defying standardization: creating curriculum for an ... · charles wheaton, leadership services,...
TRANSCRIPT

1
__________________________________________________________________________________
Vol. 14, No. 3 Fall 2017 AASA Journal of Scholarship and Practice
Fall 2017/Volume 14 No. 3
Table of Contents
Board of Editors. . . . . . . . . . . . . . . . . . . . . . . . . . . . . . . . . . . . . . . . . . . . . . . . . . . . . . . . . . . . . . . . . . . 2
Sponsorship and Appreciation . . . . . . . . . . . . . . . . . . . . . . . . . . . . . . . . . . . . . . . . . . . . . . . . . . . . . . . 3
Editorial
Federal Education Policy and the Expansion of Privatized Choice: A Call for Papers . . . . . . . . . . . . . . . . . . . . . 4 by Ken Mitchell, EdD
Research Articles A Renewed Call to Action: Update Principal Selection Methods . . . . . . . . . . . . . . . . . . . . . . . . . . . . . . . . . . . .11
by Brandon Palmer, EdD
Interactions Between Teachers’ Attribution for Student Learning and Implementation
of Evidence-Based Practices . . . . . . . . . . . . . . . . . . . . . . . . . . . . . . . . . . . . . . . . . . . . . . . . . . . . . . . . . . . . . . . . 28
by Melinda Burchard, PhD; Jennifer Fisler, EdD; Jan Dormer, EdD
Commentary Administrators Gaming Test- and Observation-Based Teacher Evaluation Methods: To Conform To
or Confront the System. . . . . . . . . . . . . . . . . . . . . . . . . . . . . . . . . . . . . . . . . . . . . . . . . . . . . . . . . . . . . . . 45
by Tray J. Geiger, MEd and Audrey Amrein-Beardsley, PhD
Book Review Excellence vs Equality: Can Society Achieve Both Goals? . . . . . . . . . . . . . . . . . . . . . . . . . . . . . . . . . . . . . . . . . 54
by Allan Ornstein, PhD
reviewed by Art Stellar, PhD
Mission and Scope, Copyright, Privacy, Ethics, Upcoming Themes,
Author Guidelines & Publication Timeline. . . . . . . . . . . . . . . . . . . . . . . . . . . . . . . . . . . . . . . . . . . . 57
AASA Resources . . . . . . . . . . . . . . . . . . . . . . . . . . . . . . . . . . . . . . . . . . . . . . . . . . . . . . . . . . . . . . . . . 61

2
__________________________________________________________________________________
Vol. 14, No. 3 Fall 2017 AASA Journal of Scholarship and Practice
Editorial Review Board
AASA Journal of Scholarship and Practice
2017-2018
Editor
Kenneth Mitchell, Manhattanville College
Associate Editors
Barbara Dean, AASA, The School Superintendents Association
Ryan Fisk, Manhattanville College
Editorial Review Board
Sidney Brown, Auburn University, Montgomery
Gina Cinotti, Netcong Public Schools, New Jersey Sandra Chistolini, Universita`degli Studi Roma Tre, Rome
Michael Cohen, Denver Public Schools
Betty Cox, University of Tennessee, Martin
Theodore B. Creighton, Virginia Polytechnic Institute and State University
Vance Dalzin, School District of Oakfield, WI
Gene Davis, Idaho State University, Emeritus
Mary Lynne Derrington, University of Tennessee
Daniel Gutmore, Seton Hall University
Gregory Hauser, Roosevelt University, Chicago
Thomas Jandris, Concordia University, Chicago
Zach Kelehear, Augusta University, GA
Theodore J. Kowalski, University of Dayton
Kevin Majewski, Seton Hall University
Nelson Maylone, Eastern Michigan University
Robert S. McCord, University of Nevada, Las Vegas
Barbara McKeon, Broome Street Academy Charter High School, New York, NY
Margaret Orr, Bank Street College
David J. Parks, Virginia Polytechnic Institute and State University
Joseph Phillips, Manhattanville College
Dereck H. Rhoads, Beaufort County School District
Thomas C. Valesky, Florida Gulf Coast University
Charles Wheaton, Leadership Services, Granger, WA
Published by
AASA, The School Superintendents Association
1615 Duke Street
Alexandria, VA 22314
Available at www.aasa.org/jsp.aspx
ISSN 1931-6569

3
__________________________________________________________________________________
Vol. 14, No. 3 Fall 2017 AASA Journal of Scholarship and Practice
Sponsorship and Appreciation
The AASA Journal of Scholarship and Practice would like to thank AASA, The School Superintendents
Association, and in particular the AASA Leadership Development Office, for its ongoing sponsorship
of the Journal.
We also offer special thanks to Kenneth Mitchell, Manhattanville College, for his efforts in selecting the
articles that comprise this professional education journal and lending sound editorial comments to each
volume.
The unique relationship between research and practice is appreciated, recognizing the mutual benefit to
those educators who conduct the research and seek out evidence-based practice and those educators
whose responsibility it is to carry out the mission of school districts in the education of children.
Without the support of AASA and Kenneth Mitchell, the AASA Journal of Scholarship and Practice
would not be possible.
4
_________________________________________________________________________________
Vol. 14, No. 3 Fall 2017 AASA Journal of Scholarship and Practice
Editorial
Ken Mitchell, Editor
AASA Journal of Scholarship & Practice
Federal Education Policy and the Expansion of Privatized Choice: A
Call for Papers from the AASA Journal of Scholarship & Practice
Secretary DeVos’ Agenda for Choice
For her January 17, 2017, confirmation
hearing, Secretary of Education nominee, Betsy
DeVos, in a written response to committee
questions about her support for virtual charter
schools, made the claim, “High quality virtual
charter schools provide valuable options to
families, particularly those who live in rural
areas where brick-and-mortar schools might not
have the capacity to provide the range of
courses or other educational experiences for
students” (Turner, 2017). DeVos cited several
examples of cyber-charters with graduation
rates that exceeded 90%; however, fact-
checking by Education Week revealed that
DeVos grossly overstated the success of these
schools (Herold, 2017).
In a speech to educators in Austin,
Texas, in 2015, DeVos stated her position on
privatized choice and vouchers: “Let the
education dollars follow each child, instead of
forcing the child to follow the dollars. This is
pretty straightforward. And it’s how you go
from a closed system to an open system that
encourages innovation. People deserve choices
and options” (B. DeVos, speech, March 11,
2015). Again, claims were made, but the
evidence about and the extent to which
innovation occurred were not provided.
The Trump-DeVos alliance is
advancing an agenda to expand the
privatization of public school education.
Secretary DeVos’ Department of Education has
proposed an expanded array of options that
includes vouchers, tuition tax credits or
scholarships, home schooling, and religious,
for-profit, and independent schools.
Speaking before the Brookings
Institution in March of this year, DeVos asked
that we “put aside the politics of the adults and
actually focus on what best serves kids.” She
then called for evidence of success: “If we find
a solution that demonstrates consistent results, I
want to support it.” This was followed by
another claim: “… choice alone is not a
panacea, but there is evidence it works. It
works for millions of students, through inner
district choice, public school choice, public
charter schools, private school choice, and
virtual and home schooling” (DeVos speech,
March 29, 2017).

5
_________________________________________________________________________________
Vol. 14, No. 3 Fall 2017 AASA Journal of Scholarship and Practice
Where’s the Evidence? The new education secretary has made claims
about the effectiveness of privatized choice.
Billions of dollars are being shifted from
established programs that support our neediest
students to support various privatization
options. The president’s proposal will eliminate
funding for teacher training, after-school and
literacy programs, and class size reductions
(Kamenetz, 2017).
Yet, many questions about the effects of
such decisions remain unanswered. What
research is being done to find evidence that
school privatization or choice effectively
improves the quality of student learning? What
is the evidence to support claims that choice
sparks innovation? What do we know or should
learn about unintended consequences?
Some research is being conducted. A
recent U.S Department of Education report
(Dynarski, et al, 2017) revealed the following
about the performance of students who
accepted vouchers:
The findings indicate that students
receiving and using scholarships had
significantly lower mathematics test
scores a year after they applied to the
OSP than did students who did not
receive a scholarship. The negative
impact was equivalent to falling back
5.4 percentile points in the national
distribution of test scores. (p.23)
These results also applied to student
performance in reading: “Reading scores also
were lower but not statistically significant for
the overall sample, though they were
statistically significant for students attending
non-SINI schools at the time of application
and for students entering a K–5 grade” (p.23).
In response to findings generated by her
own agency, DeVos was steadfast in her
resolve to support vouchers: “D.C.’s traditional
public schools have not suffered as a result of
being part of a system that allows choice,” she
said. “Rather, they have greatly improved since
the 2004 inception of the District of Columbia
Opportunity Scholarship Program (OSP)”
(Askarinam, 2017). Yet, Dynarski, et al, (2017)
cited similar studies showing negative effects
on students.
More recently, Mills and Wolf (2016)
and Abdulkadiroglu, Parthak, and Walters
(2015) found that students who used a private
school voucher as part of The Louisiana
Scholarship Program generally performed
worse than students who applied for but were
not offered a voucher. Waddington and
Berends (2015) and Figlio and Karbownik
(2016) reported that the use of vouchers had
negative impacts on test scores in Indiana and
Ohio (p. 2).
A Thomas B. Fordham Institute study
of Ohio’s school choice program concludes
with a resigned but cautionary statement:
… and while we strongly prefer the
estimates from the second round of the
EdChoice program because we believe
those results to be the more
scientifically credible—these first-
round results suggest that caution is still
warranted when concluding that the
EdChoice program led to improvements
in the schools that became voucher
eligible. (Figlio, D. & Karbownik, K.,
2016, p.40)
With such limited evidence
policymakers, legislators, and taxpayers should
be wary about funding education policy that

6
_________________________________________________________________________________
Vol. 14, No. 3 Fall 2017 AASA Journal of Scholarship and Practice
shifts public dollars to untested privatized
learning.
Researched-based Funding Choices In response to the DeVos appointment, the
American Educational Research Association
(2017), in a statement on its website, cited the
newly appointed secretary’s response to
Washington State’s Senator Patty Murray’s
question about her use of research: “To be
responsible with taxpayer dollars and ensure
that our programs are effective, responsive and
impactful, we should use reliable data, strong
research, and rigorous evaluations.”
We agree with the education Secretary.
Any decision to expand choice and
privatization options must be done with fiscal
responsibility and supported by strong research.
However, the Trump-DeVos education agenda
conflicts with its own call for research-backed
assurances. There are currently fourteen states
and the District of Columbia that have school
voucher programs.
The proposed federal budget, while
cutting many programs, will provide grant
monies to states to incentivize the development
of choice options (Brown, et al, 2017). Student
growth in just public charter schools has risen
from 1.2 million pupils in 2006-07 to 3.1
million in 2016-17. (National Alliance for
Public Charter Schools, 2017). Substantive
evidence on the effectiveness or superiority of
charter schools—public or private—does not
exist, yet their expansion and funding continues
to be promoted at the state and federal levels.
AASA: Call for Research on Choice &
Privatization Until such time that we have leadership that
legislates with empiricism over ideology, it will
be up to education leaders at the federal, state,
and local levels to confront and pressure
lawmakers with the evidence from both the
research community and the data they are
collecting at local and state levels.
Among a standing list of themes and
topics for upcoming issues, the AASA Journal
of Scholarship & Practice calls for submissions
related to the following:
• Governance, Funding, and Control of
Public Education
• Federal Education Policy and the Future
of Public Education
• Federal, State, and Local Governmental
Relationships
• Charter Schools and Other Alternatives
to Public Schools
• School Reform Policies
• Financial Issues
The mission of the Journal is to provide
peer-reviewed, user-friendly, and
methodologically sound research that
practicing school and district administrations
can use to take action and that higher education
faculty can use to prepare future school and
district administrators.
Articles from the Journal are viewed by
practitioners, in many cases district leaders
with access to policymakers. As efforts to
expand privatized choice from the federal to the
state and local levels, school leaders, especially
as they work to educate their school boards,
communities, and state and federal legislators,
need to have the best evidence.
We are calling for papers to address
such questions as the following:
• How does charter school funding or
the use of tax dollars to support
vouchers affect the costs of or
7
_________________________________________________________________________________
Vol. 14, No. 3 Fall 2017 AASA Journal of Scholarship and Practice
funding for public schools? What are
‘stranded costs’ and how do they
affect public school funding?
• By how much do tax credit
scholarships offset private tuition
costs? What are the socio-economic
profiles of the families of students
who use the money from this option?
What are the profiles of the schools
that these students attend? How do
tax credit scholarships affect tax
revenues?
• How do accountability systems and
measures compare between public
and charter schools or for for-profit
independent schools funded with
vouchers or tax credits?
• Who attends charter schools? How
did their families make the decision
to attend? How did they learn about
the school? What do the data reveal
about the learner profiles (e.g.,
special needs, ENL, behavioral)?
• In what ways are charter and for-
profit schools ‘innovative’? How do
their definitions of innovation
compare to those defined as such by
educators in a public school?
• How do charter, voucher-supported
private schools, and public schools
compare in the delivery of programs
in the arts, sciences, and extra-
curricular activities? Why is that
important?
• In what ways are on-line/cyber
charter schools beneficial or harmful
to student learning? What have we
learned about those attending or
leading them?
The Journal is interested in hearing
from education leaders and others about their
decision-making in this rapidly changing
environment.
For example, how are
superintendents addressing the question of
‘stranded costs?’ Or the difference between the
funding that leaves and the savings presumed
by advocates that result when dollars follow
students?
Is there such a savings or, due to an
economy of scale within a public school
system, does this lost funding imperil a
district’s fiscal stability, especially when large
numbers of students depart? The following is
an example of how this affects one district:
The Bethlehem school district in
Pennsylvania budgets $26 million
of its annual budget to put in “the
backpacks” of students who leave
to go to brick-and-mortar and
virtual charter schools. According
to district superintendent Joe Roy,
if those students and their funding
returned, it would cost the district
only $6 million to educate them.
That means the “stranded cost” of
charter-school choice to the
taxpayers of Bethlehem is $20
million. (Strauss, 2017)
The Journal wants to go beyond such
anecdotes. We want to hear from practitioners
about the data they are gathering through their
own evidence-driven analysis at the district
level, as well as from the formal research
community.

8
_________________________________________________________________________________
Vol. 14, No. 3 Fall 2017 AASA Journal of Scholarship and Practice
It is our plan to dedicate a section of the
Journal to examine what we are learning about
these profound changes to public education in
the United States—not through an ideological
lens but one that is research-based.
Let’s help to provide Secretary DeVos
with the research that she has requested or an
assessment and analysis of the studies that have
been or will be conducted.
We invite you to participate.
9
_________________________________________________________________________________
Vol. 14, No. 3 Fall 2017 AASA Journal of Scholarship and Practice
References
American Educational Research Association (2017, January). HELP committee sends DeVos
nomination for Education Secretary to full Senate. AERA Highlights. Retrieved from AERA
website: http://www.aera.net/Newsroom/AERA-Highlights-E-newsletter/-em-AERA-
Highlights-em-January-2017/HELP-Committee-Sends-DeVos-Nomination-for-Education-
Secretary-to-Full Senate/
Askarinam, L. (2017, April 28). What a new study on vouchers means for Trump’s agenda? Atlantic
Monthly. Retrieved from: https://www.theatlantic.com/education/archive/2017/04/do-vouchers-
actually-work/524676/
Brown, E., Strauss,V. and Douglas-Gabriel, D. (2017, May 17). Trump’s first full education budget:
Deep cuts to public school programs in pursuit of school choice. Washington Post. Retrieved
from: https://www.washingtonpost.com/local/education/trumps-first-full-education-budget-
deep-cuts-to-public-school-programs-in-pursuit-of-school-choice/2017/05/17/2a25a2cc-3a41-
11e7-8854-21f359183e8c_story.html?utm_term=.f325042addf7/
DeVos, B. (2015, March 11). Betsy DeVos addresses SXSWedu. Retrieved from:
https://www.federationforchildren.org/betsy-devos-addresses-sxswedu/
DeVos, B. (2017, March 29). Keynote remarks: The Brookings Institution: Education choice and
competition index. Retrieved from Brookings Institution website:
https://www.brookings.edu/wp-content/uploads/2017/03/20170329_ecci_devos_transcript.pdf
Dynarski, M., Rui, N.,Webber, A., Gutmann,B., and Bachman,M.(2017). Evaluation of the D.C.
opportunity scholarship program: Impacts after one year. Washington, D.C.:U.S. Department
of Education, National Center for Educational Evaluation and Regional Assistance. Retrieved
from: https://ies.ed.gov/ncee/pubs/20174022/pdf/20174022.pdf
Figlio,D. & Karbownik, K. (2016). Evaluation of Ohio’s EdChoice scholarship program: Selection,
competition, and performance effects. Retrieved from Thomas B. Fordham Foundation website:
https://edexcellence.net/publications?field_pub_issue_topic_tid=2
Herold, B. (2017, February 1). Betsy DeVos used cherry-picked graduation rates for cyber charters.
Education Week. Retrieved from:
http://blogs.edweek.org/edweek/DigitalEducation/2017/02/devos_cites_inflated_numbers_k12_
inc_cyber_charters.html/
Kamenetz, A. (2017, May 22). President Trump’s budget proposal calls for deep cuts to education.
National Public Radio. Retrieved from: http://www.npr.org/sections/ed/2017/05/22/529534031/president-trumps-budget-proposal-
calls-for-deep-cuts-to-education

10
_________________________________________________________________________________
Vol. 14, No. 3 Fall 2017 AASA Journal of Scholarship and Practice
National Alliance for Public Charter Schools (2017). Estimated public charter school enrollment,
2016-17. Retrieved from: http://www.publiccharters.org/wp-
content/uploads/2017/01/EER_Report_V5.pdf
Strauss,V. (2017, May 3). Three big problems with school ‘choice’ that supporters don’t like to talk
about. Washington Post. Retrieved from: https://www.washingtonpost.com/news/answer-
sheet/wp/2017/05/03/three-big-problems-with-school-choice-that-supporters-dont-like-to-talk-
about/?utm_term=.fb1388f71039/
Turner, C. (2017, February 4). Betsy DeVos’ graduation rate mistake. National Public Radio.
Retrieved from: http://www.npr.org/sections/ed/2017/02/04/513220220/betsy-devos-
graduation-rate-mistake/
11
_________________________________________________________________________________
Vol. 14, No. 3 Fall 2017 AASA Journal of Scholarship and Practice
Research Article ____________________________________________________________________
A Renewed Call to Action: Update Principal Selection Methods
Brandon Palmer EdD
Researcher
DPEL Center for Research and Publication
California State University, Fresno
Fresno, CA
Abstract
Many states have committed to adoption of Common Core State Standards, necessitating extensive
preparation for both teachers and students. School districts and particularly school principals have been
responsible for ensuring transition and readiness. This demand illustrates the complexity of the
principalship and its relationship to student achievement. Principal selection is of paramount
importance. This mixed methods study sought to determine which of 21 leadership responsibilities
were important to top-level school district administrators when hiring principals and how top-level
school administrators assessed these responsibilities during principal selection. Results of this study
indicated all 21 leadership responsibilities are important for top-level school administrators to consider
when hiring school principals. However, most of the participants indicated they do not have a
methodical method to evaluate the 21 leadership responsibilities.
Key Words
principal selection, school principal, human resources, student achievement

12
_________________________________________________________________________________
Vol. 14, No. 3 Fall 2017 AASA Journal of Scholarship and Practice
The adoption of Common Core State
Standards (CCSS) by 43 States has obligated
school districts to commit significant financial
and personnel resources to embrace a paradigm
shift in education, moving from recall and rote-
memorization of information or facts to
rigorous and relevant cross-curricular learning.
As a result, school principals have significant
responsibility for ensuring that both teachers
and students at their respective school sites are
prepared for the next generation of teaching
and learning centered on core competencies
that have primacy in learning such as Reading,
Writing, Speaking, and Listening across core
subject areas (CCSS, 2014).
The leadership demonstrated by
principals during implementation of CCSS is
essential to the success of staff and students at
their schools. School principals have been
identified throughout decades of literature as
one of the key school personnel affecting
student achievement (e.g., Brookover &
Lezotte, 1979; Gullatt & Lofton, 1986;
Hallinger & Heck 1996; Heck, 1992;
Leithwood, Louis, Anderson, & Wahlstrom,
2004; Mills, McDowelle, & Rouse, 2011;
Waters, Marzano, & McNulty, 2004). The
mechanisms used by school districts to select
principals may never have been more important
than today, as school principals must navigate
the shifting education tides while
simultaneously focusing on student
achievement within their schools.
The purpose of this research study was
to examine two questions. First, how important
are each of the 21 leadership responsibilities
developed by Waters et al. (2004) to top-level
school district administrators when assessing
principal candidates? Second, how are those
attributes actually assessed during principal
selection processes? This study is a duplication
of the study conducted by Rammer (2007) in
the state of Wisconsin; however, it was
conducted nationally in the United States.
This study is significant because it
continues the much-needed research of
principal selection by investigated how
principals are selected throughout the United
States.
Literature Review Role of principal in student achievement
Early interest in the relationship between
school leadership and student achievement
occurred during the 1970’s. During the 1980’s,
Gardner’s (1983) A Nation at Risk was
published and educational reform came to the
front of the national agenda as school systems
in the United States were taken to task for
numerous issues (e.g., content, expectations,
time, and teaching) related to student
achievement.
The use of student achievement data as
a means of evaluating the key players in
education (e.g., teachers and administrators) for
accountability purposes was accelerated. As
stated by Heck (1992), “The public’s demand
for educational accountability have advanced
the use of achievement data to evaluate
instructional efforts, because of concerns about
poor educational outcomes in many schools
and the perceptions that America is declining as
an economic power” (p. 21). These concerns
have led to numerous studies examining the
principal’s effect on student achievement (e.g.,
Gullatt & Lofton, 1986; Hallinger, Bickman, &
Davis, 1996; Hallinger & Heck 1996; Heck,
1992; Leithwood, Louis, Anderson, &
Wahlstrom, 2004; Mills, McDowelle, & Rouse,
2011; Waters et al., 2004).
Conducting research to find a
relationship between the school principal and
student achievement has proven to be complex,

13
_________________________________________________________________________________
Vol. 14, No. 3 Fall 2017 AASA Journal of Scholarship and Practice
and often only indirect evidence of a
relationship has been found (Heck, 1992).
Gullat and Lofton (1986) analyzed principals’
effect on student achievement by examining
principals’ school governance, collaboration,
and allocation of personnel resources. Findings
from their study indicated that principals
should be effective in promoting student
achievement if they
“a) possess a substantial knowledge
base in curriculum, instruction, and
evaluation; b) provide vision and
direction for the school; c) promote
positive teaching and learning
environments; d) establish patterns of
effective communication and
motivation; and (e) maintain high
expectations for self, staff, and
students.” (p. 22)
Furthermore, as teachers are the
facilitators of instruction, principals should be
well versed in curriculum and instruction and
current research related to instruction in order
to support teachers in this endeavor (Gullat &
Lofton, 1986).
Hallinger and Heck reviewed school
leadership and student achievement literature
from 1980 to 1995 and found that school
leadership targeting internal processes had a
direct impact on student achievement. Internal
processes were described as “academic
expectations, school mission, student
opportunity to learn, instructional organization,
and academic learning time” (1996, p. 38).
Waters et al. (2004) conducted a meta-
analysis by reviewing “more than 5,000
studies—published since the 1970’s—
purported to have examined the effect of
leadership”; only 70 met their stringent
scientific design criteria (p. 4-5). Findings
included a quantification of general leadership
effects on student achievement, a statistically
significant relationship between 21 of the
leadership responsibilities identified and
student achievement, and a “differential
impact” (i.e., positive and negative) of
leadership on student achievement. The 21
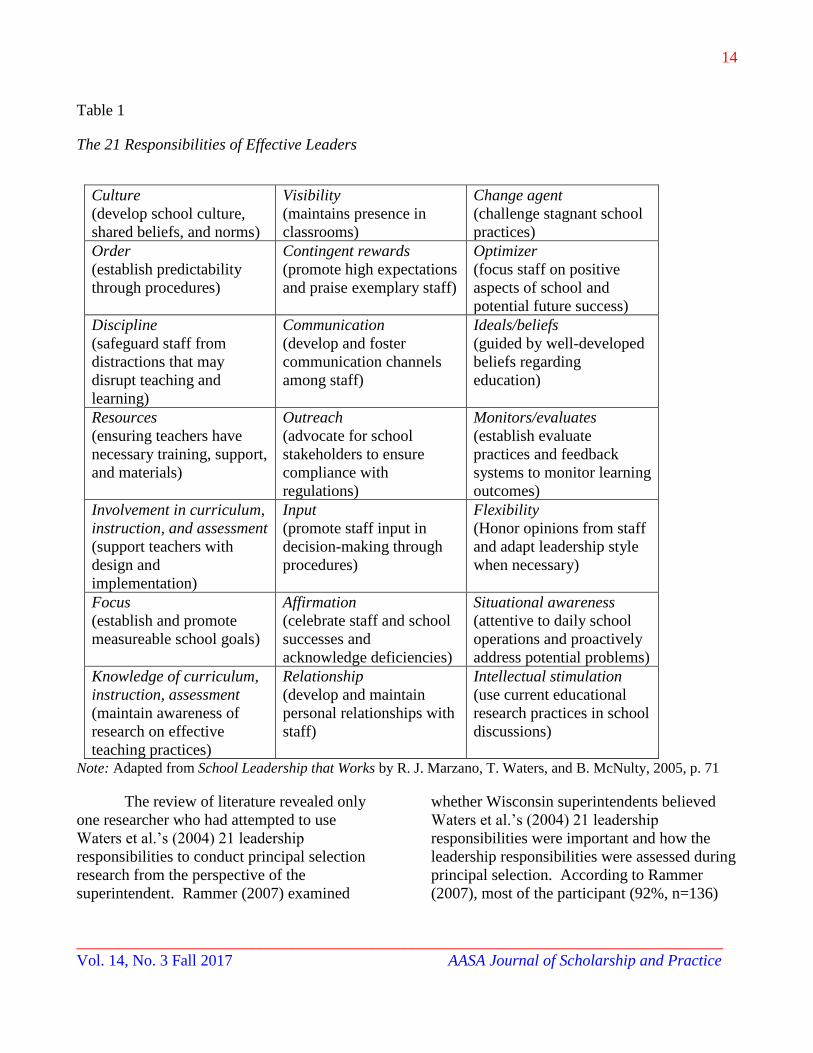
leadership responsibilities developed by Waters et
al. (2004), along with summarized definitions, are
displayed in Table 1.
14
_________________________________________________________________________________
Vol. 14, No. 3 Fall 2017 AASA Journal of Scholarship and Practice
Table 1
The 21 Responsibilities of Effective Leaders
Culture
(develop school culture,
shared beliefs, and norms)
Visibility
(maintains presence in
classrooms)
Change agent
(challenge stagnant school
practices)
Order
(establish predictability
through procedures)
Contingent rewards
(promote high expectations
and praise exemplary staff)
Optimizer
(focus staff on positive
aspects of school and
potential future success)
Discipline
(safeguard staff from
distractions that may
disrupt teaching and
learning)
Communication
(develop and foster
communication channels
among staff)
Ideals/beliefs
(guided by well-developed
beliefs regarding
education)
Resources
(ensuring teachers have
necessary training, support,
and materials)
Outreach
(advocate for school
stakeholders to ensure
compliance with
regulations)
Monitors/evaluates
(establish evaluate
practices and feedback
systems to monitor learning
outcomes)
Involvement in curriculum,
instruction, and assessment
(support teachers with
design and
implementation)
Input
(promote staff input in
decision-making through
procedures)
Flexibility
(Honor opinions from staff
and adapt leadership style
when necessary)
Focus
(establish and promote
measureable school goals)
Affirmation
(celebrate staff and school
successes and
acknowledge deficiencies)
Situational awareness
(attentive to daily school
operations and proactively
address potential problems)
Knowledge of curriculum,
instruction, assessment
(maintain awareness of
research on effective
teaching practices)
Relationship
(develop and maintain
personal relationships with
staff)
Intellectual stimulation
(use current educational
research practices in school
discussions)
Note: Adapted from School Leadership that Works by R. J. Marzano, T. Waters, and B. McNulty, 2005, p. 71
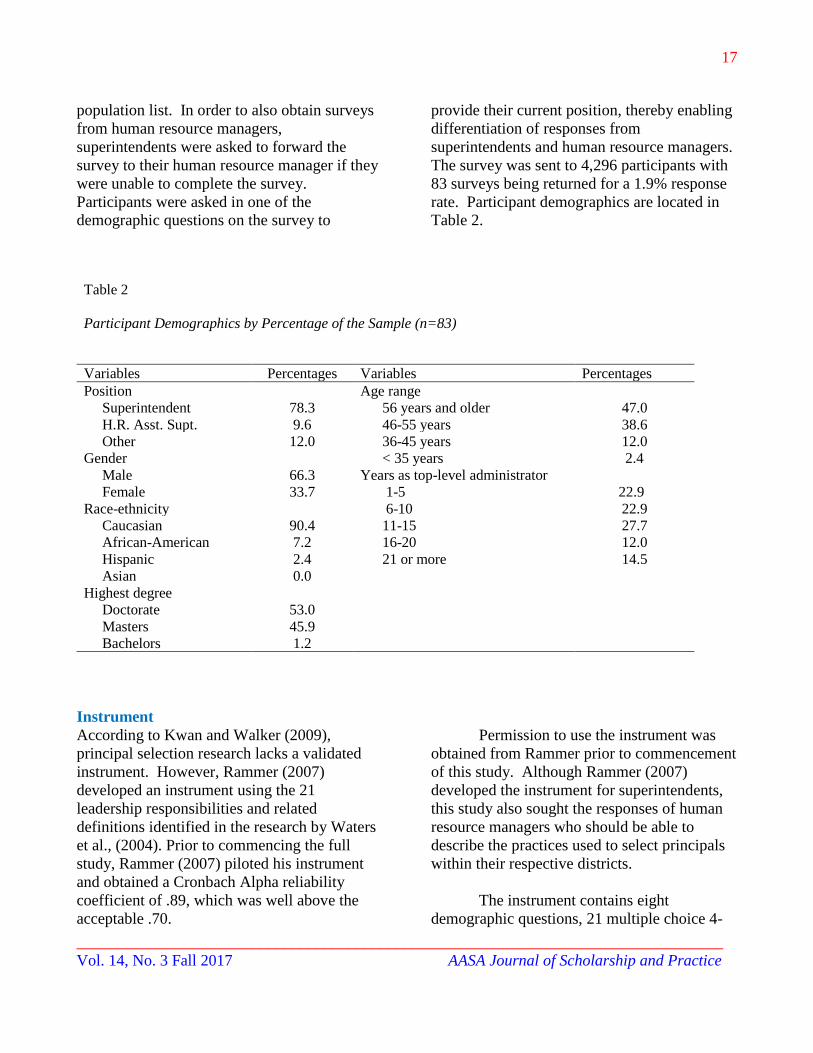
The review of literature revealed only
one researcher who had attempted to use
Waters et al.’s (2004) 21 leadership
responsibilities to conduct principal selection
research from the perspective of the
superintendent. Rammer (2007) examined
whether Wisconsin superintendents believed
Waters et al.’s (2004) 21 leadership
responsibilities were important and how the
leadership responsibilities were assessed during
principal selection. According to Rammer
(2007), most of the participant (92%, n=136)
15
_________________________________________________________________________________
Vol. 14, No. 3 Fall 2017 AASA Journal of Scholarship and Practice
superintendents believed the 21 leadership
responsibilities were an important
consideration when hiring principals.
However, only 1.2% (n=19) of
participant superintendents had a systematic or
methodical means of assessing only 1 of the 21
leadership responsibilities in principal
candidates (Rammer, 2007). This result may
seem mystifying on the surface; however,
principal selection methods have seldom been
the subject of research or scrutinized by
researchers (Blackmore, Thomspon, & Barty,
2006), therefore leaving the methods used to
select principals reliant on intuition.
Principal selection processes
The processes used to select school principals
are seldom described within the principal
selection literature (Baltzell & Dentler, 1983).
In their pioneering principal selection research,
Baltzell and Dentler (1983) differentiated four
processes that makeup the procedures used to
select school principals: (a) a vacancy
announcement, (b) forming a candidate pool,
(c) screening, and (d) the employment decision.
Baltzell and Dentler (1983) included the
interview process within the screening step.
However, Levine and Flory (1975) described
screening as the ranking of candidates based on
application materials submitted following the
vacancy announcement. Palmer (2014)
proposed a six stage model for principal
selection in which screening, as was described
by Levine and Flory (1975), is an initial stage
with evaluation stages taking place later in the
selection process.
Palmer’s (2014) six stages were (a)
vacancy announcement, (b) screening, (c) pool
of candidates established, (d) evaluation, (e) re-
evaluation, and (f) decision. Steps (d) and (e)
include processes such as interviews,
performance tasks, written tests, and
presentations. Although the stages are helpful
to understanding principal selection, the stages
may be of less importance than what actually
occurs within them, especially the evaluation
stages leading to a hiring decision.
The screening stage is where candidates
are typically first assessed against the selection
criteria; this stage is the gateway to later
evaluation stages (Palmer, 2014). The
evaluation stages, which also purport to assess
candidates against the selection criteria include
interviews, which are one of the most
commonly used procedures within principal
selection (Anderson, 1991; Baltzell & Dentler,
1983; Kwan, 2012; Palmer, 2014; Rammer,
2007; Schmitt & Schechtman, 1990; Walker &
Kwan, 2012; Wendel & Breed, 1988).
Despite their primacy in selection
processes, interviews have been seen as
problematic (Baltzetll & Dentler, 1983; Hogan
& Zenke, 1986; Palmer, 2014; Walker &
Kwan, 2012; Wendel & Breed, 1988).
Principal selectors’ reliance on interviews casts
principal selection as a highly subjective
process in which selectors rely on instinct or
intuition (Gronn & Lacey 2006; Morgan, Hall,
& McKay, 1983; Parkay & Armstrong, 1987;
Rammer, 2007; Wendell & Breed, 1988).
Rammer (2007) suggested
superintendents may intuitively know what
they are looking for in a principal candidate
and use the interview to assess those traits.
Other researchers have suggested the principal
selectors’ ambiguous rationale for selection to
be spurious. Baltzell and Dentler (1983)
questioned top-level district leadership on the
operationalization of educational leadership
during their study and described the response
they were given as a “circular definition cycle”
which heavily relied upon “fit” (p. 6). Some
researchers have also suggested selectors may
not actually be looking for specific criteria
16
_________________________________________________________________________________
Vol. 14, No. 3 Fall 2017 AASA Journal of Scholarship and Practice
within principal selection procedures but
instead may be looking for “fit” (Baltzell &
Dentler, 1983; Blackmore, Thomson, & Barty,
2006; Gronn & Lacey, 2006).
Baltzell and Dentler (1983) defined
“fit” as “interpersonal perceptions of a
candidate’s physical presence, projection of a
certain self-confidence and assertiveness, and
embodiment of community values and methods
of operation” (p. 7). Blackmore et al. (2004)
argued, “The selection process, the primary
‘gate-keeping’ mechanism to the principalship,
a position seen as the lynchpin of educational
reform and school success, is regarded widely
as a biased and unpredictable event” (p. 300).
In brief, principal selection methods are
important and further research is needed to
support an improvement of the process.
Objective methods
Within principal selection literature, few
procedures having psychometric validity, such
as assessments and performance tasks, are
mentioned. Assessments appeared to have
widespread use decades ago as the National
Association of Secondary School Principals
(NASSP) established assessment centers to
evaluate principals for a variety of traits.
While the NASSP assessment centers
have been discontinued, assessments appear to
be used on a limited basis within school
districts (Palmer, 2014); however, the validity
of those assessments are unknown. A
performance task designed by Wildy, Pepper,
and Guanzhong (2011) shows promise,
although its actual use within principal
selection is unknown. In research by Palmer
(2014), school principals (n=221) indicated
performance tasks and assessments were
seldom used.
School district’s reliance on selectors’
intuition may result in the bias and
unpredictability described by Blackmore et al.
(2004) and illustrates the need for further
research of selection criteria (i.e., candidate
characteristics or attributes) and how those
criteria are actually assessed through
procedures within principal selection in order
to develop new objective selection methods.
Method A mixed methods research design was used to
examine top-level school district
administrators’ perceptions of Walters et al.’s
(2004) 21 leadership responsibilities within
principal selection. According to Creswell
(2009), mixed methods strengthen a study by
using two complimentary methods instead of a
single method to obtain data.
The research questions this study sought
to answer were how important are each of the
21 leadership responsibilities developed by
Waters et al. (2004) to top-level school district
administrators when assessing principal
candidates, and how are those attributes
actually assessed during principal selection
processes?
Sampling and participants A random purposive sampling method was
used to select study participants.
Superintendent emails were retrieved from
States’ education school directories as well as
county and school websites. A total of 12,229
emails were retrieved representing all 50 states
within the United States. Participant emails
were incorporated into an excel spreadsheet
and assigned a unique numerical value. A
random number generator was then used to
select 4,296 participants. Selected
superintendent email addresses were then
transferred into an excel database to generate a
17
_________________________________________________________________________________
Vol. 14, No. 3 Fall 2017 AASA Journal of Scholarship and Practice
population list. In order to also obtain surveys
from human resource managers,
superintendents were asked to forward the
survey to their human resource manager if they
were unable to complete the survey.
Participants were asked in one of the
demographic questions on the survey to
provide their current position, thereby enabling
differentiation of responses from
superintendents and human resource managers.
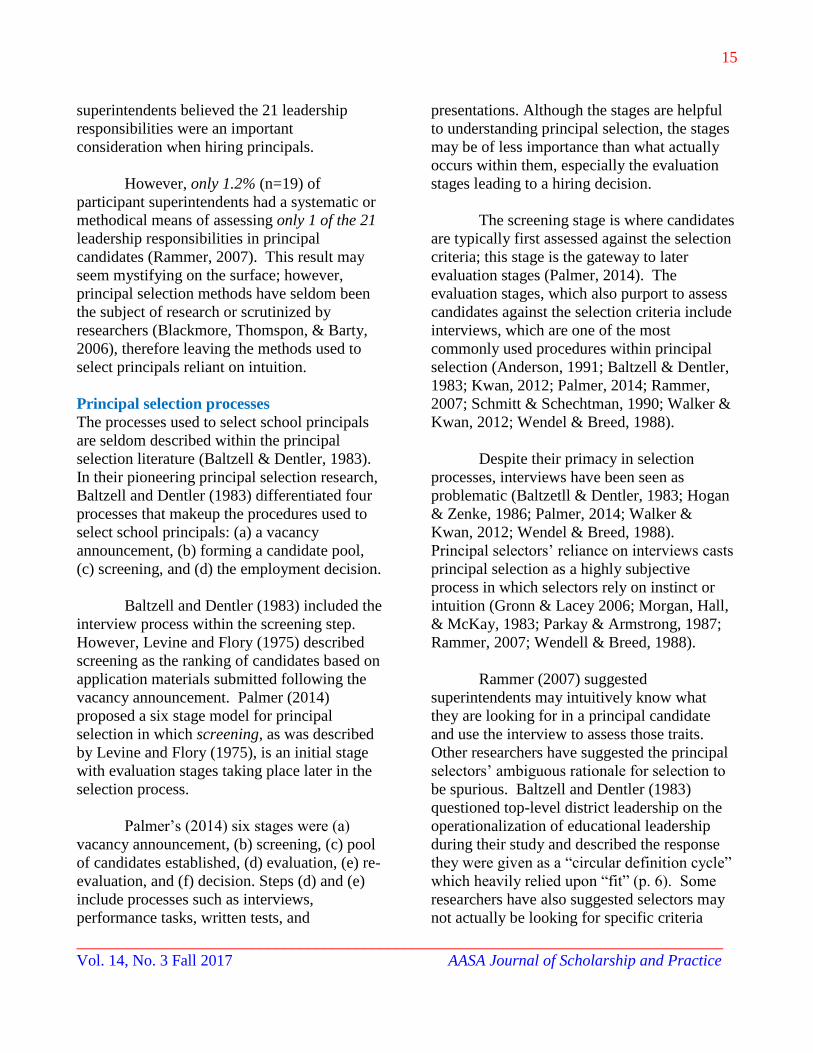
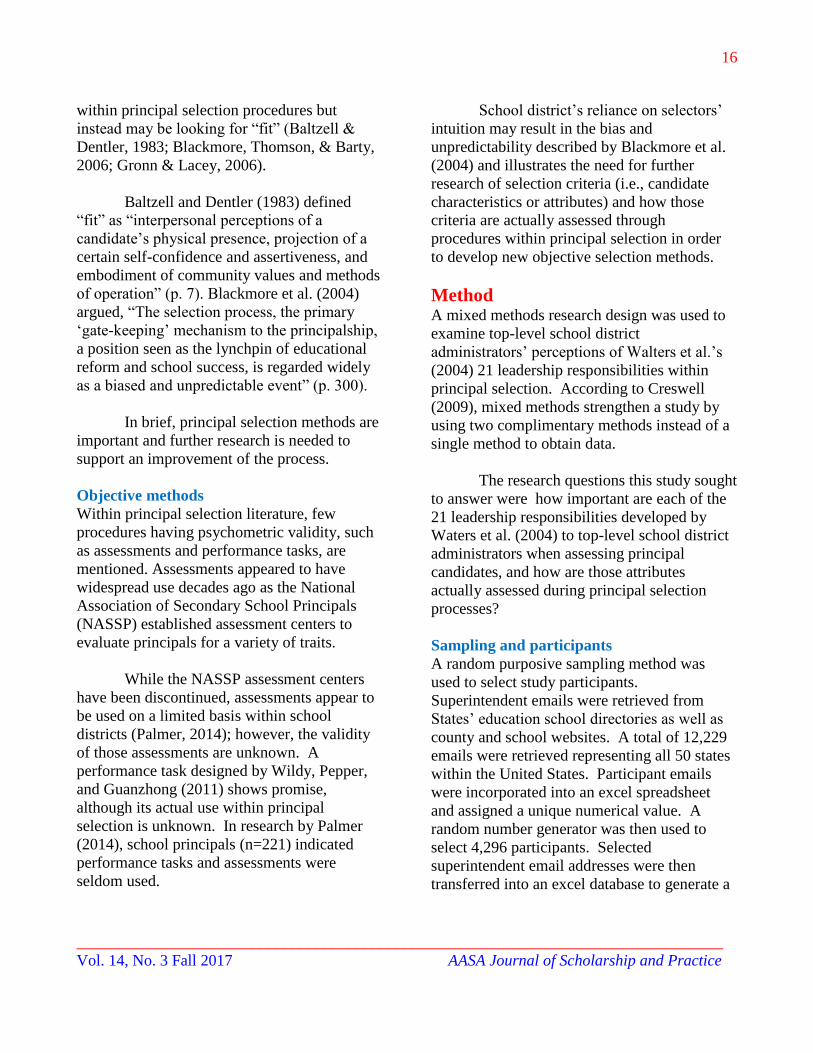
The survey was sent to 4,296 participants with
83 surveys being returned for a 1.9% response
rate. Participant demographics are located in
Table 2.
Table 2
Participant Demographics by Percentage of the Sample (n=83)
Variables Percentages Variables Percentages
Position Age range
Superintendent 78.3 56 years and older 47.0
H.R. Asst. Supt. 9.6 46-55 years 38.6
Other 12.0 36-45 years 12.0
Gender
< 35 years 2.4
Male 66.3 Years as top-level administrator
Female 33.7 1-5 22.9
Race-ethnicity 6-10 22.9
Caucasian 90.4 11-15 27.7
African-American 7.2 16-20 12.0
Hispanic 2.4 21 or more 14.5
Asian 0.0
Highest degree
Doctorate 53.0
Masters 45.9
Bachelors 1.2
Instrument According to Kwan and Walker (2009),
principal selection research lacks a validated
instrument. However, Rammer (2007)
developed an instrument using the 21
leadership responsibilities and related
definitions identified in the research by Waters
et al., (2004). Prior to commencing the full
study, Rammer (2007) piloted his instrument
and obtained a Cronbach Alpha reliability
coefficient of .89, which was well above the
acceptable .70.
Permission to use the instrument was
obtained from Rammer prior to commencement
of this study. Although Rammer (2007)
developed the instrument for superintendents,
this study also sought the responses of human
resource managers who should be able to
describe the practices used to select principals
within their respective districts.
The instrument contains eight
demographic questions, 21 multiple choice 4-
18
_________________________________________________________________________________
Vol. 14, No. 3 Fall 2017 AASA Journal of Scholarship and Practice
point Likert-scale (e.g., strongly agree-strongly
disagree) questions (1 for each of the 21
responsibilities) and 21 narrative response
questions designed to solicit how participants
assess candidates on each of the 21 leadership
responsibilities.
Data analysis Quantitative data were analyzed using
descriptive statistics. Constant comparative
analysis methods developed by Glaser (1965)
were used for the qualitative data. Two coders
conducted the qualitative analysis, and an inter-
coder reliability of at least .80 was established
by comparing results at multiple intervals
during data analysis of the narrative responses.
Analyzing data with multiple coders allows the
reliability of the data to be tested (Stewart,
Shamdasani, & Rook, 2007). Furthermore,
using multiple coders is critical in establishing
validity (Lombard, Snyder‐Duch, & Bracken,
2002).
Participant responses to open-ended
narrative questions were analyzed to determine
if the procedure used to assess the leadership
responsibility was passive or intentional. A
procedure was categorized as passive if it was
assessed through an interview, submitted
materials (e.g., resume, cover letter, etc.),
references, or some other assessment that was
not intentional such as perception.
A blank response was considered as not
having an assessment for that particular
leadership responsibility. Responses were
categorized and quantified as intentional
assessments if the participant described a
procedure that was not an interview, submitted
materials, or from references (i.e., a specific
method for evaluation had been developed).
Results Importance of the 21 responsibilities
Responses to Likert-scale survey items asking
participants how important they consider each
of the 21 leadership responsibilities to be when
selecting principals yielded some results with
unanimity or near unanimity. The results of
participant agreement of importance ranged
from 100% (communication, flexibility, focus,
and visibility) to 91.6% (involvement in
curriculum, instruction, and assessment).
Nearly all participants’ responses (1698/1743,
97.4%) considered all of the 21 leadership
responsibilities to at least be important when
selecting principals.
The leadership responsibility with the
highest response rate for strongly agree was
communication (91.6%). Participants
considered flexibility, focus, and visibility along
with communication to be important, as no
participants disagreed or strongly disagreed
regarding their importance. Only 2.6%
(45/1743) of the total responses indicated
participants disagreed or strongly disagreed
regarding the 21 leadership responsibilities.
Involvement in curriculum, instruction, and
assessment had the most disagreement among
the 21 leadership responsibilities, as 7
participant responses indicated they disagreed
regarding the importance of this responsibility
when selecting principals. Affirmation and
change agent were the only leadership
responsibilities among the 21 where
participants indicated they strongly disagreed
(1 for each leadership responsibility) that those
leadership responsibilities were important to
consider when selecting principals. Results for
the extent to which participants considered the
importance of the 21 responsibilities are
displayed in Table 3.

19
_________________________________________________________________________________
Vol. 14, No. 3 Fall 2017 AASA Journal of Scholarship and Practice
Table 3
Responses by All Participants to Likert-scale Questions Regarding the 21 Responsibilities
Strongly
Agree
Agree Disagree Strongly
Disagree
Responsibility n % n % n % n % Total
Affirmation 45 54.2 36 43.4 1 1.2 1 1.2 83
Change agent 46 55.4 35 42.2 1 1.2 1 1.2 83
Contingent
rewards
14 16.9 65 78.3 4 4.8 0 0 83
Communication 76 91.6 7 8.4 0 0 0 0 83
Culture 61 73.5 21 25.3 1 1.2 0 0 83
Discipline 35 42.2 45 54.2 3 3.6 0 0 83
Flexibility 44 53.0 39 47.0 0 0 0 0 83
Focus 53 63.9 30 36.1 0 0 0 0 83
Ideals/beliefs 42 50.6 38 45.8 3 3.6 0 0 83
Input 45 54.2 36 43.4 2 2.4 0 0 83
Intellectual
stimulation
35 42.2 44 53.0 4 4.8 0 0 83
Involvement in
curriculum,
instruction, and
assessment
39 47.0 37 44.6 7 8.4 0 0 83
Knowledge in
curriculum,
instruction, and
assessment
46 55.4 36 43.4 1 1.2 0 0 83
Monitoring/
evaluation
56 67.5 26 31.3 1 1.2 0 0 83
Optimizer 42 50.6 38 45.8 3 3.6 0 0 83
Order 31 37.3 50 60.2 2 2.4 0 0 83
Outreach 36 43.4 44 53.0 3 3.6 0 0 83
Relationship 46 55.4 35 42.2 2 2.4 0 0 83
Resources 36 43.4 44 53.0 3 3.6 0 0 83
Situational
awareness
52 62.7 29 34.9 2 2.4 0 0 83
Visibility 58 69.9 25 30.1 0 0 0 0 83
Assessing for the 21 responsibilities
Narrative responses were analyzed to determine
how top-level school district administrators
assess for each of the 21 leadership
responsibilities. Just over half of all participant
responses (880/1743, 50.5%) indicated
participants passively assess for the

20
_________________________________________________________________________________
Vol. 14, No. 3 Fall 2017 AASA Journal of Scholarship and Practice
21 leadership responsibilities. Participants did
not describe or note an assessment in 39.5%
(689/1743) of the total responses. Intentional
assessments were described within 10.0%
(174/1743) of all responses. Results for
narrative response are displayed in Table 4.
Table 4
Responses by All Participants to Narrative Questions Regarding the 21 Responsibilities
Passive
Assessment(s)
No
Assessment
Intentional
Assessment(s)
Responsibility n % n % n % Total Affirmation 51 61.4 17 20.5 15 18.1 83 Change agent 50 60.2 26 31.3 7 8.4 83 Contingent
rewards
41 49.4 31 37.3 11 13.3 83
Communication 48 57.8 26 31.3 9 10.8 83 Culture 47 56.5 26 31.3 10 12.0 83 Discipline 41 49.4 33 39.8 9 10.8 83 Flexibility 45 54.2 28 33.7 10 12.0 83 Focus 47 56.6 30 36.1 6 7.2 83 Ideals/beliefs 42 50.6 35 42.2 6 7.2 83 Input 40 48.2 32 38.6 11 13.3 83 Intellectual
stimulation
42 50.6 34 41.0 7 8.4 83
Involvement in
curriculum,
instruction, and
assessment
36 43.4 40 48.2 7 8.4 83
Knowledge in
curriculum,
instruction, and
assessment
41 49.4 35 42.2 7 8.4 83
Monitoring/
evaluation
39 47.0 36 43.4 8 9.6 83
Optimizer 39 47.0 39 47.0 5 6.0 83 Order 38 45.8 39 47.0 6 7.2 83 Outreach 43 51.8 34 41.0 6 7.2 83 Relationship 39 47.0 36 43.4 8 9.6 83 Resources 35 42.2 39 47.0 9 10.8 83 Situational
awareness
41 49.4 36 43.4 6 7.2 83
Visibility 35 42.2 37 44.6 11 13.3 83 Total 880 50.5 689 39.5 174 9.7
21
_________________________________________________________________________________
Vol. 14, No. 3 Fall 2017 AASA Journal of Scholarship and Practice
Passive assessments (50.5%) included
participants’ use of terms such as question(s)
(342 responses), interview(s) (297 responses),
reference(s) (256 responses), resume(s) (28
responses), and perception(s) (16 responses).
Affirmation (61.4%), change agent (60.2%),
communication (57.8%), culture (56.5%) had
the highest percentages of passive assessments
among the 21 leadership responsibilities. A
typical narrative response indicating a passive
assessment included specific questions
participants asked candidates or procedures
used to assess for the leadership responsibility.
For example, Participant 13 assessed
affirmation “through questioning during the
interview process, through reference checks,
and through the use of open-ended questions
that are part of the application process.
Similarly, Participant 55 described using an
“interview, references, knowledge of
candidate” as an assessment.
Participants indicated they did not have
an assessment for the 21 leadership
responsibilities in 39.5% (689/1743) of
responses. If no response was given, it was
interpreted as not having an assessment. Also,
in some cases participants provided a response
which made a statement regarding the
leadership responsibility but did not actually
describe an assessment. Participant 70
exemplified this type of response regarding the
assessment of communication by stating
“communication is the key to success of an
administrator. He/she must be able to talk with
and to all involved.” While this declaration of
the importance of communication may provide
an interesting commentary, it failed to describe
an assessment. Involvement in curriculum,
instruction, and assessment was the most
reported leadership responsibility with no
assessment by participants (40/83, 48.2%). The
affirmation leadership responsibility had the
least amount of no assessments (17/83, 20.5) by
participants.
Intentional assessments were described
within 10.0% (174/1743) of the total responses
for the 21 leadership responsibilities. Site
visits (41 responses), assessments (60
responses), and writing (26 responses) mostly
in the form of specific writing prompts were
among the most common intentional
assessments described by participants.
Participants indicated affirmation was the most
intentionally assessed trait of the 21 leadership
responsibilities (15/83, 18.1%). Optimizer was
noted by participants as the least intentionally
assessed trait (5/83, 6.0%). Procedures which
contained both passive and intentional
assessments within a single answer were noted
by participants at times, as they appeared to list
the same response throughout all 21 of their
narrative responses for each leadership
responsibility (i.e., copy/paste throughout the
survey). While it may be implausible a
particular participant assessed for all 21
leadership responsibilities using a writing
prompt for each responsibility, it was assumed
the participant in fact assessed in this manner.
For example, Participant 20 indicated they
assess for each of the 21 leadership
responsibilities using “interview questions,
resume, writing prompt, references.” A
response such as this was coded as an
intentional assessment for this particular
leadership responsibility because a writing
prompt was considered intentional even though
it was used in conjunction with passive
assessments.
Discussion Results of this mixed method study are
encouraging when compared to previous results
from the research conducted by Rammer in
2007. Participants of this study were nearly
unanimous (97.4%) in agreeing that the 21
leadership responsibilities were important
considerations in hiring decisions, compared to
Rammer’s (2007) study where 92.0% of

22
_________________________________________________________________________________
Vol. 14, No. 3 Fall 2017 AASA Journal of Scholarship and Practice
participants considered the 21 leadership
responsibilities important. Similarly, only
2.6% of participants of this study disagreed that
some of the 21 leadership responsibilities were
important to consider when selecting principals
compared to 7.8% of participants from
Rammer’s (2007) study. Furthermore, the lack
of intentional assessments by top-level school
district administrators was apparent in both
Rammer’s (2007) and this study.
Communication as a leadership
responsibility
Communication has long been considered an
important responsibility for principals to
possess throughout principal selection
literature. Most participants of this study
strongly agreed communication was important
to consider when selecting a school principal
and no participants disagreed or strongly
disagreed regarding its importance as a
leadership responsibility. In fact,
communication had the highest percentage of
strongly agree responses from participants
(91.6%).
Considering the importance of
communication in selecting school principals, it
was surprising participants did not indicate the
highest intentional or passive assessments for
this trait. Also surprising was that many
participants did not indicate any assessment for
communication (26/83, 31.3%) and only nine
participants (10.8%) had an intentional
assessment for it. As the interview is widely
used within principal selection (Anderson,
1991; Baltzell & Dentler, 1983; Kwan, 2012;
Palmer, 2014; Rammer, 2007; Schmitt &
Schechtman, 1990; Walker & Kwan, 2012;
Wendel & Breed, 1988) and could be
considered at least a passive assessment for
communication, this result was curious. During
CCSS implementation and beyond, a
principal’s ability to communicate will be
paramount to the ultimate success or failure of
teachers and students as they teach and learn
respectively. Finding ways to assess
communication within principal selection
warrants further study.
Subjective assessments
Participants of this study reported practices
similar to those found in other studies within
principal selection, with the most subjective
methods being common. Interviews (i.e.,
passive assessments) are the primary means by
which principals are selected (Anderson, 1991;
Baltzell & Dentler, 1983; Kwan, 2012; Palmer,
2014; Rammer, 2007; Schmitt & Schechtman,
1990; Walker & Kwan, 2012; Wendel & Breed,
1988). When combining results (passive and
intentional) for assessments of the 21
leadership responsibilities, only 60.5% of
participants total responses (1054/1743)
indicated they assessed for the 21 leadership
responsibilities, even though 97.4%
(1698/1743) of participants agreed or strongly
agreed the 21 leadership responsibilities were
important to consider when selecting school
principals. With nearly 40% (689/1743) of
participant responses indicating no assessment
for the 21 leadership responsibilities, one has to
wonder how top-level school district
administrators are assessing for traits they
believe are important. Either top-level school
district administrators are assessing for traits
other than the 21 leadership responsibilities,
such as “fit,” or the administrators have limited
methodical or intentional means of assessment,
as has been found by other researchers (e.g.,
Greene, 1954, Baltzell & Dentler, 1983;
Blackmore et al., 2006; Gronn & Lacey, 2006;
Palmer, 2014, Rammer, 2007). If top-level
school district administrators have no means, or
only passive means of assessing for attributes
they believe are important to consider when
selecting school principals, this finding leads to
the question: How are school principal
candidates assessed during selection?

23
_________________________________________________________________________________
Vol. 14, No. 3 Fall 2017 AASA Journal of Scholarship and Practice
Intuition
According to the literature, use of intuition is
one method top-level school district
administrators use to select principals (Gronn
& Lacey 2006; Morgan, Hall, & McKay, 1983;
Parkay & Armstrong, 1987; Wendell & Breed,
1988). In this study, perception was
specifically mentioned within 16 responses as a
means of assessing principal candidates during
selection. Rammer (2007) explained that
superintendents can observe the traits they are
looking for during selection and hire the
candidate which possesses the desired traits.
Objective methods are needed to help top-level
school district administrators make important
selection decisions, especially when
considering the principals effect on student
achievement.
Assessing for the 21 leadership
responsibilities
Results of this study are promising in one
aspect, as top-level school district
administrators appear to have near-universally
considered the 21 leadership responsibilities to
be important for principal candidates to
possess. However, results of this study confirm
Rammer’s (2007) findings indicating top-level
school district administrators may not be
objectively assessing for principal traits related
to student achievement. The lack of objectivity
in selection assessments should be cause for
concern among education stakeholders and the
general public at large. A paradigm shift is
needed for the way school principals are
selected. Top-level school district
administrators should develop specific
intentional assessments in order to determine
whether or not principal candidates actually
possess the traits desired for the position. As
the traits that top-level school district
administrators should be looking for have
already been established, objectively assessing
for some or all of the 21 leadership
responsibilities should be a high priority for
top-level school district administrators who
hope to raise or sustain student achievement
within their schools.
Several researchers have discussed and
developed objective means for assessing
principal candidates. Rammer (2007)
described the development of new methods as
“critical but not difficult” (p. 75). He also
discussed the development of “specifically
designed simulations or measurements
designed to evaluate written materials to assess
the characteristics of the candidates” (p. 75).
One such method was developed over 30 years
ago by Broward County Public Schools
(BCPS).
Baltzell and Dentler (1983) described a
blind screening process used by BCPS where a
screening committee assessed candidates’
submitted materials. All identification
information (e.g., names, addresses, phone
number) was removed from the submitted
materials prior to the review. In particular, the
candidate’s references were asked to complete
an empirically weighted characteristics
appraisal form for rating the candidate without
knowing the weights of the traits listed. The
empirical weights of the traits on the form were
a closely guarded secret within the district.
Based on scoring from the blind review of
submitted materials and the reference protocol,
the highest scoring candidates were then
selected to proceed to the interview stage. In
more recent selection literature, objective
assessment processes have not been noted, with
the exception of Wildy et al.’s (2011)
performance task used in Australia.
Wildy et al. (2011) developed a
performance task which was found to have
acceptable validity and reliability for evaluating
principal candidates. The performance task
was developed with fairness in mind and

24
_________________________________________________________________________________
Vol. 14, No. 3 Fall 2017 AASA Journal of Scholarship and Practice
included a rubric, rater training in which the
raters had to undergo the same performance
task as principal candidates, bias training, and
participation in a data validation session
following the performance tasks to ensure
objectivity.
Candidates undergoing the performance
task had to “demonstrate their knowledge,
understanding, and skill in relation to the
leadership framework in general and the role of
principal in particular” by completing three
separate performance tasks (p. 281). Tasks
included document review and presentations
which addressed “real-world” school issues
such as “dealing with a poor performing
department head, handling a critical incident,
and implementing school-wide curriculum
change” (p. 280).
Candidates were required to fill a
variety of roles including communication with
large groups, subordinates, and superiors. The
raters worked in groups for each task and were
prohibited from communicating with each other
or working with the same rater in subsequent
tasks within an evaluation day to prevent data
contamination. The performance task
developed by Wildy et al. (2011) was found to
have construct validity and robust reliability as
indicated by Rasch analysis.
Conclusion
Top-level school district administrators, school
human resources professionals, school
administrator professional organizations, and
researchers should give the development of
new principal selection methods serious and
immediate attention. Wildy et al.’s (2011)
performance task and the blind screening
review implemented 30 years ago at BCPS are
only two examples of objective measures that
could move principal selection from using
mostly subjective processes to objective means
of evaluating principal candidates.
Incorporating the 21 leadership
responsibilities posited by Waters et al. (2004)
into objective assessments would provide top-
level school district administrators an
empirically tested and reliable method for
selecting school principals, and relatedly could
help to raise or sustain student achievement.
Given the high stakes environment of Common
Core State Standards implementation and
schools’ past academic performance since the
inception of The No Child Left Behind
legislation, the impetus for change may never
be more present than it is now.
Author Biography
Brandon Palmer is a school administrator and writes about educational leadership. He conducts
research on principal selection in affiliation with the DPEL Center for Research and Publication, which
resides in the Kremen School of Education and Human Development at California State University,
Fresno. E-mail: [email protected]

25
_________________________________________________________________________________
Vol. 14, No. 3 Fall 2017 AASA Journal of Scholarship and Practice
References
Anderson, M. (1991). Principals: How to train, recruit, select, induct, and evaluate leaders for
America's schools. Retrieved from ERIC database. (ED 337843).
Baltzell, D., & Dentler, R. (1983). Selecting American school principals: A sourcebook for educators.
Washington, DC: U.S. Dept. of Education, National Institute of Education.
Blackmore, J., Thomson, P., & Barty, K. (2006). Principal selection: Homosociability, the search for
security and the production of normalized principal identities. Educational Management
Administration & Leadership, 34(3), 297-317.
Brookover, W. B., Lezotte, L. W.(1979). Changes in school characteristics coincident with changes in
student achievement. (Occasional Paper No. 17).
Common Core State Standards Initiative. (2014). Standards in your state. Retrieved from
http://www.corestandards.org/standards-in-your-state/.
Creswell, J. (2009). Research design: Qualitative, quantitative, and mixed methods approaches (3rd
ed.). Los Angeles, CA: SAGE Publications, Incorporated.
Gardner, D. P. (1983). A nation at risk. Washington, DC: The National Commission on Excellence in
Education, US Department of Education.
Glaser, B. (1965). The constant comparative method of qualitative analysis. Social Problems, 12(4),
436-445.
Greene, J. (1954). Techniques and methods in the selection of elementary-school principals for large
school systems. Education, 75(4), 259-263.
Gronn, P., & Lacey, K. (2006). Cloning their own: Aspirant principals and the school-based selection
game. Australian Journal of Education, 50(2), 102-121.
Gullatt, D. E., & Lofton, B. D. (1996). The principal's role in promoting academic gain. Retrieved
from ERIC database. (ED403227)
Hallinger, P., Bickman, L., & Davis, K. (1996). School context, principal leadership, and student
reading achievement. The Elementary School Journal, 96(5), 527-549. doi:10.1086/461843
Hallinger, P., & Heck, R. H. (1996). Reassessing the Principal's Role in School Effectiveness.
Educational Administration Quarterly, 32(1), 5-44.
Heck, R. H. (1992). Principals' instructional leadership and school performance: Implications for
policy development. Educational Evaluation and Policy Analysis, 14(1), 21-34.

26
_________________________________________________________________________________
Vol. 14, No. 3 Fall 2017 AASA Journal of Scholarship and Practice
Hogan, J., & Zenke, L. (1986). Dollar-value utility of alternative procedures for selecting school
principals. Educational and Psychological Measurement, 46(4), 935-945.
doi:10.1177/001316448604600413.
Kwan, P. (2012). Assessing school principal candidates: Perspectives of the hiring superintendents.
International Journal of Leadership in Education, 15(3), 331-349.
doi:10.1080/13603124.2011.617838
Kwan, P., & Walker, A. (2009). Are we looking through the same lens? Principal recruitment and
selection. International Journal of Educational Research, 48(1), 51-61.
Leithwood, K., Louis, K., Anderson, S., & Wahlstrom, K. (2004). Review of research: How leadership
influences student learning. Toronto: University of Minnesota.
Levine, E., & Flory, A. (1975). Evaluation of job applications-a conceptual framework. Public
Personnel Management, 4(6), 378-385.
Lombard, M., Snyder‐Duch, J., & Bracken, C. (2002). Content analysis in mass communication:
Assessment and reporting of inter-coder reliability. Human Communication Research, 28(4),
587-604.
Mills, L. B., McDowelle, J. O., & Rouse Jr, W. A. (2011). A meta-analysis of research on the mediated
effects of principal leadership on student achievement. Southern Regional Council on
Educational Administration 2011 Yearbook: Leading in the Decade, 23.
Marzano, R. J., Waters, T., & McNulty, B. A. (2005). School leadership that works: From research to
results. ASCD. Alexandria, VA.
Morgan, C., Hall, V., & Mackay, H. (1983). The selection of secondary school headteachers. Milton
Keynes, UK: Open University Press.
Nunnally, J. (1978). Psychometric theory. New York, NY: McGraw-Hill
Palmer, B. G. (2014). An analysis of principal selection criteria and procedures in California
(Doctoral dissertation). Available from Proquest Dissertations and Theses database. (UMI No.
3639880).
Parkay, F., & Armstrong, R. (1987). A behavioral approach to the selection of school principals.
Planning and Changing, 18(3), 163-169.
Rammer, R. (2007). Call to action for superintendents: Change the way you hire principals. Journal of
Educational Research, 101(2), 67-76.
Schmitt, N., & Schechtman, S. (1990). The selection of school administrators. Journal of Personnel
Evaluation in Education, 3(3), 231-38.

27
_________________________________________________________________________________
Vol. 14, No. 3 Fall 2017 AASA Journal of Scholarship and Practice
Stewart, D., Shamdasani, P., & Rook, D. (2007). Focus groups: Theory and practice. Thousand Oaks,
CA: Sage
Walker, A., & Kwan, P. (2012). Principal selection panels: Strategies, preferences and perceptions.
Journal of Educational Administration, 50(2), 188-205.
Waters, T., Marzano, R., & McNulty, B. (2004). Developing the science of educational leadership.
ERS Spectrum, 22(1), 4-13.
Wendel, F., & Breed, R. (1988). Improving the selection of principals: An analysis of the approaches.
NASSP Bulletin, 72(508), 35-38.
Wildy, H., Pepper, C., & Guanzhong, L. (2011). Applying standards for leaders to the selection of
secondary school principals. Journal of Educational Administration, 49(3), 276-291.

28
_________________________________________________________________________________
Vol. 14, No. 3 Fall 2017 AASA Journal of Scholarship and Practice
Research Article ____________________________________________________________________
Interactions between Teachers’ Attribution for Student
Learning and Implementation of Evidence-Based Practices
Melinda Burchard, PhD
Associate Professor
Department of Education
Messiah College
Mechanicsburg, PA
Jennifer Fisler, EdD
Professor
Department of Education
Messiah College
Mechanicsburg, PA
Jan Dormer, EdD
Associate Professor
Department of Education
Messiah College
Mechanicsburg, PA
Abstract
This study investigated interactions between evidence-based practices implemented and attributions of
factors contributing to achievement of student learning objectives. Conducted in three school districts
in a mid-Atlantic state, 78 teachers completed an end-of-year survey. Internal attributions were
significantly correlated with implementation of evidence-based teaching practices in general and in
teaching students with disabilities. External attributions were statistically correlated to implementation
of evidence-based practices in both reading and teaching students with disabilities. Perceptions of
school support were significantly correlated with implementation of evidence-based teaching practices
for teaching both reading and writing.
Key Words
teacher quality, evidence-based practices, teacher attribution, student learning outcomes

29
_________________________________________________________________________________
Vol. 14, No. 3 Fall 2017 AASA Journal of Scholarship and Practice
The Every Student Succeeds Act (ESSA,
2016) stresses implementation of evidence-
based teaching practices, and high expectations
for students toward postsecondary studies or
employment. The emphasis on implementation
of evidence-based teaching practices requires
that teachers implement teaching practices
shown to work well through replicated studies.
An evidence-based teaching practice is
defined as a teaching practice established
through meta-analysis with a mean effect size
greater than .20 for challenging populations or
constructs, and .40 or greater for most teaching
purposes, and .80 or higher for most
noteworthy levels of effectiveness.
For the purposes of this study, the
researchers designed a checklist of evidence-
based practices directly from meta-analyses of
those practices (See appendix A). The
assumption of ESSA is that use of evidence-
based practices will improve student learning.
Use of effective strategies is not the
only possible factor in student learning gains;
many factors may impact student learning.
Teachers’ attributions of the causes of student
learning gains may partially explain how a
teacher operates within a teacher effectiveness
system (Chang and Davis, 2009; Dweck, 2000;
Turner, Warzon, and Christensen, 2011).
For the purposes of this study, teacher
attribution is defined as conclusions teachers
make about student behaviors, successes and
failures, especially as these conclusions relate
to their own teaching practices. Researchers
measured teacher attributions through
responses to researcher-created questions
aiming at both external (outside teachers’
control) and internal (within teachers’ control)
factors (see appendix A).
The purpose of this study was to
investigate relationships between
implementation of evidence-based practices
and teacher attributions for student learning.
This report addresses these relationships using
descriptive and correlational analyses.
Procedures Participant Recruitment
This study took place in one mid-Atlantic state.
Researchers recruited teachers who had written
an annual goal and related assessment of
student learning as part of the state-mandated
teacher evaluation system. During spring 2016,
recruitment occurred through administrative
communication.
Instrumentation
Researchers administered an online survey in
late spring. Participants were asked to enter a
self-created code and identify only the school
and grade levels in which they taught to keep
responses anonymous. Teachers rated whether
an annual objective for student learning (SLO)
was achieved as “yes, fully achieved”, “yes,
partially achieved”, or “no, not achieved” and
what data was gathered to document such
achievement. Each teacher rated the importance
of factors contributing to achievement or lack
of achievement of the SLO including prior
knowledge and skills of students and teachers,
teacher actions, motivation of students and
teachers, unanticipated events, and support
from the school or district.
Teachers also completed a checklist of
evidence-based practices used consistently
during the school year. The checklist was based
upon three sources: What Works Clearinghouse
Practice Guides, high quality meta-analyses of
experimentally designed educational studies
(Institute of Education Sciences, 2014),
Council for Exceptional Children’s Current

30
_________________________________________________________________________________
Vol. 14, No. 3 Fall 2017 AASA Journal of Scholarship and Practice
Practice Alerts, brief summaries of high quality
meta-analyses specific to students with
disabilities (Council for Exceptional Children,
2000), and a study of meta-analyses of teaching
practices with strong evidence-based practices
(Burchard, 2014). Both the What Works
Clearinghouse Practice Guides and the CEC
Current Practice Alerts adhere to strict quality
standards, with their highest ratings reserved
for teaching practices with mean effect sizes of
.80 or higher (Baker, et al., 2014; Council for
Exceptional Children, 2000).
For most areas of practice, the checklist
included only those practices with mean effect
sizes of .80 or higher or rated as strong in the
What Works Clearinghouse Practice Guides or
as “Go For It” in the Current Practice Alerts.
The one exception was for practices to meet the
needs of English Language learners, in which
researchers included practices with mean effect
sizes of .40 or practices rated as moderate by
the What Works Clearinghouse Practice
Guides. This exception is due to the relatively
recent and somewhat limited research on
evidence-based practices for teaching English
language learners (Baker, et. al, 2014).
Results Participants
Teachers completed the on-line questionnaire
in spring 2016. All 78 participants were
certified teachers in three school districts of one
mid-Atlantic state.
Implementation of evidence-based teaching
practices
Using the checklist, teachers identified a
variety of evidence-based practices
implemented consistently during the past
academic year. All used more than one
evidence-based practice in multiple categories.
Evidence-based general teaching practices
As illustrated in Table 1, more than half of
participants used five of the evidence-based
practices that apply in general to all teaching:
graphic organizers (n=68, 89.47%), using
materials with which students can interact
(n=53, 69.74%), teaching critical thinking
strategies specific to course content (n=64,
84.21%), mnemonics (n=48, 63.16%), and
explicitly teaching and promoting self-
regulated learning (n=47, 61.84%).

31
_________________________________________________________________________________
Vol. 14, No. 3 Fall 2017 AASA Journal of Scholarship and Practice
Table 1
Evidence-Based Practices Implemented by 50% or More of Participants
__________________________________________________________________________________
Percentage and Count
Evidence-Based General Teaching Practices Percentage Count
Graphic Organizer 89.47% 68
Critical Thinking Strategies Specific to Content 84.21% 64
Materials with Which Students Can Interact 69.74% 53
Mnemonics 63.16% 48
Self-Regulated Learning 61.84% 47
Evidence-Based Reading Practices
Questioning Strategies 81.82% 63
Reading Comprehension 77.92% 60
Vocabulary Instruction for Reading 68.83% 53
Text Enhancement Strategies 62.34% 48
Small Group Reading Instruction 58.44% 45
Using Writing to Develop Reading 54.55% 42
Decoding 51.95% 40
Evidence-Based Writing Practices
Peer Assistance 58.44% 45
Process Approach 57.14% 44
Evidence-Based Math Practices
None implemented by 50% or more of participants
Evidence-Based Practices for Teaching Students with Disabilities
Formative Evaluation 74.03% 57
direct instruction (explicit instruction) 62.34% 48
Evidence-Based Practices for Teaching ELLs
None implemented by 50% or more of participants

32
_________________________________________________________________________________
Vol. 14, No. 3 Fall 2017 AASA Journal of Scholarship and Practice
Evidence-based reading teaching practices
Over half of the participants also reported
implementing each of the highly effective
practices for teaching reading. These results
indicated that teachers appeared to be teaching
reading across grade levels and content areas
through use of evidence-based reading
practices.
Evidence-based writing practices
Over half of respondents reported
implementing two of the highly effective
writing practices. Most teachers reported using
structured peer assistance (n=45, 58.44%).
Most also reported teaching writing using the
Process Approach which moves through stages
of brainstorming, drafting, revisions, editing,
and on to some sort of publishing (n=44,
57.14%).
Evidence-based math teaching practices
In contrast to other categories of evidence-
based practices, less than half of participants
reported use of each of the highly effective
math teaching practices. Participants
represented quite a variety of content areas,
some of which integrate fewer math practices.
Though only practices implemented by half or
more of participants were included in Table 3,
over 40% reported implementation of three
math teaching practices: explicitly teaching
students to verbally express math reasoning
(n=34, 46.58%), use of concrete math
manipulatives (n=33, 45.21%), and having
students create their own visual representations
of math problems (n=33, 45.21%).
Evidence-based practices for teaching
children with disabilities
Specific to teaching children with disabilities,
over half of participants indicated consistent
implementation of two strongly evidence-based
practices for meeting needs of that population.
Most teachers reported consistent use of
formative evaluation (n=57, 74.03%) and direct
or explicit instruction (n=48, 62.34%).
Evidence-based practices for teaching ELL
Implementation of evidence-based teaching
practices for teaching ELLs occurred less
frequently, with less than half of participants
implementing any of the evidence-based
practices for teaching ELLs. In fact, over 55%
of participants reported using none of the listed
teaching practices for teaching ELLs (n=40,
55.56%). Nearly half of participating teachers
(n=33, 45.21%) reported integrating oral and
written English language instruction within
teaching of other content. Just over 30%
reported designing structured opportunities to
develop writing skills and intervening for ELLs
with small group instruction in literacy and
language. Importantly, each of the three
participating school districts report ELL
populations of less than 3% (PDE, 2016), but
the survey did not ask teachers to identify if
they had ELLs in their own classrooms.
Achieving student learning objectives
Teachers were asked to rate their satisfaction
with their achievement of the SLOs and record
data gathered to measure achievement of the
SLO. Then teachers rated the importance of
internal and external factors related to
achievement of the SLOs.
Data gathered to assess SLOs
Though some teachers reported using more
than one type of assessment, teachers most
commonly assessed SLO achievement using
teacher-made tests or quizzes (n=26, 34%),
performance tasks that could be measured with
a checklist or by completion (n=21, 27%), and
national or standardized tests (n=19, 25%).
Approximately one fifth of teachers reported
using projects or portfolios scored by a rubric
(n=15, 19%). A small number of teachers
reported measuring SLO achievement using

33
_________________________________________________________________________________
Vol. 14, No. 3 Fall 2017 AASA Journal of Scholarship and Practice
writing (n=7, 9%) or assessment of gains
through progress monitoring (n=5, 6%).
Finally, almost one fifth of teachers reported
using broad assessments such as grades or
some otherwise unspecified evaluation of
achievement (n=14, 18%).
Factors attributed to satisfaction or
dissatisfaction in achievement of SLOs
After rating satisfaction or dissatisfaction with
accomplishment of their SLO, teachers then
rated importance of factors impacting such
satisfaction or dissatisfaction. (See Table 2.)
Table 2
Importance of Factors in Satisfaction with SLO Achievement
__________________________________________________________________________________
Percentage (count)
Construct Not
Important
Minimally
Important
Important Very
Important
Teacher Knowledge
6.41% (5) 8.97% (7) 38.46% (30) 46.15% (36)
Teacher Actions
0% (0) 1.28% (1) 35.90% (28) 62.82% (49)
Teacher Motivation
1.28% (1) 7.69% (6) 42.31% (33) 48.72% (38)
Unanticipated Events
11.54 (9) 43.59% (34) 33.33% (26) 11.54% (9)
Support from Building or District
5.13% (4) 29.49% (23) 41.03% (32) 24.36% (19)
Students’ Prior Knowledge
7.69% (6) 16.67% (13) 43.59% (34) 32.05% (25)
Students’ Motivation
0% (0) 0% (0) 34.62% (27) 65.38% (51)
Teachers rated their own motivation as
important or very important in how well they
met their SLO (n=71, 91.03%), teaching
actions as important or very important (n=77,
98.72%), while they indicated that their prior
knowledge or skills were slightly less impactful
with 84.61% rating that as important or very
important (n=66). At the same time, 100% of
teachers (n=78) rated students’ motivation as
important or very important in accomplishment
of the SLO. While teachers attributed a strong
degree of internal control to outcomes of
student learning, these teachers also attributed a
strong degree of external control through
student motivation. These results suggest that
attention to motivation strategies is an
important priority in progressing toward goals
for student learning.

34
_________________________________________________________________________________
Vol. 14, No. 3 Fall 2017 AASA Journal of Scholarship and Practice
In contrast, teachers attributed greatest
importance in any dissatisfaction with
achievement of the SLO to two external factors
(see Table 3).
Table 3
Importance of Factors in Dissatisfaction with SLO Achievement
__________________________________________________________________________________
Percentage (count)
Construct Not
Important
Minimally
Important
Important Very
Important
Total
Teacher Knowledge
30.99% (22) 28.17% (20) 26.76% (19) 14.08% (10) 71
Teacher Actions
12.68% (9) 28.17% (20) 33.80 (24) 25.35% (18) 71
Teacher Motivation
28.57% (20) 27.14% (19) 24.29% (17) 20.00% (40) 70
Unanticipated Events
26.76% (19) 42.25% (30) 21.135 (15) 9.86% (7) 71
Support from Building or
District
18.57% (13) 34.29% (24) 34.29% (24) 12.86% (9) 70
Students’ Prior Knowledge
18.06% (13) 19.44% (14) 34.72% (25) 27.78% (20) 72
Students’ Motivation
4.23% (3) 11.27% (8) 32.39% (23) 52.11% (37) 71
A significant majority of the teachers
(84.5%) rated students’ lack of motivation as
important or very important (n=60), and 62.5%
of teachers rated students’ prior knowledge and
skills as important or very important (n=45). In
other words, when teachers were dissatisfied
with how well an SLO was achieved, they
attributed an important degree of influence to
students’ motivation and to what students
already knew and could do. These attributions
provided important perspectives for school-
wide professional development for
interventions for students with learning gaps, or
low motivation.
Relationships between implementation of
evidence-based practices and attribution factors
Results revealed important relationships
between implementation of evidence-based
teaching practices and teachers’ rating of the
importance of factors contributing to
achievement or lack of achievement of learning
outcomes, “attribution factors.”
Table 4 shows the matrix of correlations
with any significance. External factors of
students’ prior knowledge and skills, students’
motivation, and unanticipated events did not
correlate significantly with implementation of

35
_________________________________________________________________________________
Vol. 14, No. 3 Fall 2017 AASA Journal of Scholarship and Practice
any evidence-based practices and so are not
reported in Table 4. While several correlations
were statistically significant, twelve
correlations reached the magnitude threshold of
.30 or higher, showing a strong predictive
relationship.
Table 4
Correlations Matrix of Evidence-Based Practices Implemented to Attributions
______________________________________________________________________________
Pearson Correlation
Attribution Factors
General
Practices
Reading
Practices
Writing
Practices
Math
Practices
Teaching Students
with Disabilities
Teaching
ELLs
Teacher Knowledge .412*** .264* .174 .165 .385*** .300**
Teacher Actions .430*** .234* .257* .200* .268** .294**
Teacher Motivation .356*** .208* .153 .188 .228* .277**
Internal Factors .443*** .257* .209* .200* .329** .319**
School Support .267** .404*** .337** .253* .273** .268**
External Factors .184 .310** .282** .121 .304** .256*
* p-value <.05 ** p-value <.01 *** p-value <.001
Relationships between internal attribution
and evidence-based general teaching
practices
Results revealed a statistically significant
positive correlation between implementation of
evidence-based general teaching practices and
internal factors of attribution. A strong
predictive relationship existed between teacher
actions and implementation of evidence-based
general teaching practices, r (n=77)=.430,
p<.001. Results showed a strong relationship
between teachers’ prior knowledge and skills
and implementation of evidence-based general
teaching practices r (n=77)=.412, p<.001.
Results also showed a strong predictive
relationship between teacher motivation and
implementation of evidence-based general
teaching practices, r (n=77)=.356, p<.001.
Those three internal factors together correlated
more strongly with implementation of
evidence-based general teaching practices, r
(n=77)=.443, p<.001.
It is important to stress that these
correlations did not indicate a causal
relationship. No results from this study
communicated that internal attribution caused
teachers to implement evidence-based general
teaching practices nor conversely that
implementation of evidence-based general
teaching practices caused teachers to internalize
control over accomplishment of student

36
_________________________________________________________________________________
Vol. 14, No. 3 Fall 2017 AASA Journal of Scholarship and Practice
learning. These results instead meant that there
was a strong linear relationship between those
factors for this population. For practical
purposes, such correlations might encourage
schools to explore professional development in
general evidence-based practices and/or
encouragement of teachers in developing their
knowledge and skills, accounting for their
actions, and addressing their own motivation.
Relationships between internal attribution
and implementation of evidence-based
practices for teaching students with
disabilities and ELLs
Combined internal factors (those under a
teacher’s control) were significantly correlated
with implementation of practices that work in
teaching students with disabilities, r
(n=77)=.329, p<.01, or ELLs, r (n=77)=.319,
p<.01. Of particular interest, teachers’ prior
knowledge and skills was significantly
correlated with implementation of evidence-
based teaching practices in teaching both
children with disabilities, r (n=77)=.385,
p<.001, and children who are ELLs, r
(n=77)=.300, p<.01. This means that
professional development could be very
important to evidence-based teaching for those
two student populations.
Relationships between school support and
implementation of evidence-based practices
in reading and writing
Results showed an important predictive
relationship between perceived support from
schools and school districts and implementation
of evidence-based practices in reading, r
(n=77)=.404, p<.001, and writing, r
(n=77)=.337, p<.01. While we cannot state
conclusively that school support would change
implementation of evidence-based practices for
teaching reading and writing, these results did
imply that support from schools and school
districts might encourage teachers to implement
practices that work for teaching reading and
writing.
Relationships between external attribution
and implementation of evidence-based
practices in reading and teaching children
with disabilities
Results showed a strong relationship between
external attribution factors (combining
students’ prior knowledge, students’
motivation, unanticipated events, and perceived
support from schools and school districts) and
implementation of some evidence-based
practices. Specifically, results showed a strong
correlation between external attribution and
implementation of evidence-based reading
practices, (n=77), r =.310, p<.01. In making
sense of these results it is important to recall
the strong positive relationship between
perceived school support and implementation
of evidence-based reading practices. Further
results showed a strong correlation between
external attribution factors and implementation
of evidence-based practices for teaching
children with disabilities, (n=77), r =.304,
p<.01. These results indicate that educators
respond to the needs of learners using practices
that work best for teaching children with
disabilities.
Discussion The goal of all educators is to provide high
quality instruction that supports student
learning. This study demonstrated interactions
between teachers’ perceived cause of actual
achievement of SLOs and implementation of
evidence-based teaching practices.
Notably, this study demonstrated that
there was a strong predictive relationship
between internal attributions (factors within a
teacher’s control) and teachers implementing
evidence-based general teaching practices.
Furthermore, there was a strong predictive
relationship between internal attributions and

37
_________________________________________________________________________________
Vol. 14, No. 3 Fall 2017 AASA Journal of Scholarship and Practice
implementation of evidence-based practices for
teaching students with disabilities. This means
that the more strongly teachers feel they can
make a difference in how students achieve
learning outcomes, and especially for students
with disabilities, the more likely they are to
implement methods proven effective, in this
case evidence-based teaching practices.
These results may indicate either that
teachers attribute strong internal control over
student learning as they implement evidence-
based teaching practices in general teaching
and for students with disabilities, or that they
seek teaching practices that work when they
attribute personal control to the
accomplishment of student learning outcomes.
This study also demonstrated a strong
linear relationship between teachers’ attribution
of external factors (school support,
unanticipated events, students’ prior knowledge
and skills, and student motivation) and
teachers’ implementation of evidence-based
practices in teaching reading and teaching
students with disabilities.
One can imagine scenarios in which
evidence-based practices are used, but learning
is still unsuccessful, and therefore the teacher
attributes failure to external factors.
On the other hand, teachers may
implement evidence-based practices in
response to concerning needs of students,
responding with teaching practices that work,
but still not overcoming the level of need in
order to meet intended target outcomes. In
either case, more research is needed to fully
explain this resulting relationship.
Finally, results showed a strong
predictive relationship between implementation
of evidence-based practices for teaching
reading and writing and perceptions of school
support. Because this study did not investigate
causation, researchers cannot conclude that
school support leads to greater implementation
of evidence-based reading and writing teaching
practices, but this linear relationship is certainly
encouraging to school districts as they provide
various supports for implementation of such
evidence-based teaching practices.
Limitations
Various factors limit conclusions that can be
drawn from this study. First, the study
participants represented three school districts of
fairly similar demographic factors in one mid-
Atlantic state, none of which were urban school
districts and none of which had very many
ELLs. The sample size was reasonable for this
study design but small for broad interpretation
to generalizable knowledge. Finally, school
districts should limit interpretations from
correlational studies to relationships, not to
causation.
Implications for future research
Future research might investigate such
relationships in larger sample sizes representing
more diverse school districts from multiple
states. Furthermore, future research might
investigate causation between such factors as
school support and professional development
with gains in self-efficacy or implementation of
evidence-based practices, or causation between
implementation of evidence-based practices
and improvement in student learning outcomes.
Conclusion In this study, researchers investigated
relationships between teachers’ satisfaction
with achievement of student learning
objectives, teachers’ attributions of factors
impacting achievement, and implementation of
evidence-based practices. Researchers found
significant relationships between

38
_________________________________________________________________________________
Vol. 14, No. 3 Fall 2017 AASA Journal of Scholarship and Practice
implementation of evidence-based practices
and teachers’ attributions of factors impacting
achievement of those student learning
objectives. Understanding relationships between
these factors may inform professional development
priorities of schools and school districts.
Author Biographies
Melinda Burchard is associate professor of special education at Messiah College in Pennsylvania. Her
recent research includes evidence-based practices for special educators and self-efficacy for multi-
tiered instruction for both pre-service and in-service teachers. Jennifer Fisler is professor of education and director of teacher education at Messiah College in
Pennsylvania. Her professional interests include teacher leadership and educational assessment. She
recently served as director of a multi-year grant implementing co-teaching with student teachers. Jan Edwards Dormer is associate professor of TESOL at Messiah College in Pennsylvania. She has
recently authored the book What School Leaders Need to Know About English Language
Learning, published by TESOL International Association.
39
_________________________________________________________________________________
Vol. 14, No. 3 Fall 2017 AASA Journal of Scholarship and Practice
References
Act 82, Pennsylvania Public School Code of 1949- Omnibus Amendments. Pub. L. No. 684, § 82, PA
Stat. 2012-82 (2012).
Baker, S., Lesaux, N., Jayanthi, M., Dimino, J., Proctor, C. P., Morris, J., Gersten, R., Haymond, K.,
Kieffer, M. J., Linan-Thompson, S., & Newman-Gonchar, R. (2014). Teaching academic
content and literacy to English learners in elementary and middle school (NCEE 2014-4012).
Washington, DC: National Center for Education Evaluation and Regional Assistance (NCEE),
Institute of Education Sciences, U.S. Department of Education. Retrieved from the NCEE
website: http://ies.ed.gov/ncee/wwc/publications_reviews.aspx.
Burchard, M. (2014). An Analysis of evidence-based teaching practices from meta-analyses 2000 to 2014 for
kindergarten through middle school. Pennsylvania Teacher Educator.
Chang, M.-L., and Davis, H.A. (2009). Understanding the roles of teacher appraisals in shaping the
dynamics of their relationships with students: Deconstructing teachers’ judgments of disruptive
behavior/students. In P. Schutz and M Zembylas (Eds.) Advances in Teacher Emotion
Research: The Impact of Teachers’ Lives. New York, Springer. 95-125.
Council for Exceptional Children: Division for Learning Disabilities and Division for Research.
(2000). The Alert Series What is It? Current Practice Alerts, 1, 1-4. Retrieved April 16, 2015
from http://teachingld.org/alerts#the-alert-series
Dweck, C.S. (2000). Self-theories: Their role in motivation, personality, and development.
Philadelphia: Psychology Press.
Every Student Succeeds Act (ESSA) Act of 2015, Pub. L. No. 114-95, § 1177, Stat. 1802 (2016).
Institute of Education Sciences. (2014). What Works Clearinghouse Practice Guides. Washington, DC:
National Center for Education Evaluation and Regional Assistance, Institute of Education
Sciences, U.S. Department of Education. Retrieved from:
http://ies.ed.gov/ncee/wwc/publications/practiceguides/.

40
_________________________________________________________________________________
Vol. 14, No. 3 Fall 2017 AASA Journal of Scholarship and Practice
Appendix A
Questionnaire about Evidence-Based Practices and Attribution
General Practices
Please check all of these evidence-based practices YOU CONSISTENTLY used in general teaching
practices during the 2015-2016 academic year. Please, check all that apply.
Graphic Organizer (visually graphing relationships between concepts)
Mnemonics (includes first letter mnemonics, peg words, key words, songs, rhyming
mnemonics, visual mnemonics, and motions-- any devices to support memory for any learning
outcomes including vocabulary, lists, steps in a process, comprehension, etc.)
Physical materials students can manipulate (for any content other than math-- this includes
anything as simple as little slips of paper or magnets)
Critical thinking strategy specifically connected to content (learning a specific method of
critical thinking for that specific content. For young children this includes the scientific method
in science. As children mature, this grows more specific such as reasoning with primary
sources in history, or using a specific problem-solving strategy for a specific data type in
computer programming.)
Self-regulated learning (students learning to self-monitor and regulate learning or behaviors
using steps in a strategy or checklists or other means of self-regulation)
Virtual reality game (specifically games that allow a student to interact in a three-dimensional
environment)
None from this list
Reading Practices
Please check all of these evidence-based practices YOU CONSISTENTLY used in reading practices
during the 2015-2016 academic year. Please, check all that apply.
Decoding (emphasizing word sounding out and identification)
Questioning strategies (including questions about main ideas, details, deep questioning
routines, etc.)
Reading comprehension (instruction or strategies to focus on comprehension)
Small group reading instruction
Text enhancement strategies (strategies to focus on using text features such as illustrations or
bolded terms or headings an subheadings or explicit training in how to use a glossary or other
supports)
Using writing to develop reading (such as journaling about reading)
Vocabulary instruction for reading (explicit instruction in specific vocabulary for reading-
related outcomes)
None from this list
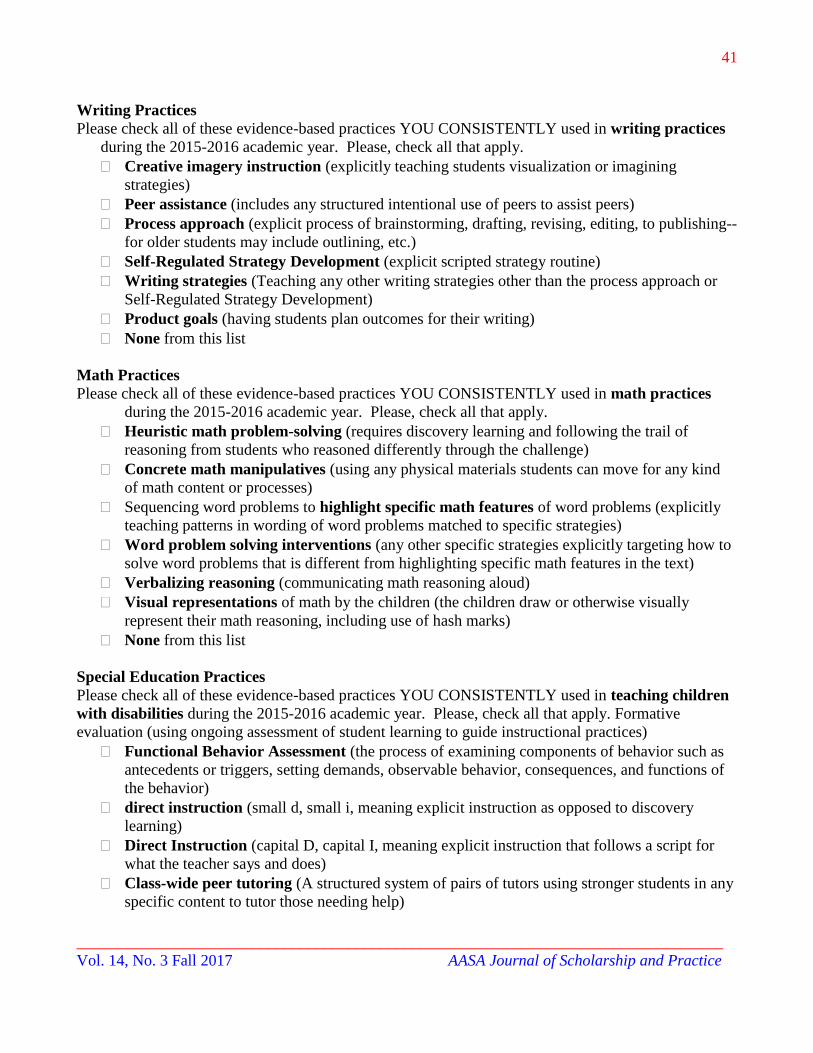
41
_________________________________________________________________________________
Vol. 14, No. 3 Fall 2017 AASA Journal of Scholarship and Practice
Writing Practices
Please check all of these evidence-based practices YOU CONSISTENTLY used in writing practices
during the 2015-2016 academic year. Please, check all that apply.
Creative imagery instruction (explicitly teaching students visualization or imagining
strategies)
Peer assistance (includes any structured intentional use of peers to assist peers)
Process approach (explicit process of brainstorming, drafting, revising, editing, to publishing--
for older students may include outlining, etc.)
Self-Regulated Strategy Development (explicit scripted strategy routine)
Writing strategies (Teaching any other writing strategies other than the process approach or
Self-Regulated Strategy Development)
Product goals (having students plan outcomes for their writing)
None from this list
Math Practices
Please check all of these evidence-based practices YOU CONSISTENTLY used in math practices
during the 2015-2016 academic year. Please, check all that apply.
Heuristic math problem-solving (requires discovery learning and following the trail of
reasoning from students who reasoned differently through the challenge)
Concrete math manipulatives (using any physical materials students can move for any kind
of math content or processes)
Sequencing word problems to highlight specific math features of word problems (explicitly
teaching patterns in wording of word problems matched to specific strategies)
Word problem solving interventions (any other specific strategies explicitly targeting how to
solve word problems that is different from highlighting specific math features in the text)
Verbalizing reasoning (communicating math reasoning aloud)
Visual representations of math by the children (the children draw or otherwise visually
represent their math reasoning, including use of hash marks)
None from this list
Special Education Practices
Please check all of these evidence-based practices YOU CONSISTENTLY used in teaching children
with disabilities during the 2015-2016 academic year. Please, check all that apply. Formative
evaluation (using ongoing assessment of student learning to guide instructional practices)
Functional Behavior Assessment (the process of examining components of behavior such as
antecedents or triggers, setting demands, observable behavior, consequences, and functions of
the behavior)
direct instruction (small d, small i, meaning explicit instruction as opposed to discovery
learning)
Direct Instruction (capital D, capital I, meaning explicit instruction that follows a script for
what the teacher says and does)
Class-wide peer tutoring (A structured system of pairs of tutors using stronger students in any
specific content to tutor those needing help)

42
_________________________________________________________________________________
Vol. 14, No. 3 Fall 2017 AASA Journal of Scholarship and Practice
Cognitive strategy instruction (emphasizing strategies to develop thinking and steps to
problem-solve)
Fluency instruction (focusing on reading with speed accuracy and expression)
Phonics instruction (focusing on letter-sound correspondences and their use in spelling and
reading)
Picture Exchange Communication System (children pointing to or exchanging picture icons
to express needs or wants or responding to such representations for receptive communication or
visual scheduling)
Video-based interventions (videos typically demonstrating how to do something or how to
socialize, similar to social stories or task analysis, but on video)
Explicit instruction for secondary (middle/high school) content learning outcomes (for
students with disabilities or who struggle)
Mnemonic strategies for secondary (middle/ high school) content learning outcomes (for
students with disabilities or who struggle)
English interventions for secondary (middle/ high school) content learning outcomes (for
students with disabilities or who struggle)
Interventions for students with disabilities for high school content learning outcomes
Interventions for students with disabilities taught by a special educator for secondary
(middle/high school) content learning outcomes
Combined social studies and science interventions for secondary (middle/ high school)
content learning outcomes (for students with disabilities or who struggle)
Classroom learning strategies for secondary (high school) content learning outcomes (for
students with disabilities or who struggle)
Social studies interventions for secondary (middle/ high school) content learning outcomes
(for students with disabilities or who struggle)
Interventions for students with disabilities in the special education setting for secondary
(middle/high school) content learning outcomes
Interventions for students with disabilities for middle school content learning outcomes
Spatial or Graphic Organizers for secondary (middle/ high school) content learning
outcomes (for students with disabilities or who struggle)
Study aids for secondary (middle/ high school) content learning outcomes (for students with
disabilities or who struggle)
Science interventions for secondary (middle/ high school) content learning outcomes (for
students with disabilities or who struggle)
Peer Mediation for secondary (middle/high school) content learning outcomes (for students
with disabilities or who struggle)
Interventions for students with disabilities in the general education setting for secondary
(middle/high school) content learning outcomes
None from this list
ESL Practices
Please check all of these teaching practices YOU CONSISTENTLY used in teaching English
language learners (i.e. your instruction was NOT the same as for native English speakers)
during the 2015-2016 academic year. Please, check all that apply.

43
_________________________________________________________________________________
Vol. 14, No. 3 Fall 2017 AASA Journal of Scholarship and Practice
Vocabulary instruction (focusing on one set of academic vocabulary words intensively across
several days using a variety of instructional strategies).
Integrate oral and written English Language instruction into content area teaching.
Provide regular structured opportunities to develop written language skills
Provide small group instructional interventions for ELLs struggling in literacy and English
language development
None from this list
What data did you gather to assess achievement of your Student Learning Objective?
Were you satisfied with the outcome of your Student Learning Objective?
Yes, fully satisfied
Yes, mostly satisfied
No, not satisfied

44
_________________________________________________________________________________
Vol. 14, No. 3 Fall 2017 AASA Journal of Scholarship and Practice

45
_________________________________________________________________________________
Vol. 14, No. 3 Fall 2017 AASA Journal of Scholarship and Practice
Commentary_______________________________________________________________________
Administrators Gaming Test- and Observation-Based Teacher
Evaluation Methods: To Conform To or Confront the System
Tray J. Geiger, MEd
Doctoral Student
Mary Lou Fulton Teachers College
Arizona State University
Tempe, AZ
Audrey Amrein-Beardsley, PhD
Professor
Mary Lou Fulton Teachers College
Arizona State University
Tempe, AZ
Abstract
In this commentary, we discuss three types of data manipulations that can occur within teacher
evaluation methods: artificial inflation, artificial deflation, and artificial conflation. These types of
manipulation are more popularly known in the education profession as instances of Campbell’s Law
(1976), which states that the higher the consequences or stakes surrounding almost any quantifiable
event (e.g., one that is based on numerical scores or outcomes), the more likely the scores or outcomes
are subject to pressures of corruption and distortion, as directly related to the relative importance or
weight of the consequences attached. We examine each type of data manipulation and consider the
greater impact of each on practice and policy.
Key Words
teacher evaluation, data manipulation

46
_________________________________________________________________________________
Vol. 14, No. 3 Fall 2017 AASA Journal of Scholarship and Practice
“Gaming the system,” or what can be more
popularly identified as instances of
Machiavellian, ends-justifying-the-means
schema that help advance individuals’ careers,
frequently occur in all realms of life. Popular
press mentions often include accounts of this in
the sports world, with international news most
recently revealing that 16 professional tennis
players, including eight who partook in the
2016 Australian Open—one of the sport’s
biggest tournaments—were involved in “match
fixing,” where players purposefully altered the
outcomes of matches to make significant sums
of money (Blake & Templon, 2016).
Likewise, manipulation of the stock
market in terms of insider trading occurs,
whereby a person who has insider knowledge
makes trades on behalf of him/herself and
perhaps others, after which the trades made
cause stock prices to artificially inflate or
deflate, without any real change to the market-
value of the stocks themselves.
Recall in the 1980s when airline
executives extended flights’ times of arrival to
increase the percentages of on-time flight
percentages for which airlines were being held
accountable. Remember as well when crime
rates observed during Richard Nixon’s
presidency became suspiciously underreported
and downgraded to less serious categories to
yield the anticipated “less crime” objectives
and goals set by the Nixon legislation.
Gaming the System in Education These occurrences of manipulation are more
popularly known in the education profession as
instances of Campbell’s Law (1976).
Campbell’s Law states that, in essence, the
higher the consequences or stakes surrounding
almost any quantifiable event (e.g., one that is
based on numerical scores or outcomes), the
more likely the scores or outcomes are subject
to pressures of corruption and distortion, as
directly related to the relative importance or
weight of the consequences attached. As one
might expect, the effects of Campbell’s Law
have been prevalent in education for years,
predominantly surrounding high-stakes
standardized testing and teacher-level
accountability policies as based on high-stakes
tests.
Instances and reports of teachers
helping students with questions on standardized
tests, teachers replacing students’ incorrect
answers with correct answers, teachers
excluding or exempting certain low-scoring
subgroups from testing, and the like, have been
present throughout research and popular press
sources (see, for example, Nichols & Berliner,
2007).
These occurrences have been most
notable since the passage of former president
George W. Bush’s No Child Left Behind
(NCLB, 2001) Act, but also noted in the
research prior (e.g., since the state of Florida
first introduced in 1979 what we now know as
a high-stakes test). Educators have felt similar
pressures to game the system in response to
other increased accountability policies and
initiatives (e.g., the Race to the Top Act of
2011).
In fact, primarily these two federal
education policies (i.e., NCLB and Race to the
Top), the latter of which incentivized states
with $4.35 billion in federal funds to adopt and
implement new and improved teacher
evaluation and accountability systems (i.e., as
largely reliant upon numerically measuring the
extent to which teachers “grow” or “add value”
to their students’ academic achievement over
time using advanced statistical growth or value-
added models (VAMs)) mandated and
incentivized states, respectively, to
theoretically realize educational reform. VAMs

47
_________________________________________________________________________________
Vol. 14, No. 3 Fall 2017 AASA Journal of Scholarship and Practice
are designed to isolate and measure teachers’
alleged contributions to student achievement on
large-scale standardized achievement tests as
groups of students move from one grade level
to the next.
VAMs are, accordingly, used to help
objectively compute the differences between
students’ composite test scores from year-to-
year, with value-added being calculated as the
deviations between predicted and actual growth
(including random and systematic error).
Differences in growth are to be compared to
“similar” coefficients of “similar” teachers in
“similar” districts at “similar” times, after
which teachers are positioned into their
respective and descriptive categories of
effectiveness (e.g., highly effective, effective,
ineffective, highly ineffective).
Simultaneously, however, Campbell’s
Law has also since had its way as per the
distortion of the very numerical indicators at
play, whereby states and many state leaders
continue to do whatever it takes to reap or
avoid the high-stakes awards and penalties also
attached (e.g., significant monetary bonuses
paid to superintendents adopting and promoting
such policies; see, for example, Amrein-
Beardsley, Collins, Holloway-Libell, &
Paufler, 2016).
In fact, school administrators in some
states and districts have faced incredible
pressures to artificially manipulate high-stakes
test data for multiple reasons, and they have
engaged as a result, all the while evidencing
additional instances of Campbell’s Law.
Namely, since Race to the Top (2011),
and states’ and school districts’ subsequent foci
on teacher level accountability as measured by
teachers’ levels of growth or value-added,
school administrators have taken it upon
themselves (or been advised or forcefully
persuaded) to:
(1) artificially inflate teachers’
observational scores (i.e., rubric-based
measures of teachers’ in-classroom
instructional practice(s)) to protect their
teachers against what school administrators
often view as the extreme consequences (e.g.,
teacher termination, the revocation of tenure)
attached to what they also often view as
unreliable, invalid, or unfair teacher
accountability systems;
(2) artificially deflate teachers’
observational scores to consciously guard
against their own (sub)conscious and
“subjective” biases and prejudices, as often
charged or accused; and
(3) artificially conflate both teachers’
observational scores and growth/VAM scores
to guarantee that the two adequately align and
correlate as theoretically expected, and also
pragmatically required should either or both
indicators be used in consequential ways.
Evidence of validity increases as
measurement indicators point in the same
direction and support the same inferences and
conclusions to be drawn (i.e., convergent-
related evidence of validity). In this case, if
both measures (i.e., the growth or value-added
and observational measure) line up, they
validate one another, and yield the required
evidence needed to support increased
confidence in both measures as independent
measures of the same construct.
These gaming instances are emphasized
herein because school administrators are the
educators who are often either encouraging or
engaging in these gaming behaviors, again, for
a variety of reasons; hence, this is the exact
audience that needs to better understand what
engaging in primarily these gaming behaviors

48
_________________________________________________________________________________
Vol. 14, No. 3 Fall 2017 AASA Journal of Scholarship and Practice
means in terms of validity, or the validity of the
inferences to be derived via either or both the
growth/VAM and observational estimates at
play.
Artificial Inflation, Deflation, and
Conflation Artificial inflation
Artificial inflation occurs when school
administrators artificially increase, without
merit, the ratings of their teachers’ in-
classroom practices (i.e., via observational
rubrics), either covertly or overtly, and most
often when administrators want to protect
teachers who they deem as “effective” or good-
to-great teachers, but whose growth/VAM
scores evidence them as significantly less. In
these cases, school administrators will often
rate these teachers higher than they might rate
other teachers of the same quality, simply to
offset the typically lower growth/VAM scores.
As Campbell’s Law would have it, this
is much more likely when there are serious
consequences at play, and school
administrators aim to protect teachers from
what they, again, view as a potential set of
inappropriate consequences (e.g., termination
after one or two years of poor ratings) to be
attached to low composite (i.e., growth/VAM
plus observational estimates) scores. Engaging
in this practice, while perhaps humanitarian and
justified as appropriate or rational, ultimately
distorts the validity of the inferences to be
drawn by the mere manipulation of one
indicator to offset the other.
Artificial deflation
Artificial deflation occurs when school
administrators decrease, again without merit,
the ratings of their teachers’ observational
scores. This type of manipulation has been
documented much less frequently than artificial
inflation; however, it still occurs. Again, in the
cases of artificial deflation, school
administrators might deliberately rate teachers
of equal caliber lower than their comparable
peers, to deliberately (and oft-forcedly) guard
against their own (sub)conscious and (too)
often favorable biases and prejudices when
“subjectively” observing and scoring their
teachers in practice.
For example, in the now famous Widget
Report (Weisberg, Sexton, Mulhern, &
Keeling, 2009), researchers reported that only
1% of teachers were rated as “unsatisfactory,”
which they deemed as nonsensical given the
US as a whole is still merely performing
around average as compared to other
comparable industrialized nations. Indeed,
“subjective” school administrators were to
blame; hence, this became one of the key
policy reports that convinced federal
policymakers to move forward with the Race to
the Top (2011) competition to entirely reform
states’ “subjective” teacher evaluation systems.
Accordingly, school administrators
have since been asked or forced to artificially
deflate teachers’ observational scores to
essentially ensure that all scores, when taken
together, fit a normal bell curve, which will
illustrate to others that there is indeed a normal
distribution of teachers as per their
effectiveness, versus a skewed distribution
demonstrating “too many” effective teachers.
While an entirely arbitrary venture, this
is being perpetually encouraged to counter
critics’ aforementioned claims. For example,
the National Institute for Excellence in
Teaching (NIET) that sponsors and promotes
state and district use of their TAP System for
Teacher and Student Advancement, evidently
encourages TAP evaluators to generously
distribute average scores (i.e., 3 = at
expectations) and to use high scores
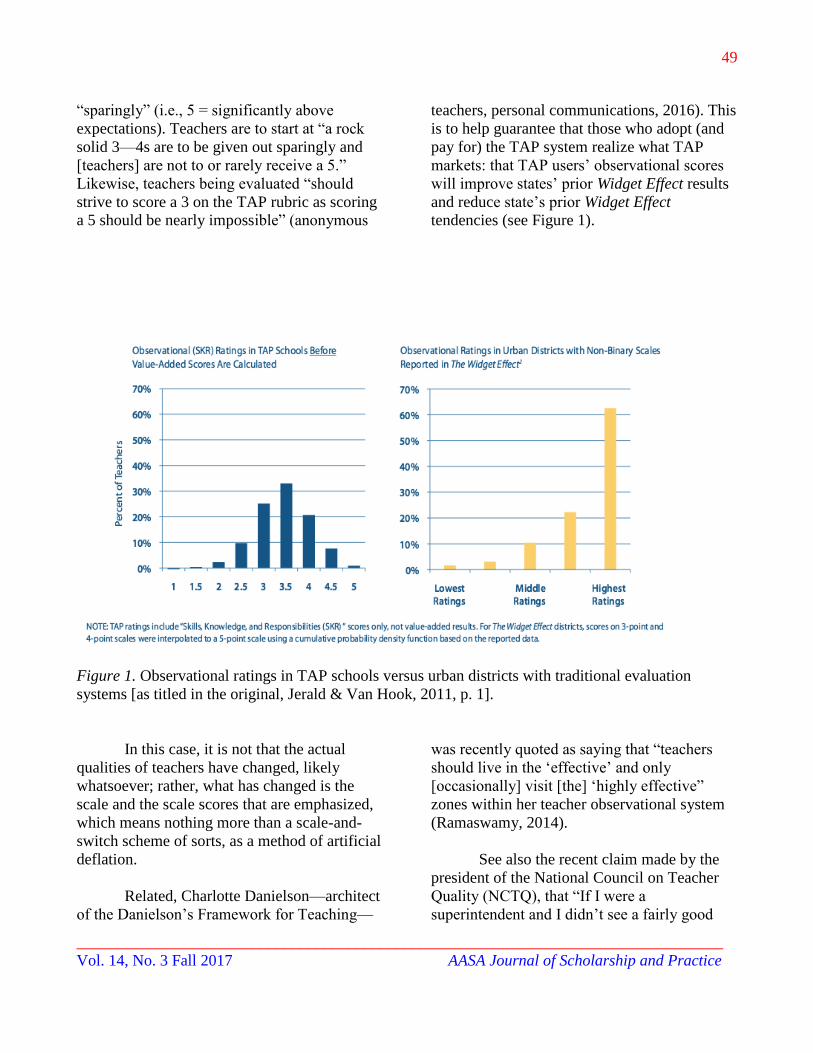
49
_________________________________________________________________________________
Vol. 14, No. 3 Fall 2017 AASA Journal of Scholarship and Practice
“sparingly” (i.e., 5 = significantly above
expectations). Teachers are to start at “a rock
solid 3—4s are to be given out sparingly and
[teachers] are not to or rarely receive a 5.”
Likewise, teachers being evaluated “should
strive to score a 3 on the TAP rubric as scoring
a 5 should be nearly impossible” (anonymous
teachers, personal communications, 2016). This
is to help guarantee that those who adopt (and
pay for) the TAP system realize what TAP
markets: that TAP users’ observational scores
will improve states’ prior Widget Effect results
and reduce state’s prior Widget Effect
tendencies (see Figure 1).
Figure 1. Observational ratings in TAP schools versus urban districts with traditional evaluation
systems [as titled in the original, Jerald & Van Hook, 2011, p. 1].
In this case, it is not that the actual
qualities of teachers have changed, likely
whatsoever; rather, what has changed is the
scale and the scale scores that are emphasized,
which means nothing more than a scale-and-
switch scheme of sorts, as a method of artificial
deflation.
Related, Charlotte Danielson—architect
of the Danielson’s Framework for Teaching—
was recently quoted as saying that “teachers
should live in the ‘effective’ and only
[occasionally] visit [the] ‘highly effective”
zones within her teacher observational system
(Ramaswamy, 2014).
See also the recent claim made by the
president of the National Council on Teacher
Quality (NCTQ), that “If I were a
superintendent and I didn’t see a fairly good

50
_________________________________________________________________________________
Vol. 14, No. 3 Fall 2017 AASA Journal of Scholarship and Practice
distribution curve within my district [as per
teachers’ effectiveness ratings], I’d be
suspicious about what was going on” (Amar,
2016).
Accordingly, it is oftentimes
superintendents who on their own accord or are
often (ill)advised by naive edu-philanthropists
like this, who are forcing their school
administrators to artificially suppress their
observational ratings of teachers, again, to
force such socially-Darwinian illusions of
normality, via more symmetrically distributed
teacher effectiveness curves.
This too, of course, has serious
implications for the validity of the inferences to
be drawn, upon which high-stakes decisions are
to be made, in that what is “true” is being
forcibly distorted by socially constructed
definitions of what “truth” is supposed to look
like.
Artificial conflation
Lastly, artificial conflation occurs when school
administrators guarantee or ensure that
teachers’ growth/VAM estimates are
adequately aligned or correlated with their
observational scores and ratings. Reports of
artificial conflation have been reported, more
specifically, in Alabama, Georgia, and
Tennessee, and most recently, Texas. In
Tennessee, the state’s Board of Education
(2012) actually made it state policy that
teachers’ observational scores be forcibly
aligned with their growth/VAM scores,
regardless of what it took to reach the increased
levels of alignment externally mandated and
desired.
State leaders even provided guidelines
to help school administrators check their own
levels of "subjectivity,” and consequently
artificially manipulate teachers’ observational
scores (typically downwards) when the
alignment between teachers’ observational and
growth/VAM scores fell outside of an
(arbitrarily defined) “acceptable” range.
Similarly, state level policies in both Alabama
and Georgia assert that the multiple measures
(i.e., observational and growth/VAM scores)
used to evaluate teachers should also be
positively correlated, with similar emphases on
charging those with the authority to manipulate
teachers’ observational scores (i.e., school
administrators) to match teachers’ more
“objective” growth/VAM counterparts.
In the Houston Independent School
District (HISD), one of the nation’s largest
urban public school districts in the nation,
many school principals have also reported that
they were under significant pressure from
district administrators to ensure that their
teachers’ observational and growth/VAM
scores were also satisfactorily “aligned.”
Further, these school principals reported
actually manipulating teachers’ observational
scores to match their growth/VAM scores, to
not be officially identified as “at risk for
misalignment” and in need of intervention and
improvement themselves as school
administrators with supervisory/observational
roles. Teachers also reported being aware that
their school principals were doing this, noting
also that they knew their principals were being
forced to do so by, in this case, the district’s
superintendent (Collins, 2014; Paufler, under
review; see also Amrein-Beardsley et al.,
2016).
Apparently, it is around these more
“objective” indicators that all other more
“subjective” indicators are to revolve, although
current research suggests that neither or these
two indicators should be so privileged, or
trusted (see, for example, American Statistical
Association, 2014; American Educational
Research Association, 2015). This also has

51
_________________________________________________________________________________
Vol. 14, No. 3 Fall 2017 AASA Journal of Scholarship and Practice
serious implications for the validity of the
inferences to be drawn and used for decision-
making purposes. But perhaps more
importantly, doing this or engaging in and
encouraging such behaviors negates the entire
enterprise, as well as the entire purpose for
doing and financing all of this in the first place.
Conclusions What school administrators need to know is
that they are unequivocally remiss if they
believe artificially manipulating teachers’
observational scores is a beneficial or
warranted practice.
Worse would be if school
administrators continue to engage in such
practices, without fighting back (and often
upwards in education’s oft-hierarchial systems)
in that this is, simply put, very bad educational
measurement and professional practice.
While it might seem like an easy ace or
safe play in the game to avoid being deemed as
“too subjective,” to dodge any sort of
“misalignment” issues, or rather engage in a
perceptibly necessary act to protect one’s
teachers, engaging in any of the three behaviors
detailed prior can be incredibly dangerous as
any of these practices ultimately distort the
validity of both measures of teacher
effectiveness, as well as the validity of the
inferences to be drawn as based on both
measures combined, in all cases and regardless
of the degree, to levels that results and
outcomes can no longer be trusted, used, or
supported with evidence.
This, accordingly, must be stopped.
Author Biographies
Tray Geiger is a doctoral student in educational policy and evaluation in the Mary Lou Fulton Teachers
College at Arizona State University. His research interests include teacher evaluation systems,
education accountability policy, and Critical Race Theory. E-mail: [email protected]
Audrey Amrein-Beardsley is currently a professor in the Mary Lou Fulton Teachers College at Arizona
State University. Her research interests include educational policy, educational measurement, research
methods, and more specifically, high-stakes tests and value-added methodologies and systems. E-mail:

52
_________________________________________________________________________________
Vol. 14, No. 3 Fall 2017 AASA Journal of Scholarship and Practice
References
Amar, M. (2016, July 15). Denver Public Schools set to strip nearly 50 teachers of tenure protections
after poor evaluations. Chalkbeat Colorado. Retrieved from
http://www.chalkbeat.org/posts/co/2016/07/14/denver-public-schools-set-to-strip-nearly-50-
teachers-of-tenure-protections-after-poor-evaluations/#.V5Yryq47Tof
American Educational Research Association (AERA). (2015). AERA statement on use of value-added
models (VAM) for the evaluation of educators and educator preparation programs. Educational
Researcher, X(Y), 1-5. doi:10.3102/0013189X15618385 Retrieved from
http://edr.sagepub.com/content/early/2015/11/10/0013189X15618385.full.pdf+html
American Statistical Association (ASA). (2014). ASA statement on using value-added models for
educational assessment. Alexandria, VA. Retrieved from http://VASboozled.com/wp-
content/uploads/2014/03/ASA_VAS_Statement.pdf
Amrein-Beardsley, A., Collins, C., Holloway-Libell, J., & Paufler, N. A. (2016). Everything is bigger
(and badder) in Texas: Houston’s teacher value-added system. [Commentary]. Teachers College
Record. Retrieved from http://www.tcrecord.org/Content.asp?ContentId=18983
Blake, H., & Templon, J. (2016, January 17). The tennis racket. BuzzFeed News/BBC. Retrieved from
https://www.buzzfeed.com/heidiblake/the-tennis-racket?utm_term=.krym92EzO#.hmznB7x0z
Campbell, D. T. (1976). Assessing the impact of planned social change. Hanover, NH: The Public
Affairs Center, Dartmouth College. Retrieved from
http://portals.wi.wur.nl/files/docs/ppme/Assessing_impact_of_planned_social_change.pdf
Collins, C. (2014). Houston, we have a problem: Teachers find no value in the SAS Education Value-
Added Assessment System (EVAAS®). Education Policy Analysis Archives, 22(98), 1-42.
doi:http://dx.doi.org/10.14507/epaa.v22.1594 Retrieved from
http://epaa.asu.edu/ojs/article/view/1594
Jerald, C. D., & Van Hook, K. (2011). More than measurement: The TAP system’s lessons learned for
designing better teacher evaluation systems. Santa Monica, CA: National Institute for
Excellence in Teaching (NIET). Retrieved from http://files.eric.ed.gov/fulltext/ED533382.pdf
Nichols, S. L. & Berliner, D. C. (2007). Collateral damage: How high-stakes testing corrupts
America’s schools. Cambridge, MA: Harvard Education Press.
No Child Left Behind (NCLB) Act of 2001, Pub. L. No. 107-110, § 115 Stat. 1425. (2002). Retrieved
from http://www.ed.gov/legislation/ESEA02/
Paufler, N. A. (under review). Principal reflections on the implementation of a teacher evaluation
system. Teachers College Record.

53
_________________________________________________________________________________
Vol. 14, No. 3 Fall 2017 AASA Journal of Scholarship and Practice
Race to the Top (RttT) Act of 2011, S. 844--112th Congress. (2011). Retrieved from
http://www.govtrack.us/congress/bills/112/s844
Ramaswamy, S. V. (2014). Teacher evaluations: Subjective data skew state results. The Journal News.
Retrieved from http://www.lohud.com/story/news/education/2014/09/12/state-teacher-evals-
skewed/15527297/
Tennessee State Board of Education (TSBE). (2012). Teacher and principal evaluation policy.
Nashville, TN. Retrieved from https://www.tn.gov/assets/entities/sbe/attachments/7-27-12-
II_C_Teacher_and_Principal_Evaluation_Revised.pdf
Weisberg, D., Sexton, S., Mulhern, J., & Keeling, D. (2009). The Widget Effect: Our national failure to
acknowledge and act on differences in teacher effectiveness. New York, NY: The New Teacher
Project (TNTP). Retrieved from http://tntp.org/assets/documents/TheWidgetEffect_2nd_ed.pdf

54
_________________________________________________________________________________
Vol. 14, No. 3 Fall 2017 AASA Journal of Scholarship and Practice
Book Review________________________________________________________________________
Excellence vs Equality: Can Society Achieve Both Goals
Written by Allan Ornstein
Reviewed by Art Stellar
Art Stellar, PhD
Vice President
National Education Foundation
McLean, VA
With so much that has been written about the
tension between achieving excellence while
ensuring equality, Allan Ornstein’s treatise
makes a significant contribution in explaining
the origins and continuing conditions for the
differences of opinion about these aspirational
concepts. Scholars and practitioners alike have
been having weighty conversations about
excellence and equity for years, and it is likely
that the debate will continue well into the
future, even as this piece adds some clarity.
As a reviewer, my hope is that in such
works, the author will answer the inherent
obvious or hidden dilemma or questions posed
to the readers or, at a minimum, provide some
solace with a first step towards a solution that
comes next. With some exceptions, this author
leaves those tasks to the reader.
Ornstein, a noted professor at St. John’s
University, takes his readers on a guided history
through education and sociology, starting with
the ancient Greeks through about 2015. Much
of his lens for both education and excellence is
related to economic outcomes. He reminds his
readers that there has been a “top two percent”
in every society, whose status appears to be
uninfluenced by additional dollars for
education. Furthermore, the research he quotes
does not support the general improvement of
excellence or equality with increased education
funding.
The book’s subject is timely with a
national conversation focused on the income
divide as described by such current contrasts as
“Wall Street” vs “Main Street”, “1 percent” vs
“99 percent”, “Tax Payers” vs “Takers”.
Ornstein writes:
In a high-passion debate we often
hear from all kinds of
professionals, pundits, and self-
styled experts, arguing (1)
whether safety nets and social
programs are necessary, (2)
whether “ job creators” should
be taxed (and how much), (3)
what steps are needed to stabilize
the financial system, (4) whether
banks and corporations need to
be regulated (and to what extent),
(5) why we cannot end poverty in
America (and in other parts of
the world), (6) whether
opportunity and mobility still
exist for ordinary people in
America or elsewhere, (7) how to
improve schools, employment,
and income and other economic

55
_________________________________________________________________________________
Vol. 14, No. 3 Fall 2017 AASA Journal of Scholarship and Practice
conditions over the long- term,
and (8) who should attend
college, how do we make
colleges more affordable, and
how can private colleges provide
more need-based assistance,
while balancing the competitive
advantages of awarding merit-
based assistance without
exhausting their resources. (p. 1)
In the main, changing the
aforementioned conditions may make little
difference if one believes as the author does
that, “The problem is, we are becoming a
society of inherited wealth, not self-made
people, just when we thought we had put
behind the idea of heredity privilege and old
patterns of aristocracies, family caste and class”
(p. 9). This is an example of the kinds of topics,
along with race and gender differences, the
author claims Americans prefer not to discuss.
Ornstein presents a litany of evidence and
examination of the influence of inherited
wealth.
The author shows how growing talent
gaps between countries demonstrate that the
United States is losing ground to the rest of the
world in the preparation of qualified
professionals with little hope of turning the
situation around. This trend exacerbates family
background playing a more significant role in
one’s achieving excellence than that of self-
determination. As U.S. corporations hire high
quality employees from other parts of the
world, fewer aspirational jobs are available
here, making family connections more
prominent.
A brief historical note with some
scholarly quotations suggests that in the last
few centuries the West has dominated most
professional fields and has led in the production
of “excellence.”
The West has peaked according to many
economists as new countries are emerging as
leaders. The West has no monopoly on
innovation or entrepreneurship. Those at the top
of the American dream have the resources to
remain there as “excellence” expands globally.
However, the middle class and the
poverty class in this country do not have the
tools or the will to compete in this new reality.
As it seems to be playing out, global gaps are
being reduced while gaps within Western
societies are widening. The author proposes that
students who come to study at U.S. universities
should be encouraged to stay as foreign-born
residents and are three times more likely to
secure a graduate degree than those who are
native-born.
Americans have other means of
reaching excellence, at least financial
excellence, by exhibiting unusual talent in the
arts, athletics, or other endeavors. Luck is also a
factor. Experience, social skills, and judgment
can be helpful as well. Obtaining educational
credentials was once more important than it is
today.
Ornstein summarizes the history of
education in the United States from the point of
view of excellence and equality. Education was
a means for the masses to learn basic skills for
employment and a way for the more privileged
to advance and contribute to society.
Relying mainly upon the massive
Coleman study and the equally comprehensive
Jencks research, Inequality, the author suggests
that additional education funding makes no
difference on educational outcomes for
students.
Schools do almost nothing to impact
equity among student subgroups or to what

56
_________________________________________________________________________________
Vol. 14, No. 3 Fall 2017 AASA Journal of Scholarship and Practice
extent they become successful, according to
these studies. This reviewer was somewhat
alarmed that other more recent educational
research was not cited.
While it may be true that most schools
do not make a profound difference on student
learning, Ron Edmonds and others in the
“Effective Schools Movement” discovered high
poverty schools that enhanced students’
opportunities for excellence and equality. Many
more such schools have been validated in the
last decade.
If one accepts the premise that school
expenditures do not make a difference on
excellence or equality, then what does?
Enabling more high quality productive
immigrants to enter the United States is
implied; however, there is the potential political
backlash from current residents.
With the current national ideological
split, that is not a feasible solution. Family
background has some potential; however, that
takes generations to upgrade to the point of
fostering excellence and reducing inequality.
Eliminating poverty may take wholesale
redistribution of wealth which the public would
likely not find acceptable. The alternative to
excellence and equality may be a “just and fair
society” (p.74).
Everyone would have opportunities for
mobility within a narrower range between the
bottom and the top. This would require some
agreement on compensation limits at both the
top and the bottom of the economic scale.
Ornstein describes the liberal and conservative
arguments against imposing economic floors
and ceilings for citizens.
The answer to the question in the book’s
title—Excellence vs Equality: Can Society
Achieve Both Goals?—can only be answered by
society itself and through a democracy.
The current divide in this country is
partially fueled by this dilemma; therefore, it
may take decades until people can reflect and
compromise upon viable solutions.
Reviewer Biography
Art Stellar is vice-president of the National Education Foundation. He has served as a superintendent
for 25 years becoming a life member of AASA in 1972. He has received three national awards from
AASA: Distinguished Service Award, the Dr. Effie Jones Humanitarian Award and Leadership for
Learning award. He has served as president of ASCD, the Horace Mann League and the North
American Chapter of the World Council for Curriculum and Instruction, as well as vice-president of the
New York State PTA. He has authored over 500 publications and consulted with many educational
organizations. He can be reached at [email protected].
Excellence vs Equality: Can Society Achieve Both Goals? was written by Allan Ornstein and published
by Routledge, New York, in 2015, 208 pages, softback price is $49.95.

57
_________________________________________________________________________________
Vol. 14, No. 3 Fall 2017 AASA Journal of Scholarship and Practice
Mission and Scope, Copyright, Privacy, Ethics, Upcoming Themes, Author
Guidelines, Submissions, Publication Rates & Publication Timeline The AASA Journal of Scholarship and Practice is a refereed, blind-reviewed, quarterly journal with a
focus on research and evidence-based practice that advance the profession of education administration.
Mission and Scope The mission of the Journal is to provide peer-reviewed, user-friendly, and methodologically sound
research that practicing school and district administrations can use to take action and that higher
education faculty can use to prepare future school and district administrators. The Journal publishes
accepted manuscripts in the following categories: (1) Evidence-based Practice, (2) Original Research,
(3) Research-informed Commentary, and (4) Book Reviews.
The scope for submissions focus on the intersection of five factors of school and district administration:
(a) administrators, (b) teachers, (c) students, (d) subject matter, and (e) settings. The Journal encourages
submissions that focus on the intersection of factors a-e. The Journal discourages submissions that
focus only on personal reflections and opinions.
Copyright Articles published by AASA, The School Superintendents Association (AASA) in the AASA Journal of
Scholarship and Practice fall under the Creative Commons Attribution-Non-Commercial-NoDerivs 3.0
license policy (http://creativecommons.org/licenses/by-nc-nd/3.0/). Please refer to the policy for rules
about republishing, distribution, etc. In most cases our readers can copy, post, and distribute articles
that appear in the AASA Journal of Scholarship and Practice, but the works must be attributed to the
author(s) and the AASA Journal of Scholarship and Practice. Works can only be distributed for non-
commercial/non-monetary purposes. Alteration to the appearance or content of any articles used is not
allowed. Readers who are unsure whether their intended uses might violate the policy should get
permission from the author or the editor of the AASA Journal of Scholarship and Practice.
Authors please note: By submitting a manuscript the author/s acknowledge that the submitted
manuscript is not under review by any other publisher or society, and the manuscript represents original
work completed by the authors and not previously published as per professional ethics based on APA
guidelines, most recent edition. By submitting a manuscript, authors agree to transfer without charge
the following rights to AASA, its publications, and especially the AASA Journal of Scholarship and
Practice upon acceptance of the manuscript. The AASA Journal of Scholarship and Practice is indexed
by several services and is also a member of the Directory of Open Access Journals. This means there is
worldwide access to all content. Authors must agree to first worldwide serial publication rights and the
right for the AASA Journal of Scholarship and Practice and AASA to grant permissions for use of
works as the editors judge appropriate for the redistribution, repackaging, and/or marketing of all works
and any metadata associated with the works in professional indexing and reference services. Any
revenues received by AASA and the AASA Journal of Scholarship and Practice from redistribution are
used to support the continued marketing, publication, and distribution of articles.

58
_________________________________________________________________________________
Vol. 14, No. 3 Fall 2017 AASA Journal of Scholarship and Practice
Privacy The names and e-mail addresses entered in this journal site will be used exclusively for the stated
purposes of this journal and will not be made available for any other purpose or to any other party.
Please note that the journal is available, via the Internet at no cost, to audiences around the world.
Authors’ names and e-mail addresses are posted for each article. Authors who agree to have their
manuscripts published in the AASA Journal of Scholarship and Practice agree to have their names and
e-mail addresses posted on their articles for public viewing.
Ethics The AASA Journal of Scholarship and Practice uses a double-blind peer-review process to maintain
scientific integrity of its published materials. Peer-reviewed articles are one hallmark of the scientific
method and the AASA Journal of Scholarship and Practice believes in the importance of maintaining
the integrity of the scientific process in order to bring high quality literature to the education leadership
community. We expect our authors to follow the same ethical guidelines. We refer readers to the latest
edition of the APA Style Guide to review the ethical expectations for publication in a scholarly journal.
Upcoming Themes and Topics of Interest Below are themes and areas of interest for publication cycles.
1. Governance, Funding, and Control of Public Education
2. Federal Education Policy and the Future of Public Education
3. Federal, State, and Local Governmental Relationships
4. Teacher Quality (e.g., hiring, assessment, evaluation, development, and compensation
of teachers)
5. School Administrator Quality (e.g., hiring, preparation, assessment, evaluation,
development, and compensation of principals and other school administrators)
6. Data and Information Systems (for both summative and formative evaluative purposes)
7. Charter Schools and Other Alternatives to Public Schools
8. Turning Around Low-Performing Schools and Districts
9. Large scale assessment policy and programs
10. Curriculum and instruction
11. School reform policies
12. Financial Issues
Submissions
Length of manuscripts should be as follows: Research and evidence-based practice articles between
2,800 and 4,800 words; commentaries between 1,600 and 3,800 words; book and media reviews
between 400 and 800 words. Articles, commentaries, book and media reviews, citations and references
are to follow the Publication Manual of the American Psychological Association, latest edition.
Permission to use previously copyrighted materials is the responsibility of the author, not the AASA
Journal of Scholarship and Practice.

59
_________________________________________________________________________________
Vol. 14, No. 3 Fall 2017 AASA Journal of Scholarship and Practice
Cover page checklist: 1. title of the article; 2. contributor name(s); 3. terminal degree; 4. academic rank; 5. department; 6. college or university; 7. city, state 8. telephone and fax numbers; 9. e-mail address; 10. 120-word abstract that conforms to APA style; 11. six to eight key words that reflect the essence of the submission; and 12. 40-word biographical sketch; 13. identify if the submission is to be considered original research, evidence-based practice article,
commentary, or book review.
Please do not use headers or footers with page numbers in the submission. Rather than use footnotes, it
is preferred authors embed footnote content in the body of the article. Articles are to be submitted to the
editor by e-mail as an electronic attachment in Microsoft Word, Times New Roman, 12 Font.
Acceptance Rates The AASA Journal of Scholarship and Practice maintains of record of acceptance rates for each of the
quarterly issues published annually. The percentage of acceptance rates since 2010 is as follows:
2011: 16%
2012: 22%
2013: 15%
2014: 20%
2015: 22%
2016: 19%
Book Review Guidelines Book review guidelines should adhere to the author guidelines as found above. The format of the book
review is to include the following:
• Full title of book
• Author
• Publisher, city, state, year, # of pages, price
• Name and affiliation of reviewer
• Contact information for reviewer: address, city, state, zip code, e-mail address,
telephone and fax
• Reviewer biography
• Date of submission

60
_________________________________________________________________________________
Vol. 14, No. 3 Fall 2017 AASA Journal of Scholarship and Practice
Publication Timeline
Issue Deadline to Submit
Articles
Notification to Authors
of Editorial Review Board
Decisions
To AASA for
Formatting
and Editing
Issue Available
on
AASA website
Spring October 1 January 1 February 15 April 1
Summer February 1 April 1 May 15 July1
Fall May 1 July 1 August 15 October 1
Winter August 1 October 1 November 15 January 15
Additional Information
Contributors will be notified of editorial board decisions within eight weeks of receipt of papers at the
editorial office. Articles to be returned must be accompanied by a postage-paid, self-addressed
envelope.
The AASA Journal of Scholarship and Practice reserves the right to make minor editorial changes
without seeking approval from contributors.
Materials published in the AASA Journal of Scholarship and Practice do not constitute endorsement of
the content or conclusions presented.
The Journal is listed in Cabell’s Directory of Publishing Opportunities. Articles are also archived in the
ERIC collection. The Journal is available on the Internet and considered an open access document.
Editor
Kenneth Mitchell, EdD
AASA Journal of Scholarship and Practice
Submit articles electronically: [email protected]
To contact by postal mail:
Dr. Ken Mitchell
Associate Professor
School of Education
Manhattanville College
2900 Purchase Street
Purchase, NY 10577

61
_________________________________________________________________________________
Vol. 14, No. 3 Fall 2017 AASA Journal of Scholarship and Practice
AASA Resources
✓ Learn about AASA’s books program where new titles and special discounts are
available to AASA members. The AASA publications catalog may be downloaded at
www.aasa.org/books.aspx.
✓ Join AASA and discover a number of resources reserved exclusively for members. Visit
www.aasa.org/Join.aspx. Questions? Contact C.J. Reid at [email protected].
✓ Upcoming AASA Events
Early Childhood Learning Summit, Oct. 23-24, InterContinental Hotel, Miami, Fla.
AASA National Conference on Education, Feb. 15-17, 2018, Nashville, Tenn.