deformation process and mechanism analyses of a rock slope
TRANSCRIPT
Research ArticleDeformation Process and Mechanism Analyses of a Rock SlopeBased on Long-Term Monitoring at the Pubugou HydropowerStation, China
Xuefeng Mei ,1 Nengfeng Wang ,2 Guotao Ma,3 Jie Wang,4 Yan Wang,3 Jianli Wu ,3
Mei Han ,5 and Bin Cai2
1School of Civil and Architectural Engineering, Shandong University of Technology, Zibo 255049, China2Power China Chengdu Engineering Corporation Limited, Chengdu 610072, China3Faculty of Geosciences and Environment Engineering, Southwest Jiaotong University, Chengdu 610031, China4Sichuan Institute of Geological Engineering Investigation Group Co., Ltd., Chengdu 610072, China5School of Mathematics, Southwest Jiaotong University, Chengdu, Sichuan 610031, China
Correspondence should be addressed to Nengfeng Wang; [email protected] and Mei Han; [email protected]
Received 15 December 2020; Revised 7 January 2021; Accepted 15 January 2021; Published 13 February 2021
Academic Editor: Bin Gong
Copyright © 2021 Xuefeng Mei et al. This is an open access article distributed under the Creative Commons Attribution License,which permits unrestricted use, distribution, and reproduction in any medium, provided the original work is properly cited.
This paper presents a typical 450m high rock slope in a highly jointed and fractured rock mass at Pubugou (PBG) hydropowerstation on the Dadu River. We established a set of multiphase field geological survey combined with GPS, inclinometers, andpiezometer monitoring system to analyze the deformation and failure mechanism of rock slope. The results show that small-scale excavation in road construction disrupted the balance of the Pubugou rock slope (PBGRS), and several local retrogressivefailures occurred at the toe. Monitoring data regarding surface and subsurface movements show that the PBGRS is stable as awhole. The deformation concentrated mainly in the loosened fractured zone, which was a feature with sliding-compressioncracking. Highly loosened rock mass was the predominant factor affecting the stability of the PBGRS, while the role of reservoirwater level fluctuation, though positive, was not significant. Overall, the PBGRS still has a high potential for furtherdevelopment, especially in the slope’s upper zone. To reinforce the slope, measurements mainly consist of the concrete framecombined with anchor cables constructed on the slope. In this study, the analysis was carried out of pre- and postreinforcementmeasure slope stability with numerical simulation, and safety factor increased from 1.09 to 1.21. This study’s findings haveimportant implications to the analytical method and reinforcement design with geological settings like that of the PBGRS.
1. Introduction
The Western Sichuan Province is located on the eastern edgeof the Tibetan Plateau and is rich in hydropower resources.Over the past few decades, there are more than 20 large-scale hydropower projects (Table 1), which mainly settledon the three major rivers [1, 2]. Usually, these areas are deepdown cutting river valleys, with high stresses, active tectonicenvironment, and loosened rock mass. Therefore, rock slopestability has been the most essential engineering problem [3–9]. Many studies pointed out that slope stability can pose ahigh risk to the operation of the hydropower station system[10–15]. The disaster hazard chains that result from slides,
especially the formation and outburst barrier lakes, oftengenerate much more threats than slope failure [16–18].Moreover, the slide deposits could result in the capacityreduction of effectiveness. Therefore, it is essential to under-stand these unstable slopes located in the reservoir regions,particularly their possible failure modes.
In many studies, several influencing factors, such as exca-vation [19], heavy rainfall [20–22], and water level fluctua-tion in the reservoir [23–26], could highly affect thestability of the bank slope. Some reported cases showed thatminor-scale excavations during road construction could alsocause a large deformation of rock slopes [27, 28]. Manyresearchers prefer to analyze the dynamic changes of seepage
HindawiGeofluidsVolume 2021, Article ID 6615424, 17 pageshttps://doi.org/10.1155/2021/6615424

flow in groundwater by numerical simulation. However, aspecial case study from the Guantangkou landslide [29, 30]reveals that the fluctuation of reservoir water level has no sig-nificant effect on the slope stability. Due to severe slope fail-ure consequences [31–35], most slopes in large hydropowerstations need to be reinforced. Therefore, a detailed stabilityanalysis of these slopes is required in engineering design,such as ensure the shear surface, slide direction, and geome-chanical parameters. These parameters can usually beobtained through field surveys or laboratory tests, but slopestability results have huge parameter uncertainty because ofsample disturbance and method errors [36]. Besides, due to
the indoor slope scale model test’s size limitation, the resultsmay differ significantly from the actual responses. In recentyears, although aerial and airborne remote sensing technolo-gies provide new methods for landslide research [37–39],these methods require a lot of manpower, cost-effectiveness[40–42], and topography limitation of covered by dense veg-etation [43, 44]. The key point is that remote sensing cannotobtain deep deformation characteristics, and this evidence isthe most critical parameter for determining reinforcementmeasures.
This paper focuses on the stability of a rock slope only780m from the dam of the Pubugou hydropower station in
Table 1: Engineering geological problems of hydropower station slope in southwest China.
Name of thehydropower station
Natural slopeheight (m)
Slopegradient (°)
Damheight (m)
Total storagecapacity (m3)
Location of theslope
LithologyEngineering
geological issues
Jinping >1000 >40° 305 77:6 × 10⁹ Left bankMarble,sandstone
Deep rupture andcreep
Xiluodu 300-350 >60° 276 128:0 × 109 Left and rightbank
Basalt Bedding rockslide
Shuangjiangkou >1000 >43° 312 76:0 × 109 Left and rightbank
Granite Deep rupture
Xiangjiaba 350 >50° 161 51:6 × 10⁹ Left bank Sandstone Deep rupture
Baihetan 400-860 >42° 289 206:0 × 109 Left bank Basalt Deep rupture
Xiaowan 700-800 >47° 294 150:0 × 109 Right bank Gneiss Bedding rockslide
Nuozhedu 800 >43° 261 237:0 × 109 Spillway GraniteWeathering,fracture
Dagangshan >600 >40° 210 7:4 × 10⁹ Right bank Granite Deep rupture
Huangjingping >300 >25° 95 1:4 × 10⁹ Left abutmentintake slope
Granite Deep rupture
Pubugou (this paper) 450 >35° 186 53:9 × 10⁹ Right bank Tuff Deep rupture
Jiangling River
Figure 1: Location map of the study area and its nearby cities.
2 Geofluids
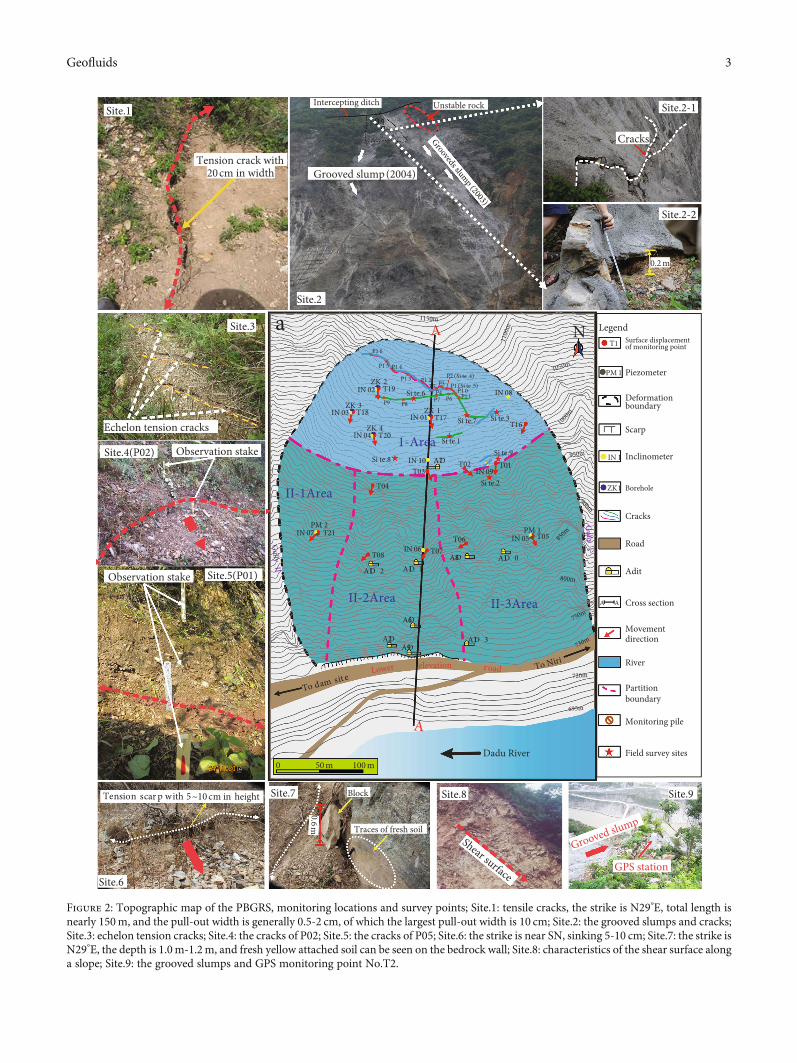
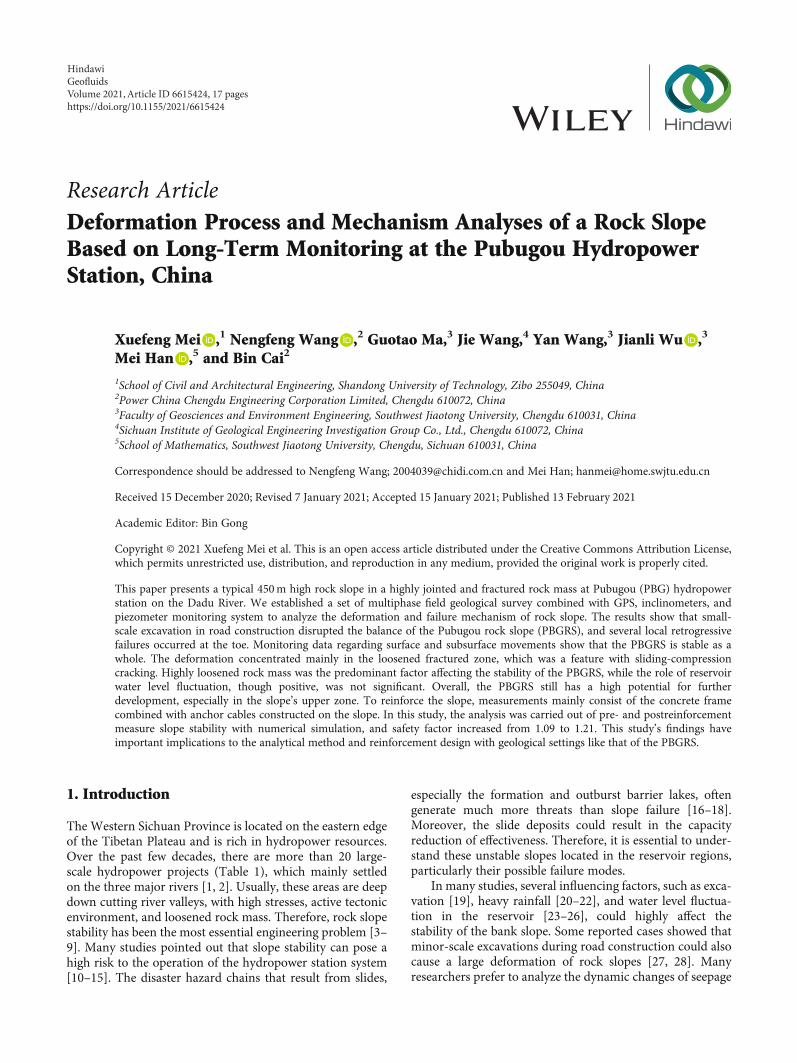
Figure 2: Topographic map of the PBGRS, monitoring locations and survey points; Site.1: tensile cracks, the strike is N29°E, total length isnearly 150m, and the pull-out width is generally 0.5-2 cm, of which the largest pull-out width is 10 cm; Site.2: the grooved slumps and cracks;Site.3: echelon tension cracks; Site.4: the cracks of P02; Site.5: the cracks of P05; Site.6: the strike is near SN, sinking 5-10 cm; Site.7: the strike isN29°E, the depth is 1.0m-1.2m, and fresh yellow attached soil can be seen on the bedrock wall; Site.8: characteristics of the shear surface alonga slope; Site.9: the grooved slumps and GPS monitoring point No.T2.
3Geofluids

Sichuan Province (Figure 1). Field investigation, deformationmonitor, and numerical analysis were carried out to deter-mine the causes and deformation mechanism of the PBGRS.The analysis was carried out with the pre- and postreinforce-ment measures in numerical simulation to evaluate the effec-tiveness of the engineering measures. According to theseresults, the slope’s possible evolution mode is proposed, andthe development tendency of the PBGRS is assessed.
2. Methodology
The PBGRS was investigated using field mapping, geologicaldrilling, in situ monitoring, and numerical modeling. Thefield survey and the topographic map of 1 : 1000 are compre-hensively used to determine the deformation range’s bound-aries and deformation characteristics (Figure 2). The drillingsampling was performed at several important locations to
Lizi debris flow ditch
Figure 3: Field observations of the PBGRS: (a) overview of the PBGRS; (b) relative position of the fault and PBGRS; Site.1: slippery debrisblocking the road at gully II; Site.2: small-scale collapse; Site.3: fractured and highly permeable rock mass.
Monthly (mm)Cumulative (mm)
Month/Date
Jan Feb Mar Apr May June July Aug Sep Oct Nov Dec
180
160
140
120
100
80
60
40
20
0
800
700
600
500
400
300
200
100
0
Cum
ulat
ive p
reci
pita
tion
(mm
)
Mon
thly
aver
age p
reci
pita
tion
(mm
)
Figure 4: Distribution of monthly average precipitation.
4 Geofluids

obtain more information about the properties of the stratumand the features of the rock mass. Several filed investigationswere conducted from 2003 to 2015, mainly including record-ing the macrodeformation characteristics of ground cracks in
the study area, such as new cracks and the expansion of oldcracks. A total of 486 crack morphology were measured toanalyze the slope deformation characteristics. The monitorinstalled on the study area recorded the following: (i) a total
Table 2: Characteristics of the rock mass in the drill holes. Their locations are shown in Figure 2.
Drill hole Depth (m) Core features Detailed core description of DH 01
DH 01
10.1~28.62 Diabase and tuff, intense rust
60 40 20 0
0
5
10
15
20
25
30
35
40
45
50
Celadon diabase, fragmentation: 2-6 cm,and 4-9 cm columns, medium rust, fissure inclination: 65-80°
Relatively complete core, columnar length: 10-48 cm
Clastic core: 0.2-2 cm, intense rust
Columnar core, 2-6 cm,intense rust
Gray core, intense rust, columnar tuff, 8-11 cm,fissure inclination: 30-45° and 65-80°
12.26 m
50.1 m46.8 m
29.7 m
10.1 m
Tawny soil, rubble (9-17 cm)≈20%,grave (2-6 cm)≈65%,0.5-1 (cm)≈15%
7.2 m40
29
14
18
572320
3112
911
14
17
Dep
th (m
)
RQD (%)
41
17.2 mGray core, intense rust, columnar tuff, 8-11 cm,fissure inclination: 30-45° and 65-80°
29.7~46.0 Columnar diabase, 4-9 cm, fissure inclination 65°-80°
46.8~50.1 Intact diabase, 12-48 cm
DH 02
3.6~40.1 Columnar diabase, 3-8 cm, intense rust
40.1~44.3 Columnar diabase, 5-20 cm, fissure inclination 65°-80°
44.3~50.4 Columnar diabase, 3-10 cm
DH 04
7.8~15.0 Columnar tuff, 1-4 cm, partially cement-like
15.0~45.9 Fractured tuff, intense rust, fissure inclination 65°-80°
45.9~50.12 Intact diabase, 8-18 cm, intense rust, fissure inclination 65°-80°
Distance (m)
(a)
Gravelly soil
(b)
Intense rust
(c) (d)
Figure 5: (a) Engineering geological profile of the PBGRS; (b) photo of gravelly soil; (c) intense rusty short columnar core of loosenedfractured zone; (d) intact core of heavily loosened zone.
5Geofluids

of 12 GPS devices were used from November 2009 to Sep-tember 2014 to measure surface displacements, (ii) deforma-tion characteristics at different depths can be explained by 10inclinometers from November 2009 to March 2019, and (iii)a total of 2 piezometers are used to analyze the influence ofreservoir water level on slope deformation. Figure 2 showsthe situations of the monitoring sites. A numerical analysisof pre- and postreinforcement measure slope stability wasconducted, and the safety factor along the observed sheersurface was calculated.
3. Project Background
The PBG hydropower station is located in Hanyuan County,Sichuan Province, China (Figure 1). The maximum designdam height is 186m on Dadu River. It creates a reservoir of53:9 × 10⁸m3 at the normal pool level of 780.00m. Thepower station’s designed capacity is 3300MW, and theannual power generation is 145:8 × 10⁸ kw·h. The reservoirwas first stored in November 2009 and reached its highestwater level in October 2010. The PBRGS is located 780mupstream of the dam axis on the right bank of the hydro-power station.
3.1. Engineering Geology. The study area is located in thetransition zone between the western edge of the Sichuanbasin and the Hengduan Mountains and is situated at theHanyun Gorge, which is one of the Three Gorges by theDadu River (namely, Hanyuan Gorge, Jinkou Gorge, andEbian Gorge). The regional tectonic setting is the Hanyuan-Zhaojue left-hand thrust inverse fault belt (SN/E∠60°-80°),with 120 km in length and 20-60m in width. This fault beltwas inactive since the Late Pleistocene (Figure 3(b)).
Hanyuan belongs to the subtropical climatic zone in themountains and southwest of Sichuan. The mountains andvalleys are highly undulating, with significant verticalchanges and concentrated rainfall. The annual average tem-perature is 17.7°C, the highest temperature is 40.9°C, andthe extreme minimum temperature is -3.3°C. The averageannual evaporation is 1395.6mm. The average relativehumidity is 68%, the maximum wind speed is 15.3m/s, the
average annual precipitation is 748.4mm, and the maximumdaily precipitation is 168.2mm. The precipitation is concen-trated from May to October and accounts for 80-90% of theannual (Figure 4).
3.2. Basic Description of the PBGRS. The PBRGS area’s eleva-tion is between 730m and 1150m, and the maximum eleva-tion difference is approximately 420m. The slope gradient isnearly 50° below the 980 ma.s.l, and nearly 40° upper the 980ma.s.l. The geomorphological pattern is a comb-like type.The slope aspect is approximately EW, and gullies on bothsides were 10m to 35m. The maximum length and widthdimensions of the PBGRS are 400m and 360m, respectively.It has an area of approximately 0.15 km2. According to thetopography, rock mass features, and deformation character-istics, the entire research area can be divided into two parts:the upper unstable dangerous rock mass area which is above980 ma.s.l (area I) and the lower unstable area that is below980 ma.s.l (area II). Among them, the gradient in area I is rel-atively gentle. There is a quaternary loose accumulation layerwith an average thickness of 10m. The outcrop of the bed-rock has a fragmentation-debris structure (Site.3 inFigure 3). Area II includes three subzones according to thecharacteristics of deformation and failure. The II-1 area dis-integrated from the toe in May 2003 and formed a tensionfracture groove, and the volume of this part is approximately1000m3. Area II-2 is a potential failure part, which is contin-uously expanding in the retrogressive pattern since 2003. Thearea from the right boundary of area II-2 to gully II is calledII-3, which found a residual ancient collapse body in thisarea.
3.3. Geological Drilling and Rock Mass Properties. The bed-rock exposed in the region is the rhyolite tuffs of the SuxiongFormation in the Sinian and the shallow metamorphicbasalts in the pre-Sinian. During the long renovation process,these rocks have been altered by river incision and a series oftectonic events (such as the Yanshan movement and Hima-laya orogeny), thus creating very complex structures [45,46]. According to the lithostratigraphy and structure of thePBGRS which were obtained by drill holes and site investiga-tions, the slope’s rock mass has been extensively fractured.The degree of fracturing and jointing increases toward theground surface, resulting in an increasingly loosened rockmass (Table 2, and detailed core description of DH 01). Asshown schematically in the cross-section (Figure 5(a)),except for gravel soil a few meters thick below the surface(Figure 5(b)), the loosened fractured zone extends to a depthof about 20-60m, and the heavily loosened zone extensiondepth is approximately 65-90m. Drilling lithology samplesindicate that the drill core sample of the loosened fracturedzone is fragmental with a short column, and the crack surfaceis severely rusty (Figure 5(c)). In contrast, that of the heavilyloosened zone is relatively intact (Figure 5(d)). The boreholesampling’s core fracture angle indicates that steep dip cracks(inside or outside the steep slope) are absolutely dominant,and rock debris fills with the gaps reflects the mutual dis-placement between the blocks. In addition, the extendeddepth of the loosened fractured zone is thick at high
0.00~1.00 %1.00~2.00 %2.00~3.00 %3.00~4.00 %4.00~5.00 %5.00~6.00 %6.00~7.00 %
Fisherconcentrations
% of total per 1.0% area
No bias correctionMax.conc. = 6.1878%
Equal angleUpper hemisphere
486 poles486 entries
N
S
W E
Figure 6: Contour plots of basal joints in the horizontal adit.
6 Geofluids
30
28
26
24
22
20
18
16
14
12
10
Date (yy/mm/dd)
P2P5
Crac
k w
idth
(cm
)
14/10/23 14/10/28 14/10/3 14/11/3 14/11/6 14/11/11
Figure 7: Crack width changes with time.
Wat
er le
vel (
m)
860
850
840
830
820
810
800
790
780
14/0
9/22
14/0
6/30
14/0
4/07
14/0
1/13
13/1
0/21
13/0
7/29
13/0
5/06
13/0
2/11
12/1
1/19
12/0
8/27
12/0
6/04
12/0
3/12
11/1
2/19
11/0
9/26
11/0
7/04
11/0
4/11
11/0
1/17
10/1
0/25
10/0
8/02
10/0
5/10
10/0
2/15
09/1
1/23
09/0
8/31
09/0
6/08
Disp
lace
men
t (m
m)
Date (yy/mm/dd)
180
Water levelT1T2T3T4T7T8
T16T17T18T19T20T21
160
140
120
100
80
60
40
20
–20
0
Figure 8: The surface movement monitoring and reservoir water level result.
7Geofluids
elevations. The entire slope’s rock mass is extensively frac-tured and highly permeable; stable groundwater levels werenot found during field investigations.
The basal joints are composed of various primary andtectonic fissure types at the most basic level and randomlydeveloped in the rock mass [47, 48]. In this study, we inves-tigated the distribution of approximately 486 basal joints inthe adits (Figure 6). The results showed that the discontinu-ities on the PBRGS are abundant; no persistent and dominat-ing discontinuity trends were identified. The most basaljoints account for only 5.1% of the total number of cracks,i.e., 25 basal joints.
4. Brief History of Instabilities
The earliest deformation history of the PBGRS dates back toFebruary 2003. Several very small-scale collapse sites in areaII-1 have been observed (Figure 3(a)), induced by excavationduring the construction of a road, and it did not attract muchattention. Subsequently, in May 2003, a heavy rainfallinduced a collapse with more than 1000m3. The retrogressivedisintegrations failed towards the upslope and formed thefirst collapse groove (Site.2 in Figure 2). The depth of the col-lapse groove is about 12m. By the end of 2004, the range ofinstability had expanded, and a second collapse groove had
Calc
ulat
ed w
ater
leve
l (m
)
Calculated water level of PM1Calculated water level of PM2Reservoir water level
Wat
er le
vel (
m)
12/0
3/15
11/1
2/15
11/0
9/15
11/0
6/15
11/0
3/15
10/1
2/15
10/0
9/15
10/0
6/15
10/0
3/15
09/1
2/15
09/0
9/15
860
850
840
830
820
810
800
790
780
Date (yy/mm/dd)
860
850
840
830
820
810
800
790
780
Figure 10: Comparison of calculated water level of piezometers and the reservoir levels.
Aver
age v
eloci
ty (m
m/d
ay)
2.5
2.0
T01
1.5
1.0
0.5
0.0
–0.5
–1.0
Date (yy/mm/dd)
09/10/16 10/10/16 11/10/16 12/10/16 13/10/16 14/10/16
(a)
Aver
age v
eloci
ty (m
m/m
onth
) 2.5
2.0
1.5
1.0
0.5
0.0T01 T02 T03 T04 T07 T08 T16 T18 T19 T20 T21T17
(b)
Figure 9: Comparison of average displacement velocities from GPS monitoring: (a) daily average velocities of T01; (b) monthly averagevelocities.
8 Geofluids

Dep
th (m
m)a
0
5
10
15
20
25
09/11/0310/03/2410/08/0110/12/0811/04/0611/08/0212/03/0612/09/0413/03/2513/10/2114/07/2615/04/1316/03/2116/11/1417/06/2918/03/2018/12/17 19/01/12
18/05/1217/09/1117/01/1616/05/2415/07/0614/09/2614/01/1313/05/2712/10/3112/04/0211/10/0411/05/0411/01/1910/09/0610/05/1009/12/03 10/01/06 10/02/03
10/07/1910/11/0311/03/0311/07/0512/01/0312/07/1113/02/2513/08/2614/04/2115/03/1616/01/1816/09/2117/05/0318/01/2418/10/2219/03/15
10/07/0410/10/0511/02/1611/06/0111/11/0112/05/0112/12/0813/07/2914/02/2415/01/1215/11/2316/07/2617/03/2017/11/1418/08/2019/02/19
30
35
40
45
50
Cumulative displacement (mm)
0 40 80 120 160 200 240
(a)
Dep
th (m
)
0
10
20
30
40
50
60
70
80
90
100
Cumulative displacement (mm)
0 30 60 90 120 150 180
10/05/1010/07/1910/09/2610/12/0411/02/1211/07/0512/01/0312/06/1212/10/0913/05/2714/02/2415/03/1615/09/2616/05/2417/01/1617/09/1118/05/1218/12/18 19/01/12 19/02/19 19/03/15
18/11/1419/10/2218/08/2017/12/26 18/02/08 18/03/20
17/06/2917/05/0317/03/2016/07/26 16/09/21 16/11/16
16/03/2316/01/1815/12/2115/04/13 15/05/11 15/07/06
15/01/1214/07/2614/04/2113/07/29 13/08/26 13/10/21
13/03/2513/02/2512/12/0812/07/11 12/08/07 12/09/04
12/05/0812/04/1012/03/0611/08/02 11/10/04 11/11/01
11/06/0411/04/0911/03/0510/12/18 11/01/02 11/01/15
10/11/2010/11/0310/10/1310/07/31 10/08/24 10/09/14
10/07/0210/06/2510/05/11
(b)
Figure 11: Continued.
9Geofluids

been formed. During this time, intermittent ground cracks inall areas have been reported since February 2003. Severallong-lived extending in the direction of N29°E tensile crackswith maximum widths and lengths of 10 cm and 150m,respectively, have been observed near the 980 to 1100 ma.s.l(Site.1 in Figure 2). In order to guarantee the stability and
security of the PBGRS, a series of engineering control mea-sures were applied according to emergency plans.
During the construction of the reinforcement measuresin 2008, a small-scale collapse occurred at 974.5 ma.s.l (lowermonitoring pile T04) in area II-2 (Site.2 in Figure 3). Due tothe scraping of the lower deposits, a total volume is
Dep
th (m
)
0
10
20
30
40
50
60
70
80
90
100
Cumulative displacement (mm)
0 5 10 15 20
09/11/03 09/10/29 09/11/0409/12/1009/11/3009/11/15
09/12/24 10/01/13 10/02/0310/05/2410/04/2710/03/17
10/06/21 10/07/20 10/08/1910/11/2510/10/2210/09/20
10/12/23 11/01/20 11/02/1711/05/1911/04/1511/03/17
11/06/23 11/07/24 11/08/2211/11/2011/10/1611/09/18
11/12/18 12/01/15 12/02/1912/05/2012/04/1512/03/18
12/06/18 12/07/17 12/08/2012/11/1912/10/1512/09/17
12/12/16 13/01/20 13/03/0313/06/2313/05/1213/04/14
13/07/22 13/08/19 13/09/1613/12/2313/11/2413/10/13
14/01/07 14/02/18 14/03/1714/08/0414/06/1014/05/12
14/09/16 14/10/27 14/10/2715/01/1915/02/1315/01/19
15/03/09 15/06/29 15/07/1615/11/3015/10/1915/09/21
15/12/28 16/01/25 16/02/2916/06/0816/04/2516/03/28
16/07/19 16/08/29 16/09/2716/12/1716/11/2116/10/29
17/01/13 17/02/23 17/03/2317/07/2017/06/2817/05/02
17/08/15 17/09/15 17/10/2018/01/2517/12/2217/11/15
18/02/07 18/03/21 18/04/1018/07/1918/06/1118/05/15
18/07/19 18/09/17 18/10/1919/03/1818/12/1418/11/13
19/05/11 19/06/17 19/07/10
25 30 35 40
(c)
Figure 11: Monitoring curves of three inclinometers located at the cross-section A-A: (a) In01; (b) In10; (c) In06.
10 Geofluids

approximately 50m3 and injured several workers. Severaltensile cracks were observed in the collapse grooves formedin 2003 and 2004 (Site.2-1 in Figure 2). The dislocationcracks with an opening width of approximately 20 cm ofdrainage ditches (Site.2-2 in Figure 2).
On October 19, 2014, the local inspectors observed thatfresh tension cracks (Site.3, Site.4, and Site.5 in Figure 2)appeared on the road to T15, and the width increased from10 cm to 15 cm in the next two days. Since October 23, 16groups of wooden piles have been buried on both sides ofthe edge crack to monitor the change trend of crack width.The typical P02 (Site.4 in Figure 2) and P05 crack changetrends are shown in Figure 3, within 18 days of observation;the crack width at P05 increased from 20 cm to 28.2 cm(Figure 7).
InMarch 2015, several fresh tensile cracks are observed ataround 1055 ma.s.l (Site.6 and Site.7 in Figure 2) with anopening width of approximately 5 cm-15 cm and lengthexceeding 100m, and the averaged strike nearby SN. Anarc-shaped crack develops at 1010 to 1040 ma.s.l and extends
to the old crack on the right side of the collapse grooveformed in 2003, with a maximum opening width and sinkingdistance of 30 cm and 40 cm, respectively.
5. Monitoring Results
5.1. Relative Surface Displacements. The first emergency mit-igation was completed in September 2009. During the nextfour years monitoring period, the results of 12 surface dis-placement monitoring and reservoir water level changes areplotted in Figure 8. We can see that
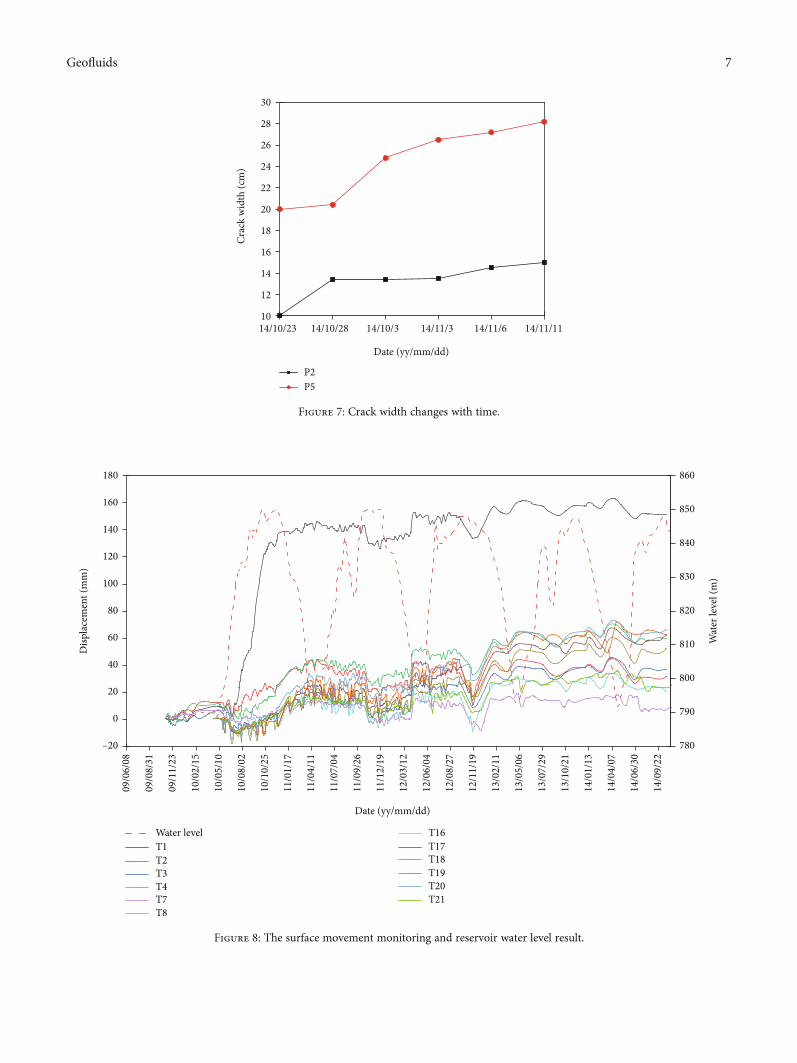
(1) The cumulative displacement and average displace-ment velocities increased faster when the firstimpoundment was accomplished from 780 to 850ma.s.l (Figure 9). Over the next 4 years, cumulativedisplacement increases slowly yearly. The cumulativedisplacement and average displacement velocities ofT01 (approximately 980 ma.s.l) are much larger thanother points, and their values are 152mm (Figure 8),
Concrete frame andanchor cables
Shotcrete
Figure 12: Reinforcement solution under construction as of 2015.
Table 3: Mechanical parameters of different strata in the PBGRS.
MaterialDensity(kg/m3)
Elastic modulus(GPa)
Poisson’sratio
Friction angle(°)
Cohesion(MPa)
Yield criterion
Colluvium deposit 2250 0.3 0.38 30 0.06Mohr-
Coulomb
Loosened and fracturedzone
2600 0.6 0.34 32 0.28Mohr-
Coulomb
Heavily loosened zone 2600 1.2 0.31 34 0.4Mohr-
Coulomb
Slightly fresh zone 2600 10.0 0.29 43 1.2Mohr-
Coulomb
Slightly weathered basalt 2650 12.0 0.28 46 1.3Mohr-
Coulomb
Alluvial deposit 2200 0.8 0.32 — —
Artificial deposit 2250 3.0 0.35 — —
11Geofluids

1200
1150
700
650
800
750
900
850
1000
950
1100
1050
Elev
atio
n (m
)
Distance (m)
0 50 100 150 200 250 300 350 400 550 500 550 600 650 700
0.3600.3420.3240.3060.2880.2700.2520.2340.2160.1980.1800.1620.1440.1260.1080.0900.0720.0540.0360.0180.000
(a)
1200
1150
700
650
800
750
900
850
1000
950
1100
1050
Elev
atio
n (m
)
Distance (m)
0 50 100 150 200 250 300 350 400 550 500 550 600 650 700
0.680Unit: m
0.6350.5890.5440.4990.4530.4080.3630.3170.2720.2270.1810.1360.0910.0450.000
(b)
Figure 13: Continued.
12 Geofluids

2.5mm/month (Figure 9(b)), and 2.3mm/day(Figure 9(a)), respectively, and T01 is located in thecollapse groove formed in 2003 and 2004, respec-tively. This further suggests that area II-1 is relativelyunstable. Besides, the slope at T01 monitoring pointis steep, and the surface layer mainly consists of elu-vium and slope deposits, which is also the reasonfor the large displacement of T01. The overall moni-toring data show that the cumulative displacementand average monthly and daily displacement veloci-ties (Figure 8) vary gently, verifying the reinforcedmitigation’s effectiveness to decrease the deformationof the PBGRS
(2) The reservoir water level has a minor effect on surfacedisplacement. This law can be explained by piezome-ters and reservoir water level results (Figure 10). Thecalculated water level (the sum of the pressure headand the buried elevation) of the two piezometers isalmost the same as the reservoir water level. Thereis no head loss and lag, which proves loosened frac-tured rock mass and high permeability, and this rockmass structure is like a leaky bucket full of mesh
5.2. Inclinometer and Piezometer Measurements. The shearsurface location can be obtained from an interpretation ofinclinometric measurements [49–52]. The detailed data from10 inclinometer monitors are shown in Figure 11, andFigure 2 shows the layout of inclinometers (A-A profiles inFigure 5(a)). According to the time-series deformation data,the subsurface movement was progressive over a continuousmonitoring period of ten years. The cumulative displacementdecreased towards the downslope, and the cumulative dis-placement at In06 is only 22mm (Figure 11(c)). For incli-nometers In01, the shear surface is located at 22m, which
coincides with the DH 01. Notably, monitoring data fromIn10 indicates that the cumulative displacements at differentdepths were not uniform. There are at least 3 apparent shearsurfaces at different depths, and the thickness of each surfaceis limited. A sawtooth-shaped cumulative displacementcurve was observed at 40-60m, indicating that the rock massin this area is loosened, and the relative dislocation is obvi-ous. Besides, the shear surface at 22m depth forms a contin-uous failure surface with the In01, and this result can berepresented by the red line in Figure 2. Monitoring data fromIn06 show that the shear surface was located at a depth ofapproximately 40m below the ground surface. Notably, rela-tive dislocation can be clearly observed in the depth range of20-40m, although these data values have some fluctuations.In view of the In01 (Figure 11(a)), In10 (Figure 11(b)), andIn06 (Figure 11(c)) monitoring results, the cumulative dis-placement at the top of the inclinometers is 210mm,119mm, and 22mm, respectively, indicating the zone inwhich In06 is located serves as a locked segment. The com-plete continuous failure surface is not formed in the A-Across-section. Because the average displacement velocity ofthe In01 inclinometer was slow before July 2012, from May2014 to August 2014, the average displacement velocityincreased to 5mm/month. Then, it decreased to1.2mm/month in the next year. The most recent increaseoccurred from June 2018 to July 2018, and the cumulativedisplacement values increased from 167mm to 202mm.
6. Discussion
6.1. Mechanisms and Formation Process of PBGRS. The rockmass of the PBGRS is found loosened and fractured, with thecharacteristic that is closely related to the regional tectonicevent and the rapid down cutting caused by the river, whichprovides topographic conditions and abundant material
1200
1150
700
650
800
750
900
850
1000
950
1100
1050
Elev
atio
n (m
)
Distance (m)
0 50 100 150 200 250 300 350 400 550 500 550 600 650 700
6.0005.7005.4005.1004.8004.5004.2003.9003.6003.3002.7002.4002.1001.8001.5001.2000.9000.6000.3000.000
(c)
Natural slopeReinforced slope
1.23
1.20
1.17
1.14
1.11
1.08
1.05
1.02
Displacement (m)
Fact
or o
f saf
ety
(Fs)
0.0 0.1 0.2 0.3 0.4 0.5 0.6 0.7
(d)
Figure 13: Numerical calculation results: (a, b) potential failure surface and the total displacement before the implementation of engineeringmeasures; (c) potential shear surface reinforced by concrete frame combined with anchor cables; (d) factor of safety with pre- andpostreinforcement measures.
13Geofluids

sources for the kinematic feasibility. Firstly, we present a geo-mechanical failure model for the PBRGS in area II-3(Figure 3(a)). As discussed in “Brief History of Instabilities,”excavation breaks the initial equilibrium conditions, whichinduced kinematic release. Besides, owning to broken rockmass, it is hard for relatively sliding mass to maintain integ-rity during creep. The tensile stress is high enough to crackthe rock and induce new ruptures. Meanwhile, cracks createnew free space for the posterior sliding mass and form chan-nels for rainfall. Overall, area II-3 presents retrogressive dis-integration deformation-failure mode.
The stability of the rock mass in area II-2 is most noting.To better understand the failure mechanism, inclinometermeasurements may provide some evidence. According toFigure 11, the intermittent deformation trend indicates thatthe loosened fractured zone went through three stages: (1)sliding and compression cracking, (2) compaction due tothe antislip effect of the locked segment, and (3) sliding andcompression cracks again. After multiple cycles, a continu-ous shear surface is finally formed, and the destruction finallyoccurred; the free surface formed by the failure of the area II-
2 may promote the formation of high-altitude, extremelyenergetic rock avalanches. A more detailed analysis of thefailure mechanism will be described later in the FEM verifica-tion section.
6.2. Mitigation Measures and Effect Evaluation
6.2.1. Mitigation Measures. Based on extensive field surveysand continuous monitoring results, the leading engineeringreinforcement measures, including concrete frame combinedwith anchor cables, large area concrete shotcrete, and inter-cepting ditch, were applied to stabilize the PBGRS(Figure 12). The premise of these reinforcement measures isto remove loose deposits on the surface. The total length ofthe anchor cable is between 45 and 70m. The single anchorcable (10 × φ15:2 unbonded steel stranded wire) is designedto have an anchoring force of 1500 kN, with a standard areaand density of 140mm2 and 1101 kg/km, respectively. Thetensile strength is 1860MPa, the elastic modulus is 1:95 ×105MPa, and the anchor hole diameter is 140mm. The emer-gency mitigation plan was divided into two phases: The first
Initi
al an
chor
ing
of fo
rce (
kN)
1600
1550
1500
1450
1400
1350
1300
1250
Time (yy/mm/dd)
DP01DP02DP03
08/09/01 09/08/01 10/07/01 11/06/01 12/05/01 13/04/01 14/03/01 15/02/01
(a)
Pres
tress
loss
(%)
14
12
10
8
6
4
2
0
Time (yy/mm/dd)
DP01DP02DP03
08/09/01 09/08/01 10/07/01 11/06/01 12/05/01 13/04/01 14/03/01 15/02/01
(b)
Figure 14: Typical monitoring results of anchor cable varied with time: (a) forces in anchor cables (3 measurement points); (b) forcereduction of prestressed anchor cable (3 measurement points).
14 Geofluids

stage is mainly aimed at the water level fluctuation zone with780-850 ma.s.l. To obtain maximum antisliding force, theanchoring angle of the anchor cables is tilted up 5°, whichthe engineering audit was completed in October 2009. Basedon ensuring the loosened fractured zone’s stability, in the sec-ond stage treatment, the anchoring angle is inclined down-ward 15°. As of September 2015, 912 anchor cables havebeen implemented, and 1020 anchor cables have not beencompleted.
6.2.2. The FEM Verification. The purpose of the numericalanalysis is to evaluate the PBGRS stability after the installa-tion of reinforcement measures. Since no major discontinu-ities were recognized as well as the deformationcharacteristics were similar to the particles, the slope rockmass was modeled as a continuous material [1]. Many studiespointed out that rock slopes with faults and joints; thestrength reduction FEM can provide more accurate stabilityevaluation results [53–55].
The geologic engineering profile A-A (Figure 5(a)) wasanalyzed. The total numbers of the elements and nodes inthe mesh for the strength reduction FEM were 17743 and18045, respectively. The boundary conditions of the modelare as follows: left and right boundaries limit horizontal dis-placement, and the bottom boundary is fixed. The selectionof material parameters is based on the “Deformation Mecha-nism and Stability Evaluation of Rock Slope on the RightBank of Pubugou Hydropower Station” [56]. The Mohr-Coulomb model was applied in the loosened fractured zone,heavily loosened zone, moderately loosened zone, and collu-viums. Due to the alluvial deposits and artificial deposits atthe toe of the slope which are far away from the research areaof interest in this article, to avoid untimely yielding duringthe calculation, these areas use linearly elastic mode constitu-tive. The detailed material parameters and constitutive com-ponents used in the FEM are shown in Table 3.
6.2.3. Analysis Results. Figures 13(a) and 13(b) show the cal-culation results without reinforcement measures. Asexpected, the predicted failure surface mainly occurs at thebottom of the loosened fractured zone (780-1050 ma.s.l).Above the 950 ma.s.l, a discrete shear surface appears at thebottom of the heavily loosened zone. From the numericalsimulation results, we can predict if the PBGRS does not takereinforcement measures, and with continuous dislocationdeformation. Finally, the loosened fractured zone wascompletely cut-off to form a huge slide body and a new headscarp. After adopting the concrete frame combined withanchor cables, the FEM results are shown in Figure 13(c).The continuous shear surface in a loosened fractured zonewas effectively blocked. The most dangerous shear surfacemoves around the anchor cables to the bottom of the heavilyloosened zone but only forms the partially discrete shear sur-face, so anchor cables also improve the stability of the heavilyloosened zone. By comparing pre- and postreinforcementmeasures of concrete frames and ground anchors, safetyincreased from 1.09 to 1.21 (Figure 13(d)), which basicallymeets the 2012 Professional Standards of the People’s Repub-lic of China.
6.2.4. Monitoring Data Verification and Recommendations.As shown in Figure 14, the anchor cable generally experi-enced relatively minor relaxation and less than 13% in 7years. Although these analyses prove that the reinforcementmeasures are very effective, most anchor cables do not pene-trate the heavily loosened zone and cause discontinuousshear surfaces. The dislocation still went on due to shearing,and the main zone of movement is concentrated in area I(Figure 11(a)). We still recommend that the anchor cablesshould be long enough to extend as far as possible into themore stable zone (such as bedrock). Besides, the remaining1020 anchor cables should be implemented as soon aspossible.
7. Conclusions
This paper studies a case of the stabilization of a high andsteep rock slope, characterized by a highly jointed and frac-tured rock mass. The main culprit for the relaxation of therock mass can boil down to the rapid down cutting causedby the river. Extensive investigations have shown thatsmall-scale excavation is considered an essential factor thatcauses PBGRS movement. Drilling data and monitoringinclinometer displacement show that there is multiple shearsurface inside the rock mass. The whole PBGRS underwentslow creep deformation in the loosened fractured zone. Themovement occurred locally in the PBRRS, and the entire rockslope did not form a continuous shear surface. The positionof failure at the toe of the slope in 2003 (area II-1) is consid-ered a typical retrogressive motion mode. The stability of thetoe is vital because it plays an essential supporting role. Asrevealed by the inclinometer displacement, the PBGRS wouldprobably deform in a complex pattern: progressivecompression-induced rupture occurred in the loosened frac-tured zone. The lower locked segment is continuouslysqueezed. With the interval movement cycle, PBGRS stabilitywill be gradually worsening even a loosened fractured zonewill form a continuous cut-out channel. The concrete framecombined with anchor cables has been performed and comeinto effect, and comparative analysis was carried out on thePBGRS before and after reinforcement measures. As revealedby the results, the potential shear surface is in the loosed frac-tured zone. After the anchor cables are applied, the stabilityof the slope is much improved. Finally, the piezometer datashow that the reservoir water level has a minor effect on thePBGRS deformation, due to the extensively fractured rockmass and high permeability of the rock mass, which is bene-ficial to the good operation of the PBG.
Data Availability
The data used to support the results of this research are avail-able from the corresponding author upon request.
Conflicts of Interest
None of the authors have any conflicts of interest.
15Geofluids

Acknowledgments
This research is financially supported by the Open Fund ofState Key Laboratory of Geological Disaster Prevention andGeological Environment Protection (Grant No.SKLGP2018K011) and the National Natural Science Founda-tion of China (Grant No. 41907225).
References
[1] T. Chen, J. H. Deng, N. Sitar et al., “Stability investigation andstabilization of a heavily fractured and loosened rock slopeduring construction of a strategic hydropower station inChina,” Engineering Geology, vol. 221, pp. 70–81, 2017.
[2] S. L. Zhang, Z. H. Zhu, S. C. Qi, Y. X. Hu, Q. du, and J. W.Zhou, “Deformation process and mechanism analyses for aplanar sliding in the Mayanpo massive bedding rock slope atthe Xiangjiaba hydropower station,” Landslides, vol. 15,no. 10, pp. 2061–2073, 2018.
[3] Y. Sun, J. S. Huang, W. Jin, S. W. Sloan, and Q. H. Jiang,“Bayesian updating for progressive excavation of high rockslopes using multi- type monitoring data,” Engineering Geol-ogy, vol. 252, pp. 1–13, 2019.
[4] D. Q. Li, S. H. Jiang, Z. J. Cao, C. B. Zhou, X. Y. Li, and L. M.Zhang, “Efficient 3-D reliability analysis of the 530 m highabutment slope at Jinping I hydropower station during con-struction,” Engineering Geology, vol. 195, pp. 269–281, 2015.
[5] J. W. Chen, J. H. Deng, J. B. Wei, X. Y. Wu, and A. C. Zhang,“Cause analysis of cracking in right abutement slope of Chan-gheba hydropower station,” Chinese Journal of RockMechanicsand Engineering, vol. 31, no. 6, pp. 1121–1127, 2012.
[6] S. R. Sun, C. Q. Gao, J. M. Liu, Y. X. Lu, and P. L. Xu, “Researchon formation mechanism of deep cracks in left bank slope ofJinping first stage hydropower station based on DDAmethod,” Applied Mechanics and Materials, vol. 170-173,pp. 1966–1970, 2012.
[7] G. Rong, J. Peng, X. J. Wang, G. Liu, and D. Hou, “Formationmechanism of deep cracks in the left bank slope of Jinping-ihydropower station,” Disaster Advances, vol. 6, no. 3, pp. 4–13, 2013.
[8] S. W. Qi, F. Q. Wu, F. Z. Yan, and H. X. Lan, “Mechanism ofdeep cracks in the left bank slope of Jinping first stage hydro-power station,” Engineering Geology, vol. 73, no. 1-2,pp. 129–144, 2004.
[9] J. G. Um and P. H. S. W. Kulatilake, “Kinematic and block the-ory analyses for shiplock slopes of the Three Gorges Dam sitein China,” Geotechnical and Geological Engineering, vol. 19,no. 1, pp. 21–42, 2001.
[10] D. X. Zhang, G. H. Wang, T. J. Yang, M. C. Zhang, S. H. Chen,and F. Y. Zhang, “Satellite remote sensing-based detection ofthe deformation of a reservoir bank slope in Laxiwa hydro-power station, China,” Landslides, vol. 10, no. 2, pp. 231–238,2013.
[11] Y. P. Yin, B. L. Huang, W. P. Wang et al., “Reservoir-inducedlandslides and risk control in Three Gorges project on YangtzeRiver, China,” Journal of Rock Mechanics and GeotechnicalEngineering, vol. 8, no. 5, pp. 577–595, 2016.
[12] Y. G. Zhang, Z. Zhang, S. Xue, R. Wang, and M. Xiao, “Stabil-ity analysis of a typical landslide mass in the Three Gorges res-ervoir under varying reservoir water levels,,” EnvironmentalEarth Sciences, vol. 79, no. 1, 2020.
[13] Y. G. Zhang, S. Y. Zhu, J. K. Tan, L. D. Li, and X. J. Yin, “Theinfluence of water level fluctuation on the stability of landslidein the Three Gorges reservoir,” Arabian Journal of Geosciences,vol. 13, no. 17, p. 845, 2020.
[14] Y. G. Zhang, Y. Zhu, W. Q. Zhang, and H. Liu, “Analysis ofdeformation characteristics and stability mechanisms of typi-cal landslide mass based on the field monitoring in the ThreeGorges reservoir, China,” Journal of Earth System Science,vol. 128, no. 1, pp. 2–11, 2019.
[15] Y. P. Yin, B. L. Huang, X. Chen, G. N. Liu, and S. C. Wang,“Numerical analysis on wave generated by the Qianjiangpinglandslide in Three Gorges reservoir, China,” Landslides,vol. 12, no. 2, pp. 355–364, 2015.
[16] C. J. Ouyang, H. C. An, S. Zhou et al., “Insights from the failureand dynamic characteristics of two sequential landslides atBaige village along the Jinsha River, China,” Landslides,vol. 16, no. 7, pp. 1397–1414, 2019.
[17] J. J. Clague, S. G. Evans, and I. G. Blown, “A debris flow trig-gered by the breaching of a moraine-dammed lake, KlattasineCreek, British Columbia,” Canadian Journal of Earth Sciences,vol. 22, no. 10, pp. 1492–1502, 1985.
[18] G. Barla and P. Paronuzzi, “The 1963 Vajont landslide: 50thanniversary,” Rock Mechanics and Rock Engineering, vol. 46,no. 6, pp. 1267–1270, 2013.
[19] D. Xue, T. Li, S. Zhang, C. C. Ma, M. B. Gao, and J. Liu, “Fail-ure mechanism and stabilization of a basalt rock slide withweak layers,” Engineering Geology, vol. 233, pp. 213–224, 2018.
[20] S. L. Luo, X. G. Jin, and D. Huang, “Long-term coupled effectsof hydrological factors on kinematic responses of a reactivatedlandslide in the Three Gorges reservoir,” Engineering Geology,vol. 261, article 105271, 2019.
[21] J. Corominas and J. Moya, “Reconstructing recent landslideactivity in relation to rainfall in the Llobregat River basin, East-ern Pyrenees, Spain,” Geomorphology, vol. 30, no. 1-2, pp. 79–93, 1999.
[22] T. L. Tsai, “The influence of rainstorm pattern on shallowlandslide,” Environmental Geology, vol. 53, no. 7, pp. 1563–1569, 2008.
[23] D. Huang, D. M. Gu, Y. X. Song, D. F. Cen, and B. Zeng,“Towards a complete understanding of the triggering mecha-nism of a large reactivated landslide in the Three Gorges reser-voir,” Engineering Geology, vol. 238, pp. 36–51, 2018.
[24] S. Matsuura, S. Asano, and T. Okamoto, “Relationshipbetween rain and/or meltwater, pore-water pressure and dis-placement of a reactivated landslide,” Engineering Geology,vol. 100, pp. 49–59, 2008.
[25] S. W. Qi, F. Z. Yan, S. J. Wang, and R. C. Xu, “Characteristics,mechanism and development tendency of deformation ofMaoping landslide after commission of Geheyan reservoir onthe Qingjiang River, Hubei Province, China,” EngineeringGeology, vol. 86, no. 1, pp. 37–51, 2006.
[26] J. G. Liu, P. J. Mason, N. Clerici et al., “Landslide hazard assess-ment in the Three Gorges area of the Yangtze river usingASTER imagery: Zigui-Badong,” Geomorphology, vol. 61,no. 1-2, pp. 171–187, 2004.
[27] C. Irigaray, F. Lamas, R. el Hamdouni, T. Fernández, andJ. Chacón, “The importance of the precipitation and the sus-ceptibility of the slopes for the triggering of landslides alongthe roads,” Natural Hazards, vol. 21, no. 1, pp. 65–81, 2000.
[28] F. Y. Zhang, S. B. Bai, G. Liu, W. W. Chen, and W. F. Han,“Process and mechanisem of cut slope instablity at yuan
16 Geofluids

jiawan section of lan-expressway,” Journal of EngineeringGeology, vol. 1, pp. 83–89, 2009.
[29] Y. P. Yin, “Seepage pressure effect on landslide stability at theThree Gorges. Reservoir area,” The Chinese Journal of Geolog-ical Hazard and Control, vol. 14, no. 3, pp. 1–8, 2003.
[30] Y. P. Yin and X. M. Peng, “Failure mechanism on Qianjiangp-ing landslide in the Three Gorges reservoir region,”Hydrogeol-ogy and Engineering Geology, vol. 3, pp. 51–54, 2007.
[31] W. Yi, Z. P. Meng, and Q. L. Yi, “Theory and method of land-slide stability prediction in the Three Gorges reservoir area,”Science Press, Beijing, 2011.
[32] X. L. Hu, M. Zhang, M. J. Sun, K. X. Huang, and Y. J. Song,“Deformation characteristics and failure mode of the Zhujia-dian landslide in the Three Gorges reservoir, China,” Bulletinof Engineering Geology and the Environment, vol. 74, no. 1,pp. 1–12, 2015.
[33] D. M. Gu and D. Huang, “A complex rock topple-rock slidefailure of an anaclinal rock slope in the Wu Gorge, YangtzeRiver, China,” Engineering Geology, vol. 208, pp. 165–180,2016.
[34] D. Huang and D. M. Gu, “Influence of filling-drawdown cyclesof the Three Gorges reservoir on deformation and failurebehaviors of anaclinal rock slopes in the Wu Gorge,” Geomor-phology, vol. 295, pp. 489–506, 2017.
[35] M. Xia, G. M. Ren, and X. L. Ma, “Deformation and mecha-nism of landslide influenced by the effects of reservoir waterand rainfall, Three Gorges, China,” Natural Hazards, vol. 68,no. 2, pp. 467–482, 2013.
[36] L. L. Zheng, Y. F. Zheng, L. M. Zhang, X. Li, and J. H. Wang,“Probabilistic model calibration for soil slope under rainfall:effects of measurement duration and frequency in field moni-toring,” Natural Hazards, vol. 64, no. 5, pp. 365–378, 2014.
[37] T. Peraya, X. Shi, L. Zhang, T. Balz, andM. S. Liao, “Character-ization of landslide deformations in three gorges area usingmultiple InSAR data stacks,” Remote Sensing, vol. 5, no. 6,pp. 2704–2719, 2013.
[38] M. Jaboyedoff, T. Oppikofer, A. Abellán et al., “Use of LIDARin landslide investigations: a review,” Natural Hazards, vol. 61,no. 1, pp. 5–28, 2012.
[39] G. B. Crosta, P. Frattini, and F. Agliardi, “Deep seated gravita-tional slope deformations in the European Alps,” Tectonophy-sics, vol. 605, pp. 13–33, 2013.
[40] I. P. Kovács, S. Czigány, B. Dobre et al., “A field survey–basedmethod to characterise landslide development: a case study atthe high bluff of the Danube, south-central Hungary,” Land-slides, vol. 16, no. 8, pp. 1567–1581, 2019.
[41] S. Uhlemannab, A. Smithc, J. Chambersa et al., “Assessment ofground-based monitoring techniques applied to landslideinvestigations,” Geomorphology, vol. 253, pp. 438–451, 2019.
[42] U. Niethammer, M. R. James, S. Rothmund, J. Travelletti, andM. Joswig, “UAV-based remote sensing of the Super-Sauzelandslide: evaluation and results,” Engineering Geology,vol. 128, pp. 2–11, 2012.
[43] E. Intrieri, F. Raspini, A. Fumagalli et al., “The Maoxian land-slide as seen from space: detecting precursors of failure withSentinel-1 data,” Landslides, vol. 15, pp. 123–133, 2017.
[44] J. Wasowski and F. Bovenga, “Investigating landslides andunstable slopes with satellite multi temporal interferometry:current issues and future perspectives,” Engineering Geology,vol. 174, pp. 103–138, 2014.
[45] R. Q. Huang, “Geodynamical process and stability control ofhigh rock slope development,” Chinese Journal of RockMechanics and Engineering, vol. 27, no. 8, pp. 1525–1544,2008.
[46] S. W. Song, X. M. Feng, B. Y. Xiang, W. B. Xing, and Y. Zeng,“Research on key technologies for high and steep rock slopesof hydropower engineering in southwest China,” Chinese Jour-nal of Rock Mechanics and Engineering, vol. 30, no. 1, pp. 1–22,2011.
[47] D. Huang, R. Q. Huang, Q. Chen, M. Zhang, and L. W. Jiang,“Study on distribution laws of observation full-trace length ofbasal joints,” Hydrogeology and Engineering Geology, vol. 4,pp. 10–12, 2005.
[48] M. Mauldon, “Estimating mean fracture trace length and den-sity from observations in convex windows,” Rock Mechanicsand Rock Engineering, vol. 31, no. 4, pp. 201–216, 1998.
[49] N. M. Pinyol, E. E. Alonso, J. Corominas, and J. Moya,“Canelles landslide: modelling rapid drawdown and fastpotential sliding,” Landslides, vol. 9, no. 1, pp. 33–51, 2012.
[50] D. F. Macfarlane, “Observations and predictions of the behav-iour of large, slow-moving landslides in schist, Clyde Dam res-ervoir, New Zealand,” Engineering Geology, vol. 109, no. 1–2,pp. 5–15, 2009.
[51] L. Borgatti, A. Corsini, M. Barbieri et al., “Large reactivatedlandslides in weak rockmasses: a case study from the NorthernApennines (Italy),” Landslides, vol. 3, no. 2, pp. 115–124, 2006.
[52] S. Jiang, Y. F. Wang, C. Tang, and K. Liu, “Long-term kinemat-ics and mechanism of a deep-seated slow-moving debris slidenear Wudongde hydropower station in southwest China,”Journal of Mountain Science, vol. 15, no. 2, pp. 364–379, 2018.
[53] S. Y. Zhao, Y. R. Zheng, andW. D. Deng, “Stability analysis onjointed rock slope by strength reduction FEM,” Chinese Jour-nal of Rock Mechanics and Engineering, vol. 22, no. 2,pp. 254–260, 2003.
[54] G. Q. Chen, R. Q. Huang, Q. Xu, T. B. Li, and M. L. Zhu, “Pro-gressive modelling of the gravity-induced landslide using thelocal dynamic strength reduction method,” Journal of Moun-tain Science, vol. 10, no. 4, pp. 532–540, 2013.
[55] E. E. Alonso and N. M. Pinyol, “Criteria for rapid sliding I. Areview of Vaiont case,” Engineering Geology, vol. 114, no. 3–4, pp. 198–210, 2010.
[56] Hydrochina Chengdu Engineering Corporation, DeformationMechanism and Stability Evaluation of Rock Slope on the RightBank of Pubugou Hydropower Station, Hydrochina ChengduEngineering Corporation, Dadu River in Sichuan Province,2015.
17Geofluids