defining the role of phytoene synthase in carotenoid ... › download › pdf › 10909437.pdf ·...
TRANSCRIPT

Defining the role of phytoene synthase in
carotenoid accumulation of high provitamin A
bananas
By
Bulukani Mlalazi
Bachelor of Biotechnology Innovation (Hons.)
A thesis submitted for the degree of Doctor of Philosophy
at the
Queensland University of Technology
Centre for Tropical Crops and Biocommodities
2010

ii
Abstract: Vitamin A deficiency (VAD) is a serious problem in developing countries, affecting
approximately 127 million children of preschool age and 7.2 million pregnant women each
year. However, this deficiency is readily treated and prevented through adequate nutrition.
This can potentially be achieved through genetically engineered biofortification of staple
food crops to enhance provitamin A (pVA) carotenoid content. Bananas are the fourth most
important food crop with an annual production of 100 million tonnes and are widely
consumed in areas affected by VAD. However, the fruit pVA content of most widely
consumed banana cultivars is low (~ 0.2 to 0.5 µg/g dry weight). This includes cultivars such
as the East African highland banana (EAHB), the staple crop in countries such as Uganda,
where annual banana consumption is approximately 250 kg per person. This fact, in addition
to the agronomic properties of staple banana cultivars such as vegetative reproduction and
continuous cropping, make bananas an ideal target for pVA enhancement through genetic
engineering.
Interestingly, there are banana varieties known with high fruit pVA content (up to 27.8 µg/g
dry weight), although they are not widely consumed due to factors such as cultural
preference and availability. The genes involved in carotenoid accumulation during banana
fruit ripening have not been well studied and an understanding of the molecular basis for the
differential capacity of bananas to accumulate carotenoids may impact on the effective
production of genetically engineered high pVA bananas. The production of phytoene by the
enzyme phytoene synthase (PSY) has been shown to be an important rate limiting
determinant of pVA accumulation in crop systems such as maize and rice. Manipulation of
this gene in rice has been used successfully to produce Golden Rice, which exhibits higher
seed endosperm pVA levels than wild type plants. Therefore, it was hypothesised that
differences between high and low pVA accumulating bananas could be due either to
differences in PSY enzyme activity or factors regulating the expression of the psy gene.
Therefore, the aim of this thesis was to investigate the role of PSY in accumulation of pVA
in banana fruit of representative high (Asupina) and low (Cavendish) pVA banana cultivars
by comparing the nucleic acid and encoded amino acid sequences of the banana psy genes, in
vivo enzyme activity of PSY in rice callus and expression of PSY through analysis of
promoter activity and mRNA levels.
Initially, partial sequences of the psy coding region from five banana cultivars were obtained
using reverse transcriptase (RT)-PCR with degenerate primers designed to conserved amino

iii
acids in the coding region of available psy sequences from other plants. Based on
phylogenetic analysis and comparison to maize psy sequences, it was found that in banana,
psy occurs as a gene family of at least three members (psy1, psy2a and psy2b). Subsequent
analysis of the complete coding regions of these genes from Asupina and Cavendish
suggested that they were all capable of producing functional proteins due to high
conservation in the catalytic domain. However, inability to obtain the complete mRNA
sequences of Cavendish psy2a, and isolation of two non-functional Cavendish psy2a coding
region variants, suggested that psy2a expression may be impaired in Cavendish. Sequence
analysis indicated that these Cavendish psy2a coding region variants may have resulted from
alternate splicing. Evidence of alternate splicing was also observed in one Asupina psy1
coding region variant, which was predicted to produce a functional PSY1 isoform. The
complete mRNA sequence of the psy2b coding regions could not be isolated from either
cultivar.
Interestingly, psy1 was cloned predominantly from leaf while psy2 was obtained
preferentially from fruit, suggesting some level of tissue-specific expression. The Asupina
and Cavendish psy1 and psy2a coding regions were subsequently expressed in rice callus and
the activity of the enzymes compared in vivo through visual observation and quantitative
measurement of carotenoid accumulation. The maize B73 psy1 coding region was included
as a positive control. After several weeks on selection, regenerating calli showed a range of
colours from white to dark orange representing various levels of carotenoid accumulation.
These results confirmed that the banana psy coding regions were all capable of producing
functional enzymes. No statistically significant differences in levels of activity were
observed between banana PSYs, suggesting that differences in PSY activity were not
responsible for differences in the fruit pVA content of Asupina and Cavendish.
The psy1 and psy2a promoter sequences were isolated from Asupina and Cavendish gDNA
using a PCR-based genome walking strategy. Interestingly, three Cavendish psy2a promoter
clones of different sizes, representing possible allelic variants, were identified while only
single promoter sequences were obtained for the other Asupina and Cavendish psy genes.
Bioinformatic analysis of these sequences identified motifs that were previously
characterised in the Arabidopsis psy promoter. Notably, an ATCTA motif associated with
basal expression in Arabidopsis was identified in all promoters with the exception of two of
the Cavendish psy2a promoter clones (Cpsy2apr2 and Cpsy2apr3). G1 and G2 motifs, linked
to light-regulated responses in Arabidopsis, appeared to be differentially distributed between
psy1 and psy2a promoters. In the untranscribed regulatory regions, the G1 motifs were found
only in psy1 promoters, while the G2 motifs were found only in psy2a. Interestingly, both

iv
ATCTA and G2 motifs were identified in the 5’ UTRs of Asupina and Cavendish psy1.
Consistent with other monocot promoters, introns were present in the Asupina and
Cavendish psy1 5’ UTRs, while none were observed in the psy2a 5’ UTRs. Promoters were
cloned into expression constructs, driving the β-glucuronidase (GUS) reporter gene.
Transient expression of the Asupina and Cavendish psy1 and psy2a promoters in both
Cavendish embryogenic cells and Cavendish fruit demonstrated that all promoters were
active, except Cpsy2apr2 and Cpsy2apr3. The functional Cavendish psy2a promoter
(Cpsy2apr1) appeared to have activity similar to the Asupina psy2a promoter. The activities
of the Asupina and Cavendish psy1 promoters were similar to each other, and comparable to
those of the functional psy2a promoters.
Semi-quantitative PCR analysis of Asupina and Cavendish psy1 and psy2a transcripts
showed that psy2a levels were high in green fruit and decreased during ripening, reinforcing
the hypothesis that fruit pVA levels were largely dependent on levels of psy2a expression.
Additionally, semi-quantitative PCR using intron-spanning primers indicated that high levels
of unprocessed psy2a and psy2b mRNA were present in the ripe fruit of Cavendish but not in
Asupina. This raised the possibility that differences in intron processing may influence pVA
accumulation in Asupina and Cavendish.
In this study the role of PSY in banana pVA accumulation was analysed at a number of
different levels. Both mRNA accumulation and promoter activity of psy genes studied were
very similar between Asupina and Cavendish. However, in several experiments there was
evidence of cryptic or alternate splicing that differed in Cavendish compared to Asupina,
although these differences were not conclusively linked to the differences in fruit pVA
accumulation between Asupina and Cavendish. Therefore, other carotenoid biosynthetic
genes or regulatory mechanisms may be involved in determining pVA levels in these
cultivars. This study has contributed to an increased understanding of the role of PSY in the
production of pVA carotenoids in banana fruit, corroborating the importance of this enzyme
in regulating carotenoid production. Ultimately, this work may serve to inform future
research into pVA accumulation in important crop varieties such as the EAHB and the
discovery of avenues to improve such crops through genetic modification.

v
Table of Contents: Abstract:.......... ................................................................................................................................. ii
Table of Contents: ............................................................................................................................ v
List of Figures: ................................................................................................................................ ix
List of Tables:. ................................................................................................................................ xi
List of Abbreviations: .................................................................................................................... xii
Declaration:..... .............................................................................................................................. xiv
Acknowledgements: ....................................................................................................................... xv
Chapter 1: Introduction .............................................................................................................. 1
1.1 General introduction .............................................................................................. 1
1.2 Banana ................................................................................................................... 3
1.2.1 Taxonomy and genetics ....................................................................................... 3
1.2.2 Banana as a target for pVA enrichment ............................................................... 3
1.3 Carotenoid metabolism .......................................................................................... 4
1.3.1 Carotenoid biosynthesis ....................................................................................... 6
1.3.2 Carotenoid cleavage ............................................................................................. 9
1.3.3 Regulation of carotenoid metabolism ................................................................ 10
1.4 Phytoene synthase ................................................................................................ 13
1.4.1 Properties of psy ................................................................................................. 13
1.4.2 The psy gene as a target for pVA enhancement ................................................. 15
1.5 Objectives of the program of research and investigation ..................................... 17
Chapter 2: General methods .................................................................................................... 19
2.1 General methods for nucleic acid purification from plant cells ........................... 19
2.1.1 Purification of total RNA from banana tissue .................................................... 19
2.1.2 mRNA purification ............................................................................................ 19
2.1.3 DNA extraction .................................................................................................. 19
2.2 General methods in nucleic acid amplification, cloning and sequencing ............ 20
2.2.1 PCR amplification .............................................................................................. 20
2.2.2 Restriction enzyme digestion of DNA ............................................................... 21
2.2.3 Agarose gel electrophoresis ............................................................................... 21
2.2.4 Purification of DNA from agarose gels ............................................................. 21
2.2.5 DNA ligation ...................................................................................................... 22
2.2.6 Transformation of Escherichia coli with recombinant plasmids ....................... 22
2.2.7 Growth of bacteria in liquid cultures ................................................................. 22
2.2.8 Purification of plasmid DNA ............................................................................. 22

vi
2.2.9 Storage of bacterial cultures ............................................................................... 23
2.2.10 DNA sequencing ................................................................................................ 23
2.3 Plant tissue culture media ..................................................................................... 24
Chapter 3: Isolation and characterisation of phytoene synthase sequences from banana ........ 25
3.1 Introduction .......................................................................................................... 25
3.2 Materials and methods ......................................................................................... 27
3.2.1 Plant material ...................................................................................................... 27
3.2.2 Nucleic acid isolation from plant tissue ............................................................. 27
3.2.3 Oligonucleotide primers ..................................................................................... 27
3.2.4 RT-PCR of partial psy coding region using degenerate primers ........................ 29
3.2.5 Sequence analysis ............................................................................................... 29
3.2.6 Isolation of banana psy mRNA sequences ......................................................... 30
3.2.7 Isolation of partial banana psy sequences from gDNA ...................................... 32
3.2.8 Amplification of the complete psy coding region from mRNA and gDNA ....... 34
3.3 Results .................................................................................................................. 35
3.3.1 Initial characterisation of banana psy ................................................................. 35
3.3.1.1 Isolation of partial banana psy sequences .................................................. 35
3.3.1.2 Phylogenetic analysis of partial banana psy sequences ............................. 37
3.3.2 Isolation of complete psy mRNA sequences ...................................................... 39
3.3.2.1 Isolation of psy1 mRNA sequences ........................................................... 40
3.3.2.2 Isolation of psy2 coding regions ................................................................ 42
3.3.3 Phylogenetic analysis of complete banana psy coding regions .......................... 47
3.3.4 Analysis of Asupina and Cavendish psy gene structure ..................................... 49
3.3.5 Further analysis of psy coding region variants ................................................... 51
3.4 Discussion ............................................................................................................ 51
Chapter 4: Characterisation of phytoene synthase enzymes .................................................... 60
4.1 Introduction .......................................................................................................... 60
4.2 Materials and methods ......................................................................................... 61
4.2.1 Bioinformatic analysis of banana PSY protein sequences ................................. 61
4.2.2 Cloning of psy coding regions into binary vectors ............................................. 62
4.2.3 Functional analysis of psy genes in rice ............................................................. 65
4.2.3.1 Callus induction and maintenance ............................................................. 65
4.2.3.2 Transformation of Agrobacterium with binary vectors ............................. 65
4.2.3.3 Preparation of Agrobacterium for transformation of rice callus ............... 66
4.2.3.4 Transformation of rice callus .................................................................... 66
4.2.4 Analysis of carotenoid accumulation in rice callus ............................................ 67
4.3 Results .................................................................................................................. 68

vii
4.3.1 PSY protein sequence analysis .......................................................................... 68
4.3.1.1 Primary sequence analysis ........................................................................ 68
4.3.1.2 Secondary and tertiary sequence analysis ................................................. 70
4.3.2 Functional analysis of banana PSYs .................................................................. 74
4.3.2.1 Rice callus induction and optimisation of transformation ........................ 74
4.3.2.2 Comparison of banana psy genes in rice ................................................... 76
4.4 Discussion ............................................................................................................ 81
Chapter 5: Characterisation of factors affecting phytoene synthase expression ...................... 88
5.1 Introduction .......................................................................................................... 88
5.2 Materials and methods ......................................................................................... 89
5.2.1 Oligonucleotide primers ..................................................................................... 89
5.2.2 psy promoter isolation ........................................................................................ 89
5.2.3 Cloning of psy promoters into pGEM-4Z vectors .............................................. 91
5.2.4 Bioinformatic analysis of promoter sequences .................................................. 92
5.2.5 Preparation of banana tissue for microprojectile bombardment ........................ 93
5.2.5.1 Banana embryogenic cell suspensions ...................................................... 93
5.2.5.2 Banana fruit tissue ..................................................................................... 93
5.2.6 Microprojectile bombardment of psy promoter GUS constructs ....................... 94
5.2.6.1 Microprojectile bombardment procedure .................................................. 94
5.2.6.2 Histochemical GUS staining ..................................................................... 94
5.2.6.3 Fluorimetric analysis of GUS activity ...................................................... 95
5.2.7 Analysis of Asupina and Cavendish banana fruit ripening ................................ 95
5.2.7.1 Plant materials ........................................................................................... 95
5.2.7.2 Ripening trial ............................................................................................ 96
5.2.8 Semi-quantitative RT-PCR ................................................................................ 96
5.2.8.1 Preparation of mRNA ............................................................................... 96
5.2.8.2 RT-PCR analysis ....................................................................................... 97
5.3 Results .................................................................................................................. 97
5.3.1 PSY promoter isolation and analysis ................................................................. 97
5.3.1.1 Promoter isolation ..................................................................................... 97
5.3.1.2 Promoter analysis ...................................................................................... 98
5.3.2 Comparison of promoter activity ..................................................................... 105
5.3.2.1 Microprojectile bombardment of banana ECS ........................................ 105
5.3.2.2 Microprojectile bombardment of banana fruit ........................................ 106
5.3.3 Analysis of mRNA transcript abundance ......................................................... 114
5.3.3.1 Ripening trial .......................................................................................... 114
5.3.3.2 Semi-quantitative PCR ............................................................................ 117

viii
5.4 Discussion .......................................................................................................... 122
Chapter 6: General discussion ................................................................................................ 129
References:...... ............................................................................................................................. 137

ix
List of Figures: Figure 1.1: Structure of carotene cyclic end groups ........................................................................ 5
Figure 1.2: Summary of carotenoid biosynthesis ............................................................................. 7
Figure 1.3: Organisation of carotenoid biosynthetic enzymes in plastids........................................ 9
Figure 1.4: Analysis of carotenoid accumulation in tomato fruit .................................................. 12
Figure 1.5: General structure of plant PSY proteins ...................................................................... 14
Figure 3.1: Summary of 5’ and 3’RLM-RACE strategies ............................................................. 31
Figure 3.2: Summary of genome walking strategy ........................................................................ 33
Figure 3.3: Representative agarose gel showing amplification of partial psy coding region ......... 35
Figure 3.4: Phylogenetic analysis of the banana psy partial coding region ................................... 38
Figure 3.5: Putative structure of psy1 mRNA ................................................................................ 41
Figure 3.6: Summary of psy2a and psy2b sequences isolated from Asupina and Cavendish ........ 43
Figure 3.7: Agarose gel electrophoresis of psy2a 5’ and 3’ RLM-RACE products from
Cavendish fruit mRNA .................................................................................................................. 44
Figure 3.8: Analysis of psy2 3’RLM-RACE clones ...................................................................... 46
Figure 3.9: Phylogenetic analysis of the coding regions of Asupina and Cavendish psy genes .... 48
Figure 3.10: Analysis of genomic sequence of Asupina and Cavendish psy genes ....................... 50
Figure 3.11: Analysis of coding region variants of Asupina psy1 and Cavendish psy2a .............. 52
Figure 3.12: Analysis of Cavendish psy2c partial sequence structure ........................................... 53
Figure 4.1: Construction of psy coding region binary vectors ....................................................... 64
Figure 4.2: Primary structure of banana PSY proteins .................................................................. 69
Figure 4.3: Analysis of secondary and tertiary structure of banana PSY proteins ......................... 72
Figure 4.4: Testing of GFP reporter genes in rice callus ............................................................... 75
Figure 4.5: Pilot experiment to confirm carotenoid accumulation in transgenic rice callus .......... 78
Figure 4.6: Carotenoid accumulation in rice callus ....................................................................... 79
Figure 4.7: Total carotenoids in Zpsy1 transformed rice calli ....................................................... 80
Figure 4.8: Carotenoid accumulation in rice calli transformed with different psy genes .............. 82
Figure 5.1: Strategy for the isolation of psy promoter sequences .................................................. 91
Figure 5.2: Strategy for generation of psy promoter constructs in pGEM-4Z ............................... 93
Figure 5.3: Updated psy1 and psy2a genomic sequence information ............................................ 99
Figure 5.4: Analysis of psy promoter sequences .......................................................................... 100
Figure 5.5: Alignment of selected regions of psy2a promoters ................................................... 101
Figure 5.6: Repeat sequence analysis of psy2a promoters ........................................................... 102
Figure 5.7: Secondary structure analysis of repeat region in the psy2a promoters ...................... 103
Figure 5.8: Identification of putative DNA regulatory motifs in banana psy promoters ............. 104

x
Figure 5.9: Analysis of banana psy promoter activity in banana ECS ......................................... 108
Figure 5.10: Analysis of psy promoter activity in gassed green fruit ........................................... 110
Figure 5.11: Analysis of psy promoter activity in ungassed green fruit ....................................... 113
Figure 5.12: Ripening of Asupina green fruit .............................................................................. 115
Figure 5.13: Analysis of Asupina and Cavendish mRNA ............................................................ 118
Figure 5.14: Semi-quantitative PCR analysis of banana psy expression ...................................... 121
Figure 5.15: Comparison of putative ATCTA motifs in psy2a promoters ................................... 125

xi
List of Tables: Table 1.1: Examples of animal VA and plant pVA sources ............................................................ 1
Table 1.2: Summary of the β-carotene yields of a range of high pVA bananas .............................. 4
Table 2.1: Composition of plant tissue culture (PTC) media ......................................................... 24
Table 3.1: Properties of banana cultivars used in the current project ............................................ 27
Table 3.2: PCR primers used in the isolation of banana psy sequences......................................... 28
Table 3.3: Conserved regions of PSY proteins used to design degenerate primers ....................... 29
Table 3.4: Partial psy clones obtained using degenerate primer RT-PCR. .................................... 37
Table 5.1: PCR primers used in banana psy promoter isolation and semi-quantitative PCR ........ 90
Table 5.2: Analysis of the ripening of Asupina and Cavendish green fruit ................................. 116

xii
List of Abbreviations: × g gravity
°C degrees Celsius
bp base pair(s)
BLASTn nucleotide basic local alignment search tool
CaMV35S cauliflower mosaic virus 35S
CDD conserved domain database
cDNA complementary deoxyribonucleic acid CTAB centyltriethylammonium bromide
DEPC diethylpyrocarbonate
DNA deoxyribonucleic acid
DTT dithiothreitol
EAHB East African highland banana
EDTA ethylenediaminetetraacetic acid
g gram(s)
gDNA genomic DNA
GFP green fluorescent protein
GUS β-glucuronidase
hr hour(s)
IPTG isopropyl-β-d-thiogalactopyranoside
Kb kilobase(s)
kDa kilodalton(s)
LN2 liquid nitrogen
mg milligram(s)
min minute(s)
mL millilitre(s)
mM millimolar
M-MLV Moloney murine leukaemia virus
mmol millimole(s)
mqH2O Milli-Q water (18.2 MΩ·cm water quality)
mRNA messenger RNA
MUG 4-methylumbelliferyl-β-D-glucuronide trihydrate
NCBI National centre for biotechnology information
ng nanogram(s)
NIH National Institute of Health

xiii
nm nanometre(s)
No(s). number(s)
OD600 optical density at 600 nm
pDNA plasmid DNA
pmol picomole(s)
pVA provitamin A
PVP polyvinylpyrrolidone
RACE rapid amplification of cDNA ends
RLM-RACE RNA ligase mediated-rapid amplification of cDNA ends
rRNA ribosomal RNA
RT reverse transcriptase
RT-PCR reverse transcriptase polymerase chain reaction
SDS sodium dodecyl sulphate
sec seconds
TAE tris-acetate EDTA
Taq Thermus aquaticus
TE tris-EDTA
U units of activity
UTR untranslated region
UV ultraviolet
V volts
v version
v/v volume per volume
VA vitamin A
VAD vitamin A deficiency
W watts
w/v weight per volume
X-gal 5-bromo-4-chloro-indolyl-β-D-galactopyranoside
X-gluc 5-bromo-4-chloro-3-indolyl-beta-D-glucuronic acid
μg microgram(s)
μL microlitre(s)
μM micromolar

xiv
Declaration: “The work contained within this thesis has not been previously submitted for a degree or
diploma at any other higher education institution. To the best of my knowledge and belief,
this thesis contains no material previously published or written by another person except
where due reference is made.”
Signed: …………………………………….
Date: ……………………………………….

xv
Acknowledgements: The successful completion of my thesis would not be possible without the tangible support of a
significant number of people to whom I would like to express my thanks:
Firstly I would like to thank my principal supervisor, Dr Marion Bateson, for lending me her wealth of
knowledge and expertise throughout the entire process and for being a compassionate mentor.
I would also like to thank my associate supervisors: Dr Doug Becker, Dr Mark Harrison, Dr Harjeet
Khanna and Professor James Dale. The insight and instruction that they have all provided throughout
my PhD has been invaluable.
Dr Jason Geijskes, for the additional insights generously provided during my PhD.
Professor James Dale, for seeing the potential in me and entrusting me with the honour of undertaking
this project in his lab.
I would like to thank the Bill and Melinda Gates Foundation as well as the QIDS scholarship scheme
for their material support in making my PhD project possible.
I would like to thank the QUT staff, particularly in the School of Life Sciences, whose various
activities contributed to the smooth progress of my thesis.
To the students and staff of the Centre for Tropical Crops and Biocommodities, thank you all for
making the time that I spent among you worthwhile, as your helpfulness and understanding enriched
my working environment.
To all my friends who have stood by me and encouraged me ceaselessly along the way, thank you,
there are too many of you to name! Thanks particularly to Priver, Mumbi, Inge and Washington (Jnr)
for the fun times had in the quest for the thesis.
To my family: Mum, Dad and Amu. I owe you so much in ways too innumerable to count! Thank you
for your love, prayers and support, without which I could not have ever hoped to achieve this dream.
To God, for giving me the opportunity to live and work with the exceptional group of people
mentioned above, and giving me strength and peace when I needed them most.

1
Chapter 1: Introduction 1.1 General introduction The term vitamin A (VA) describes any natural or synthetic compound able to perform the
functions attributed to this vitamin, and includes the retinoids (retinol and its derivatives) and
the provitamin A (pVA) carotenoids (Bender, 2003). Retinoids are obtained from animal
sources including animal liver and dairy products (NIH, 2006; Palace et al., 1999). However,
the pVA carotenoids α-carotene, β-carotene and β-cryptoxanthin are obtained from certain
fruits and vegetables (Amaya, 2001; NIH, 2006; Palace et al., 1999), absorbed by the
digestive system and converted into retinol (von Lintig et al., 2005). Selected examples of
recommended animal (retinol) and plant (β-carotene) sources of VA are shown in Table 1.1.
VA is important due to its diverse biological functions. It is involved in vision through the
signalling action of rhodopsin, a covalent complex of 11-cis-retinal with an apoprotein called
opsin (Okada et al., 2001), and is important in embryonic development (Chen et al., 1995)
and the function of organs including bone (Harada et al., 1995), lungs (Malpel et al., 2000),
skin (Roos et al., 1998) and the immune system (Chew, 1993). pVA carotenoids also play a
critical role as antioxidants in the direct control of oxidative stress, caused by reactive
oxygen species (Chew and Park, 2004; Halliwell, 1997).
Table 1.1: Examples of animal VA and plant pVA sources. The content of retinol or β-carotene is expressed as a proportion of the weight of the raw/fresh food source using data obtained from the USDA National Nutrient Database for Standard Reference (USDA, 2008).
Food Source VA compound Amount (μg/g) Chicken liver retinol 33 Whole eggs retinol 1 Carrots β-carotene 83 Spinach β-carotene 56 Apricots β-carotene 11
The human body is incapable of de novo VA synthesis, therefore it must be obtained
exclusively from the diet and metabolised into its bioactive and storable forms (von Lintig et
al., 2005). Vitamin A deficiency (VAD) is caused by inadequate dietary intake of VA
compounds due to malnutrition or diseases that affect intestinal absorption such as diarrhoea
(NIH, 2006). As a result, treatment and prevention of VAD is only possible through adequate
dietary intake of VA or pVA compounds through supplementation, food fortification or
dietary intervention (Filteau and Tomkins, 1999). Supplementation normally involves the
intake of retinol or β-carotene in pharmacological formulations, such as cod liver oil, palm
2
oil or tablets (Solomons and Orozco, 2003; West, 2000). Food fortification is achieved using
purified VA compounds to boost the nutritional value of commercially available foods such
as margarine and breakfast cereals during manufacturing (West, 2000). Dietary intervention
involves the integration of naturally rich VA sources into the diet of the population (West,
2000). Interestingly, the use of crops with pVA content enhanced through genetic
engineering may provide a means by which dietary intervention may be achieved (West et
al., 2002).
VAD is a serious problem in developing countries where it affects up to 127 million children
of preschool age and 7.2 million pregnant women each year (West, 2002). Clinical VAD is
associated with various developmental, organ and immune dysfunctions with the first sign
being xerophthalmia or night blindness, which untreated leads to permanent blindness
(Sommer and West, 1996). The prevalence of VAD is widespread across Africa, where it is
estimated to affect 33 million preschool age children (SanJoaquin and Molyneux, 2009).
Studies showed that this disorder accounted for approximately 35% of overall mortality in
Mozambican children below 5 years old (Aguayo et al., 2005), while the rate of VAD in
Tanzanian children (aged 7 to 14) was approximately 31.9% and significantly linked with
anaemia (Tatala et al., 2008). Additionally, analysis of VA levels of HIV infected patients in
Uganda found that 33% suffered from VAD and were at increased risk of mortality
compared to those not exhibiting VAD (Langi et al., 2003). Bananas have potential in the
treatment of VAD due to their wide production and consumption in developing countries
(Ammar-Khodja, 2000), particularly Eastern Africa (Uganda, Burundi and Rwanda), where
VAD is a significant problem. Banana is grown in over 120 countries and consumed by 400
million people, making it the fourth most nutritionally important staple food crop after rice,
wheat and maize. In banana growing regions, 90% of the harvested crop is consumed by the
local population and in East Africa, as much as 250 kg per person of the East African
Highland Banana (EAHB) is consumed annually (Ammar-Khodja, 2000). Although high
pVA bananas exist (Englberger, 2003), they are not widely consumed in most countries, and
staple banana cultivars such as the EAHB are relatively low in pVA. One approach currently
being investigated is to increase the pVA content in banana through genetic manipulation of
the carotenoid biosynthetic pathway, specifically through increased expression of the
enzyme phytoene synthase (PSY), as has previously been demonstrated in rice (Paine et al.,
2005). However, to date, the carotenoid biosynthetic pathway and the gene(s) encoding PSY
have not been characterised in banana. Additionally, there is no understanding of the
mechanisms responsible for the high pVA accumulation in some banana cultivars or if PSY
plays a role in this, factors that could impact significantly on the enhancement of pVA in
banana.

3
1.2 Banana 1.2.1 Taxonomy and genetics There are over 1000 varieties of banana which are subdivided into 50 groups (Ammar-
Khodja, 2000). Taxonomically, wild banana species are classified into one of five groups
within the genus Musa, being: eumusa, rhodochlamys, callimusa, australimusa and incertae
sedis. Of these, eumusa, australimusa and their hybrids constitute the predominant
proportion of cultivated varieties (Daniells et al., 2001). The diploid number of banana
genomes ranges between 2n = 20 and 2n = 22 and these can be segregated into four genomes
acuminata (A), balbisiana (B), schizocarpa (S) and textiles (T) (Daniells et al., 2001; Pillay
et al., 2004). The T genome is characteristic of Australimusa, which includes Musa textilis
and the Fe’i bananas, found in Papua New Guinea and Polynesia, which are poorly
characterised and whose genotype is typically represented simply as Fe’i. Banana genomes
may contain multiple types and their ploidy varies between diploid and tetraploid. Triploid
bananas include the popular commercial varieties Cavendish (AAA) and Ladyfinger (AAB)
as well as important staples such as the EAHB (AAA; Daniells et al., 2001; Pillay et al.,
2004). There have been a number of studies focussed on characterising the structure and
organisation of the banana genome (Gowen, 1995), including distribution of repetitive DNA
sequences (Valárik et al., 2002), determination of nucleotide content and gene density (Aert
et al., 2004; Kamate et al., 2001), and the relationship between genome size and ribosomal
DNA distribution (Bartos et al., 2005). Many banana genes with different roles have been
characterised and include ripening-related enzymes such as polyphenol oxidase (Gooding et
al., 2001), pectate lyase (Marin-Rodriguez et al., 2003) and 1-aminocyclopropane-1-
carboxylate (ACC) oxidase (Huang et al., 1997; Liu et al., 1999). However, extensive review
of the literature suggests that none of the genes known to directly influence carotenoid
biosynthesis have been characterised in banana, with work mainly focused on other
characteristics such as disease resistance (Atkinson et al., 2004; Chakrabarti et al., 2003;
Gowen, 1995).
1.2.2 Banana as a target for pVA enrichment Banana plants have a relatively short maturation time (9 to 12 months after planting) and
high fruit yield (20 to 25 kg of fruit per bunch; Ammar-Khodja, 2000) and banana fruit is a
high energy source containing vitamin C and B group vitamins such as niacin and riboflavin,
as well as minerals such as potassium (Gowen, 1995). Further, some varieties of Fe’i
bananas are very good calcium sources (Englberger et al., 2003a). Bananas are not typically
regarded as a high pVA crop. However, cultivars with β-carotene levels ranging from 3.3
µg/g (yellow fruit) to 27.8 µg/g (orange fruit), and high α-carotene levels exist in the

4
Federated States of Micronesia and other areas (Englberger et al., 2003c; Table 1.2).
Comparatively, these cultivars have between 16 and 132 times the β-carotene content of
commercial varieties (approximately 0.21 µg/g; Holden et al., 1999). However, these
bananas are usually not consumed in regions where they do not naturally occur due to factors
such as quarantine restrictions and cultural acceptability (Englberger et al., 2003a).
Table 1.2: Summary of the β-carotene yields of a range of high pVA bananas. The banana cultivars are ranked according to β-carotene yield. The taxonomic classification and genome type data were reported by Daniells et al. (2001). However, the Fe’i type bananas were simply classified as Fe’i (Englberger et al., 2003c). The β-carotene yields of banana cultivars marked (a) ,(b) and (c) were obtained from results reported by Englberger et al. (2003c), Englberger (2003) and Holden et al. (1999), respectively.
Banana Cultivar Taxonomic Classification Genome Type β-carotene content (μg g-1)
Uht en yap (a) Fe’i Fe’i 27.80 Lakatan (b) Eumusa AA 8.37 Usr kulasr (a) Fe’i Fe’i 6.6 Pisang Kelat (b) Eumusa AAB 4.90 Pisang Rajah (b) Eumusa AAB 4.15 Usr Lakatan (a) Eumusa AA 3.30 Cavendish (c) Eumusa AAA 0.21
Due to their excellent bioavailability, good cultural acceptance in target areas and high
nutritional value, bananas make an excellent target for pVA biofortification. Further, the
sterility of commercially important bananas reduces the risk of gene transfer to wild species
or related plants. In banana, conventional breeding of staple cultivars with high pVA
varieties is not feasible because cultivated bananas are sterile due to cytoplasmic and genetic
factors (Gowen, 1995), making it difficult to obtain viable seed for breeding. Conversely, the
genetic modification of banana is an established technology using both microprojectile
bombardment (Hermann et al., 2001) and Agrobacterium-mediated (Khanna et al., 2004)
transformation. These gene transfer methods are preferred over conventional breeding as
they produce more plants with desired traits in a shorter time frame due to the direct nature
of gene transfer, and the efficient selection and micropropagation of transgenic plants. The
genetic modification of edible plant varieties to enhance pVA bioavailability requires a
detailed understanding of carotenoid metabolism.
1.3 Carotenoid metabolism Carotenoids are lipophilic pigments found in all photosynthetic organisms and are
characterised by an unsaturated 40 carbon backbone with as many as 15 double bonds
(Busch et al., 2002; Hirschberg, 2001; Taylor and Ramsay, 2005). This family includes
5
carotenes, such as α-carotene and β-carotene, and their oxygenated derivatives the
xanthophylls, such as zeaxanthin and violaxanthin. They are localised predominantly in the
chloroplasts and chromoplasts in plants (Sinha, 2004). In chloroplasts, they have critical
roles in photosynthesis where they form part of light harvesting complexes, serving as
photosynthetic electron transfer molecules by reducing chlorophyll. They are also
photoprotective agents that prevent chlorophyll damage by dissipating excess light energy
and inhibiting free radical reactions (Sinha, 2004; Taiz and Zeiger, 2002). Carotenoids also
function in fruits and flowers where they attract animals and insects for pollination and seed
scattering, as well as in some grains, roots and tubers (Sinha, 2004; Taylor and Ramsay,
2005). In addition, the phytohormone abscisic acid, which has well characterised roles in
stress response, is derived from carotenoid precursors (Cutler and Krochko, 1999).
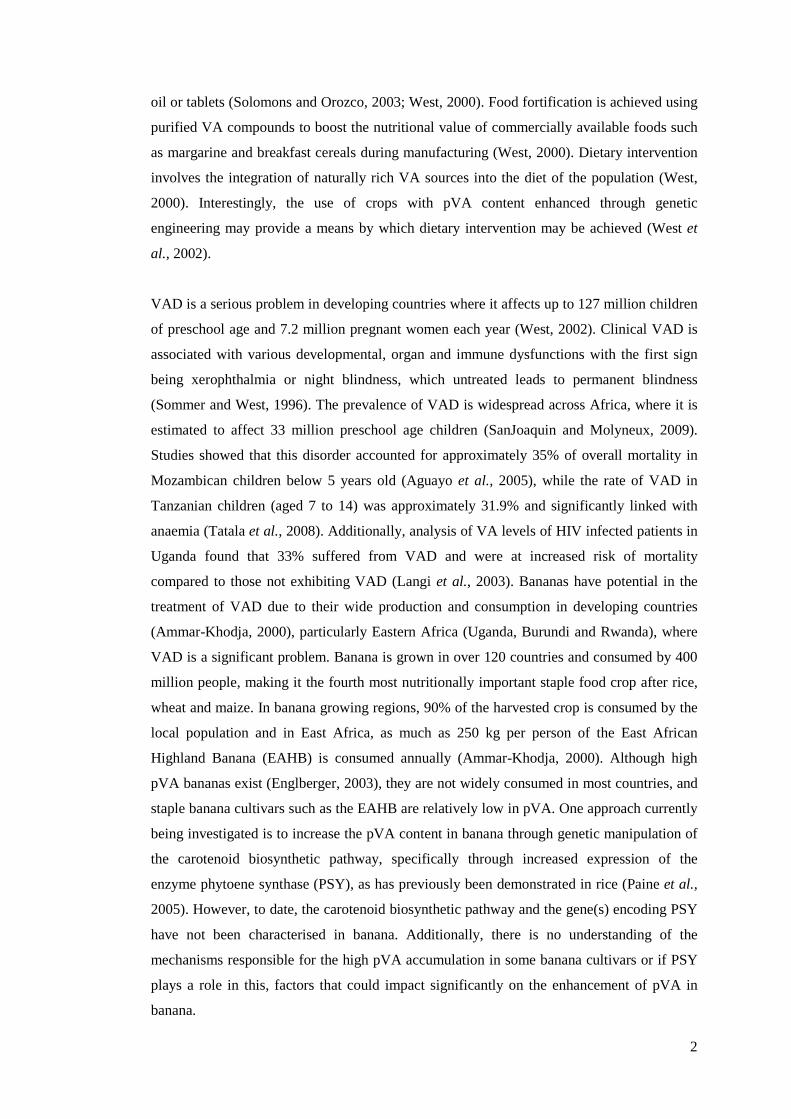
The three naturally occurring carotenoids with pVA activity are β-carotene, α-carotene and
β-cryptoxanthin, which are nutritionally active because they have an unsubstituted β-ionone
ring at one or both ends of the molecule (Figure 1.1; Bender, 2003; Yeum and Russell,
2002). β-carotene has β-ionone rings at both ends of the molecule and is therefore most
efficiently converted to retinol. However, α-carotene and β-cryptoxanthin are less efficiently
converted to retinol because they also have ε-cyclic and hydroxylated β-cyclic rings,
Figure 1.1: Structure of carotene cyclic end groups. The two basic ring structures a) β-ionone (β-cyclic) and b) ε-ionone (ε-cyclic) differ only in the position of the carbon-carbon double bond, which is between carbon 5 and 6 for β-ionone and between carbon 4 and 5 for ε-ionone. c) Summary of the structure of the pVA carotenoids [adapted from Cunningham and Gantt, 1998].

6
respectively (Cunningham and Gantt, 1998; West, 2000). The genes involved in carotenoid
metabolism have been well characterised in both prokaryote and eukaryote systems, and
have been reviewed extensively (Armstrong and Hearst, 1996; Cunningham and Gantt, 1998;
Sinha, 2004). The regulation of these genes during fruit development has also been widely
studied in systems such as tomato (Fraser et al., 1994; Giuliano et al., 1993; Pecker et al.,
1996; Ronen et al., 1999) and citrus (Rodrigo et al., 2004). This has resulted in a detailed
understanding of the metabolic pathway, from which multiple molecular targets for the
genetic improvement of pVA carotenoid biosynthesis have been identified (Cunningham and
Gantt, 1998).
1.3.1 Carotenoid biosynthesis The process of carotenoid biosynthesis is summarised in Figure 1.2 and begins with the
conversion of isopentenyl diphosphate (IPP) to its isomer, dimethylallyl diphosphate
(DMAPP). DMAPP is the initial substrate required to form the precursors for virtually all
isoprenoid biosynthetic pathways (Cunningham and Gantt, 1998). The enzyme isopentenyl
diphosphate isomerise (IPI) catalyses the conversion of IPP to DMAPP through a reversible
allylic rearrangement that repositions the carbon-carbon double bond. Following
isomerisation, the sequential addition of three IPP molecules to one DMAPP molecule
(Figure 1.2a) by geranylgeranyl diphosphate synthase (GGPS), leads to the production of
geranylgeranyl diphosphate (GGPP). The first committed step of carotenoid biosynthesis is
the condensation of two GGPP molecules by the enzyme phytoene synthase (PSY) to
produce the symmetrical phytoene molecule (Cunningham and Gantt, 1998). This is a two-
step process involving the intermediate molecule prephytoene diphosphate (PPPP) and the
removal of the diphosphate groups from the substrates, resulting in a linear hydrophobic
product. The second step in carotenoid biosynthesis is the desaturation of phytoene to
produce lycopene (Figure 1.2b), which is catalysed by two related enzymes, phytoene
desaturase (PDS) and zeta (ζ)-carotene desaturase (ZDS). The process occurs via two
desaturation steps where PDS converts phytoene to ζ-carotene via phytofluene, which is then
transformed to lycopene by ZDS through the intermediate neurosporene (Cunningham and
Gantt, 1998).

7
Figure 1.2: Summary of carotenoid biosynthesis illustrating the process by which short chain isoprenoids are biochemically converted into carotenoids and related compounds [adapted from Cunningham and Gantt, 1998]. Carotenoid biosynthesis can be considered to consist of three phases. The first stage a) is the condensation of isopentenyl diphosphate (IPP) and dimethylallyl diphosphate (DMAPP) into phytoene. The second part b) involves the desaturation of phytoene to lycopene, which is then converted into carotene compounds c) that are converted into lutein and xanthophylls. Although the precursors of phytoene production in a) are known to be involved in the synthesis of other isoprenoids, only their relevance to carotenoid biosynthesis has been highlighted. The dotted arrows show the transfer of carotenoid intermediates to subsequent phases of biosynthetic process. The circled text represents the different enzymes involved in carotenoid biosynthesis while the solid arrows ( and ) represent substrate conversion events. The abbreviated enzyme names are: isopentenyl diphosphate isomerase (IPI), geranylgeranyl diphosphate synthase (GGPS), phytoene synthase (PSY), phytoene desaturase (PDS), ζ-carotene desaturase (ZDS), lycopene β-cyclase (LCYB), lycopene ε-cyclase (LCYE) and β-carotene hydroxylase (CHYB).
The linear lycopene molecule is converted to bicyclic carotene compounds such as α- and β-
carotene through sequential cyclisation reactions catalysed by the lycopene β- and ε-cyclases
(Figure 1.2c; Cunningham and Gantt, 1998). Lycopene β-cyclase (LCYB) catalyses the
formation of β-carotene by forming two β-cyclic rings from both ends of the lycopene
molecule in a process that produces the monocyclic γ-carotene intermediate. Similarly,
FPP (C15)
IPP (C5)
DMAPP (C5)
GPP (C10) GGPP (C20) PPPP (C40) Phytoene (C40)
PSY GGPS
IPI
IPP (C5) IPP (C5) GGPP (C20)
a) Phytoene Formation via IPP condensation
Phytofluene ζ-carotene Neurosporene Phytoene (C40) Lycopene
ZDS PDS
H2 H2 H2 H2
b) Lycopene Formation via Phytoene Desaturation
c) Carotenoid Formation via Lycopene Cyclisation
δ-carotene
ε-carotene
α-carotene Lutein Xanthophyll Cycle
γ-carotene
Lycopene β-carotene β-cryptoxanthin
LCYE
LCYE
LCYB
LCYB
CHYB
CHYB

8
lycopene ε-cyclase (LCYE) creates δ-carotene, and then ε-carotene in two steps. However,
ε,ε-carotenes are rare in plant systems and LCYE is normally involved in the synthesis of α-
carotene, a β,ε-carotenoid, in concert with LCYB. The enzyme β-carotene hydroxylase
(CHYB) sequentially adds hydroxyl groups to both β-ionone rings of the β-carotene
molecule in two a step process, producing zeaxanthin via the intermediate β-cryptoxanthin
(Figure 1.2c). This represents the first step in the conversion of carotenoids into xanthophylls
and related compounds (Cunningham and Gantt, 1998).
Observation of the structural and functional properties of carotenoid biosynthetic enzymes
resulted in the hypothesis that in plant and algal plastids, these enzymes function in three
multi-enzyme complexes (Figure 1.3; Cunningham and Gantt, 1998). The first enzyme
aggregate is a phytoene biosynthesis complex consisting of monomeric IPI and PSY
complexed to a GGPP homodimer (Figure 1.3a). This complex is predicted to convert IPP
into phytoene (Bonk et al., 1997) and be soluble but membrane associated in its functional
state due to PSY’s lipid cofactor requirements (Fraser et al., 2000; Schledz et al., 1996) and
the hydrophobic nature of isoprenoids (Cunningham and Gantt, 1998). This hypothesis is
supported by evidence of organelle-specific functional segregation of GGPS family members
(Okada et al., 2000; Suire et al., 2000). Analysis of cauliflower PDS provided further
evidence of isoprenoid enzyme complex formation as this 55 kDa protein was associated
with 350 kDa and 660 kDa complexes in the plastid membrane and stroma respectively
(Lopez et al., 2008b).
Phytoene is then transferred to adjacent membrane-bound β,β- and β,ε-complexes (Figure
1.3b and c) which ultimately produce β-carotene and α-carotene, respectively. The β,β-
complex is thought to consist of an association of the homodimers of PDS, ZDS and LCYB,
while β,ε-complexes differ only in the presence of a LCYB/LCYE heterodimer instead of the
LCYB homodimer. The rarity of natural ε,ε compounds and questions over LCYE’s ability
to homodimerise suggest that ε,ε-complexes are not common (Cunningham and Gantt,
1998). Enzyme complex formation could help to explain the concurrent upregulation of
endogenous PDS and ZDS in tomato lines transformed with prokaryotic PDS (Romer et al.,
2000), and changes in the α-carotene to β-carotene ratio in transgenic canola seeds modified
with different combinations of isoprenoid biosynthetic enzymes (Ravanello et al., 2003).

9
Figure 1.3: Organisation of carotenoid biosynthetic enzymes in plastids. At the start of carotenoid synthesis, eight IPP molecules are converted to phytoene by the stromal phytoene biosynthesis complex (a), which consists of monomeric IPI and PSY enzymes linked to a GGPS homodimer. This complex is linked to the plastid membrane by the membrane-associated PSY enzyme. Next, the lipophilic phytoene molecule is processed by the membrane-bound β,β- (b) and β,ε- (c) carotenoid synthesis complexes responsible for the production of α-carotene and β-carotene, respectively. [adapted from Cunningham and Gantt, 1998)].
1.3.2 Carotenoid cleavage Carotenoids are precursors for the biosynthesis of many secondary metabolites and some,
such as abscisic acid (ABA), have signalling functions. Enzymes in the 9-cis-epocarotenoid
cleavage dioxygenase (NCED) and carotenoid cleavage dioxygenase (CCD) protein families
are involved in carotenoid catabolism (Tan et al., 2001). NCEDs are involved in ABA
biosynthesis and as such are not ideal targets for genetic improvement of pVA content due to
the potential for abnormal phenotypes (Fray et al., 1995). The function of NCEDs in relation
to ABA metabolism has been reviewed elsewhere (Schwartz et al., 2001; Tan et al., 2001).
The first member of the ccd gene family, ccd1, was characterised in Arabidopsis and
appeared to function as a dimer that simultaneously cleaves both ends of its carotenoid
substrates, which include ß-carotene, zeaxanthin and lutein (Schwartz et al., 2001). In
tomato, CCD1 was also shown to cleave β-carotene precursors such as the monocyclic δ-
carotene as well as the linear substrates phytoene, ζ-carotene and lycopene Simkin et al.,
2004. This enzyme has also been characterised in other plants including crocus (Bouvier et
al., 2003), grape (Mathieu et al., 2005) and melon (Ibdah et al., 2006). The various CCD1
cleavage products are volatile compounds involved in fruit maturation and flavour, microbial
symbiosis and pathogen resistance, and light induced development of growing seedlings
10
(Mathieu et al., 2005; Simkin et al., 2004; Schwartz et al., 2001). ccd1 is part of a gene
family that also includes ccd4, ccd7 and ccd8 and is distinct from the carotenoid cleavage
enzymes involved in ABA synthesis (Tan et al., 2003).
1.3.3 Regulation of carotenoid metabolism Regulation of carotenoid metabolism occurs on multiple levels. Some major regulators of
carotenoid metabolism include environmental factors such as ethylene production and light,
which act through transcriptional and post-transcriptional mechanisms. Fruit ripening
requires the coordinated expression of a variety of genes whose products facilitate the
various fruit maturation processes, and ethylene biosynthesis plays a critical role in the
regulation of such genes in climacteric fruit such as tomato (Moore et al., 2002).
The effects of ethylene on the mRNA levels transcribed from the psy, pds and zds genes and
their impact on phytoene, phytofluene and β-carotene accumulation were profiled in two
cultivars of apricot, Moniqui and Goldrich, that produce white and orange fruit, respectively
(Marty et al., 2005). Expression profiles of these genes prior to ethylene-induced ripening
were similar in both cultivars and correlated positively with increasing accumulation of
phytoene, phytofluene and β-carotene. However, accumulation of these mRNAs and
ethylene production was significantly greater in the white Moniqui fruit compared to
Goldrich fruit, although in contrast, accumulation of phytoene and phytofluene was 2 fold
higher in Goldrich fruit. Ethylene treatment of fruit from both cultivars doubled phytoene
and phytofluene production and dramatically increased psy and pds expression. However,
both β-carotene accumulation and zds expression were unaffected by ethylene treatment. The
results showed that ethylene production regulated the production of the colourless
carotenoids phytoene and phytofluene but not downstream β-carotene levels, suggesting that
lycopene accumulation and lcyb expression are ethylene independent (Marty et al., 2005).
Plant carotenoid biosynthesis is also known to be affected by light through the interactions of
phytochromes with red and far-red light. The conformation of these proteins depends on the
nature of the light they receive, and the modulation of plant maturation is activated by red
light stimulation (Quail, 2002). Exposure to red-light was also found to increase total
carotenoid accumulation by about 50% without altering total carotenoid composition in
ripening tomato fruit (Schofield and Paliyath, 2005). Moreover, the catalytic activity of PSY
was boosted by 40% and these effects were reversible upon exposure to far-red light. These
results suggested that the observed increases in carotenoid metabolism were due to a
phytochrome-mediated effect that occurred prior to peak PSY activity and mediated by

11
translational or post-translational factors. The Arabidopsis psy promoter has been
characterised and found to be regulated by light (Welsch et al., 2003), and this is discussed
further in Chapter 5.
Carotenoid composition fluctuates during fruit development. This has been studied in a
number of fruit including citrus (Kato et al., 2004) and apricots (Marty et al., 2005) and
extensive studies have been undertaken in tomato, a model system in which the regulation of
carotenoid composition during fruit development has been well characterised (Fraser et al.,
1994; Giuliano et al., 1993; Giovannoni, 2004). In one study, psy mRNA was 18 and 52 fold
greater than that of pds at the breaker (ripening triggered) and firm red (ripening complete)
stages, respectively (Figure 1.4a; Giuliano et al., 1993). In a subsequent study, the highest
carotenoid concentration was reported to occur in ripened fruit (Figure 1.4b) while green
fruit exhibited the highest activity of PSY, PDS and LCYB enzymes (Figure 1.4c; Fraser et
al., 1994). The psy and pds mRNA levels were also quantified and transcripts were only
detected in breaker and post-breaker fruit, supporting previous observations by Giuliano et
al. (1993). In addition, PSY activity at the immature green stage was approx 10 and 20 fold
greater than PDS and LCYB, respectively (Fraser et al., 1994). These studies demonstrate
that the coordinated transcriptional regulation of carotenoid biosynthetic genes is a
significant contributor to carotenoid accumulation during fruit development. The observed
differential expression of psy and pds (Giuliano et al., 1993; Fraser et al., 1994) has led to
the widely accepted hypothesis that this phenomenon is the predominant determinant of
lycopene accumulation in tomato (Corona et al., 1996; Hirschberg, 2001; Ronen et al.,
1999). The importance of transcriptional control in carotenoid biosynthesis was observed in
the study of lcyb and lcye, which were found to have the same relative mRNA abundance as
psy and pds at the immature green stage (Ronen et al., 1999). However, during the transition
to breaker fruit, lcyb and lcye mRNA decreased despite increasing expression of psy and pds.
This suggested that lycopene accumulation in ripening tomato was due to down regulation of
the genes that converted it to β-carotene. Further, the transcriptional control of multiple gene
families appears to be significant in tissue-specific carotenoid accumulation during
development. This hypothesis was supported by the detection of PSY proteins of different
sizes in chloroplasts and chromoplasts (Fraser et al., 1994) and the discovery of the leaf-
associated psy2 gene in tomato (Bartley and Scolnik, 1993).

12
Figure 1.4: Analysis of carotenoid accumulation in tomato fruit. a) Accumulation of psy and pds mRNA over the first four stages of tomato fruit ripening [adapted from Giuliano et al. (1993)]. b) Changes in total carotenoid, carotene and chlorophyll content and c) carotenoid biosynthetic enzyme activity during the five stages of tomato fruit ripening [adapted from Fraser et al., 1994]. Stages of fruit ripening: immature green and mature green - 2 weeks and 7 weeks post-fertilisation, respectively; breaker - marked by the first transition of fruit colour; firm red - 7 days post breaker (dpb); overripe - about 14 dpb (Fraser et al., 1994; Lu et al., 2001).
13
Carotenoids accumulate in the plastids where they are synthesised (Sinha, 2004).
Chromoplasts store carotenoids in a number of ways including: crystals, oil bodies, lipid
binding proteins, and membrane structures (Paine et al., 2005; Vishnevetsky et al., 1999).
Significant work in this area has been done in the study of cauliflower Or mutants, which
exhibited altered colour of the cauliflower curd due to β-carotene accumulation caused by a
dominant single gene called the Or gene. Molecular analysis revealed no significant
alterations in isoprenoid and carotenoid biosynthesis, and no linkage between carotenoid
biosynthetic genes and the Or locus. This lead to the hypothesis that the Or gene, may
promote carotenoid accumulation through the creation of sheet-like structures that
accumulated β-carotene (Li et al., 2001). In subsequent studies, a detailed linkage map was
constructed and markers associated with the Or gene locus were identified (Li and Garvin,
2003; Li et al., 2003). Characterisation of this gene found that it encoded a protein that
affects chromoplast formation and division (Lu et al., 2006), and was capable of enhancing
carotenoid production in tomato tubers (Lopez et al., 2008a).
1.4 Phytoene synthase 1.4.1 Properties of psy PSY is considered to be a major rate limiting step in carotenoid biosynthesis because it
irreversibly channels GGDP towards carotenoid production and away from the production of
many isoprenoids such as chlorophylls, tocopherols, gibberellins and quinones (Cunningham
and Gantt, 1998). Consequently, PSY occupies a metabolic junction between multiple
pathways and its activity may have a broad influence on isoprenoid production in plants. The
importance of this enzyme makes it the logical starting point for investigating differential
carotenoid accumulation in bananas.
The genes encoding PSY in higher plants, in many cases, have been found to exist as gene
families with multiple members. While only one psy gene has been identified from
Arabidopsis (Scolnik and Bartley, 1994) and daffodil (Schledz et al., 1996), two distinct psy
genes have been identified in plants such as tomato (Bartley et al., 1992; Bartley and
Scolnik, 1993), tobacco (Busch et al., 2002), maize, rice (Gallagher et al., 2004), and wheat
(Cenci et al., 2004; Pozniak et al., 2007). Plant species with more than two psy genes may
also exist. For example, the yellow gentian (Gentiana lutea) psy gene family (Zhu et al.,
2002) consists of four genes: psy1, psy2, psy3 and psy4 (GenBank accession numbers
E15680, E15681, E15682 and E15683, respectively). Further, a third member of the maize
and rice psy families, psy3, was recently identified (Li et al., 2008a; Li et al., 2008b). The
complete gDNA sequence of a wheat psy1 gene (psy-A1) was shown to be 4175 bp long and
included six exons and five introns with an coding region of 1,284 bp (He et al., 2008),

14
which was consistent with previous observations in maize and rice (Gallagher et al., 2004).
The PSY protein appears to be monomeric (Dogbo et al., 1988) and is thought to interact
with plastid membranes and other enzymes in carotenoid biosynthetic complexes (Chapter
1.3.1; Cunningham and Gantt, 1998). Analysis of Arabidopsis PSY, and the tomato PSY1
and PSY2 proteins (Figure 1.5) suggests that the plant PSY proteins include an N-terminal
signal peptide that is subsequently cleaved (Bartley et al., 1992; Bartley and Scolnik, 1993;
Scolnik and Bartley, 1994). The mature protein has a single large prenyltransferase
(Cunningham and Gantt, 1998) catalytic domain belonging to the trans-isoprenyl
diphosphate synthases, head-to-head (1'-1) condensation reaction (Trans_IPPS_HH) family
(NCBI CDD No. cd00683).
Protein Length Structure GenBank ID
Arabidopsis
thaliana PSY1 422
NP_001031895
Tomato PSY12 411
ABU40772
Tomato PSY23 438
ABU40771
Figure 1.5: General structure of plant PSY proteins showing the signal peptides, catalytic domains and lengths of Arabidopsis PSY, tomato PSY1 and tomato PSY2. The lengths (black text) of the signal peptides (grey rectangle) was based on estimates by Scolnik and Bartley (1994)1, Bartley et al. (1992)2 and Bartley and Scolnik (1993)3. The catalytic domains (Trans_IPPS_HH; black hexagon) are indicated on each protein along with the positions of the first and second aspartic acid rich motifs (ARM1 and ARM2); the lengths (white text) of the mature proteins were obtained from the listed GenBank protein entries. All lengths are measured in amino acids.
Transcription of the psy genes has been reported in both leaf and fruit tissue of tomato
(Bartley and Scolnik, 1993), with psy1 expression associated with chromoplast-bearing
tissues (fruit and petals) while psy2 was more constitutively expressed (Giorio et al., 2008).
Semi-quantitative RT-PCR analysis of psy1 and psy2 expression in maize varieties with
yellow endosperm (high carotenoid) or white endosperm (low carotenoid) colour implicated
psy1 in endosperm carotenoid accumulation. In leaf tissue of both maize varieties the psy1
and psy2 expression was similar. However, psy1 expression was higher than psy2 in yellow
200 amino acids
268
ARM1 ARM2
145
121 268
ARM1 ARM2
132 268
ARM1 ARM2

15
endosperm maize, while only psy2 was expressed in white endosperm maize. The psy
expression in the leaf and endosperm of rice (white endosperm) was identical to that of white
endosperm maize (Gallagher et al., 2004). The recently identified psy3 gene is thought to be
involved in ABA-mediated stress tolerance in the roots of grasses such as maize and rice (Li
et al., 2008a).
Expression of psy during fruit development was influenced by ethylene production in apricot
(Marty et al., 2005), while in Arabidopsis, psy expression and enzymatic activity was shown
to be regulated by light through phytochrome activity, and increased carotenoid content was
only seen under light conditions that triggered chlorophyll synthesis (von Lintig et al., 1997;
Welsch et al., 2000). Characterisation of the Arabidopsis thaliana psy promoter identified
DNA regulatory motifs activated by different light conditions (Welsch et al., 2003).
Responses to red light were under the specific control of two adjacent G-box like elements
roughly 200 bp upstream of the transcription start site. In contrast, constitutive promoter
expression was linked to a pair of ATCTA motifs located approximately 840 bp from the
transcription start site (Welsch et al., 2003) and this motif was thought to coordinate the
expression of genes involved in photosynthesis, and also carotenoid and tocopherol
metabolism (Welsch et al., 2003).
1.4.2 The psy gene as a target for pVA enhancement The extensive knowledge of carotenoid metabolism in model systems has identified multiple
targets for improvement of pVA content in nutritionally important crops. Considerable work
has been undertaken towards the genetic manipulation of carotenoid biosynthesis in a
number of plant systems and this area has been reviewed extensively (Sandmann, 2001a;
Sandmann, 2001b; Taylor and Ramsay, 2005; Zimmermann and Hurrell, 2002). Significant
work in enhancing pVA content in transgenic plants has been achieved through genetic
manipulation of psy expression in tomato and rice.
Tomato is a commercially important crop known to naturally accumulate significant
quantities of carotenoids, and has been used as a model to study the enhancement of
carotenoid levels (Giuliano et al., 1993; Fraser et al., 1994). Early work involved the
constitutive over-expression of the tomato psy1 gene driven by the CaMV35S promoter
(Fray et al., 1995). Abnormal carotenoid accumulation was observed in numerous organs
including the seed coat, immature fruit and abscission zones. Although lycopene and
phytoene content was enhanced, the yields of β-carotene, total carotenoids and chlorophyll
were unaffected. Interestingly, increased psy1 mRNA levels produced dose dependent
dwarfism in transgenic plants, due to a 30 fold reduction in gibberellin production that was

16
attributed to GGPP depletion. From this work it was apparent that constitutive carotenoid
biosynthetic gene over-expression was inappropriate for genetic improvement of pVA
content. Later, fruit-specific psy expression was achieved using the Erwinia crtB gene,
encoding a PSY enzyme, which was chromoplast targeted using the tomato psy1 transit
peptide and regulated by the tomato polygalacturonase promoter (Fraser et al., 2002). As a
result, the concentrations of β-carotene, phytoene and lycopene increased by roughly two
fold and total fruit carotenoid content was improved by between 200% and 400% without
detriment to other isoprenoid pathways. β-carotene content of up to 200 µg/g dry weight was
reported.
The psy gene has also been used in the improvement of pVA content of rice endosperm.
Genetically modified Golden Rice, with elevated endosperm pVA levels, represents one of
the first concerted efforts to alleviate VAD through genetic engineering of a staple crop.
Endosperm, the edible portion of the rice grain (Grusak, 2005), expresses ggps but not the
enzymes required for conversion of GGPP into carotenoids, although these genes are present
and expressed in other organs such as the leaf. Early work used Agrobacterium-mediated
transformation to introduce the daffodil psy and crtI (a desaturase from Erwinia uredovora
that has the function of both pds and zds) genes into rice endosperm in a single binary vector
(Hoa et al., 2003; Ye et al., 2000). The expression of psy was driven by the rice endosperm
glutelin (gt1) promoter and localised using its transit peptide, while crtI was constitutively
expressed by the CaMV35S promoter and endosperm targeted using the pea RuBisCO small
subunit signal peptide. These studies demonstrated that endogenous lcyb activity was
sufficient to produce β-carotene upon addition of psy and the desaturase enzymes alone.
However, the β-carotene yield of carotenogenic seeds, identified by their yellow colour, was
only between 0.8 μg/g and 1.6 μg/g dry weight (Hoa et al., 2003; Ye et al., 2000).
Recent work succeeded in drastically improving the pVA content of rice and was conducted
in three phases (Paine et al., 2005). The activity of several psy genes from plants such as
carrot, daffodil, maize and rice was compared by stably transforming them into maize callus
and assessing the carotenoid content. The maize psy gene demonstrated the highest activity
followed by the rice and carrot genes, respectively, which were each approximately 50% as
active as maize psy. The daffodil psy gene was least active, consistent with the hypothesis
that this gene was the limiting factor in pVA accumulation in the previous generation of
Golden Rice. Selected psy genes were then used to create transgenic rice lines, using single
expression cassettes containing a plastid targeted psy gene and a crtI gene (Ye et al., 2000).
Both were controlled by the rice gt1 promoter with a catalase intron (Paine et al., 2005).
Selected transgenic rice lines exhibited yellow and even orange grain phenotypes that were

17
otherwise normal. The best performing genes were maize and rice psy, yielding 14 μg g-1 and
18 μg g-1 total carotenoids respectively with 80 to 90% β-carotene content compared with the
low 1.2 μg g-1 carotenoid yield of daffodil psy (Hoa et al., 2003; Paine et al., 2005).
Interestingly, maize and rice psy genes had highest sequence similarity of 89% (Paine et al.,
2005), possibly explaining their high productivity as both gene sources are gramminaceous
monocotyledonous plants. The last experiment involved the creation of a transgenic rice line,
Golden Rice 2, using a construct expressing maize psy and crtI, both regulated by an
intronless gt1 promoter (Paine et al., 2005). This produced a rice line yielding 37 μg g-1 total
endosperm carotenoid that accumulated 85% β-carotene, exceeding previously reported
yields by 23 fold (Hoa et al., 2003; Ye et al., 2000). The authors hypothesised that the maize
psy worked well due to the optimal nature of the rice endosperm environment and that
despite this, PSY still limits further carotenoid yield (Paine et al., 2005).
1.5 Objectives of the program of research and investigation Following the development of Golden Rice, genetic engineering of staple banana cultivars to
enhance pVA content is being undertaken in an attempt to combat VAD in regions where
rice is not readily grown or consumed. At the start of this project little was known about
carotenoid metabolism in banana, the sequences of the genes in the pathway or why the
carotenoid content of fruit varies so much. A better understanding of the mechanisms
enabling high pVA accumulation in banana varieties could prove valuable in the
development of bananas with enhanced carotenoid content. Although there are many levels
at which carotenoid biosynthesis can be regulated, there is considerable evidence that PSY
plays a critical role directly linked to the capacity for pVA accumulation in a number of
systems. Quantitative Trait Loci (QTL) analyses have demonstrated a putative association
between the psy1 locus and carotenoid content in maize (Wong et al., 2004; Chander et al.,
2008) and with increased endosperm colour in durum wheat (Triticum turgidum var. durum;
Pozniak et al., 2007). This role is further supported by the results of genetically engineered
tomato (Fraser et al., 2002) and rice (Paine et al., 2005) where overexpression of psy
significantly increased pVA accumulation. Cumulatively, these studies demonstrate that PSY
activity is an important rate limiting step in carotenoid biosynthesis, which is of great
significance as the activity of this enzyme is the first irreversible step in this process
(Cunningham and Gantt, 1998).
Therefore, the overall aim of this project was to investigate the role of PSY, at the level of
protein function and gene expression, in the differential production of pVA carotenoids in
bananas with both high and low pVA content. This was achieved by:

18
i) isolation and characterisation of psy nucleotide sequences from high and low pVA
bananas
ii) analysis of banana PSY proteins using bioinformatics and expression in rice callus
iii) comparison of the activity of banana psy gene promoters using reporter gene assays
iv) investigation of psy mRNA levels in different tissues from high and low pVA bananas
19
Chapter 2: General methods 2.1 General methods for nucleic acid purification from plant cells 2.1.1 Purification of total RNA from banana tissue Total RNA was obtained using the CTAB extraction method (Chang et al., 1993) modified
to include the CTAB RNA extraction buffer and polysaccharide removal procedure
described by Asif et al. (2000). Essentially, plant tissue was ground in LN2 and incubated
with RNA extraction buffer (10 mL/g tissue) at 65 °C for 60 min. The mixture was extracted
twice with chloroform and total RNA precipitated with 1/3 volume of 10 M LiCl to the
supernatant at 4 °C overnight. Total RNA was recovered by centrifugation at 17,000 × g for
20 min at 4 °C. The pellet was resuspended in DEPC-treated mqH2O (100 µL per gram of
starting plant material) and extracted again with an equal volume of chloroform.
Polysaccharides were precipitated with 1/30 volume of 3 M sodium acetate (pH 5.2) and 0.1
volume of 100% ethanol on ice for 30 min and removed by centrifugation at 10,000 × g for
25 min at 4 °C. RNA was precipitated from the supernatant with 1/10 volume of 3 M sodium
acetate (pH 5.2) and 3 volumes of 100% ethanol at –80 °C overnight and recovered by
centrifugation at 10,000 × g for 20 min at 4 °C. The pellet was washed with 70% ethanol,
dried under vacuum and resuspended in DEPC-treated mqH2O as previously described. Total
RNA was either used immediately or stored at –80 °C with or without prior DNase
treatment.
2.1.2 mRNA purification Banana mRNA was purified from total RNA (100 to 500 µg) using the GenEluteTM mRNA
Miniprep Kit (Sigma-Aldrich) according to the manufacturer’s instructions.
2.1.3 DNA extraction Banana leaf tissue (1 g) was ground in LN2, added to 3 mL pre-warmed (65 oC) DNA
extraction buffer (2% w/v CTAB; 2% w/v PVP; 100 mM Tris HCl, pH 8.0; 25 mM EDTA; 2
M NaCl; 1.4% v/v 2-mercaptoethanol) and incubated for 60 min at 65 °C with occasional
mixing. Plant material was removed by centrifugation at 3880 × g for 10 min at room
temperature and the supernatant extracted twice with an equal volume of chloroform under
the same conditions. The aqueous phase was collected and 10 µL RNase A (1 mg/mL) was
added before incubation at 37 °C for 60 min. The sample was extracted again with
chloroform before precipitation of the DNA with an equal volume of isopropanol at –80 °C
for 30 min. The DNA was collected by centrifugation at 3880 × g for 20 min at room
20
temperature and the pellet washed with 70% ethanol. The DNA pellet was dried under
vacuum and resuspended in 50 µL mqH2O. The yield and quality of the DNA were assessed
by spectrophotometry and agarose gel electrophoresis and either used immediately or stored
at –20 °C.
When DNA of higher purity was required, the DNeasy Plant Mini Kit (Qiagen) was used.
Banana leaf tissue (0.1 g) was ground in LN2 and the DNA extracted as recommended by the
manufacturer.
2.2 General methods in nucleic acid amplification, cloning and sequencing
2.2.1 PCR amplification For all PCRs, thin walled 0.2 mL tubes were used to amplify products in a DNAEngine®
thermocycler (Bio-Rad). Annealing temperatures were dependant on primers and are
specified in individual chapters.
Standard DNA Amplification
PCR products were amplified from DNA template (~0.3 to 1 µg) using either Taq DNA
Polymerase (Roche Applied Science) or the GoTaq® Green Master Mix (Promega). Taq
DNA Polymerase reactions included 1× PCR buffer, 300 μM dNTP Mix (Roche Applied
Science), 7.5 pmol of each PCR primer, 1 U Taq DNA polymerase, and mqH2O to a final
volume of 25 µL. GoTaq Green® (Promega) PCRs included 1× GoTaq green master mix, 7.5
pmol of each primer, and mqH20 to a total volume of 20 µL. Templates were initially
denatured at 94 °C for 3 min followed by 35 cycles of denaturation at 94 ºC for 10 sec,
annealing for 30 sec and extension at 72 °C for 1 min per Kb of expected product. A final
extension step of 72 °C for 10 min was included.
Long Template Amplification
Amplification of long DNA templates was achieved using the Expand™ Long Template
PCR System (Roche Applied Science) as recommended by the manufacturer. The final
reaction mix consisted of 500 µM dNTP mix, 3.75 pmol of each primer, 0.5 µL Expand
Long Template Enzyme mix, 1× Expand PCR buffer 3, DNA template (~0.3 to 1 µg) and
mqH2O to a final volume of 25 µL. PCR conditions included an initial denaturation cycle of
94 °C for 3 min prior to 10 cycles of denaturation at 94 ºC for 10 sec, annealing for 30 sec
and extension at 68 °C for 1 min per Kb of expected product. This was followed by an
additional identical 25 cycles with 10 sec added to each successive extension step. A final
extension at 68 °C for 7 min was included.

21
RT-PCR
RNA template (amounts specified in each chapter) was used as template in RT-PCR using
the Titan One Tube RT-PCR System (Roche Applied Science) as per the manufacturer’s
instructions. The final reaction contained 200 µM dNTP mix, 5 mM DTT, 5 pmol of each
primer, 5 U Protector RNase Inhibitor (Roche Applied Science), 0.5 µL Titan Enzyme mix,
1× RT-PCR buffer, and mqH2O to a final volume of 25 µL. A single cycle of 50 °C for 30
min was included for cDNA synthesis and preceded PCR amplification. The reactions were
denatured once at 94 °C for 2 min prior to 10 cycles of denaturation at 94 ºC for 10 sec,
annealing for 30 sec and extension at 68 °C for 1 min per Kb of expected product. This was
followed by 25 cycles of 94 ºC for 10 sec, annealing for 30 sec and 68 °C for 1 min per Kb
of expected product with 5 sec added to each successive cycle. A final extension step of 68
°C for 7 min was included.
2.2.2 Restriction enzyme digestion of DNA Up to 1 μg of plasmid DNA (pDNA) or plant gDNA was incubated with 10 U of the
appropriate restriction enzyme (Roche Applied Sciences) in compatible 1× reaction buffer at
37 °C for 1 to 16 hr.
2.2.3 Agarose gel electrophoresis Unless otherwise specified, DNA fragments from PCR or restriction digestion analysis were
mixed with 1× Agarose gel loading dye (0.04% bromophenol blue; 1.7 mM Tris-HCl, pH
8.0; 0.17 mM EDTA; 0.08% glycerol) and separated for 30 min in 1% agarose gels made
with 1× TAE buffer (10 mM Tris-acetate; 0.5 mM EDTA, pH 7.8) containing 0.25× SYBR®
Safe DNA Gel Stain (Invitrogen) at 4 V/cm on a B1 or B2 EasyCast Mini Gel System (Owl
Separation Systems). Nucleic acids were visualized on a Safe Imager blue light
transilluminator (Invitrogen) and images recorded using a G-Box (Syngene) gel
documentation system with GeneSnap v6.07 and GeneTools v3.07 software.
2.2.4 Purification of DNA from agarose gels Bands were excised from agarose gels and the DNA purified using the Mobio UltraClean
GelSpin DNA Purification Kit (Mobio Laboratories inc.) according to the manufacturer’s
instructions. All purified DNA was eluted in a final volume of 20 μL of 10 mM Tris-HCl.

22
2.2.5 DNA ligation Gel purified PCR products (3 µL) were ligated to 50 ng of T-tailed pGEM-T Easy (Promega)
vector, as recommended by the manufacturer, in 10 µL reactions containing 1 U T4 DNA
Ligase (Promega) and 1× Rapid Ligation Buffer for up to 16 hr at 4 °C. For all other
ligations, the vector and insert DNA were linearised by restriction enzyme digestion and
ligated in a 3:1 molar ratio (insert: vector) as described above.
2.2.6 Transformation of Escherichia coli with recombinant plasmids Recombinant plasmids were transformed as previously described (Inoue et al., 1990) into
chemically competent Escherichia coli strain XL1-Blue (Stratagene) obtained from Don
Catchpoole (QUT). Chemically competent cells (50 µl) were mixed with 5 µl pDNA and
incubated on ice for 30 min before heat shock at 42 °C for 45 sec. The cells were then
incubated on ice for 2 min and then allowed to recover in 450 µl of SOC liquid medium (2%
w/v bacto-tryptone; 0.5% w/v bacto-yeast extract; 10 mM NaCl; 2.5 mM KCl; 0.94 M
MgCl2.6H20; 0.94 M MgSO4
.7H20; 20 mM glucose) for 1 hr at 37 °C. Transformed colonies
were grown overnight at 37 °C on Luria-Bertani (LB) media (1% w/v bacto-tryptone; 0.5%
w/v bacto-yeast extract; 170 mM sodium chloride) solidified with 1.5% w/v bacto-agar and
containing 100 µg/µl Ampicillin (unless otherwise specified). For blue/white selection, 250
μL 2% (w/v) X-gal and 500 µL 0.1 M IPTG were added per mL of LB solid medium.
2.2.7 Growth of bacteria in liquid cultures Liquid cultures of E. coli were grown by inoculating single bacterial colonies into LB media
and incubating overnight at 37 °C and 220 rpm. The culture volume depended upon the
quantity of bacteria required for subsequent pDNA purification.
2.2.8 Purification of plasmid DNA For most purposes, a standard alkaline lysis procedure (Sambrook and Russell, 2001) was
used for isolation of pDNA from 1.5 mL E. coli cultures except that RNase A (~20µg) was
added during the initial lysis step. The pDNA was resuspended in 50 µL mqH2O. For
sequencing, pDNA was isolated using an UltraClean 6 Minute Mini Plasmid Prep Kit
(Mobio Laboratories inc.), while for large scale plasmid purification (20 mL E. coli cultures)
a Genopure Plasmid Midi Kit (Roche Applied Science) was used, both according to the
manufacturer’s instructions. The quality and quantity of pDNA was assessed by agarose gel
electrophoresis and UV spectrophotometry.

23
2.2.9 Storage of bacterial cultures Bacteria were stored at –80 °C as 1 mL glycerol cultures, prepared by mixing 500 µL
overnight culture and 500 µL sterile 80% glycerol in cryovials and snap-freezing in LN2.
2.2.10 DNA sequencing Plasmids were prepared for sequencing using the ABI Prism BigDye 3.1 Terminator
(Applied Biosystems) system. The reaction mixtures (20 µL) consisted of up to 500 ng
pDNA, 1× Big Dye Terminator Buffer, 1 µL Big Dye Terminator v3.1 Enzyme Mix
(Applied Biosystems) and 3.2 pmol primer [either M13 forward (5’-
GTAAAACGACGGCCAGT-3’) or reverse (5’- CACACAGGAAACAGCTATGACCATG-
3’) universal sequencing primers or specific primers]. Sequence reactions were cycled in a
DNAEngine® thermocycler (Bio-Rad) with an initial denaturation step of 94 °C for 3 min
followed by 35 cycles of 94 ºC for 10 sec, 60 ºC for 30 sec and 72 °C for 1 min per Kb of
expected product with 10 sec added to each successive cycle. A final extension step of 72 °C
for 10 min was included.
Sequencing reactions were purified by precipitation with 2 µL 125 mM EDTA, 2 µL 3 M
sodium acetate and 50 µL 100% ethanol for 30 min at room temperature. Pellets were
collected by centrifugation at 10,000 × g for 15 min at room temperature, washed with 70%
ethanol and dried under vacuum. Samples were analysed at Griffith University DNA
Sequencing Facility (GUDSF) by capillary separation on a 3710xl DNA Analyser (Applied
Biosystems).

24
2.3 Plant tissue culture media
The composition of all media used for plant tissue culture throughout this study is shown in
Table 2.1.
Table 2.1: Composition of plant tissue culture (PTC) media used in this study
Media Components
2N6 Media1 3% sucrose; 0.1% casein hydrolysate; 0.5 g/L proline; 0.5 g/L glutamine; 1×
N6 Macronutrient solution; 1× N6 Micronutrient solution; 0.1 mM
FeS04.7H20; 0.1 mM Na2EDTA; 1× N6 Vitamins; 10 mg/mL 2,4-D; 0.25%
phytagel, pH 5.8
1× N6 Macronutrient
solution1
28 mM KNO3; 3.5 mM (NH4)2S04; 2.9 mM KH2PO4; 0.75 mM
MgS04.7H2O; 1.13 mM CaCl2.2H2O
1× N6 Micronutrient
solution1
19.7 mM MnS04.4H20; 25.9 mM H3BO3; 5.2 mM ZnS04.7H20; 4.8 mM KI
1× N6 Vitamins1 555 μM myo-inositol; 26.6 μM glycine; 3.0 μM thiamine-HCl; 4.0 μM
nicotinic acid; 2.4 μM pyridoxine-HCl
AAM media3 AA salts and amino acids5; 1× MS vitamins4; 500 mg/L casein hydrolysate;
68.5 g/L sucrose; 36 g/L glucose; 100 μM acetosyringone; pH 5.2
BL2 1/2× MS Macronutrients4; 1× MS Micronutrients4; 0.4 mg/L thiamine; 0.5
mg/L nicotinic acid; 0.5 mg/L pyridoxine; 2.0 mg/L glycine; 10 mg/L
ascorbic acid; 1.1 mg/L 2,4-D; 0.25 mg/L zeatin; 20 g/L sucrose; pH 5.7
BRM2 1/10× MS Macronutrients4; 1/10× MS Micronutrients4; 1× MS vitamins4; 0.4
g/L cysteine; 9.0 mg/L thiamine; 36 g/L glucose; 68.5 g/L sucrose; 100 μM
acetosyringone; pH 5.2
CCM2 1/10× MS Macronutrients4; 1/10× MS Micronutrients4; 1× MS vitamins4; 0.4
g/L cysteine; 0.1 g/L glutamine; 0.1 g/L malt extract; 1.0 mg/L biotin; 10
g/L PVP; 10 mg/L ascorbic acid; 300 mg/L proline; 0.5 mg/L 2,4-D; 0.5
mg/L kinetin; 2.5 mg/L NAA; 30 g/L sucrose; 30 g/L maltose; 10 g/L
glucose; 200 μM acetosyringone; 7.0 g/L agar; pH 5.3
Yeast-Mannitol
(YM)2
0.4 g/L yeast extract; 55 mM mannitol; 2.8 mM K2HPO4; 800 μM
MgSO4.7H2O; 1.7 mM NaCl; pH 7.0
YM Solid media YM with 7 g/L bacto agar
1 CAMBIA (2009); 2 Khanna et al. (2004); 3 Hiei et al. (1994); 4 Murashige and Skoog (1962); 5 Toriyama and Hinata (1985)

25
Chapter 3: Isolation and characterisation of phytoene synthase sequences from banana 3.1 Introduction Banana is a diverse group of plants with over a 1000 varieties that are morphologically
variable and spread over a vast geographical area (Ammar-Khodja 2000). Four genome types
(A, B, S, and T) have been identified in banana (Pillay et al., 2004), and the A and B
genomes are found in most cultivated bananas, such as Cavendish (AAA) and Ladyfinger
(AAB). Conversely, the genotypes of few Polynesian Fe’i bananas, associated with the T-
genome, have been characterised (Daniells et al., 2001). However, the genotype of the Fe’i
banana cultivar, Asupina, from Papua New Guinea is thought to be ATT (Sharrock and
Frison, 1998). The pVA content in the edible portion of banana fruit varies among the
different cultivars, and fruit colour ranges from yellow to dark orange (Englberger et al.,
2003b). However, the relationship between colour and genotype is not clear. Cultivars such
as Asupina (Fe’i genome) and Lakatan (AA) have significantly higher pVA levels than
bananas such as Cavendish (AAA; Englberger et al., 2006).
The activity of the psy gene is a critical determinant of carotenoid accumulation as the
production of phytoene leads irreversibly to carotenoid production (Cunningham and Gantt,
1998). Consequently, the psy gene has been the subject of extensive studies and has been
isolated from various plants including the agronomically important tomato (Bartley et al.,
1992), maize (Palaisa et al., 2003), rice (Paine et al., 2005) and wheat (He et al., 2008)
crops. These studies support the theory that activity of this gene has a direct impact on
carotenoid accumulation. As previously described (Chapter 1.4.1), the number of psy genes
found in higher plants varies from one [e.g. Arabidopsis (Scolnik and Bartley, 1994);
daffodil (Schledz et al., 1996)] to as many as four [e.g. Gentiana lutea (Zhu et al., 2002)].
At least two distinct psy genes have been identified in tomato (Bartley et al., 1992; Bartley
and Scolnik, 1993), tobacco (Busch et al., 2002), maize (Gallagher et al., 2004), rice
(Gallagher et al., 2004) and wheat (Cenci et al., 2004; Pozniak et al., 2007) and the recent
characterisation of a third psy gene, psy3, (Li et al., 2008a; Li et al., 2008b) in maize and rice
suggests that additional genes may also be present in other plants. In some cases, psy appears
to be differentially expressed in plant tissues. In tomato, both psy genes function in leaf and
fruit tissue (Bartley and Scolnik, 1993), although psy1 has been predominantly associated
with chromoplast bearing tissue (fruit and petals; Giorio et al., 2008). Both psy1 and psy2

26
were expressed in yellow endosperm maize, although psy1 expression was higher (Gallagher
et al., 2004). Interestingly, only psy2 was expressed in white endosperm maize mutants,
although levels of both were similar in leaf tissue of both varieties. A similar expression
profile was reported in leaf and endosperm of rice.
There have been numerous studies in maize investigating carotenoid accumulation in the
endosperm. Sequence diversity of the psy1 gene at the y1 locus in yellow endosperm lines
was 19 fold less than that of white endosperm lines, while sequence diversity at the leaf-
associated psy2 locus was similar for lines of both colours (Palaisa et al., 2003). It was
suggested that these differences were due to selection at the y1 locus for the yellow
endosperm phenotype. Recent QTL analyses have also supported the association between the
psy1 locus and phenotypic variation in carotenoid content of maize endosperm (Chander et
al., 2008). Similar QTL analysis in wheat also suggested that the psy1 locus was associated
with increased endosperm carotenoid content (Pozniak et al., 2007). In wheat, which is
triploid and consists of A and B genomes, psy1 and psy2 map to chromosomes 7 and 5,
respectively (Cenci et al., 2004; Pozniak et al., 2007). Allelic variation of a co-dominant
marker associated with a psy1 gene (psy-A1) located on chromosome 7A in wheat accounted
for between 20% and 28% of the phenotypic variance for yellow carotenoid content (He et
al., 2008). A subsequent study investigating the genetic effects of psy1 allelic variation in
Chinese winter wheat and spring wheat cultivars identified a third psy-A1 allele and 5 alleles
for psy-B1 (chromosome 7B) and linked the psy-B1 locus to yellow carotenoid content (He
et al., 2009). Taken together, these studies show that the psy1 locus on chromosome 7 in
both A and B genomes affects carotenoid accumulation in wheat endosperm. Whether
similar associations between psy alleles and carotenoid accumulation occur in other plants,
including banana is still unknown.
Various genes have been isolated from banana, particularly those encoding enzymes
associated with fruit ripening such as polyphenol oxidases (Gooding et al., 2001) and pectate
lyases (Marin-Rodriguez et al., 2003). However, despite the importance of this crop, there
are no reports on characterisation of banana psy genes to date. This chapter describes the
cloning, sequencing and comparative analysis of mRNA and genomic sequences of psy
genes from selected high and low pVA banana cultivars to investigate their potential role in
carotenoid accumulation.

27
3.2 Materials and methods 3.2.1 Plant material Banana tissue and cultivars used in this investigation are listed in Table 3.1. The cultivars
were selected based on material availability, fruit β-carotene content and genome
composition. Leaf tissue for the five selected banana cultivars was obtained from tissue
cultured plantlets maintained by Jen Kleidon (QUT) and originally obtained from the
Queensland Department of Primary Industries (QDPI). Cavendish ripe fruit was purchased
from a local supermarket and ungassed green fruit was obtained from the Brisbane Markets.
A hand of Asupina fruit and field grown leaf tissue was obtained from Jeff Daniells (QDPI).
One fruit was sampled at an early green stage while the remaining fruit was allowed to ripen
before sampling. All plant material was stored at –80 °C prior to use.
Table 3.1: Properties of banana cultivars used in the current project including the genotype, available tissue and pVA content of banana fruit, expressed as β-carotene equivalents. β-carotene equivalents(a) were calculated as the sum of the total all-trans and cis β-carotene and half the α-carotene content (Englberger et al., 2006).
Banana
Cultivar Genotype
Fruit β-carotene
equivalents (μg/g)(a)
Available
Tissue
Asupina Fe’i 15.93 leaf / fruit
Cavendish AAA 1.34 leaf / fruit
Ladyfinger AAB 1.78 leaf
Lakatan AA 3.54 leaf
Wain Fe’i 5.32 leaf
3.2.2 Nucleic acid isolation from plant tissue Total RNA was isolated from 5 to 10 g of leaf or fruit tissue as described in Chapter 2.1.1
and total mRNA was purified as per Chapter 2.1.2. DNA was isolated from Asupina and
Cavendish leaf tissue using either the CTAB method or a DNeasy Plant Mini Kit (QIAGEN)
depending on the required purity (Chapter 2.1.3).
3.2.3 Oligonucleotide primers Oligonucleotide primers were obtained lyophilised from GeneWorks Pty Ltd and
resuspended in mqH2O to 1 µg/µL, or from Sigma-Proligo as a 100 µM solution. Stock
solutions were diluted to a working concentration of 10 µM before use. The sequences of
primers used in this chapter are given in Table 3.2.

28
Table 3.2: PCR primers used in the isolation of banana psy sequences
Primer name Sequence (5’-3’) orientationa Target sequence Restriction siteb
psy-F01 RTNTGGGCNATHTAYGTNTGGTG Forward Banana psy gene coding region None psy-R01 RAARTYRTARTCRTTNGCYTCDAT Reverse Banana psy gene coding region None 5’Adapter-Out GCTGATGGCGATGAATGAACACTG Forward 5’RACE adapter outer primer None 5’Adapter-In CGCGGATCCGAACACTGCGTTTGCTGGCTTTGATG Forward 5’RACE adapter inner primer None 3’Adapter-Out GCGAGCACAGAATTAATACGACT Reverse 3’RACE adapter outer primer None 3’Adapter-In CGCGGATCCGAATTAATACGACTCACTATAGG Reverse 3’RACE adapter inner primer None psy1-5’RACE-Out-01 CGACTTCTTCAAGTCCATTCTCATTCC Reverse Asupina and Cavendish psy1 None psy1-5’RACE-In-01 ATTCTCATTCCTTCGATCATGTCCCTG Reverse Asupina and Cavendish psy1 None psy2-5’RACE-Out01 TTGTACCTCGATTTCCGCAGGTC Reverse Asupina and Cavendish psy2 None psy2-5’RACE-In-01 TTCCGCAGGTCCATTCTCATTCC Reverse Asupina and Cavendish psy2 None psy1-3’RACE-Out-01 GCGGCAAGGTGACTGAGAAATGG Forward Asupina and Cavendish psy1 None psy1-3’RACE-In-01 AATGGAGGAGCTTCATGAAG Forward Asupina and Cavendish psy1 None psy2-3’RACE-Out01 CATTAGCTCTTGGCATCGCGAATC Forward Asupina and Cavendish psy2 None psy2-3’RACE-In-01 TCGCGAATCAACTCACCAACATAC Forward Asupina and Cavendish psy2 None AP1 GTAATACGACTCACTATAGGGC Forward Genome Walking Adapter None AP2 ACTATAGGGCACGCGTGGT forward Genome Walking Adapter None psy2-GW04 GTACGCCGCGTCGAGTAG Reverse Cavendish psy2a gene None psy2-GW05 CAAGTAGAAAGTCTTGGCATACTC Reverse Cavendish psy2a gene None psy2-GW06 CCTCCACCATCTCCTCTTCA Reverse Cavendish psy2a gene None psy2-GW07 AACTGGCTGAACCCAGAGCTC Reverse Cavendish psy2a gene None psy1-CR-F1 ggatccATGGCGTGCCTGTTGCTACGG Forward Asupina and Cavendish psy1 exon 1 BamHI Apsy1-CR-R1 tctagaTCATGTTTTAGCTAAACTTTGG Reverse Asupina psy1 3’Coding Region XbaI Cpsy1-CR-R1 tctagaTCATGTTTTTGCTAAGTTTGACTGGCTC Reverse Cavendish psy1 3’Coding Region XbaI Apsy2a-CR-F1 ggatccATGTCTGGCTCTATTGTTTGG Forward Asupina psy2a 5’Coding Region BamHI Apsy2a-CR-R1 tctagaTTATAGTGTTCCTGCAAATTTGG Reverse Asupina psy2a 3’Coding Region XbaI Cpsy2a-CR-F1 ccatggATGTCTGGCTCTGTTGTTTGGGTTGT Forward Cavendish psy2a Coding Region BamHI Cpsy2a-CR-R1 tctagaTTATAGTGTTCCTGCAAATCTTGAAGG Reverse Cavendish psy2a Coding Region Xba1 Cpsy2b-CR-R1 tctagaTTATGTCCTTGTTGCTCCTGTAAACC Reverse Cavendish psy2b Coding Region Xba1
(a) Primer orientation is indicated with respect to the mRNA sequence (b) Restriction enzyme sites are indicated in the primer sequence in lowercase

29
3.2.4 RT-PCR of partial psy coding region using degenerate primers Partial fragments of the psy coding region were amplified by RT-PCR from mRNA of
several banana varieties using degenerate forward and reverse primers, psy-F01 and psy-R01
(Table 3.2), designed to conserved regions shared by a number of plant PSYs (Table 3.3).
Total mRNA (1 to 5 µL, not quantitated as the concentration was too low for
spectrophotometry) isolated from Asupina, Cavendish, Ladyfinger, Lakatan and Wain leaf
tissue, and from Asupina and Cavendish fruit tissue, was used as template for RT-PCR using
the Titan One Tube RT-PCR System (Roche Applied Science) as described in Chapter 2.2.1,
with annealing temperature and extension time modified to 45 °C and 45 sec, respectively.
The PCRs were analysed on a 1% agarose gel and the products gel purified and cloned into
pGEM-T Easy (Chapter 2.2.3 to 2.2.8). Putative clones (10 to 12) were characterised by
EcoRI restriction enzyme digestion and sequencing (Chapter 2.2.2 and 2.2.10).
Table 3.3: Conserved regions of PSY proteins used to design degenerate primers. A multiple sequence alignment was generated using Clustal W2. The regions from which degenerate primers were designed are shown in bold. PSY source GenBank No. psy-F01 region psy-R01 region
rice (PSY1) AAS18307 RRRAIWAIYVWCRRT LDEIEANDYNNFTKR
maize (PSY1) NP_001108124.2 RRRAIWAIYVWCRRT LDEIEANDYNNFTKR
Arabidopsis NP_001031895 RRKAIWAIYVWCRRT LDEIEANDYNNFTKR
grapefruit AAD38051.2 RRRAIWAIYVWCRRT LDEIEANDYNNFTKR
orange AAF33237.1 RRRAIWAIYVWCRRT LDEIEANDYNNFTKR
melon CAA85775.1 RQKAIWAIYVWCRRT LDEIEANDYDNFTKR
tomato ABM45873 RRRAIWAIYVWCRRT LDEIEANDYNNFTKR
capsicum EU753855.1 RRKAIWAIYVWCRRT LDEIEANDYNNFTKR
wolfberry AAW88383 RRLAIWAIYVWCRRT LDEIEANDYNNFTKR
marigold AAM45379 RRKAIWAIYVWCRRT LDEIEANDYNNFTKR
sunflower AJ304825.1 RRKAIWAIYVWCRRT LDEIEANDYNHFTKR
daffodil CAA55391 RRRAIWAIYVWCRRT LDEIEANDYNNFTKR
maize (PSY2) NP_001108117.1 RRKAVWAIYVWCRRT LDAIEANDYNNFTKR
carrot BAA84763.1 RRRAVWAIYVWCRRT LDAIEANDYDNFTKR
3.2.5 Sequence analysis Eight to 12 clones representing the partial psy coding region amplified with degenerate
primers were sequenced at least once in both directions using the M13 universal sequencing
primers (Chapter 2.2.10). Sequencing data was analysed using the Seqman (Lasergene8)
DNA analysis program, which created consensus sequences by clustering individual clone
sequences into groups on the basis of an 80 – 95% minimum percentage identity. NCBI

30
nucleotide and protein BLAST tools were used to determine the identity of the consensus
sequences. Those positively identified as psy were further classified according to similarity
with psy sequences from monocots such as maize and rice in GenBank. Consensus
sequences not identified as psy were discarded. For phylogenetic analysis, partial banana psy
consensus sequences generated by Seqman were cropped to a 600 bp region (encoding 203
amino acids). The same was done for the maize B73 psy1 (GenBank No. AY324431) and
psy2 (GenBank No. AY325302) genes for comparison. The corresponding region of the
Dunaliella salina psy gene (GenBank No. AY601075; 624 bp) was included as an outgroup.
Clustal W2 v2.0.1.0 (Larkin et al., 2007) at the European Bioinformatics Institute server
(www.ebi.ac.uk) was used to produce sequence alignments and percentage identity
comparisons with the default parameters. Bootstrapped phylogenetic trees were produced
using Clustal X2 v2.0.6 (Larkin et al., 2007).
3.2.6 Isolation of banana psy mRNA sequences The FirstChoice® RLM-RACE kit (Ambion) was used to obtain the 5’ and 3’ ends of the
Asupina and Cavendish psy transcripts from leaf and fruit mRNA. RNA Ligase Mediated
Rapid Amplification of cDNA Ends (RLM-RACE) is optimised to preferentially amplify
products from full length mRNA templates and this strategy is outlined in Figure 3.1a.
Templates for 5’ RLM-RACE were prepared according to the manufacturer’s instructions for
the standard reaction. The amount of mRNA used for 5’ RLM-RACE template preparation
(2 to 5 µL) was based on previous observations of the efficiency of PCR amplification using
degenerate primers. The mRNA concentration could not be estimated by agarose gel
electrophoresis or spectrophotometry and other methods were unavailable. The 5’ RACE
adapter sequence is shown in Figure 3.1b and 0.3 µg was used in the ligation step (Figure 3.1
a). The 5’ RLM-RACE adapter ligated mRNA (2 µL) was converted into cDNA using
SuperScript® III reverse transcriptase (RT) according to the manufacturer’s instructions. The
RT reaction included 100 pmol random decamers (Ambion, supplied with the RLM-RACE
kit) and 40 U Protector RNase inhibitor (Roche Applied Science). SuperScript® III proved
more efficient than the M-MLV RT provided with the RLM-RACE kit. The RT reaction was
incubated at 25 °C for 5 min, followed by 50 °C for 60 min and then either used immediately
or stored at –20 °C. Templates for 3’ RLM-RACE were prepared from 2 µL total mRNA
using the SuperScript® III RT reaction described for 5’ RLM-RACE adapter ligated mRNA.
However, the 5’ RLM-RACE adapter and random decamers were replaced by the 3’ RLM-
RACE adapter (Figure 3.1 b).

31
a)
b)
5’RLM-RACE adapter: 5'-GCUGAUGGCGAUGAAUGAACACUGCGUUUGCUGGCUUUGAUGAAA-3'
3’RLM-RACE adapter: 5'-GCGAGCACAGAATTAATACGACTCACTATAGG(T)12VN-3'
Figure 3.1: Summary of 5’ and 3’RLM-RACE strategies. a) Illustrates how mRNA is converted into cDNA templates used in nested PCR for 5’ and 3’ RLM-RACE using b) 5’ and 3’ adapters. Adapter primer sequences are listed in Table 3.2. Enzymes used for cDNA preparation included T4 RNA ligase, calf intestine alkaline phosphatase (CIP) and tobacco acid phosphatase (TAP).
5’RLM-RACE
Cap AAAAA AAAAA
5’Adapter TTTTT
5’Adapter TTTTT
5’Adapter
5’Adapter AAAAA
PO4 AAAAA 5’Adapter-OH
TAP Reaction
T4 RNA Ligase
cDNA Synthesis
Outer PCR
Inner PCR
CIP Reaction
PO4
Cap AAAAA PO4 AAAAA
mRNA Sample 3’RLM-RACE
cDNA Synthesis
Outer PCR
Inner PCR
Cap AAAA NVTTTT-3’Adapter
NVTTTT-3’Adapter
NVTTTT-3’Adapter

32
The 5’ and 3’ ends of psy1 and psy2 mRNAs were amplified from the respective cDNA
templates using nested primers and the adapter primers supplied with FirstChoice® kit (Table
3.2), as summarised in Figure 3.1a. PCR primer pairs used to isolate the 5’ regions of psy1
mRNA were 5’Adapter-Out/psy1-5’RACE-Out-01 (outer primers) and 5’Adapter-In/psy1-
5’RACE-In-01 (nested primers). The 3’ ends of psy1 mRNAs were amplified using
3’Adapter-Out/psy1-3’RACE-Out-01 (outer primers) and 3’Adapter-In/psy1-3’RACE-In-01
(nested primers). For amplification of psy2 mRNA 5’ regions, 5’Adapter-Out/psy2-5’RACE-
Out-01 (outer primers) and 5’Adapter-In/psy2-5’RACE-In-01(nested primers) were used. For
amplification of psy2 mRNA 3’ ends, PCR primers 3’Adapter-Out/psy2-3’RACE-Out-01 and
3’Adapter-In/psy2-3’RACE-In-01 were used for outer and nested amplification, respectively.
Outer PCRs for both 5’ and 3’ RLM-RACE used 1μL cDNA template, while for inner PCRs
1 to 5 µL of the outer PCR was used, depending on template abundance. PCR amplification
used Taq DNA Polymerase (Roche Applied Science) and thermal cycling conditions as
described in Chapter 2.2.1 with an extension time of 2 min and annealing temperatures
ranging from 55 °C to 60 °C. The PCRs were analysed on a 1% agarose gel, gel purified and
cloned into pGEM-T Easy (Chapter 2.2.2 to 2.2.7). Putative clones were confirmed by
EcoRI digestion and sequencing (Chapter 2.2.2 and 1.2.10) and analysed as per Chapter
3.2.5.
3.2.7 Isolation of partial banana psy sequences from gDNA Where sequences could not be obtained using RLM-RACE, strategies were used to isolate
these regions from gDNA. Genome walking libraries were constructed from Asupina and
Cavendish gDNA for the isolation of coding and regulatory segments of the carotenoid
biosynthesis genes (Figure 3.2a). The genome walking method was based on the
GenomeWalker™ Universal Kit (Clontech Laboratories, Inc.). Banana gDNA (0.3 to 1 µg)
was digested overnight at 37 °C with selected restriction enzymes in 20 µL reactions
containing 10 U restriction enzyme and corresponding 1× restriction buffer. Cavendish
gDNA was digested with EcoRI, EcoRV, NaeI, PvuII, StuI, StyI and SwaI, while Asupina
gDNA was digested with BamHI, EcoRV, HindIII, PvuII and StuI. Aliquots of each reaction
(5 µL) were electrophoresed to verify complete digestion. Where necessary, overhanging
ends were filled in by incubation with 2 U Klenow polymerase (Roche Applied Science) and
1× filling buffer (supplied with the enzyme) at 37 °C for 15 min. The remaining digest
reaction (15 µL) was precipitated with 2.2 volumes of 100% ethanol for 2 hours at –20 °C.

33
a)
b)
Figure 3.2: Summary of genome walking strategy a) illustrating how genomic fragments are obtained by nested PCR from genomic libraries created by ligation of the genome walking adapter to restriction enzyme digested gDNA. b) Structure of the genome walking adapter (adapted from GenomeWalker™ Universal Kit Manual, Clontech Laboratories, Inc.) and position of the adapter primers listed in Table 3.2.
SrfI . MluI SalI SmaI/XmaI 5’-GTAATACGACTCACTATAGGGCACGCGTGGTCGACGGCCCGGGCTGGT-OH-3’ 3’-H2N-CCCGACCA-PO4-5’
Adapter primer 1 (AP1)
Adapter primer 2 (AP2)
Adapter Ligation
Outer PCR
Inner PCR
RE Digestion
Adapter
Adapter Adapter
Adapter Adapter
gDNA Sample

34
DNA was collected by centrifugation at 10,000 × g for 25 min and the pellet washed in 70%
ethanol and dried under vacuum. The gDNA was resuspended in 10 mM Tris buffer (20 µL)
for 2 hours at 65 °C. The digested gDNA (10 µL) was ligated to 5 pmol genome walking
adapter (GWA, Figure 3.2b) in 20 µL ligation reactions which also included 2 U T4 DNA
ligase (Promega) and 1× T4 DNA ligase buffer. The reactions were incubated overnight at
16 °C before addition of 10 mM Tris (80 µL) to create 100 µL GWA libraries that were
stored at 4 °C.
The 5’ sequence of the coding region and part of the 5’ UTR of the Cavendish psy2a gene
were obtained through three stages of nested PCR with new primers designed as sequence
data was generated. The first genome fragment was isolated using primer pairs AP1/psy2-
5’RACE-Out-01 for outer PCR followed by a nested PCR with AP2/psy2-5’RACE-In-01.
Primer pairs AP1/psy2-GW04 (outer) and AP2/psy2-GW05 (inner) were designed to amplify
the second fragment. The final Cavendish psy2a region was amplified with outer and inner
primer pairs AP1/psy2-GW06 and AP2/psy2-GW07, respectively. For outer PCRs, 0.5 µL of
each Cavendish genome walking library was amplified with the ExpandTM Long Template
PCR system (Roche Applied Science). For nested PCR, 0.5 µL of the outer PCR reaction
was used as template. Thermal cycling conditions were as per Chapter 2.2.1 with an
extension time of 2 min and annealing temperatures between 55 °C and 60 °C. PCR products
were cloned and sequenced (Chapter 3.2.4), before analysis (Chapter 3.2.5).
Primer pair Apsy2a-CR-F1/psy2-5’RACE-Out-01 was used to amplify part of the 5’ end of
the psy2b coding region from Asupina and Cavendish gDNA (0.3 to 1 µg) using Taq DNA
Polymerase (Roche Applied Science, Chapter 2.2.1) and with annealing temperature and
extension times of 48 °C and 1 min, respectively. PCR products were cloned and sequenced
as per Chapter 3.2.4.
3.2.8 Amplification of the complete psy coding region from mRNA and gDNA Fragments representing the complete coding region of the Asupina and Cavendish psy genes
were amplified from 1 µL leaf mRNA (psy1) or fruit mRNA (psy2a and psy2b) using Titan
One-Tube RT-PCR (Roche Applied Science; Chapter 2.2.1) with an annealing temperature
and extension time of 50 °C and 1 min, respectively. Primer sets used included psy1-CR-
F1/Apsy1-CR-R1 [Asupina psy1], psy1-CR-F1/Cpsy1-CR-R1 [Cavendish psy1], Apsy2a-CR-
F1/Apsy2a-CR-R1 [Asupina psy2a], Cpsy2a-CR-F1/Cpsy2a-CR-R1 [Cavendish psy2a] and
Apsy2a-CR-F1/Cpsy2b-CR-R1 [Asupina and Cavendish psy2b]. The same regions, including
introns, were also amplified with the same primer sets from Asupina and Cavendish gDNA

35
(300 to 500 ng), prepared using the QIAGEN DNeasy™ kit (Chapter 2.1.3). The Asupina
psy2a genomic coding region was amplified using the GoTaq Green® system (Chapter 2.2.1),
while all others were obtained using ExpandTM Long Template PCR (Chapter 2.2.1). The
annealing temperature and extension times were modified to 50 °C and 2 min, respectively.
The resulting PCR products were cloned and analysed as per Chapter 3.2.6.
3.3 Results 3.3.1 Initial characterisation of banana psy
3.3.1.1 Isolation of partial banana psy sequences
Degenerate primers psy-F01 and psy-R01 were designed to conserved regions identified in a
sequence alignment of plant PSY proteins (Table 3.3) and used to amplify a 680 bp fragment
of the banana psy coding region. Initially, RT-PCR conditions were optimised using
capsicum fruit total RNA (results not shown) as this psy gene was known to include the
conserved primer sequences. From these results the decision was made to use mRNA as the
template for isolating banana psy sequences, instead of total RNA, to enhance the efficiency
of degenerate primer RT-PCR and to reduce the potential for gDNA contamination. The
primers were used to amplify a fragment of the expected size from several banana cultivars
including Asupina, Cavendish, Ladyfinger, Lakatan and Wain (Table 3.1), with represented
a range of pVA content. A band of approximately 680 bp was obtained following RT-PCR
from leaf or fruit mRNA of all cultivars. Figure 3.3 (band #1) shows a typical result.
Smaller, faint bands (#2) were sometimes observed but were not characterised.
Figure 3.3: Representative agarose gel showing amplification of partial psy coding region using degenerate primers. (+) PCR product obtained from Cavendish leaf mRNA; (–) negative PCR control; (M) DNA Molecular weight marker X (Roche Applied Science). Samples were electrophoresed in a 2% agarose gel for 25 min. The positions of the expected 680 bp psy fragment (#1) and unknown RT-PCR product (#2) are indicated.
The first fragments to be cloned and sequenced were amplified from leaf mRNA of
Ladyfinger (AAB). Nine sequences were confirmed to be psy based on BLASTn analysis. Of
these, five were similar to psy1 sequences from plants such as daffodil (79%) and rice (78%)
#2
- +M
2036 bp
1018 bp
517 bp
220 bp
#1

36
and were tentatively called psy1, while two clones were similar to psy2 sequences such as
rice psy2 (78%) and maize psy2 (76%) and were tentatively called psy2 (Table 3.4).
Translation of these sequences confirmed that they contained an uninterrupted coding region.
The remaining two clones, although identified as psy1, each included a single putative intron
of 79 and 97 bp, respectively, which appeared to interrupt the coding region at the same
relative position. The nucleotide sequences of the nine clones were then used to generate
psy1 and psy2 consensus sequences, which were approximately 75% identical to each other.
Eight clones were isolated following RT-PCR from leaf mRNA of the diploid cultivar
Lakatan (AA) and of these, four represented a single psy1 consensus and four represented a
single psy2 consensus sequence (Table 3.4). A total of 17 clones were obtained following
RT-PCR with psy degenerate primers from mRNA isolated from fruit and leaf of the triploid
cultivar Cavendish (AAA; Table 3.4). Of the seven clones obtained from leaf, three were
identified as psy1 and four as psy2, while all 10 clones from Cavendish fruit mRNA
corresponded to psy2. Interestingly, there were two different sequence subgroups within the
psy2 clones from both leaf and fruit which were subsequently called psy2a (most abundant)
and psy2b (Table 3.4). The psy2a and psy2b consensus sequences were 85% identical. One
other Cavendish psy clone obtained from leaf mRNA, was identified as psy2 based on
BLASTn analysis, but did not closely match either psy2a or psy2b. This sequence, called
psy2c, was 80% identical to psy2b and 87% identical to both psy1 and psy2a. Further
analysis suggested that psy2c was a chimera whose 5’ and 3’ halves were psy1 and psy2a,
respectively.
Asupina and Wain cultivars both have Fe’i genotypes. A total of 19 clones were obtained
from Asupina leaf (6 clones) and fruit (13 clones) mRNA. Of the clones isolated from leaf
mRNA, one sequence was identified as psy1 and the other five as psy2. One of the psy2
clones had a putative 92 bp intron at a position closer to the 3’ end than previously identified
in the Ladyfinger clones. All 13 clones isolated from fruit mRNA were psy2 and represented
a single consensus. Only leaf tissue of the Wain banana cultivar was available. Eleven clones
were obtained, six corresponding to psy1 and five to psy2. However, two of the psy1 clones
contained a 79 bp intron located at the same relative position as those found in Ladyfinger
psy1 clones.
Cavendish was the only banana cultivar from which more than one variant of the psy2 gene
was identified by degenerate primer RT-PCR. Overall, the region of the psy1 and psy2
coding region represented in these clones for the five cultivars were approximately 75%
identical. These relationships were further investigated using phylogenetic analysis.

37
Table 3.4: Partial psy clones obtained using degenerate primer RT-PCR. Summary of the number of psy1 and psy2 RT-PCR clones obtained from each banana cultivar and tissue. Tissues that were not available (NA) or not tested (NT) by RT-PCR are also indicated.
Cultivar Gene
Tissue Source of Degenerate
Primer RT-PCR clones
Leaf Fruit Total
Asupina psy1 1 0 1
Asupina psy2 5 13 18
Cavendish psy1 3 0 3
Cavendish psy2a 2 7 9
Cavendish psy2b 1 3 4
Cavendish psy2c 1 0 1
Ladyfinger psy1 7 NTa 7
Ladyfinger psy2 2 NTa 2
Lakatan psy1 4 NA 4
Lakatan psy2 4 NA 4
Wain psy1 6 NA 6
Wain psy2 5 NA 5 a as fruit was not available for some cultivars. Asupina and Cavendish were selected as representative high and low pVA varieties, respectively, for fruit analysis. Therefore Ladyfinger fruit was not included in the study.
3.3.1.2 Phylogenetic analysis of partial banana psy sequences
Phylogenetic analysis was used to investigate the relationships between the partial banana
psy1 and psy2 sequences from different cultivars and to assess the significance of factors
such as genotype. Equivalent regions of maize psy1 and psy2 were included for comparison
of the banana sequences to other monocots and psy from Dunaliella salina, a green algae,
was included as an outgroup (Figure 3.4).
The psy1 and psy2 sequences diverged early from a single main branch, when compared to
D. salina psy. The main psy1 clade included all five banana cultivars and was further divided
into two major subgroups. One subgroup included Asupina and Wain psy1 (both Fe’i-
genomes), which were 99% identical. The second psy1 clade included sequences from the
Cavendish, Ladyfinger and Lakatan banana varieties, all of which have the A-genome,

38
a)
b) Gene # 1 2 3 4 5 6 7 8 9 10 11 12 13 14 15
Apsy1 1 74 97 74 74 86 99 74 98 74 97 74 77 74 68 Apsy2 2 74 74 98 85 86 73 99 75 97 74 84 73 76 64 Cpsy1 3 97 74 74 74 87 96 74 99 74 99 74 77 74 67 Cpsy2a 4 74 98 74 85 87 73 97 74 99 74 84 72 75 64 Cpsy2b 5 74 85 74 85 80 73 84 74 84 74 98 73 76 59 Cpsy2c 6 86 86 87 87 80 85 86 87 87 87 79 75 74 66 Wpsy1 7 99 73 96 73 73 85 73 97 73 97 73 76 73 68 Wpsy2 8 74 99 74 97 84 86 73 75 97 74 84 73 75 64 Lak-psy1 9 98 75 99 74 74 87 97 75 74 99 74 77 74 68 Lak-psy2 10 74 97 74 99 84 87 73 97 74 74 84 72 74 64 Laf-psy1 11 97 74 99 74 74 87 97 74 99 74 74 77 74 67 Laf-psy2 12 74 84 74 84 98 79 73 84 74 84 74 73 76 60 Zpsy1 13 77 73 77 72 73 75 76 73 77 72 77 73 72 65 Zpsy2 14 74 76 74 75 76 74 73 75 74 74 74 76 72 64 DunSa-psy 15 68 64 67 64 59 66 68 64 68 64 67 60 65 64 Figure 3.4: Phylogenetic analysis of the banana psy partial coding region. a) Neighbour Joining tree illustrating the relationships between the nucleotide sequences of the various psy1 and psy2 sequences. b) Percentage identity matrix comparing levels of nucleotide sequence similarity. The numbers (#) correspond to each of the 15 partial sequences in the analysis, Asupina psy1 (Apsy1) and psy2 (Apsy2); Cavendish psy1 (Cpsy1), psy2a (Cpsy2a), psy2b (Cpsy2b) and psy2c (Cpsy2c); Ladyfinger psy1 (Laf-psy1) and psy2 (Laf-psy2); Lakatan psy1 (Lak-psy1) and psy2 (Lak-psy2); Wain psy1 (Wpsy1) and psy2 (Wpsy1); maize psy1 (Zpsy1) and psy2 (Zpsy2); D. salina psy (DunSa-psy). The tree was bootstrapped to 10,000 trials and the values are shown at each node of the rectangular cladogram.

39
although Ladyfinger also has a B-genome component. These sequences were also 99%
identical, although the Cavendish and Ladyfinger psy1 sequences grouped together with
Lakatan psy1 on a separate branch. All banana psy1 sequences were between 96% and 98%
identical. Interestingly, Cavendish psy2c formed a separate branch adjacent to the banana
psy1 clade, with 85 to 87% similarity with these genes. The banana psy1 sequences were
only 76 to 77% identical to maize psy1, which was in a separate clade.
The relationships between the six banana psy2 sequences were more complex than those
seen for the psy1 group, and were divided into three clades (Figure 3.4a). The psy2
sequences from the Fe’i-type Asupina and Wain cultivars grouped together with 99%
identity. The Cavendish psy2a and Lakatan psy2 sequences paired in an adjacent group with
99% identity. The close relationship between these four sequences suggests that they are
equivalent to psy2a. Interestingly, the Cavendish psy2b and Ladyfinger psy2 sequences
grouped together in a separate clade with 98% identity. This suggests that psy2b transcripts
are expressed, at least in related cultivars. Maize psy2 was in a separate clade from all the
other banana psy1 and psy2 sequences, sharing 74 to 76% sequence identity with the banana
psy2 sequences and only 67 to 68% identity with the banana psy1 sequences.
Within the Cavendish psy gene family, psy1 was 74% identical to both psy2a and psy2b,
while psy2a and psy2b were 85% identical to each other. Comparatively, Cavendish psy2c
was 87% identical to both psy1 and psy2a but was only 80% compared to psy2b. The
similarity between the psy1 and psy2 sequences of the Asupina, Lakatan, Ladyfinger and
Wain cultivars ranged between 73 and 75%. The maize psy1 and psy2 sequence were 72%
identical.
3.3.2 Isolation of complete psy mRNA sequences Asupina and Cavendish were selected as representative high and low pVA cultivars,
respectively, for isolation of the complete psy1 and psy2 mRNA sequences and subsequent
comparison of enzyme activity. This choice was based on availability of both leaf and fruit
tissue for analysis (Table 3.1). The remaining 5’ and 3’ sequences of the coding region and
the respective 5’ and 3’ UTRs were obtained by RLM-RACE using specific primers derived
from the partial psy sequences. Primers were designed to ensure that there was significant
overlap between new sequences and existing partial sequences so that they could be verified
as belonging to the same gene. The 5’ RLM-RACE nested gene-specific primers were
designed to amplify RT-PCR products with a 218 bp overlap with the 5’ end of the
degenerate primer clones. Similarly, 3’ RLM-RACE primers were designed to produce PCR

40
products with an overlap of 167 bp with the 3’ end of degenerate primer clones. Following
analysis of the 5’ and 3’ RLM-RACE sequences, the complete coding region for each of the
Asupina and Cavendish psy mRNAs was isolated using RT-PCR with specific primers.
3.3.2.1 Isolation of psy1 mRNA sequences
Leaf was selected as the target tissue for isolation of the complete psy1 transcript as this was
the source of all partial psy1 clones obtained earlier (Table 3.3). RLM-RACE to amplify the
5’ end of the psy1 transcript from Cavendish leaf cDNA gave a single product of
approximately 1000 bp. Five putative clones of this fragment were selected and the inserts
sequenced. The fragments were either 1020 or 1050 bp and the sequences formed a single
psy1 consensus, which on further analysis suggested the presence of two transcription start
sites. RLM-RACE to amplify the 3’ end of the psy1 transcript produced a broad product of
approximately 400 to 500 bp, from which a total of 17 clones of varying lengths were
obtained. All clones appeared to be polyadenylated as they ended in strings of at least eight
adenosine nucleotides terminated by the 3’ RLM-RACE adapter sequence. Of these, 12
clones overlapped with the partial psy1 sequences but varied in length with one clone each of
328, 407 and 457 bp, three clones of 420 bp and six clones of 475 bp. This sequence group
also included another two clones that appeared to have a single 74 bp intron in the 3’ coding
region and a 3’ UTR that was 50 bp longer than those found in the other psy1 3’ RACE
clones. These clones were 597 bp in length, making them the longest of the Cavendish psy 3’
RACE clones. These results suggest the existence of at least six polyadenylation sites in
psy1. One of the clones was 451 bp and appeared to be a psy2 clone as it was homologous to
the 3’ end of the Cavendish psy2b partial coding region and will be discussed later.
Collectively, the Cavendish psy1 RLM-RACE data, in combination with the partial
sequences, suggest a maximum putative transcript size of 1854 bp with transcription
initiation and polyadenylation possible at two and six sites, respectively (Figure. 3.5b),
corresponding to a 5’ UTR of either 255 or 322 bp and a 3’ UTR ranging from 110 to 239
bp. The putative Cavendish psy1 coding region is 1293 bp, encoding a polypeptide of 430
amino acids. A fragment representing the complete coding region was amplified from leaf
mRNA using coding region-specific primers, yielding a product of approximately 1300 bp.
Five clones were selected and sequenced and four of these were identical to the putative psy1
coding region. One of these four clones, Cpsy1 coding region clone Q4, was selected for
functional analysis (Chapter 4). The remaining clone had the same putative 74 bp intron
found in the longest psy1 3’ RLM-RACE clone.

41
Figure 3.5: Putative structure of psy1 mRNA of the a) Asupina and b) Cavendish banana varieties showing the coding region (black rectangle) marked with the start (AUG) and stop (UGA) codons. Putative transcription initiation (T) and polyadenylation (P) sites are marked on the 5’ and 3’ UTRs (grey arrows), respectively. The position of a 51 bp deletion observed in one of the Asupina psy1 clones is marked (X).
One pair of Cavendish leaf 3’ RLM-RACE clones was distinct from the other sequences,
although BLASTn analysis suggested that they were psy1. These sequences, subsequently
called psyX, did not match the psy1 partial sequence consensus and could not be grouped
into existing psy categories. This pair of sequences was 542 and 582 bp and identical to each
other except that the longer clone had a putative 40 bp intron located in the 3’ coding region
at the same relative position as other psy1 3’ RACE intron-bearing clones. Alignment of the
psyX 3’ RACE clones with the Cavendish psy1 3’ RACE clone with an intron found these
sequences to be 48% identical. However, translation of these clones revealed that the stop
codon was missing from the expected position compared to psy1 and a premature stop codon
was found 4 bp after the putative intron.
A single product (~1000 bp), representing the 5’ UTR and partial coding region of psy1, was
obtained following 5’ RLM-RACE from Asupina leaf cDNA. Five clones were sequenced
and products of three different sizes were obtained (850 bp, 920 bp and 950 bp). The clones
formed a single consensus that differed at the 5’ terminus, suggesting multiple transcription
start sites, giving putative 5’ UTRs of 250 bp, 307 bp and 348 bp. Following 3’ RLM-
RACE, two clones were sequenced and found to be approximately 490 bp and 520 bp. As
with the Cavendish 3’UTR clones, these sequences were polyadenylated. This suggests that
Asupina psy1 has at least two polyadenylation sites, producing transcripts with 3’ UTRs of
210 and 243 bp. The combined 5’ and 3’ RACE data indicated that Asupina psy1 mRNA
transcripts may be up to 1890 bp (Figure 3.5a). Amplification of the complete Asupina psy1
coding region with specific primers produced a single band of approximately 1300 bp.
500 bp
X
T T T AUG
UGA P P
T T P P P
P P UGA AUG
a)
b)

42
Sequence analysis of three clones confirmed that the coding region was 1293 bp long, as
previously found in Cavendish psy1. Apsy1 coding region clone 13 was selected for
functional analysis (Chapter 4). Interestingly, the coding region of a fourth clone was only
1242 bp due to a nucleotide sequence deletion from position 464 to 514 in the coding region
(Figure 3.5a). The sequence following the deletion was still in frame and capable of
producing a polypeptide of 413 amino acids, suggesting that this could be an Asupina psy1
isoform.
3.3.2.2 Isolation of psy2 coding regions
Fruit tissue was chosen for cloning and sequencing of the complete Asupina psy2 transcript
as all partial psy2 clones were obtained from this tissue. All primers used to isolate the 5’
and 3’ ends of the Asupina and Cavendish psy2 mRNAs were also capable of amplifying
psy2b due to the high sequence similarity between the Cavendish psy2a and psy2b partial
sequences. However, amplification of the complete coding region of each psy sequence used
gene-specific primers.
Asupina psy2a: Amplification of the 5’ end of Asupina psy2 mRNA by RLM-RACE gave a
single product of ~1000 bp. Two clones were sequenced and both were found to be 876 bp,
which indicated that the 5’ UTR was 276 bp. 3’ RLM-RACE produced a broad band of 400
to 500 bp from Asupina fruit and six clones were selected for analysis. Five clones
overlapped with the Asupina partial psy2 coding region consensus; two clones were 305 bp
and 342 bp, while three clones were 365 bp in length. This suggests that Asupina psy2 has at
least three polyadenylation sites and a 3’UTR of 30, 67 or 90 bp. Interestingly, the sixth
clone corresponded to psy2b and is discussed later. This was the first indication that Fe’i-
genome cultivars also expressed psy2b transcripts. Consequently, all psy2 sequences were
subsequently designated psy2a or psy2b, depending on their phylogenetic relationship to the
Cavendish psy2 sequences. Overall, it appeared that Asupina psy2a had a maximum
transcript length of 1551 bp, with one transcription start site and three polyadenylation sites
(Figure 3.6a). The Asupina psy2a coding region was 1185 bp, encoding a polypeptide of 394
amino acids. Using gene-specific primers, a product representing the full Asupina psy2a
coding region was amplified. Five clones were analysed and all matched the expected
consensus. Apsy2a coding region clone 2 was selected for functional analysis (Chapter 4).
Cavendish psy2a: Ripe fruit mRNA was used to isolate the complete Cavendish psy2a
transcript, as a significant number of partial psy2 clones had been obtained from this tissue.
The position of the primers used for 5’ RLM-RACE and results from Asupina psy2a,
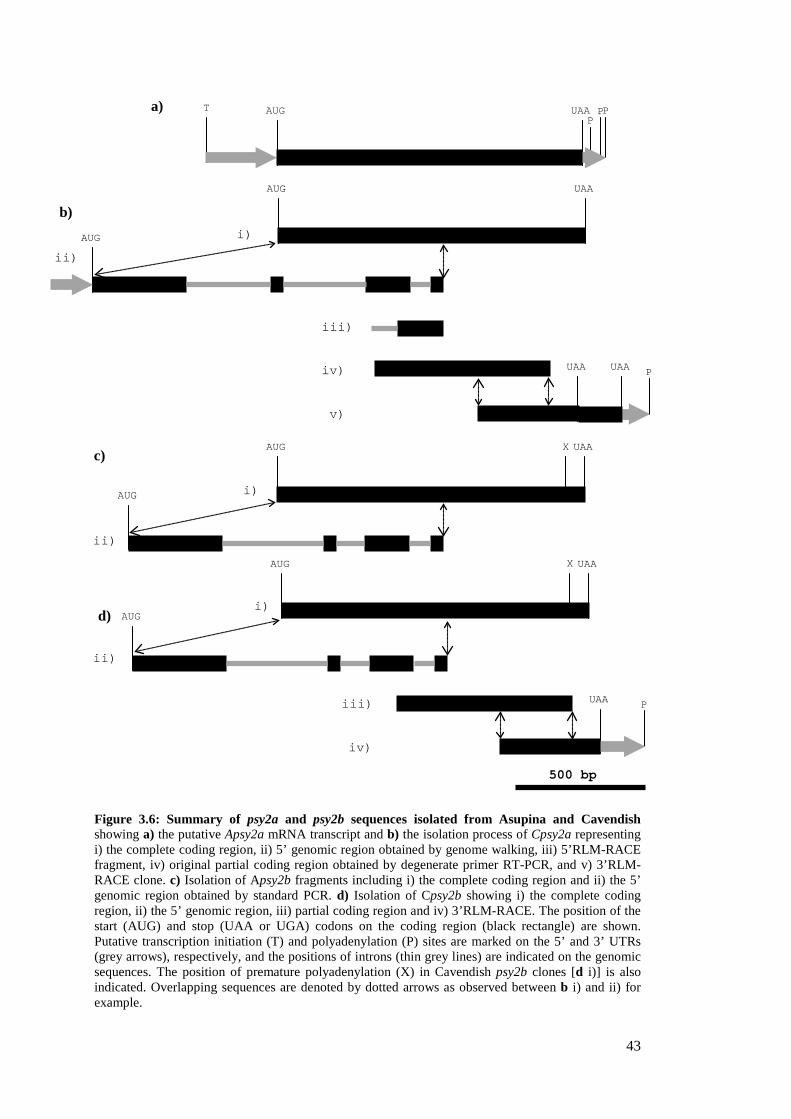
43
Figure 3.6: Summary of psy2a and psy2b sequences isolated from Asupina and Cavendish showing a) the putative Apsy2a mRNA transcript and b) the isolation process of Cpsy2a representing i) the complete coding region, ii) 5’ genomic region obtained by genome walking, iii) 5’RLM-RACE fragment, iv) original partial coding region obtained by degenerate primer RT-PCR, and v) 3’RLM-RACE clone. c) Isolation of Apsy2b fragments including i) the complete coding region and ii) the 5’ genomic region obtained by standard PCR. d) Isolation of Cpsy2b showing i) the complete coding region, ii) the 5’ genomic region, iii) partial coding region and iv) 3’RLM-RACE. The position of the start (AUG) and stop (UAA or UGA) codons on the coding region (black rectangle) are shown. Putative transcription initiation (T) and polyadenylation (P) sites are marked on the 5’ and 3’ UTRs (grey arrows), respectively, and the positions of introns (thin grey lines) are indicated on the genomic sequences. The position of premature polyadenylation (X) in Cavendish psy2b clones [d i)] is also indicated. Overlapping sequences are denoted by dotted arrows as observed between b i) and ii) for example.
T UAA
AUG P P
P a)
AUG
X UAA
AUG
c)
i)
ii)
500 bp
b) i)
ii)
iii)
iv)
UAA
AUG
AUG
v)
UAA
P UAA
d)
iv)
UAA
P iii)
i)
ii)
AUG
X UAA
AUG
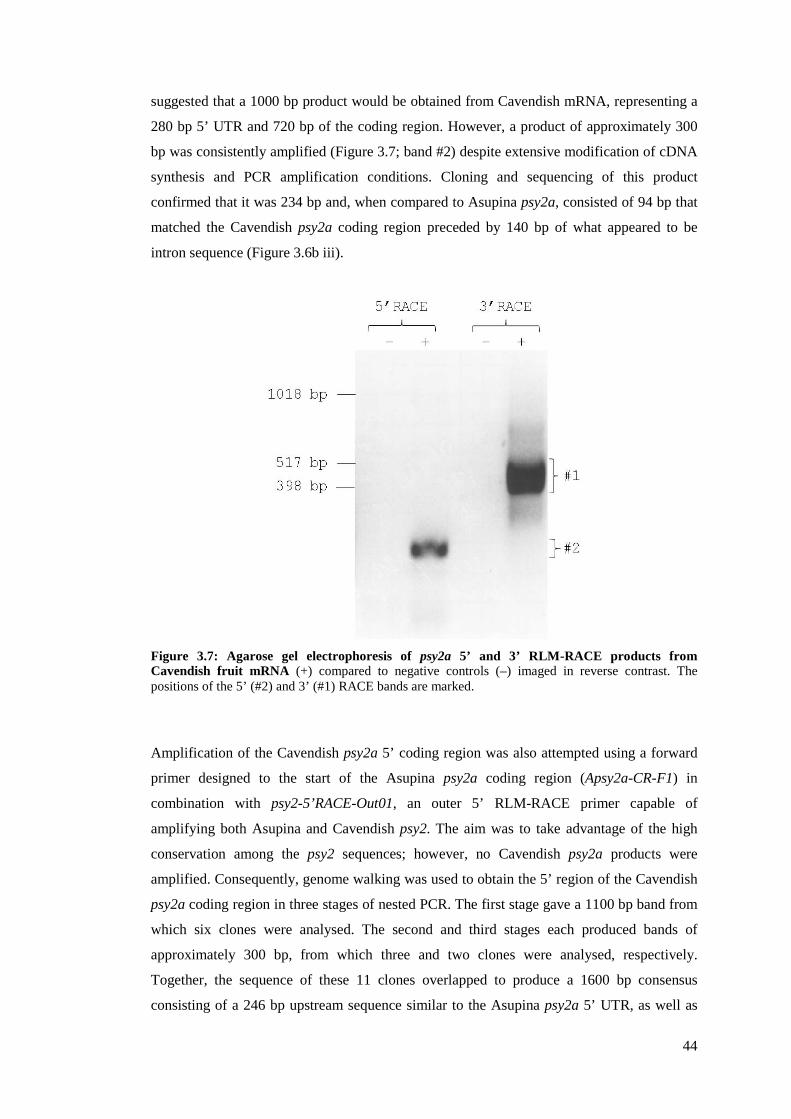
44
suggested that a 1000 bp product would be obtained from Cavendish mRNA, representing a
280 bp 5’ UTR and 720 bp of the coding region. However, a product of approximately 300
bp was consistently amplified (Figure 3.7; band #2) despite extensive modification of cDNA
synthesis and PCR amplification conditions. Cloning and sequencing of this product
confirmed that it was 234 bp and, when compared to Asupina psy2a, consisted of 94 bp that
matched the Cavendish psy2a coding region preceded by 140 bp of what appeared to be
intron sequence (Figure 3.6b iii).
Figure 3.7: Agarose gel electrophoresis of psy2a 5’ and 3’ RLM-RACE products from Cavendish fruit mRNA (+) compared to negative controls (–) imaged in reverse contrast. The positions of the 5’ (#2) and 3’ (#1) RACE bands are marked.
Amplification of the Cavendish psy2a 5’ coding region was also attempted using a forward
primer designed to the start of the Asupina psy2a coding region (Apsy2a-CR-F1) in
combination with psy2-5’RACE-Out01, an outer 5’ RLM-RACE primer capable of
amplifying both Asupina and Cavendish psy2. The aim was to take advantage of the high
conservation among the psy2 sequences; however, no Cavendish psy2a products were
amplified. Consequently, genome walking was used to obtain the 5’ region of the Cavendish
psy2a coding region in three stages of nested PCR. The first stage gave a 1100 bp band from
which six clones were analysed. The second and third stages each produced bands of
approximately 300 bp, from which three and two clones were analysed, respectively.
Together, the sequence of these 11 clones overlapped to produce a 1600 bp consensus
consisting of a 246 bp upstream sequence similar to the Asupina psy2a 5’ UTR, as well as

45
the first three exons (367, 51 and 173bp) and three introns (328, 320 and 79 bp) of the
Cavendish psy2a coding region (Figure 3.6b ii). This sequence was confirmed to be
Cavendish psy2a as the last 45 bp, which appeared to be the start of the fourth exon, was
identical to existing Cavendish psy2a partial sequence data.
RLM-RACE to amplify the 3’ end of the Cavendish psy2a transcript produced a band of
approximately 400 to 500 bp (Figure 3.7; band #1) similar to that obtained for psy1 and
Asupina psy2a. Of the eight clones obtained, seven were psy2b and will be considered later.
The eighth clone was approximately 640 bp and represented 362 bp of the 3’ psy2a coding
region and a 278 bp 3’ UTR (Figure 3.8a). The Cavendish psy2a sequence was compared
with the longest Asupina psy2a 3’ RACE clone and it was found that the last 107 bp of the
Cavendish psy2a clone was 97% identical to the Asupina psy2a 3’ UTR. Interestingly, the
first 172 bp of the Cavendish psy2a 3’ UTR appeared to be a duplication of the 3’ end of the
coding region (Figure 3.8a). The true size of the Cavendish psy2a mRNA transcript could
not be estimated due to the failure of 5’ and 3’ RLM-RACE, although comparison of the 5’
upstream sequence obtained by genome walking with the Asupina psy2a 5’ UTR suggests
that this region may be of similar size in both genes. As the major aim of this work was to
clone the full coding region, no further 5’ and 3’ RLM-RACE was undertaken for Cavendish
psy2a. The complete Cavendish psy2a coding region was amplified from fruit mRNA using
primers based on existing 5’ genome walking and 3’ RLM-RACE sequence and a fragment
of ~1200 bp was obtained. Of the five clones analysed, clones 1 to 3 had inserts of 1194 bp,
encoding a polypeptide of 397 amino acids, similar in size to Asupina psy2a. Clone 4 was
1160 bp, encoding a truncated protein of 115 amino acids, due to a 34 bp deletion that
resulted in a frame shift. The fifth clone was 1102 bp, encoding a truncated polypeptide of
256 amino acids due to a 92 bp deletion that caused a frame shift. These clones may
represent abnormal transcripts as neither sequence was predicted to produce a functional
protein. Cpsy2a coding region clone 1 was selected for functional analysis (Chapter 4).
Asupina and Cavendish psy2b: Asupina or Cavendish psy2b clones were not obtained from
5’ RLM-RACE of either cultivar despite the capacity for these primers to amplify both psy2a
and psy2b. However, the 5’ coding region of these genes was obtained from gDNA using the
Apsy2a-CR-F1 and psy2-5’RACE-Out01 primers, producing a band of ~1200 bp. Clones
from Asupina (one clone) and Cavendish (three clones) were sequenced and this region was
shown to be similar in structure to that of Cavendish psy2a, consisting of the first 3 exons
(364, 51 and 173 bp) and 3 introns (390, 110 and 78 bp) of the Asupina and Cavendish psy2b
coding region. The final 40 to 60 bp of the partial fourth exon was very similar to existing
Cavendish psy2b partial sequence data (Figure 3.6c ii & d ii). The only psy2b cDNA clone

46
a) aacatactcagggatgttggagaggactccaggagggggagagtgtaccttcctcaagat N I L R D V G E D S R R G R V Y L P Q D gaactggcccacgctggtctgtcagatgatgacgtcttcgaagggagggtgacagacaaa E L A H A G L S D D D V F E G R V T D K tggcggaccttcatgaagggtcaaattacgcgagcgaggatgttcttcgacgaggccgag W R T F M K G Q I T R A R M F F D E A E aagggcatatatgagctgaactcagccagcagatggccggttttggct K G I Y E L N S A S R W P V L A S L L L
tcgttgctgctg
Y R Q I L D A I E A N D Y N N F T K R A tatcggcagattctggatgccattgaggcaaacgactacaacaacttcaccaagcgtgca
Y V G K A K K L A S L P I A Y A K A V I tacgtagggaaagcaaagaaactggcttcgttacccatagcatatgccaaggcagtaatt
gtaggcccgtcaaaatttgcaggaacactataagtataa V G P S K F A G T L - V - S L L L Y R Q
tcgttgctgctgtaccggcag
I L D A I E A N D Y S N F T K R A Y V G attttggatgccattgaagcaaatgactacagcaacttcaccaagcgtgcatacgtaggg
K A K K L A S L P I A Y A K A V I V G P aaagcaaagaaactggcttcgttacccatagcatatgccaaggcagtaattgtaggcccg
tcaaaatttgcaggaacacta S K F A G T L - V -
taagtataatcttcatttgcttcctcattgcaatcgcca
aatgtaagttttaagttgattcgttcttctcacctcgggggcttatattttggtacttca taatttgttac
b) Cpsy2b-3’ AATGGAGGAGCTTCATGAAGGGACAGATTAGGCGAGCCAGGATGTTCTTTGAGG-AGGCT Cpsy2b-T AATGGAGGAGCTTCATGAAGGGACAGATTAGGCGAGCCAGGATGTTCTTTGAGG-AGGCT Apsy2b-T AATGGAGGAGCTTCATGAAGGGACAGATTAGGCGAGCCAGGATGTTCTTTGGGGGAGGCT *************************************************** **^***** Cpsy2b-3’ GAGAAGGGCATATACGAGCTGAATTCAGCTAGCAGATGGCCGGTTTTGGCTTCTCTGCTG Cpsy2b-T GAGAAGGGCATATACGAGCTGAATTCAGCTAGCAGATGGCCGGTTTTGGCTTCTCTGCTG Apsy2b-T GAGAAGGGCATATACGAGCTGAATTCAGCTAGCAGATGGCCGGTTTTGGCTTCTCTGCTG ************************************************************ Cpsy2b-3’ CTATATCGATAGATCCTT-GACGCCATCGAAGAAAATGACTACAACAACTTCACGAGGCG Cpsy2b-T CTATATCGACAGATCCTT-GACGCCATCGAAGCAAATGACTACAACAACTTCACAAGGCG Apsy2b-T CTATATCGACAGATCCTTTGACGCCATCGAAGCAAATGACTACACAACTTCCACAGGCGT *********#********^************* *********** * * *** * Cpsy2b-3’ TGCATATGTAGGAAAAGCAAAGAAACTGGCTTCATTGCCCATAGCATATACCAGGGCACG Cpsy2b-T TGCATATGTAGGAATAGC------------------------------------------ Apsy2b-T TGCATATGTAGGATAC-------------------------------------------- ************* Cpsy2b-3’ TCTGGGCCCTTCTAGGTTTACAGGAGCAACAAGGACATAATGTTCACTTCCTCTCTGTAC Cpsy2b-3’ TCTCTGCACAAAAATCATAACCAACTGTATCTGTAGTACCTTTGACAGTGTATATAAGAA Cpsy2b-3’ GGTGTCATGTGATTTGCATTAGATGTACTGAAATGATAGTAACTTCAATGATTTGGAGAA Cpsy2b-3’ GAAGAGAGTAAAAGATAATGATATTGTGCGCC
Figure 3.8: Analysis of psy2 3’RLM-RACE clones. Translated sequence of the a) Cavendish psy2a 3’RACE clone starting at nt position 808 from the start of the coding region. The coding region duplication (bold) inserted into the 3’ UTR (underlined) and the positions of stop codons (grey highlight) are shown. b) Sequence alignment of Cavendish psy2b 3’ coding region clone (Cpsy2b-3’) from leaf mRNA against truncated Asupina (Apsy2b-T) and Cavendish (Cpsy2b-T) 3’ RACE clones from fruit mRNA. The alignment starts at nt position 923 from the start of the Asupina and Cavendish psy2b coding region. Positions of conserved nucleotides (*) and insertions in Apsy2b-T sequence (^) compared to the Cavendish psy2b clones are marked. The position of a C/T mutation (#) in Cpsy2b-3’ compared to the Cpsy2b coding region consensus is also marked.

47
without a truncated 3’ UTR was obtained from Cavendish leaf tissue as a by-product of psy1
3’RLM-RACE, and was 450 bp with a 172 bp 3’ UTR (Chapter 3.3.2.1). Translation of this
sequence suggested that the Cavendish PSY2B protein would be prematurely truncated by an
internal TAG stop codon (Figure 3.8b). However, the corresponding codon in the psy2b
partial sequence consensus was CAG, suggesting that the C/T substitution in the 3’RACE
clone could be a PCR amplification error. Seven further clones were obtained from
Cavendish fruit tissue, but were only 320 bp long and polyadenylated prematurely just after
the region of overlap with the partial psy2b coding region (Figure 3.6d i & Figure 3.8b). The
translated protein was uninterrupted until the point at which the sequences were truncated.
One Asupina 3’RACE clone corresponding to psy2b was 316 bp long and truncated at the
same position as the Cavendish psy2b clones but appeared to have multiple stop codons
(Figure 3.8b). The full mRNA transcript lengths of Asupina or Cavendish psy2b could not be
predicted as sufficient 5’ or 3’ RLM-RACE data was not available. Nevertheless, the
complete coding region of psy2b was isolated from fruit mRNA of both Asupina and
Cavendish using the primers Apsy2a-CR-F1 (used to obtain the psy2b 5’ coding region from
gDNA), and Cpsy2b-CR-R1 (designed from the end of the Cavendish psy2b coding region of
the full length 3’RACE clone). This confirmed that the psy2b coding region was 1194 bp,
encoding a polypeptide of 397 amino acids. No other sequence variants were detected from
the five clones sequenced from Asupina and Cavendish psy2b.
In summary, although complete mRNA sequence information was only deduced for Asupina
psy1, Cavendish psy1 and Asupina psy2a, clones of the complete coding region of psy1,
psy2a and psy2b from both varieties was obtained. The relationship between these sequences
was investigated by phylogenetic analysis.
3.3.3 Phylogenetic analysis of complete banana psy coding regions The sequences of the complete psy1, psy2a and psy2b coding regions from Asupina and
Cavendish were compared to those of rice and maize psy1 and psy2 (Figure 3.9).
Phylogenetic analysis showed that the psy1 and psy2 sequence groups diverged at the first
branch of the tree. The psy1 group further divided with Asupina and Cavendish psy1 (97%
identical) forming one clade and maize and rice psy1 forming a second clade (81%
identical). Maize and rice psy2 (79% identical) diverged from the banana psy2 sequences,
while the psy2a and psy2b sequences also diverged into two pairs of sequences. The Asupina
and Cavendish psy2a sequences were 97% identical, while surprisingly, the respective psy2b
sequences were 100% identical. The Asupina and Cavendish psy1 coding regions were
approximately 60% identical to their respective psy2a and psy2b sequences, and in both
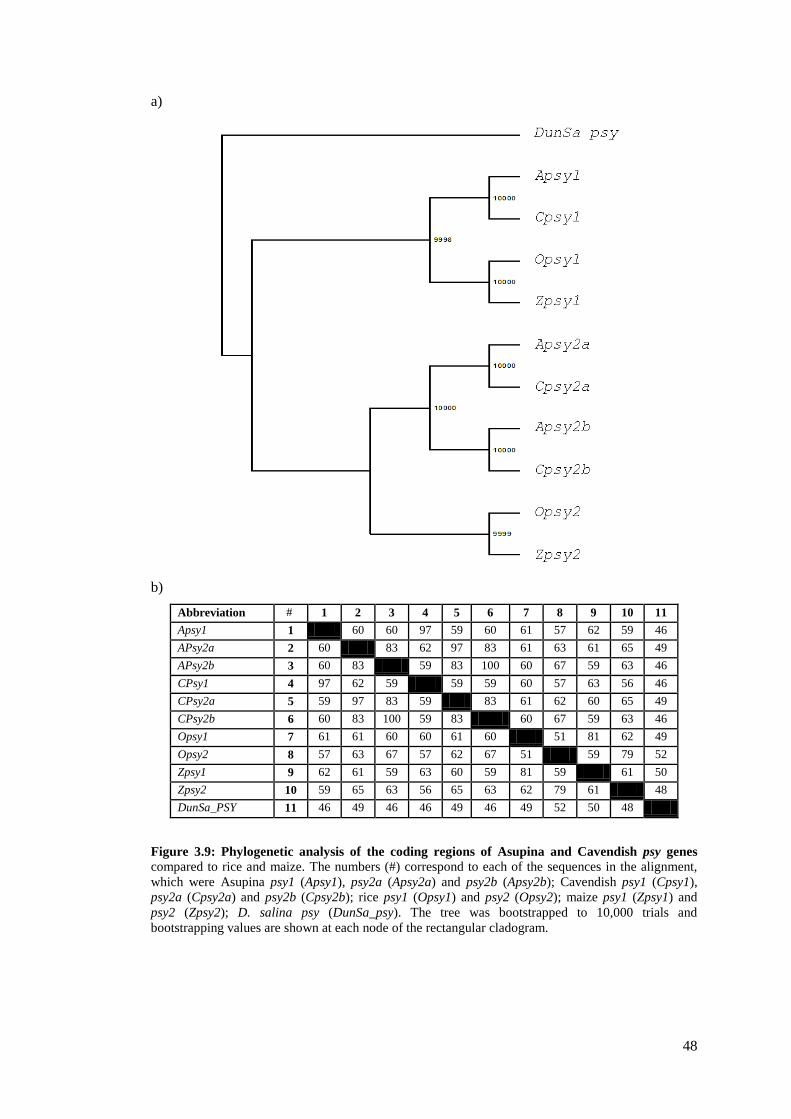
48
a)
b)
Abbreviation # 1 2 3 4 5 6 7 8 9 10 11 Apsy1 1 60 60 97 59 60 61 57 62 59 46 APsy2a 2 60 83 62 97 83 61 63 61 65 49 APsy2b 3 60 83 59 83 100 60 67 59 63 46 CPsy1 4 97 62 59 59 59 60 57 63 56 46 CPsy2a 5 59 97 83 59 83 61 62 60 65 49 CPsy2b 6 60 83 100 59 83 60 67 59 63 46 Opsy1 7 61 61 60 60 61 60 51 81 62 49 Opsy2 8 57 63 67 57 62 67 51 59 79 52 Zpsy1 9 62 61 59 63 60 59 81 59 61 50 Zpsy2 10 59 65 63 56 65 63 62 79 61 48 DunSa_PSY 11 46 49 46 46 49 46 49 52 50 48
Figure 3.9: Phylogenetic analysis of the coding regions of Asupina and Cavendish psy genes compared to rice and maize. The numbers (#) correspond to each of the sequences in the alignment, which were Asupina psy1 (Apsy1), psy2a (Apsy2a) and psy2b (Apsy2b); Cavendish psy1 (Cpsy1), psy2a (Cpsy2a) and psy2b (Cpsy2b); rice psy1 (Opsy1) and psy2 (Opsy2); maize psy1 (Zpsy1) and psy2 (Zpsy2); D. salina psy (DunSa_psy). The tree was bootstrapped to 10,000 trials and bootstrapping values are shown at each node of the rectangular cladogram.

49
Asupina and Cavendish the psy2a coding regions were 83% identical to psy2b. This was
similar to maize and rice where the psy1 and psy2 coding regions were 61% and 51%
identical, respectively. Overall, phylogenetic analysis confirmed that the Asupina and
Cavendish psy gene families contained three known distinct gene family members: psy1,
psy2a and psy2b.
3.3.4 Analysis of Asupina and Cavendish psy gene structure The genomic sequences representing the Asupina and Cavendish psy1 and psy2 coding
regions were isolated (Figure 3.10) due to the presence of putative introns in RT-PCR clones
and to enable comparison of banana psy gene structure to those of maize and rice. PCR
amplification from gDNA, using the same primers used to amplify the coding regions from
mRNA (Chapter 3.3.2), gave strong 2 Kb psy products. Alignment of the psy coding regions
amplified from mRNA with their corresponding genomic sequences confirmed that the
cDNAs were identical to the exons in the gDNA sequences. The sole exception was
Cavendish psy2b, where the genomic sequence was only 96% identical to its respective
cDNA coding region identified earlier (Chapter 3.3.2.2.). The Cavendish psy2b cDNA was
99% identical to the Asupina psy2b gDNA sequence. Although this suggests an error in
amplification of the full Cavendish psy2b coding region from mRNA, the partial Cavendish
psy2b sequence was identical to the full length coding region which was amplified from a
separate mRNA extract.
The structure of all banana, maize and rice psy genes was highly conserved and each
genomic coding region had six exons separated by five introns (Figure 3.10a). The size of
exons 2, 3, 4 and 5 was identical across all psy genes, including rice and maize, and were 51,
173, 236 and 193bp, respectively. In contrast, exons 1 and 6 were variable in length (Figure
3.10b). Exon 1 ranged in size from 286 bp (rice psy2) to 457 bp (banana psy1), while exon 6
varied in length from 150 bp (maize and rice psy2) to 183 bp (banana psy1). Exon lengths
were identical for corresponding Asupina and Cavendish psy genes with the exception of
psy2a, where the Cavendish exon 1 was 9 bp longer than its Asupina counterpart. In contrast,
introns were more variable in size (Figure 3.10 a & b). In banana, Cavendish psy1 intron 2
was the largest (466 bp) and Asupina psy1 intron 5 the smallest (73 bp). Generally, each
intron within psy1, psy2a or psy2b, was similar in size in both Asupina and Cavendish. The
exception was psy2a intron 5, which was 166 bp in Asupina and only 97 bp in Cavendish.
However, introns differed considerably in size between different psy genes. For example,
Cavendish psy1 intron 1 was 81 bp, compared to 326 bp and 394 bp for Cavendish psy2a and
psy2b, respectively. Generally, the maize and rice psy introns were larger than those of

50
a)
b)
Exon Intron Total
Gene 1 2 3 4 5 6 1 2 3 4 5 CR intron gDNA
Apsy1 457 51 173 236 193 183 81 461 79 79 73 1293 773 2066
Apsy2a 358 51 173 236 193 174 324 332 75 92 166 1185 989 2174
Apsy2b 364 51 173 236 193 177 392 110 78 124 111 1194 815 2009
Cpsy1 457 51 173 236 193 183 81 466 79 80 74 1293 780 2073
Cpsy2a 367 51 173 236 193 174 326 320 79 91 97 1194 913 2107
Cpsy2b 364 51 173 236 193 177 394 110 78 122 105 1194 809 2003
Opsy1 436 51 173 236 193 174 109 828 597 104 113 1263 1751 3014
Opsy2 286 51 173 236 193 150 1150 115 129 279 87 1089 1760 2849
Zpsy1 406 51 173 236 193 174 98 613 885 94 77 1233 1767 3000
Zpsy2 406 51 173 236 193 150 716 100 146 317 131 1209 1410 2619
Figure 3.10: Analysis of genomic sequence of Asupina and Cavendish psy genes. a) Diagrammatic representation of the structure of the genomic sequences corresponding to the coding region (CR) of Asupina and Cavendish psy1, psy2a and psy2b compared to that of maize and rice psy1 and psy2 showing the positions of the exons (red rectangles) and introns (blue lines). b) Table showing the sizes of the six exons and five introns of the coding region of the psy genomic sequences of Asupina, Cavendish, rice and maize. Abbreviations for the banana, maize and rice psy genomic sequences were as given in Figure 3.10.
500bp Apsy1 Cpsy1 Opsy1 Zpsy1
Apsy2a Cpsy2a
Apsy2b Cpsy2b
Opsy2 Zpsy2

51
Asupina and Cavendish, ranging in size from 77 bp to 1150 bp.
3.3.5 Further analysis of psy coding region variants The coding region variants of Asupina psy1 (Chapter 3.3.2.1) and Cavendish psy2a (Chapter
3.3.2.2) were compared to the respective gDNA sequences (Figure 3.11a). The Asupina psy1
variant lacked 51 bp corresponding to exon 2 and was predicted to produce a smaller,
possibly functional version of PSY1. Analysis of the gDNA confirmed that the intron and
exon boundaries of exons 1 and 3 which flanked the missing exon were normal suggesting
that exon 2 was spliced out with introns 1 and 2. Cavendish psy2a variant 1 (1160 bp) and
variant 2 (1102 bp) lacked 34 bp from the 3’ end of exon 1 and 92 bp from the middle of
exon 4, respectively. Consequently, these psy2a transcript variants are unlikely to produce
functional proteins. Variant 1 appeared to stem from misprocessing of the donor splice site
(GT) of intron 1, causing the loss of the 3’ end of exon 1, in conjunction with the normal
processing of the acceptor splice site of intron 1 (AG; Figure 3.11b). The 92 bp fragment
missing from exon 4 of variant 2 was bordered by putative donor (GT) and acceptor (AG)
sequences that were apparently not recognised in variant 1 or the full length coding region
(Figure 3.11b).
Using the available gene structure data, the chimeric Cavendish psy2c clone (Chapter
3.3.1.1) was compared with the genomic sequences of psy1 and psy2a to determine how
much of each of these genes it contained (Figure 3.12). The psy2c partial sequence consisted
of 147 bp of exon 3, all of exons 4 and 5, and the first 24 bp of exon 6 (Figure 3.12a). The 5’
and 3’ regions of the psy2c sequence were derived from psy1 and psy2a, respectively. The
transition in the sequence occurred in exon 4 such that the first 164 bp was psy1 while the
next 62 bp was psy2a (Figure 3.12a & b). Although analysis of the partial coding regions
showed that psy2c, as a whole, exhibited 87% sequence identity with both psy1 and psy2a,
the region of this clone represented by exon 4 was 93% and 85% identical to psy1 and psy2a,
respectively.
3.4 Discussion Phytoene synthase occupies an important role in carotenoid biosynthesis and therefore may
also play a role in mediating pVA levels in banana cultivars. In this study, sequences of the
banana psy genes and putative PSY proteins were determined for the first time and as
reported in other monocots, were confirmed to exist in banana as part of a gene family. The
gDNA and corresponding mRNA sequences from representative high and low pVA bananas
were analysed to look for a correlation with differential carotenoid accumulation.

52
a)
b)
i)
CR variant 1
Genomic ctactcgatgcggcgtacgagcggtgcggcgaggtctgcgccgagtatgccaagactttc Complete CR ctactcgatgcggcgtacgagcggtgcggcgaggtctgcgccgagtatgccaagactttc CR variant 1 ctactcgatgcggcgtacgagcggtgcggcgag--------------------------- CR variant 2 ctactcgatgcggcgtacgagcggtgcggcgaggtctgcgccgagtatgccaagactttc Genomic tacttgggt Complete CR tacttgg CR variant 1 ------- CR variant 2 tacttgg
ii)
CR variant 2
Genomic agccattcaaggacatgatagaaggaatgagaatggacctgcggaaatcgaggtacaaga Complete CR ccattcaaggacatgatagaaggaatgagaatggacctgcggaaatcgaggtacaaga CR variant 1 ccattcaaggacatgatagaaggaatgagaatggacctgcggaaatcgaggtacaaga CR variant 2 ccattcaaggacatgatagaaggaatgagaatggacctgcggaaatcgag-------- Genomic atttcgacgaactctatctctactgctactatgtcgccggcacggtggggctcatgagtg Complete CR atttcgacgaactctatctctactgctactatgtcgccggcacggtggggctcatgagtg CR variant 1 atttcgacgaactctatctctactgctactatgtcgccggcacggtggggctcatgagtg CR variant 2 ------------------------------------------------------------ Genomic tgccggtgatgggaattgccccagactcgaaggcctcagccgagagcgtctacagcgcag Complete CR tgccggtgatgggaattgccccagactcgaaggcctcagccgagagcgtctacagcgcag CR variant 1 tgccggtgatgggaattgccccagactcgaaggcctcagccgagagcgtctacagcgcag CR variant 2 ------------------------actcgaaggcctcagccgagagcgtctacagcgcag Genomic cattagctcttggcatcgcgaatcaactcaccaacatactcagggatgtcggagaggagt Complete CR cattagctcttggcatcgcgaatcaactcaccaacatactcagggatgtcggagagga CR variant 1 cattagctcttggcatcgcgaatcaactcaccaacatactcagggatgtcggagagga CR variant 2 cattagctcttggcatcgcgaatcaactcaccaacatactcagggatgtcggagagga
Figure 3.11: Analysis of coding region variants of Asupina psy1 and Cavendish psy2a. a) Diagram showing the exon (black rectangles) and intron (grey lines) structure of the coding region (CR) variants of Asupina psy1 (Apsy1) and Cavendish psy2a (Cpsy2a) compared to the genomic sequence of the complete coding region. b) Analysis of splicing of Cpsy2a coding region variant 1 and 2 compared to the complete coding region and genomic sequence showing i) the end of exon 1 and ii) exon 4. The donor (gt) and acceptor (ag) splice sites are highlighted in grey, while the position of the cryptic splice sites () and removed exon sequences (-) are marked.
Apsy1
Complete CR
CR variant 1
Cpsy2a Complete CR
CR variant 1
CR variant 2
500 bp

53
a)
b) Cpsy1 CCATTCAGGGACATGATCGAAGGAATGAGAATGGACTTGAAGAAGTCGAGATACAAGAAC Cpsy2c CCATTCAGGGACATGATCGAAGGAATGAGAATGGACTTGAAGAAGTCGAGATACAAGAAC Cpsy2a ******* ********* ****************** ** *** ***** ********
CCATTCAAGGACATGATAGAAGGAATGAGAATGGACCTGCGGAAATCGAGGTACAAGAAT
Cpsy1 TTCGACGAACTCTATCTTTACTGCTACTACGTCGCTGGGACTGTCGGATTGATGAGCGTT Cpsy2c TTCGACGAACTCTATCTTTACTGCTACTACGTCGCTGGGACTGTCGGATTGATGAGCGTT Cpsy2a ***************** *********** ***** ** ** ** ** * ***** **
TTCGACGAACTCTATCTCTACTGCTACTATGTCGCCGGCACGGTGGGGCTCATGAGTGTG
Cpsy1 CCCGTGATGGGCATCGCACCGGAGTCGAAGGCGACGACGGAGAGCGTTTACGGTTCTGCT Cpsy2c CCCGTGATGGGCATCGCACCAGAGTCGAAGGCGACGACGGAGAGCGTTTACGGTCpsy2a
GCTGCA
** ******** ** ** ** ** ******** * * ******** *** * * ** CCGGTGATGGGAATTGCCCCAGACTCGAAGGCCTCAGCCGAGAGCGTCTACAGCGCAGCA
Cpsy1 TTGGCTTTGGGACTTGCAAACCAGCTCACCAATATACTCAGGGATGTTGGCGAAGA Cpsy2c Cpsy2a
TTAGCTCTTGGCATCGCGAATCAACTCACCAACATACTCAGGGATGTTGGAGAGGA
** *** * ** * ** ** ** ******** ************** ** ** ** TTAGCTCTTGGCATCGCGAATCAACTCACCAACATACTCAGGGATGTCGGAGAGGA
Figure 3.12: Analysis of Cavendish psy2c partial sequence structure. a) Diagram showing the sequence composition of the Cavendish psy2c (Cpsy2c) partial coding region compared to psy1 (Cpsy1) and psy2a (Cpsy2a). The exons (rectangles) and introns (solid lines) of Cpsy1 are marked in black while those of Cpsy2a are marked in grey. No introns were identified in Cpsy2c, however, the predicted position of introns in this sequence are denoted by black dotted lines. b) Sequence alignment of exon 4 to show the transition from Cpsy1 sequence (bold text) to Cpsy2a (underlined text) in the corresponding sequence of Cpsy2c. Nucleotides shared between these three sequences are marked under the alignment (*).
Initially, partial psy sequences were obtained from the mRNA of five banana cultivars, with
different carotenoid levels and genetic backgrounds, using degenerate primer RT-PCR.
Phylogenetic analysis of these sequences demonstrated the existence of a psy gene family in
banana consisting of one psy1 and at least one psy2 gene. Although multiple psy2 genes were
isolated only from Cavendish (psy2a, psy2b and psy2c), the apparent absence of these genes
in other cultivars could be due to the low number of clones obtained for some cultivars or the
limited availability of fruit, as psy2 appeared more predominant in this tissue. Following
initial studies with multiple cultivars, Asupina and Cavendish were selected as representative
high and low pVA cultivars, respectively. This choice was made to simplify the isolation and
comparison of the complete psy sequences, and both leaf and fruit tissue from both cultivars
was available for analysis. The presence of multiple psy2 genes in other banana genomes
was confirmed with the subsequent isolation of the complete coding regions of psy1, psy2a
500 bp
Cpsy2a
Cpsy2c
Cpsy1

54
and psy2b from mRNA and gDNA of both Asupina (Fe’i genome) and Cavendish (A
genome). Phylogenetic analysis of these sequences supported the relationships observed
from analysis of the partial coding regions and confirmed that psy2b was a distinct gene. The
identification of a psy gene family in banana is consistent with existing knowledge of other
plants where the number of identified psy genes varies from one in Arabidopsis (Li et al.,
2008a) to four in yellow gentian (Zhu et al., 2002; GenBank Nos. E15680-83). This has also
been shown in algae where some species had two psy genes, while others had only one (Tran
et al., 2009).
Phylogenetic segregation of psy sequences, in both partial and full sequence studies, appears
to be based initially on potential gene function (psy1 or psy2), while the individual clades
reflect the genomic origin (A, B and Fe’i). Additionally, the grouping of the psy genes did
not appear to correlate with fruit pVA content (Figure 3.4). Based on the number of clones
obtained from different tissues (Table 3.3), psy1 appears to be primarily expressed in leaf,
possibly involved in the production of secondary photosynthesis pigments in chloroplasts, as
no clones were detected in Asupina or Cavendish fruit tissue using degenerate primers. In
contrast, psy2 was isolated from both leaf and fruit tissues with degenerate primers,
suggesting that this gene is more widely expressed, and based on the number of clones
obtained, psy2a appears more highly expressed than psy2b. The psy2a and psy2b genes may
be divergent enough to have different roles in carotenoid metabolism. Interestingly, psy1
expression in maize was linked to carotenoid production in the endosperm, while psy2
mRNA was only detected in leaf (Gallagher et al., 2004). Comparatively, tomato psy1
expression was observed in chromoplast-bearing tissue, such as fruit and petals, while psy2
was expressed in various tissues (Giorio et al., 2008). It has been postulated that the gene
duplication observed in the psy genes could facilitate tissue-specific regulation of carotenoid
synthesis, enabling differential regulation of carotenoid expression in non-photosynthetic
organs without adverse impact on carotenoid homeostasis in photosynthetic tissue (Gallagher
et al., 2004). This would effectively shield the photosynthetic machinery from changes in
carotenoid metabolism that occur during the development of flower, seed and fruit, thereby
preventing photosensitivity (Busch et al., 2002) and allowing photosynthetic carotenoids to
be used as secondary metabolites (Gallagher et al., 2004). However, before any conclusions
can be drawn as to the function of these genes in banana tissues, further work is required to
confirm the expression level of psy1 and psy2 in Asupina and Cavendish tissues.
Evidence of multiple transcription start and polyadenylation sites was observed in the
putative mRNA sequences of psy1 (Asupina and Cavendish) and Asupina psy2a, indicating
that transcripts of variable length may exist in vivo. The RLM-RACE method used to isolate

55
the 5’ and 3’ ends of the Asupina and Cavendish psy mRNAs is designed to amplify from
mRNAs that have intact 7-methylguanosine caps at their 5’ termini. Therefore, the putative
multiple transcription start sites are unlikely to be artefacts due to amplification from
degraded mRNAs or the RLM-RACE method itself. The psy1 transcripts exhibited the most
variation in 3’ UTR length and appeared to be longer than those of psy2a. The discovery of
polyadenylation at different sites in banana psy transcripts is consistent with maize, where 3’
RACE detected six polyadenylation sites in psy1 (GenBank No. ZMU32636). Transcripts
with multiple polyadenylation sites are common in plants (Dean et al., 1986; Montoliu et al.,
1990; Lupold et al., 1999; Kaleikau et al., 1992; Loke et al., 2005). Interestingly, recent in
silico genomic analysis in rice found that over 60% of the genes analysed had multiple
polyadenylation sites (Shen et al., 2008). Comparison of the number of putative transcription
start sites also indicated that psy1 was more variable in 5’ UTR length than psy2a,
potentially resulting in structural changes that could influence gene expression. Secondary
structure in the 5’ UTR may also influence gene expression although this has not been
previously studied in psy. However, in tomato, the 5’ UTR of lat52 gene was involved in
regulating expression of this gene during pollen development (Bate et al., 1996), while
secondary structure in the 5’ UTR of the psbA gene affected mRNA stability and
translational efficiency (Zou et al., 2003).
Variability in 5‘ and 3‘ UTR length may indicate that psy1 has more diverse roles than
psy2a, as transcripts of this gene may come in a range of sizes that are regulated differently.
The length of the 3‘ UTR has been reported to affect mRNA stability by altering secondary
structure (Kaleikau et al., 1992), which is also thought to be affected by the sequence of
putative polyadenylation signals (Loke et al., 2005). Structural differences may significantly
affect psy gene function and regulation. For example, heterogeneous psy1 transcripts with
variable half lives may allow constant psy1 mRNA levels that may facilitate rapid turnover
of photosynthetic pigments in leaf. In contrast, carotenoid biosynthesis is highly regulated
during fruit development (Chapter 1.3.3). Therefore psy2a expression may be coordinated
primarily with banana fruit ripening and this may be reflected in lower variability in mRNA
length.
The complete mRNA sequence was only obtained for Asupina and Cavendish psy1 and
Asupina psy2a, despite the successful isolation of the psy1, psy2a and psy2b coding regions
from both cultivars. Failure to obtain the full psy2a transcript from Cavendish and the psy2b
transcripts from Asupina and Cavendish may be of significance as it may indicate abnormal
regulation of mRNA at the transcriptional or post-transcriptional level. The only Cavendish
psy2a clone obtained through 5’ RACE was smaller than expected and included part of an

56
intron. Although this could be a genomic fragment amplified from degraded gDNA
contaminating the cDNA sample, this same fragment was amplified consistently over several
attempts and no product of the expected size was ever observed. This suggests that
functional Cavendish psy2a transcripts may be in very low abundance in fruit tissue due to
poor expression or mRNA degradation. The 5’ RLM-RACE template preparation process
may also dilute complete transcripts below the detection threshold of nested PCR. It is also
possible that the mRNA was simply purified from fruit where peak psy2a expression may
not have occurred or may have already passed. The amplification of only one Cavendish
psy2a 3’ RACE clone supports the hypothesis that this gene is in low abundance in fruit, as
template dilution is not expected to be as significant in 3’ RLM-RACE. The duplication of
part of the coding region in the 3’ UTR of this clone raises the possibility that a genomic
rearrangement may exist in at least one of the psy2a alleles in Cavendish.
Interestingly, all of the psy2b 3’ RACE clones obtained from Cavendish fruit were truncated
through premature polyadenylation, a process previously shown to down-regulate expression
of transgenic B.t toxin in tobacco (Diehn et al., 1998). The regulatory function of
prematurely polyadenylated transcripts is also seen in the down-regulation of Arabidopsis
flowering time control protein (FCA) expression during flower development (Amasino,
2003). Premature polyadenylation could reduce the level of functional transcripts, negatively
affecting pVA accumulation during fruit development. This may be significant in Cavendish,
where both psy2a and psy2b appear to suffer abnormal post-transcriptional processing. The
Asupina psy2b truncated clone had a premature stop codon prior to the polyadenylation site,
raising the possibility that nonsense-mediated mRNA decay (NMD) may be involved, where
premature termination codons trigger the polyadenylation and subsequent degradation of
truncated transcripts. This can be triggered by long 3’ UTRs or introns in this region and is
thought to be a natural regulatory mechanism of Arabidopsis wild-type genes (Kertész et al.,
2006). However, comparison of truncated psy2b 3’ RACE clones with the Cavendish psy2b
3’RACE clone revealed that they terminate in an adenosine rich region similar to putative
polyadenylation motifs (Dean et al., 1986; Loke et al., 2005). Therefore, the observed
premature polyadenylation in these clones may be due to artefacts caused by preferential
amplification of sequences from cDNA where the 3’ RLM-RACE adapter misprimed onto
this A-rich region of the psy2b coding region rather than the poly (A) tail.
Cavendish is triploid, with three copies of the A genome, and is thought to be an
interspecific hybrid from diploid parents (Heslop-Harrison and Schwarzacher, 2007). As
previously mentioned, Asupina is also thought to be triploid with a genotype of ATT,
containing both A and Fe’i genomes, based on flow cytometry analysis and molecular

57
characterisation (Sharrock and Frison, 1998). The Asupina and Cavendish psy gene family
members identified in this study were each assumed to exist as a single copy per genome.
This was supported by comparison of the NCBI rice genome sequence where single copies
of psy1, psy2 and psy3 were located on chromosomes 6 (GenBank No. NC_008399.1), 12
(GenBank No. NC_008405.1) and 9 (GenBank No. NC_008402.1), respectively.
Additionally, the phylogenetic grouping (Figure 3.9) and level of percentage similarity
between psy1, psy2a and psy2b in both Asupina and Cavendish, appears support this
hypothesis. Therefore, the banana psy genes were each expected to reside at different loci
and have three alleles per locus. The sequences isolated so far suggest that, in both Asupina
and Cavendish, there is little variation at the psy1 locus and that all alleles are intact in the
genome. This is also the case for Asupina psy2a. However, isolation of truncated psy2a 5’
and 3’ RLM-RACE fragments (Figure 3.7) from Cavendish mRNA may indicate that
expression of one or more alleles of these genes may be impaired. Other banana cultivars
possessing the A genome, such as Lakatan (AA), exhibit higher fruit pVA levels (Table 1.2),
suggesting that the presence of the A genome alone is not a sufficient explanation for the low
pVA content of Cavendish fruit. Therefore, the Cavendish psy2a gene may have lost
function over time through mutations. Polyploidy has been linked to genome instability
(Bennetzen, 2007), which can induce genomic rearrangements, or chromosomal insertions
and deletions that may be responsible for Cavendish psy2a alleles that express truncated or
otherwise defective mRNAs.
The Cavendish psy2c partial sequence, a chimera of psy1 and psy2a, was only found once
and could be due to alternate trans-splicing of pre-mRNAs from these two genes, a process
thought to expand proteome diversity by producing novel proteins with unique functions
(Horiuchi and Aigaki, 2006). For example, the pre-mRNAs of the mitochondrial NADH
dehydrogenase subunit genes (nad1, nad2, and nad5) in flowering plants require trans-
splicing for their mature transcripts to be functional (Bonen, 1993). However, there is no
intron at the junction between the two genes, suggesting that other mechanisms such as
genomic rearrangements may be responsible. Alternatively, psy2c may exist only as a gene
fragment (Bennetzen, 2007), a feature that is common in plant genomes. Therefore, further
characterisation using methods such as genome walking is needed to determine whether
psy2c exists in the genome or is a post-transcriptional artefact.
Interestingly, the discovery of two psyX 3’RACE clones may suggest that there are more
members of the banana psy gene family. However, the presence of premature stop codons
may indicate that these clones are derived from a pseudogene, which could prove interesting
as these have not been reported in the psy gene family (Gallagher et al., 2004) but have been

58
identified in other gene families such as the Arabidopsis flavonol synthase (Owens et al.,
2008) and Scots Pine phytochrome (Garcia-Gil, 2008) genes. The current set of psy
sequences isolated from Asupina and Cavendish may not represent all alleles of psy1, psy2a
and psy2b. Further investigation of the ploidy of the Fe’i genome and the copy number of the
psy genes in Asupina and Cavendish using approaches such as southern hybridisation or real-
time PCR will be useful. Ultimately, release of the complete the banana genome sequence
would provide the greatest insight into its structure and organisation. Such work is currently
being undertaken by the Global Musa Genomics Consortium (Lescot et al., 2008).
Analysis of genomic clones confirmed that the three members of the psy gene family isolated
from Asupina and Cavendish mRNA (psy1, psy2a and psy2b) were present in the genome.
Interestingly, the isolated Asupina and Cavendish psy2b genomic sequences confirmed the
legitimacy of both genes despite the unexpected high similarity between their cDNA
sequences. Consequently, more Cavendish psy2b clones need to be obtained from mRNA to
verify the sequence. The difference between the Cavendish psy2b cDNA and genomic
coding regions may be a result of contamination with Asupina sequences or may indicate the
existence of multiple gene copies or allelic variation. This study also showed that the
genomic organisation of the coding region exons of Asupina and Cavendish psy genes is
consistent with that of related monocots such as maize, rice, sorghum (Li et al., 2008a) and
wheat (He et al., 2008), suggesting that these may be indicative of the genomic structure of
banana psy genes as a whole. The differences in the conservation of intron size and gene
structure between the banana (Asupina and Cavendish) psy family members and those of
maize and rice probably represents species-specific differences. The highly conserved central
coding region of psy represented by exons 2 to 5 is likely to contain critical domains relating
to catalytic functions such as substrate specificity, while more variable exons corresponding
to exons 1 and 6 may serve secondary functions that may be specific to each gene.
The gDNA sequences suggest that the difficulties encountered in obtaining complete
Cavendish psy2a mRNA sequence were not due to genomic aberrations, such as insertion of
transposable elements or deletions in the 5’ or 3’ region of the coding region, but may be
caused by other factors such as mRNA processing or stability. As the sequences flanking the
banana psy coding region were not available at this stage, the presence of features such as
introns or genomic aberrations in the 5’ or 3’ UTRs was unknown. Although the isolation of
more clones may be required to confirm the gDNA sequences obtained, particularly in the
introns, the number of clones was sufficient to determine the gene structure corresponding to
the Asupina and Cavendish psy coding regions. Interestingly, the partial clones which
included introns are likely to be due to incomplete mRNA processing rather than to gDNA

59
contamination as the genomic psy coding regions have three introns in the region amplified
by the degenerate primers, while all of the intron bearing clones obtained from mRNA had
only one intron.
Multiple variant clones of the Asupina psy1 and Cavendish psy2a coding regions were also
obtained from cDNA, and comparison with the respective genomic sequences suggested that
they were a result of alternate or cryptic splicing. Exon 2 of the Asupina psy1 variant was
completely excised, leaving an otherwise complete coding region that could encode a
functional protein. However, Cavendish psy2a pre-mRNA may be processed into two
isoforms that do not appear to produce functional PSY proteins. Alternate splicing is
common in plants (Wang and Brendel, 2006; Reddy, 2007) and has recently been reported
for psy1 in wheat (Howitt et al., 2009), and is discussed further in Chapter 5. High levels of
non-functional psy2a transcripts in Cavendish fruit, compared to the Asupina psy2a which
appears normal, may result in lower enzyme activity in Cavendish fruit. This could in turn
explain the difference in the pVA content of the fruit of these two banana cultivars.
Due to time constraints, isolation of the complete psy sequences from these cultivars took
priority over further analysis of partial clones. The number of clones used to derive some
consensus sequences for analysis was low or occasionally was based on only a single clone,
as in the case of Cavendish psy2c. Also, the number of tissue types analysed was limited as
fruit tissue was available for only Asupina and Cavendish. To improve the detection of psy
gene family members in banana, the range of tissues from which mRNA is isolated could be
expanded to include other tissues such as roots and flowers. The psy mRNAs for which
clones were difficult to obtain may have low expression levels in the tissues that were
targeted. The primary aim of this chapter was to determine whether the difference in
carotenoid accumulation between high and low pVA banana varieties could be attributed to
differences in the psy genes at the level of mRNA or gDNA. This study found that the psy
genes in banana exist as a gene family, consistent with existing knowledge in the literature
for other psy genes. Bioinformatic analysis indicated that all complete psy sequences from
both Asupina and Cavendish may encode functional proteins. Whether this is true and
whether these enzymes differ in activity is unknown. The difficulties in obtaining complete
mRNAs for psy2b transcripts and Cavendish psy2a, and the identification of non-functional
variants of the latter, suggest that the psy2 expression may be impaired in Cavendish.
Intriguingly, partial sequence data for psy2c and psyX suggest that the banana psy gene
family may yet be larger. This study also gave an insight into the tissue specificity of psy
gene expression in leaf and fruit, suggesting that psy1 was predominantly found in leaf while
psy2 was expressed mainly in fruit despite being obtained from both tissues.

60
Chapter 4: Characterisation of phytoene synthase enzymes 4.1 Introduction Phytoene synthase (EC 2.5.1.32) occupies an important position in the biosynthesis of
isoprenoids and produces phytoene from the head-to-head condensation of two GGPP
molecules via the intermediate, PPPP. Studies in capsicum and tomato have demonstrated a
requirement for Mn2+ (Dogbo et al., 1988; Fraser et al., 2000) and ATP (Fraser et al., 2000)
as cofactors in this reaction, while in daffodil, Mg2+ enhanced the activity of PSY in the
presence of Mn2+ (Schledz et al., 1996). PSY exists in both soluble and tightly membrane
bound forms, and PSY function requires galactolipids as cofactors (Schledz et al., 1996;
Fraser et al., 2000). PSY has a prenyltransferase catalytic domain similar to enzymes
involved in squalene biosynthesis (Cunningham and Gantt, 1998). This domain is part of the
trans-isoprenyl diphosphate synthases head-to-head (1'-1) condensation reaction
(Trans_IPPS_HH) family (NCBI CDD No. cd00683). PSY is thought to interact with plastid
membranes as well as other enzymes in carotenoid biosynthetic complexes (Cunningham
and Gantt, 1998), and characterisation of purified PSY from capsicum chromoplasts
indicates that it functions as a monomer (Dogbo et al., 1988). Interestingly, it appears that
cleavage of the signal peptide is required for PSY activity as N-terminal truncated versions
were found to be significantly more active than the full length polypeptide (Misawa et al.,
1994; Schledz et al., 1996).
The activity of the PSY enzyme has been analysed in a number of ways. PSY proteins
purified from capsicum chromoplasts (Dogbo et al., 1988) and tomato chloroplasts (Fraser et
al., 2000), were assayed using in vitro phytoene synthesis from radiolabelled substrates to
characterise the kinetic properties of these enzymes. A similar approach was used to
determine the activity of daffodil PSY protein from chromoplast extracts and recombinant
PSY protein produced in insect cells (Schledz et al., 1996). The activity of PSY proteins has
also been analysed through functional complementation in prokaryotic systems containing
components of the carotenoid biosynthetic pathway (Cunningham and Gantt, 1998). Mutants
of the photosynthetic bacterium Rhodobacter capsulatus were used to determine the
enzymatic activity of tomato PSY1 and PSY2 and the accumulated carotenoids were
extracted for analysis (Bartley et al., 1992; Bartley and Scolnik, 1993). The entire carotenoid
biosynthetic pathway has also been integrated into E. coli strains which have been used to
test the function of a number of PSY proteins from a range of organisms including
prokaryotes such as Erwinia uredovora (Neudert et al., 1998) and Erwinia herbicola (Iwata-

61
Reuyl et al., 2003), and plants such as tomato (Misawa et al., 1994), Gentiana lutea (Zhu et
al., 2002), and rice (Li et al., 2008a).
Recently, the relative activity of PSY from several sources was compared in transgenic
maize callus in a study aimed at improving the nutritional benefit of golden rice (Paine et al.,
2005). Activity was estimated based on the total carotenoid content in individual transformed
calli as well as the proportion of calli with high carotenoid content. The maize (B73),
tomato, capsicum and rice PSY1 proteins were the most active of the seven tested. The gene
encoding B73PSY1 (ZPSY1) was subsequently transformed into rice, resulting in Golden
Rice 2, which produced lines yielding as much as 37 μg/g total carotenoid levels in the
endosperm, 23 fold higher than levels previously reported (Ye et al., 2000). The use of a
callus-based expression system provides a simple method for the simultaneous analysis of a
number of PSY proteins. The aim of the work reported in this chapter was to test the
hypothesis that PSY enzymatic activity was responsible for differences between the fruit
pVA content of Asupina and Cavendish cultivars. Therefore, PSY protein sequences from
these cultivars were analysed to investigate whether any significant differences exist in their
sequence or structure. The enzymatic activity of these proteins was also compared by
measuring their effects on carotenoid accumulation in rice callus.
4.2 Materials and methods 4.2.1 Bioinformatic analysis of banana PSY protein sequences The banana PSY protein sequences were translated from the Asupina and Cavendish psy
coding region consensus sequences (psy1, psy2a and psy2b), while maize psy1 (Zpsy1) was
included as a reference. The Cavendish psy2b genomic sequence was translated because the
mRNA-derived coding region was identical to that of Asupina psy2b (Chapter 3.3.5.1). The
primary structure of these proteins was analysed using ScanProsite (de Castro et al., 2006),
on the ExPASy proteomics server, to search the PROSITE database for conserved motifs
(Hulo et al., 2008). PSY primary structure was also compared using The CD Search tool
(Marchler-Bauer and Bryant, 2004), on the NCBI website to search the CDD (Marchler-
Bauer et al., 2009). From these results, an alignment of the banana PSY sequences was
constructed to highlight conserved amino acids identified by CDD and PROSITE.
Secondary structure was analysed using SSpro v4.5 (Pollastri et al., 2002,
http://scratch.proteomics.ics.uci.edu/), which was rated best performing prediction software
by the EVA (continuous automatic EVAluation of protein structure prediction servers)
benchmarking method (Eyrich et al., 2001). Secondary structure regions were then
highlighted on a multiple sequence alignment produced using the Clustal W2 program

62
(Larkin et al., 2007) v2.0.1.0 provided by the European Bioinformatics Institute (EBI)
(www.ebi.ac.uk) using default parameters. The predicted secondary structures were then
superimposed onto this alignment for visualisation.
The Protein Homology/analogY Recognition Engine (PHYRE) server v0.2 (Kelley and
Sternberg, 2009) was used to predict the tertiary structures of the PSY protein query
sequences because analysis using the first approach mode of the SWISS-MODEL server
(Arnold et al., 2006) failed to generate any results. PHYRE returned several tertiary structure
predictions based on several of the isoprenoid biosynthetic enzymes. These structures were
viewed using SPDBV (Swiss PDB deep view) v4.0 (Kaplan and Littlejohn, 2001), which
also enabled modelling of the GGPP substrate within the PSY protein structure. This was
achieved by superimposing the APSY1 protein with the human squalene synthase (SQS)
protein complexed to GGPP (RSCB PDB No. 2q80), before merging the GGPP and PSY
molecules into one layer.
4.2.2 Cloning of psy coding regions into binary vectors The coding region clones were originally in the pGEM-T Easy vector and included BamHI
and XbaI restriction sites at their 5’ and 3’ ends as a result of primers used to amplify them
(Table 3.2). The clones: Asupina psy1 (clone 13), Asupina psy2a (clone 2), Cavendish psy1
(clone P4) and Cavendish psy2a (clone 1) were selected for subcloning into the pCAMBIA-
1302 binary vector backbone (GenBank No. AF234298.1), obtained as an E. coli stab culture
from Dr Harjeet Khanna (QUT). The intermediate cloning vectors, pGEM-4Z-nos-GUS-nos
and pGEM-4Z-ubi-gus-nos was obtained from Dr Jason Geijskes (QUT).
Asupina and Cavendish psy1 and psy2a coding region binary vectors were constructed in
three main steps summarised in Figure 4.1a. The first step facilitated attachment of the
nopaline synthase (nos) terminator to the 3’ end of the psy coding region. The psy coding
region fragment was excised from the pGEM-T Easy vector by BamHI/XbaI double
digestion and ligated into the pGEM-4Z-nos-GUS-nos cloning vector backbone to replace
the gus coding region which was controlled by the nos promoter and nos terminator, forming
pGEM-4Z-nos-psy-nos (Figure 4.1a i). The maize ubiquitin (ubi) promoter was subsequently
attached to the 5’ end of the psy coding region fragment. The psy-nos fragment was excised
from pGEM-4Z-nos-psy-nos with BamHI/EcoRI, and ligated into pGEM-4Z-ubi-gus-nos to
replace the gus-nos cassette, forming the vector pGEM-4Z-ubi-psy-nos (Figure 4.1a ii). This
step was carried out because the ubi promoter has four internal XbaI restriction sites,
preventing a more direct approach. The third step involved subcloning the ubi-psy-nos

63
expression cassette from the pGEM-4Z vector backbone into the pCAMBIA-1302 vector
(Figure 4.1a iii). The cassette was excised from the pGEM-4Z vector by HindIII/EcoRI
double digestion and ligated into the HindIII/EcoR1 linearised pCAMBIA-1302 backbone, to
form pCAMBIA-1302-ubi-psy-nos (Figure 4.1b). This was possible because the ubi promoter
available at QUT lacks an active EcoRI site. The maize B73 psy1 coding region (positive
control) was available in another binary vector, pBIN-ubi-b73-nos, obtained from Dr Jason
Geijskes (QUT) as purified pDNA. The ubi-b73-nos cassette was excised from the pBIN
vector by HindIII/EcoRI double digestion and ligated into the HindIII/EcoR1 linearised
pCAMBIA-1302 backbone. Completed vectors were sequenced using universal forward and
reverse sequencing primers (Chapter 2.2.10) and ubi-intron-F01 (5’-
GATTTTTTTAGCCCTGCCTTC-3’), a forward primer designed to check restriction site
integrity at the 3’ end of the ubi promoter. Products from restriction digestions (carried out
as per Chapter 2.2.2) were separated at each cloning stage using agarose gel electrophoresis
and gel purified before the selected fragments were ligated together (Chapter 2.2.2 to 2.2.5).
Ligation reactions were transformed into E. coli and selected on LB containing 100 μg/mL
kanamycin (Chapter 2.2.6). Colonies containing putative clones were grown overnight and
the plasmids recovered by alkaline lysis miniprep (Chapter 2.2.7 to 2.2.8). The pCAMBIA-
1302 psy vector DNA was purified from E. coli using the UltraClean 6 Minute Mini
Plasmid Prep Kit (Mobio Laboratories inc., Chapter 2.2.6), prior to transformation into
Agrobacterium.

64
a) i)
ii)
iii)
b)
Figure 4.1: Construction of psy coding region binary vectors showing a) overview of steps used to subclone the banana psy coding regions into the pCAMBIA-1302 binary vector: i) addition of nopaline synthase (nos) terminator (n) to psy coding region (CR), ii) addition of ubiquitin (ubi) promoter to psy coding region/nos terminator fragment to make a ubi-psy-nos expression cassette in pGEM-4Z and iii) insertion of psy expression cassette into pCAMBIA-1302. b) pCAMBIA-1302 binary vector between the left (L) and right (R) T-DNA borders including the psy, hygromycin (hptII) selection and gfp reporter gene expression cassettes and including critical restriction sites. The position of sequence elements removed by restriction digestion is denoted as (x). The CaMV35S single (35S) and duplicated (35S2) promoters, and CaMV35S terminator (c) are marked.
Ligation
pCAMBIA-1302-ubi-psy-nos
pGEM-4Z vector
+
ubi-psy-nos
pGEM-4Z-ubi-psy-nos
HindIII/EcoRI
Circular pCAMBIA-1302 vector
Linear pCAMBIA-1302 vector
HindIII/EcoRI
Ligation
pGEM-4Z-ubi-psy-nos
pGEM-4Z-ubi-gus-nos
pGEM-4Z-ubi-x-x
+ gus-nos
BamHI/EcoRI
+
psy-nos
pGEM-4Z-nos-psy-nos
pGEM-4Z-nos-x-x
BamHI/EcoRI
Ligation
pGEM-4Z-nos-psy-nos
pGEM-T Easy psy clone
pGEM-T Easy vector
+
psy CR
BamHI/XbaI
pGEM-4Z-nos-gus-nos
pGEM-4Z-nos-x-nos
+ gus CR
BamHI/XbaI

65
4.2.3 Functional analysis of psy genes in rice 4.2.3.1 Callus induction and maintenance
Rice callus was selected as the model system for the comparison of Asupina and Cavendish
PSY enzyme activity. Callus was induced from germinating rice seeds (Oryza sativa L. ssp.
japonica cv. Nipponbare) essentially as previously described (CAMBIA, 2009b).
Approximately 900 seeds were manually de-husked before incubation in three volumes of
70% ethanol for 1 min. Seeds were washed five times in mqH2O and sterilised in a solution
containing 4.0% hypochlorite (w/v) with one drop of Tween-20 and rotated on a suspension
mixer (Ratek) at room temperature for 30 min at 30 rpm. Seeds were washed at least six
times in sterile mqH2O (until of the smell of bleach dissipated), blotted dry and plated at ~20
seeds per plate onto 2N6 media (Chapter 2.3) before germination in the dark at 25 °C for
four weeks. Callus pieces, ~2.5 mm in size, were removed from the germinating seeds,
transferred to fresh 2N6 media and multiplied for four weeks. Callus was maintained on 2N6
media with subculturing every four weeks.
4.2.3.2 Transformation of Agrobacterium with binary vectors
pCAMBIA-1302 and pCAMBIA-1302-ubi-psy-nos binary vectors containing maize psy1, and
Asupina and Cavendish psy1 and psy2a coding regions were transformed into
Agrobacterium tumefaciens (AGL1 strain), using a modified protocol based on a previous
method (Dower et al., 1988). pDNA (~1 µg) was mixed with 50 µL electrocompetent AGL1
cells (kindly supplied by Don Catchpoole, QUT), transferred to an electroporation cuvette
(Cell Projects; 0.2 cm electrode gap) and electroporated at 2800 V. The cells were mixed
with SOC media (950 µL, Chapter 2.3) and incubated at 28 °C for 2 hr at 195 rpm.
Transformed cells (50 µL) were plated onto solid LB media (Chapter 2.3) supplemented with
25 µg/mL rifampicin and 50 µg/mL kanamycin and incubated at 28 °C for 48 to 72 hr.
Transformed colonies were inoculated into 5 mL LB liquid media (Chapter 2.3) containing
25 µg/mL rifampicin and 50 µg/mL kanamycin and incubated at 28 °C for 72 hr. Cultures
were then streaked onto YM solid media (Chapter 2.3) containing the same antibiotic
selection and grown at 28 °C for 72 hr. The transformed cells on YM solid media were
stored at 4 °C and subcultured weekly onto fresh media. The pART-TEST7 binary vector
containing the gfp reporter gene, and used as a control vector, was obtained as an
Agrobacterium (AGL1 strain) liquid culture (kindly supplied by Jennifer Kleidon, QUT) and
was maintained on YM solid media containing 100 µg/mL spectinomycin.
66
4.2.3.3 Preparation of Agrobacterium for transformation of rice callus
A single Agrobacterium colony containing the plasmid of interest was inoculated in LB
liquid media (5 mL), containing 100 µg/mL spectinomycin or 50 µg/mL kanamycin for
pART-TEST7 and pCAMBIA-1302 vectors, respectively. Cultures were incubated at 28 °C
for 72 hr at 195 rpm, before addition of further LB liquid media (20 mL) and incubation at
28 °C overnight at 195 rpm. Two overnight Agrobacterium cultures were prepared per
pDNA treatment and bacterial concentration measured at OD600.
4.2.3.4 Transformation of rice callus
Three methods for the Agrobacterium-mediated transformation of rice callus were
investigated: (i) the transformation protocol according to CAMBIA (CAMBIA, 2009b), (ii)
the centrifugation assisted Agrobacterium-mediated transformation (CAAT) method
(Khanna et al., 2004), and (iii) a modified version of the CAAT protocol that used media
from the CAMBIA protocol. Proliferation and selection controls included untransformed rice
callus grown on media with or without antibiotic selection.
(i) CAMBIA method
Overnight Agrobacterium cultures were pelleted by centrifugation at 3880 × g for 1 min at
room temperature. The bacteria were resuspended in AAM media (Chapter 2.3) containing
100 µM acetosyringone to an OD600 of 1.0 and incubated for 3 hr at room temperature with
gentle shaking. Thirty rice calli (~2.5 mm in size), were mixed with Agrobacterium
suspension (10 mL). Callus for the untransformed negative control was mixed with AAM
media without Agrobacterium. This mixture was swirled vigorously then incubated for 40
min at room temperature. The callus was blotted dry on sterile paper towel and transferred to
Petri dishes containing 2N6-AS (2N6 media with 100 µM acetosyringone) media. The calli
were then co-cultivated with the Agrobacterium for 3 days at 25 °C in the dark.
(ii) CAAT method
Overnight Agrobacterium cultures were pelleted by centrifugation at 3880 × g for 10 min at
room temperature. The bacteria were then resuspended in BRM media (Chapter 2.3)
containing 100 µM acetosyringone to an OD600 of 0.7 and incubated for 3 hr at room
temperature with gentle shaking. Thirty subcultured calli (~2.5 mm in size) were mixed with
10 mL preheated 2N6 media and incubated for 5 min at 45 °C before removal of 2N6 media
and addition of BRM media (10 mL) containing Agrobacterium. Untransformed control calli
were mixed with BRM media lacking Agrobacterium. Pluronic F68 (0.02% v/v final
concentration) was added to the calli, which were centrifuged at 670 × g for 10 min and

67
incubated at room temperature for 30 min. The BRM media was removed from the calli,
which were blotted dry and co-cultivated with the Agrobacterium on CCM media (Chapter
2.3) for 3 days at 25 °C in the dark.
(iii) Rice heat shock method
The rice heat shock-assisted Agrobacterium-mediated protocol was essentially the same as
the CAAT protocol with the following modifications. Firstly, the Agrobacterium cultures
were pelleted by centrifugation at 3880 × g for 1 min and resuspended in AAM media as per
the CAMBIA protocol. Secondly, the calli were left to sit at room temperature for 40 min
after centrifugation at 670 × g for 10 min. Finally, the calli were blotted dry and left to co-
cultivate on 2N6-AS media as per the CAMBIA protocol. This experiment was carried out to
assess whether the CAAT method could be successfully modified to replace its more
complex media with those used in the CAMBIA protocol.
Callus washing, selection and visual analysis of rice callus
After co-cultivation, calli were agitated in 25 mL timentin wash solution (200 µg/mL
timentin in sterile mqH2O) before incubation for 30 min at room temperature. The calli were
washed in 25 mL timentin wash solution five times (until the solution was clear) and blotted
dry on sterile filter paper. Calli were maintained in the dark at 25 °C on 2N6-TG40 (2N6
media supplemented with 200 µg/mL timentin and 40 µg/mL geneticin) and subcultured
every two to four weeks for selection of pART-TEST7 transformants. Cells transformed with
pCAMBIA-1302-based vectors were initially incubated for two weeks in the dark at 25 °C in
2N6-TH25 (2N6 media supplemented with 200 µg/mL timentin and 25 µg/mL hygromycin)
to assist cell recovery. Thereafter, callus was maintained in the dark at 25 °C on 2N6-TH50
media (2N6 supplemented with 200 µg/mL timentin and 50 µg/mL hygromycin) with
subculturing every two to four weeks. Untransformed calli were grown with and without
antibiotic selection to assess selection effectiveness and proliferative capacity, respectively.
Calli were assessed for carotenoid accumulation and GFP expression two, four and six
weeks post transformation and photographed using the SZ-CTV stereo microscope
(Olympus) with CAMEDIA C-5060 camera (Olympus).
4.2.4 Analysis of carotenoid accumulation in rice callus Carotenogenic callus (300 to 400 mg) was collected and freeze dried overnight in a Flexi-
Dry MP freeze drying system (FTS Systems). The dried callus was weighed and ground with
a 2 mm stainless steel bead in a Mini-Beadbeater-8 (Biospec Products) for 1 min at medium
speed. Total carotenoids were extracted three times from the ground callus using acetone (2

68
mL, HPLC grade) and the supernatants collected at 3880 × g for 5 min at room temperature
under low light conditions to prevent carotenoid degradation. The acetone supernatants were
pooled before addition of 2 mL 2:1 v/v petroleum ether 40-60 °C fraction (PE): diethyl ether
(DE) [PE:DE, HPLC grade] and 1% w/v NaCl to a final volume of 14 mL, before extraction
of carotenoids at 3880 × g for 5 min at room temperature. The upper organic phase (1 mL)
was collected and a further 1 mL PE:DE (2:1 v/v) was added to the acetone supernatants
before another 1 mL of the organic phase was extracted. Extracted carotenoids were dried
under vacuum and resuspended in 2 mL chloroform. For simplicity, total carotenoid content
was assumed to be entirely β-carotene (measured at 465 nm) as carotenoid accumulation
would be due to PSY activity. Samples were compared against a β-carotene (Sigma-Aldrich)
standard curve measured at 465 nm and carotenoid concentration (μg/g dry weight) was
calculated. Results were graphed and analysed statistically in Excel 2007 (Microsoft) and
SPSS v16 (SPSS Inc.), respectively.
4.3 Results 4.3.1 PSY protein sequence analysis
4.3.1.1 Primary sequence analysis
The primary amino acid sequences of three Asupina and three Cavendish PSY proteins were
analysed for putative differences that could affect enzyme activity and possibly explain the
variation in pVA accumulation in these cultivars. Maize B73 PSY1 (ZPSY1) was included
for comparison.
Analysis of the PSY protein sequences against the CDD confirmed that they had the Trans-
IPPS-HH domain required for isoprenoid synthesis (Figure 4.2). This domain contains the
PSY active site and the amino acids that interact with the GGDP substrate and cation
cofactor. Two aspartic acid rich motifs (ARMs, Figure 4.2), each five residues long, were
predicted to serve the dual role of substrate and cofactor binding. However, the aspartic acid
residues in both ARMs were also predicted to form part of the substrate binding pocket and
active site (catalytic residues). The active site and substrate binding pocket also share many
amino acids. ScanProsite analysis identified two motifs within the Trans_IPP-HH domain of
the banana and maize PSY sequences called squalene/phytoene synthase signatures 1 and 2
(SQS-PSY1 and SQS-PSY2), which comprised 16 and 26 amino acids, respectively (Figure
4.2). The conserved SQS-PSY signatures formed by the alignment of the six banana PSY
sequences and ZPSY1 were referred to as the local consensus (Figure 4.2). SQS-PSY1 was
completely conserved in all banana PSY sequences and ZPSY1, while SQS-PSY2 was not as
highly conserved as SQS-PSY1.

69
1 11 21 31 41 APSY2B ERCGEVCAEYAKNFYLGTLLMTPERRRAIWAIDVWCRRTDELVDGPNASH CPSY2B ERCGEVCAEYAKTFYLGTLLMTPERRRAIWAIYVWCRRTDELVDGPNASH APSY2A ERCGEVCAEYAKTFYLGTMLMTPERRRAIWAIYVWCRRTDELVDGPNASH CPSY2A ERCGEVCAEYAKTFYLGTMLMTPERRKAIWAIYVWCRRTDELVDGPNASH APSY1 DRCGEVCAEYAKTFYLGTLLMTPERRRAIWAIYVWCRRTDELVDGPNASQ CPSY1 DRCGEVCAEYAKTFYLGTLLMTPERRRAIWAIYVWCRRTDELVDGPNASQ ZPSY1 DRCGEICEEYAKTFYLGTMLMTEERRRAIWAIYVWCRRTDELVDGPNANY Lid .........YAKTF.................................... Catalytic .............F..................Y......D...D...... Pocket ...........K.F..................Y...R..D...D...... ARM1 .......................................DELVD...... 51 61 71 81 91 APSY2B MTPTALDRWQNRLEDLFNGRPYDLYDAALSDTVSKFPVDIQPFKAMVDGM CPSY2B MTPTALDRWQNRLEDLFNDRPYDMYDAALSDTVSKFPVDIQPFKDMIDGM APSY2A ITPTALDRWSNRLEDLFAGRPYDMYDAALSDTVSKFPVDMQPFKDMVEGM CPSY2A ITPTALDRWSNRLEDLFAGRPYDMYDAALSDTASNFPVDMQPFKDMIEGM APSY1 ITPTALDRWESRLEDVFAGRPYDMLDAALSDTVSKYPVDIQPFRDMIEGM CPSY1 ITPTALDRWESRLDDVFAGRPYDMLDAALSDTVSKYPVDIQPFRDMIEGM ZPSY1 ITPTALDRWEKRLEDLFTGRPYDMLDAALSDTISRFPIDIQPFRDMIEGM 101 111 121 131 141 APSY2B RMDLWKSRYNNFDELYLYCYYVAGTVGLMSVPVMGIAPDSKASTESVYNA CPSY2B RMDLWKSRYNNFDELYLYCYYVAGTVGLMSVPVMGIAPDSKASTESVYNA APSY2A RMDLRKSRYKNFDELYLYCYYVAGTVGLMSVPVMGIAPDSKASAESVYGA CPSY2A RMDLRKSRYKNFDELYLYCYYVAGTVGLMSVPVMGIAPDSKASAESVYSA APSY1 RMDLKKSRYKNFDELYLYCYYVAGTVGLMSVPVMGIAPESKATTESVYGA CPSY1 RMDLKKSRYKNFDELYLYCYYVAGTVGLMSVPVMGIAPESKATTESVYGS ZPSY1 RSDLRKTRYNNFDELYMYCYYVAGTVGLMSVPVMGIATESKATTESVYSA Catalytic .................Y.......V...S.................... Pocket .................Y....A...G....................... SQS-PSY1 .................YCyyVAGTVGlmSvpV................. 151 161 171 181 191 APSY2B ALALGIANQLTNILRDVGEDARRGRIYLPQDELAQAGLSDDDIFKGRVTD CPSY2B ALALGIANQLTNILRDVGEDARRGRIYLPQDELAQAGLSDDDVFKGRVTD APSY2A ALALGIANQLTNILRDVGEDSRRGRVYLPQDELAQAGLSDDDVFEGRVTD CPSY2A ALALGIANQLTNILRDVGEDSRRGRVYLPQDELAHAGLSDDDVFEGRVTD APSY1 ALALGLANQLTNILRDVGEDARRGRIYLPQDELAQAGISDEDIFDGKVTE CPSY1 ALALGLANQLTNILRDVGEDARRGRIYLPQDELAQAGLSDEDIFGGKVTE ZPSY1 ALALGIANQLTNILRDVGEDARRGRIYLPQDELAQAGLSDEDIFKGVVTN Catalytic .......N......RD...D....R......................... Pocket ....G..N......RD..ED....R......................... ARM2 ...............DVGED.............................. SQS-PSY2 ...LGianQltNIlRDVgeDarrgRiYlP..................... 201 211 221 231 241 APSY2B KWRSFMKGQIRRARMFFEEAEKGIYELNSASRWPVLASLLLYRQILDAIE CPSY2B KWRSFMKGQIRRARMFFEEAEKGIHELNSASRWPVLASLLLYRQILDAIE APSY2A KWRTFMKGQITRARMFFDEAEKGIYELNSASRWPVLASLLLYRQILDAIE CPSY2A KWRTFMKGQITRARMFFDEAEKGIYELNSASRWPVLASLLLYRQILDAIE APSY1 KWRSFMKNQIKRARMFFQQAEAGVTELNRASRWPVWASLQLYRQILDEIE CPSY1 KWRSFMKNQIKRARMLFQQAEAGVTELNRASRWPVWASLQLYRQILDEIE ZPSY1 RWRNFMKRQIKRARMFFEEAERGVTELSQASRWPVWASLLLYRQILDEIE Catalytic ................................WP...S............ Pocket ................................WP................ 251 261 APSY2B ANDYNNFTRRAYVGIAKKLA CPSY2B ANDYNNFTRRAYVGKAKKLA APSY2A ANDYNNFTKRAYVGKAKKLA CPSY2A ANDYNNFTKRAYVGKAKKLA APSY1 ANDYNNFTKRAYVSKAKKLL CPSY1 ANDYNNFTKRAYVSKAKKLL ZPSY1 ANDYNNFTKRAYVGKGKKLL Lid .........RAYV.......
Figure 4.2: Primary structure of banana PSY proteins. Sequence alignment showing the location of the functional residues in the Trans-IPPS-HH domain predicted by the Conserved Domain Database (CDD) that constitute the active site lid (Lid), catalytic residues (Catalytic), GGPP binding pocket (Pocket) and substrate/Mg2+ binding sites (ARM1 and ARM2; which are also the aspartic acid rich regions) in their respective positions below the alignment. The squalene/phytoene synthase signatures 1 and 2 (SQS-PSY1 and SQS-PSY2) were included for comparison. Partially conserved amino acids are highlighted in grey. The Trans-IPPS-HH domain is represented by residues at different positions in the: APSY1 (137 to 406), CPSY1 (137 to 406), APSY2A (104 to 373), CPSY2A (107 to 376), PSY2B (106 to 375) and ZPSY1 (120 to 389) proteins. Upper and lower case letters in SQS-PSY1 and SQS-PSY2 represent amino acids that are critical and non critical, respectively, according to the respective Prosite consensus sequences.
70
Comparison of the residues characterised using CDD with the SQS-PSY motifs showed that
SQS-PSY1 contained three residues of the active site and substrate binding pocket.
Comparatively, SQS-PSY2 accounted for approximately 39% of the substrate binding pocket
residues and 33% of the catalytic residues. Interestingly, several conserved residues in the
SQS-PSY motifs (designated by capital letters in Figure 4.2 local consensus) were not
assigned a function by CDD (Figure 4.2). All but two of the functional residues in the motifs
identified by CDD were completely conserved across the analysed banana and maize
sequences. These differences, which both occurred in APSY2B, were in the fourth residue of
the first active site lid motif (T118N) and at the tyrosine residue that appears to be involved
in both catalytic activity and substrate binding, respectively (Y135D, Figure 4.2). Many
amino acids other than the functional residues were not conserved, and some differences
were unique to specific PSYs. However, there were numerous examples where limited
conservation was observed in a manner similar to that previously observed upon analysis of
the SQS-PSY2 motif. In these cases one group of proteins shared a particular residue at a
given position while the other group of sequences shared a different residue at the same
position; this was also observed for pairs of neighbouring amino acids. For example, the
glutamic acid residue at position 191 (Figure 4.2) in the PSY1 proteins was an aspartic acid
residue in the PSY2A and PSY2B at this location. This residue was located in a region with
several aspartic acid residues, 11 amino acids C-terminal to SQS-PSY2 whose residues were
DED and DDD in the PSY1 and PSY2 proteins, respectively (Figure 4.2). In total, 35
residues were conserved in this manner.
4.3.1.2 Secondary and tertiary sequence analysis
Secondary structure of the PSY protein was examined for putative structural differences that
could affect enzyme function in light of the primary structure analysis. The banana and
maize PSYs consisted primarily of α-helices and coiled regions with a small number of
residues in extended configuration (Figure 4.3a). Fifteen predicted α-helices were conserved
in all the banana PSY proteins and ZPSY1 within a region of approximately 320 amino
acids. Generally, the lengths of these helices were well conserved across these proteins,
especially towards the C-terminus where the functional domain is located (Figure 4.3a).
Predicted lengths of conserved α-helices range from two (Helix 13) to approximately 30
amino acids (Helix 9), and some were separated by only one or two residues. However, the
lengths of some of the conserved helices did vary between the PSY proteins. The most
notable was Helix 1, which was approximately 20 amino acids in all PSYs except CPSY2A
where it was 28 amino acids long. This was predicted to be due to a tandem repeat of 3

71
a) Helix # n1 n2 n3 APSY2B MSGSIVWVVSP---------KESIR-------CSLLNQFIEVKRRSWRRSSVA------- 37 CPSY2B-gDNA MSGSIVWVVSP---------KESIR-------CSLLNQFIEVKRRSWRRSSVE------- 37 APSY2A MSGSIVWVATP---------KEASR-------SSGFNQFVGVTRRWWRSSSAG------- 37 CPSY2A MSGSVVWVVSP---------KETSR-------SSGFSQFAGVKRRWWRSSSAG------- 37 APSY1 MACLLLRMIAPADIPSGLGSAEAVREGDHLPRKAFPPRNNRNLSRKRRRWSLRSPHADSK 60 CPSY1 MACLLLRMIAPADIPAGLGSAEAIREGDRFPRKAFRPRNNRNLSRKRRRWSLRSPHADSK 60 ZPSY1 MAIILVRAASP-----GLSAADSISHQGTLQCSTLL-KTKRPAARRWMPCSLLGLHP--- 51 *: :: :* :: : : * * Helix # n4 n5 n6 c1 ### APSY2B WSFSRPAPASG--HSVPASLVVTPP----RTSEELVYEVVLRQAALVGETKRKRP-ATVQ 90 CPSY2B-gDNA WTCSRPAPSSG--HSVSASLVVTPP----RTSEELVYEVVLRQAALVGETRRKRP-TAVR 90 APSY2A WSCARSASTAR--RSVSASLVVTPP----RSSEELVYDVVLRQAALVGDARRKR---AVE 88 CPSY2A WSCARSASTAR--RSVSASLVVTPP----RSSEALVYDVVLRQAALVGEARRKRAVEAVE 91 APSY1 YASLRFDPESGRNLPLVSSLLTSTAGEVAVSSEQKVYNVVLKQAALV--KQQPRSSTAPD 118 CPSY1 YASLRFDPESGMNLPLVSSLLTSTAGEVAVSAEQKVYNVVLKQAALV--KQQPRSSTALD 118 ZPSY1 WEAGRPSP------AVYSSLAVNPAGEAVVSSEQKVYDVVLKQAALL--KRQLR-TPVLD 102 : * . .: :** .... ::* **:***:****: :: * . Helix # c2 3 c4 APSY2B LPP----VPLRGDLLYEAYERCGEVCAEYAKNFYLGTLLMTPERRRAIWAIDVWCRRTDE 146 CPSY2B-gDNA LPQ----VPLRGDLLIEAYERCGEVCAEYAKTFYLGTLLMTPERRRAIWAIYVWCRRTDE 146 APSY2A APP----APLRGDLLDAAYERCGEVCAEYAKTFYLGTMLMTPERRRAIWAIYVWCRRTDE 144 CPSY2A APP----APLRGDLLDAAYERCGEVCAEYAKTFYLGTMLMTPERRKAIWAIYVWCRRTDE 147 APSY1 VKP-DTVIPGSVGLLKEAYDRCGEVCAEYAKTFYLGTLLMTPERRRAIWAIYVWCRRTDE 177 CPSY1 VKP-DTVIPGSVGLLKEAYDRCGEVCAEYAKTFYLGTLLMTPERRRAIWAIYVWCRRTDE 177 ZPSY1 ARPQDMDMPRNG--LKEAYDRCGEICEEYAKTFYLGTMLMTEERRRAIWAIYVWCRRTDE 160 * * **:****:* ****.*****:*** ***:***** ******** Helix # c5 c6 c7 APSY2B LVDGPNASHMTPTALDRWQNRLEDLFNGRPYDLYDAALSDTVSKFPVDIQPFKAMVDGMR 206 CPSY2B-gDNA LVDGPNASHMTPTALDRWQNRLEDLFNDRPYDMYDAALSDTVSKFPVDIQPFKDMIDGMR 206 APSY2A LVDGPNASHITPTALDRWSNRLEDLFAGRPYDMYDAALSDTVSKFPVDMQPFKDMVEGMR 204 CPSY2A LVDGPNASHITPTALDRWSNRLEDLFAGRPYDMYDAALSDTASNFPVDMQPFKDMIEGMR 207 APSY1 LVDGPNASQITPTALDRWESRLEDVFAGRPYDMLDAALSDTVSKYPVDIQPFRDMIEGMR 237 CPSY1 LVDGPNASQITPTALDRWESRLDDVFAGRPYDMLDAALSDTVSKYPVDIQPFRDMIEGMR 237 ZPSY1 LVDGPNANYITPTALDRWEKRLEDLFTGRPYDMLDAALSDTISRFPIDIQPFRDMIEGMR 220 *******. :********..**:*:* .****: ******* *.:*:*:***: *::*** Helix # c8 c9 APSY2B MDLWKSRYNNFDELYLYCYYVAGTVGLMSVPVMGIAPDSKASTESVYNAALALGIANQLT 266 CPSY2B-gDNA MDLWKSRYNNFDELYLYCYYVAGTVGLMSVPVMGIAPDSKASTESVYNAALALGIANQLT 266 APSY2A MDLRKSRYKNFDELYLYCYYVAGTVGLMSVPVMGIAPDSKASAESVYGAALALGIANQLT 264 CPSY2A MDLRKSRYKNFDELYLYCYYVAGTVGLMSVPVMGIAPDSKASAESVYSAALALGIANQLT 267 APSY1 MDLKKSRYKNFDELYLYCYYVAGTVGLMSVPVMGIAPESKATTESVYGAALALGLANQLT 297 CPSY1 MDLKKSRYKNFDELYLYCYYVAGTVGLMSVPVMGIAPESKATTESVYGSALALGLANQLT 297 ZPSY1 SDLRKTRYNNFDELYMYCYYVAGTVGLMSVPVMGIATESKATTESVYSAALALGIANQLT 280 ** *:**:******:********************.:***::****.:*****:***** Helix # c10 c11 c12 APSY2B NILRDVGEDARRGRIYLPQDELAQAGLSDDDIFKGRVTDKWRSFMKGQIRRARMFFEEAE 326 CPSY2B-gDNA NILRDVGEDARRGRIYLPQDELAQAGLSDDDVFKGRVTDKWRSFMKGQIRRARMFFEEAE 326 APSY2A NILRDVGEDSRRGRVYLPQDELAQAGLSDDDVFEGRVTDKWRTFMKGQITRARMFFDEAE 324 CPSY2A NILRDVGEDSRRGRVYLPQDELAHAGLSDDDVFEGRVTDKWRTFMKGQITRARMFFDEAE 327 APSY1 NILRDVGEDARRGRIYLPQDELAQAGISDEDIFDGKVTEKWRSFMKNQIKRARMFFQQAE 357 CPSY1 NILRDVGEDARRGRIYLPQDELAQAGLSDEDIFGGKVTEKWRSFMKNQIKRARMLFQQAE 357 ZPSY1 NILRDVGEDARRGRIYLPQDELAQAGLSDEDIFKGVVTNRWRNFMKRQIKRARMFFEEAE 340 *********:****:********:**:**:*:* * **::**.*** ** ****:*::** Helix # c13 c14 c15 APSY2B KGIYELNSASRWPVLASLLLYRQILDAIEANDYNNFTRRAYVGIAKKLASLPIAYARALR 386 CPSY2B-gDNA KGIHELNSASRWPVLASLLLYRQILDAIEANDYNNFTRRAYVGKAKKLASLPIAYARALL 386 APSY2A KGIYELNSASRWPVLASLLLYRQILDAIEANDYNNFTKRAYVGKAKKLASLPIAYAKAVI 384 CPSY2A KGIYELNSASRWPVLASLLLYRQILDAIEANDYNNFTKRAYVGKAKKLASLPIAYAKAVI 387 APSY1 AGVTELNRASRWPVWASLQLYRQILDEIEANDYNNFTKRAYVSKAKKLLALPVAYGRSLI 417 CPSY1 AGVTELNRASRWPVWASLQLYRQILDEIEANDYNNFTKRAYVSKAKKLLALPVAYGKSLI 417 ZPSY1 RGVTELSQASRWPVWASLLLYRQILDEIEANDYNNFTKRAYVGKGKKLLALPVAYGKSLL 400 *: **. ****** *** ******* **********:****. .*** :**:**.::: Helix # n7 APSY2B -GPSRFTGATRT- 397 CPSY2B-gDNA -GPSRFTGATRT- 397 APSY2A VGPSKFAGTL--- 394 CPSY2A VGPSRFAGTL--- 397 APSY1 SPSSLSQSSLAKT 430 CPSY1 SPSSLSQSNLAKT 430 ZPSY1 LPCSLRNGQT--- 410 * .
Exon 1
Exon 6
Exon 5
Exon 3
Exon 4
Exon 2

72
b)
c)
d)
protein e-value ratio
ZPSY1 4.85E-27 3.83
APSY1 2.63E-26 20.78
APSY2A 1.26E-27 1.00
APSY2B 2.25E-26 17.80
CPSY1 3.39E-26 26.80
CPSY2A 1.34E-27 1.06
CPSY2B 2.66E-27 2.10
Figure 4.3: Analysis of secondary and tertiary structure of banana PSY proteins. a) Alignment of Asupina and Cavendish PSY proteins and maize ZPSY1 with secondary structure prediction using SSpro v4.5 that predicts the structure of amino acids as either coiled (plain text), α-helical (grey highlighting) or extended conformation (white text highlighted in black). The α-helices are numbered above the alignment as conserved (numbers c1 to c15) or non-conserved (numbers n1 to n7). The exons encoding the different parts of PSY are labelled with the locations of exons 2, 4 and 6 indicated by boxes. b) Scale diagram of the putative PSY signal peptide region showing the relative positions of the six predicted non-conserved α-helices (n1 to n6, black shapes) and conserved α-helix 1 (c1, green shape) along the PSY sequence (blue line). c) Predicted tertiary structure of APSY1 is shown as an example to illustrate the organisation of α-helices (blue ribbons) and loop regions (grey strands) and the expected orientation of the GGPP substrate (white hydrocarbon chain with yellow and red phosphate group) and Mn2+ atoms (grey spheres). d) Table of e-values from the tertiary structure prediction and their ratio compared to APSY2A, which was the most similar to the human SQS template structure (RSCB PDB No. 1ezf). Note, that 100% modelling precision for all tertiary structures was estimated for all PSY proteins studied.
50 amino acids
ZPSY1
APSY1
CPSY1
APSY2A
CPSY2A
APSY2B
CPSY2B
C1
n2 n6 C1
C1 n3
C1 n3
C1 n6
C1 n4 n5
C1
n2 n3 n1

73
amino acids, AVE, at the C-terminal end of the helix (Figure 4.3a). Interestingly, APSY2A
had a single AVE repeat, which was not present in any of the PSY1 or PSY2B proteins. At
the N- and C-termini of this conserved region the secondary structure was primarily
composed of coiled regions. However, non-conserved α-helical structures were found in
some PSY proteins, labelled n1 to n6, which were located in the putative signal peptide
(Figure 4.4b). The most notable were helices n3 to n6. Helix n3 was 16 amino acids from the
N-terminus of APSY3B and CPSY2B and was 11 to 12 residues long. ZPSY1 also had a
helix (Helix n3) which was only 4 amino acids long. Helices n4 (3 amino acids) and n5 (7
amino acids) were in the N-terminus of CPSY2A, 40 amino acids from the start of the
protein and were separated by a single amino acid. Interestingly, these were absent from
APSY2A. The α-helix at position n6 was 6 and 7 amino acids long in Asupina and CPSY1,
respectively. These predicted differences in the structures of the putative signal peptide
region of the banana PSYs (Figure 4.3b) may influence their activity. The putative non-
conserved α-helices at the C-terminus were very close to the end of APSY1, CPSY2A and
ZPSY1 in a position labelled n7 and consisted of one or two amino acids.
Tertiary structure was initially examined by homology modelling of the PSY primary
sequences using the first approach method on the SWISS-MODEL server. However, using
this method no suitable tertiary structure was identified. Subsequently, tertiary structure
analysis was performed using PHYRE fold recognition server (Figure 4.3c). The template
for the predicted tertiary structure was the human SQS α-chain (RSCB PDB No. 1ezf),
which was approximately 280 amino acids long and represented approximately 88% of the
conserved α-helical region. This template was the only significant match for all the banana
PSY proteins and ZPSY1 (Figure 4.3d), returning the highest predicted protein threading
precision (100%) and lowest e-values, ranging from 1.26E-27 (APSY2A) to 3.39E-26
(CPSY1). An e-value ratio was calculated to provide a comparison of the predicted PSY
tertiary structures relative to APSY2A, which was most similar to the human SQS template
structure. These ratios were used to gauge the level of overall structural variation among
banana PSYs, and suggested that the tertiary structures of CPSY2A, CPSY2B and ZPSY1
were most related to Asupina PSY2A as their e-value ratios were between 1.1 and 3.8 fold
higher. In contrast, the structures of APSY2B, Asupina PSY1 and CPSY1 were least similar
to APSY2A as their e-values were between 17.8 and 26.7 fold higher. Orientation of the
GGPP substrate, based on comparison with the PDB structure of substrate-bound human
SQS (RSCB PDB No. 2Q80), suggested that it was positioned in the protein with the charged
phosphate group closest to the surface and the hydrocarbon chain in the protein core (Figure
4.3c). Despite the many differences observed at the levels of primary, secondary and tertiary

74
structure, none of these variations appeared to conclusively relate to the differences in pVA
accumulation between the Asupina and Cavendish PSYs.
4.3.2 Functional analysis of banana PSYs Rice callus was used as a model system, to compare the relative ability of the banana PSY
proteins to synthesise carotenoids, as banana embryogenic cells were not available at the
time. The binary vector, pCAMBIA-1302, encoding the hygromycin phosphotransferase II
(HPTII) selectable marker and gfp reporter gene, was selected as the base vector for
Agrobacterium-mediated transformation as hygromycin selection has been used successfully
for rice transformation (Hiei et al., 1994). It was also rationalised that the presence of the gfp
reporter gene, in addition to the psy genes, would facilitate monitoring of the transformation
process. Asupina and Cavendish psy1 and psy2a coding regions were selected for analysis
and subcloned into pCAMBIA-1302, as they were the major psy sequences obtained using
degenerate primers from leaf and fruit, respectively (Chapter 3).
4.3.2.1 Rice callus induction and optimisation of transformation
Rice seeds were successfully germinated and produced callus over a four week period
(Figure 4.4a). Although some seeds produced complex root structures with no usable callus
(Figure 4.4a i), most seeds responded by producing a simple root structure in addition to
callus tissue, which budded off the seeds in place of the shoots and was friable and white in
colour (Figure 4.4a ii). Callus was excised from the germinating seeds and multiplied in
preparation for transformation (Figure 4.4a iii).
Rice transformation was being undertaken by other researchers at QUT; however, several
different procedures were being used. Therefore, the first experiment compared three
available Agrobacterium-mediated transformation methods to determine the most efficient
protocol: i) the rice transformation protocol according to CAMBIA, ii) the centrifugation
assisted Agrobacterium-mediated transformation (CAAT) method, and iii) a modified
version of the CAAT protocol that used media from the CAMBIA protocol. The pART-
TEST7 binary vector, encoding the sGFP (S65T) protein regulated by the CaMV 35S
promoter and catalase intron, was used to test transformation efficiency as it had previously
been used at QUT and was known to be functional in rice callus. Four replicate plates of
callus (~30 individual calli per plate) were transformed separately with pART-TEST7 for
each of the three transformation methods. One plate of ~30 untransformed calli was included
in each experiment as proliferation (no antibiotic selection) and selection controls. This
experiment showed qualitatively that the CAAT method was the most efficient method for

75
a) (i)
(ii)
(iii)
b)
(i)
(ii)
(iii)
(iv)
(v)
(vi)
(vii)
(viii)
(ix)
Figure 4.4: Testing of GFP reporter genes in rice callus. a) Induced rice callus after 4 weeks showing seeds with (i) complex root structure, (ii) callus and simple roots structure (iii) callus transferred from seeds. b) Comparison of GFP expressed by pART-TEST7 and pCAMBIA-1302 binary vectors which have different versions of the gfp reporter gene. Untransformed rice callus after (i) 3 days, (ii) 7 days and (iii) 2 weeks on selection as a negative control. Rice callus transformed with sGFP encoded by pART-TEST7 was monitored for transient expression after 3 days (iv) and stable expression after 7 days (v) and 2 weeks (vi) and compared to callus transformed with mGFP5 encoded by pCAMBIA-1302 after 3 days (vii), 7 days (viii) and 2 weeks (ix).

76
rice callus transformation, producing higher numbers of transiently transformed cells than
the other two methods after three days and more stably transformed callus after two weeks
(results not shown). This method was used for all further transformation experiments.
The relative transformation efficiencies of the pART-TEST7 (sGFP reporter gene) and
pCAMBIA-1302 (mGFP5 reporter gene) vectors in rice callus were compared before
undertaking experiments with psy constructs. Agrobacterium cultures containing these
vectors were each used to transform four separate batches of callus (~30 calli) that were
grown on separate selection plates. Two replicate plates of untransformed calli (~30) were
included as proliferation and selection controls respectively. Callus exhibited some
autofluorescence (Figure 4.4b i), however, transient expression was seen in pART-TEST7
transformed callus after three days as bright foci (Figure 4.4b iv) which were not present in
the untransformed callus control (Figure 4.4b i). After further selection (1-2 weeks), stable
GFP expression was seen in large clumps of callus (Figure 4.5b v & vi) compared to the
untransformed tissue (Figure 4.4b ii & iii). In contrast, pCAMBIA-1302 gave no visible
transient or stable GFP expression after more than two weeks of culture (Fig 4.4b, vii-ix),
although clumps of regenerating callus were apparent. It was subsequently determined that
the GFP version encoded by pCAMBIA-1302 (mGFP5) expresses poorly in rice (CAMBIA,
2009a). As there was insufficient time to change the reporter gene in the pCAMBIA-1302-
based psy constructs, they were used directly for rice transformation.
4.3.2.2 Comparison of banana psy genes in rice
The Asupina and Cavendish psy1 and psy2a coding regions were selected for transformation
into rice callus because they appeared to be the predominant psy genes in leaf and fruit
respectively. The psy2b coding regions were not tested due to the high similarity between the
Asupina and Cavendish psy2b sequences, and the latter differed from its genomic sequence
(Chapter 3).
A pilot study was undertaken with selected psy constructs to confirm the ability of rice callus
to accumulate carotenoids in the absence of other carotenoid biosynthetic genes. Four
batches of callus were transformed with the pCAMBIA-1302 base vector (included as a
negative control), maize psy1, and the Asupina psy1 and psy2a vectors. Untransformed
controls (two replicates) were also included. The hygromycin selection regime successfully
inhibited the proliferation of untransformed rice callus, which appeared necrotic and was
considered dead after six weeks on selection (results not shown). Callus appearing to arise
from different transformation events was grown separately as “callus lines” during selection,
77
such that all multiplying tissue could be traced to the original transformation event. Evidence
of carotenoid expression was first seen four weeks post transformation as a change in colour
of the transformed callus. Calli transformed with the psy constructs exhibited a range of
colours from creamy white, similar to the negative control, to pale yellow to dark orange
(Figure 4.5). The colour became more obvious six weeks post transformation as the
transformed calli began to proliferate on selection. This range of colours was seen in
transformations with all the psy constructs, although the proportion of each colour varied
between treatments. Rice callus transformed with Zpsy1 appeared to exhibit more orange
clumps of calli compared to plates of callus transformed with Apsy1 and Apsy2a.
Consequently, a large scale rice transformation experiment was carried out to compare the
carotenoid accumulation of Asupina and Cavendish PSYs. Rice callus was transformed with
pCAMBIA-1302 alone (negative control) or containing the banana Apsy1, Apsy2a, Cpsy1 and
Cpsy2a, or maize Zpsy1 (positive control) sequences; untransformed rice callus was also
included as a control for multiplication and selection. The number of batches of calli
transformed for each psy construct and untransformed controls, and the segregation of
“callus lines” was as per the pilot study. Hygromycin selection efficacy was consistent with
that observed in the pilot experiment (Figure 4.6 ii). Carotenoid accumulation, seen as a
range of colours from creamy white, light yellow to dark orange, was observed in all the psy
treatments while no accumulation was seen in the pCAMBIA-1302 vector or untransformed
controls (Figure 4.6). As previously observed in the pilot experiment, maize Zpsy1 plates
appeared to have larger amounts of orange callus than banana psy plates. However, although
not as prolific, all banana psy treatments had some dark orange callus. Often, very dark
orange callus did not multiply well, as evidenced by very small, dark clumps of callus
(results not shown). Many of the proliferating clumps of callus had mixtures of colour,
ranging from white to yellow and orange (Figure 4.6 viii).
Quantitative analysis of carotenoid accumulation was undertaken to confirm that visual
observations (colour) correlated with actual carotenoid accumulation. Rice callus was
multiplied for 22 weeks post transformation and carotenogenic callus clumps were selected
by colour and photographed, before total carotenoids were extracted and quantified by
spectrophotometry. Callus (300 to 400 mg wet weight) was harvested from each line
according to colour, and tissue from different lines were analysed separately, allowing
observation of the variation arising from different transformation events. The correlation
between callus colour and β-carotene content was first investigated using transformed Zpsy1
lines (Figure 4.7). Untransformed calli and pCAMBIA-1302 negative control calli (line 4A-

78
Figure 4.5: Pilot experiment to confirm carotenoid accumulation in transgenic rice callus. Plates of rice callus transformed with pCAMBIA-1302 (negative control), maize Zpsy1 (positive control), Apsy1 and Apsy2a coding regions were photographed 6 weeks post transformation [4× magnification].
Apsy2a Apsy1 Zpsy1 pCAMBIA-1302

79
Figure 4.6: Carotenoid accumulation in rice callus transformed with different psy coding region constructs. Each panel is a close-up [8× magnification] of selected calli clumps containing the darkest orange callus visible at 7 weeks post transformation. (i) Untransformed callus without selection; (ii) Untransformed callus on selection; (iii) pCAMBIA-1302 vector (negative transformation control); (iv) maize Zpsy1 (positive control); (v) Apsy1; (vi) Apsy2a; (vii) Cpsy1; (viii) Cpsy2a.
(i)
(ii)
(iii)
(iv)
(v)
(vi)
(vii)
(viii)

80
a)
b)
Figure 4.7: Total carotenoids in Zpsy1 transformed rice calli. β-carotene content a) of different coloured clumps of rice callus b) transformed with Zpsy1 including untransformed and pCAMBIA-1302 vector only negative controls. Callus lines of each sample are labelled under the respective photographs [8× magnification].

81
11) were creamy white in colour (Figure 4.7b) and had β-carotene levels of 54.7 μg/g dry
weight and 35.9 μg/g dry weight, respectively (Figure 4.7a). Representative Zpsy1 rice calli
were harvested according to three different colour groups: pale yellow, yellow and orange
(Figure 4.7b). The β-carotene content of Zpsy1 lines ranged from 64 μg/g dry weight (pale
yellow callus; line 2A-41) to 507 µg/g dry weight (orange callus; line 2A-13) [Figure 4.7a],
confirming a positive correlation between callus colour and carotenoid content.
To investigate carotenoid accumulation in lines transformed with banana psy coding regions,
the average carotenoid content of three lines each of the most visibly carotenogenic calli
transformed with Zpsy1, and Asupina and Cavendish psy1 and psy2a was analysed (Figure
4.8). The average β-carotene content of the untransformed callus and pCAMBIA-1302
negative control lines was significantly lower than psy lines at 22.3 µg/g and 37.1 µg/g dry
weight, respectively. The average β-carotene content of the Zpsy1 callus was the lowest of
the psy genes at 455.7 µg/g dry weight, while the banana psy callus was 511.8 µg/g, 567.5
µg/g, 682.0 µg/g and 793.6 µg/g dry weight for Apsy1, Cpsy2a, Cpsy1 and Apsy2a,
respectively. There was considerable variation within the three samples for each psy
transformation, which is seen by the large standard deviation in most psy treatments.
However, all psy transformed lines were at least 10 fold higher than the untransformed or
vector only negative controls. The highest individual value was 957.3 µg/g dry weight for
one Apsy2a line which was 1.8 fold higher than the highest Zpsy1 line. Statistical analysis
confirmed that the β-carotene levels in callus transformed with Apsy2a and Zpsy1 differed
significantly, however, neither treatment differed significantly from the β-carotene levels of
the other PSYs. These results confirm that, at least in rice, the banana PSYs have the
potential to mediate carotenoid accumulation to levels higher than maize psy1. Moreover,
Cavendish PSY1 and PSY2A appeared capable of synthesising carotenoids to similar levels
as the Asupina PSYs.
4.4 Discussion In this study, the efficacy of the cloned banana psy1 and psy2a coding regions was
confirmed as they all mediated an increase in carotenoid content in transgenic rice callus to a
level comparable to the previously characterised maize B73 psy1 coding region.
Analysis of the primary structure of the complete banana PSY proteins confirmed that the
catalytic domain was the Trans-IPPS-HH domain linked to isoprenoid biosynthesis, all the
predicted critical residues were intact, and sequence differences did not affect important
structural motifs (Figure 4.2). Interestingly, the 7th amino acid before the first ARM of
APSY2B is aspartic acid instead of tyrosine, which is in the other banana PSY proteins, and

82
Figure 4.8: Carotenoid accumulation in rice calli transformed with different psy genes: Graph of the carotenoid content of the three most visually carotenogenic calli from each of the experimental treatments including untransformed and vector only controls. Standard deviation between the three replicates is indicated by black error bars above each average (red bars). One-way ANOVA with least significant difference post-hoc analysis was used to determine the statistical significance of β-carotene content with a 95% confidence level. Letters above each bar (a, b and c) in the graph indicate treatments where β-carotene levels were not statistically different.
is predicted to form the substrate binding pocket. In prenyltransferases, this region is known
as the chain length determination region (CLD) and the 2nd, 4th and 5th amino acids before the
first ARM are known to affect prenyltransferase product length in farnesyl diphosphate
synthase (FPS) and GGPS (Ohnuma et al., 1997). The hydrophobicity and steric properties
of these residues are thought to define the depth of the substrate binding pocket (Ohnuma et
al., 1996; Wang and Ohnuma, 1999). However, the 5th residue before the first ARM is
tryptophan (Figure 4.2), whose bulky aromatic side chain would be expected to restrict the
size of the GGPP binding pocket (Tarshis et al., 1996), suggesting that all banana PSY have
the same binding pocket depth. The 4th residue in the active site lid (arginine) of APSY2B
also differed from the consensus (tyrosine), suggesting that this protein may have a different
substrate binding efficiency. However, all other functional residues were identical.
Therefore, all PSYs are expected to be capable of producing phytoene.

83
Apart from the two mutations in the CLD region of APSY2B, the catalytic residues were
identical in all of the banana PSY proteins and ZPSY1. Interestingly, primary structure
analysis predicted that several amino acids may carry out multiple functions, indicating that
these residues may be more highly conserved than others. However, differences in amino
acids not involved in catalytic function may still influence enzyme function by altering
overall protein structure and changing interactions between adjacent regions. The banana
PSY proteins were all predicted to consist predominantly of α-helices and coiled loop
regions (Figure 4.3c), consistent with the structures of other prenyltransferases (Wang and
Ohnuma, 1999) and the fact that PSY is a soluble protein (Dogbo et al., 1988). Interestingly,
two potentially significant structural differences were found between Asupina and Cavendish
PSY2A (Figure 4.3a & b). Firstly, conserved Helix 1 is longer in CPSY2A due to two
consecutive AVE tripeptides at the C-terminal end of this structure while APSY2A has only
one. In addition, the amino acids prior to Helix 1 form non-conserved helices (helices n4 and
n5) in Cavendish but not Asupina despite the fact that the residues are the same. The
additional AVE motif could be responsible for the presence of both structural differences in
Cavendish PSY2A due to interactions between adjacent residues. These structural
differences are located in the large N-terminal plastid targeting signal peptide that must be
cleaved in order for the mature PSY protein to be fully functional (Misawa et al., 1994). This
could potentially reduce carotenoid biosynthesis in Cavendish fruit by interfering with
PSY2A signal peptide cleavage or plastid targeting. The AVE motif itself may be part of the
signal peptide cleavage site, therefore the change in sequence alone may be sufficient to
disrupt signal peptide cleavage.
Tertiary structure prediction only compared the catalytic domains of the banana PSYs;
therefore potential differences in the putative signal peptides could not be further examined.
Interestingly, PSY was predicted to have a tertiary structure similar to SQS (Tansey and
Shechter, 2000), and the SQS-PSY motifs conserved between these two enzymes are thought
to participate in reaction catalysis. These similarities may shed light on some aspects of the
function of PSY. SQS plays a pivotal role in the synthesis of sterols such as cholesterol, and
its activity is thought to direct the use of farnesyl diphosphate in the manufacture of both
sterol and non-sterol isoprenoids (Tansey and Shechter, 2000). This is similar to the role
played by PSY in irreversibly directing GGPP, which is a precursor for other compounds
such as tocopherols and chlorophylls, towards to synthesis of carotenoids (Cunningham and
Gantt, 1998). The similarities between these proteins may shed light on the putative function
of the banana PSY C-terminus, which could be responsible for anchoring PSY to the plastid
membranes where its hydrophobic products would accumulate (Cunningham and Gantt,
1998). The nature of this attachment would have to facilitate both the acquisition of water

84
soluble GGPP substrate and cofactors, as well as the delivery of phytoene to plastid
membranes. Such a mechanism has been proposed for the function of the endoplasmic
reticulum-associated mammalian SQS enzymes (Tansey and Shechter, 2000).
Analysis of the potential functional impacts of sequence differences in the banana PSY
proteins was tempered by the fact that secondary and tertiary structure predictions are
approximations and may not therefore be fully representative. For example, the SSpro
secondary structure prediction program only has a structure prediction accuracy of 78%
although it performs well against other programs (Pollastri et al., 2002). Additionally,
although the tertiary structure of many isoprenoid biosynthetic enzymes has been elucidated
(Liang et al., 2002), no such information exists for PSY, as evidenced by the failure of
homology modelling to associate the non-catalytic N- and C-terminal domains of the banana
PSY enzymes with any existing structures. It is therefore difficult to verify the putative
functions of these regions and deduce the possible implications of any sequence or structural
differences therein. Completely accurate prediction of secondary and tertiary structures from
primary sequence data is unlikely as a number of factors are not accounted for including: pH
and other environmental variables; the dynamic nature of proteins and the formation of
quaternary structures; the existence proteins that do not fold automatically and limitations in
prediction methodologies (Pollastri et al., 2002). In addition, predicted secondary or tertiary
structures may not account for any post-translational effects such as glycosylation that may
influence protein structure. In the case of PSY2B, the sequence of the first 20 amino acids
corresponds to APSY2A due to the primers used to amplify the complete coding region
(Chapter 3). Consequently, the activity of the banana PSYs was confirmed directly in rice
callus as their actual structures may differ significantly from predictions in Figures 4.2 &
4.3.
Rice transformation was optimised through induction of rice callus and selection of the
CAAT method as the best transformation method using GFP reporter gene analysis. This
enabled subsequent transformation of expression constructs containing Asupina and
Cavendish psy1 and psy2a coding regions. All banana PSY proteins were functional in
transgenic callus and appeared capable of producing much higher levels of carotenoids than
the negative controls despite significant variability between individual replicates. In previous
studies (Ye et al., 2000), PSY expression in rice endosperm relied on co-expression of
additional enzymes in the carotenoid biosynthesis pathway and E. uredovora crtI was used
as had both ZDS and PDS activity. However, like the maize callus used to compare psy
genes for production of Golden Rice 2 (Paine et al., 2005), the callus induced in this study
should express the full carotenoid biosynthesis pathway as it is derived from the rice embryo.

85
Based on initial visual observations, little difference was observed in levels of carotenoid
accumulation between banana PSYs, with callus colours ranging from cream to dark orange
(Figure 4.6 and 4.7). Although not significantly higher than other banana PSYs, APSY2A
produced callus with the highest carotenoid levels (Figure 4.8). However, it is uncertain
whether this difference alone would sufficiently explain the observed differences between
pVA content of Asupina and Cavendish fruit as CPSY2A is clearly functional. As this
experiment was undertaken in rice callus, it is also possible that the relative activity of these
enzymes will differ in banana.
Interestingly, when assayed quantitatively, ZPSY1 appeared to be the least active of the
enzymes tested, having the lowest average carotenoid accumulation and significantly lower
than APSY2A. This control was expected to have higher activity than the banana PSY
proteins as it was the most active enzyme in maize callus (Paine et al., 2005), and because
rice is more closely related to maize than to banana. Additionally, there appeared to be a
greater proportion of orange callus in experiments transformed with ZPSY1. A similar result
was seen in maize callus (Paine et al., 2005) transformed with rice PSY1, which had only
half the level of relative carotenoid accumulation compared to ZPSY1, yet 70% of calli
transformed with rice psy had carotenoid levels at least five times higher than baseline levels,
while for ZPSY1 this was only 60%. The more active PSYs, giving high levels of carotenoid
accumulation, might inhibit callus multiplication. A few banana psy lines were observed
which had dark orange callus, suggesting very high expression. These calli were small and
tended to proliferate more slowly than those with lower carotenoid levels suggesting that
high carotenoid levels have a negative effect on callus growth. This is supported by studies
in cauliflower where lines homozygous for the Or gene had high carotenoid accumulation
but were very small (Li et al., 2001). The effect was less obvious in heterozygous Or lines.
This may be due to GGPP depletion within the callus cells, which was thought to be have
caused phenotypic abnormalities in tomato as phytohormone production was suppressed
(Fray et al., 1995). Similar phenotypic abnormalities were observed in tobacco when either
psy1 or psy2 was overexpressed (Busch et al., 2002). Although these limitations were
overcome in tomato using a fruit-specific promoter (Fraser et al., 2002), this was not
possible for the callus-based assay as the tissue is undifferentiated. The reduced proliferative
capacity of highly carotenogenic lines may also mean that the relative activity of some
enzymes such as CPSY2A or APSY1 was under-reported as their best performing lines
produced too little callus for quantitative analysis. Because 200 mg was the minimum wet
weight for feasible carotenoid extraction, lines were selected for quantitative analysis based
on the amount of available tissue as well as carotenoid content. This meant that there was
insufficient material from some highly carotenogenic lines to be analysed. This challenge

86
may be solved by increasing the number of replicates during transformation in order to
increase the frequency of highly carotenogenic lines for analysis or allowing more time for
callus to proliferate. This would also provide more conclusive results by allowing more lines
to be tested, thus reducing the variability observed in the results.
Previous work in maize (Paine et al., 2005), the only other work that used callus tissue to
compare PSY activity, assessed the activity of various PSYs based on the level of carotenoid
accumulation and on the proportion of highly carotenogenic clumps of individual callus. In
the present study, callus was segregated into lines based on the origin from a single callus
“mother” clump representing the original transformation. However, sections of some clumps
were different colours suggesting multiple transformation events. This made it impossible to
determine the proportions of transformants for each of the banana psy sequences represented
by the different colour levels. Nevertheless, the present study was able to verify that PSY1
and PSY2A from both Asupina and Cavendish were capable of producing pVA carotenoids.
Analysis of carotenoid accumulation in rice callus proved to be a simple model for testing
PSY enzyme function compared to radiolabelled biochemical assays (Dogbo et al., 1988;
Fraser et al., 2000; Schledz et al., 1996) due to the nature of the reagents and detection
systems required. Bacterial systems such as E. coli for functional complementation studies
were not available. Interestingly, despite the poor GFP expression, PSY proved to be an
excellent alternative reporter gene as carotenoid accumulation was visible. Rice callus
provided a simple model for assessing the carotenogenic potential of a given psy coding
region, but does not directly measure enzyme activity. Consequently, as the intrinsic activity
of each enzyme was not measured biochemically, subtle differences in enzyme function
could not be determined. Comparison of PSY enzyme activity in rice would also be limited
by restrictions in plastid storage capacity, size and number, as well as GGPP substrate
restrictions that may negatively affect callus growth.
Transgene copy number and site of integration into the rice genome were not expected to
bias the results as Agrobacterium-mediated transformation is known to produce
transformants with lower copy number and fewer genetic aberrations than microprojectile
bombardment. However, it is still possible that these factors may contribute to the variation
in carotenoid content observed. All the transformations were conducted on the same day
under the same experimental conditions in order to further limit variation. Further, some
variability may be attributed to the nature of rice callus, which is probably a mixture of
different embryonic cell types and morphologies observed during callus maintenance ranged
from soft friable callus to harder tissue. Therefore, differences in the properties of these cells
such as transformability, water content and proliferative capacity could contribute to the

87
variation in carotenoid content observed between the various callus lines. However, the
trends in carotenoid accumulation observed in Figure 4.6 were unchanged when wet weight
measurements were used instead of dry weight (results not shown). Therefore variation in
cellular water content did not appear to have an impact on the results.
The work reported in this Chapter tested the hypothesis that differences in the activity of the
PSY proteins in Asupina and Cavendish may be responsible for the difference in their
respective fruit pVA content. Bioinformatic analysis of PSY structure yielded differences
that were largely inconclusive, although differences in PSY2A signal peptide structure may
yet prove important. The Asupina and Cavendish psy1 and psy2a coding regions were
expressed in rice callus for in vivo analysis of enzyme function and all sequences were
capable of producing active enzymes that catalysed visually observable and quantifiable
levels of carotenoid accumulation. These enzymes appeared to possess similar levels of
maximal activity based on β-carotene accumulation measurements. Cumulatively, these
results indicated that factors other than PSY enzyme activity may be responsible for
differences in the fruit pVA content of Asupina and Cavendish.

88
Chapter 5: Characterisation of factors affecting phytoene synthase expression 5.1 Introduction Carotenoids are synthesised by plants and have numerous functions such as photosynthesis
in leaves, colouration of fruits and flowers (Cunningham and Gantt, 1998), and precursors
for abscisic acid synthesis in organs such seeds, leaf and vascular tissue (Nambara and
Marion-Poll, 2005). This requires carotenoids to be synthesised at different times, in
different amounts in the various tissue through regulation of the enzymes in the carotenoid
biosynthetic and degradation pathways.
Tissue-specific regulation of PSY activity has been observed in a number of plants (Bartley
and Scolnik, 1993; Clotault et al., 2008; Gallagher et al., 2004). The tomato psy genes
function in both leaf and fruit (Bartley and Scolnik, 1993), with psy1 predominantly
associated with chromoplast bearing tissue (fruit and petals) and psy2 more widely expressed
(Giorio et al., 2008). Semi-quantitative RT-PCR analysis of psy transcripts in maize varieties
with yellow (high carotenoid) or white (low carotenoid) endosperm implicated psy1 in
endosperm carotenoid accumulation (Gallagher et al., 2004). Expression of psy1 was higher
than psy2 in yellow endosperm maize, while only psy2 was expressed in white endosperm
maize. The psy expression in rice endosperm was identical to that of white endosperm maize.
Comparison of two apricot varieties with yellow (high carotenoid) and white (low
carotenoid) fruit indicated that ethylene production influenced psy expression during fruit
development (Marty et al., 2005). Initial studies in banana (Chapter 3) suggest that psy1 is
predominantly expressed in leaf and psy2 in fruit. However, this was based on the frequency
of obtaining particular clones and a more robust analysis is required to confirm this and to
correlate expression of these genes with differences in carotenoid accumulation in fruit.
Gene expression in plants is regulated by mRNA stability (Abler and Green, 1996),
methylation of DNA and histone proteins (Vaillant and Paszkowski, 2007), and promoter
activity. Promoters play the most significant role in regulating tissue specificity and
transcript abundance through the specific interactions of DNA sequence motifs (Higo et al.,
1999; Sawant et al., 2005) or secondary structures (Yamagishi et al., 2008) with
transcription factors. The promoter regions of the maize (Palaisa et al., 2003) and
Arabidopsis (Welsch et al., 2003) psy genes have been studied. In maize, an Ins2

89
transposable element in the promoter of the y1 gene that encodes PSY1, was predominantly
associated with lines that had high carotenoid accumulation, suggesting that this phenotype
was due to enhanced promoter activity (Palaisa et al., 2003). The Arabidopsis psy promoter
is the best characterised psy promoter, and characterisation of this promoter identified DNA
regulatory motifs activated by different light conditions (Welsch et al., 2003). Response to
light was controlled by two adjacent G-box-like elements, approximately 200 bp upstream
from the transcription start site. However, constitutive expression was linked to a pair of
ATCTA motifs located approximately 840 bp upstream from the transcription start site. This
motif was thought to coordinate the expression of genes involved in photosynthesis, as well
as carotenoid and tocopherol metabolism. Interestingly, during photomorphogenesis in
Arabidopsis thaliana, psy expression and enzymatic activity was also shown to be regulated
by light through the activity of phytochromes, and increased carotenoid content was seen
only under light conditions conducive to chlorophyll biosynthesis (von Lintig et al., 1997).
The work reported in this chapter investigated the hypothesis that differences in the
regulation of psy expression were responsible for determining pVA accumulation in banana
fruit. Consequently, the promoters of the psy1 and psy2a genes from Asupina and Cavendish
were isolated and their activity characterised using transient GUS expression in green fruit
tissue. In addition, semi-quantitative RT-PCR was used to further investigate relative levels
of psy1 and psy2a mRNA transcripts in leaf and fruit of Asupina and Cavendish bananas.
5.2 Materials and methods 5.2.1 Oligonucleotide primers PCR primers were sourced as previously described (Chapter 3.2.3) and their sequences are
listed in Table 5.1.
5.2.2 psy promoter isolation The putative promoter regions of Asupina and Cavendish psy1 and psy2 were obtained using
the genome walking strategy (Chapter 3.2.7). Overlapping DNA fragments ranging between
2600 and 3500 bp were obtained through consecutive rounds of nested PCR using adapter-
specific primers AP1 and AP2 (Table 3.2) in combination with promoter-specific primers
(Table 5.1) designed from previously characterised psy sequences (Chapter 3). The genome
walking strategy for promoter isolation is outlined in Figure 5.1.
The promoter regions of Asupina and Cavendish psy1 were amplified using primer pairs
AP1/psy1pr-GW01 and AP2/psy1pr-GW02 for outer and inner PCR, respectively. Two

90
Table 5.1: PCR primers used in banana psy promoter isolation and semi-quantitative PCR
Primer name Sequence (5’-3’) Orientationa Target sequence Restriction siteb
psy1pr-GW01 TAATCCACTGAGAAGGTGGAATCC Reverse psy1 5’ UTR none psy1pr-GW02 CAAAGGCGATCCTCCTTTCTGTG Reverse psy1 5’ UTR none psy2apr-GW01 GGGGAAGAAGCACGACGGTCGTCG Reverse psy2a 5’ UTR none psy2apr-GW02 CAGGCGTCCACTTGGTTGGCGCCGC Reverse psy2a 5’ UTR none Apsy2apr-GW01 TTGAGGTGAAACGCAGAAGCGTC Reverse Asupina psy2a 5’ promoter region none Apsy2apr-GW02 CTCATTCATTGCCATTGTGTCAAAC Reverse Asupina psy2a 5’ promoter region none Cpsy2apr-GW01 ACCGAAGAATCAATTTAGGTCCAAC Reverse Cavendish psy2a 5’ promoter region none Cpsy2apr-GW02 AATGTTCATGTTTGTCATAATCTGTGG Reverse Cavendish psy2a 5’ promoter region none psy2b_5utr-R1 GCTCCGCCTCTTCACCTCT Reverse psy2B 5’ coding region none Apsy1_pr-F1 ggtaccGTTACATTCTTAATGAGAGGTATT Forward Asupina psy1 promoter region KpnI Cpsy1_pr-F1 ggtaccGTCACATAGTTGAATGAGATGC Forward Cavendish psy1 promoter region KpnI psy1_pr-R1 ccatggGAAGCAAGAGCAAGATCGTATAAC Reverse psy1 5’ UTR NcoI Apsy2a_pr-F1 ggtaccGCAATAATGACCTGGTGACATA Forward Asupina psy2a promoter region KpnI Cpsy2a_pr-F1 ggtaccGCAATAATGACAGGGTGATGATA Forward Cavendish psy2a promoter region KpnI psy2a_pr-R1 ccatggCTGCTTAGTTTCGTCTTCGG Reverse psy2a 5’ UTR NcoI qActin1-F1 TGGCTGACACTGACGACATTC Forward Musa acuminata actin1 coding region none qActin1-R1 CAACAATACTTGGGAAAACGG Reverse Musa acuminata actin1 coding region none psy1_qPCR-F1 GCCTGTTGCTACGGATGATTGC Forward psy1 5’ coding region none psy1_qPCR-R1 ACTCCATCTTCGCCTCTTCCTC Reverse psy1 5’ coding region none Apsy2a_qPCR-F1 CAAGTGGACGCCTGTCTCGG Forward Asupina psy2a 5’ UTR none Cpsy2a_qPCR-F1 CAAGTGGATGCCTGTCTCGG Forward Cavendish psy2a 5’ UTR none psy2a-qPCR-R1 CGCTGCTTAGTTTCGTCTTCCG Reverse psy2a 5’ UTR none psy2int-qPCR-RVS CAGCAACGAAGCCAAAACC Reverse exon 6 of psy2a and psy2b none
(a) orientation with respect to mRNA sequence (b) presence of restriction sites (indicated in the primer sequence in lowercase)

91
Figure 5.1: Strategy for the isolation of psy promoter sequences from restriction digested Asupina and Cavendish gDNA libraries. Genome walking nested PCRs (Chapter 5.2.2) with adapter primers (AP1 and AP2) designed to the genome walking adapter (white rectangle) and gene-specific (gsp1 to gsp4) designed to a) the 5’ UTR (black rectangle) and b) the upstream regulatory region (grey line) were used to obtain overlapping promoter fragments. c) Consensus sequence information from these fragments was used to design primers gsp5 and gsp6 to the psy promoter regions and 5’ UTRs respectively (Chapter 5.2.3), enabling amplification of psy1 and psy2a promoters as single fragments with 5’ KpnI and 3’ NcoI restriction sites for cloning and construction of vectors for microprojectile bombardment.
rounds of nested PCR were required to obtain the psy2a promoter regions of Asupina and
Cavendish. The outer and inner primers for the first round were AP1/psy2apr-GW01 and
AP2/psy2apr-GW02, respectively. The remaining psy2a promoter sequence was amplified
with the AP1/Apsy2apr-GW01 (Asupina) or AP1/Cpsy2apr-GW01 (Cavendish) outer PCR
and AP2/Apsy2apr-GW02 (Asupina) or AP2/Cpsy2apr-GW02 (Cavendish) inner PCR primer
combinations. The AP1/psy2-GW06 and AP2/psy2b_5utr-R1 outer and inner PCR primer
pairs, respectively, were used in attempts to amplify the Asupina and Cavendish psy2b
promoter regions. PCR products were amplified from the genome walking libraries and
analysed as described previously (Chapter 3.2.7).
5.2.3 Cloning of psy promoters into pGEM-4Z vectors Consensus sequence information for the Asupina and Cavendish psy1 and psy2a promoter
regions was used to generate contiguous full length PCR products (Figure 5.1c), including
the 5’ UTR and upstream regulatory regions, that were cloned into pGEM-4Z vectors
containing the GUS reporter gene (Figure 5.2). The psy1 fragments were amplified using the
Apsy1pr-F1/psy1pr-R1 (Asupina) and Cpsy1pr-F1/psy1pr-R1 (Cavendish) primer pairs. The
c)
5’ UTR
gsp5
NcoI
gsp6
KpnI
a) AP1 AP2
Adapter 5’ UTR
gsp1 gsp2
b)
Adapter
AP1 AP2
gsp3 gsp4

92
primer sets for psy2a fragment amplification were Apsy2apr-F1/psy2apr-R1 (Asupina) and
Cpsy2apr-F1/psy2apr-R1 (Cavendish). The Expand Long Template PCR system (Chapter
2.2.1) was used to amplify promoter fragments from 1 µg gDNA with an extension time of 2
min and annealing temperatures between 55 °C to 60 °C. PCR fragments were cloned into
pGEM-T Easy and sequenced as previously described (Chapter 2.2.2-10).
Primers for amplification of Asupina and Cavendish psy promoters included KpnI and NcoI
restriction sites to facilitate subcloning in front of the GUS coding region, which had an NcoI
site in the start codon (Figure 5.2). The psy promoters were excised from the pGEM-T Easy
vector and the nos promoter from the pGEM-4Z-based GUS expression vector (pGEM-4Z-
nos-gus-nos) by double digestion with KpnI/NcoI (Chapter 2.2.2). Digests were separated by
agarose gel electrophoresis (Chapter 2.2.3), and psy promoter fragments and pGEM-4Z-X-
gus-nos vector backbone fragments were gel purified (Chapter 2.2.4). Gel purified
vector/insert fragments were ligated together (Chapter 2.2.5) to form the psy promoter
expression vectors (pGEM-4Z-psy-gus-nos). Ligation reactions were transformed into E. coli
and putative clones selected and sequenced as described previously (Chapter 2.2.6-10). The
following clones were purified in high concentration for microprojectile bombardment using
a Geno Pure Plasmid Midi Kit (Chapter 2.2.8): pGEM-4z-Apsy1pr-gus-nos, pGEM-4z-
Apsy2apr-gus-nos, pGEM-4z-Cpsy1pr-gus-nos, pGEM-4z-Cpsy2apr1-gus-nos, pGEM-4z-
Cpsy2apr2-gus-nos, and pGEM-4z-Cpsy2apr3-gus-nos. The Musa acuminata 1-
aminocyclopropane-1-carboxylate oxidase promoter (acopr) and Maize ubiquitin promoter
with intron (ubipr), kindly supplied by Dr Jason Geijskes (QUT), were included as fruit-
specific and constitutive positive controls, respectively.
5.2.4 Bioinformatic analysis of promoter sequences Consensus promoter sequences were compiled from the sequence trace files of overlapping
genome walking fragments of the respective psy promoter regions. Separate consensus
sequences were also compiled for the individual promoter clones in pGEM-4Z listed in
Chapter 5.2.3 above. Sequence alignment and analysis were as described in Chapter 3.2.5.
Phylogenetic analysis, multiple sequence alignment and percentage identity comparisons
were performed using the Clustal W2 program (Larkin et al., 2007) v2.0.1.0 provided by the
European Bioinformatics Institute (www.ebi.ac.uk) using the default parameters. For
secondary structure analysis, the repeat sequence adjacent to the psy2a transcription start site
and 10 bp flanking this region from each of the Asupina and Cavendish psy2a promoter
clones were submitted to the Quickfold program interface (based on the Unafold program;
Markham and Zuker, 2008), on the DINAMelt server (Markham and Zuker, 2005) using
default settings.

93
a)
b)
Figure 5.2: Strategy for generation of psy promoter constructs in pGEM-4Z showing a) cloning of psy promoters into pGEM-4Z to make the GUS reporter cassette containing b) the Asupina or Cavendish psy promoter, gus coding region interrupted by a catalase intron and nos terminator (n). This diagram also represents the structure of the Musa acuminata 1-aminocyclopropane-1-carboxylate oxidase (aco) and maize ubiquitin (ubi) promoter driven GUS reporter cassettes.
5.2.5 Preparation of banana tissue for microprojectile bombardment 5.2.5.1 Banana embryogenic cell suspensions
Banana embryogenic cell suspensions (ECS), kindly supplied by Jennifer Kleidon (QUT),
were maintained in 250 mL flasks containing 50 mL BL media (Chapter 2.3) and
subcultured every 10 days. Typically, one flask of banana ECS was required to prepare one
plate of cells for microprojectile bombardment. Banana ECS were prepared for
transformation as described previously (Becker and Dale, 2004). Four days after subculture,
the cell suspensions were plated out onto sterile filter paper discs (Whatman) placed onto BL
solid media (BL liquid media solidified with 0.25% phytagel, Sigma-Aldrich) and incubated
at 25 °C for 3 days prior to microprojectile bombardment.
5.2.5.2 Banana fruit tissue
The outer surface of the banana flesh was chosen as the target tissue for microprojectile
bombardment as it could be obtained routinely as an undamaged surface. Each banana was
peeled such that only part of the surface of the flesh was exposed, enabling the surface layer
to be removed without damage as the unpeeled tissue would be protected from injury. To
excise tissue sections, a scalpel was used to make parallel longitudinal incisions
approximately 2 to 3 cm apart and then a further incision was made approximately 1 to 2 mm
KpnI/NcoI
pGEM-T Easy psy clone
pGEM-T Easy
+
psy promoter
KpnI/NcoI
pGEM-4Z-nos-gus-nos
pGEM-4Z-X-gus-nos
+ nos promoter
Ligation
pGEM-4Z-psy-gus-nos

94
under the surface at one end of the fruit, connecting both parallel incisions. This was
continued under the entire length of the fruit, essentially peeling the intact outer surface of
the flesh from the inner layers. The surface was then cut into sections approximately 3 to 4
cm in length. The exact dimensions of the fruit sections were dependent on the size and
malleability of the fruit being sampled. For microprojectile bombardment, two fruit sections
were placed in Petri dishes onto filter paper moistened with 1 mL BL media without
phytohormones.
5.2.6 Microprojectile bombardment of psy promoter GUS constructs 5.2.6.1 Microprojectile bombardment procedure
Microprojectile bombardment was carried out as previously described (Becker and Dale,
2004). Gold particles (1 μm), prepared for microprojectile bombardment as described by
Becker and Dale (2004), were kindly supplied by Jennifer Kleidon (QUT). Samples were
placed 7.5 cm from the point of particle discharge, and were transformed using 550 kPa
helium pressure in a chamber at –84 kPa vacuum.
5.2.6.2 Histochemical GUS staining
Plates of banana ECS were incubated for 48 hr at 25 °C in the dark following microprojectile
bombardment. The filter paper carrying the disc of embryogenic cells was cut out from the
media using a scalpel blade and transferred to a well in a plastic 6 well plate. Cells were
washed into the well with 1 mL GUS histochemical stain (1mM X-gluc, 50 mM Na2HPO4,
pH 7.0). The wash step was repeated with a further 1 mL GUS stain solution and the cells
incubated for 10 min at room temperature on an orbital shaker at 90 rpm to dislodge
remaining cells from the filter paper. The paper was rinsed with an additional 1 mL GUS
histochemical stain before being discarded. Cells were incubated undisturbed overnight at 37
°C before the GUS stain was carefully removed and replaced with 1 mL 100% ethanol. For
photography, the cells in ethanol were transferred to smaller wells to increase cell density,
allowed to settle under gravity and the ethanol completely removed. Cells were
photographed at 8× and 16× magnification under an SZ-CTV stereo microscope (Olympus)
using a CAMEDIA C-5060 digital camera (Olympus) under full zoom using the portrait
setting under controlled lighting conditions.
Transformed fruit sections were incubated for either 24 or 72 hr at 25 °C in the dark to
facilitate transient GUS reporter expression. Prior to histochemical staining, the fruit sections
were photographed under a measuring grid of 0.25 cm2 squares to enable determination of
sample surface area for subsequent analysis. The fruit tissue was sealed into plastic pouches

95
containing 4 to 6 mL of GUS histochemical stain per treatment to optimise staining
efficiency. Fruit tissue was incubated overnight at 37 °C and then transferred to Petri dishes
for photography at 2.68× magnification as described above for embryogenic cells. Transient
GUS expression for each treatment was estimated by counting the total number of individual
blue-staining foci visible in the photographs regardless of intensity. Total surface area of
each treatment was estimated to the nearest 0.0625 cm2 and promoter activity estimated as
GUS foci per cm2. Excel 2007 (Microsoft) and SPSS v16 (SPSS Inc.) were used for
visualisation and statistical analysis of results, respectively.
5.2.6.3 Fluorimetric analysis of GUS activity
Bombarded banana embryogenic cells (three replicates per treatment) and untransformed
control tissue (two replicates) were incubated for 48 hr at 25 °C in the dark. Cells were
scraped off the filter paper disc and mixed with 400 μL GUS extraction buffer (1 M
Na2HPO4, 50 mM NaPO4, 10 mM EDTA; 0.1% v/v Triton X-100, 0.1% w/v N-
lauroylsarcosine sodium salt, 0.7 μL/mL β-mercaptoethanol, pH 7.0). The cells were lysed
by sonication at 14 W for 30 sec on ice using a Misonix 3000 sonicator. Samples were
centrifuged at 10,000 × g for 5 min at room temperature and supernatants stored overnight at
–80 °C. For analysis, the samples were clarified by centrifugation at 10,000 × g for 25 min at
4 °C. Total protein was measured against a BSA (PIERCE) standard curve using a Bradford
assay (Bio-Rad). A 200 μL aliquot of 1× Bradford Assay Reagent was mixed with 10 μL
protein extract, incubated for 5 min at room temperature and the absorbance measured at 595
nm. GUS activity of 100 µg soluble protein was determined using a fluorimetric (MUG)
assay (Jefferson et al., 1987) with 1 mM MUG substrate (Fluka Chemicals) in 200 μL GUS
extraction buffer at 37 °C for 1 hr. Reactions were terminated by addition of 1 mL GUS stop
buffer (0.2 M Na2CO3) and the fluorescence of 200 μL aliquots were measured in a LS50B
luminescence spectrometer (Perkin Elmer) at excitation and emission wavelengths of 365
and 455 nm respectively. GUS activity was recorded as pmol MU/µg protein/min, and
results were visualised and analysed statistically in Excel 2007 (Microsoft) and SPSS v16
(SPSS Inc.), respectively.
5.2.7 Analysis of Asupina and Cavendish banana fruit ripening 5.2.7.1 Plant materials
Green Asupina and Cavendish fruit was simultaneously ripened over a 12 day period to
assess carotenoid accumulation during fruit maturation. Ungassed (not ethylene treated)
green fruit was obtained from the QDPI Banana Germplasm collection at South Johnston
(North Queensland) courtesy of Jeff Daniells (QDPI) and came in two sizes: i) large, mature

96
fruit from the top of the bunch which were fully formed but unripened, and ii) small,
immature fruit from the bottom of the bunch whose ridges were more pronounced than in
large fruit. Due to the limited number of fruit that could be shipped, six Asupina fruit (each
size) and five Cavendish fruit (each size) were used for the trial.
5.2.7.2 Ripening trial
Fruit were ripened in an enclosed box (30 × 21.5 × 22.5 cm) containing additional fruit as
ripening agents (a ripe apple, tomato, and banana and an unripe tomato) at room temperature
(25 °C) in a plant tissue culture room to limit fluctuations in environmental conditions. Small
and large fruit from each cultivar were sampled separately. Fruit were photographed; the
mass and length recorded, and observations made of fruit characteristics. Transverse sections
of fruit flesh (1 to 2 cm thick) were stored at –80 °C for further analysis. The first large and
small fruits sampled from Asupina and Cavendish were not ripened, while the remaining
fruit were sampled in the same manner at 48 hr intervals. All photographs were taken under
identical lighting conditions to ensure consistency for comparison between samples. The
ripening agents were removed after six days as they were no longer required for further
ripening.
5.2.8 Semi-quantitative RT-PCR 5.2.8.1 Preparation of mRNA
Total mRNA was obtained as described in Chapter 2.1.1-2 from Asupina mature leaf tissue,
Cavendish leaf tissue, Cavendish green and ripe fruit tissue (obtained as per Chapter 3.2.1),
and Asupina unripened small green fruit and ripening small fruit (sampled day 10 post
ripening induction, Chapter 5.2.7.2). Contaminating gDNA was removed from total mRNA
using the Turbo-DNAfreeTM (Ambion) system in reactions consisting of 40 μL total mRNA,
1× Turbo DNase buffer, 2 U Turbo DNase, 40 U Protector RNase Inhibitor (Roche Applied
Science) and mqH2O to 50 μL. The reactions were then incubated for 30 min at 37 °C before
the addition of 5 μL DNase Inactivation reagent, incubated for 2 min at room temperature
with periodic mixing and centrifuged at 10,000 × g for 2 min at room temperature. Integrity
of mRNA was confirmed by RT-PCR of part of the banana actin1 coding region using the
TitanTM One Tube RT-PCR system (Roche Applied Science) as per Chapter 2.2.1 from 1 µL
mRNA with annealing temperature and extension time of 60 °C and 30 sec, respectively.
The actin1 control primers, actin1-qPCR-F1 and actin1-qPCR-R1 (Table 5.1), were
designed from Musa acuminata actin1 mRNA (GenBank #: AF246288). Total mRNA
concentration was measured using the Quant-itTM RiboGreen RNA assay kit (Invitrogen) as
per the manufacturer’s instructions for the 96 well plate format. The mRNA samples were

97
diluted to 3 ng/µL in mqH2O (DEPC-treated), and the concentration was confirmed using the
Quant-itTM RiboGreen kit (Invitrogen).
5.2.8.2 RT-PCR analysis
The mRNA levels of psy1, psy2a and actin1 in the leaf, green fruit and ripe fruit of Asupina
and Cavendish bananas were measured semi-quantitatively by RT-PCR using primers listed
in Table 5.1. Asupina and Cavendish psy1 were analysed using the psy1_qPCR-
F1/psy1_qPCR-R1 primer pair. The Apsy2a_qPCR-F1/psy2a_qPCR-R1 (Asupina) and
Cpsy2a_qPCR-F1/psy2a_qPCR-R1 (Cavendish) primer sets were used to amplify psy2a
templates. The psy2-3’RACE-In-01/psy2-qPCR-RVS and actin1-qPCR-F1/actin1-qPCR-R1
control primer pairs were designed to amplify regions of psy2 and actin1, respectively, that
include introns for the detection of gDNA contamination.
The TitanTM One Tube RT-PCR system (Roche Applied Science, Chapter 2.2.1) was used to
amplify templates from 3 ng mRNA using these primers with the annealing temperature and
extension time modified to 60 °C and 30 sec, respectively. The semi-quantitative PCRs were
repeated for consistency. The actin1 and psy2 control primers were used to detect gDNA
contamination from 3 pg mRNA using the GoTaq Green® (Promega) PCR system as per
Chapter 2.2.1 with annealing temperature and extension time of 60 °C and 30 sec,
respectively. RT-PCRs (12.5 μL) was electrophoresed on a 2% TAE agarose gel for 40 min
(Chapter 2.2.3) against 500 ng GeneRuler™ 50 bp DNA Ladder (Fermentas). GeneTools
v3.07 software was used for densitometry of RT-PCR product band intensity based on the
500 bp reference band (75 ng DNA) and results analysed in Excel 2007 (Microsoft).
5.3 Results 5.3.1 PSY promoter isolation and analysis
5.3.1.1 Promoter isolation
The genome regions approximately 2500 to 3000 bp upstream of the Asupina and Cavendish
psy1 and psy2a genes, containing their respective putative promoters, were isolated using
genome walking PCR. Overlapping fragments were used to generate consensus sequences
representing each promoter region, which were then amplified as single fragments that also
included the native 5’ UTR. The promoter fragments for each gene and cultivar were cloned
and sequenced and a representative clone of each was selected for further analysis. The psy1
promoter clones from Asupina (Apsy1pr) and Cavendish (Cpsy1pr) cultivars contained
fragments of approximately 2700 bp. The Asupina psy2a promoter (Apsy2apr) clone
contained an insert of approximately 2300 bp. However, during isolation of the Cavendish

98
psy2a promoter, three clones (Cpsy2apr1, Cpsy2apr2 and Cpsy2apr3) containing slightly
different sequences were identified. Cpsy2apr1 was approximately 2300 bp, while
Cpsy2apr2 and Cpsy2apr3 were approximately 2400 bp. The activity of all three psy2a
promoter clones was subsequently investigated. The Asupina and Cavendish psy2b promoter
regions could not be isolated using the same genome walking strategy. This was possibly due
to technical limitations such as PCR amplification efficiency or target template quality.
5.3.1.2 Promoter analysis
The overall structure of the psy1 and psy2a genes from Asupina and Cavendish was
investigated by comparing their promoter sequences with available mRNA and gDNA data
obtained in Chapter 3.
Comparison of the genomic 5’ UTR sequences of Asupina and Cavendish psy1 with their
corresponding mRNA sequences showed that the psy1 5’ UTR was divided into 3 exons that
were interrupted by two introns (Figure 5.3). The first exon was 175 bp and 143 bp in
Asupina and Cavendish, respectively, while the second exon was 91 bp in both psy1
sequences. The 3’ 88 bp of the 5’ UTR in combination with the first coding region exon
(termed exon 1 in Chapter 3) formed exon 3. In contrast, the psy2a genes did not have
introns in their 5’ UTRs, which formed the first half of exon 1 (Figure 5.3). As 5’ RACE was
not able to identify the true 5’ end of the Cavendish psy2a mRNA transcript (Chapter 3), a
282 bp 5’ UTR was predicted by aligning its genomic sequence with the 276 bp Asupina
psy2a 5’ UTR. Overall, exon 1 of Asupina and Cavendish psy2a was 634 and 649 bp,
respectively (Figure 5.3). Phylogenetic analysis of the psy promoters (Figure 5.4) showed
that the psy1 and psy2a sequences separated into distinct groups as expected. Asupina and
Cavendish psy1 sequences were 88% identical, while Apsy2apr was 84% identical to
Cpsy2apr1 and 86% identical to Cpsy2apr2 and Cpsy2apr3. The longer Cavendish psy2a
promoter clones were 99% identical to each other but were only approximately 94 to 95%
identical to Cpsy2apr1 (Figure 5.4b). In contrast, the promoters of different psy genes
exhibited very low identities.
Sequence alignment of Apsy1pr and Cpsy1pr suggested that both promoters had the same
structure with no notable gaps. In contrast, alignment of the Asupina and Cavendish psy2a
promoters identified large sequence gaps in one or more sequences relative to each other
(Figure 5.5). Apsy2apr had several large gaps compared to the Cavendish psy2a promoters
including 23, 33, 31 and 18 bp, which occurred at nucleotide position 451, 1118, 1226 and
1295, respectively, in the Apsy2apr sequence (Figure 5.5a – c). The most prominent gap in

99
Figure 5.3: Updated psy1 and psy2a genomic sequence information. Locations of the regulatory regions (grey line) of the Asupina psy1 (Apsy1pr), Asupina psy2a (Apsy2apr), Cavendish psy1 (Cpsy1pr), Cavendish psy2a (Cpsy2apr1, Cpsy2apr2, and Cpsy2apr3) promoters is indicated. Known exons (E) are numbered showing the position of 5’ UTRs (grey rectangle) and coding regions (black rectangle), and are separated by introns (grey line). The sizes of the first exon of the coding region of each psy gene (white text), 5’ UTR portion of exons (black text above grey rectangle) and introns in 5’ UTR (black text below grey lines) are also labelled. The 107 bp internal deletion in Cpsy2apr1 compared to Cpsy2apr2 and Cpsy2apr3 is also indicated (X).
Asupina psy1
Cavendish psy1
Asupina psy2a
500 bp
457 114 150
143 91 88
E1 E2 E6 E5 E7 E8 E3 E4
Cpsy1pr
175 91 87
112 148 457
E1 E2 E6 E5 E7 E8 E3 E4
Apsy1pr
276 358
E4 E3 E5 E6 E2 E1
Apsy2apr
Cavendish psy2a
X
Cpsy2apr1
282 367
E4 E3 E5 E6 E2 E1
282
E4 E3 E5 E6 E2 E1
367
Cpsy2apr2 and Cpsy2apr3

100
a)
b) Sequence A Length (bp) Sequence B Length (bp) Identity (%) Apsy1pr 2672 Cpsy1pr 2650 88 Apsy2apr 2333 Cpsy2apr1 2292 84 Apsy2apr 2333 Cpsy2apr2 2427 86 Apsy2apr 2333 Cpsy2apr3 2415 86 Cpsy2apr1 2292 Cpsy2apr2 2427 95 Cpsy2apr1 2292 Cpsy2apr3 2415 94 Cpsy2apr2 2427 Cpsy2apr3 2415 99 Figure 5.4: Analysis of psy promoter sequences showing a) Bootstrapped radial tree of the Asupina psy1 (Apsy1pr), Asupina psy2a (Apsy2apr), Cavendish psy1 (Cpsy1pr), Cavendish psy2a (Cpsy2apr1, Cpsy2apr2, and Cpsy2apr3) promoters and b) percentage identity between promoter sequences.
Cpsy2apr1 was at nucleotide position 1478 (Figure 5.5d) with 118 bp and 107 bp deletions
compared to Apsy2apr and the other Cavendish psy2a promoters, respectively. There were
also two sequence gaps of 20 bp in the Cavendish psy2a promoters compared to Apsy2apr
(Figure 5.5e) at nucleotide positions 1912 and 1966 in Apsy2apr. These gaps occur at the 3’
end of the psy2a promoters in a region that was rich in repeat sequences and approximately
200 bp before the predicted transcription start sites. A common AG dinucleotide repeat that
was 30 bp in Apsy2apr and 40 to 48 bp in the Cavendish psy2a promoters was found at the
3’ end of this region (Figure 5.6). Several differences were observed upstream of the AG
repeat (Figure 5.6). Apsy2apr had eight TA dinucleotide repeats ranging in size from (TA)4
to (TA)18 in an 82 bp region downstream of a (CA)8 dinucleotide repeat In contrast,
Cpsy2apr1 had a single (TA)8 dinucleotide repeat downstream of a (CA)15 dinucleotide
repeat. Interestingly, there was a (TC)9 dinucleotide repeat immediately upstream of the CA
repeat. The Cavendish psy2apr2 and psy2apr3 promoters had TC repeats that were about 3
fold larger than that of Cpsy2apr1, smaller (CA)4 repeats and lacked the TA repeat region.
Upstream of the conserved AG repeat, Cpsy2apr1 did not have a spacer sequence that
separated it from the other dinucleotide repeats unlike the other Cavendish psy2a promoter
sequences (8bp spacer) and Apsy2apr (26 bp spacer).

101
a) Cpsy2apr2 ACATAGATCATGAACTGCACATGATGGCTAACGTGAAGACCAAGGAGAATTACTTCATCC 480 Cpsy2apr3 ACATAGATCATGAACTGCACATGATGGCTAACGTGAAGACCAAGGAGAATTACTTCATCC 480 Cpsy2apr1 GCATAGATCATGAACTGCACATGATGGCTAACGTGAAGACCAAGGAGAATTGCTTCATCC 476 Apsy2apr ACATAGATCATGAACTGCACATGATGGCTAACGTGAAGACCA------------------ 451
***************************************** Cpsy2apr2 AACCATTTCTTCTTTGCTGCAGCAGCAATTGTTTTAATGGAAGCTTGCAGCGAAGCCTTA 540 Cpsy2apr3 AACCATTTCTTCTTTGCTGCAGCAGCAATTGTTTTAATGGAAGCTTGCAGCGAAGCCTTA 540 Cpsy2apr1 AACCATTTCTTGTTTGCTGCAGCAGCAATTGTTTTAATGGAAGCTTGCAGCGAAGCCTTA 536 Apsy2apr -----TTGCTTCTTTGCTGAAGCAGCAATTGTTTTAATGGCAGATTGCAGCGAACCCTTA 506
** *** ******* ******************** ** ********** *****
b) Cpsy2apr2 TGTAGACGA-----CGAAGAATATTTTGTTCATACCATATAATATTCTCCCTCATTAATC 1194 Cpsy2apr3 TGTAGACGA-----CGAAGAATATTTTGTTCATACCATATAATATTCTCCCTCATTAATC 1194 Cpsy2apr1 TATAGACGATAGGACGGAGAATATTTTGTTCGTACCATATAATATTCTCCCTCATTAATC 1189 Apsy2apr GGTAGATGATAGGACAGATAATATTTTGT------------------------------- 1118 **** ** * * ********** Cpsy2apr2 GGATATAAAAAGTCACTTAGAACATGATAAACAAGGTTAATTATTATTTACTAAAATTAT 1254 Cpsy2apr3 GGATATAAAAAGTCACTTAGAACATGATAAACAAGGTTAATTATTATTTACTAAAATTAT 1254 Cpsy2apr1 TGATAGAAAAAGTCACTTGGAACACGATAAACAAGGTTAATTATTATTTACTAAAATTAT 1249 Apsy2apr --ATATAAAAAGTCGCTTGGAGCATGATAAATGAGATCAATTACTATTTACTAAAATTAT 1176 *** ******** *** ** ** ****** ** * ***** **************** Cpsy2apr2 TTCATCCTTGTCAACTACCAACTTGAGCAT-GGTTAGATCATGTCGAAAACTCTATTCGA 1313 Cpsy2apr3 TTCATCCTTGTCAACTACCAACTTGAGCAT-GGTTAGATCATGTCGAAAACTCTATTCGA 1313 Cpsy2apr1 TTCATCCTTGTCAACTAT-------AGCATCGGATAGATTATGTCGAAAATTCTATTCGA 1302 Apsy2apr TTCATTCTTATCAGCTATCAATTTGAGCATCCAATAGTTAA-----------CTATTGGA 1225 ***** *** *** *** ***** *** * * ***** ** Cpsy2apr2 CCTTAATCTTCATGTAGGTTGACGGTTGGATGAGCGTACAATCGAGTCTACATCAGCCCC 1373 Cpsy2apr3 CCTTAATCTTCATGTAGGTTGACGGTTGGATGAGCGTACAATCGAGTCTACATCAGCCCC 1373 Cpsy2apr1 CCTTAATCTTCATGTAAG--------------AGTGTACAATCGAGTCTACATTAGGCCC 1348 Apsy2apr C------------G------------------AGCATACAATTCAGTCTAC--CAA---C 1250 * * ** ****** ******* * *
c) Cpsy2apr2 CAAGCAATTATTCGAACTTCCACTCAATCACATCGAACTTCTTACGCAAACCTAAATCAA 1433 Cpsy2apr3 CAAGCAATTATTCGAACTTCCACTCAATCACATCGAACTTCTTACGCAAACCTAAATCAA 1433 Cpsy2apr1 CAAGCAAGTGTTCAAGCTTCCACTCAATCACATCGGACTACTTACACAAATCTAAATCAA 1408 Apsy2apr CAAGTAAGCGTTTAGGTTTTTCTTTAATCATATCGAAATTTTTAC--------------- 1295 **** ** ** ** * ***** **** * * **** Cpsy2apr2 ATCAGCTTATTCTATGTATCATTAATATTTATATTATGGCACATTAATATACTGACTCAT 1493 Cpsy2apr3 ATCAGCTTATTCTATGTATCATTAATATTTATATTATGGCACATTAATATACTGACTCAT 1493 Cpsy2apr1 ATCAGCTTGTTCCAGGTATCATTAATATTTATATTATCGCACATTAATATGCTGACTCAT 1468 Apsy2apr ---AGTCTGTTCCAAACATCATCGATATTTATGTTATCTCACATTAATCCGTTGACTCAT 1352 ** * *** * ***** ******** **** ********* ********
d) Cpsy2apr2 AAAATCTTAAAATTTAACTCTCAAACTGTTGTAATATCAACATC--------GACATTAA 1545 Cpsy2apr3 AAAATCTTAAAATTTAACTCTCAAACTGTTGTAATATCAACATC--------GACATTAA 1545 Cpsy2apr1 AAAATCTTAA-------------------------------------------------- 1478 Apsy2apr AAAATCTTAAAATTTAACTCCCAAACCGTTATAATATCAATATCCAAACATGGACATTAA 1412 ********** Cpsy2apr2 ATCGGAAGAGATGG-TTTGAATGATGACGAAGAGAGTTGCCTCCAACATCGACACA--AA 1602 Cpsy2apr3 ATCGGAAGAGATGG-TTTGAATGATGACGAAGAGAGTTGCCTCCAACATCGACACA--AA 1602 Cpsy2apr1 ------------------------------------------------------------ Apsy2apr ATTGGAAGAGATGGGTTTGAATGATGACCGAGAGAGTAGCCTCCAACATTGACACATAAA 1472 Cpsy2apr2 TAGTTTGATACATGTAGATAGCTATCCAATCTTCCTATTCATGCATATGAAAGACCAACA 1662 Cpsy2apr3 TAGTTTGATACATGTAGATAGCTATCCAATCTTCCTATTCATGCATATGAAAGACCAACA 1662 Cpsy2apr1 --------TACATGTAGATAGCTATCCAATCTTCCTATTCATGCATCTGTAAGACCAACA 1530 Apsy2apr TTGTTTGATACACGTAGA-AGCTATCCAATCTTCCTATTCATGCATCTATAAAACCAACA 1531 **** ***** *************************** * ** *******
e) Cpsy2apr2 CTCTCTCTCTCTCTCTCTCTCTCTC--------------------TCTCTCTCTCTCTCT 2055 Cpsy2apr3 CTCTCTCTCTCTCTCTCTCTCTCTC--------------------TCTCTCTCTCTCTCT 2055 Cpsy2apr1 CTCTCTCTCTCACACACACACACAC--------------------ACACACACACACACA 1924 Apsy2apr CACACACATATATATGTATATATATGTGTATAAATATATATGTGTATATATATATACACA 1946 * * * * * * Cpsy2apr2 CTCTCTC-CACACACATAT--------------------CATTCAGAGAGAGAGAGAGAG 2094 Cpsy2apr3 CTCTC---CACACACATAT--------------------CATTCAGAGAGAGAGAGAGAG 2092 Cpsy2apr1 TATAT----ATATATATAT---------------------AGAGAGAGAGAGAGAGAGAG 1959 Apsy2apr TATATATACATATATATATGTGTGTATATATGGGTTTGACACAATGGCAATGAATGAGAG 2006 * * * **** * * * ** ***** Cpsy2apr2 AGAGAGAGAGAGAGAGAGAGAAAGAGACAGATGCTGATGGGTTTCACCTCAAATTGTTCT 2154 Cpsy2apr3 AGAGAGAGAGAGAGAGAGAGAAAGAGACAGATGCTGATGGGTTTCACCTCAAATTGTTCT 2152 Cpsy2apr1 AGAGAGAGAGAGAGAGAGAGAGAGAGACAGATGCTGATGGGTTTCACCTCAAATTGTTCT 2019 Apsy2apr AGAGAGAGAGAGAGAGAGAGAGAGAGGCCGACGCTTCTGCGTTTCACCTCAAATTGTTGT 2066 ********************* **** * ** *** ** ****************** *
Figure 5.5: Alignment of selected regions of psy2a promoters showing sequence gaps found in each promoter. The location of each region a) to e) from the first nucleotide of the cloned promoter sequence is indicated by numbers on the right hand side of each line. Gaps in the sequence alignment (dashes highlighted in grey) and conserved residues (* below each line) are also highlighted.

102
Apsy2apr TTATGCAGATCACACACACACACACATATATATGTATATATATGTGTATAAATATATATGTGTATATATATATACACATATATATACATATATATATGTGTGTATATATGGGTTTGACACAATGGCAATGAATGAGAGAGAGAGAGAGAGAGAGAGAGAGAGAGGCCGACGCTT Cpsy2apr1 TTTATGCAGATCTCTCTCTCTCTCTCTCTCACACACACACACACACACACACACACACATATATATATATATATAGAGAGAGAGAGAGAGAGAGAGAGAGAGAGAGAGAGAGAGAGAGAGACAGATGCTG Cpsy2apr2 TTTATGCAGATCTCTCTCTCTCTCTCTCTCTCTCTCTCTCTCTCTCTCTCTCTCTCTCTCTCTCTCCACACACATATCATTCAGAGAGAGAGAGAGAGAGAGAGAGAGAGAGAGAGAGAAAGAGACAGATGCTG Cpsy2apr3 TTTATGCAGATCTCTCTCTCTCTCTCTCTCTCTCTCTCTCTCTCTCTCTCTCTCTCTCTCTCTCCACACACATATCATTCAGAGAGAGAGAGAGAGAGAGAGAGAGAGAGAGAGAGAAAGAGACAGATGCTG Figure 5.6: Repeat sequence analysis of psy2a promoters of Asupina and Cavendish showing the position of identified dinucleotide repeats in each promoter: TA (text underlined with dots), CA (italicised text), TC (bold text) and AG (white text with black background). Spacer nucleotides preceding the AG dinucleotide repeat (small capital letters) and the 10 nucleotides flanking the repeat region (plain capital letters) are also shown.
The presence of adjacent TC and AG dinucleotide repeats in this region raised the possibility
that it may form secondary structure in the Asupina and Cavendish psy2a promoters. The
most stable structures identified during analysis of this region for DNA secondary structure
elements are shown in (Figure 5.7a). The main loop of Apsy2apr had a 39 bp long stem
region that terminated in a small loop consisting of 4 bp. Approximately 11 bp downstream
of the main Apsy2apr loop, before the conserved AG repeat, was a smaller secondary loop
structure. The main feature of this region in Cpsy2apr1 was a structure with a stem of 18 bp
and a 33 bp main loop. Interestingly, at the 3’ end of the main loop was a smaller 14 bp
structure with a 6 bp loop region, and no other structures were observed prior to the AG
repeat region. Cpsy2apr2 and Cpsy2apr3 were predicted to form the largest secondary
structure which consisted of stem and loop regions of 104 bp and 27 bp, respectively.
Analysis of the properties of all the predicted DNA secondary structures (Figure 5.7a)
showed that the loops of the longer Cavendish psy2a promoters (Cpsy2apr2 and Cpsy2apr3)
were the most stable, followed by those of Apsy2apr and Cpsy2apr1. The more stable loops
tended to have higher predicted melting temperatures. Interestingly, the Cpsy2apr1
secondary structure had only one predicted form while Apsy2apr and the other Cavendish
psy2a promoters had 3 and 4 forms respectively. The region in which the predicted DNA
secondary structures occurred was approximately 50 bp upstream of the transcription start
site of the Asupina and Cavendish psy2a promoters (Figure 5.7b).
As differences in promoter sequence composition, such as the gaps in the psy2a promoters,
could affect the presence of regulatory elements, the Asupina and Cavendish psy1 and psy2a

103
a) i)
Apsy2apr = -31.22
iii)
Cpsy2apr2 = -46.64 Cpsy2apr3 = -46.94
ii)
Cpsy2apr1 = -21.72
b)
Figure 5.7: Secondary structure analysis of repeat region in the psy2a promoters of Asupina and Cavendish. a) Predicted secondary structures of the repeat regions of: (i) Apsy2apr, (ii) Cpsy2apr1, (iii) Cpsy2apr2 and Cpsy2apr3 with the free energies (∆G, measured in kcal/mol) of the most stable predicted structures. b) Representation of the 3’ end of the psy2a promoters marking the location of the predicted secondary structures (loop), 5’ UTR region, and 5’ coding region (CR) with the positions of the transcription start site (tx start) and start codon (ATG) shown.
Loop tx start
CR
ATG
5’ UTR
100 bp

104
Figure 5.8: Identification of putative DNA regulatory motifs in banana psy promoters compared to those previously identified in the Arabidopsis thaliana psy promoter (Welsch et al., 2003). The position of A (ATCTA), G1 (CACGAG) and G2 (CTCGAG) motifs in the 5’ UTR (orange arrow) and untranscribed regions (yellow line) of the promoters is shown. The two ATCTA motifs previously characterised in Arabidopsis are marked with an asterisk (A*).
200 bp
Cpsy2apr2/3 G2
Cpsy2apr
A G2
Apsy2apr A G2 A
Cpsy1pr G1 A A A A G1 G2
Arabidopsis G1 G2 A A*
A* A A A A
Apsy1pr A G2 G1 A

105
promoter sequences were further analysed to look for the ATCTA (basal promoter activity),
G1 and G2 (red light responsive) regulatory motifs previously identified in the Arabidopsis
thaliana psy promoter (Figure 5.8). The untranscribed regulatory region upstream of the 5’
UTR of Apsy1pr had single putative ATCTA (position 427) and G1 (position 1512) motifs,
while the Cpsy1pr regulatory region had three putative ATCTA motifs (positions 427, 526
and 1645) and two putative G1 motifs (positions 1258 and 1480). There were no G2 motifs
in the untranscribed region of the psy1 promoters but there was a single putative G2 motif
and ATCTA motif in the 5’ UTR of both Apsy1pr and Cpsy1pr.
There were no G1 motifs found in any psy2a promoter sequences. Apsy2apr, Cpsy2apr1,
Cpsy2apr2 and Cpsy2apr3 each had one G2 motif at positions 1044, 1084, 1094 and 1094,
respectively, in the untranscribed regulatory region. Interestingly, while there were two
ATCTA motifs in Apsy2apr (positions 1516 and 1533) and one in Cpsy2apr1 (position
1398), there were no ATCTA motifs identified in Cpsy2apr2 and Cpsy2apr. Additionally, no
putative regulatory motifs were found in any of the psy2a 5’ UTRs. Generally, the putative
ATCTA motifs in the psy1 promoters were located 5’ of the putative G1 motifs, but were 3’
of the putative G2 motif found in the psy2a promoters. However, one predicted ATCTA
motif in Cpsy1pr was 3’ of both putative G1 sequences. Differences in the presence and
location of these putative regulatory elements may reflect differences in the activity of the
Asupina and Cavendish psy1 and psy2a promoters that could influence pVA accumulation
by modifying gene expression.
5.3.2 Comparison of promoter activity The activity of the Asupina and Cavendish psy1 and psy2a promoters was compared by
subcloning these regions into the pGEM-4Z-based expression vector to facilitate GUS
expression in banana (Cavendish Williams) ECS and Cavendish green and ripe fruit tissue.
The promoter regions investigated included Apsy1pr, Apsy2a-pr, Cpsy1pr and the three
variants of the Cavendish psy2a promoter (Cpsy2apr1, Cpsy2apr2, and Cpsy2apr3)
identified during promoter isolation. The ACC oxidase and ubiquitin promoter regions,
acopr and ubipr, were included as fruit-specific and constitutive positive control promoters,
respectively. Untransformed tissue was included as a negative control.
5.3.2.1 Microprojectile bombardment of banana ECS
Each of the six psy promoter constructs and two controls were bombarded onto four plates of
banana ECS, before histochemical staining for qualitative analysis of GUS expression to
estimate promoter activity. Transient expression of GUS under the control of Apsy1pr,
106
Cpsy1pr and Cpsy2apr1 appeared to be similar based on visual analysis of the numbers
transformed cells (blue foci) at 16× magnification while Apsy2apr yielded fewer foci and
ECS transformed with the Cpsy2apr2 and Cpsy2apr3 constructs were identical to the unshot
control (no visible foci, results not shown). The control promoters acopr and ubipr appeared
to direct significantly higher transient GUS expression than the banana psy promoter
constructs as greater numbers of foci were observed (results not shown). This experiment
was repeated and one replicate of each treatment was stained histochemically (Figure 5.9a).
The results were consistent with those observed in the first experiment. The remaining three
replicates were assayed using a fluorimetric MUG assay (Figure 5.9b & c) to quantitatively
compare the differences in Asupina and Cavendish promoter activity in ECS. GUS
expression directed by ubipr and acopr was significantly higher than both the unshot ECS
and banana promoters (Figure 5.9b). Closer comparison of banana psy promoter activities
(Figure 5.9c), without the two positive controls, showed that Cpsy2apr1 was the most active
of the psy promoters followed by Apsy1pr, Apsy2apr and Cpsy1pr which were 6.5 fold, 3.7
fold, 2.7 fold and 1.5 fold higher than the unshot control, respectively. ECS transformed with
GUS vectors driven by Cpsy2apr2 and Cpsy2apr3 showed no visible GUS foci (Figure
5.9a), and their GUS expression was consistent with that of the unshot control (Figure 5.9c).
There was considerable variability within sample replicates and only Cpsy2apr1 differed
significantly from other promoters, with the exception of Apsy1pr, which was also not
statistically different from the unshot controls. The high level of variation seen between
Cpsy2apr1 replicates was confirmed not to be due to the MUG assays and must have arisen
during bombardment. The experiment could not be repeated due to limited availability of
ECS.
5.3.2.2 Microprojectile bombardment of banana fruit
Having observed differences in the activity of the Asupina and Cavendish psy promoters in
banana ECS, these promoters were then tested transiently in banana leaf and fruit tissue for
comparison in a more representative gene expression background to better reflect their
potential impact on carotenoid biosynthesis.
Promoter activity was initially examined in tissue cultured leaf of Asupina and Cavendish
(two leaves per treatment). Each banana psy and control promoter was bombarded into leaf
tissue of both cultivars (four replicates) and histochemically stained after 24 hr incubation
post-bombardment. Only a handful of faint GUS foci were observed across all treatments
(results not shown). The experiment was repeated once with similar results, particularly for
the acopr and ubipr positive controls (results not shown), indicating the need for further

107
a)
i)
ii)
iii)
iv)
v)
vi)
vii)
viii)
ix)
b)

108
c)
Figure 5.9: Analysis of banana psy promoter activity in banana ECS (24hr post bombardment). a) Histochemical assays of GUS reporter gene activity controlled by banana psy and control promoters. Representative photographs showing i) unshot cells and cells transformed with ii) aco, iii) ubi, iv) Apsy1pr, v) Cpsy1pr, vi) Apsy2apr, vii) Cpsy2apr1, viii) Cpsy2apr2 and ix) Cpsy2apr3 promoter constructs (16× magnification). Quantitative fluorimetric analysis (MUG assay) of banana psy promoter activity compared to the unshot negative control and the acopr and ubipr positive control promoters b) or the negative control only c) (to better demonstrate differences in psy promoter activity). Three replicates were averaged per fluorescence measurement (green columns) except the unshot control (two replicates). The error bars on each column represent standard deviation (not calculated for unshot samples due to the number of replicates). One-way ANOVA with least significant difference post-hoc analysis was used to determine the statistical significance of promoter activity in b) and c) with a 95% confidence level. Letters above each bar (a and b) in the graphs were used to group treatments with promoter activity levels that were not statistically different. Statistical analysis in c) omitted the acopr and ubipr positive controls.

109
optimisation. However, analysis of promoter activity in leaf tissue was discontinued due to
unavailability of leaf tissue for further experiments and insufficient time. All subsequent
promoter analysis was undertaken in fruit tissue.
Initially, the Asupina and Cavendish psy and control promoter constructs were bombarded
into ripe Cavendish fruit tissue purchased from a supermarket. This fruit was at an advanced
stage of ripening characterised by completely yellow peel colour and ripened flesh (but was
not overripe). Due to difficulties in obtaining fruit slices of consistent mass and surface area,
and the fact that microprojectile bombardment would only transform surface tissue, meaning
that GUS expression would not be detectable in fruit lysates that would consist mainly of
untransformed cells, fluorimetric analysis was not considered reliable for comparison of
GUS expression in fruit. Therefore, all bombarded fruit replicates were histochemically
stained to assess GUS activity. Histochemical staining after 24 hr incubation gave no visible
signs of expression for any of the banana psy promoter constructs in addition to inconsistent
results for acopr and ubipr control promoters, which did not show expression in some
replicates (results not shown). This was hypothesised to be due to the condition of the fruit,
therefore, ethylene-treated green fruit obtained from a supermarket and exhibiting a
completely green peel colour and firm flesh texture, were subsequently used. GUS
expression driven by ubipr was lower than expected and yielded far fewer foci than acopr
(Figure 5.10a), which was almost four fold more active (Figure 5.10b). Generally, the
banana psy promoters were identical to the unshot control (Figure 5.10a), and only one of the
four Cpsy2apr1 replicates displayed any visible GUS expression (four GUS foci). This was
visible only under high magnification using a stereo microscope and was comparatively
lower than acopr (Figure 5.10a iv & v). Statistical analysis (Figure 5.10b) showed that the
activities of acopr and ubipr differed significantly from those of the banana psy promoters,
but not from each other. The apparent statistical similarity between the activities of the
unshot (two replicates) and ubipr (four replicates) controls was due to software limitations in
the handling of the number of replicates rather than equivalence of the activities of the two
treatments. In summary, the results suggested that the banana promoters were not active to
detectable levels in ethylene-treated green fruit as all were comparable to unshot tissue
(Figure 10b). However, low expression of the constitutive ubipr promoter indicated that the
experiment required further optimisation such as a longer incubation time post
transformation to enhance GUS accumulation.
On the strength of the previous results, a larger experiment was carried out on green fruit
tissue that had not been ethylene treated, and obtained directly from a banana grower. The
number of replicates was doubled to eight so that GUS staining could be tested at both 24

110
a) i)
ii)
iii)
iv)
v)
b)
Figure 5.10: Analysis of psy promoter activity in gassed green fruit (24 hr post bombardment) showing a) unshot tissue i), tissue bombarded with ii) ubipr and iii) acopr at 2.68× magnification, and iv) acopr and v) Cpsy2apr1 at 16× magnification. b) Semi-quantitative analysis of promoter activity measuring average GUS expression (four replicates), with standard deviation represented as error bars on each column. No standard deviation was calculated for the unshot control (two replicates). Statistical significance of promoter activity was calculated with 95% confidence using a one-way ANOVA and least significant difference post-hoc analysis. Promoters whose activities were not statistically different were grouped using the same letter (a, b or c), located above each bar. The unshot (a*) and ubipr (c*) groups were not determined to be statistically significant by SPSS v16 due to the difference in the number of replicates in the unshot control (two) compared to psy the promoter treatments (four), which affected the way that SPSS processed the data.

111
and 72 hr post bombardment (four replicates each). After 24 hr, tissue transformed with
acopr and ubipr GUS expression vectors appeared to have similar numbers of foci (Figure
5.11a) although closer analysis suggested that the activity of ubipr was 30% higher than
acopr (Figure 5.11b). Histochemical staining of fruit bombarded with Apsy1pr, Apsy2apr
and Cpsy1pr GUS vectors produced very few foci, and Cpsy2apr1 transformants yielded
more foci that were clearly visible (Figure 5.11a). Semi-quantitative analysis showed that
Cpsy2apr1 was twice as active as Apsy1pr and Cpsy1pr, whose levels were similar, and over
3.5 fold more active than Apsy2apr (Figure 5.11b). Cpsy2apr2 and Cpsy2apr3 showed no
visible GUS staining and were identical to the unshot control (results not shown). Only the
activities of positive control promoters (acopr and ubipr) were statistically significant from
unshot tissue after 24hr incubation (Figure 11b), although Cpsy2apr1 was also statistically
similar to acopr. In comparison, after 72 hr incubation post bombardment distinct GUS foci
were obvious in all treatments (Figure 5.11a) except Cpsy2apr2 and Cpsy2apr3, which were
identical to the unshot control (results not shown). The activity of ubipr was almost double
that of acopr (Figure 5.11b). Cpsy1pr was approximately 2.5 fold more active than Apsy1pr
and Apsy2apr, which had similar activity (Figure 5.11b). Cpsy2apr1 appeared to have more
prominent foci than Cpsy1pr (Figure 5.11a) but was only 85% as active based on number of
foci (Figure 5.11b).
Incubation for 72 hr compared to 24 hr gave improved results for all the promoters tested
with the greatest difference seen in Apsy2apr and Cpsy1pr which were 10 and 15 fold
higher, respectively (Figure 5.11b). Generally, the Cavendish psy promoters performed
better than those of Asupina and both psy1 and psy2a appear capable of similar levels of
expression in fruit. However, as was seen in the transformation of banana ECS, Cpsy2apr1
was the only Cavendish psy2a promoter that showed any activity. Neither Cpsy2apr2 nor
Cpsy2apr3 were active even after 72 hr incubation. There was high variation in promoter
activity between replicates of each treatment, and the only promoters driving GUS
expression that were statistically significant from unshot tissue after 72 hr were Cpsy1pr,
Cpsy2apr1 and the positive controls (acopr and ubipr). However, the activities of these
promoters were equivalent to Apsy1pr and Apsy2apr, whose activities were not statistically
significant from unshot tissue. These results suggested that there was no significant
difference between the Asupina and Cavendish psy promoter activities. To investigate the
impact of promoter activity in the context of other variables that affect gene expression, the
transcript levels of psy1 and psy2a were analysed semi-quantitatively.

112
a) 24 hr incubation 72 hr incubation 24 hr incubation 72 hr incubation
unshot
Cpsy2apr1
Apsy1pr
acopr
Apsy2apr
ubipr
Cpsy1pr

113
b)
Figure 5.11: Analysis of psy promoter activity in ungassed green fruit after 24 and 72 hr incubation post transformation. a) Photographs showing GUS activity of representative samples of each psy promoter and control treatment [8× magnification]. b) Graph comparing average promoter activity of each treatment (4 replicates) in a) with standard deviations represented by error bars on the respective column. Statistical significance of promoter activity was calculated separately for 24 and 72 hr treatments, with 95% confidence using a one-way ANOVA and least significant difference post-hoc analysis. Promoters whose activities were not statistically different were grouped using the same letter (a to f) located above each bar in bold blue (24 hr) or red (72 hr) text, respectively.

114
5.3.3 Analysis of mRNA transcript abundance 5.3.3.1 Ripening trial
Samples of Asupina and Cavendish fruit flesh were required at different stages of ripening to
compare changes in pVA accumulation (Figure 5.12) and as a source of material from which
mRNA would be extracted for semi-quantitative comparison of psy1 and psy2a transcript
levels.
Green fruit from both cultivars was simultaneously ripened over a 12 day period with
sampling every two days. These fruit were classified into two sizes, large and small,
depending on their position on the banana bunch which correlated with the level of maturity.
During the ripening trial, observations were made regarding the morphological
characteristics of the fruit at each sampling point. On day 0 (prior to ripening induction) the
peel of both Asupina and Cavendish fruit samples was completely green and difficult to
remove. When an incision was made into the skin of the Asupina fruit during the removal of
the peel, a viscous and sticky purple sap was observed oozing out of the incision in
significant quantity (Figure 5.12, day 0 panel). However, incision of Cavendish fruit
produced a sap that was initially colourless before darkening on exposure to air and was
much less viscous and less sticky than the Asupina sap (not shown). Comparatively, the sap
exuded by the Asupina fruit did not darken. The fruit flesh of both the Cavendish and
Asupina specimens was starchy and firm in texture and creamy white in colour.
Characteristics of the fruit that was sampled are summarised in Table 5.2. By day 6 it was
clear that Cavendish fruit was not likely to ripen as the peel and flesh colour of the fruit
remained unchanged and it began to desiccate. Consequently, sampling of Cavendish fruit
was discontinued. Ripening of the Asupina fruit was continued and is documented in Figure
5.12. On the final day of the ripening trial, Day 10, the peel of the Asupina fruit sampled at
this stage was completely yellow, although the ridges of the small fruit retained small green
streaks.
The slow development of colour during ripening suggesting that pVA accumulation is
gradual in Asupina. At Day 10 the Asupina fruit was still not completely ripe compared to
previously obtained samples (Chapter 3.2.1, results not shown), which had a distinct orange
flesh colour. Unfortunately, additional fruit was not available. Overall, the large and small
fruit samples of Asupina shared the same ripening progression despite differing stages of
maturity as indicated by size and position on the bunch. As the Cavendish fruit failed to fully
ripen, unripened small fruit (day 0) and ripe fruit (purchased from a supermarket) were the
only available tissue samples from this cultivar. Therefore, samples of unripened small fruit
(day 0) and the most ripe small fruit available (day 10) from Asupina (Figure 5.12) were

115
Figure 5.12: Ripening of Asupina green fruit. a) Photographs showing changes in outer peel and flesh colour during the ripening of large and small fruit.

116
Table 5.2: Analysis of the ripening of Asupina and Cavendish green fruit
Date Source type day Outer Peel colour Mass (g) Length (cm)
22/11/2007 Asupina large 0 Fully green 180.2 16
22/11/2007 Asupina Small 0 Fully green 133.1 15
22/11/2007 Cavendish large 0 Fully green 287.9 23
22/11/2007 Cavendish Small 0 Fully green 195.5 17
24/11/2007 Asupina large 2 Green, yellowing slightly 186.0 16
24/11/2007 Asupina Small 2 Green, yellowing slightly 124.1 13
24/11/2007 Cavendish large 2 Green, lighter than day 0 264.5 21
24/11/2007 Cavendish Small 2 Green, lighter than day 0 183.0 17
26/11/2007 Asupina large 4 Light green 164.8 15.5
26/11/2007 Asupina Small 4 Light green 117.2 13.5
26/11/2007 Cavendish large 4 Light green 229.0 20.0
26/11/2007 Cavendish Small 4 Light green 192.3 17.5
28/11/2007 Asupina large 6 Green with yellow sections 166.2 15
28/11/2007 Asupina Small 6 Green with yellow sections 112.4 13
28/11/2007 Cavendish* large 6 Fruit not sampled N/A N/A
28/11/2007 Cavendish* Small 6 Fruit not sampled N/A N/A
30/11/2007 Asupina large 8 Yellow with green patches 151.9 14.5
30/11/2007 Asupina Small 8 Yellow with green patches 119.4 13.5
02/12/2007 Asupina large 10 Yellow 146.2 15
02/12/2007 Asupina Small 10 Yellow with green ridges 133.7 13
*Ripening of Cavendish fruit was terminated at day 6 and no samples were taken (N/A) as the fruit failed to ripen and began to desiccate.

117
selected for semi-quantitative comparison of psy mRNA levels at similar developmental
stages. Total mRNA was isolated from these Asupina and Cavendish fruit samples in
addition to leaf tissue from these cultivars.
5.3.3.2 Semi-quantitative PCR
The expression of psy1 and psy2a mRNA was examined in leaf, green fruit and ripe fruit
tissue of Asupina and Cavendish using semi-quantitative RT-PCR (semi-qRT-PCR) to
determine their relative abundance in these tissues and potential tissue specificity. Half of
each mRNA sample was DNase-treated to remove gDNA, while the remaining mRNA
aliquot was stored untreated. Template quality of the DNase-treated mRNA was investigated
by RT-PCR using primers to amplify a fragment of the 5’ sequence of the actin1 coding
region, chosen as the housekeeping gene. In preliminary experiments, RT-PCR with actin1
primers amplified a band of approximately 110 bp as expected in all extracts, confirming that
the mRNA template was undegraded (results not shown).
To confirm the absence of intron-bearing sequences indicative of gDNA contamination and
without gDNA sequence data for actin1, control primers (psy2-3’ gDNA) were designed to
amplify across psy2 intron 5 (Chapter 3.3.4). These primers were designed to amplify both
psy2a and psy2b from Asupina and Cavendish and were expected to amplify products of 254
bp from mRNA. However, from gDNA, the primers were expected to amplify bands of 512
and 442 bp from Asupina and Cavendish psy2a templates, respectively, and bands of 489
and 481 bp from Asupina and Cavendish psy2b templates, respectively. These primers
repeatedly amplified RT-PCR products corresponding to fragments expected from both
gDNA and mRNA, indicating gDNA contamination (results not shown). This was also
supported by the presence of larger than expected products (~220 bp) in some samples
amplified by the actin1 primers (results not shown), suggesting that the actin primers
actually amplify across an intron (~100 bp) present in banana actin1 gDNA. Unexpectedly,
these results did not change despite additional DNase-treatment of the mRNA samples. To
further investigate this problem with gDNA contamination, actin1 and psy2-3’ gDNA
control primers were tested on the DNase-treated mRNA samples using GoTaq Green®
which lacks reverse transcriptase activity. This was compared with amplification using the
standard RT-PCR protocol and included Cavendish gDNA as a positive control (Figure
5.13a & b). The psy1 and psy2a primers, designed for semi-qRT-PCR to amplify the 5’
coding region and 5’ UTR, respectively, were also tested (Figure 5.13 c & d). While
products were amplified from the gDNA positive control template using both GoTaq Green®
PCR (Figure 5.13 a – d i) and RT-PCR (Figure 5.13 a – d ii), no fragments were amplified

118
a)
b)
c)
d)
Figure 5.13: Analysis of Asupina and Cavendish mRNA using i) GoTaq PCR and ii) RT-PCR followed by electrophoresis on 2% agarose gels. Primers a) actin1 5’coding region, b) psy2 3’ coding region, c) psy1 5’ coding region and d) psy2a 5’ UTR were tested on mRNA template from Asupina and Cavendish leaf (L), green fruit (GF) and ripe fruit (RF). Cavendish gDNA (gDNA) was used as a positive control. Lanes containing the GeneRulerTM 50 bp ladder (GR, Fermentas) and Marker X (MX, Roche Applied Science) molecular weight markers are indicated, as is the position of the wells (origin) in each gel.
i) ii)
i) ii)
i) ii)
i) ii)

119
with any of the primers from mRNA samples or negative controls using GoTaq Green® PCR.
This indicated that mRNA extracts were not contaminated with gDNA. Importantly, actin1
RT-PCR products were observed in all mRNA samples but not negative controls (Figure
5.13 a ii), confirming that the mRNA template was undegraded.
RT-PCR using the psy-specific primers produced amplicons of the sizes expected from
mRNA templates in all tissues except ripe fruit (Figure 5.13 b – d ii), suggesting an absence
of psy-specific RNA in this tissue. Surprisingly, the psy2-3’ gDNA control primers also
produced amplicons larger than the size predicted for mRNA, but consistent with those from
the gDNA control, in leaf and green fruit samples from both Asupina and Cavendish (Figure
5.13 b ii). As these bands were not amplified in GoTaq Green® PCR and were similar to
those previously seen after several treatments with DNase, they appeared to represent
amplicons from unprocessed psy2 mRNA (where at least intron 5 was not processed).
Interestingly, these products were also amplified in significant amounts from Cavendish ripe
fruit mRNA but not from Asupina. Larger bands (~220 bp), consistent with the size of the
gDNA positive control, were also observed in some lanes following RT-PCR with actin1
primers (Figure 5.13 a ii). An additional product (~ 400 bp) was amplified from Cavendish
leaf and green fruit mRNA and was not consistent with sizes expected from processed or
unprocessed transcripts (Figure 5.13 d ii). Additionally, larger bands that did not correspond
to processed mRNA were also amplified with psy1 5’ gDNA primers, from Asupina green
fruit and Cavendish ripe fruit (Figure 5.13 c ii). These bands appeared to be non-specific
amplification because the psy1 primers do not amplify across introns (identified in Chapter
3.3.4). No larger bands were observed from RT-PCR using psy2a 5’ UTR primers (Figure
5.13 d ii).
Semi-qRT-PCR templates were prepared by DNase-treatment of the second mRNA aliquots
before quantitation and normalising of mRNA concentration to approximately 3 ng/μL.
Relative expression of different psy transcripts could not be measured using earlier templates
because the mRNA concentrations were expected to be variable, despite the use of similar
amounts of starting tissue for mRNA extraction. The quality of this template and absence of
gDNA were confirmed by RT-PCR and GoTaq PCR, respectively, using actin1 primers
(results not shown), and results were identical to those in Figure 5.13a. The actin1, psy1,
psy2a and psy2-3’ gDNA primer sets were used in semi-qRT-PCR using equivalent amounts
of mRNA (~3ng) and repeated once for confirmation (Figure 5.14). Generally, RT-PCR
amplicons were consistent with previous results. However, several putatively non-specific
bands were also noted in some tissues amplified using psy2a 5’ UTR primers (Figure 5.14a
iii) and from Cavendish ripe fruit using psy2-3’ gDNA primers (Figure 5.14a iv). Only bands

120
a)
i)
ii)
iii)
iv)

121
b) i)
ii)
iii)
iv)
Figure 5.14: Semi-quantitative PCR analysis of banana psy expression. a) Agarose gel of products amplified by RT-PCR from leaf (L), green (GF) and ripe fruit (RF) mRNA using primers i) actin1 5’ coding region, ii) psy1 5’ coding region, iii) psy2a 5’ UTR and iv) psy2 3’ coding region. Target bands for densitometry analysis (#1, #2 and #3) are indicated by arrows. Lanes with the GeneRulerTM 50 ladder (GR, Fermentas) or Marker X (MX, Roche Applied Science) molecular weight markers are also shown. b) Densitometry analysis of target bands amplified using the i) actin1 5’ coding region, ii) psy1 5’ coding region, iii) psy2a 5’ UTR and iv) psy2 3’ coding region primers. The levels of actin1, psy1 and psy2a in panels i to iii are expressed as a percentage of the RT-PCR products obtained from green fruit, leaf and green fruit, respectively. In panel iv), target bands #1 and #2 are denoted by psy2a and psy2b, while band #3 is denoted by cDNA. All levels are expressed as a % relative to green fruit band #3.

122
of the expected sizes (target bands) corresponding to amplicons from processed and where
expected, unprocessed mRNA, were quantitated by densitometry. As expected, the actin1
target band (#1) was of similar intensity in all tissues tested (Figure 5.14a i) and this was
supported by densitometry analysis (Figure 5.14b i). The relative intensity of the psy1 target
band (#1) was 40% higher in leaf mRNA from both cultivars than in green fruit, and was
absent in ripe fruit (Figure 5.14a & b ii). The psy2a target band (#1) appeared more
prominent in green fruit mRNA of both cultivars than in leaf mRNA (Figure 5.14a iii). The
Asupina psy2a target band was approximately 30% higher in green fruit than leaf mRNA,
while the Cavendish psy2a target band intensity was marginally higher in green fruit (Figure
5.14b iii).
The psy2a/psy2b target band expected from amplification of processed mRNA using psy2-3’
gDNA control primers (Figure 5.14a iv; #3), was observed at similar intensities in both
Asupina and Cavendish leaf and green fruit samples, but was absent from ripe fruit of both
cultivars. The target band putatively representing psy2a with intron 5 (Asupina band #1 and
Cavendish band #2) was more intense than the equivalent band putatively representing psy2b
(Asupina band #1 and Cavendish band #2). No psy2 bands of any kind were observed in
Asupina ripe fruit, and no processed psy2 mRNA band (#3) was amplified from Cavendish
ripe fruit. However, both psy2a and psy2b unprocessed mRNA bands (#1 and #2) were
observed in Cavendish ripe fruit, and were more intense than those observed in leaf and
green fruit. The relative expression determined by densitometry supported these observations
(Figure 5.14b iv).
5.4 Discussion Preliminary studies in Chapter 3 suggested that there were differences in tissue specificity of
the psy genes, such that psy1 and psy2 were predominantly leaf and fruit associated,
respectively. In this chapter, the relative abundance of these transcripts in leaf, green fruit
and ripe fruit was further investigated. The psy1 and psy2a promoters were also isolated, and
their relative activity tested in banana fruit. Bioinformatic analysis of these promoters
revealed sequence differences that may be linked to psy promoter activity. Interestingly,
there was evidence of alternative intron splicing in banana and some differences in psy2
intron processing in ripe fruit of Cavendish compared to Asupina, which could potentially
influence pVA accumulation.
Single promoter sequences were identified for each of the Asupina and Cavendish psy1 and
psy2a genes with the exception of the Cavendish psy2a promoter, for which three variants of
different sizes were found. Efforts to isolate the psy2b promoters from these cultivars were

123
unsuccessful although several attempts were made using genome walking PCR with different
primer combinations. Failure to obtain these promoters was surprising due to the high
sequence similarity between psy2a and psy2b. Consequently, parameters such as primer
design or preparation of genome walking DNA library templates may need further
optimisation. The psy1 and psy2a gene structures proposed in Chapter 3 were revised to
include the promoter sequences, showing that the Asupina and Cavendish psy1 5’ UTRs
were divided between the first three exons, two of which were upstream of coding region
exon 1 (Chapter 3). Conversely, the Asupina and Cavendish psy2a 5’ UTRs were not
interrupted by introns and formed the 5’ end of exon 1. The presence of introns in the 5’
UTR is common in monocots (Christensen et al., 1992; Sivamani and Qu, 2006) as well as
dicots (Chung et al., 2006; Garbarino et al., 1995) and their presence has been shown to
enhance gene expression. This has been demonstrated for potato ubi7 (Garbarino et al.,
1995) and rice ubi3 (Sivamani and Qu, 2006) promoters, which directed significantly higher
levels of reporter gene expression than their intronless versions. The impact of the rice ubi3
5’ UTR intron on promoter activity was subsequently found to be tissue specific, with
apparently greater effect in roots than leaf tissue (Lu et al., 2008). The introns found in the
Asupina and Cavendish psy1 5’ UTRs could also play a role in tissue-specific regulation.
This could explain the high psy1 expression in leaf and its apparent down-regulation during
fruit ripening. Interestingly, the identification of G2 and ATCTA motifs in the Asupina and
Cavendish psy1 5’ UTRs may also play some related but presently unknown role in
determining tissue specificity.
Transient GUS reporter gene analysis of the Asupina and Cavendish psy1 and psy2a
promoters demonstrated that all promoters except the Cavendish psy2a variants, Cpsy2apr2
and Cpsy2apr3, were functional in embryogenic cells and green fruit. Cavendish promoters,
Cpsy1pr and Cpsy2apr1, seemed to be the most active of the promoters tested in green fruit
tissue. While Cpsy1pr gave similar numbers of GUS foci to Cpsy2apr1, the intensity of GUS
staining in cells transformed with Cpsy2apr1 appeared to be higher, suggesting this was a
stronger promoter. The lower level of GUS expression seen in the Asupina promoters
compared to those from Cavendish may reflect the fact that the Cavendish promoters were
expressed in their native tissue. However, none of the differences in activity between the
Asupina and Cavendish psy promoters tested were statistically significant (Figure 5.10 and
5.11). There were a number of sequence differences in the psy1 and psy2 promoters that may
influence promoter activity and tissue specificity. One of these was the repeat region that
forms a secondary structure immediately prior to the known transcription start sites of
Asupina and Cavendish psy2a. DNA secondary structures are widely known to influence
nucleic acid synthesis and gene expression, and examples of this can be seen in

124
bacteriophages (Gleghorn et al., 2008), bacterial plasmids, eukaryotic viruses and
geminiviruses (Orozco and Hanley-Bowdoin, 1996), and eukaryotic promoters (Yamagishi
et al., 2008). The function of the Asupina and Cavendish psy2a promoters appears to
correlate with the stability of the secondary structures formed in the repeat region. The
inactive Cavendish psy2a promoters (Cpsy2apr2 and Cpsy2apr3) appeared to form the most
stable structures, possibly due to the large stretches of CT dinucleotide repeat which are
complementary to the long GA dinucleotide repeats in all of the psy2a promoters. Apsy2apr
and Cpsyp2apr1 had either few or no CT repeats and were shown to putatively form weaker
structures. The promoter with the weakest predicted secondary structure was Cpsyp2apr1,
which appeared to be the most active. Weaker secondary structure may result in increased
transcriptional efficiency, as DNA strands would separate more easily to accommodate
transcriptional machinery. Interestingly, the length of dinucleotide repeats in different alleles
has been widely reported to affect promoter activity. For example, upregulation of HGMA2
promoter activity was associated with an increased number of TC repeats (Borrmann et al.,
2003), while an increase in the number of CA repeats was reported to reduce activity of the
Cyr61 promoter (Wang et al., 2005).
The shape of the secondary structures in the proximal promoter region of psy2a may also
influence its activity by affecting the binding of transcription factors that may ultimately
downregulate psy2a mRNA levels in Cavendish or upregulate them in Asupina. The
activation of the hoxd1 promoter and repression of hoxb9 and hoxd8 promoters, whose gene
products are transcription factors in early animal development, is regulate simultaneously in
mice (Yamagishi et al., 2008). This regulation appeared to be mediated by a DNA secondary
structure, in the 3’ promoter region adjacent to the 5’ UTR, which interacts with a putative
chromatin modification protein. These structures also appeared to be conserved across
different species. The presence of a hairpin structure in both Asupina and Cavendish psy2a
promoters suggested that this structure and putative function may be conserved in all banana
psy2a promoters. The impact of these secondary structures on psy expression is not currently
understood as it has not been previously investigated. Interestingly, the absence of these
DNA repeat sequences within 200 bp of the known psy1 transcription start sites, may suggest
that the psy1 promoter lacks a secondary structure feature required for fruit-specific
expression. The requirement for different transcription factors could explain the low activity
of the Asupina promoters in Cavendish tissue.
DNA regulatory elements, previously identified in the Arabidopsis psy promoter, were also
present in the Asupina and Cavendish psy1 and psy2a promoter regions. Previous work
demonstrated that the presence of the ATCTA motif determined the strength of psy promoter

125
activity in Arabidopsis, and that one such motif was sufficient to mediate gene expression
(Welsch et al., 2003). Consequently, the absence of the ATCTA sequence from Cpsy2apr2
and Cpsy2apr3 may explain the lack of transient expression in both embryogenic cells and
fruit tissue. Comparison of the Asupina and Cavendish psy2a promoters (Figure 5.15)
suggested that the absence of these motifs from Cpsy2apr2 and Cpsy2apr3 was due to
nucleotide substitutions at three positions. Segregation of the G1 and G2 motifs between the
psy1 and psy2a promoters of banana was consistent with the differential expression of these
mRNAs in leaf and fruit, respectively. These elements are thought to mediate light-induced
responses in Arabidopsis (Welsch et al., 2003), which have also been linked to phytochrome
A activity (von Lintig et al., 1997). Light has also been shown to influence lycopene
accumulation in tomato fruit without triggering ripening (Alba et al., 2000), suggesting that
fruit-specific phytochromes were able to control carotenoid accumulation independently of
ethylene. Consequently, the expression of phytochrome P450 during Cavendish fruit ripening
(Pua and Lee, 2003), may be indicative of a role for light in regulating banana fruit
carotenogenesis. The presence of both motifs in the Arabidopsis psy promoter is consistent
with the presence of only one psy gene, which must be regulated in multiple tissues.
However, other as yet unidentified DNA elements may also regulate psy promoter function.
The presence of psy1 and psy2a mRNA was detected in both leaf and fruit using semi-qRT-
PCR. The relative expression of these transcripts was consistent with the frequency of their
respective partial mRNA clones isolated from Asupina and Cavendish leaf and fruit tissue
(Chapter 3). The abundance of psy1 transcripts was highest in leaf followed by green fruit,
while psy2a was higher in green fruit than leaf. Conversely, RT-PCR analysis of psy
expression in maize and rice showed that psy1 expression was responsible for leaf
carotenogenesis and high endosperm carotenoid accumulation, while psy2 was
predominantly associated with photosynthetic activity in leaf (Gallagher et al., 2004).
Interestingly, maize PSY1 also appears to responsible for carotenogenesis in the dark and
heat stress tolerance in photosynthetic tissue (Li et al., 2008b). Leaf carotenogenesis required
Cpsy2apr2 TCGAACTTCTTACGCAAACCTAAATCAA 1433 Cpsy2apr3 TCGAACTTCTTACGCAAACCTAAATCAA 1433 Cpsy2apr1 TCGGACTACTTACACAAATCTAAATCAA 1408 Apsy2apr TCGAAATTTTTAC--------------- 1295 *** * * **** # Cpsy2apr2 TGCATATGAAAGACCAACACACCTACTC 1671 Cpsy2apr3 TGCATATGAAAGACCAACACACCTACTC 1671 Cpsy2apr1 TGCATCTGTAAGACCAACACACCTACTC 1539 Apsy2apr TGCATCTATAAAACCAACACATCTACTC 1540 *****#*# ** *********#******
Figure 5.15: Comparison of putative ATCTA motifs in psy2a promoters of Asupina and Cavendish (bold text) showing the sites of conserved nucleotides (*) and putative mutations in the ATCTA sequence (#).

126
both phytochrome-dependent and phytochrome-independent photoregulation of PSY2 and
non-photoregulated PSY1 expression. This supports the results seen in banana as both psy1
and psy2a were detected in leaf although psy1 transcript appears to be more abundant. This
could reflect the photoprotective role of PSY1 in photosynthesis in banana. Interestingly,
with the exception of psy2a in leaf, the relative abundance of psy1 and psy2a mRNA was
essentially identical in Asupina and Cavendish (Figure 5.13b). The variation in leaf psy2a
may be because the Cavendish leaf material used in the present study was sourced from
tissue culture, while Asupina leaf tissue was obtained from mature plants. The semi-qRT-
PCR analysis was repeated once to verify consistency. However, this variation may also be
due to the semi-quantitative nature of the RT-PCR assay used in this study, which is less
sensitive than real-time PCR. The expression of psy2a mRNA in Cavendish leaf and green
fruit, suggests that the Cpsy2apr1 may be sufficient to compensate for the lack of function of
Cpsy2apr2 and Cpsy2apr3. Given that Cavendish is triploid, these three promoter variants
could control the expression of three psy2a alleles at a single locus in a dominant fashion.
However, multiple psy2a loci may exist, in which case Cpsy2apr1 could represent the
functional locus, while Cpsy2apr2 and Cpsy2apr3 may represent inactive genes.
Fragments corresponding to the sizes expected for processed and unprocessed psy2a and
psy2b were amplified using primers designed to span intron 5, and may result from normal
or abnormal psy2 mRNA processing. This conclusion was supported by extensive
experiments that confirmed the absence of gDNA contamination in the mRNA samples
analysed. The level of unprocessed psy2a mRNA appeared higher than that of psy2b tissues
in both Asupina and Cavendish, adding further to the hypothesis that psy2a is the
predominant gene involved in fruit pVA accumulation. Mature transcripts of psy2 were
detected in both leaf and green fruit of Asupina and Cavendish but were not detected in ripe
fruit of either cultivar, consistent with previous data (Chapter 3). The Asupina psy2a and
psy2b unprocessed mRNA was present with processed psy2 transcripts in leaf and green
fruit, but were both absent from ripe fruit, suggesting that unprocessed transcripts were a
normal part of the regulation of these genes in fruit. Interestingly, although mature psy2
transcripts were not detected in Cavendish ripe fruit, unprocessed psy2a and psy2b mRNA
was still present. This may be due to the expression of abnormal unprocessed or partially
processed transcripts that are truncated at their 5’ ends. The isolation of truncated Cavendish
psy2 5’ RLM-RACE products from fruit mRNA (Figure 3.6b iii and 3.7) may support this
hypothesis. These mRNAs may be transcribed from an abnormal psy2a allele and may
accumulate in ripe fruit, possibly due to the absence of sequences associated with normal
degradation that may be located in the 5’ UTR. This may explain why semi-qRT-PCR using
psy2 3’ coding region primers was successful in Cavendish ripe fruit while psy2a 5’ UTR

127
primers produced no amplicons. However, other factors may be responsible for the presence
of these transcripts, including aberrations in mRNA degradation mechanisms such as NMD
(discussed in Chapter 3.4) in Cavendish compared to Asupina. Alternatively, the insertion of
the 3’ end of the coding region in the Cavendish psy2a 3’ UTR (Figure 3.6b v and 3.8a) may
somehow explain the accumulation of unprocessed psy2a mRNAs in Cavendish ripe fruit.
Intron processing may be another level of regulation of psy expression. Interestingly, intron 5
which was spanned by the psy2 3’ coding region primers used in semi-qRT-PCR was the
only one whose size was different between Apsy2a and Cpsy2a but not in psy2b (Chapter 3,
Figure 3.10). Therefore, this difference in intron size may be somehow related to the
nonsense Cavendish psy2a alternate splicing sequences obtained in Chapter 3 (Figure 3.11).
Consequently, the proportion of Cavendish psy2 transcripts able to produce active enzymes
may be low despite apparently high mRNA levels. Therefore, carotenoid production may
have to be supplemented by psy1 expression, which may cease early in fruit ripening. Intron
splicing is directed by cis-acting regulatory elements that reside in both introns and exons
(Zhang et al., 2005), and are recognised by RNA binding proteins that facilitate pre-mRNA
processing (Fu, 2004).
Alternate splicing is common in plants (Wang and Brendel, 2006; Reddy, 2007) and this
process was investigated in Arabidopsis and rice using bioinformatic analysis that included
approximately 34,000 and 61,000 full length transcripts from Arabidopsis and rice,
respectively (Campbell et al., 2006). A significant number of genes in Arabidopsis (~5,000
genes) and rice (~8,800 genes) were linked with alternate splicing, and approximately 16,000
and 37,000 alternate splicing events were observed in Arabidopsis and rice, respectively.
Interestingly, various classes of alternative splicing events were observed, including the
skipped exon and alternative donor site classes observed in Asupina psy1 and Cavendish
psy2a alternate splicing variants, respectively (Figure 3.11). There is evidence that alternate
splicing plays a significant role in normal plant gene expression. The activity of the FCA
protein involved in the regulation of Arabidopsis flower development is thought to be
negatively self-regulated through the production of prematurely polyadenylated transcripts
(Amasino, 2003). Alternative splicing has recently been linked to the function of the psy1
gene in wheat (Howitt et al., 2009). Sequence duplication at the 3’ end of exon 2 resulted in
the production of non-functional alternately spliced transcripts that were expected to reduce
wheat carotenoid content due to decreased levels of functional PSY1. Similarly, the
production of non-functional psy2a transcripts in Cavendish fruit could reduce the
abundance of functional transcripts, leading to low pVA content as low amounts of PSY2A
would be produced. The apparently non-functional coding region variants 1 and 2 of

128
Cavendish psy2a (Figure 3.11) are examples of alternative donor site and alternative position
modes of alternate splicing, respectively (Wang and Brendel, 2006). In contrast, the Asupina
psy1 coding region variant appears to be formed by exon skipping, which may result in the
absence of a functional domain that could affect cellular targeting or catalytic function.
Interestingly, the two introns in the banana psy1 5’ UTR (Figure 5.3) may contribute to the
variability of 5’ UTR length observed in Chapter 3 through alternate splicing, which may
regulate psy1 expression through mRNA stability and turnover.
The experiments described in this chapter investigated the hypothesis that the differential
pVA accumulation in Asupina and Cavendish fruit was due to factors affecting promoter
activity and mRNA abundance. Promoter analysis showed that the psy1 promoters, and at
least one psy2a promoter from both cultivars, were functional in banana fruit. Transcript
abundance of psy2a was highest in green fruit and decreased during ripening; reinforcing the
hypothesis (Chapter 3) that fruit pVA accumulation was largely due to psy2a expression.
However, psy2 transcript abundance was similar between Asupina and Cavendish fruit. In
contrast, high levels of psy2a and psy2b unprocessed mRNA were present in ripe fruit of
Cavendish but not in Asupina. Whether the abnormalities in promoter activity or mRNA
processing in Cavendish fruit play some role in psy2a expression remains to be determined.
129
Chapter 6: General discussion Bananas are an important staple food for millions of people in developing countries where
VAD is prevalent. The fruit of nutritionally important staple banana varieties is low in pVA
carotenoids, although numerous banana cultivars with high pVA content have been
identified. However, no studies have yet investigated the molecular mechanisms underlying
this variation in banana fruit pVA content. PSY appears to play an important role in
carotenoid metabolism and has been extensively characterised in a wide range of plants. This
study investigated the role of this enzyme in carotenoid biosynthesis in banana fruit, testing
the hypothesis that factors affecting PSY function and regulation were responsible for the
differences in pVA accumulation. Overall, the psy1 and psy2a mRNA and gDNA nucleotide
sequences appeared to be intact (Chapter 3) and capable of producing functional PSY, as
demonstrated in rice callus (Chapter 4). However, anomalies in psy2a transcript processing,
observed in Chapters 3 and 5, may somehow contribute to the low pVA levels in Cavendish
fruit. Another contributing factor may be abnormal Cavendish psy2a promoter activity
(Chapter 5), although the active Cavendish psy2a promoter variant may compensate for the
loss of function of the other sequences. However, the production of at least two types of non-
functional Cavendish psy2a transcripts may lead to the translation of less PSY2A than in
Asupina. The accumulation of unprocessed psy2a mRNA in the ripe fruit of Cavendish but
not Asupina, despite sharing the same psy1 and psy2a abundance profile in green and ripe
fruit, may also affect PSY2A protein levels.
Results from Chapters 3 and 5 supported the hypothesis that psy1 was mainly expressed in
leaf and psy2a in fruit, suggesting that PSY1 and PSY2A direct carotenoid biosynthesis in
chloroplasts and chromoplasts, respectively. Both psy1 and psy2a transcription was detected
in green fruit, suggesting that both PSY1 and PSY2A were active. However, psy2a mRNA
levels (based on semi-qRT-PCR) appeared higher than those of psy1 in green fruit and may
indicate that PSY2A is more active that PSY in early ripening stages. No processed psy2a
transcript was detected in semi-qRT-PCR of ripe fruit (Chapter 5), however, low levels of
full-length transcript must be present since complete coding region clones were isolated from
ripe fruit (Chapter 3). This may be due to differences in the maturity of ripe fruit tissue used
in Chapter 3 and Chapter 5. The absence of psy1 transcript in ripe fruit (Chapter 5) was
consistent with the lack of psy1 partial clones obtained from ripe fruit (Chapter 3). The
coordination of psy expression and enzyme function during banana fruit ripening may be
regulated during chromoplast development. This process may be similar to those involved in
light-induced transformation of etioplasts into chloroplasts during photomorphogenesis in
130
Arabidopsis (Welsch et al., 2000), or the development of chloroplasts into chromoplasts
during tomato fruit ripening (Kobayashi et al., 1990). The maturation of chromoplasts from
precursor plastids may be incomplete in banana green fruit prior to ethylene induction.
Recent analysis of psy gene expression in tomato demonstrated that psy1 was fruit-specific
while psy2 was expressed in a broader range of tissues (Giorio et al., 2008), suggesting that
these genes were equivalent to banana psy2a and psy1, respectively. During ripening, tomato
psy1 mRNA levels were higher in ripening fruit than in ripe fruit, and lowest in mature green
fruit. This was consistent with the patterns of banana psy2a expression (Chapter 5), where
ripening green fruit had higher psy mRNA levels than ripe fruit, suggesting that ripening
banana and tomato fruit share similar coordination of PSY activity and chromoplast
maturation. Therefore, psy2a expression may be low in very early stages of banana fruit
ripening and increase during ripening as chromoplasts mature, before decreasing in ripe fruit
once carotenoid accumulation is complete. Interestingly, tomato psy2 levels appeared to
increase during ripening although at much lower relative levels than psy1. This may be
indicative of differences in psy gene regulation in the ripening of banana and tomato fruit or
a reflection of the greater sensitivity of real-time RT-PCR (Giorio et al., 2008) compared to
semi-qRT-PCR (Chapter 5).
This apparent tissue specificity may be linked to light-regulated transcription due to the
presence of the putative light responsive G1 and G2 motifs in the psy promoters (Welsch et
al., 2003). This regulation may occur through psy1 promoter activity down-regulation and
psy2a promoter upregulation by transcription factors that bind the G1 and G2 motifs,
respectively. The relative activity of these promoters could be coordinated through the
ATCTA motif, which may regulate other genes as photosynthetic enzymes are replaced by
those involved in chromoplast function (Welsch et al., 2003). This is consistent with the
identification of light responsive properties of the tobacco pds promoter (Corona et al.,
1996), and the presence of the ATCTA motif in other pds promoters (Welsch et al., 2003).
On the basis of this proposed model, pVA production could be suppressed in Cavendish due
to the transcription of nonsense psy2a mRNAs (Chapter 3.3.6) incapable of producing a
functional protein, despite adequate promoter function. This would explain why mRNA
profiles are similar in both cultivars, but only Asupina has high pVA, as the proportion of
viable psy2a transcript could be significantly lower in Cavendish than Asupina due to
alternate splicing (discussed in Chapter 5). Additionally, although the Cavendish psy2a
coding region (Chapter 3) was cloned from ripe fruit, and semi-qRT-PCR (Chapter 5)
suggested that mature (processed) transcript is present in green fruit, no normal 5’ or 3’
RACE products were amplified from Cavendish fruit compared to Asupina.

131
Post-translational mechanisms may also be responsible for the levels of pVA accumulated in
Cavendish and Asupina fruit as light triggers the activation of PSY during chloroplast
maturation (Welsch et al., 2000). This regulation was apparently mediated by phytochromes
independently of mRNA accumulation (von Lintig et al., 1997). Fruit-specific phytochromes
are believed to regulate carotenogenesis in tomato independent of ethylene activity (Alba et
al., 2000), and a ripening related phytochrome has been identified in Cavendish (Pua and
Lee, 2003). Therefore, it is hypothesised that PSY1 and PSY2A activity during banana fruit
ripening may be regulated by phytochromes independently of mRNA accumulation.
Consequently, further work needs to be conducted to investigate the role of phytochrome
activity and other post-translational mechanisms in the regulation of banana psy gene
expression and enzyme activity in both high and low pVA bananas.
Further characterisation of PSY enzyme activity is also required to fill existing knowledge
gaps in the proposed model above. Bioinformatic analysis (Chapter 4) raised the possibility
that structural differences within the putative signal peptide may reduce CPSY2A activity
compared to APSY2A. Signal peptide cleavage appears to be necessary for optimal PSY
activity (Misawa et al., 1994; Schledz et al., 1996). This may be relevant to CPSY2A
activity, despite proving the functionality of this enzyme in rice callus, as reduced
carotenogenesis due to inefficient signal peptide cleavage may be masked by the effects of
constitutive over-expression. However, this effect could be measured directly by comparing
the activity of native and truncated forms of the Asupina and Cavendish PSY2A proteins.
This has been done previously using E. coli, which may be a more appropriate model than
rice callus because it appears incapable of PSY signal peptide cleavage (Misawa et al.,
1994). Biochemical characterisation of intrinsic PSY enzyme activity would provide further
insight into the possible effects of any differences in PSY1 and PSY2A catalytic properties
on pVA accumulation. The Apsy2a coding region has also been transformed into Cavendish
as part of the wider project at QUT, and field testing is currently underway. This experiment
would examine whether the expression of a psy gene from a high pVA banana variety is
sufficient to enhance pVA levels in Cavendish or whether other factors are involved. The
activity of Asupina and Cavendish PSYs during fruit development could also be studied
through biochemical analysis from tissue sampled during ripening. This has been done
previously in daffodil (Schledz et al., 1996) and has the benefit of observing protein function
in the native cellular environment. In addition, the use of antibodies raised against PSY
would complement enzyme activity analysis by enabling the study of PSY localisation,
signal peptide cleavage efficiency and protein interactions. Anti-PSY antibodies have been
used to in the characterisation of PSY properties in capsicum (Dogbo et al., 1988), tomato
(Misawa et al., 1994) and daffodil (Schledz et al., 1996).

132
Semi-quantitative RT-PCR analysis (Chapter 5) provided valuable data regarding psy1 and
psy2a expression in Asupina and Cavendish leaf and fruit. This method was selected because
of its simplicity and its use in previous analysis of psy expression in maize and rice
(Gallagher et al., 2004). However, real-time PCR would provide a more quantitative
approach for future work due to its increased sensitivity and it has proven successful in the
analysis of psy1 and psy2 expression in tobacco (Busch et al., 2002) and carrot (Clotault et
al., 2008). The semi-quantitative comparison in Chapter 5 was also limited by the inability to
ripen Cavendish green fruit and the incomplete ripening of Asupina fruit, making it
impossible to undertake full a comparison of mRNA levels during all major ripening stages.
In addition, semi-qRT-PCR analysis of psy1 and psy2a (Figure 5.14a ii and iii) was not able
to differentiate between mature mRNA and unprocessed mRNA as the primers were not
designed to span introns. This was due to limitations resulting from the high sequence
similarity between psy1 and psy2a that restricted where differentiating primers could be
designed. This could be addressed using Northern hybridisation, which may also observe
alternate splicing and mRNA stability. However, high levels of sequence similarity between
psy1, psy2a and psy2b would make the design of hybridisation probes difficult.
Consequently, future analysis of psy transcription during ripening of Asupina and Cavendish
fruit using real-time PCR should also include HPLC analysis of pVA levels at each stage to
determine at which point differences in carotenoid accumulation exist. This combination of
approaches was used previously in analysis of carotenoid production during carrot root
development (Clotault et al., 2008).
Further characterisation of the Asupina and Cavendish psy promoters would also be
valuable. The function of psy promoters was successfully demonstrated in banana
embryogenic cells and ungassed green fruit, and putative DNA regulatory sequences were
identified. However, the role of these motifs in promoter function could not be confirmed in
the available time. Bananas are climacteric fruit, whose ripening depends upon ethylene
production, which may somehow modulate psy1 and psy2a promoter activity. During tomato
fruit ripening, psy mRNA levels were shown to rise dramatically relative to immature fruit
(Giuliano et al., 1993; summarised in Figure 1.8a). Tomato ripening inhibitor (rin) mutants
with abnormal fruit ripening and poor carotenoid accumulation also had reduced psy mRNA
levels (Kitagawa et al., 2005). This phenotype was subsequently linked to a mutation in a
transcription factor that is up-regulated during ripening and controls the expression of
ethylene biosynthetic genes (Kitagawa et al., 2006; Ito et al., 2008). Similarly, differences in
ethylene sensitivity through mutations in the psy2a promoter region may be responsible for
either the apparent lack of Cpsy2apr2 and Cpsy2apr3 activity or the function of Apsy2apr
133
and Cpsy2apr1. However, there is no evidence thus far of differences in psy transcript
abundance between Asupina and Cavendish. Other phytohormones may also be involved in
psy promoter regulation such as salicylic acid, which has been shown to delay ripening in
banana (Srivastava and Dwivedi, 2000). ABA may also be involved is, as it is produced from
carotenoid precursors (Schwartz et al., 2003), and may regulate its own production. In
addition, ABA appears to play a role in ethylene regulation of banana fruit ripening (Jiang et
al., 2000). This suggests that other cis-acting elements that mediate psy promoter activity in
response to a number of environmental stimuli are likely to be involved in regulating psy
activity during fruit ripening. Consequently, Cpsy2apr2 and Cpsy2apr3 activity may be
triggered under other conditions.
Asupina and Cavendish psy promoter activity could be characterised in future studies using a
combination of bioinformatic and experimental analysis. Databases such as AGRIS
(Palaniswamy et al., 2006) and PLACE (Higo et al., 1999) contain a catalogue of cis-acting
regulatory elements that have been experimentally determined in plants. This would expedite
promoter characterisation as potential regulatory sequences in the psy promoters could be
identified before confirmation using methods such as electrophoretic mobility shift assays
and reporter gene assays, which have been used in the characterisation of psy promoter
activity in Arabidopsis (Welsch et al., 2003). Promoter activity (Chapter 5) was measured
semi-quantitively (GUS foci per cm2) since fluorimetric MUG assays were not feasible as
the mass of fruit samples for microprojectile bombardment could not be reliably
standardised. However, high variability between sample replicates highlighted the limitations
of the semi-quantitative approach. This could be addressed by using autofluorescent proteins,
such as GFP, which can be assayed non-destructively. In addition, microprojectile
bombardment of Asupina and Cavendish psy promoters into fruit sampled at different
ripening stages would be useful to examine differences in the regulation mechanisms. This
work should be repeated in Asupina fruit when available, and in stably transformed banana,
as transient assays are not always an accurate measure of tissue-specificity. Stable
transformation in banana would most likely be the most reliable and informative approach to
promoter analysis, however, the time required to generate and screen transgenic plants and
obtain mature fruit-bearing plants (~3 to 4 years) was outside the scope of the present study.
Interestingly, the presence of two introns in the banana psy1 5’ UTR may have significant
implications for the activity of this gene. Future work may examine the role of these introns
by expressing reporter genes using psy1 promoter constructs that have one intron and no
introns in leaf and fruit, comparing their activity against the native psy1 promoter that has
both introns. This would be similar to previous work on the tissue-specific effects of the rice
ubi3 promoter (Lu et al., 2008).

134
Further characterisation of the psy gene family is required. Currently, the genomic sequence
corresponding to the 3’ UTR and flanking sequences of the psy1 and psy2 genes have not
been isolated. This data could be important in determining whether differences in the
structure of the Asupina and Cavendish psy genes at the nucleotide level and may help to
explain the differences in fruit pVA content. The role of psy2b gene structure and promoter
activity could not be investigated in the present study as the 5’ promoter and 3’ flanking
sequences could not be isolated. These sequences could be obtained through further
optimisation of the genome walking PCR method used successfully in this study. In addition,
further 5’ and 3’ RACE analysis of the psy genes from these cultivars, particularly psy2a and
psy2b, will be important in order to confirm that clones obtained thus far are not artefacts.
For example, the insertion of part of the coding region in the 3’ UTR of the only Cavendish
psy2a 3’RACE clone obtained in this study needs further characterisation. This could be
attempted by modifying experimental conditions such as PCR amplification and using
mRNA from a broader range of tissues and developmental stages as only fruit was used in
the present study. The isolation of the known Asupina and Cavendish psy genes as single
fragments using primers to 5’ promoter and 3’ flanking sequences and copy number analysis
of these genes in both cultivars would also be valuable in determining whether all of the
Cavendish psy2a promoters are attached to structurally intact genes. These techniques could
also be used in future to confirm whether the psy2c and psyX partial sequences isolated from
Cavendish (Chapter 3) are additional psy gene family members. These were not investigated
in this study, as the focus of the study was isolation of genes to facilitate characterisation of
enzyme activity and gene expression and there was no time to extend this study.
PSY is an important enzyme in carotenoid biosynthesis, however, other factors may be
responsible for differences in Asupina and Cavendish fruit pVA accumulation. Downstream
genes in pVA carotenoid biosynthesis (pds, zds, lcyb, lcye and chyb) and catabolism (ccd1)
are known to influence carotenoid accumulation. The roles of these genes have been
reviewed previously in Chapter 1. Disruptions in the function of these genes may result in
either diminished carotenoid biosynthesis or excessive depletion of pVA in Cavendish (low
pVA) compared to Asupina (high pVA). The genes encoding IPI (Campbell et al., 1998) and
GGPS (Okada et al., 2000), which are responsible for GGPP production, have been
identified as gene families of two and five members in Arabidopsis, respectively. IPI1
(Campbell et al., 1998), GGPS1 and GGPS3 (Okada et al., 2000) were found to be localised
to plastids, and may influence carotenoid biosynthesis in banana by affecting the level of
GGPP available for phytoene biosynthesis. However, the critical nature of GGPP as a
substrate for multiple isoprenoid pathways (Cunningham and Gantt, 1998) and normal plant
growth suggests that these enzymes may not be responsible for differences in pVA
135
accumulation between Asupina and Cavendish. This hypothesis is supported by the
observation of dwarfism in transgenic tomato plants with PSY constitutively over-expressed.
This phenotype was thought to stem from excessive GGPP depletion (Fray et al., 1995). In
addition, at least one functional IPI enzyme was required in Arabidopsis because double IPI
mutants were not viable (Campbell et al., 1998).
Several enzymes downstream of PSY in the carotenoid biosynthetic pathway (reviewed in
Chapter 1.3.1) may be responsible for the differences in pVA content between Asupina and
Cavendish. The sequential activity of PDS and ZDS is required to convert phytoene to
lycopene (Figure 1.2b). Constitutive expression of Erwinia crtI, which performs the function
of both pds and zds (Misawa et al., 1990), in tomato increased β-carotene levels up to three
fold compared to wild type fruit (Romer et al., 2000). In addition, enhancement of pVA
levels in rice endosperm required the transformation of crtI as well as psy (Paine et al.,
2005). These examples illustrate the potential role of pds and zds expression on pVA content
in banana fruit, which would influence lycopene production. The enzymes directly
responsible for pVA biosynthesis are LCYB and LCYE, which convert lycopene into α- and
β-carotene (Figure 1.2c). Both cyclases appear to be encoded by related single genes
(Hugueney et al., 1996; Pecker et al., 1996), and are capable of heterodimerisation (Candau
et al., 1991). Over-expression of lcyb in tomato increased fruit β-carotene yield of 7-fold and
10-fold compared to wild type controls using chromoplast-specific Arabidopsis lcyb (Rosati
et al., 2000) and constitutive tomato lcyb (D'Ambrosio et al., 2004) expression, respectively,
compared to wild type fruit. Characterisation of these enzymes in Arabidopsis showed that
LCYE was only able to add one ε-ionone ring to lycopene, while LCYB activity added β-
ionone rings to both ends of the substrate (Cunningham et al., 1996). Consequently, lcyb
would be an important gene to characterise in banana given its pivotal role in pVA
production, coupled with its ability to significantly increase β-carotene content in transgenic
plants. CHYB converts β-carotene to zeaxanthin (Figure 1.2) by addition of hydroxyl groups
to both β-ionone rings (Cunningham and Gantt, 1998) and is encoded by two related genes,
chyb1 and chyb2, which have been identified in Arabidopsis (Tian and Della Penna, 2001).
Silencing of CHYB expression in potato tubers increased β-carotene up to 38 fold compared
to the wild type control (Diretto et al., 2007). Therefore, the increased fruit pVA content of
Asupina compared to Cavendish may be due to mechanisms involved in suppressing CHYB
activity. The down-regulation of carotenoid degradation in Asupina fruit or its upregulation
in Cavendish fruit may also explain the respective pVA levels of these cultivars. The ccd
gene family encodes enzymes involved in carotenoid cleavage to produce other secondary
metabolites (Chapter 1.3.2) and may have specific functions in different organelles. CCD1

136
may regulate pVA accumulation as it is known to cleave β-carotene (Schwartz et al., 2001)
and its precursor compounds, including phytoene and lycopene (Simkin et al., 2004). Maize
mutants with the dominant white cap 1 phenotype exhibited increased carotenoid
degradation due to the presence of 20 copies of ccd1 at the mutant locus (Tan et al., 2004),
driving 40 fold higher levels of expression compared to wild type maize. This suggests that
the activity of CCD1 may be an important regulator of banana pVA accumulation in light of
its ability to cleave both pVA carotenoids and their precursors. Regulatory genes such as the
Or gene may also influence pVA accumulation (reviewed in Chapter 1.3.3). This gene which
was characterised in cauliflower and encodes a protein involved in chromoplast development
(Lu et al., 2006), and which has been demonstrated to improve carotenogenesis in potato
tubers (Lopez et al., 2008a).
Consequently, the roles of these genes could be investigated in Asupina and Cavendish using
approaches adopted in this study to investigate the role of PSY. Quantitative analysis of
mRNA levels during multiple stages of fruit development would be a potential starting point,
and the lcyb, pds, zds and ccd1 genes also appear to occupy key positions in carotenoid
metabolism. The inclusion of other banana varieties with both high and low fruit pVA
content in subsequent work may also prove crucial to research into the biofortification of
bananas for increased fruit pVA content. This is because the pVA content of other cultivars
may not be due to differences in the same components of carotenoid metabolism. Ultimately,
availability of the complete banana genome would greatly accelerate this research by
expediting the identification and characterisation of these genes through comparative
genomics with fully sequenced genomes such as those of maize and rice.
In conclusion, psy exists as a multigene family in banana consisting of at least three
members (psy1, psy2a and psy2b) in both high and low pVA cultivars. Comparison of the
molecular characteristics of psy in Asupina (high pVA) and Cavendish (low pVA)
demonstrated that the PSY1 and PSY2A proteins from both cultivars are functional.
However, these results suggested that psy1 and psy2a were predominant in leaf and fruit
respectively, and that alternate splicing of psy2a in Cavendish during fruit ripening may
reduce the levels of active PSY, ultimately resulting in fruit with lower pVA content. The
present study forms a basis for further investigation into the regulation of PSY activity in
high and low pVA banana cultivars and may also prove valuable in informing research
aimed at increasing the pVA content of nutritionally important banana cultivars using
genetic modification. This is the goal of the wider project at QUT sponsored by the Bill and
Melinda Gates foundation to improve the pVA potential of the East African Highland
Banana.

137
References: ABLER, M. L. & GREEN, P. J. (1996) Control of mRNA stability in higher plants. Plant
Mol Biol, 32, 63-78. AERT, R., SAGI, L. & VOLCKAERT, G. (2004) Gene content and density in banana (Musa
acuminata) as revealed by genomic sequencing of BAC clones. Theor Appl Genet, 109, 129-39.
AGUAYO, V. M., KAHN, S., ISMAEL, C. & MEERSHOEK, S. (2005) Vitamin A deficiency and child mortality in Mozambique. Public Health Nutr, 8, 29-31.
ALBA, R., CORDONNIER-PRATT, M. M. & PRATT, L. H. (2000) Fruit-localized phytochromes regulate lycopene accumulation independently of ethylene production in tomato. Plant Physiol, 123, 363-70.
AMASINO, R. M. (2003) Flowering time: a pathway that begins at the 3' end. Curr Biol, 13, R670-2.
AMAYA, D. R. (2001) Food carotenoids: analysis, composition and alterations during stoarage and processing of foods. IN ELMADFA, I., ANKLAM, E. & KÖNIG, J. (Eds.) Modern aspect of nutrition: present knowledge and future perspectives. Karger.
AMMAR-KHODJA, P. (2000) Bananas, International Network for the Improvement of Banana and Plantain (INIBAP).
ARMSTRONG, G. A. & HEARST, J. E. (1996) Carotenoids 2: genetics and molecular biology of carotenoid pigment biosynthesis. FASEB J, 10, 228-37.
ARNOLD, K., BORDOLI, L., KOPP, J. & SCHWEDE, T. (2006) The SWISS-MODEL workspace: a web-based environment for protein structure homology modelling. Bioinformatics, 22, 195-201.
ASIF, M. H., DHAWAN, P. & NATH, P. (2000) A simple procedure for the isolation of high quality RNA from ripening banana fruit. Plant Mol Biol Rep, 18, 109-15.
ATKINSON, H. J., GRIMWOOD, S., JOHNSTON, K. & GREEN, J. (2004) Prototype demonstration of transgenic resistance to the nematode Radopholus similis conferred on banana by a cystatin. Transgenic Res, 13, 135-42.
BARTLEY, G. E. & SCOLNIK, P. A. (1993) cDNA cloning, expression during development, and genome mapping of PSY2, a second tomato gene encoding phytoene synthase. J Biol Chem, 268, 25718-21.
BARTLEY, G. E., VIITANEN, P. V., BACOT, K. O. & SCOLNIK, P. A. (1992) A tomato gene expressed during fruit ripening encodes an enzyme of the carotenoid biosynthesis pathway. J Biol Chem, 267, 5036-9.
BARTOS, J., ALKHIMOVA, O., DOLEZELOVA, M., DE LANGHE, E. & DOLEZEL, J. (2005) Nuclear genome size and genomic distribution of ribosomal DNA in Musa and Ensete (Musaceae): taxonomic implications. Cytogenet Genome Res, 109, 50-7.
BATE, N., SPURR, C., FOSTER, G. D. & TWELL, D. (1996) Maturation-specific translational enhancement mediated by the 5'UTR of a late pollen transcript. Plant J, 10, 613-23.
BECKER, D. K. & DALE, J. L. (2004) Transformation of banana using microprojectile bombardment. IN CURTIS, I. S. (Ed.) Transgenic Crops of the World; Essential Protocols. Kluwer Academic Publishers.
BENDER, D. A. (2003) Nutritional biochemistry of the vitamins, 2nd edition, Cambridge University Press.
BENNETZEN, J. L. (2007) Patterns in grass genome evolution. Curr Opin Plant Biol, 10, 176-81.
BONEN, L. (1993) Trans-splicing of pre-mRNA in plants, animals, and protists. FASEB J, 7, 40-6.
BONK, M., HOFFMANN, B., VON LINTIG, J., SCHLEDZ, M., AL-BABILI, S., HOBEIKA, E., KLEINIG, H. & BEYER, P. (1997) Chloroplast import of four

138
carotenoid biosynthetic enzymes in vitro reveals differential fates prior to membrane binding and oligomeric assembly. Eur J Biochem, 247, 942-50.
BORRMANN, L., SEEBECK, B., ROGALLA, P. & BULLERDIEK, J. (2003) Human HMGA2 promoter is coregulated by a polymorphic dinucleotide (TC)-repeat. Oncogene, 22, 756-60.
BOUVIER, F., SUIRE, C., MUTTERER, J. & CAMARA, B. (2003) Oxidative remodeling of chromoplast carotenoids: identification of the carotenoid dioxygenase CsCCD and CsZCD genes involved in Crocus secondary metabolite biogenesis. Plant Cell, 15, 47-62.
BUSCH, M., SEUTER, A. & HAIN, R. (2002) Functional analysis of the early steps of carotenoid biosynthesis in tobacco. Plant Physiol, 128, 439-53.
CAMBIA (2009a) pCambia vectors. [Online] 2009. Available: http://www.cambia.org/daisy/cambia/585.html Accessed: 19 April 2009.
CAMBIA (2009b) Transformation protocol for rice. [Online]. Available: http://www.cambia.org/daisy/bioforge_transbacter/4214/version/default/part/AttachmentData/data/Transformation%20protocol%20for%20Rice-1.pdf Accessed: 18 March 2009.
CAMPBELL, M., HAHN, F. M., POULTER, C. D. & LEUSTEK, T. (1998) Analysis of the isopentenyl diphosphate isomerase gene family from Arabidopsis thaliana. Plant Mol Biol, 36, 323-8.
CAMPBELL, M. A., HAAS, B. J., HAMILTON, J. P., MOUNT, S. M. & BUELL, C. R. (2006) Comprehensive analysis of alternative splicing in rice and comparative analyses with Arabidopsis. BMC Genomics, 7, 327.
CANDAU, R., BEJARANO, E. & CERDA-OLMEDO, E. (1991) In vivo channeling of substrates in an enzyme aggregate for beta-carotene biosynthesis. Proc Natl Acad Sci U S A, 88, 4936-40.
CENCI, A., SOMMA, S., CHANTRET, N., DUBCOVSKY, J. & BLANCO, A. (2004) PCR identification of durum wheat BAC clones containing genes coding for carotenoid biosynthesis enzymes and their chromosome localization. Genome, 47, 911-7.
CHAKRABARTI, A., GANAPATHI, T. R., MUKHERJEE, P. K. & BAPAT, V. A. (2003) MSI-99, a magainin analogue, imparts enhanced disease resistance in transgenic tobacco and banana. Planta, 216, 587-96.
CHANDER, S., GUO, Y. Q., YANG, X. H., ZHANG, J., LU, X. Q., YAN, J. B., SONG, T. M., ROCHEFORD, T. R. & LI, J. S. (2008) Using molecular markers to identify two major loci controlling carotenoid contents in maize grain. Theor Appl Genet, 116, 223-33.
CHANG, S., PURYEAR, J. & CAIRNEY, J. (1993) A simple and efficient method for isolating RNA from pine trees. Plant Mol Biol Rep, 11, 113-6.
CHEN, H., NAMKUNG, M. J. & JUCHAU, M. R. (1995) Biotransformation of all-trans-retinol and all-trans-retinal to all-trans-retinoic acid in rat conceptal homogenates. Biochem Pharmacol, 50, 1257-64.
CHEW, B. P. (1993) Role of carotenoids in the immune response. J Dairy Sci, 76, 2804-11. CHEW, B. P. & PARK, J. S. (2004) Carotenoid action on the immune response. J Nutr, 134,
257S-61S. CHRISTENSEN, A. H., SHARROCK, R. A. & QUAIL, P. H. (1992) Maize polyubiquitin
genes: structure, thermal perturbation of expression and transcript splicing, and promoter activity following transfer to protoplasts by electroporation. Plant Mol Biol, 18, 675-89.
CHUNG, B. Y., SIMONS, C., FIRTH, A. E., BROWN, C. M. & HELLENS, R. P. (2006) Effect of 5'UTR introns on gene expression in Arabidopsis thaliana. BMC Genomics, 7, 120.
CLOTAULT, J., PELTIER, D., BERRUYER, R., THOMAS, M., BRIARD, M. & GEOFFRIAU, E. (2008) Expression of carotenoid biosynthesis genes during carrot root development. J Exp Bot, 59, 3563-73.

139
CORONA, V., ARACRI, B., KOSTURKOVA, G., BARTLEY, G. E., PITTO, L., GIORGETTI, L., SCOLNIK, P. A. & GIULIANO, G. (1996) Regulation of a carotenoid biosynthesis gene promoter during plant development. Plant J, 9, 505-12.
CUNNINGHAM, F. X., JR., POGSON, B., SUN, Z., MCDONALD, K. A., DELLAPENNA, D. & GANTT, E. (1996) Functional analysis of the beta and epsilon lycopene cyclase enzymes of Arabidopsis reveals a mechanism for control of cyclic carotenoid formation. Plant Cell, 8, 1613-26.
CUNNINGHAM, F. X. J. & GANTT, E. (1998) Genes and enzymes of carotenoid biosynthesis in plants. Annu Rev Plant Physiol Plant Mol Biol, 49, 557-83.
CUTLER, A. J. & KROCHKO, J. E. (1999) Formation and breakdown of ABA. Trends Plant Sci, 4, 472-78.
D'AMBROSIO, C., GIORIO, G., MARINO, I., MERENDINO, A., PETROZZA, A., SALFI, L., STIGLIANI, A. L. & CELLINI, F. (2004) Virtually complete conversion of lycopene into beta-carotene in fruits of tomato plants transformed with the tomato lycopene beta-cyclase (tlcy-b) cDNA. Plant Sci, 166, 207-14.
DANIELLS, J., JENNY, C., KARAMURA, D. & TOMEKPE, K. (2001) Diversity in the genus Musa, International Network for the Improvement of Banana and Plantain.
DE CASTRO, E., SIGRIST, C. J., GATTIKER, A., BULLIARD, V., LANGENDIJK-GENEVAUX, P. S., GASTEIGER, E., BAIROCH, A. & HULO, N. (2006) ScanProsite: detection of PROSITE signature matches and ProRule-associated functional and structural residues in proteins. Nucleic Acids Res, 34, W362-5.
DEAN, C., TAMAKI, S., DUNSMUIR, P., FAVREAU, M., KATAYAMA, C., DOONER, H. & BEDBROOK, J. (1986) mRNA transcripts of several plant genes are polyadenylated at multiple sites in vivo. Nucleic Acids Res, 14, 2229-40.
DIEHN, S. H., CHIU, W. L., DE ROCHER, E. J. & GREEN, P. J. (1998) Premature polyadenylation at multiple sites within a Bacillus thuringiensis toxin gene-coding region. Plant Physiol, 117, 1433-43.
DIRETTO, G., WELSCH, R., TAVAZZA, R., MOURGUES, F., PIZZICHINI, D., BEYER, P. & GIULIANO, G. (2007) Silencing of beta-carotene hydroxylase increases total carotenoid and beta-carotene levels in potato tubers. BMC Plant Biol, 7, 11.
DOGBO, O., LAFERRIERE, A., D'HARLINGUE, A. & CAMARA, B. (1988) Carotenoid biosynthesis: isolation and characterization of a bifunctional enzyme catalyzing the synthesis of phytoene. Proc Natl Acad Sci U S A, 85, 7054-8.
DOWER, W. J., MILLER, J. F. & RAGSDALE, C. W. (1988) High efficiency transformation of E. coli by high voltage electroporation. Nucleic Acids Res, 16, 6127-45.
ENGLBERGER, L. (2003) Carotenoid-rich bananas in Micronesia. Infomusa, 12, 2-5. ENGLBERGER, L., AALBERSBERG, W., RAVI, P., BONNIN, E., MARKS, G. C.,
FITZGERALD, M. H. & ELYMORE, J. (2003a) Further analyses on Micronesian banana, taro, breadfruit and other foods for provitamin A carotenoids and minerals. J Food Compost Anal, 16, 219-36.
ENGLBERGER, L., DARNTON-HILL, I., COYNE, T., FITZGERALD, M. H. & MARKS, G. C. (2003b) Carotenoid-rich bananas: a potential food source for alleviating vitamin A deficiency. Food Nutr Bull, 24, 303-18.
ENGLBERGER, L., SCHIERLE, J., MARKS, G. C. & FITZGERALD, M. H. (2003c) Micronesian banana, taro, and other foods: newly recognized sources of provitamin A and other carotenoids. J Food Compost Anal, 16, 3-19.
ENGLBERGER, L., WILLS, R. B., BLADES, B., DUFFICY, L., DANIELLS, J. W. & COYNE, T. (2006) Carotenoid content and flesh color of selected banana cultivars growing in Australia. Food Nutr Bull, 27, 281-91.
EYRICH, V. A., MARTI-RENOM, M. A., PRZYBYLSKI, D., MADHUSUDHAN, M. S., FISER, A., PAZOS, F., VALENCIA, A., SALI, A. & ROST, B. (2001) EVA: continuous automatic evaluation of protein structure prediction servers. Bioinformatics, 17, 1242-3.
140
FILTEAU, S. M. & TOMKINS, A. M. (1999) Promoting vitamin A status in low-income countries. Lancet, 353, 1458-9.
FRASER, P. D., ROMER, S., SHIPTON, C. A., MILLS, P. B., KIANO, J. W., MISAWA, N., DRAKE, R. G., SCHUCH, W. & BRAMLEY, P. M. (2002) Evaluation of transgenic tomato plants expressing an additional phytoene synthase in a fruit-specific manner. Proc Natl Acad Sci U S A, 99, 1092-7.
FRASER, P. D., SCHUCH, W. & BRAMLEY, P. M. (2000) Phytoene synthase from tomato (Lycopersicon esculentum) chloroplasts - partial purification and biochemical properties. Planta, 211, 361-9.
FRASER, P. D., TRUESDALE, M. R., BIRD, C. R., SCHUCH, W. & BRAMLEY, P. M. (1994) Carotenoid biosynthesis during tomato fruit development (evidence for tissue-specific gene expression). Plant Physiol, 105, 405-13.
FRAY, R. G., WALLACE, A., FRASER, P. D., VALERO, D., HEDDEN, P., BRAMLEY, P. M. & GRIERSON, D. (1995) Constitutive expression of a fruit phytoene synthase gene in transgenic tomatoes causes dwarfism by redirecting metabolites from the gibberellin pathway. Plant J, 8, 693-701.
FU, X. D. (2004) Towards a splicing code. Cell, 119, 736-8. GALLAGHER, C. E., MATTHEWS, P. D., LI, F. & WURTZEL, E. T. (2004) Gene
duplication in the carotenoid biosynthetic pathway preceded evolution of the grasses. Plant Physiol, 135, 1776-83.
GARBARINO, J. E., OOSUMI, T. & BELKNAP, W. R. (1995) Isolation of a polyubiquitin promoter and its expression in transgenic potato plants. Plant Physiol, 109, 1371-8.
GARCIA-GIL, M. R. (2008) Evolutionary aspects of functional and pseudogene members of the phytochrome gene family in Scots pine. J Mol Evol, 67, 222-32.
GIORIO, G., STIGLIANI, A. L. & D'AMBROSIO, C. (2008) Phytoene synthase genes in tomato (Solanum lycopersicum L.) - new data on the structures, the deduced amino acid sequences and the expression patterns. FEBS J, 275, 527-35.
GIOVANNONI, J. J. (2004) Genetic regulation of fruit development and ripening. Plant Cell, 16, S170-80.
GIULIANO, G., BARTLEY, G. E. & SCOLNIK, P. A. (1993) Regulation of carotenoid biosynthesis during tomato development. Plant Cell, 5, 379-87.
GLEGHORN, M. L., DAVYDOVA, E. K., ROTHMAN-DENES, L. B. & MURAKAMI, K. S. (2008) Structural basis for DNA-hairpin promoter recognition by the bacteriophage N4 virion RNA polymerase. Mol Cell, 32, 707-17.
GOODING, P. S., BIRD, C. & ROBINSON, S. P. (2001) Molecular cloning and characterisation of banana fruit polyphenol oxidase. Planta, 213, 748-57.
GOWEN, S. R. (1995) Bananas and plantains, Chapman & Hall. GRUSAK, M. A. (2005) Golden rice gets a boost from maize. Nat Biotechnol, 23, 429-30. HALLIWELL, B. (1997) Introduction: free radicals and human disease - trick or treat? IN
THOMAS, C. E. & KALYANARAMAN, B. (Eds.) Oxygen radicals and the disease process. Harwood Academic.
HARADA, H., MIKI, R., MASUSHIGE, S. & KATO, S. (1995) Gene expression of retinoic acid receptors, retinoid-X receptors, and cellular retinol-binding protein I in bone and its regulation by vitamin A. Endocrinology, 136, 5329-5335.
HE, X. Y., HE, Z. H., MA, W., APPELS, R. & XIA, X. C. (2009) Allelic variants of phytoene synthase 1 (Psy1) genes in Chinese and CIMMYT wheat cultivars and development of functional markers for flour colour Mol Breed.
HE, X. Y., ZHANG, Y. L., HE, Z. H., WU, Y. P., XIAO, Y. G., MA, C. X. & XIA, X. C. (2008) Characterization of phytoene synthase 1 gene (Psy1) located on common wheat chromosome 7A and development of a functional marker. Theor Appl Genet, 116, 213-21.
HERMANN, S. R., HARDING, R. M. & DALE, J. L. (2001) The banana actin 1 promoter drives near-constitutive transgene expression in vegetative tissues of banana. Plant Cell Rep, 20, 525-30.

141
HESLOP-HARRISON, J. S. & SCHWARZACHER, T. (2007) Domestication, genomics and the future for banana. Ann Bot, 100, 1073-84.
HIEI, Y., OHTA, S., KOMARI, T. & KUMASHIRO, T. (1994) Efficient transformation of rice (Oryza sativa L.) mediated by Agrobacterium and sequence analysis of the boundaries of the T-DNA. Plant J, 6, 271-82.
HIGO, K., UGAWA, Y., IWAMOTO, M. & KORENAGA, T. (1999) Plant cis-acting regulatory DNA elements (PLACE) database: 1999. Nucleic Acids Res, 27, 297-300.
HIRSCHBERG, J. (2001) Carotenoid biosynthesis in flowering plants. Curr Opin Plant Biol, 4, 210-8.
HOA, T. T., AL-BABILI, S., SCHAUB, P., POTRYKUS, I. & BEYER, P. (2003) Golden Indica and Japonica rice lines amenable to deregulation. Plant Physiol, 133, 161-9.
HOLDEN, J. M., ELDRIDGE, A. L., BEECHER, G. R., MARILYN BUZZARD, I., BHAGWAT, S., DAVIS, C. S., DOUGLASS, L. W., GEBHARDT, S., HAYTOWITZ, D. & SCHAKEL, S. (1999) Carotenoid content of U.S. Foods: an update of the database. J Food Compost Anal, 12, 169-96.
HORIUCHI, T. & AIGAKI, T. (2006) Alternative trans-splicing: a novel mode of pre-mRNA processing. 98, 135-40.
HOWITT, C. A., CAVANAGH, C. R., BOWERMAN, A. F., CAZZONELLI, C., RAMPLING, L., MIMICA, J. L. & POGSON, B. J. (2009) Alternative splicing, activation of cryptic exons and amino acid substitutions in carotenoid biosynthetic genes are associated with lutein accumulation in wheat endosperm. Funct Integr Genomics, 9, 363-76.
HUANG, P. L., DO, Y. Y., HUANG, F. C., THAY, T. S. & CHANG, T. W. (1997) Characterization and expression analysis of a banana gene encoding 1-aminocyclopropane-1-carboxylate oxidase. Biochem Mol Biol Int, 41, 941-50.
HUGUENEY, P., BOUVIER, F., BADILLO, A., QUENNEMET, J., D'HARLINGUE, A. & CAMARA, B. (1996) Developmental and stress regulation of gene expression for plastid and cytosolic isoprenoid pathways in pepper fruits. Plant Physiol, 111, 619-26.
HULO, N., BAIROCH, A., BULLIARD, V., CERUTTI, L., CUCHE, B. A., DE CASTRO, E., LACHAIZE, C., LANGENDIJK-GENEVAUX, P. S. & SIGRIST, C. J. (2008) The 20 years of PROSITE. Nucleic Acids Res, 36, D245-9.
IBDAH, M., AZULAY, Y., PORTNOY, V., WASSERMAN, B., BAR, E., MEIR, A., BURGER, Y., HIRSCHBERG, J., SCHAFFER, A. A., KATZIR, N., TADMOR, Y. & LEWINSOHN, E. (2006) Functional characterization of CmCCD1, a carotenoid cleavage dioxygenase from melon. Phytochemistry, 67, 1579-89.
ITO, Y., KITAGAWA, M., IHASHI, N., YABE, K., KIMBARA, J., YASUDA, J., ITO, H., INAKUMA, T., HIROI, S. & KASUMI, T. (2008) DNA-binding specificity, transcriptional activation potential, and the rin mutation effect for the tomato fruit-ripening regulator RIN. Plant J, 55, 212-23.
IWATA-REUYL, D., MATH, S. K., DESAI, S. B. & POULTER, C. D. (2003) Bacterial phytoene synthase: molecular cloning, expression, and characterization of Erwinia herbicola phytoene synthase. Biochemistry, 42, 3359-65.
JEFFERSON, R. A., KAVANAGH, T. A. & BEVAN, M. W. (1987) GUS fusions: beta-glucuronidase as a sensitive and versatile gene fusion marker in higher plants. EMBO J, 6, 3901-7.
JIANG, Y., JOYCE, D. C. & MACNISH, A. J. (2000) Effect of abscisic acid on banana fruit ripening in relation to the role of ethylene. J Plant Growth Regul, 19, 106-11.
KALEIKAU, E. K., ANDRE, C. P. & WALBOT, V. (1992) Structure and expression of the rice mitochondrial apocytochrome b gene (cob-1) and pseudogene (cob-2). Curr Genet, 22, 463-70.
KAMATE, K., BROWN, S., DURAND, P., BUREAU, J. M., DE NAY, D. & TRINH, T. H. (2001) Nuclear DNA content and base composition in 28 taxa of Musa. Genome, 44, 622-7.

142
KAPLAN, W. & LITTLEJOHN, T. G. (2001) Swiss-PDB viewer (deep view). Brief Bioinform, 2, 195-7.
KATO, M., IKOMA, Y., MATSUMOTO, H., SUGIURA, M., HYODO, H. & YANO, M. (2004) Accumulation of carotenoids and expression of carotenoid biosynthetic genes during maturation in citrus fruit. Plant Physiol, 134, 824-37.
KELLEY, L. A. & STERNBERG, M. J. (2009) Protein structure prediction on the web: a case study using the Phyre server. Nat Protoc, 4, 363-71.
KERTÉSZ, S., KERÉNY, Z., MÉRAI, Z., BARTOS, I., PÁLFY, T., BARTA, E. & SILHAVY, D. (2006) Both introns and long 3'-UTRs operate as cis-acting elements to trigger nonsense-mediated decay in plants. Nucleic Acids Res, 34, 6147-57.
KHANNA, H., BECKER, D., KLEIDON, J. & DALE, J. L. (2004) Centrifugation Assisted Agrobacterium tumefaciens-mediated transformation (CAAT) of embryogenic cell suspensions of banana (Musa spp. Cavendish AAA and Lady finger AAB). Mol Breed, 14, 239-52.
KITAGAWA, M., ITO, H., SHIINA, T., NAKAMURA, N., INAKUMA, T., KASUMI, T., ISHIGURO, Y., YABE, K. & ITO, Y. (2005) Characterization of tomato fruit ripening and analysis of gene expression in F1 hybrids of the ripening inhibitor (rin) mutant. Physiol Plant, 123, 331-8.
KITAGAWA, M., NAKAMURA, N., USUDA, H., SHIINA, T., ITO, H., YASUDA, J., INAKUMA, T., ISHIGURO, Y., KASUMI, T. & ITO, Y. (2006) Ethylene biosynthesis regulation in tomato fruit from the F1 hybrid of the ripening inhibitor (rin) mutant. Biosci Biotechnol Biochem, 70, 1769-72.
KOBAYASHI, H., NGERNPRASIRTSIRI, J. & AKAZAWA, T. (1990) Transcriptional regulation and DNA methylation in plastids during transitional conversion of chloroplasts to chromoplasts. EMBO J, 9, 307-13.
LANGI, P., SEMBA, R. D., MUGERWA, R. D. & WHALEN, C. C. (2003) Vitamin A deficiency and increased mortality among human immunodeficiency virus-infected adults in Uganda. Nutr Res, 23, 595-605.
LARKIN, M. A., BLACKSHIELDS, G., BROWN, N. P., CHENNA, R., MCGETTIGAN, P. A., MCWILLIAM, H., VALENTIN, F., WALLACE, I. M., WILM, A., LOPEZ, R., THOMPSON, J. D., GIBSON, T. J. & HIGGINS, D. G. (2007) Clustal W and Clustal X version 2.0. Bioinformatics, 23, 2947-8.
LESCOT, M., PIFFANELLI, P., CIAMPI, A. Y., RUIZ, M., BLANC, G., LEEBENS-MACK, J., DA SILVA, F. R., SANTOS, C. M., D'HONT, A., GARSMEUR, O., VILARINHOS, A. D., KANAMORI, H., MATSUMOTO, T., RONNING, C. M., CHEUNG, F., HAAS, B. J., ALTHOFF, R., ARBOGAST, T., HINE, E., PAPPAS, G. J., JR., SASAKI, T., SOUZA, M. T., JR., MILLER, R. N., GLASZMANN, J. C. & TOWN, C. D. (2008) Insights into the Musa genome: syntenic relationships to rice and between Musa species. BMC Genomics, 9, 58.
LI, F., VALLABHANENI, R. & WURTZEL, E. T. (2008a) PSY3, a new member of the phytoene synthase gene family conserved in the Poaceae and regulator of abiotic stress-induced root carotenogenesis. Plant Physiol, 146, 1333-45.
LI, F., VALLABHANENI, R., YU, J., ROCHEFORD, T. & WURTZEL, E. T. (2008b) The maize phytoene synthase gene family: overlapping roles for carotenogenesis in endosperm, photomorphogenesis, and thermal stress tolerance. Plant Physiol, 147, 1334-46.
LI, L. & GARVIN, D. F. (2003) Molecular mapping of Or, a gene inducing beta-carotene accumulation in cauliflower (Brassica oleracea L. var. botrytis). Genome, 46, 588-94.
LI, L., LU, S., O'HALLORAN, D. M., GARVIN, D. F. & VREBALOV, J. (2003) High-resolution genetic and physical mapping of the cauliflower high-beta-carotene gene Or ( Orange). Mol Genet Genomics, 270, 132-8.
LI, L., PAOLILLO, D. J., PARTHASARATHY, M. V., DIMUZIO, E. M. & GARVIN, D. F. (2001) A novel gene mutation that confers abnormal patterns of beta-carotene accumulation in cauliflower (Brassica oleracea var. botrytis). Plant J, 26, 59-67.

143
LIANG, P. H., KO, T. P. & WANG, A. H. (2002) Structure, mechanism and function of prenyltransferases. Eur J Biochem, 269, 3339-54.
LIU, X., SHIOMI, S., NAKATSUKA, A., KUBO, Y., NAKAMURA, R. & INABA, A. (1999) Characterization of ethylene biosynthesis associated with ripening in banana fruit. Plant Physiol, 121, 1257-66.
LOKE, J. C., STAHLBERG, E. A., STRENSKI, D. G., HAAS, B. J., WOOD, P. C. & LI, Q. Q. (2005) Compilation of mRNA polyadenylation signals in Arabidopsis revealed a new signal element and potential secondary structures. Plant Physiol, 138, 1457-68.
LOPEZ, A. B., VAN ECK, J., CONLIN, B. J., PAOLILLO, D. J., O'NEILL, J. & LI, L. (2008a) Effect of the cauliflower Or transgene on carotenoid accumulation and chromoplast formation in transgenic potato tubers. J Exp Bot, 59, 213-23.
LOPEZ, A. B., YANG, Y., THANNHAUSER, T. W. & LI, L. (2008b) Phytoene desaturase is present in a large protein complex in the plastid membrane. Physiol Plant, 133, 190-8.
LU, C., ZAINAL, Z., TUCKER, G. A. & LYCETT, G. W. (2001) Developmental abnormalities and reducedfruit softening in tomato plants expressing an antisense Rab11 GTPase gene. Plant Cell, 13, 1819-33.
LU, J., SIVAMANI, E., AZHAKANANDAM, K., SAMADDER, P., LI, X. & QU, R. (2008) Gene expression enhancement mediated by the 5' UTR intron of the rice rubi3 gene varied remarkably among tissues in transgenic rice plants. Mol Genet Genomics, 279, 563-72.
LU, S., VAN ECK, J., ZHOU, X., LOPEZ, A. B., O'HALLORAN, D. M., COSMAN, K. M., CONLIN, B. J., PAOLILLO, D. J., GARVIN, D. F., VREBALOV, J., KOCHIAN, L. V., KUPPER, H., EARLE, E. D., CAO, J. & LI, L. (2006) The cauliflower Or gene encodes a DnaJ cysteine-rich domain-containing protein that mediates high levels of beta-carotene accumulation. Plant Cell, 18, 3594-605.
LUPOLD, D. S., CAOILE, A. G. & STERN, D. B. (1999) Polyadenylation occurs at multiple sites in maize mitochondrial cox2 mRNA and is independent of editing status. Plant Cell, 11, 1565-78.
MALPEL, S., MENDELSOHN, C. & CARDOSO, W. V. (2000) Regulation of retinoic acid signaling during lung morphogenesis. Development, 127, 3057-67.
MARCHLER-BAUER, A., ANDERSON, J. B., CHITSAZ, F., DERBYSHIRE, M. K., DEWEESE-SCOTT, C., FONG, J. H., GEER, L. Y., GEER, R. C., GONZALES, N. R., GWADZ, M., HE, S., HURWITZ, D. I., JACKSON, J. D., KE, Z., LANCZYCKI, C. J., LIEBERT, C. A., LIU, C., LU, F., LU, S., MARCHLER, G. H., MULLOKANDOV, M., SONG, J. S., TASNEEM, A., THANKI, N., YAMASHITA, R. A., ZHANG, D., ZHANG, N. & BRYANT, S. H. (2009) CDD: specific functional annotation with the conserved domain database. Nucleic Acids Res, 37, D205-10.
MARCHLER-BAUER, A. & BRYANT, S. H. (2004) CD-Search: protein domain annotations on the fly. Nucleic Acids Res, 32, W327-31.
MARIN-RODRIGUEZ, M. C., SMITH, D. L., MANNING, K., ORCHARD, J. & SEYMOUR, G. B. (2003) Pectate lyase gene expression and enzyme activity in ripening banana fruit. Plant Mol Biol, 51, 851-7.
MARKHAM, N. R. & ZUKER, M. (2005) DINAMelt web server for nucleic acid melting prediction. Nucleic Acids Res, 33, W577-81.
MARKHAM, N. R. & ZUKER, M. (2008) UNAFold: software for nucleic acid folding and hybridization. Methods Mol Biol, 453, 3-31.
MARTY, I., BUREAU, S., SARKISSIAN, G., GOUBLE, B., AUDERGON, J. M. & ALBAGNAC, G. (2005) Ethylene regulation of carotenoid accumulation and carotenogenic gene expression in colour-contrasted apricot varieties (Prunus armeniaca). J Exp Bot, 56, 1877-86.
MATHIEU, S., TERRIER, N., PROCUREUR, J., BIGEY, F. & GUNATA, Z. (2005) A carotenoid cleavage dioxygenase from Vitis vinifera L.: functional characterization

144
and expression during grape berry development in relation to C13-norisoprenoid accumulation. J Exp Bot, 56, 2721-31.
MISAWA, N., NAKAGAWA, M., KOBAYASHI, K., YAMANO, S., IZAWA, Y., NAKAMURA, K. & HARASHIMA, K. (1990) Elucidation of the Erwinia uredovora carotenoid biosynthetic pathway by functional analysis of gene products expressed in Escherichia coli. J Bacteriol, 172, 6704-12.
MISAWA, N., TRUESDALE, M. R., SANDMANN, G., FRASER, P. D., BIRD, C., SCHUCH, W. & BRAMLEY, P. M. (1994) Expression of a tomato cDNA coding for phytoene synthase in Escherichia coli, phytoene formation in vivo and in vitro, and functional analysis of the various truncated gene products. J Biochem, 116, 980-5.
MONTOLIU, L., RIGAU, J. & PUIGDOMENECH, P. (1990) Multiple polyadenylation sites are active in the alpha 1-tubulin gene from Zea mays. FEBS Lett, 277, 29-32.
MOORE, S., VREBALOV, J., PAYTON, P. & GIOVANNONI, J. (2002) Use of genomics tools to isolate key ripening genes and analyse fruit maturation in tomato. J Exp Bot, 53, 2023-30.
MURASHIGE, T. & SKOOG, F. (1962) A revised medium for rapid growth and bioassays with tobacco tissue cultures. Physiol Plant, 15, 473-97.
NAMBARA, E. & MARION-POLL, A. (2005) Abscisic acid biosynthesis and catabolism. Annu Rev Plant Biol, 56, 165-85.
NEUDERT, U., MARTINEZ-FEREZ, I. M., FRASER, P. D. & SANDMANN, G. (1998) Expression of an active phytoene synthase from Erwinia uredovora and biochemical properties of the enzyme. Biochim Biophys Acta, 1392, 51-8.
NIH, O. O. D. S. (2006) Vitamin A and carotenoids. Facts about dietary supplements. National Institute of Health (NIH).
OHNUMA, S.-I., HIROOKA, K., OHTO, C. & NISHINO, T. (1997) Conversion from archaeal geranylgeranyl diphosphate synthase to farnesyl diphosphate synthase. Two amino acids before the first aspartate-rich motif solely determine eukaryotic farnesyl diphosphate synthase activity. J Biol Chem, 272, 5192-8.
OHNUMA, S., NARITA, K., NAKAZAWA, T., ISHIDA, C., TAKEUCHI, Y., OHTO, C. & NISHINO, T. (1996) A role of the amino acid residue located on the fifth position before the first aspartate-rich motif of farnesyl diphosphate synthase on determination of the final product. J Biol Chem, 271, 30748-54.
OKADA, K., SAITO, T., NAKAGAWA, T., KAWAMUKAI, M. & KAMIYA, Y. (2000) Five geranylgeranyl diphosphate synthases expressed in different organs are localized into three subcellular compartments in Arabidopsis. Plant Physiol, 122, 1045-56.
OKADA, T., ERNST, O. P., PALCZEWSKI, K. & HOFMANN, K. P. (2001) Activation of rhodopsin: new insights from structural and biochemical studies. Trends Biochem Sci, 26, 318-324.
OROZCO, B. M. & HANLEY-BOWDOIN, L. (1996) A DNA structure is required for geminivirus replication origin function. J Virol, 70, 148-58.
OWENS, D. K., ALERDING, A. B., CROSBY, K. C., BANDARA, A. B., WESTWOOD, J. H. & WINKEL, B. S. (2008) Functional analysis of a predicted flavonol synthase gene family in Arabidopsis. Plant Physiol, 147, 1046-61.
PAINE, J. A., SHIPTON, C. A., CHAGGAR, S., HOWELLS, R. M., KENNEDY, M. J., VERNON, G., WRIGHT, S. Y., HINCHLIFFE, E., ADAMS, J. L., SILVERSTONE, A. L. & DRAKE, R. (2005) Improving the nutritional value of golden rice through increased pro-vitamin A content. Nat Biotechnol, 23, 482-7.
PALACE, V. P., KHAPER, N., QIN, Q. & SINGAL, P. K. (1999) Antioxidant potentials of vitamin A and carotenoids and their relevance to heart disease. Free Radic Biol Med, 26, 746-61.
PALAISA, K. A., MORGANTE, M., WILLIAMS, M. & RAFALSKI, A. (2003) Contrasting effects of selection on sequence diversity and linkage disequilibrium at two phytoene synthase loci. Plant Cell, 15, 1795-806.

145
PALANISWAMY, S. K., JAMES, S., SUN, H., LAMB, R. S., DAVULURI, R. V. & GROTEWOLD, E. (2006) AGRIS and AtRegNet. a platform to link cis-regulatory elements and transcription factors into regulatory networks. Plant Physiol, 140, 818-29.
PECKER, I., GABBAY, R., CUNNINGHAM, F. X., JR. & HIRSCHBERG, J. (1996) Cloning and characterization of the cDNA for lycopene beta-cyclase from tomato reveals decrease in its expression during fruit ripening. Plant Mol Biol, 30, 807-19.
PILLAY, M., TENKOUANO, A., UDE, G. & ORTIZ, R. (2004) Molecular characterization of genomes in Musa and its applications. IN JAIN, S. M. & SWENNEN, R. (Eds.) Banana improvement: cellular, molecular biology, and induced mutations. Science Publishers.
POLLASTRI, G., PRZYBYLSKI, D., ROST, B. & BALDI, P. (2002) Improving the prediction of protein secondary structure in three and eight classes using recurrent neural networks and profiles. 47, 228-35.
POZNIAK, C. J., KNOX, R. E., CLARKE, F. R. & CLARKE, J. M. (2007) Identification of QTL and association of a phytoene synthase gene with endosperm colour in durum wheat. Theor Appl Genet, 114, 525-37.
PUA, E. C. & LEE, Y. C. (2003) Expression of a ripening-related cytochrome P450 cDNA in Cavendish banana (Musa acuminata cv. Williams). Gene, 305, 133-40.
QUAIL, P. H. (2002) Phytochrome photosensory signalling networks. Nat Rev Mol Cell Biol, 3, 85-93.
RAVANELLO, M. P., KE, D., ALVAREZ, J., HUANG, B. & SHEWMAKER, C. K. (2003) Coordinate expression of multiple bacterial carotenoid genes in canola leading to altered carotenoid production. Metab Eng, 5, 255-63.
REDDY, A. S. (2007) Alternative splicing of pre-messenger RNAs in plants in the genomic era. Annu Rev Plant Biol, 58, 267-94.
RODRIGO, M. J., MARCOS, J. F. & ZACARIAS, L. (2004) Biochemical and molecular analysis of carotenoid biosynthesis in flavedo of orange (Citrus sinensis L.) during fruit development and maturation. J Agric Food Chem, 52, 6724-31.
ROMER, S., FRASER, P. D., KIANO, J. W., SHIPTON, C. A., MISAWA, N., SCHUCH, W. & BRAMLEY, P. M. (2000) Elevation of the provitamin A content of transgenic tomato plants. Nat Biotechnol, 18, 666-9.
RONEN, G., COHEN, M., ZAMIR, D. & HIRSCHBERG, J. (1999) Regulation of carotenoid biosynthesis during tomato fruit development: expression of the gene for lycopene epsilon-cyclase is down-regulated during ripening and is elevated in the mutant Delta. Plant J, 17, 341-51.
ROOS, T. C., JUGERT, F. K., MERK, H. F. & BICKERS, D. R. (1998) Retinoid metabolism in the skin. Pharmacol Rev, 50, 315-33.
ROSATI, C., AQUILANI, R., DHARMAPURI, S., PALLARA, P., MARUSIC, C., TAVAZZA, R., BOUVIER, F., CAMARA, B. & GIULIANO, G. (2000) Metabolic engineering of beta-carotene and lycopene content in tomato fruit. Plant J, 24, 413-9.
SAMBROOK, J. & RUSSELL, D. W. (2001) Molecular Cloning: A Laboratory Manual, 3rd edition, Cold Spring Harbor Laboratory Press.
SANDMANN, G. (2001a) Carotenoid biosynthesis and biotechnological application. Arch Biochem Biophys, 385, 4-12.
SANDMANN, G. (2001b) Genetic manipulation of carotenoid biosynthesis: strategies, problems and achievements. Trends Plant Sci, 6, 14-17.
SANJOAQUIN, M. A. & MOLYNEUX, M. E. (2009) Malaria and vitamin A deficiency in African children: a vicious circle? Malar J, 8, 134.
SAWANT, S. V., KIRAN, K., MEHROTRA, R., CHATURVEDI, C. P., ANSARI, S. A., SINGH, P., LODHI, N. & TULI, R. (2005) A variety of synergistic and antagonistic interactions mediated by cis-acting DNA motifs regulate gene expression in plant cells and modulate stability of the transcription complex formed on a basal promoter. J Exp Bot, 56, 2345-53.

146
SCHLEDZ, M., AL BABILI, S., VON LINTIG, J., HAUBRUCK, H., RABBANI, S., KLEINIG, H. & BEYER, P. (1996) Phytoene synthase from Narcissus pseudonarcissus: functional expression, galactolipid requirement, topological distribution in chromoplasts and induction during flowering. Plant J, 10, 781-92.
SCHOFIELD, A. & PALIYATH, G. (2005) Modulation of carotenoid biosynthesis during tomato fruit ripening through phytochrome regulation of phytoene synthase activity. Plant Physiol and Biochem, 43, 1052-60.
SCHWARTZ, S. H., QIN, X. & ZEEVAART, J. A. (2001) Characterization of a novel carotenoid cleavage dioxygenase from plants. J Biol Chem, 276, 25208-11.
SCHWARTZ, S. H., TAN, B. C., MCCARTY, D. R., WELCH, W. & ZEEVAART, J. A. (2003) Substrate specificity and kinetics for VP14, a carotenoid cleavage dioxygenase in the ABA biosynthetic pathway. Biochim Biophys Acta, 1619, 9-14.
SCOLNIK, P. A. & BARTLEY, G. E. (1994) Nucleotide sequence of an Arabidopsis cDNA for phytoene synthase. Plant Physiol, 104, 1471-2.
SHARROCK, S. & FRISON, E. (1998) Musa production around the world – trends, varieties and regional importance. Networking Banana and Plantain: Annual Report 1998, 41-6.
SHEN, Y., JI, G., HAAS, B. J., WU, X., ZHENG, J., REESE, G. J. & LI, Q. Q. (2008) Genome level analysis of rice mRNA 3'-end processing signals and alternative polyadenylation. Nucleic Acids Res, 36, 3150-61.
SIMKIN, A. J., SCHWARTZ, S. H., AULDRIDGE, M., TAYLOR, M. G. & KLEE, H. J. (2004) The tomato carotenoid cleavage dioxygenase 1 genes contribute to the formation of the flavor volatiles beta-ionone, pseudoionone, and geranylacetone. Plant J, 40, 882-92.
SINHA, R. K. (2004) Modern plant physiology, Alpha Science. SIVAMANI, E. & QU, R. (2006) Expression enhancement of a rice polyubiquitin gene
promoter. Plant Mol Biol, 60, 225-39. SOLOMONS, N. W. & OROZCO, M. (2003) Alleviation of vitamin A deficiency with palm
fruit and its products. Asia Pac J Clin Nutr, 12, 373-84. SOMMER, A. & WEST, K. P. (1996) Vitamin A deficiency : health, survival, and vision,
Oxford University Press. SRIVASTAVA, M. K. & DWIVEDI, U. N. (2000) Delayed ripening of banana fruit by
salicylic acid. Plant Sci, 158, 87-96. SUIRE, C., BOUVIER, F., BACKHAUS, R. A., BEGU, D., BONNEU, M. & CAMARA, B.
(2000) Cellular localization of isoprenoid biosynthetic enzymes in Marchantia polymorpha. Uncovering a new role of oil bodies. Plant Physiol, 124, 971-978.
TAIZ, L. & ZEIGER, E. (2002) Plant physiology, 3rd edition, Sinauer Associates. TAN, B.-C., CLINE, K. & MCCARTY, D. R. (2001) Localization and targeting of the VP14
epoxy-carotenoid dioxygenase to chloroplast membranes. Plant J, 27, 373-382. TAN, B.-C., LIU, L., WU, S., LAI, J., SIMONE, A. & MCCARTY, D. (2004) The dominant
white endosperm factor white cap encodes the ZmCCD1 carotenoid dioxygenase in a large multiple copy gene array. Maize genetics conference.
TAN, B. C., JOSEPH, L. M., DENG, W. T., LIU, L., LI, Q. B., CLINE, K. & MCCARTY, D. R. (2003) Molecular characterization of the Arabidopsis 9-cis epoxycarotenoid dioxygenase gene family. Plant J, 35, 44-56.
TANSEY, T. R. & SHECHTER, I. (2000) Structure and regulation of mammalian squalene synthase. Biochim Biophys Acta, 1529, 49-62.
TARSHIS, L. C., PROTEAU, P. J., KELLOGG, B. A., SACCHETTINI, J. C. & POULTER, C. D. (1996) Regulation of product chain length by isoprenyl diphosphate synthases. Proc Natl Acad Sci U S A, 93, 15018-23.
TATALA, S. R., KIHAMIA, C. M., KYUNGU, L. H. & SVANBERG, U. (2008) Risk factors for anaemia in schoolchildren in Tanga Region, Tanzania. Tanzan J Health Res, 10, 189-202.

147
TAYLOR, M. & RAMSAY, G. (2005) Carotenoid biosynthesis in plant storage organs: recent advances and prospects for improving plant food quality. Physiol Plant, 124, 143-51.
TIAN, L. & DELLA PENNA, D. (2001) Characterization of a second carotenoid beta-hydroxylase gene from Arabidopsis and its relationship to the LUT1 locus. Plant Mol Biol, 47, 379-88.
TORIYAMA, K. & HINATA, K. (1985) Cell suspension and protoplast culture in rice. Plant Sci, 41, 179-183.
TRAN, D., HAVEN, J., QIU, W. G. & POLLE, J. E. (2009) An update on carotenoid biosynthesis in algae: phylogenetic evidence for the existence of two classes of phytoene synthase. Planta, 229, 723-9.
USDA (2008) USDA national nutrient database for standard reference, release 21. Available: http://www.ars.usda.gov/main/site_main.htm?modecode=12-35-45-00 Accessed: [19 May 2009].
VAILLANT, I. & PASZKOWSKI, J. (2007) Role of histone and DNA methylation in gene regulation. Curr Opin Plant Biol, 10, 528-33.
VALÁRIK, M., SIMKOVA, H., HRIBOVA, E., SAFAR, J., DOLEZELOVA, M. & DOLEZEL, J. (2002) Isolation, characterization and chromosome localization of repetitive DNA sequences in bananas (Musa spp.). Chromosome Res, 10, 89-100.
VISHNEVETSKY, M., OVADIS, M. & VAINSTEIN, A. (1999) Carotenoid sequestration in plants: the role of carotenoid-associated proteins. Trends Plant Sci, 4, 232-235.
VON LINTIG, J., HESSEL, S., ISKEN, A., KIEFER, C., LAMPERT, J. M., VOOLSTRA, O. & VOGT, K. (2005) Towards a better understanding of carotenoid metabolism in animals. Biochim Biophys Acta, 1740, 122-31.
VON LINTIG, J., WELSCH, R., BONK, M., GIULIANO, G., BATSCHAUER, A. & KLEINIG, H. (1997) Light-dependent regulation of carotenoid biosynthesis occurs at the level of phytoene synthase expression and is mediated by phytochrome in Sinapis alba and Arabidopsis thaliana seedlings. Plant J, 12, 625-34.
WANG, B. B. & BRENDEL, V. (2006) Genomewide comparative analysis of alternative splicing in plants. Proc Natl Acad Sci U S A, 103, 7175-80.
WANG, B. S., REN, J. W., OOI, L., CHONG, S. S. & LEE, C. G. L. (2005) Dinucleotide repeats negatively modulate the promoter activity of Cyr61 and is unstable in hepatocellular carcinoma patients. Oncogene, 24, 3999-4008.
WANG, K. & OHNUMA, S.-I. (1999) Chain-length determination mechanism of isoprenyl diphosphate synthases and implications for molecular evolution. Trends Biochem Sci, 24, 445-51.
WELSCH, R., BEYER, P., HUGUENEY, P., KLEINIG, H. & VON LINTIG, J. (2000) Regulation and activation of phytoene synthase, a key enzyme in carotenoid biosynthesis, during photomorphogenesis. Planta, 211, 846-54.
WELSCH, R., MEDINA, J., GIULIANO, G., BEYER, P. & VON LINTIG, J. (2003) Structural and functional characterization of the phytoene synthase promoter from Arabidopsis thaliana. Planta, 216, 523-34.
WEST, C. E. (2000) Meeting requirements for vitamin A. Nutr Rev, 58, 341-5. WEST, C. E., EILANDER, A. & VAN LIESHOUT, M. (2002) Consequences of revised
estimates of carotenoid bioefficacy for dietary control of vitamin A deficiency in developing countries. J Nutr, 132, 2920S-6S.
WEST, K. P., JR. (2002) Extent of vitamin A deficiency among preschool children and women of reproductive age. J Nutr, 132, 2857S-66S.
WONG, J. C., LAMBERT, R. J., WURTZEL, E. T. & ROCHEFORD, T. R. (2004) QTL and candidate genes phytoene synthase and zeta-carotene desaturase associated with the accumulation of carotenoids in maize. Theor Appl Genet, 108, 349-59.
YAMAGISHI, T., HIROSE, S. & KONDO, T. (2008) Secondary DNA structure formation for Hoxb9 promoter and identification of its specific binding protein. Nucleic Acids Res, 36, 1965-75.

148
YE, X., AL-BABILI, S., KLOTI, A., ZHANG, J., LUCCA, P., BEYER, P. & POTRYKUS, I. (2000) Engineering the provitamin A (beta-carotene) biosynthetic pathway into (carotenoid-free) rice endosperm. Science, 287, 303-5.
YEUM, K. J. & RUSSELL, R. M. (2002) Carotenoid bioavailability and bioconversion. Annu Rev Nutr, 22, 483-504.
ZHANG, X. H., LESLIE, C. S. & CHASIN, L. A. (2005) Computational searches for splicing signals. Methods, 37, 292-305.
ZHU, C., YAMAMURA, S., KOIWA, H., NISHIHARA, M. & SANDMANN, G. (2002) cDNA cloning and expression of carotenogenic genes during flower development in Gentiana lutea. Plant Mol Biol, 48, 277-85.
ZIMMERMANN, M. B. & HURRELL, R. F. (2002) Improving iron, zinc and vitamin A nutrition through plant biotechnology. Curr Opin Biotechnol, 13, 142-5.
ZOU, Z., EIBL, C. & KOOP, H. U. (2003) The stem-loop region of the tobacco psbA 5'UTR is an important determinant of mRNA stability and translation efficiency. Mol Genet Genomics, 269, 340-9.