defining great places: using data-driven storytelling to unlock the power of place
TRANSCRIPT

I have a confession to make.I was asked to come here today because people have come to think of me as the methods girl, a data geek, a methodholic.But actually, I'm a placeoholicMethods, data, definition, rationalism, are just my drugs of choice I use to feed my place addictionI very much embrace the notion thatIf you cannot measure it, it doesn't existbut not for the sake of measurement itself'but for the sake of changing itfor the sake of convincing other people to change itfor the sake of communicating the value of urban designBut I didn't start out this way.
Defining Great Places
Using data-driven storytelling to
unlock the power of place
TM
Mariela Alfonzo, Ph.D.
Founder, State of Place TM
Research Assistant Professor, NYU
OU Institute for Quality Communities
Placemaking Conference, March 21st, 2015
This is my hometown - westchester
meeyame
Where my most exhilarating memory is
playing an ersatz game of frogger
as i tightroped down pencil thin
sidewalks
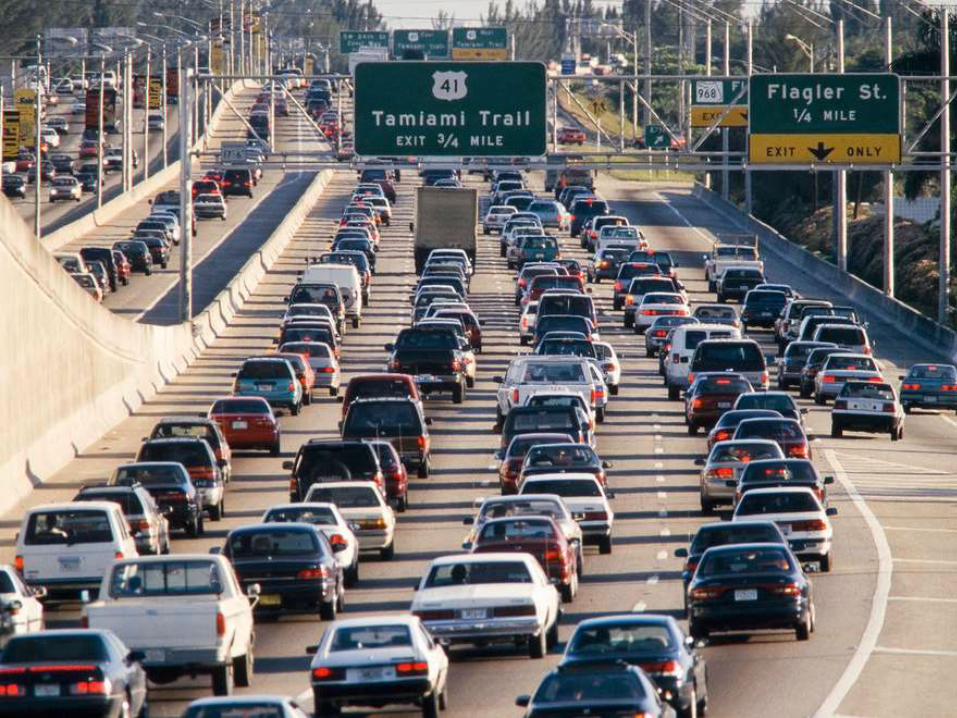
dogging cars as I crossed strip-mall
lined highways masquerading as
streets
all to get to a chicken teriyaki sub.
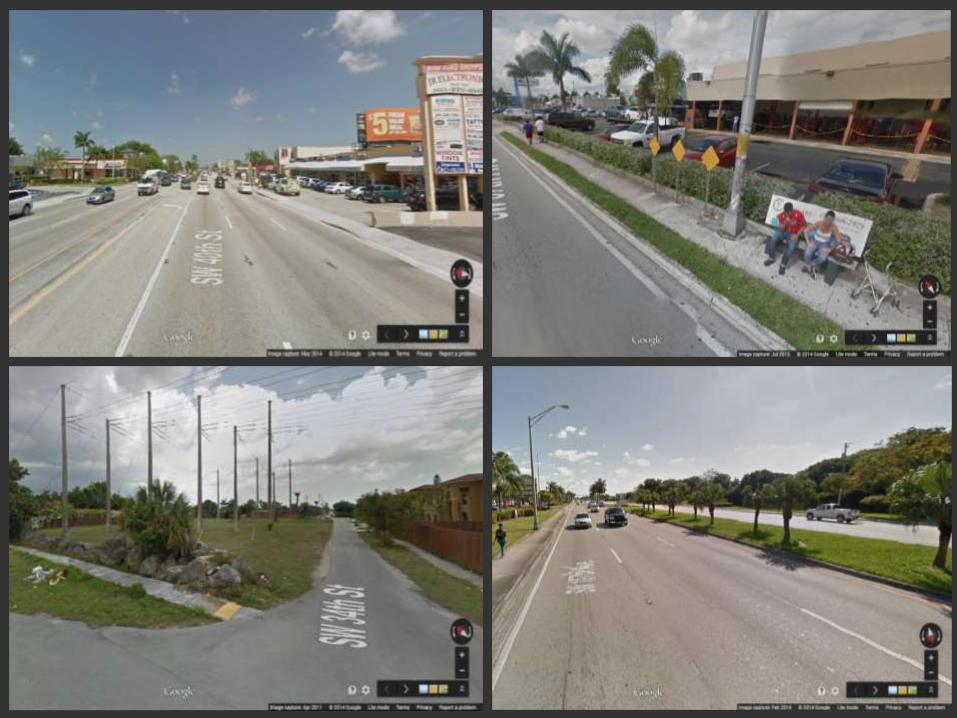
Growing up in Miami - especially as a
carless teenager sucked.
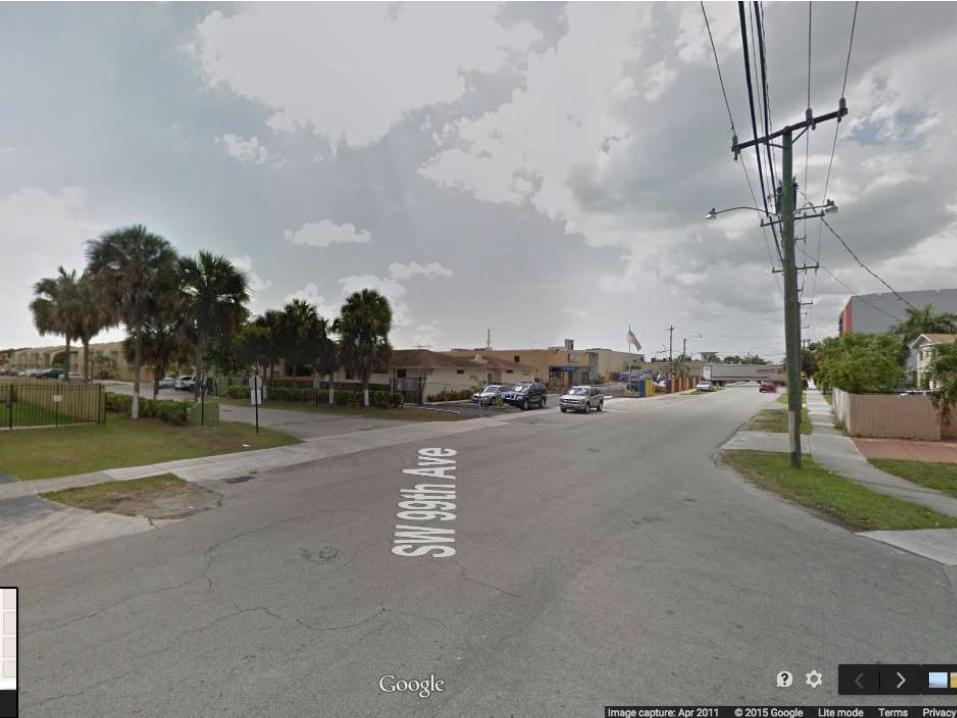
This was life
This was work
This was play

Caddy corner form another form of
play
This was our best hope for place
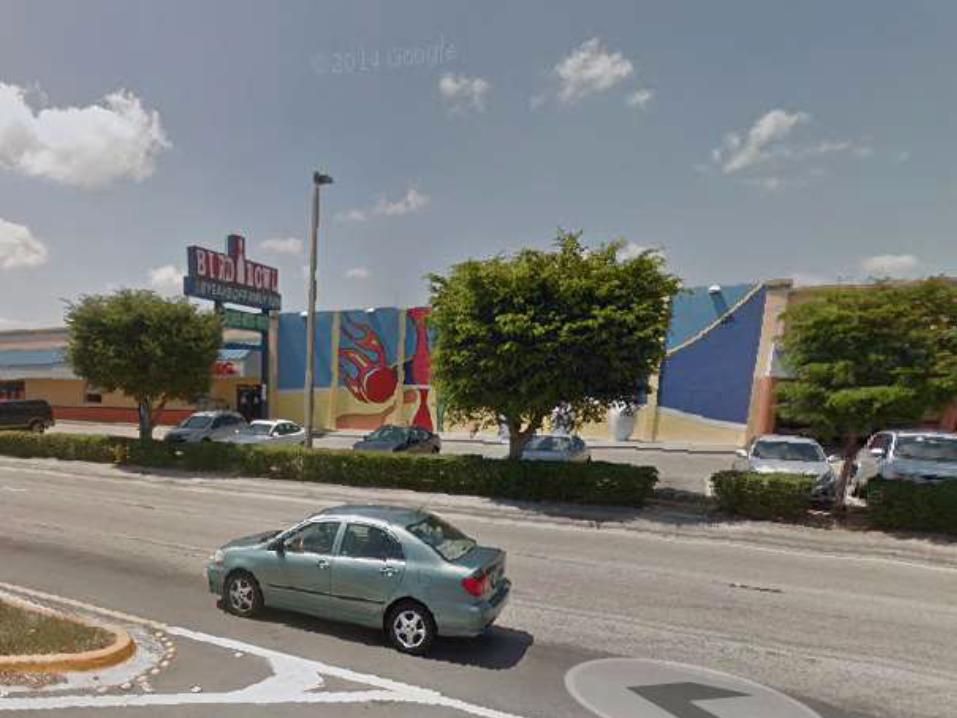
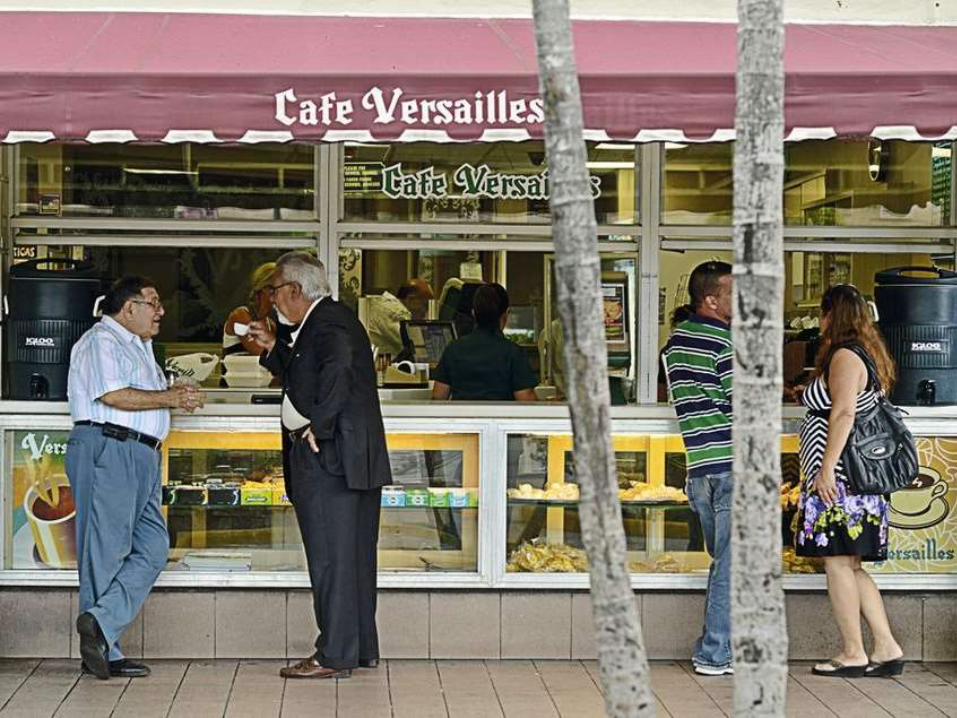
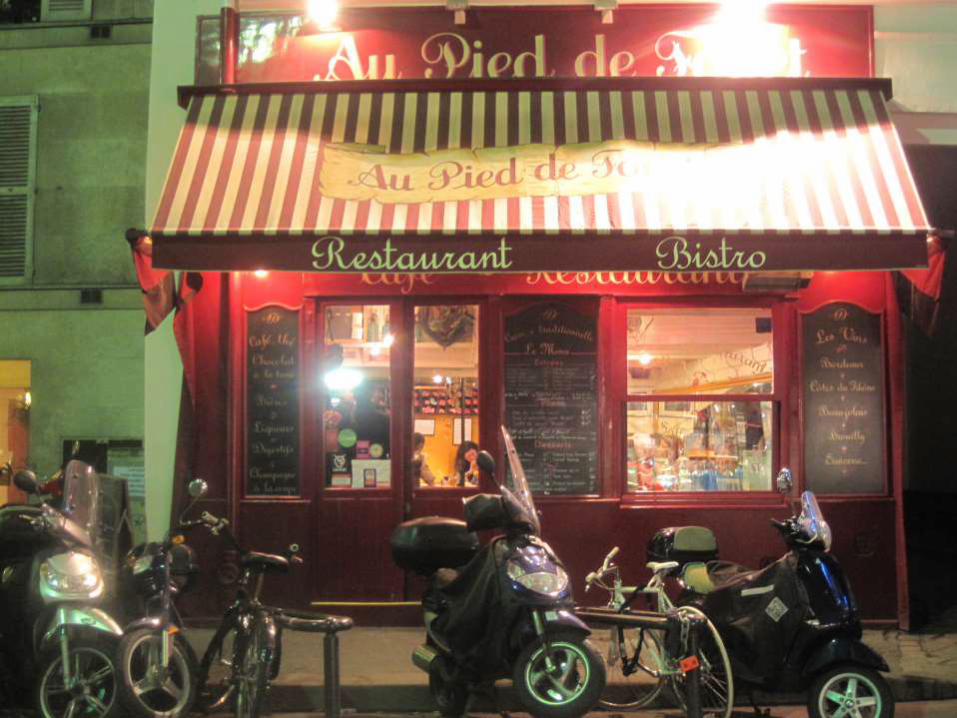
I always say the best place to find
Miami's soul is within a tired strip mall
along an otherwise placeless artery at
the famous Versailles café.

This is the typical scene outside of the
Versailles Café window – la ventanita –
where all the Cubans gather around
talking about their heydays on the
island.

I don't blame them, I'd miss this place too.
Miamians – Cuban exiles or otherwise – are obviously starving for place; creating it out of whatever they can.
But what miami lacked in place, I made up for in passion
Ironically, I owe my intimate understanding of the power of place, or lack thereof, to Miami.
I desperately wanted to fix Miami, to help create place
I thought if you could only convince people, show them the power of place…its value…that things could change. Even
then I was convinced better places did better, all around.
I just needed to find a way to prove that to people.
for a while, I thought I would do that as an architect
I had studied psychology as an undergrad but had always been interested in design as a way to create solutions to
problems - guess that's what drew me to psychology too
but as a grad student in architecture, I was too much of a social scientist. I was less focused on the nuts and bolts of
design and more on the question -- how will this make people feel? what has been done in the past that has been
successful in producing an emotion, in facilitating a behavior...
I left architecture school as I didn't feel I was being trained to answer those questions, those questions that were most
important to me.
I was so confused. My friends joked with me – well, you could design houses for psychologists or psychoanalyze architects.
Yeah, thanks, great help!
So needing to make some money, I took a temporary detour, working at a global advertising agency. But my very first
day there, I hated it. It was quarter to 5 and no one seemed to be getting ready to go. Um, wait, what? This job is from 9
to 6, not 9 to 5? And effectively, more like 9 to 7 or 8? I don't get to be creative? I don't get to solve problems? 5 minutes
into this major life crisis, I typed into Yahoo, as this preceded the Google days, "psychology" and "architecture" and I
found a woman who had a Phd in Psychology and a Masters in Architecture. Yes, I wasn't crazy - there are other people
out there that want to "fix" places as a vehicle to "fix" people.
One year later, I was a first year PhD student at UC Irvine clamoring for research experience.
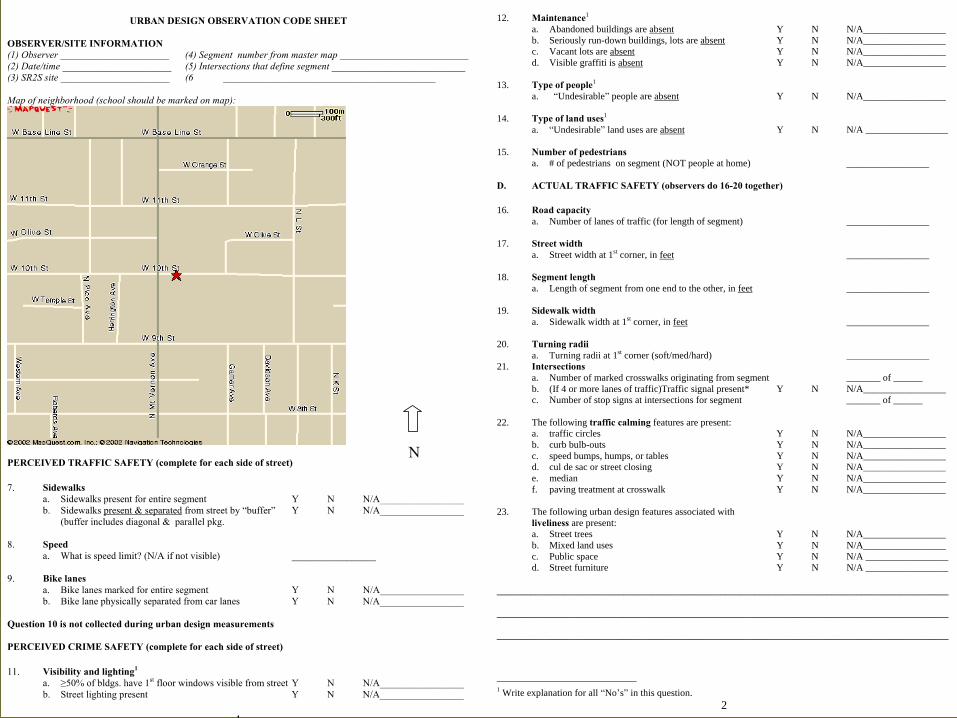
I began working with a team
evaluating the Safe Routes to School
program in California. It was in that
project that I first dipped my toe into
the world of methods. It was the first
time that I had heard the term
"walkability" and the first time I had
thought about health as it related to
the power of place. We evaluated 16
schools across the state using an urban
design audit tool that measured about
20 built environment features, like
sidewalks and road width. But we
encountered so many more urban
design issues that children were
battling with on an everyday basis just
to get to school
2
12. Maintenance1
a. Abandoned buildings are absent Y N N/A_________________
b. Seriously run-down buildings, lots are absent Y N N/A_________________
c. Vacant lots are absent Y N N/A_________________
d. Visible graffiti is absent Y N N/A_________________
13. Type of people1
a. “Undesirable” people are absent Y N N/A_________________
14. Type of land uses1
a. “Undesirable” land uses are absent Y N N/A _________________
15. Number of pedestrians
a. # of pedestrians on segment (NOT people at home) _________________
D. ACTUAL TRAFFIC SAFETY (observers do 16-20 together)
16. Road capacity
a. Number of lanes of traffic (for length of segment) _________________
17. Street width
a. Street width at 1st corner, in feet _________________
18. Segment length
a. Length of segment from one end to the other, in feet _________________
19. Sidewalk width
a. Sidewalk width at 1st corner, in feet _________________
20. Turning radii
a. Turning radii at 1st corner (soft/med/hard) _________________
21. Intersections
a. Number of marked crosswalks originating from segment _______ of ______
b. (If 4 or more lanes of traffic)Traffic signal present* Y N N/A_________________
c. Number of stop signs at intersections for segment _______ of ______
22. The following traffic calming features are present:
a. traffic circles Y N N/A_________________
b. curb bulb-outs Y N N/A_________________
c. speed bumps, humps, or tables Y N N/A_________________
d. cul de sac or street closing Y N N/A_________________
e. median Y N N/A_________________
f. paving treatment at crosswalk Y N N/A_________________
23. The following urban design features associated with
liveliness are present:
a. Street trees Y N N/A_________________
b. Mixed land uses Y N N/A_________________
c. Public space Y N N/A _________________
d. Street furniture Y N N/A _________________
_____________________________________________________________________________________________
_____________________________________________________________________________________________
_____________________________________________________________________________________________
1 Write explanation for all “No’s” in this question.

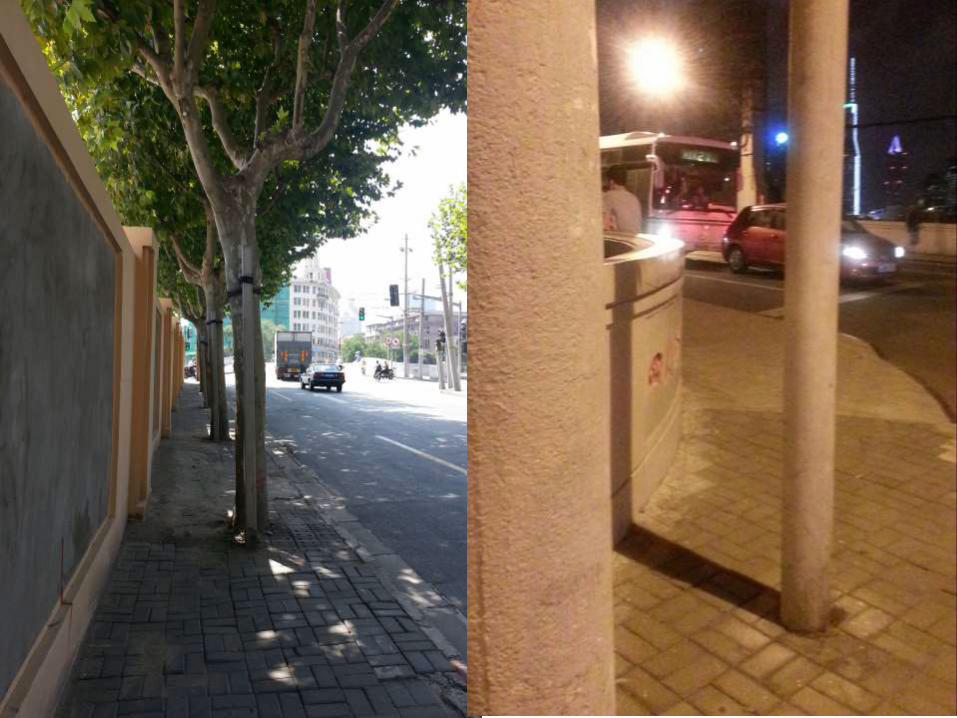
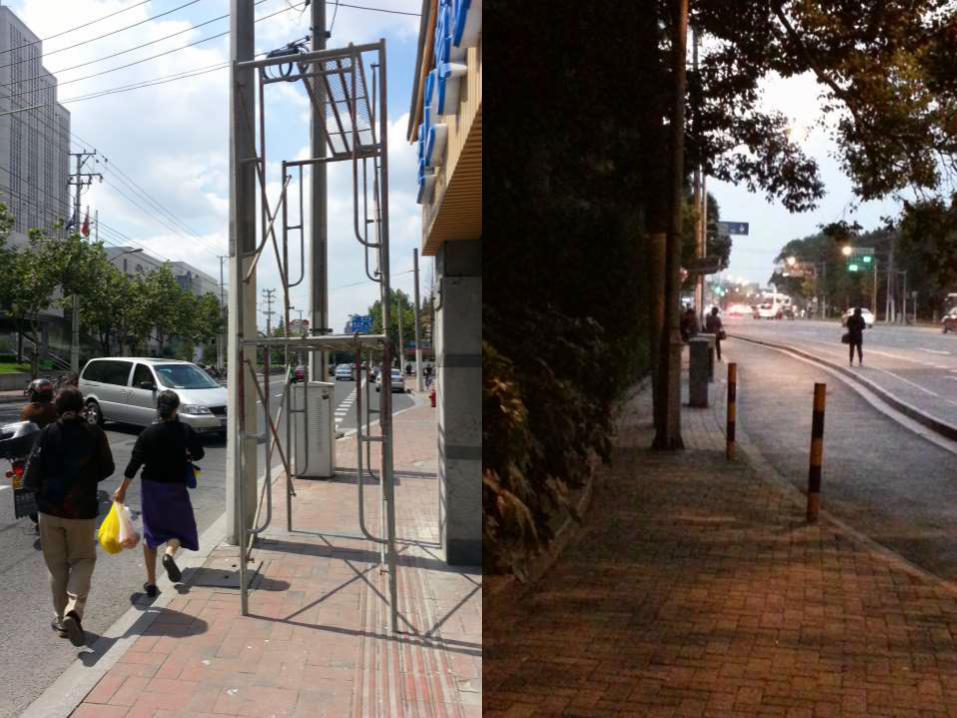
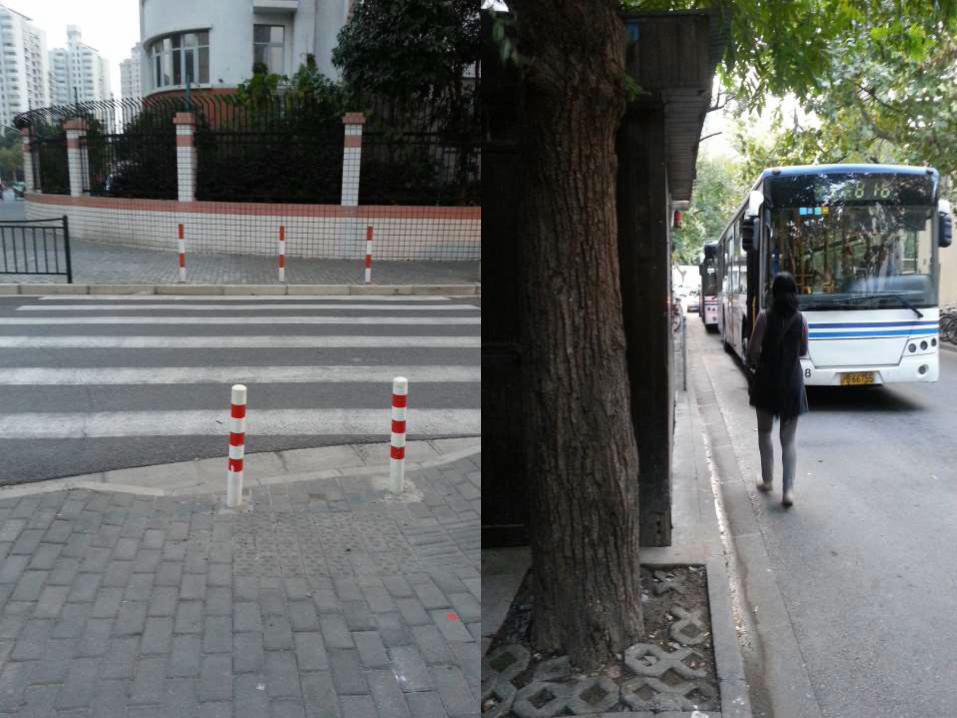
Overgrown bushes making an already
tiny 3ft sidewalk effectively unusable,
forcing kids to walk along the road or
do a balancing act on the one-foot
wide sidewalk curb
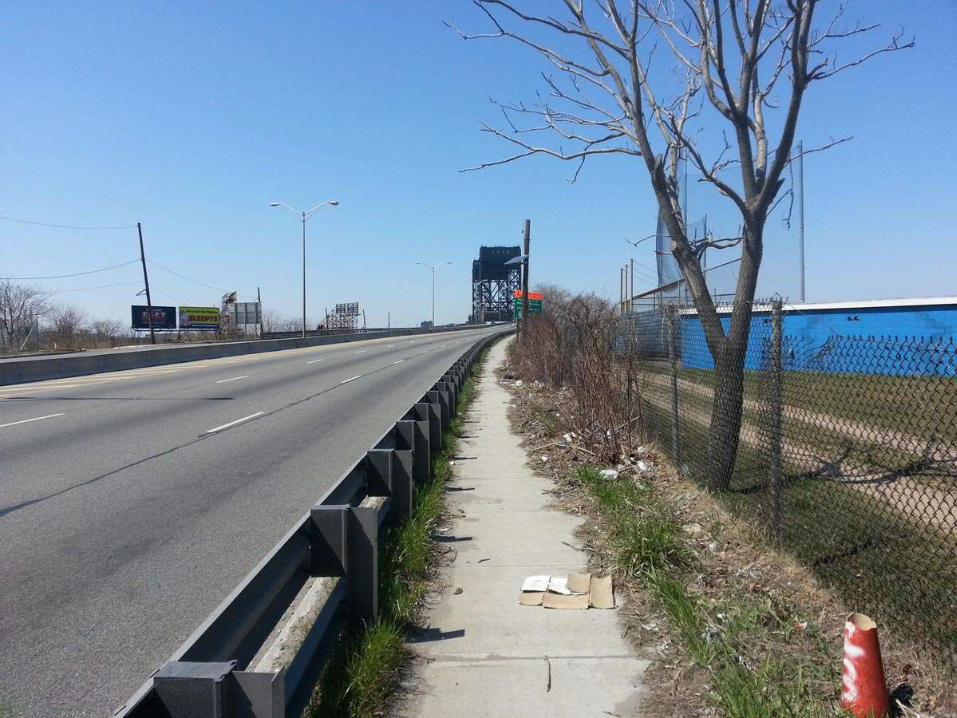
Or in other cases forcing them to step over the
barricade that was placed between the sidewalk
and the road to purportedly "keep people safe."
I realized that this was the early days of measuring
urban design – it was 2001
but I knew we were not capturing so much that
mattered to our perceptions, safety, behavior...
I also began to realize that the whole of urban
design was bigger than the sum of its parts.
I became obsessed with understanding what
influenced people's decisions to walk. I got a lot of
personal practice at this, as I didn't have a car for
my first two years in SoCal. I have seen it all – well, I
thought so until I started working in China – but
that’s a whole other talk!
I couldn't get out of my own head. every time I took
a step, I took copious mental notes about the
design features that were influencing me - the
setbacks, the height of the buildings, the trees, the
views, the colors, the windows, the smells.

I thought about Malibu’s beautiful but
sidewalk-less landscapes
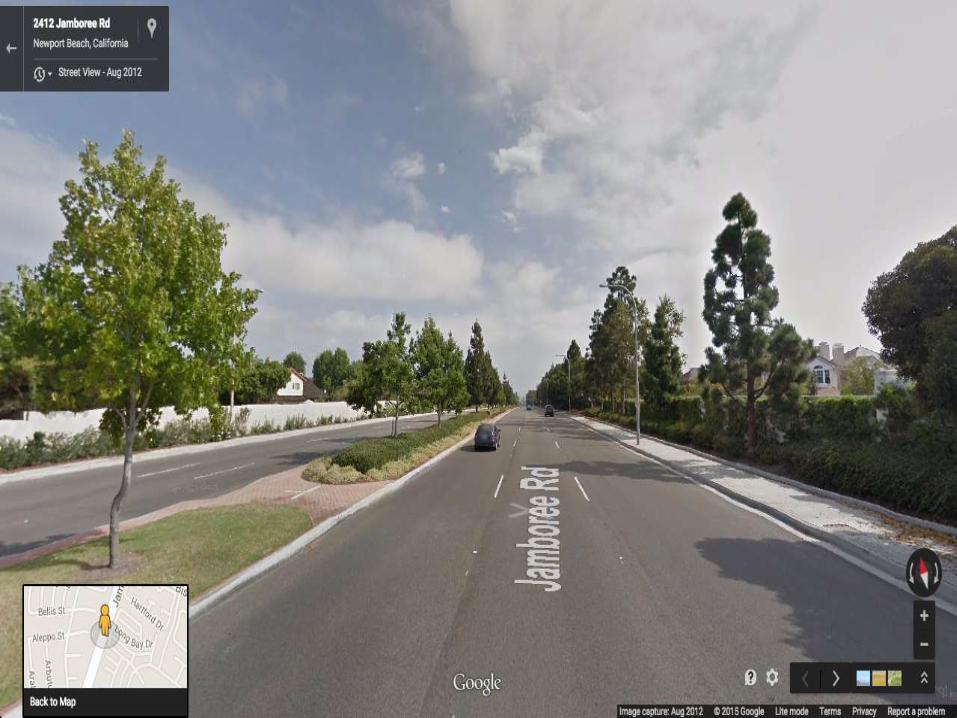
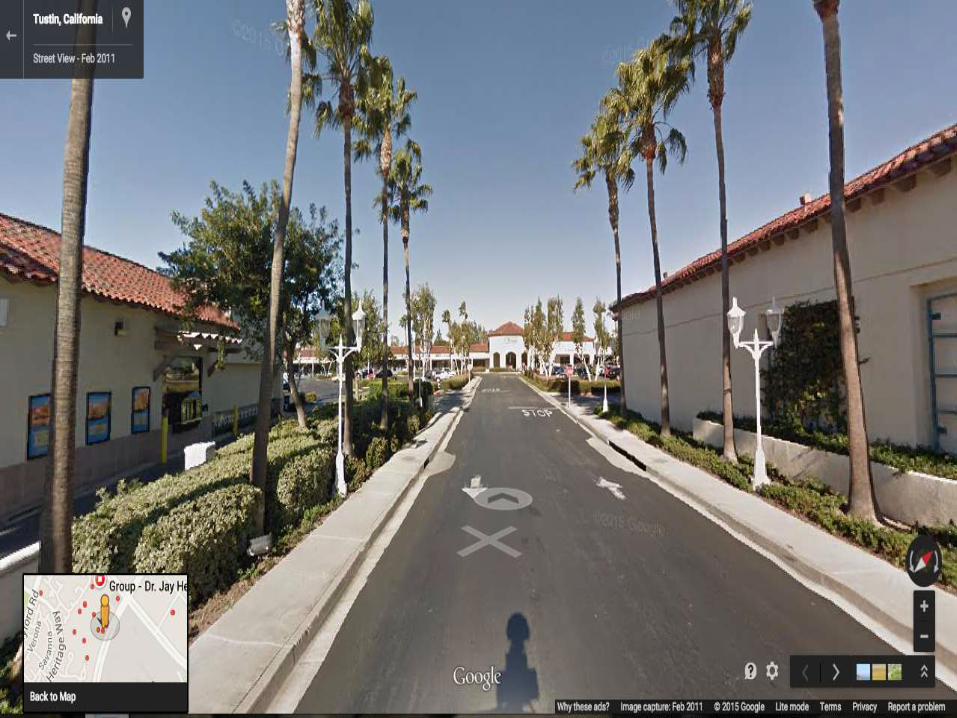
I thought about Irvine’s beautiful yet
useless sidewalks abutting the
uttermost boring of cookie cutter
shopping plazas
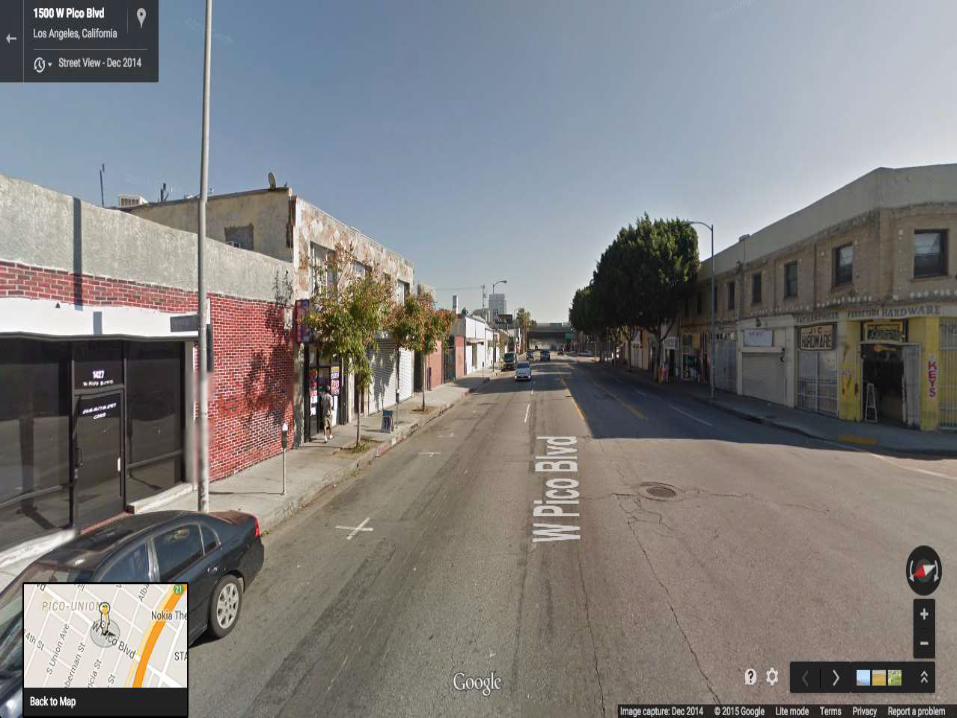
I thought about the older parts of LA
that had great bones but didn’t feel
quite safe or inviting as a pedestrian

I thought about the quaint scale of
Laguna Beach

I thought about the dynamic nature of
the streets of Santa Monica
I realized that not everything mattered
in the same way at the same time.

THE HIERARCHY OF WALKING NEEDS

I thought about the quaint scale of Laguna Beach
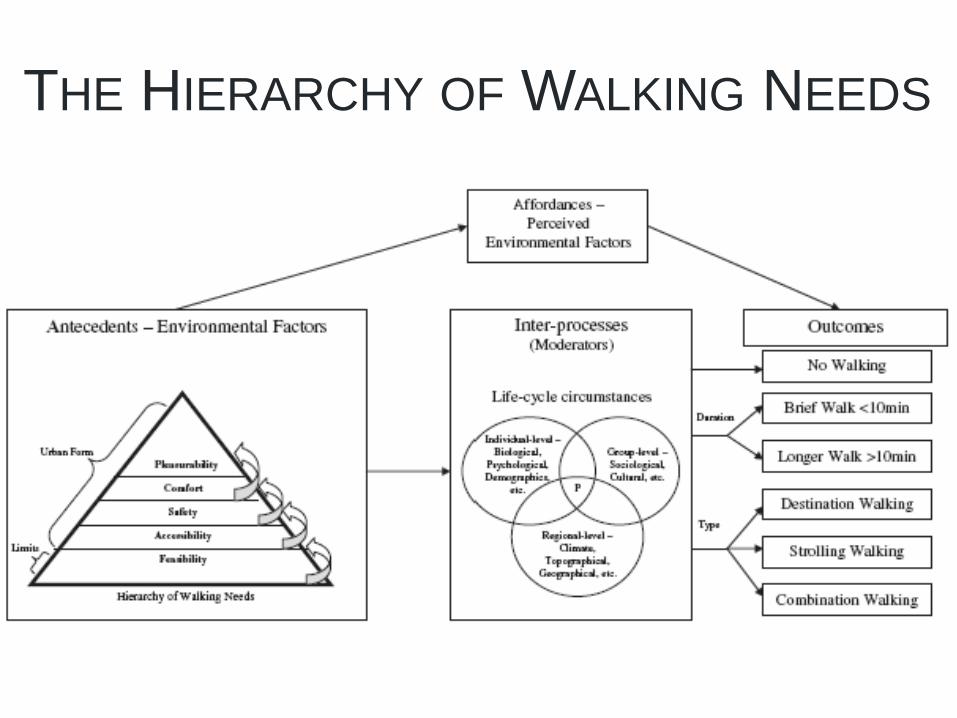
That’s when I wrote the hierarchy of walking needs – my aim was to organize all these different elements of urban design that mattered based on what was most fundamental for a walk to occur, starting with accessibility (having somewhere to walk on and to), perceived safety from crime (not feeling like you were going to be in danger), pedestrian comfort (not feeling like you were going to get run over/feeling like you belonged as a pedestrian), and finally pleasurability (the things that made a walk interesting and enjoyable). I argued that in most cases, you needed to address the most fundamental needs first – think of Irvine, as an example, in which many of the streets were quite aesthetically pleasing, but you had no real reason to walk on them in terms of getting to a destination).
THE HIERARCHY OF WALKING NEEDS

My aim was to provide a framework for those studying the links between
urban design and physical activity – to encourage people to analyze built
environment features as a composite of various urban design dimensions, the
way they occurred in real life, instead of just evaluating the impacts of single
features, like sidewalks. My goal was to indeed produce a better
methodology…
I had begun to become the methods girl
But it wasn't until the Irvine Minnesota Inventory that I got the opportunity to
really geek out.
With funding from Robert Wood Johnson Foundation through Active Living
Research, we were tasked to establish an objective built environment audit
tool that would allow researchers to test the relationship between urban
design and health.
We visited dozens of neighborhoods. My job was to literally jot down every
possible item you could think of that would influence our choices to walk –
ironically enough, I had to buy a car to do so! I remember driving through
Barstow and thinking, oh, yeah, a jail. That might impact our decision to
walk…It didn’t make it to the final version though!
Throughout this process, I combed through

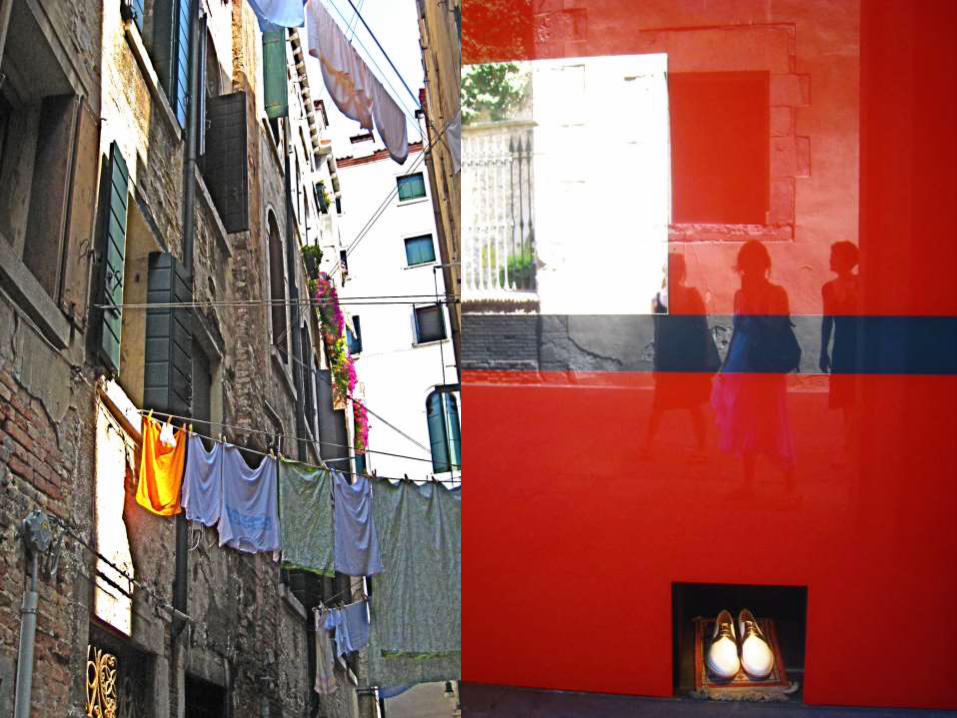
The goodDynamic public plazas encased by engaging retail within buildings full of character

Organized chaos, with various forms of mobility living side by side, that prioritized the pedestrian

The importance of lightingThe contribution of the whimsical

The delicate balance between the private and the public, the active

and the intimate

The importance of urban parks and providing access to nature

The provision of bicycle infrastructure,How a couple of chairs and tables transform streets into buzzing centers of activityYou know those people are having fun and that feeling is infectious – that’s what amazing about just going for a walk in a city filled with places
The juxtaposition of the high brow and the ordinary
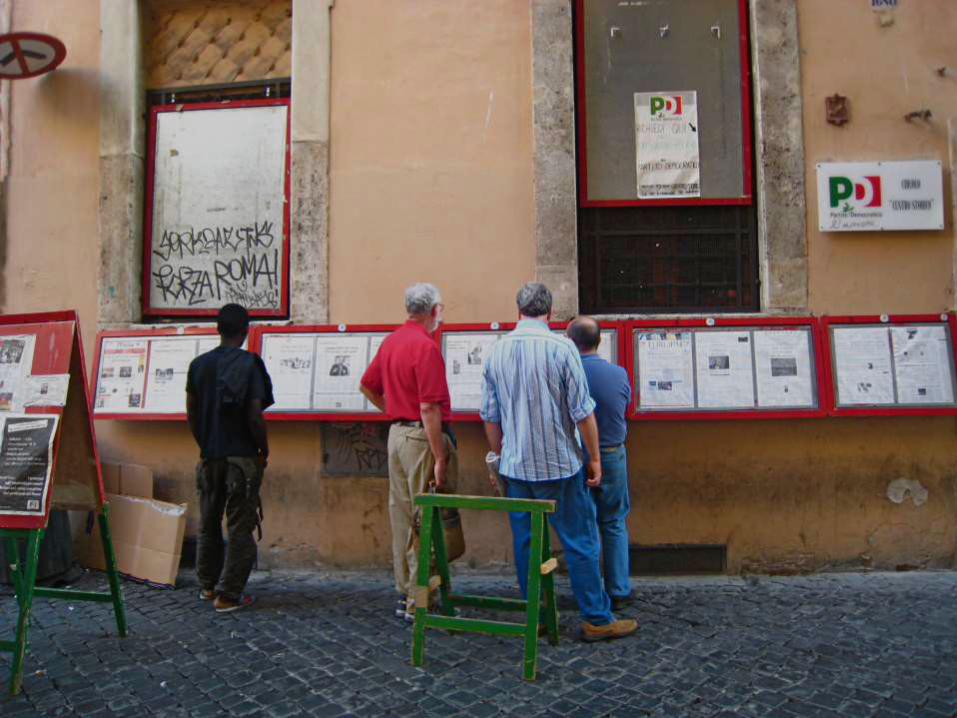
The interactive possibility of designAnd creating true civic places

Offering different opportunities to sit
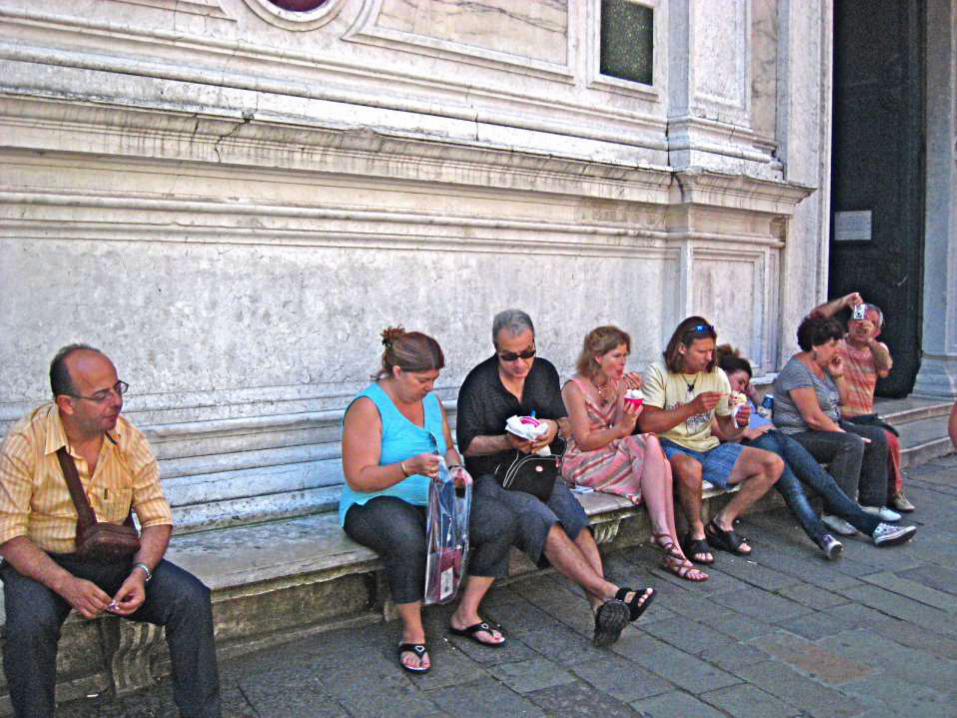
RestLingerWatch other people – one of the best things to do in great places
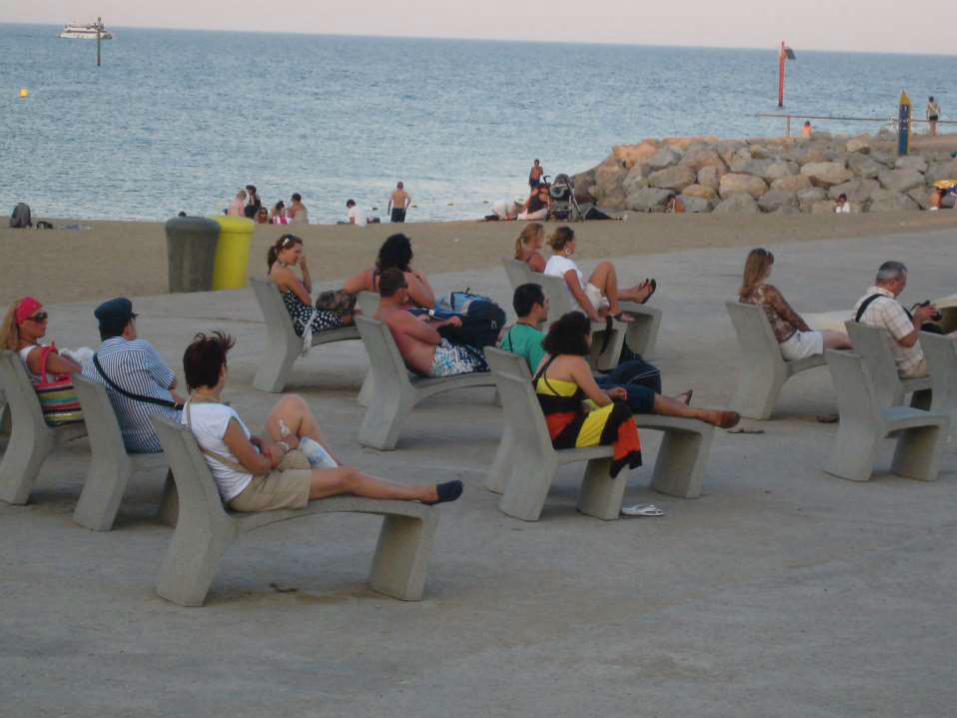
And adapting that to all climates and types of places

And noting the resiliency of the human sprit, even when we are not provided official places to sit, or we are explicitly barred from it
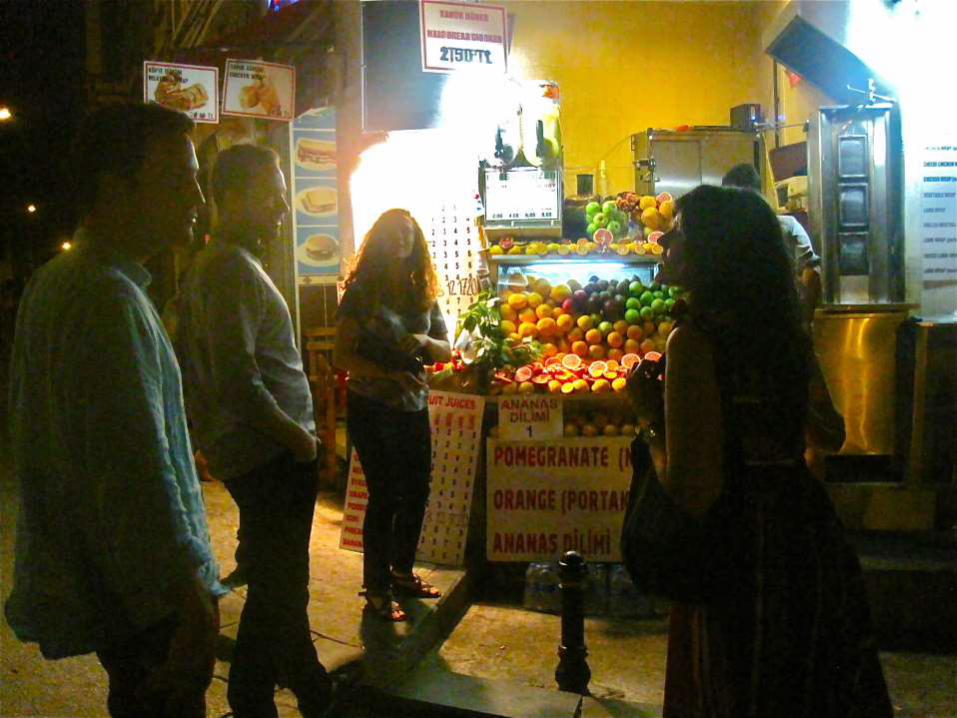
The dynamic effect of food within the urban landscapeThe colors, the smell, the access
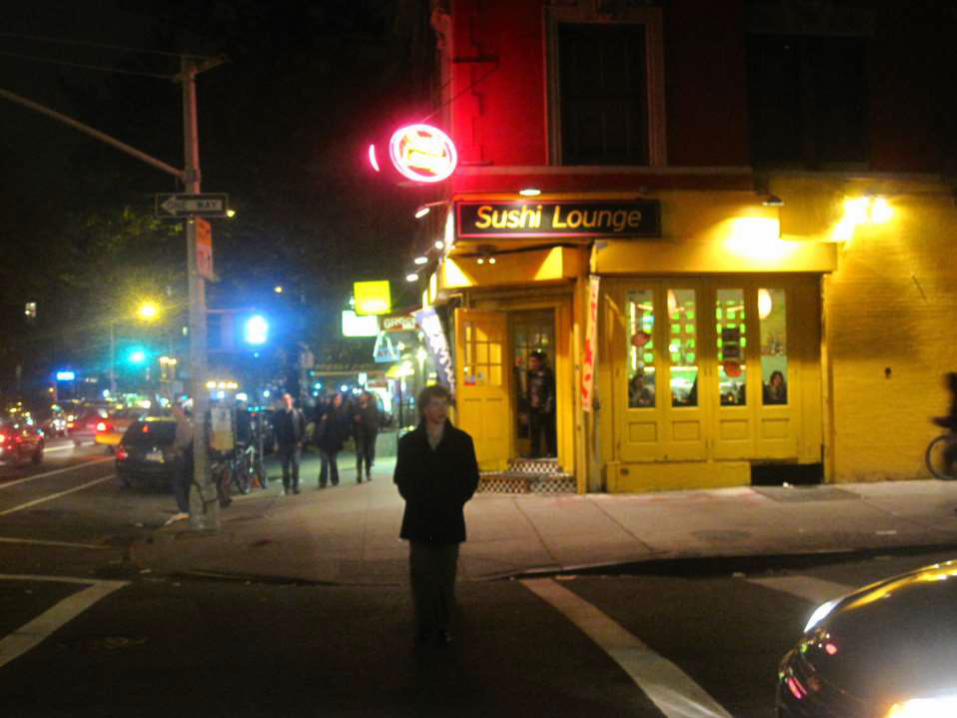
Playing with color and lightAnd understanding nightscapes

Having little nodes of activity and hidden retreats

the desire for personalization
Admiring the so ridiculously quaint I want to hug it facade

appreciating absolutely perfect urban form and scale
And then the badEncountering so many obstacles along the way
So many times we are told we’re not wanted or not thought of

Or not prioritized

When the sidewalk literally does end…
When there is literally a disconnect
When landscapes are littered with homogenous, never-ending rivers of strip malls

Which force us to drive from one to the other even when they are right across the street from one another

When it’s obvious we are purposely not meant to traverse a place

And finally, the ugly.I think this was the no-turning back point for me. I officially became that girl who could not help but indulge in incessant commentary about the built environment and the public realm every time she stepped foot outside –and mostly framed as what needed to be fixed! I call it advanced people-watching (a al William Whyte); it’s the one key skill I try to impart onto my urban design students. But if you’re not an urbanist…ah, my poor fiancé. Bless his heart. The funniest thing is I’ve caught him now several times starting a sentence with “From an urban design perspective…” Yes! I’ve done my job. We do try to incorporate some non-urban spots when we go on vacation for both our sakes! I have a lot less to say about fields and mountains!
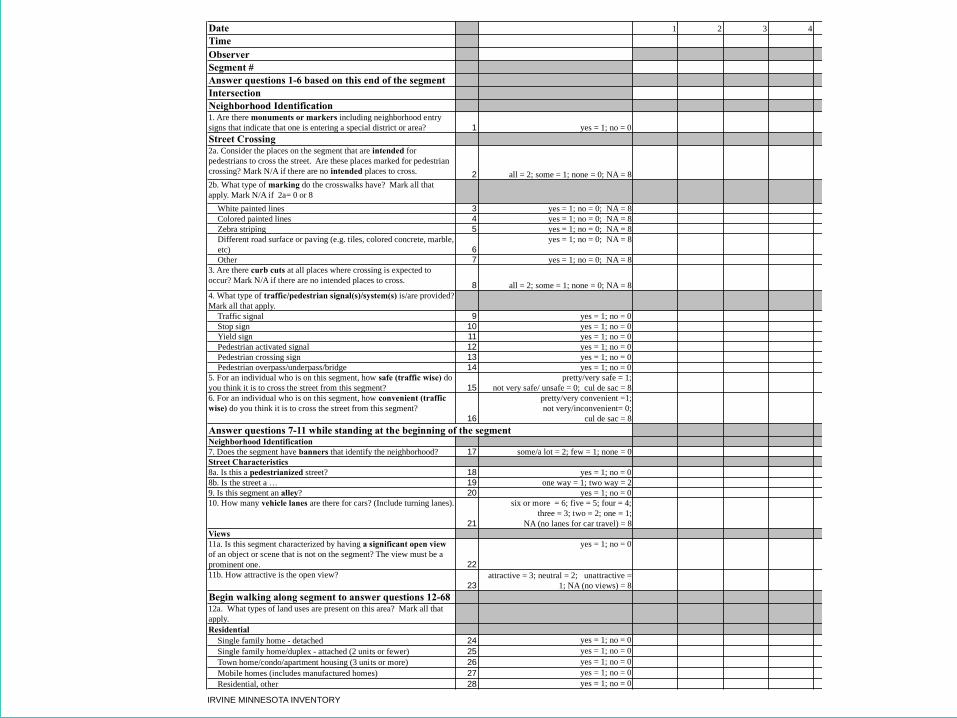
So in the end, we identified 241 items and after reliability testing, 162 ended up in the original IMI.It was GREAT! We had done it. We had measured urban design!BUTWe had built a tool for measurements sake.I’ve since fielded dozens of calls from researchers and practitioners asking us how to use this thing – and as the grad student on the project, I was really the only one who knew what to do with it!
IRVINE MINNESOTA INVENTORY Page 1
Date 1 2 3 4 5 6 7 8
Time
Observer
Segment #
Answer questions 1-6 based on this end of the segment
Intersection
Neighborhood Identification1. Are there monuments or markers including neighborhood entry
signs that indicate that one is entering a special district or area? 1 yes = 1; no = 0
Street Crossing2a. Consider the places on the segment that are intended for
pedestrians to cross the street. Are these places marked for pedestrian
crossing? Mark N/A if there are no intended places to cross. 2 all = 2; some = 1; none = 0; NA = 8
2b. What type of marking do the crosswalks have? Mark all that
apply. Mark N/A if 2a= 0 or 8
White painted lines 3 yes = 1; no = 0; NA = 8
Colored painted lines 4 yes = 1; no = 0; NA = 8
Zebra striping 5 yes = 1; no = 0; NA = 8
Different road surface or paving (e.g. tiles, colored concrete, marble,
etc) 6
yes = 1; no = 0; NA = 8
Other 7 yes = 1; no = 0; NA = 8
3. Are there curb cuts at all places where crossing is expected to
occur? Mark N/A if there are no intended places to cross.8 all = 2; some = 1; none = 0; NA = 8
4. What type of traffic/pedestrian signal(s)/system(s) is/are provided?
Mark all that apply.
Traffic signal 9 yes = 1; no = 0
Stop sign 10 yes = 1; no = 0
Yield sign 11 yes = 1; no = 0
Pedestrian activated signal 12 yes = 1; no = 0
Pedestrian crossing sign 13 yes = 1; no = 0
Pedestrian overpass/underpass/bridge 14 yes = 1; no = 0
5. For an individual who is on this segment, how safe (traffic wise) do
you think it is to cross the street from this segment? 15
pretty/very safe = 1;
not very safe/ unsafe = 0; cul de sac = 8
6. For an individual who is on this segment, how convenient (traffic
wise) do you think it is to cross the street from this segment?
16
pretty/very convenient =1;
not very/inconvenient= 0;
cul de sac = 8
Answer questions 7-11 while standing at the beginning of the segmentNeighborhood Identification
7. Does the segment have banners that identify the neighborhood? 17 some/a lot = 2; few = 1; none = 0
Street Characteristics
8a. Is this a pedestrianized street? 18 yes = 1; no = 0
8b. Is the street a … 19 one way = 1; two way = 2
9. Is this segment an alley? 20 yes = 1; no = 0
10. How many vehicle lanes are there for cars? (Include turning lanes).
21
six or more = 6; five = 5; four = 4;
three = 3; two = 2; one = 1;
NA (no lanes for car travel) = 8
Views
11a. Is this segment characterized by having a significant open view
of an object or scene that is not on the segment? The view must be a
prominent one. 22
yes = 1; no = 0
11b. How attractive is the open view?
23
attractive = 3; neutral = 2; unattractive =
1; NA (no views) = 8
Begin walking along segment to answer questions 12-6812a. What types of land uses are present on this area? Mark all that
apply.
Residential
Single family home - detached 24 yes = 1; no = 0
Single family home/duplex - attached (2 units or fewer) 25 yes = 1; no = 0
Town home/condo/apartment housing (3 units or more) 26 yes = 1; no = 0
Mobile homes (includes manufactured homes) 27 yes = 1; no = 0
Residential, other 28 yes = 1; no = 0

But even before the ink was dry on the IMI, I met a group of “urban brokers” – renegades – from Houston that wanted to tell the story of place, or lack of thereof in their case. They planned to rank several neighborhoods in Houston based on their sense of place. As the purported methods girl, I asked them how they planned to do that. They had no clue – they were planning to have a group of “experts” subjectively judge these places. Enter light bulb moment – so hey, I have this tool… I was forced to come up with a quick and dirty methodology – the very first version of my State of Place algorithm (which I’ll get to later) – to use the IMI to tell a story about neighborhoods' Sense of Place! We gave each of the 12 neighborhoods grades and everything. In 2005!Now I really thought I had my eureka moment…we thought this would incite these neighborhoods to think about Place, to compete on the basis on Place. But again, this was 10 years ago. Even if we had begun to define the nuts and bolts of great placesIt couldn’t just be about health. It couldn’t just be about sense of place. I STILL had to show them the money if I wanted them to consider place in the equation. I realized I had to learn a whole new language – and method. The language of real estate economics and finance. I audited a real estate development class, jumped feet first into an intense relationship with the Urban Land Institute, got countless headaches from trying to figure out all of the jargon and oh my God, the acronyms. If you think we urban planners and designers have acronyms. Wow.

As I was slowly absorbing the concepts of mezzanine finance and cap rates, I had one pivotal conversation with one of my many new real estate friends who worked for a large insurance company about how they chose which deals to invest in. He rattled off a whole bunch of jargon but none of them had to do with place. Far from it. They didn’t even know what most of these buildings actually looked like! I was floored. I made it my quest that day to measure the value of urban design – to truly use methods to feed my place addiction – no actually, to convince others they should feed my place addiction.


And then came Brookings! I finally had the opportunity to truly tie built environment features not just to walking, health, sense of place and community, but to economic value. We gathered IMI and real estate data from over 60 neighborhoods in the Washington DC Metro area that were sampled from over 240 neighborhoods along a continuum of walkability, from the auto-dominated exurbs to the highly walkable core. A meta-analyses examining the results of dozens of studies evaluating the relationship between the built environment and walking guided the development of the first official State of Place algorithm – finally! I created a comprehensive index, ranging from 0 to 100, to make sense out of the 162 data points we were gathering with the IMI. I’ll go into that more in just a little bit, but first the real Eureka moment:
BR
OO
KIN
GS
| May 2
012
4
Figure 1. Neighborhoods Included in Study and their Walkability Scores
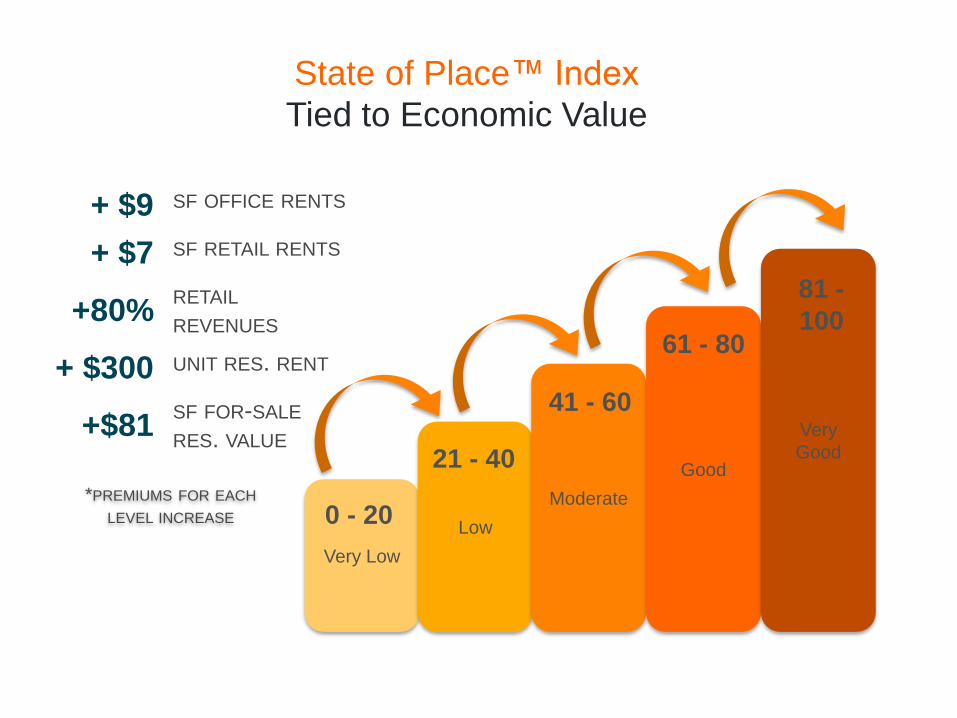
Very Low
State of Place™ Index
Tied to Economic Value
0 - 20Low
Moderate
Good
Very
Good21 - 40
41 - 60
61 - 80
81 -
100
*PREMIUMS FOR EACH
LEVEL INCREASE
+ $9 SF OFFICE RENTS
+ $7 SF RETAIL RENTS
+80% RETAIL
REVENUES
+ $300 UNIT RES. RENT
+$81SF FOR-SALE
RES. VALUE
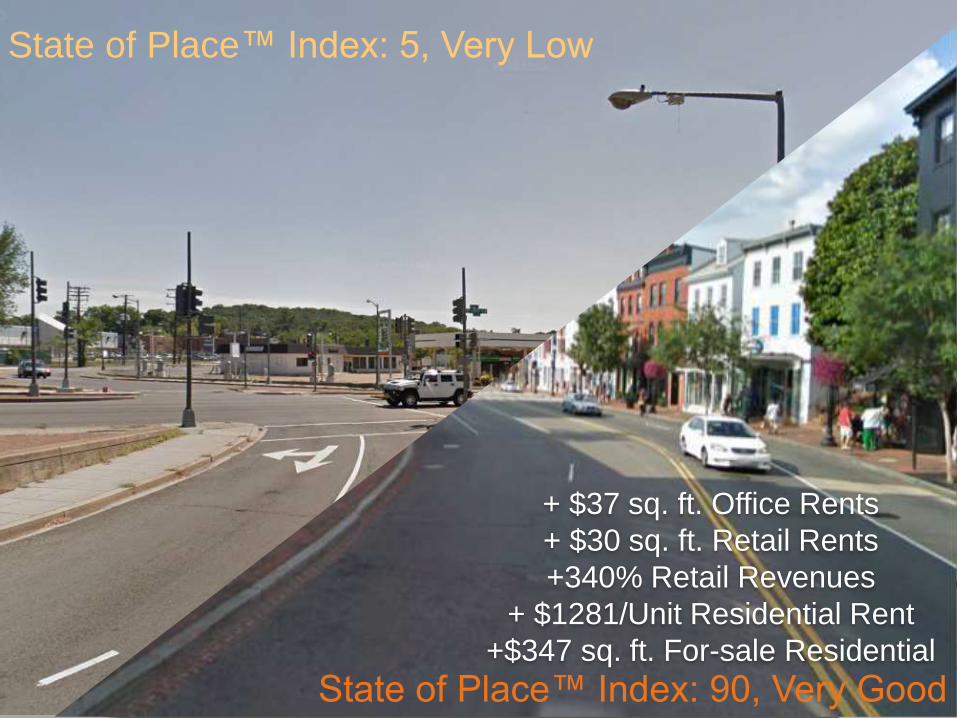
When you aggregate what that means in terms of going from the lowest to the highest level of State of Place, the numbers are quite startling.
+ $37 sq. ft. Office Rents
+ $30 sq. ft. Retail Rents
+340% Retail Revenues
+ $1281/Unit Residential Rent
+$347 sq. ft. For-sale Residential
State of Place™ Index: 90, Very Good
State of Place™ Index: 5, Very Low

And all in all, these premiums have serious implications for economic development in terms of retail and property tax bases
WASHINGTON, DC
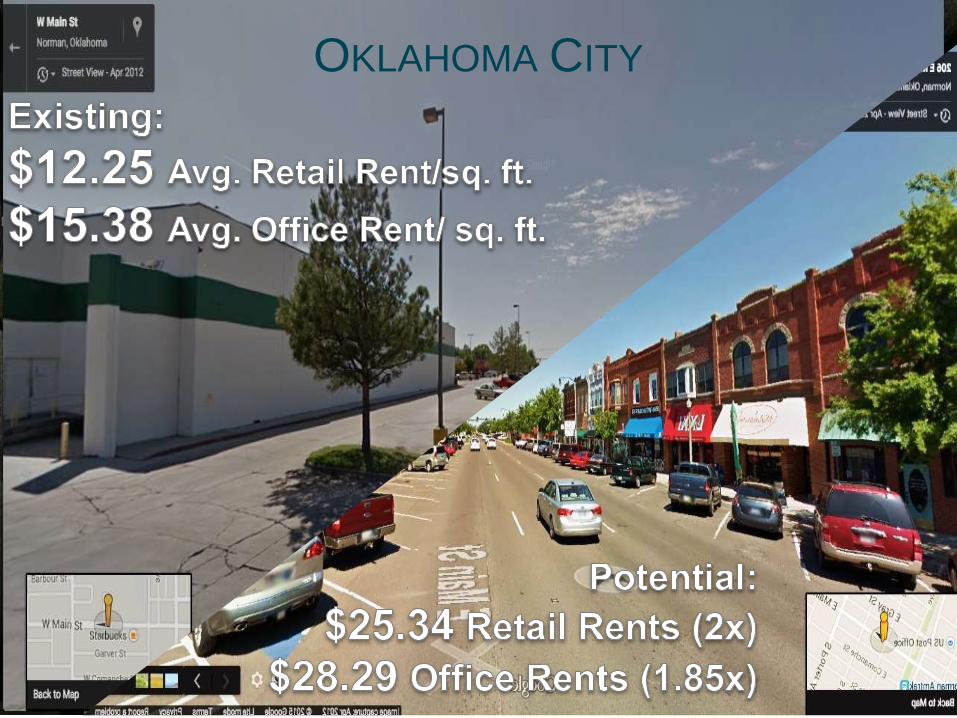
If you were to apply these numbers – in terms of magnitude of impact – relative to Oklahoma City, if it were to move up four levels, it really starts to weave a tale of why place matters. If this slide doesn’t create an objective narrative for the power of place, I’m not sure what else can.
OKLAHOMA CITY
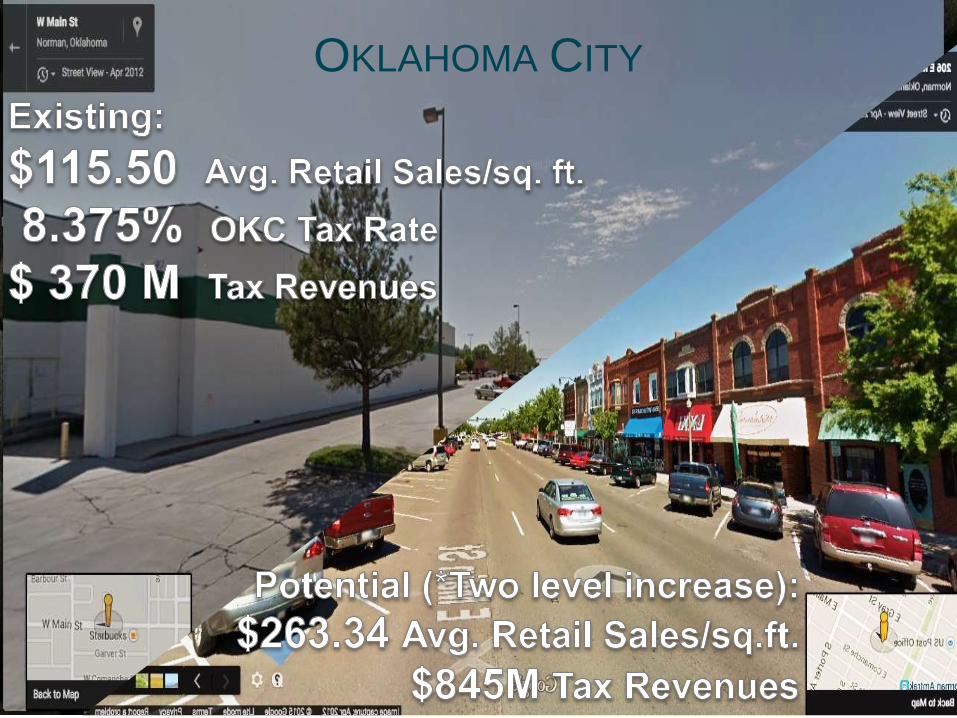
And if you extrapolate out what this means in terms of economic development, even when just talking about moving up two State of Place levels, there is considerable unlocked potential throughout this city, at least with respect to value that can be generated from the built environment.
+ $37 sq. ft. Office Rents
+ $30 sq. ft. Retail Rents
+340% Retail Revenues
+ $1281/Unit Residential Rent
+$347 sq. ft. For-sale Residential
State of Place™ Index: 90, Very Good
OKLAHOMA CITY
TM
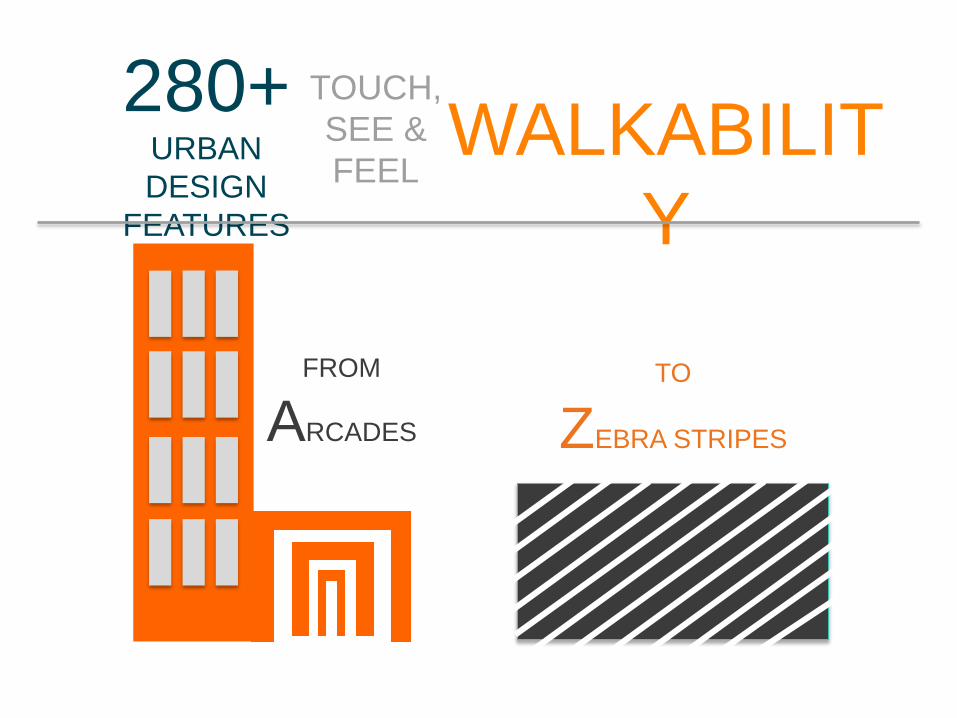
280+URBAN
DESIGN
FEATURES
TOUCH,
SEE &
FEELWALKABILIT
Y
FROM
ARCADES
TO
ZEBRA STRIPES

TRAINING
VIDEO
+
INTERACTIVE
QUIZ
TRAINED COMMUNITY
MEMBERS OR STAFF
COLLECT DATA
MINUTES/B
L O C K
10-15
STATE OF
PLACE APP
SEAMLESSLY
TRANSFERS
DATA TO
SERVERS

0% 20% 40% 60% 80% 100%
DENSITY
FORM
CONNECTIVIT
YPROXIMITY
PARKS & PUBLIC
SPACES
RECREATIONAL FACILITIES
PEDESTRIAN & BIKE
AMENITIESTRAFFIC SAFETY
AESTHETICS
PERSONAL SAFETY
URBAN
FABRIC
DESTINATIONS
HUMAN
NEEDS &
COMFORT
LIVELINESS &
UPKEEP
STATE OF PLACE™ INDEX & PROFILE
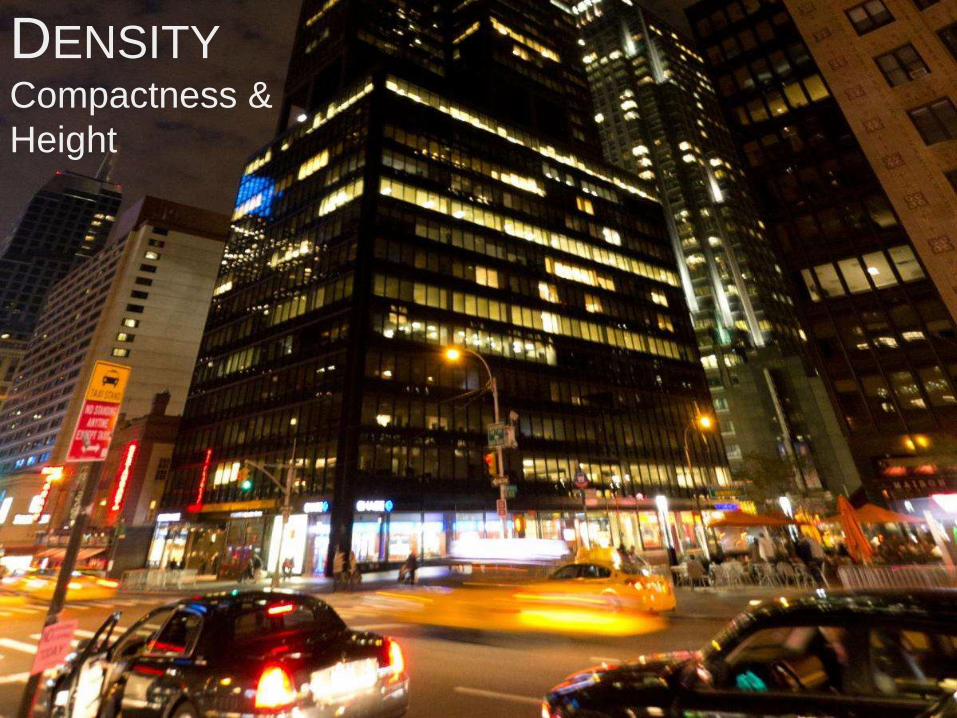
For Density, we are measuring building compactness and height, not so much population density – this is particularly important in terms of making it feasible to have enough destinations to walk to within a reasonable walking distance. It can also influence the scale of city – is it for cars or people?
DENSITYCompactness &
Height
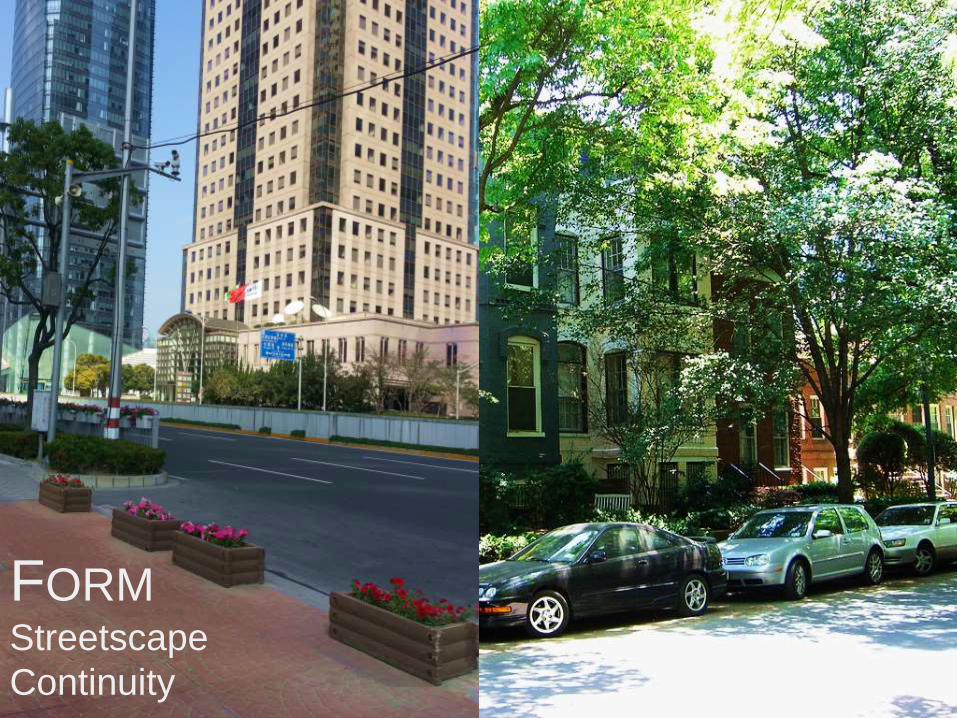
Related to that is Urban Form. Here we are measuring streetscape continuity, so we take into account building setbacks, how the building meets the street, the siting of buildings, and the number and width of buildings. This is what I like to call the hugability of a street. If the form is off, a street can feel aloof or it can feel suffocating. You know you’ve achieved the right proportions of setbacks, street width, and building height when it feels like the street is hugging you.
FORMStreetscape
Continuity

CONNECTIVITYAccess &
Barriers

Proximity refers to the diversity of the land use mix – the number of non-residential land uses there are to walk to. So literally, how many of your daily needs, services, and amenities are present within a certain distance of you
PROXIMITYLand Use Mix
Photo Credit Nakeva Corothers

With parks and public spaces, we include the presence hard and soft scape public spaces, as well as their quality and accessibility. These are often the soul and life of neighborhoods, they are the city’s living rooms. Along with museums and monuments, these are the places you bring your friends and families to when they come visit. I can tell a lot about a city based on how people use their public spaces.
PARKS & PUBLIC
SPACESPresence, Quality & Access
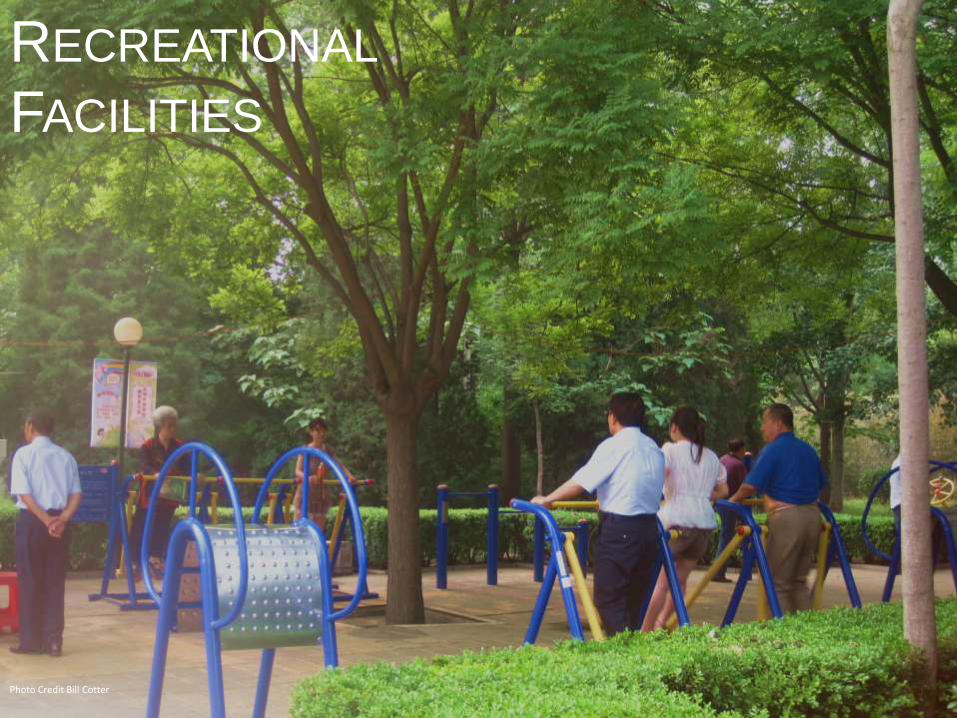
We also look at recreational facilities –separately. This is getting a bit more at recreational walking, but the literature found this to be an important determinant for physical activity, so we measure the presence of outdoor and indoor physical activity facilities.
RECREATIONAL
FACILITIES
Photo Credit Bill Cotter

Pedestrian and bike amenities refer to aspects of the built environment that make it comfortable or pleasant to be a pedestrian, so sidewalk presence and quality, seating, bike lane presence and type, street trees, etc. Along with form, these are the features that truly help distinguish car-focused neighborhoods from people-first places – they are the things that make you want to linger…
PEDESTRIA
N
& BIKE
AMENITIES

Along with that, we look at traffic safety. Here we are mainly focusing on the quality and safety of the intersection as well as the presence of traffic calming features. These include the presence of curbcuts, crosswalk markings, traffic standards, and on-street parking. These are the features that help manage all of the mobile members of the public realm – people, strollers, bicyclists, scooters, cars, and buses.
TRAFFIC
SAFETY

Aesthetics goes beyond the visually pleasing; it also includes aspects of urban design that make places more dynamic and inviting. We look at the transparency of buildings, colors, outdoor dining, street trees, building maintenance, ground floor uses, etc. This is charm, character, the wow factor – the things you’ll most remember about places.
AESTHETIC
SLiveliness &
maintenance

Finally, personal safety refers not to actual crime data but rather the aspects of the built environment that influence our perception of safety – these are called physical incivilities and include features like graffiti, litter, broken windows, abandoned buildings and lighting. These features actually influence walking rates more than the rates of crime incidents.
PERSONAL
SAFETY

So what does all of this mean for Oklahoma?How can these methods, this amount of definition, actually be weaved into a data-driven story that will help enhance your State of Place?
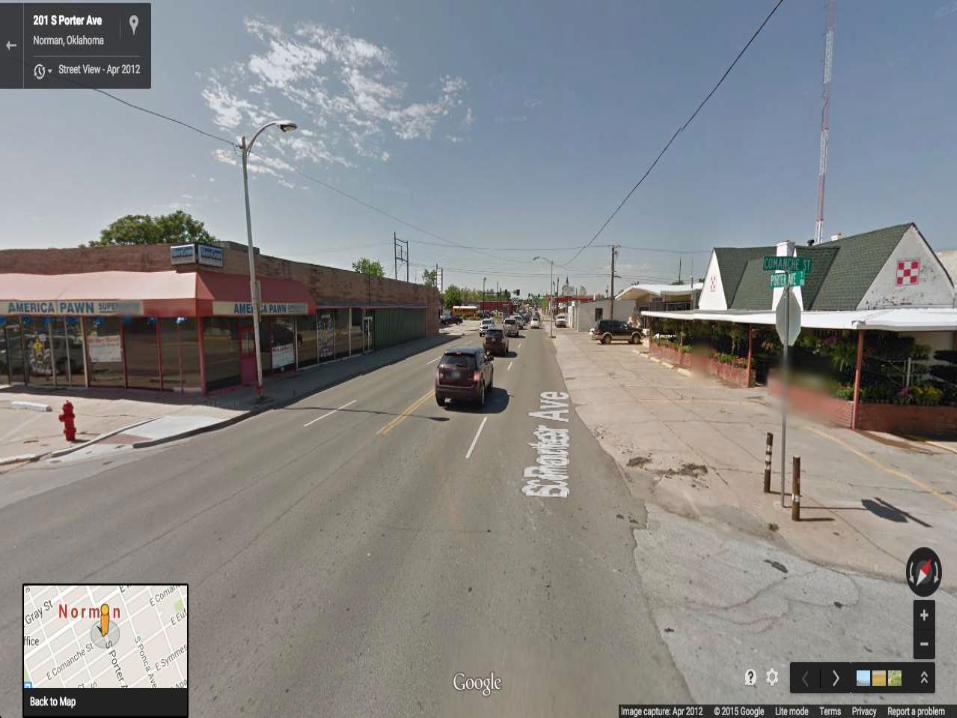
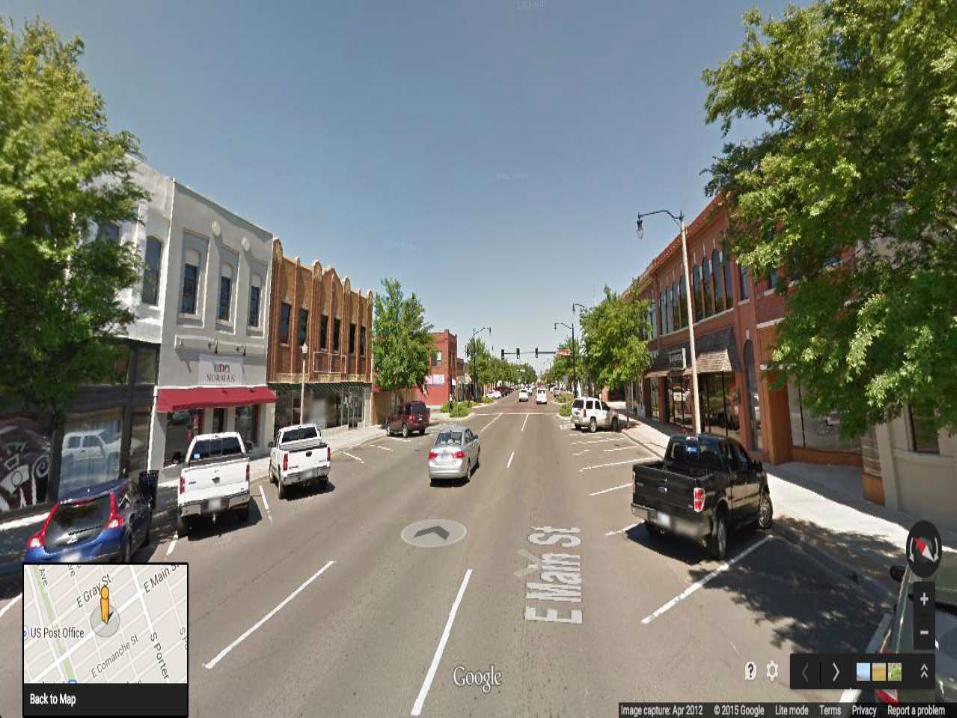
When you look at a street like this in Norman, where do you start? How do you convince others to want to start? How can you use methods to feed your place addition?

Identify Priorities
State of Place Index
State of Place Profiles
Scenario Analysis
Run Analytics

Platform conducts “multi-criterion assessment” to
identify top priorities.
Example, Walkability as a Goal:
Dimension Performanc
e
Ranking for Goal
(Walkability)
Impact* Feasibilit
y
Communit
y
Score
Density 76.5 9 .432 1 4.3 91.4
Form 65.4 9 .543 1 7.1 169.1
Connectivity 55.8 9 .342 1 6.3 136.0
Proximity 74.3 9 .765 2 9.5 353.9
Parks & Public Spaces 23.5 9 .634 2 7.4873.0
Recreational Facilities 13.4 9 .548 2 5.7854.2
Pedestrian Amenities 55.4 9 .813 3 8.6979.0
Traffic Safety 43.1 9 .745 3 8.8 1144.5
Aesthetics 58.4 9 .436 4 7.5 962.3
Personal Safety 71.3 9 .512 4 9.3 529.0
*Impact scores listed here are for explanatory purposes only;
the actual impact scores are proprietary.
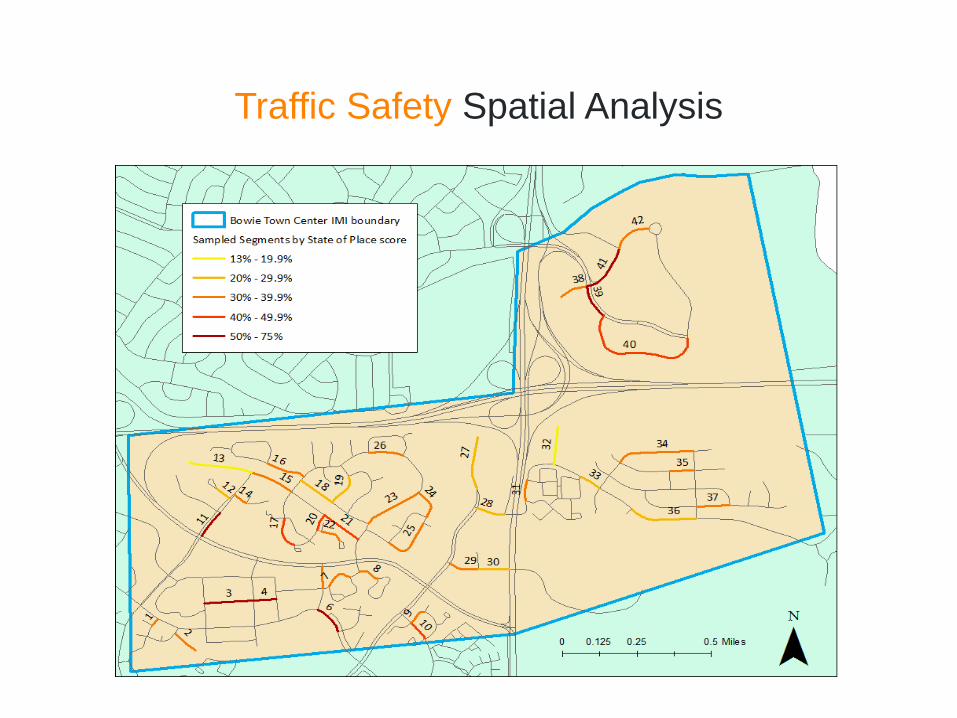
Here we can see then see how any dimension, in this case Traffic Safety which came out on top as a priority, parses out within the study area.
Traffic Safety Spatial Analysis

Identify Priorities
State of Place Index
State of Place Profiles
Scenario Analysis
Run Analytics
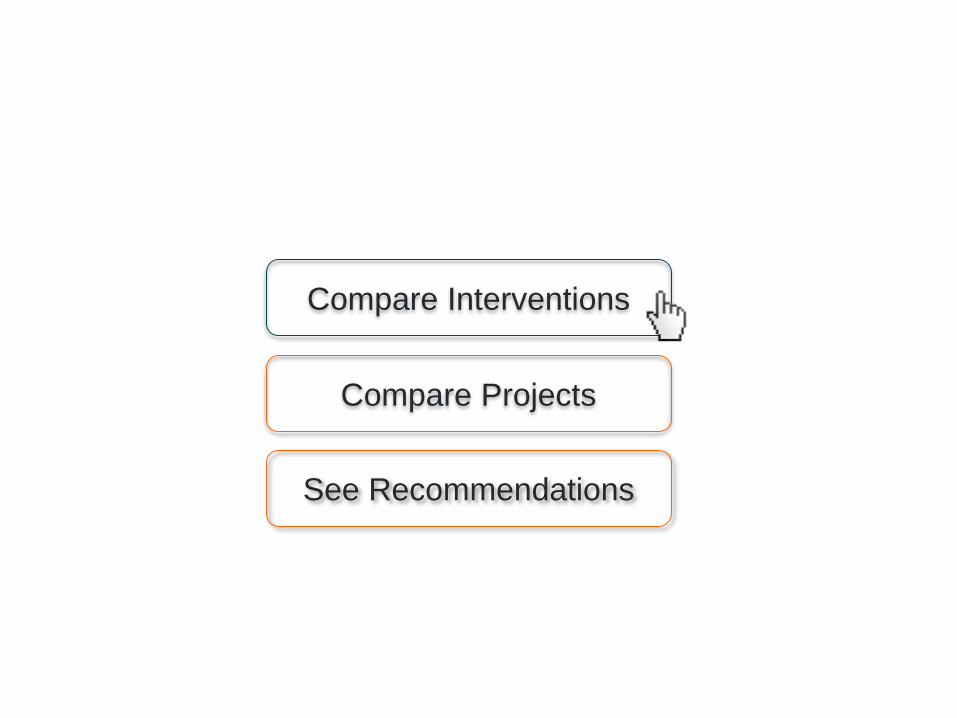
Compare Interventions
See Recommendations
Compare Projects

Choose Up To Three Dimensions To Compare
Density
Form
Connectivity
Proximity
Parks & Public Spaces
Recreational Facilities
Pedestrian & Bicyclist Amenities
Traffic Safety
Aesthetics
Personal Safety
✓
✓
✓

Parks &
Public Spaces
$80,000
Pedestrian & Bicyclist
Amenities
Traffic
Safety
Add Park
Add Plaza
New PlazaPark Maintenance
Arcades
Benches
Sidewalk Buffers
Street Trees
Sidewalk Buffers
Crosswalks
Curbcuts
Midblock Crossing
Pedestrian Countdown
CurbCuts
Enter Project Cost Enter Project Cost
Select Interventions

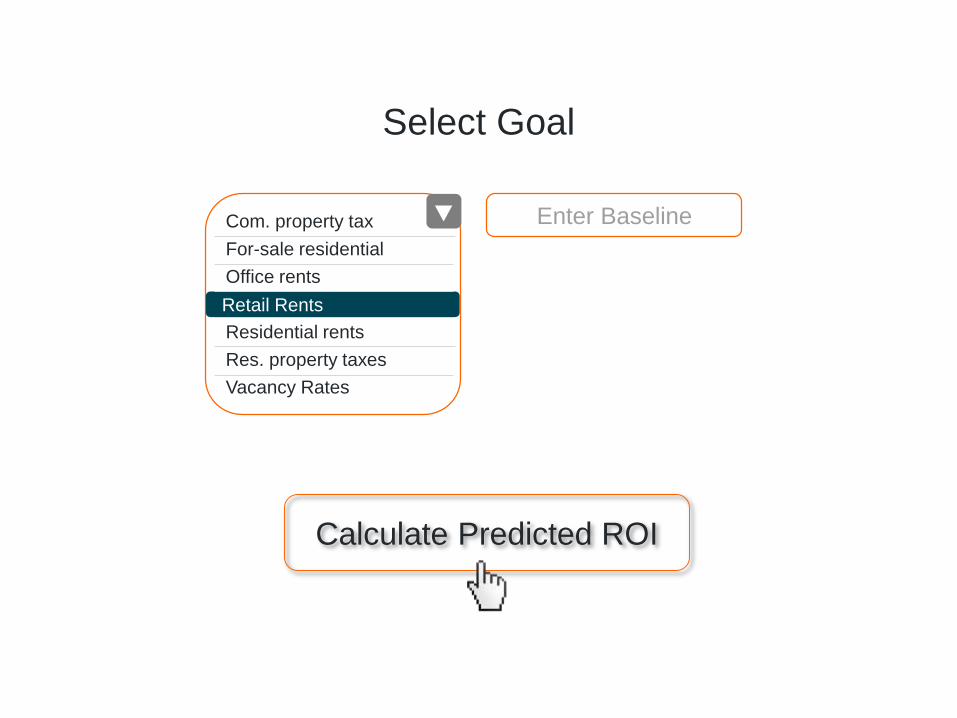
Com. property tax
For-sale residential
Office rents
Retail rents
Residential rents
Res. property taxes
Vacancy Rates
Retail Rents
Enter Baseline
Select Goal
Calculate Predicted ROI

Parks &
Public Spaces
$80,000
Pedestrian & Bicyclist
Amenities
Traffic
Safety
$300,000 $150,000
$1.09/sf $0.89/sf
Park Maintenance Sidewalk Buffers Curbcuts
$1.43/sf
Predicted ROI: Retail Rents
+4.3% +3.1% +3.7%
Impact on State of Place Index

Compare Interventions
See Recommendations
Compare Projects

Enter Project Cost Enter Project Cost
Enter Project Information
Neighborhood 1
$1,800,000
Neighborhood 1 Neighborhood 1
Project 1 Project 2 Project 3
Com. property tax
For-sale residential
Office rents
Retail rents
Residential rents
Res. property taxes
Vacancy Rates
Retail Rents
Enter Baseline
Select Goal
Calculate Predicted ROI

Neighborhood 1
$1,800,000
Neighborhood 1 Neighborhood 1
$2,700,000 $2,300,000
$1.43/sf $0.99/sf
Project 1 Project 2 Project 3
$1.56/sf
Predicted ROI: Retail Rents
+6.0% +2.0% +11.0%
Impact on State of Place Index
Map It

We are doing this currently for one of our clients who is managing a $30M equity fund focusing on underserved neighborhoods in Boston. They are using State of Place to help identify which development projects will have the most impact on Place – and ultimately informing which ones they will fund.
Predicted ROI Impact of Proposed Projects
We could do the same for this scenario…and create a data-driven story to make the case for place…

The good news is that if my hometown, Meeyamee, finally has begun to figure this out, so can Oklahoma City, believe me!
