deferred revenues and the matching of revenues and expenses
TRANSCRIPT
1
Deferred Revenues and the Matching of Revenues and Expenses
Rachna PrakashMason School of Business
College of William and MaryP.O.Box 8795
Williamsburg, VA 23187-8795(757) 221-2696
Nishi Sinha*Graduate School of Management
Boston University595 Commonwealth Avenue
Boston, MA 02215(617) [email protected]
*Corresponding Author
August 15, 2009
Abstract: Revenue deferrals, when combined with significant indirect costs and/or immediate expensingof investment expenditures, exacerbate the mismatch in the timing of revenue and expense recognition.As a result of the increased mismatch, small changes in the deferred revenue liability can have adisproportionately large impact on future profitability and can make current margins poor predictors offuture margins. One outcome of this increased complexity in predicting earnings is that neither investorsnor analysts are able to fully incorporate the future performance implications of changes in the deferredrevenue liability. The analysis shows that such changes are associated with mis-priced securities andsignificant errors in analyst forecasts.
JEL: M41, M44, G14Keywords: Revenue Recognition, Deferred Revenues, Matching, Mispricing, Analyst Forecasts
This paper has benefited from the comments of Ana Albuquerque, Clayton Forester, Pete Lisowsky,Krish Menon, Moshe Hagigi, George Papadakis and conference participants at the 2008 NortheastAmerican Accounting Association meetings, the 2009 MidAtlantic AAA meetings, the 2009 AmericanAccounting Association annual meetings and at Boston University and College of William and Mary.

1
Deferred Revenues and the Matching of Revenues and Expenses
1. Introduction
In many business arrangements firms enter into complex contracts with customers that require
performance obligations over a protracted period of time. In such arrangements firms may collect cash
from customers in advance, prior to fulfilling all elements of the contract, thus giving rise to a "deferred
revenue" liability. If firms defer the recognition of revenue without deferring the recognition of
associated expenses, the consequent mismatch of revenue and expenses affects reported margins in
current and in future periods. This study provides evidence that changes in the current deferred revenue
liability (ΔDRC) have a disproportionately large impact on future profit margins and that such changes
make current profit margins poor predictors of future margins. As a result of this increased complexity,
neither stock prices nor analysts’ forecasts fully incorporate the future-performance implications of
changes in the current deferred revenue liability. The market’s mis-pricing of ΔDRC is reflected in
significant future abnormal returns to a hedge strategy based on the magnitude of ΔDRC. Analysts’
limited understanding of the implications of changes in revenue deferrals is reflected in forecast errors for
both sales as well as for the margin on those sales.
A combination of factors, including recent changes in business practices and regulation, has led to
an increase in the prevalence and prominence of the deferred revenue liability on corporate balance
sheets.1 Despite this prominence, both anecdotal and research evidence suggests that there is considerable
uncertainty about revenue recognition in general and deferred revenues in particular. Numerous articles in
the business press suggest that the market ignores the implications of deferred revenue in forecasting and
1 In year 2000 Compustat showed only 122 non-financial and non-utility firms (of a total of 7,202) that
reported non-zero (current or long-term) deferred revenue balances. This number increased to 1,584 in2001 and to 2,121 in 2002 which represents 23% and 34%, respectively, of all non-financial Compustatfirms. Since 2002 nearly roughly 38% of Compustat non-financial firms have reported non-zerodeferred revenue amounts on their balance sheets every year. The total deferred revenue liability hasaveraged about 21% of sales revenue annually for those firms that report deferred revenue.

2
valuation exercises.2 There is also some evidence to suggest a degree of uncertainty amongst
practitioners as to what constitutes deferred revenue. Sondhi and Taub's (2006) authoritative book on
revenue recognition notes (page 11.39) "accounting guidance on the classification of cash received in
advance of revenue recognition (deferred revenue) is still somewhat scarce. … [N]o literature actually
describes what liabilities actually qualify as deferred revenue." The accounting firm Ernst and Young
states, “… restatements resulting either from the misapplication of revenue recognition principles or the
improper allocation of arrangement consideration to the elements in a multiple element arrangement are
becoming more common among technology companies."3
If revenues are deferred but some of the associated expenses are recognized as incurred, revenue
deferrals will have a negative impact on profit margins in the year of the deferral (when cash is collected
and some expenses, but not revenue, are recognized) and a positive impact on margins in subsequent
year/s when the previously-deferred revenue (without some of the associated expenses) is eventually
recognized. Consistent with this, the first set of tests shows that changes in the current deferred revenue
liability (ΔDRC) are strongly positively correlated with year-ahead profit margins and changes in profit
margin. The economic magnitude of this association is quite substantial; in our sample a 1% change in
ΔDRC, on average, leads to a nearly 20% change in year-ahead profit margins. Additional tests also
show that ΔDRC has an adverse impact on the persistence of margins. That is, current margins are a poor
predictor of future margins in firms with significant changes in the deferred revenue liability. These
results are robust to controls for other factors that prior literature has shown to affect future profitability.
These factors include current profitability, total accruals and its components (Richardson, Sloan, Soliman,
and Tuna, 2005, Soliman, 2008) as well as changes in the “conservatism index” as constructed by
Penman and Zhang (2002).
2 For instance, in a Fortune article (February 11, 2008), Elmer-Dewitt argues that investors and analysts
are largely ignoring the effects of deferred revenues on Apple’s future performance. Apple's deferral ofiPhone revenues has resulted in a deferred revenue liability of “$1.4 billions on its [2007] balance sheetto be recognized over 7 quarters, a revenue bomb that could explode to the shareholders’ advantage.”
3 “Are Multiple Element Arrangements Giving You Separation Anxiety?” October 30, 2007.http://webcast.ey.com/thoughtcenter/

3
An explanation for the substantial magnitude of the profitability changes in response to changes
in the deferred revenue liability lies in the cost structure of the firms that are likely to be subject to the
revenue deferral reporting rules. These rules are especially relevant for firms in industries such as
software, pharmaceuticals and healthcare where period costs, including R&D, advertising and other
indirect costs, are a relatively high proportion of total operating costs. The median ratio of period
operating costs to total operating costs in our sample is nearly 50%. With such high period or “fixed”
costs, any change in revenue gets magnified into a proportionately larger change in reported earnings.
When the revenue change is due to revenue deferrals, this effect is further amplified due to the
exacerbated mismatch from the deferrals.4
Since small changes in the deferred revenue liability can potentially lead to relatively wide
swings in profitability, investors who miss the future performance implications of such changes may
make significant errors in predicting profitability and may be systematically surprised in future periods.
As mentioned, revenue deferrals result in depressed margins in the year of the deferral (a net increase in
the deferred revenue liability) and inflated margins in the year of recognition (a net decrease in the
deferred revenue liability). Investors who expect these current margins to persist may therefore be
positively (negatively) surprised in the year following a net deferral (net recognition).
Consistent with these predictions the results show that a hedge strategy based on ΔDRC, after
controlling for Fama-French risk factors, operating accruals and accounting conservatism, earns abnormal
returns of nearly 9% over the next year. These results are confirmed with both regression tests and
portfolio tests. Robustness tests show that the abnormal returns are not exclusively due to the presence of
small firms (as suggested by Kothari, 2001) or of outliers in the sample. The analysis is especially careful
to avoid explicit and implicit selection biases due to delistings and missing returns that introduce ex post
information in trading strategy research design (Kraft, Leone and Wasley, 2006).
4 We elaborate on this idea in Section 6.1. We use the terms “cost structure” and “operating leverage”somewhat loosely. These terms formally refer to the distinction between fixed and variable costs. Thedistinction between period and product costs and between fixed and variable costs is not perfectlyanalogous since both period and product costs may contain both fixed and variable elements.

4
We next examine if equity analysts, representing the more sophisticated market participants,
appropriately incorporate information about changes in the deferred revenue liability in their forecasts of
sales and earnings. The results first show that analysts underestimate (overestimate) future earnings as
well as revenues for firms that report increases (decreases) in the deferred revenue liability. This pattern
of forecast errors is consistent with analysts’ use of current margins and sales to forecast future values,
without sufficiently adjusting the current numbers for the impact of revenue deferrals.
Further tests establish that in ΔDRC firms, analysts estimate future earnings incorrectly not only
because their future sales estimates are in error but also because their future margin (or, equivalently,
expense) estimates are incorrect. Finally, we show that every dollar of sales forecast error is associated
with significantly greater errors in earnings forecasts in ΔDRC firms as compared to a size-and-industry
matched sample of firms that report no deferred revenue liability. This result is consistent with the idea a
change in sales that is due to a change in reveneu deferrals (and which exacerbates mismatching) has
relatively bigger earnings consequences than a change in sales due to other reasons. We elaborate on this
idea in Section 6.1
We perform a number of robustness tests to rule out alternate explanations for our results. The
predicted impact of ΔDRC on future profitability and abnormal returns is similar to the impact of
temporary changes in conservatively reported investment expenditures (such as R&D and advertising), as
documented by Penman and Zhang (2002). Further, since ΔDRC is a (negative) component of operating
accruals, the positive association between ΔDRC and future returns documented here could simply be
evidence of the more general accrual anomaly phenomenon which, as first documented by Sloan (1996),
manifests as a systematic negative relationship between accruals and future returns. We rule out these
alternate explanations by including appropriate controls for conservatism and for accruals in our tests as
well as with additional robustness tests.
The results of this study add to the growing literature on revenue recognition and deferred
revenue. Recent research on revenue recognition shows that the increased deferral of revenue created by

5
SAB 101 and the AICPA's SOP97-2 (described below) has led to a reduction in earnings informativeness
(Altamuro, Weber and Beatty, 2005 and Srivastava, 2008). Our results corroborate these findings and
suggest that the reduced informativeness of earnings may partly be due to an exacerbation of the
mismatch in the timing of revenues and expense recognition. The results of this study also contribute to
the literature on revenue and expense matching. Dichev and Tang (2008) document a clear trend of
increasingly weaker accounting matching over the past four decades. This study highlights one specific
practice, namely, revenue deferrals, that may have contributed to this increased mismatch in recent years.
Finally, the results of this study may be of interest to the FASB and the IASB as they jointly work
towards developing a comprehensive revenue recognition standard. Recent revenue recognition standards
such as SOP 97-2 and SAB 101/104 were promulgated to deter premature recognition of revenue and to
improve earnings quality by making revenue recognition more consistent with the earnings generating
process. The results of this study suggest that these regulations may have inadvertently weakened one
aspect of earnings quality, namely, predictability, by exacerbating the mismatch in the timing of revenue
and expense recognition. In Section 7 we discuss the relevance of our findings to the revenue recognition
model proposed by the FASB/IASB in the December 2008 Preliminary Views document.
The rest of the paper is organized as follows. Section 2 provides background information on
deferred revenue and related revenue recognition standards. Section 3 identifies the research questions;
sample selection and data are described in Section 4. Research design and results are presented in Section
5. Section 6 discusses alternative explanations and sensitivity analyses. Section 7 concludes the paper by
summarizing our findings and their relevance to the new revenue recognition model being jointly
considered by the FASB and the IASB.
2. Background
2.1 The Nature of Deferred Revenue
Over time firms’ contractual obligations to customers have become more complex and reporting
challenges related to revenue recognition have, accordingly, multiplied. Sales arrangements often include

6
contracts with customers that require performance obligations over a protracted period of time. In such
arrangements firms may collect cash from customers in advance, prior to fulfilling all elements of the
contract, thus giving rise to a deferred revenue liability. For instance, software firms sell products that
entitle the customer to receive service and upgrades several years into the future while biotech firms
collect licensing fees for licenses that the customers will use over an extended period of time.
For many firms the prominence of transactions that result in revenue deferrals, and the impact
that revenue deferrals have on reported numbers, has increased significantly in recent years. For instance,
in fiscal year 2008 Apple Inc.’s total deferred revenue liability was a substantial 24% of the $32.5 billion
of reported sales. In terms of impact of the deferrals on reported numbers, in the third quarter of fiscal
2009 Apple’s reported revenue and net income of $8.34 billion and $1.23 billion, respectively. After
undoing the impact of revenue deferrals on sales and costs, the corresponding non-GAAP measures were
a substantially higher $9.74 billion of “Adjusted Sales” and $1.94 billion of “Adjusted Net Income.”
While the prevalence of complex, multiple-element contracts is growing, guidance on reporting
remains incomplete and somewhat opaque. As evidence of the lack of clarity on this issue, consider the
following report from CFO Magazine:
NEC Gives Up Over Revenue Recognition (September 21, 2007)
NEC Corp. says it is stumped by U.S. accounting rules for revenue recognition and has given uptrying to comply with them. The Japanese electronics giant says it realizes this will likely lead tothe delisting of its ADR shares on Nasdaq. It also says it will not be able to file its 2006 annualreport under U.S. GAAP, and that it cannot vouch for its financial statements since 2000. … Undera GAAP standard called SOP 97-2, companies wishing to recognize the software-sales revenue upfront must perform an analysis of such contracts that provides "vendor-specific objective evidence"of consistent treatment of sales and service. That analysis, which NEC says it has been unable tocomplete, is required before portions of revenue from a single contract can be broken out andrecognized at different times.
2.2 Revenue Recognition Standards and their Impact
The basic revenue recognition criteria for US firms are encapsulated in Statement of Financial
Accounting Concepts No. 5 (SFAC No.5). Two standards, SOP97-2 and SAB 104, which revised and
rescinded SAB 101, currently provide more specific guidance on revenue recognition practices. In 1997
the AICPA promulgated SOP97-2 in response to the idea that software firms were recognizing revenue

7
prematurely. SOP 97-2 sought to improve software firms’ earnings reliability by requiring such firms to
defer revenues when they cannot objectively and verifiably determine the extent of completion of the
earnings process. In effect, it required software firms to defer a portion of their revenues corresponding
to the undelivered elements of a multiple-element contract. For example, SOP 97-2 introduced the vendor
specific objective evidence (VSOE) condition that requires that a firm should first establish the fair value
of each element of the contract based solely on the firm’s own pricing records. If a firm cannot establish
fair value of even one element, it may have to defer recognition of all revenues from the contract.
Srivastava (2008) finds that the implementation of SOP 97-2 led to additional revenue deferrals
and a decline in earnings informativeness for the affected software firms. His tests show that in the year
after implementation the market priced the SOP 97-2 deferrals (which are reported as current liabilities on
the balance sheet) as revenues rather than as a current liability. Overall, his results suggest that there was
no premature recognition prior to SOP97-2 and that forcing firms to defer the recognition was
inappropriate because it artificially delayed recognition.
In 2000 the SEC issued SAB 101, also in response to the concern that some firms were
inappropriately accelerating revenue recognition. SAB 101 was implemented in 2001 and applied to
industries other than the software industry. It consolidated several industry-specific standards related to
revenue recognition in multiple element contracts, such as those related to licensing arrangements, setup
services and upfront fees. As a result, subsequent to 2001 several non-software firms also started
reporting deferred revenue liability on their balance sheets.5
Altamuro et al (2005) examine a sample of firms that were required to adjust their earnings
estimates in response to SAB 101. As compared to a matched sample, the SAB 101 firms showed greater
evidence of earnings management prior to the adoption of SAB 101. Further, the association between
earnings and future cash flows, as well as between announcement period returns and unexpected earnings, 5 Unlike SOP 97-2, most of the SAB 101 implementation effects arise from delivery-based revenue-
recognition requirements, rather than from its multiple-element rules (Moffeit and Eikner, 2003). Forexample, because SAB 101 requires licensing and research fees to be recognized over the contractedperiod rather than upfront, the pharmaceutical industry is among the industries most affected by SAB101 even though pharmaceutical firms do not assume significant multiple-element obligations.

8
declines in the post-adoption period. The evidence supports the notion that SAB 101 curtailed firms'
discretion in accelerating revenue recognition in order to meet earnings targets, but that this curtailment
led to earnings that are less informative about returns and future cash flows.
In December 2003 SEC issued SAB 104 which updated and revised the guidance provided in
SAB 101, Topic 13. The principal revisions related to the rescission of material no longer necessary
because of private sector developments in U.S. GAAP.
Controversy over these reporting requirements continues as the FASB and the IASB deliberate a
comprehensive new revenue recognition standard. The Revenue Recognition project, initiated in 2002,
aims to "develop coherent conceptual guidance on revenue recognition and a comprehensive Statement on
revenue recognition based on those concepts." In December 2008, the FASB, jointly with the IASB,
issued a Preliminary Views document on a comprehensive new revenue recognition model. We briefly
discuss this model in the concluding section of this paper.
A re-evaluation of revenue recognition standards stems partly from the conflict between SFAC
No. 5 and SFAC No. 6 (‘Elements of Financial Statements’). Transactions that give rise to revenue
deferrals do not meet revenue recognition criteria specified under SFAC No. 5, and are thus treated as
deferred revenue liability. However, they also do not meet the definition of a liability as laid down in
SFAC No. 6 since there may not be a future obligation attached to them (FASAC, 2002).
3. Hypothesis Development
Current reporting regulations require firms to defer revenues when they cannot objectively and
verifiably determine the extent of completion of the earnings process. In effect, firms are required to
defer a portion of their revenues corresponding to the undelivered elements of a multiple-element
contract. These regulations result in revenues from certain types of contracts, for example non-refundable
licensing and research fees, to be recognized over the contracted period rather than upfront. One outcome
of such deferrals, especially in combination with substantial period costs, is an exacerbation of the
mismatch in the timing of revenues and expense recognition.

9
Dichev and Tang (2008) note that poor matching can arise for several reasons including,
“unavoidable business factors (e.g., fixed costs, poor traceability of costs), managerial discretion (e.g.,
taking a big bath), and accounting rules (e.g., R&D is required to be expensed regardless of traceability).”
A number of these factors, including firms’ inability to correctly apportion indirect costs to different
elements of a contract or to different products, result in some of the expenses being recognized prior to
the recognition of resulting revenues. Revenue deferrals further exacerbate this tendency for expenses to
lead revenues. When revenues are deferred firms may, at best, be able to defer only the associated
product costs, leaving behind all the period expenses, including selling and marketing costs. For instance,
an excerpt from Apple Inc.'s July 21, 2009 press release notes the following when describing the
accounting treatment for revenues from its iPhone and AppleTV product lines:
This accounting treatment, referred to as subscription accounting, results in the deferralof almost all of the revenue and cost of goods during the quarter in which the products are sold tothe customer. Other costs related to these products, including costs for engineering, sales,marketing and warranty, are expensed as incurred. Further, the costs to develop any futureunspecified features and additional software products that may eventually be provided tocustomers also are expensed as incurred.
Other firms have also expressed concern about the impact of revenue deferral rules on the
matching of revenues and expenses. For instance, in a comment letter to the AICPA during the SOP97-2
deliberation process Lucent Technologies noted that "Bulk of costs will already have been expensed …
while revenue will not be recognized until all elements are delivered … this could be a departure from
matching principle and could be very misleading."6
If revenue deferrals result in revenues being recognized later than associated expenses, changes in
deferred revenue liability will be systematically related to future changes in profitability. A net increase in
the current deferred revenue liability (that is, a net deferral of revenue) will depress current period’s
margins as some expenses without the associated revenue are recognized. In the subsequent period, as the
previously-deferred revenues without many of the associated expenses are recognized, profit margins will
be positively affected. Combined, this suggests that a net increase in the current deferred revenue
6 As noted in Appendix A of Srivastava (2008).
10
liability, ceteris paribus, will have a positive impact on margins next year. Similarly, a net decrease in the
deferred revenue liability (that is, a net recognition of previously-deferred revenue) will positively affect
profit margins in the year of the decrease but these inflated margins, ceteris paribus, will not persist into
the next period. Overall, this pattern of revenue and expense recognition suggests a systematic positive
correlation between changes in deferred revenue liability and future profit margins.
This mismatch in the timing of revenue and expense recognition also suggests that current
margins may not be a good predictor of future margins in the presence of substantial changes in the
deferred revenue liability. This argument is similar to the one tested by Penman and Zhang (2002) who
show that temporary changes in certain investment expenditures, in combination with the conservative
accounting (immediate expensing) of those investments, makes current earnings a poor predictor of future
earnings.
The above discussion on mismatching and profitability leads to two testable implications, which
are summarized in the following alternative hypotheses.
Hypothesis 1: Changes in the deferred revenue liability are positively associated with future
profit margins.
Hypothesis 2: Changes in the deferred revenue liability adversely affect the persistence of profit
margins.
If market participants do not fully appreciate the future performance implications of ΔDRC, their
errors will be reflected in stock prices and analyst forecasts. Addressing first the issue of stock prices, if
investors use current margins to predict future profitability and neglect to take the impact of ΔDRC into
account, they will be systematically surprised in the next period. As noted, revenue deferrals result in
depressed margins in the year of the deferral (a net increase in the deferred revenue liability) and inflated
margins in the year of recognition (a net decrease in the deferred revenue liability). Investors that expect
these current margins to persist may be positively (negatively) surprised in the year after a net deferral
(recognition). Overall, this suggests a positive correlation between changes in current deferred revenue
liability and abnormal returns over the subsequent year. The above discussion is summarized in the

11
following alternative hypothesis:
Hypothesis 3: Changes in the deferred revenue liability are positively associated with future
abnormal returns.
An alternative set of explanations for such a positive correlation can be found in the accrual
anomaly literature (e.g., Sloan, 1996, Fairfield et al, 2003) and in the accounting conservatism literature
(Penman and Zhang, 2002). We control for these factors in our analyses.
We next examine how one set of sophisticated market participants, equity analysts, incorporate
information about changes in the deferred revenue liability in their forecasts of revenues and earnings.
Since increases in the deferred revenue liability have a positive impact on future margins and sales, if
analysts do not correctly incorporate ΔDRC information they may underestimate (overestimate) future
earnings and sales for firms that report increases (decreases) in the deferred revenue liability. The extent
to which ΔDRC information is incorporated into analysts' forecasts will be reflected in forecast errors.
Accordingly, we first test the following alternative hypothesis:
Hypothesis 4: Analysts’ earnings forecast errors and sales forecast errors are positively
associated with changes in the deferred revenue liability.
In the presence of period costs ΔDRC affects not only year-ahead reported revenue but also
reported profit margins (or, equivalently, expenses). Analysts’ earnings forecast errors resulting from
changes in DRC could therefore be an outcome of three potential combinations of errors. First, since the
impact of deferrals on future revenue is somewhat obvious but the impact on future margins stems from
mismatching and is more subtle, it is possible that analysts correctly assess the impact of revenue
deferrals on future sales but not on future margins. Alternatively, it is also possible (but unlikely) that
analysts get the sales forecasts wrong but manage to forecast margins correctly. Finally, analysts could
predict both sales and margins incorrectly. To narrow down the source of errors in analysts’ earnings
forecasts we test the following hypothesis:
Hypothesis 5: Analysts’ earnings forecast errors resulting from changes in DRC are a combined
outcome of errors in predicting future revenues and the margins on those revenues.

12
If the sales forecast errors are due to changes in deferred revenues, the magnitude of the
consequent errors in forecasting earnings may be larger than if the sales forecast errors were for reasons
other than changes in the deferred revenue liability. This is because changes in revenue deferrals affect
future earnings through two distinct channels: one, they affect future sales and, two, due to increased
mismatching, they amplify the change in margins. Since these two effects reinforce each other when
revenue is deferred, the combined effect on earnings is more pronounced. In general, any change in sales
that exacerbates the mismatch in the timing of revenue and expense recognition will have a
proportionately bigger impact on earnings than a change in sales that does not alter the degree of
mismatch. This suggests that every dollar of sales forecast error that is caused by ΔDRC is likely to be
associated with bigger errors in earnings forecast than a sales forecast error caused by other reasons.
Hypothesis 6: Errors in forecasting sales will lead to greater errors in forecasting earnings if the
sales forecast error is due to ΔDRC.
The following sections provide tests for these hypotheses and attempt to rule out competing
hypotheses for the observed results. The next section describes the sample selection procedure and the
data.
4. Sample Selection and Descriptive Stats
4.1 Sample Selection
Compustat breaks the deferred revenue liability into the current component (variable name in
Compustat's new XPF files: DRC) and the long-term component (DRLT). Our tests focus mainly on the
current component of deferred revenue, DRC, since we know both the year of the deferral as well as the
year of revenue recognition for this item.
The data is from Compustat's July 2009 XPF files and CRSP files (the compna.company and
compx.funda tables) for US firms over the period 2002-2007. The sample period begins after the

13
implementation of SAB101 in 2000.7 We exclude fiscal year 2000 because that is a transition year for
firms adopting SAB 101. Year 2001 is excluded because our primary variable, ΔDRC, is a change
variable. Year 2008 is excluded because we need year-ahead returns and profitability data for our tests.
To be included in the sample, firms must have available data to calculate changes in the current
deferred revenue liability, year-ahead size-adjusted returns, size (log of average Assets), book-to-market,
operating accruals, earnings-to-price and market beta. The precise construction of these variables is
described below. In addition, observations in the financial and utilities sector and those with sales less
than $5 million or with negative stockholders’ equity or with both DRC and ΔDRC at zero were also
excluded.8 These criteria yield a sample of 6,684 firm-years (1,999 firms) for the period 2002-2007. The
requirement for availability of year-ahead profit margins reduces the sample to 6,121 observations
because, as of July 2009, Compustat data had not yet been updated fully for fiscal 2008. We provide the
descriptive statistics only for the broader (N=6,684) sample since the two samples have very similar
economic characteristics.
4.2 Variable Measurement
The primary variable of interest in this study is annual change in the current deferred revenue
liability, which is deflated by average assets (ΔDRC).9 To abstract from financing concerns, profit
margins are measured as operating income divide by sales. Future abnormal returns are denoted by
LEADSAR which represents one-year-ahead buy-and-hold returns over twelve months starting with the
fourth month after fiscal year-end, adjusted for the mean buy-and-hold return on a size-matched decile
portfolio. The sample includes firms from both NYSE/AMEX and NASDAQ stock exchanges. We use
7 The implementation of SAB 101 became mandatory no later than the fourth quarter of fiscal years
beginning after December 15, 1999, so that 2000 was the first year of implementation for most firms.8 The latter criterion effectively removes firms with two consecutive years of zero balance in their current
deferred revenue liability accounts. There are 741 observations with either zero DRCt or zero DRCt-1
(but not both) and 68 observations with zero ΔDRC in our sample. No observations have both zeroDRC and zero ΔDRC.
9 Since revenue deferrals also affect current and future sales, we scale the change in the deferred revenueliability by assets rather than by sales.

14
historical (that is, at the time the trading strategy is implemented) exchange listing to identify the
exchanges on which firms are traded.10 Size decile assignments are made using decile cutoffs calculated
separately for NYSE/CRSP and NASDAQ firms.
Returns are obtained from CRSP's monthly return files, delisting files and decile returns files.
Following the recommendation in Kraft et al (2006) we take numerous steps to avoid introducing look-
ahead selection bias in the measurement of LEADSAR.11 We do not delete observations that have
monthly returns available at the time of portfolio formation but for which monthly returns are missing for
some of the subsequent eleven months. Instead, we make the following adjustments. If a firm's monthly
return is missing with a return code of ".B" in CRSP, which indicates that the return is missing because
there is no price information on CRSP, the monthly return is set to zero. If a firm delists during the year
and delisting returns are available, we use the delisting returns in the delisting month and assume a return
equal to the return on the firm's size-matched portfolio (so that SAR is zero) in the subsequent months.
Following Shumway and Warther (1999), if the delisting return is missing and the delisting is forced (by
the exchange or the SEC) the delisting return is set to -30% for NYSE and AMEX firms and to -55% for
NASDAQ firms. If the delisting is due to liquidation the delisting return is set to –100%. Finally, if a
firm's size-portfolio assignment is missing, to size-adjust we use the value-weighted return instead of
size-matched portfolio return.
4.3 Descriptive Statistics
Although the primary variable of interest is the annual change in the current deferred revenue
liability, we first describe the magnitude of the liability itself. Table 1 Panel A shows that current 10 Kraft et al (2006) show that using the firms' current exchange listing (as given in Compustat's ZLIST
variable or CRSP's header information) in place of the historical listing introduces a predictable upwardbias in BHAR. The historical exchange listing is identified in the "EXCHCD" variable in thecrsp.stocknames tables.
11 Kraft et al (2006) show that three common sample selection biases introduce ex-post information intrading strategy research design and bias the calculation of one-year-ahead BHAR. These sampleselection choices relate to (a) the exclusion of observations that have return data at the beginning of thereturn accumulation period but have missing returns in some of the subsequent 11 months, (b) theexclusion of firms with missing t+1 earnings data and (c) an incorrect identification of exchange listingat the time the strategy is implemented.

15
deferred revenue as a percentage of sales (DRC/S) has a mean (median) value of 9.7% (3.4%). For a few
firms the relative size of this liability is quite substantial, with firms in the 90th percentile deferring over
one-quarter of their current sales. Only about a third (N=2,246) of sample observations also report
positive long-term deferred revenue; the combined total of current and long-term deferred revenue
(DRT/S) averages 14.9% (median 4.1%) of sales.
The change in the current deferred revenue liability deflated by average assets (ΔDRC) has a
mean (median) value of is 0.9% (0.3%). The average positive value of ΔDRC suggests, on average, a
growing liability. Since this variable takes on both positive and negative values, another meaningful
measure of its magnitude is its absolute value, which averages 2% of assets in the sample. In percentage
terms, the mean unsigned annual change in DRC, measured as abs(DRCt - DRCt-1)/DRCt-1, has a mean of
64% and a median of 27%.12
The mean and median sales (SALE) for firms in the sample are $1,689.9 million and $148.1
million, respectively, indicating the presence of a few large firms in the sample. The median (mean) year-
ahead operating profit margin for sample firms is 3.9% (-20.1%) of sales and mean (median) year-ahead
buy-and-hold size-adjusted returns (LEADSAR) are 1.4% (-7.1%). Untabulated analysis suggests that on
average, sample firms are larger, riskier (BETA) and have higher book-to-market ratios (BM) as
compared to the median firm in their respective 2-digit SIC industry group that year. Untabulated
statistics also show that over 75% (N= 5,220) of sample firms trade on NASDAQ.
We estimate the “period cost ratio” (PDCOST), an indicator of conservative accounting treatment
of investment expenditures and of the presence of indirect costs, as a three-year average of the ratio of
period operating costs to total operating costs. The mean and median PDCOST ratio both approximate
47% of total operating costs. A similar metric, Penman and Zhang’s conservatism score or C-score,
which measures the balance sheet impact of conservative accounting treatment of investment
expenditures, averages 0.61 in our sample as compared to 0.31 in their study.
12 The mean and median for the signed value of this percentage change variable are 36.6% and 9.3%,respectively.

16
Penman and Zhang’s (2002) Q-score measures the effect of conservative accounting on earnings.
For each firm we construct Q-score as the average of the annual change in C-score and industry-adjusted
C-score. C-score is measured as the sum of inventory reserves, research and development (R&D)
reserves, and advertising (ADV) reserves, scaled by net operating assets. Inventory reserve is the LIFO
reserve as reported on the balance sheet. R&D and ADV reserves are the estimated net values of R&D
and advertising assets that would have been on the balance sheet if R&D and advertising had not been
expensed. We amortize R&D (ADV) using sum-of-the-year’s digit method over five (two) years. The
mean (median) Q-score for our sample firms is 0.156 (0.007) compared to mean (median) of 0.099
(0.009) reported by Penman and Zhang (2002). The higher mean Q-score as well as the higher C-Score
for our sample are consistent with technology-heavy nature of the sample.13
Operating accruals are measured using the cash flow method rather than the balance sheet
method. Since ΔDRC is a part of operating accruals and we want to isolate its impact, we calculate
accruals net of the ΔDRC component. Consistent with prior research, the sample mean of adjusted
operating accruals (ACCR) is negative while the median is zero.14 The median analyst sales and earnings
forecast errors are both positive suggesting that, on average, analysts underestimate both sales and
earnings for this sample.
Table 1, Panel B shows that mean DRC has remained stable at about 6% of assets every year in
the sample, with the median declining from 3% to a little over 2%. The mean and median values of signed
and unsigned ΔDRC have also remained relatively stable over the years.
Table 1, Panel C describes the sample by a modified Fama-French 12-industry classification. We
modify the Fama-French classification by pulling out software firms (SIC code 7370-7379) from the
13 There are two other reasons for our Q and C-scores to be different from Penman and Zhang (2002).
First, the period over which they calculate the two scores is 1975-1997, compared to 2002-2007 in ourstudy. The other reason maybe that for their reported scores they amortize R&D using industrycoefficients estimated by Lev and Sougiannis (1996). However, in sensitivity analysis they also use butdo not report scores based on sum of the digits over five years to amortize R&D.
14 Since ΔDRC is a deferral, total accruals are adjusted by added back ΔDRC. Accruals scaled by averageassets, without adjusting for ΔDRC, have a median value of -0.062 in the sample.

17
original Business Equipment category (which originally included Computers, Software, and Electronic
Equipment) and putting them in a separate 13th category. Thus, we have 13 industry classifications. A
little over 25% of the sample is from the Business Equipment sector, where current DRC averages 4.5%
of assets. Another 20% of the sample is in the software industry, where current DRC averages 14.5% of
assets. The largest values of ΔDRC are in the software industry, with a mean of 2.1% of assets.
Untabulated statistics shows that industry distribution based on total deferred revenue is similar to the
distribution based on current deferred revenue and that current deferred revenue is the bigger component
of total deferred revenue in all sectors except the health sector.
Table 1, Panel D reports Pearson (Spearman) correlation coefficients above (below) the diagonal.
Since the variables in our mispricing analyses are in deciles and the Spearman and Pearson coefficients
are similar, we discuss Spearman coefficients here. Current deferred revenue (DRC/S) is not significantly
related to one-year-ahead returns, LEADSAR. However, as hypothesized, ΔDRC is positively correlated
with LEADSAR as well as with future profit margin, PM. The positive correlation between ΔDRC and
accruals, ACC, may be by construction because we have adjusted accruals by adding back ΔDRC.
5. Research Design and Results
Test of Hypothesis 1: ΔDRC and future profitability
Hypothesis 1 posits that, due to the mismatch created by revenue deferrals, changes in the
deferred revenue liability will be positively associated with future profit margins. To test the association
between one-year-ahead profit margins and ΔDRC we estimate a model that also includes total accruals
and its components as predictors. The inclusion of accruals and its components as controls is guided by
the results found in prior literature. Sloan (1996) finds that firms with higher operating accruals (ΔNOA)
relative to cash flows in their earnings tend to have lower future earnings. Richardson, et al (2005)
decompose total accruals into three components (hereafter referred to as “RSST Controls”) - changes in
working capital (ΔWC), changes in non-current assets (ΔNCO) and changes in financing (ΔFIN) - and
18
show that ΔNCO has greater explanatory power for future earnings than changes in operating accruals
(measured as ΔWC). Soliman (2008) incorporates changes in total accruals (both in the aggregate as well
as with the disaggregated components) in Fairfield and Yohn's (2001) DuPont model. To isolate the
impact of ΔDRC we calculate total accruals and working capital net of ΔDRC.
In addition to accruals, we also include current sales (level and growth) to account for any
economies of scale that may be reflected in margins as sales change. Finally, we include Q-score which
captures changes in R&D, advertising and LIFO inventory, each of which can also affect future
profitability. Since industry characteristics also affect margin predictability, Fama-French industry
dummies are included as controls in all specifications. Specifically, we estimate the following model to
test the impact of ΔDRC on year-ahead profit margins (firm identifiers are suppressed):
PMt+1 = β0 + β1 ΔDRCt + β2 PMt + β3 SALESt + β4 SALEGRt + β5 Qt+ β6 ΔNOAt
+∑γi•RSST Controlst + εt+1 (1)
Hypothesis 1 posits a positive coefficient on ΔDRC. The results are presented in Table 2.
Column 1 reports estimates of this model with ΔDRC and current profit margin as the only explanatory
variable. The coefficient on ΔDRC is positive and significant (β1 = 2.624, t-stat 5.87) suggesting that this
variable is significant in predicting year-ahead profit margins. The inclusion of additional predictors to
the regression does not change β1 significantly. The results in column 5 show that after controlling for
accrual components, conservatism, current margins and sales (levels and growth), the coefficient on
ΔDRC is 2.709 (t-stat=5.89). This translates into an elasticity (calculated at median values) of PMt+1 with
respect to ΔDRC of 0.208. That is, a 1% change in ΔDRC from its sample median is associated with a
20.8% change in PMt+1.
To ease economic interpretation, we also estimated regression (1) after replacing ΔDRCt with
DRCt/Salest. Untabulated results show that the coefficient on DRC/Sales is 0.370 (t=2.77) suggesting
that, ceteris paribus, an additional dollar of sales deferred in year t (and recognized in year t+1) is

19
associated with $0.37 of operating income in year t+1. In contrast to this high 37% operating margin on
deferred sales, the median margin on total sales is only 3.9% for the sample (median PMt+1 = 0.039).15
Other coefficient estimates in Table 2 show that, as expected, current profit margin is always
highly significant in predicting future profit margin, with the coefficient being close to one. Column (4)
shows that changes in total operating accruals (ΔNOA) have only a marginally significant impact on
future margins. When total accruals are disaggregated into their working capital, non-current and
financial components (ΔWC, ΔNCO and ΔFIN), column (5) shows that none of the components of total
operating accruals are significant in explaining future margins.
We also tested for the impact of ΔDRC on future changes in profit margins. The same five
regressions as in Table 2 were estimated with ΔPMt+1 (rather than PMt+1) as the dependent variable.
ΔDRC was significant in all specifications. The coefficient on ΔDRC was 2.139 (t=6.79) when all
predictors were included (as in column 5 in Table 2).
These tests provide significant evidence that ΔDRC is positively associated with year-ahead
margins and that the magnitude of this association is quite large – small changes in DRC can lead to
relatively large changes in year-ahead margins. Such an association is consistent with revenue deferrals
exacerbating the mismatch in the timing of revenue and expense recognition to a substantial extent.
Test of Hypothesis 2: ΔDRC and the persistence of operating margin
Hypothesis 2 predicts that current profit margins (PM) will be relatively poor predictors of future
margins for firms that report significant changes in the deferred revenue liability. To test this hypothesis,
in model (1) above we introduced an interacted variable, ΔDRCt*PMt, which captures the impact of
ΔDRC on the relationship between PMt+1 and PMt. Specifically, we estimated the following model:
15 Using the 37% estimated margin on deferred sales and given mean DRCt/Salest of 9.7% and meanSalest of $1,690 million, on average revenue deferrals contribute a substantial $163.9 million to year-ahead operating income.

20
PMit+1 = β0 + β1 ΔDRCit + β2 PMit + β3 ΔDRC*PMit + β4 SALESit + β5 SALEGRit + β6 Qit + β7 ΔNOAit +
∑γi•RSST Controlsit + εt+1 (2)
The hypothesis predicts a negative coefficient on the interacted variable, ΔDRC*PMit. The
rationale for the control variables is described in the previous section. Estimated coefficients are reported
in Table 3. Consistent with the hypothesis, β3 is significantly negative in all specifications. Column 5,
which reports the estimates for the full model as described in equation (2), shows β3 of –3.846 (t = 5.24).
One drawback in using the above specification is that the interacted variable, ΔDRC*PMit, has a
high correlation with the corresponding main variables. (The sample correlation between ΔDRC and the
interacted variable and between PMt and the interacted variable is –34% and 17%, respectively.) To
eliminate muticollinearity concerns, and also to allow for non-linearities in the PMt+1 and ΔDRC
relationship as well as to provide a better economic interpretation of the coefficient on the interacted
variable, we estimated a piece-wise linear version of the above regression equation. Each year the sample
was split into quintiles on the basis of ΔDRC and quintile membership was indicated by dummy variables
DQ1-DQ5, where DQ5 contains observations with the largest values of ΔDRC that year. Future PM was
regressed on current PM interacted with these indicator variables along with all other controls as
described in equation (2). Untabulated results show that the coefficients on the interacted variable
DQjt*PMit are negative and progressively smaller in the higher quintiles, consistent with the hypothesized
negative effect of ΔDRC on margin persistence. The coefficient on PMt in the lowest ΔDRC quintile is
1.064 (t=13.52) while the coefficient on the highest quintile is smaller by –0.329 (t=2.88).
Overall, the evidence from both the continuous and discrete specifications is consistent with
changes in deferred revenue having an adverse impact on the persistence of profit margins.
Test of Hypothesis 3: Mispricing of ΔDRC
In order to test if the market correctly prices changes in the current deferred revenue liability, we
test if portfolios formed on the basis of cross-sectional distribution of ΔDRC predict abnormal returns
over the following year. We use regression analysis to estimate the size of year-ahead returns

21
(LEADSAR) to a zero-investment portfolio formed on the basis of ΔDRC.16 Each year firms are ranked
into deciles - numbered from 0 to 9 - based on the (signed) magnitude of ΔDRC and the decile number is
divided by nine so that the transformed ΔDRC variable, called ΔDRCdec, takes values between zero and
one. The basic regression model to detect mispricing of ΔDRC takes the following form:
LEADSARit+1 = β0 + β1 ΔDRCitdec + εit+1 (3)
Portfolios are formed three months after the firm’s fiscal year end. The weights assigned to each
firm in the portfolio are given by the rows of the matrix (X’X)-1X, where X = [1, ΔDRCitdec]. Firms
receiving negative weights are sold short and those receiving positive weights are bought. Because the
weights sum to zero, the coefficient β1 reflects the size-adjusted returns to a zero-investment portfolio
formed on the basis of the variable ΔDRC (Fama and Macbeth, 1973). β1 will be significantly different
from zero if investors fail to fully incorporate the year-ahead performance implications of ΔDRC.
To assess if the future abnormal returns are incremental to those identified by operating accruals
(Sloan, 1996), accounting conservatism (Penman and Zhang, 2002) and other known risk factors such as
size, book-to-market, earnings-to-price and beta, the following extended model is estimated (firm
identifiers are suppressed):
LEADSARt+1 = β0 + β1 ΔDRCtdec + β2 Qt
dec + β3 ACCRtdec + β4 SIZEt
dec + β5 BMtdec + β6EPt
dec +
β7BETAtdec + εt+1 (4)
Each of the regressors is transformed into scaled decile ranks and the transformed variables are
denoted with a "dec" superscript. Pooled OLS regression estimates from regression equation (4) are
presented in Table 4. Following Petersen (2008), we use standard errors that are clustered on firms
16 In the robustness section we report results from a simple hedge portfolio test. Most prior studies on
mispricing of accruals have used the Mishkin test to detect mispricing. However, more recently severalstudies have highlighted the drawbacks of the Mishkin approach (e.g. Kraft, Leone and Wasley 2007,Zhang 2007, footnote 6, pp. 1338). We confirm the mispricing results with a Mishkin test as well asOLS but do not detail those tests in the paper. The results are available on request from the authors.

22
(gvkey) to correct for time series dependence in standard errors and fixed year effects and industry effects
to control for cross-sectional dependence.17
The first column of Table 4 reports estimation results for the basic mispricing regression equation
(3). The coefficient on ΔDRCdec is significant and positive (β1 = 0.080, t-stat = 3.59). That is, a trading
strategy based on portfolios constructed on ΔDRC three months after the fiscal year ends yields an
average abnormal return over the next year of about 8%.
We next control for three potential alternative explanations for the predictable returns. First,
column (2) shows that the coefficient on ΔDRCdec remain significant even after controlling for previously
documented risk factors such as SIZE, BM, EP and BETA. Second, to show that the returns to ΔDRC are
incremental to returns earned by trading on other accruals-based returns anomalies, column (3) includes
operating accruals (excluding ΔDRC) as an additional regressor. Finally, we add Penman and Zhang’s
(2002) Q-score to control for temporary changes in R&D, advertising and LIFO inventory, all of which
have been shown to affect future returns.
The inclusion of known risk factors, accruals and the Q-score as additional controls does not alter
our results. The coefficient on ΔDRCdec (β1=0.090 t=3.91) in column 5 suggests that size-adjusted returns
to a zero-investment trading strategy based on ΔDRCdec portfolios average about 9% one year after
portfolio formation; these returns are incremental to the returns explained by total accruals, Q-score as
well as by other known risk factors.
Consistent with results from prior literature, SIZE and BM are positively and significantly
correlated with future returns but neither Q nor ACCR are significant in explaining future returns.18 The
lack of significance of accruals could be due to their relatively small size in our sample. Additionally,
17 When correlations are from both dimensions (time and firm), Petersen (2008) recommends correcting
for one dimension by parametrically estimating its effect (with a dummy variable) and for the otherdimension by clustering the standard error on the second dimension. The Fama Macbeth procedurecorrects only for the cross-sectional correlation in standard errors (time effect) and not for the timeseries correlation (firm effect).
18 The use of size-adjusted returns does not appear to fully control for size since the estimates for mostregressions in this table show significant abnormal return to the SIZE variable. This is consistent withresults found in numerous prior studies (see, e.g., Rajgopal et al, 2003, page 478).

23
Beaver et al. (2007) show that the returns to accruals for the period 1987-2002, after including delisting
returns in the analyses (as we have done), are insignificantly different from zero.
The primary finding of this section is that the market significantly misprices ΔDRC information,
thereby making it possible to earn significant year-ahead abnormal returns by trading on ΔDRC
information. In section 6.3 we detail numerous robustness tests to confirm these results.
Tests of Hypotheses 4-6: ΔDRC and analysts' forecasts of sales and earnings
In this section we examine whether equity analysts fully incorporate current ΔDRC information
in their sales and earnings forecasts. To test Hypothesis 4, we estimate the following models for sales
forecasts (firm identifiers are suppressed):
SALEt+1 = α0 + α1 SALEt + α2 ΔDRCt + εt+1 (5.1)
FSALEt+1 = β0 + β1 SALEt + β2 ΔDRCt + µt+1 (5.2)
FE_SALt+1 = (α0 - β0) + (α1 -β1) SALEt + (α2 - β2) ΔDRCt + (εt+1 - µt+1) (5.3)
where SALE is actual sales as reported by IBES, FSALE is analysts' most recent median forecast of sales
and FE_SAL is sales forecast error calculated as the difference between actual and forecast sales. All
variables are scaled by average assets. Coefficients α1 and α2 measure the weight on current sales and
current ΔDRC in determining actual future sales. Coefficients β1 and β2 measure the weights that analysts
put on current sales and current ΔDRC in their forecasts of future sales. If analysts fail to fully utilize
information in ΔDRC when forecasting sales, the coefficient on ΔDRC on analysts’ sales forecast error,
(α2 - β2) in equation (5.3), will be significantly different from zero.
Similarly, to test if analysts fully incorporate ΔDRC information when making earnings forecasts,
we estimate a similar set of three regressions for earnings per share, EPS. Actual EPS is the number
reported by IBES, forecast EPS is analysts' most recent median eps forecast and forecast error in EPS is
measured as actual EPS less forecast EPS. All per share variables are scaled by price at the end of the
previous period. Following a logic similar to the one detailed above for sales forecasts, if analysts fail to

24
fully incorporate information in ΔDRC when forecasting eps, the coefficient on ΔDRC in the EPS
forecast regression (analogous to regression 5.3 above) will be significantly different from zero.
We estimated these models on both annual and quarterly forecast data for sample firms and
obtained consistent results. Only the estimates based on quarterly data (using panel data techniques with
fixed firm effects) are reported in the paper. Evidence in Table 5, columns 1 and 2 shows that, consistent
with Hypothesis 4, although analysts incorporate ΔDRC information in their forecasts of sales, they put a
lower weight on ΔDRC in their sales prediction than is warranted (β2<α2,). As a result, sales forecast
errors are significantly positively correlated with ΔDRC (column 3, coeff. 0.043, t= 3.04).19
Similarly, the EPS regression results reported in Table 5, columns 4-6 show that although
analysts do incorporate ΔDRC information in their EPS forecasts (column 5, β2=0.082, t=5.68), they
underestimate the significance of ΔDRC in explaining future EPS. ΔDRC is therefore significant in
explaining EPS forecast errors (column 6, coeff. 0.020, t= 2.80).
Hypothesis 5 attempts to parse the source of EPS forecast errors with respect to ΔDRC. The
previous results show that analysts misjudge the impact of ΔDRC on sales. To assess if the error in
forecasting earnings is due only to the analysts’ incorrect assessment of the impact of ΔDRC on future
sales or is a combined outcome of both sales and margin errors, we restrict the sample to only those firms
for which both quarterly sales as well as EPS forecasts are available (N=9,403) and estimate the following
regression:
FE_EPSit+1 = α0 + γi + α1 ACTUAL_EPSit + α2 ΔDRCit + α3 FE_SALit+1 + α4 SIZEit + εit+1 (6)
If analysts misjudge the implications of ΔDRC for sales only (and not for margins), which then
translates into their underestimating the implications of ΔDRC for earnings, ΔDRC should not be
significant in explaining EPS forecast errors after including sales forecast errors, FE_SALt+1 in the 19 Since the impact of current DRC and year-ahead sales is straightforward, it is surprising thatsophisticated analysts do not fully incorporate DRC information in their sales forecasts. One potentialexplanation is that analysts misperceive the persistence of ΔDRC. In tests reported in the robustnesssection we show that this component of earnings is significantly less persistent than cash flows and othercomponents of accruals.

25
regression. However, if analysts underestimate the implications of ΔDRC not only for sales but also for
margins (equivalently, expenses), then both FE_SALt+1 and ΔDRC together should be significant in
explaining earnings forecast errors. Consistent with the latter interpretation that analysts misunderstand
the implications of ΔDRC for both future sales as well as for the margins on those sales, Table 6, column
4 shows that ΔDRC remains significant (α2 = 0.015, t = 2.10) after including FE_SALt+1 as an
explanatory variable in the EPS forecast regression.
Hypothesis 6 posits that, due to the exacerbated mismatch in the timing of revenue and expense
recognition that ΔDRC induces, sales forecast errors caused by ΔDRC are likely to be associated with
bigger errors in earnings forecast than sales forecast error caused by other factors. To test this hypothesis
we constructed an industry-and-size-matched sample of firms that report zero or missing ΔDRC. The
matched firms are from the same fiscal quarter, SIC2 industry and the same sales decile within that
industry. A match was found for 6,942 observations from the original sample. Observations in the
original sample are identified by the indicator variable MAIN=1. To test the hypothesis, we estimate the
following model:
FE_EPSit+1 = α0 + γi + α1 ACTUAL_EPSit + α2 FE_SALit+1 + α3 MAIN*FE_SALit + α4MAINit +
α5 SIZEit + εit+1 (7)
Hypothesis 6 posits a higher coefficient on sales forecast errors in ΔDRC firms, which suggests a
positive coefficient on the interacted variable MAIN*FE_SAL. Table 6 column 3 reports results that are
consistent with this hypothesis. The coefficient on FE_SAL is 0.125 for non-ΔDRC firms and
significantly higher (α2 + α3 = 0.157) for ΔDRC firms. The difference in the two coefficients is
significant at the 5% level. The higher association between earnings forecast errors and sales forecast
errors in ΔDRC firms is consistent with the idea that unexpected changes in earnings due to unexpected
sales are larger when the unexpected sales are due to changes in the DRC liability. This result highlights
the fact that a change in sales that is due to a change in reveneu deferrals has relatively bigger earnings
consequences than a change in sales due to other reasons.

26
The evidence presented in this section is consistent with the idea that ΔDRC makes it more
difficult for analysts to predict both future sales and future earnings. The results also suggest that even if
analysts were to correctly estimate the future revenue implications of revenue deferrals, they could
potentially still misestimate future earnings because ΔDRC affects not just future reported revenues but
the margins on those revenues.
6. Discussion, Alternate Explanations, and Robustness Tests
6.1 Why are profitability changes and abnormal returns associated with ΔDRC so large?
Given the relatively small magnitude of ΔDRC, the magnitude of its impact on future probability
and future abnormal returns (9%) documented in this study is somewhat surprising. In this section we
provide an economic rationale for the magnitude of the impact of ΔDRC.
The sample for this study primarily includes firms in the technology industries where indirect
costs are high and where many major investment expenditures (such as R&D) are immediately expensed.
Accordingly, period costs for sample firms average nearly 47% of total operating costs. This ratio, on
average, is significantly larger for sample firms as compared to the corresponding 2-digit-SIC industry
median.
In the presence of such high period costs (or of high fixed costs) small changes in sales can have
a magnified impact on reported earnings. This is the standard effect of operating leverage; a change in
sales has a magnified impact on operating earnings. However, if the change in sales is due to a change in
revenue deferrals in the previous year, an additional factor is likely to further magnify the resulting
earnings change. Revenue deferrals’ effect on future earnings is a combined outcome of a change in sales
as well as of a change in margins, such that the two effects reinforce each other. When the changes in
sales are not due to changes in deferrals, the reinforcing changes in margins may be somewhat weaker
since such sales changes are less likely to exacerbate mismatching. Thus, a change in sales that is due to
27
a change in reveneu deferrals has relatively bigger earnings consequences than a change in sales due to
other reasons. We further clarify this idea further with the help of a numerical example in Appendix A.
It is, therefore, a combination of high period costs and the exacerbation of the mismatch due to
revenue deferrals which creates the potential for magnified forecast errors and, therefore, large abnormal
returns in this sample.
6.2 Alternate explanations for the association between ΔDRC and future profitability and returns
Although our primary explanation for the association of ΔDRC with future profitability and
abnormal returns rests on mismatching, in this section we explore other feasible explanations such as
those found in the accounting conservatism literature and the accrual anomaly literature.
Penman and Zhang (2002) show that temporary changes in investment expenditures that receive a
conservative accounting treatment also result in a pattern of future profitability and returns that are similar
to the ones documented in this study. The concern that it is changes in investments such as R&D, rather
than ΔDRC, that is driving our results is especially pertinent for our sample of high-tech firms. However,
our results remain unchanged after controlling for changes in R&D, advertising and LIFO inventory, both
individually as well as when aggregated in the Q-score.
Turning next to the accrual anomaly literature, starting with Sloan (1996), a large body of
research in accounting has documented that operating accruals are negatively correlated with future
returns. Since ΔDRC is a (negative) component of accruals the positive association between ΔDRC and
future returns could simply be explained by theories previously offered as explanations for the accrual
anomaly, in particular the persistence theory and the investment/growth theory.20
The investment/growth theory, first tested by Fairfield et al (2003), notes that accruals are
positively associated with growth in net operating assets and that the accrual anomaly is simply a special
20 Evidence in Zhang (2007) and Desai et al (2003) tends to favor the growth argument over the
persistence argument. Kraft et al (2006), on the other hand, find that after correcting various selectionbiases that were inadvertently introduced in trading strategy designs in prior studies, the pattern ofaccruals mispricing that emerges is inconsistent with either the persistence or the growth explanation.

28
case of the lower future returns associated with growth firms, as documented in studies such as Titman,
Wei and Xie (2004). However, evidence in our sample shows that high ΔDRC firms are likely to be
growth firms and that such firms also have higher future abnormal returns.21 This pattern of abnormal
returns is inconsistent with the mispricing of growth documented in prior studies.
The persistence explanation for the accrual anomaly, first developed by Sloan (1996), argues that
when forecasting earnings functionally-fixated investors naively weight both the cash and the accrual
component of earnings similarly, without noting the more subjective and therefore less persistent nature
of accruals. As a result, investors are negatively surprised and stock returns are systematically lower
when high accrual firms subsequently announce lower-than-expected earnings. Untabulated results show
that ΔDRC is significantly less persistent than either cash flows or total operating accruals (excluding
ΔDRC). Therefore, the returns predictability of ΔDRC could also be due to the fact that investors
overestimate the persistence of ΔDRC. Although the pattern of mispricing documented in the paper is
consistent with both the persistence as well as the poorer matching explanations, the persistence theory
alone cannot explain the magnitude of impact that ΔDRC has on future margins.
It should also be noted that the regression tests for mispricing in section 4 include controls for
both operating accruals (ACCR) and for growth as proxied for by the book-to-market ratio (BM). The
results show that in these tests the impact of ΔDRC is incremental to both ACCR and BM.
Another potential explanation for the positive correlation between ΔDRC and future abnormal
returns can be found in the literature on order backlogs (Rajgopal et al., 2003) since transactions that give
rise to deferred revenue are similar in nature to transactions that result in order backlogs.22 However, only
21 ΔDRC is positively correlated with such growth variables as market-to-book and current and future sale
and employee growth. Table 1 Panel E shows that the Spearman correlation between ΔDRC and BM(inverse of the growth proxy) is –16%. The correlation coefficients between ΔDRC and other growthvariables are all positive and significant at 5%. These correlations are as follows: employee growth(15%), sales growth (10%), growth in net operating assets (3%) and growth in order backlogs (18%).
22 Although both order backlogs and revenue deferrals result in recognition of sales and income in thefuture, there are some key differences. Revenue deferrals are always accompanied by cash paymentsfrom customers and the resulting liability is recognized on the balance sheet whereas order backlogsmay or may not be accompanied by any cash flows and are only disclosed in the footnotes.

29
a fifth of sample observations report backlogs. Excluding these observations does not substantially alter
the conclusions from our analysis.
Additional portfolio and regression tests (untabulated) show that it is not the size of the liability
(DRC) but the change in the liability (ΔDRC) that is mispriced. That is, it is the unpredictable component
of the deferred revenue liability, as proxied for by the change in DRC, which is systematically associated
with future returns.
6.3 Robustness Tests for the Mispricing of ΔDRC
We take numerous steps to ensure that significant abnormal returns to a ΔDRC-based trading
strategy are not an artifact of a sampling choice or an econometric issue. As discussed in Section 4.2, we
are especially careful to avoid explicit and implicit selection biases that introduce ex post information in
trading strategy research design. To rule out the possibility that the anomalous stock returns are due to a
preponderance of smaller firms in the sample (Kothari, 2001) or due to a few abnormally large returns
(Kraft et al., 2006) or are limited to firms from specific exchanges or industries, we re-estimate the
mispricing regression of Table 4 with the following restrictions. We limit the sample to firms with fiscal
year-end stock price greater than $5, exclude observations with returns greater than 200%, restrict the
sample to only NASDAQ firms which account for over 75% of the sample or to only non-software firms.
(To ensure comparability of results across different sets of tests, the assignment of firm-years to the
ΔDRC deciles remains constant throughout the analysis, even though some robustness tests impose
additional restrictions). We also identify 249 influential outliers using the Belsley, Kuh and Welsch
regression diagnostics.23 The outliers are primarily in the extreme deciles and are mostly poorly-
performing, small firms. The mean and median LEADSAR for the excluded observations is nearly 185%.
Despite these restrictions the ΔDRC hedge portfolio still yields significantly positive abnormal returns of
at least 7% in each specification.
23 We use the technique as described on page 306, equation (1) of Kraft et al. (2006).

30
To get away from the implicit linearity assumption of the regression tests and to understand the
pattern of returns across ΔDRC deciles we first do a basic hedge portfolio test. As before, each year ten
portfolios are formed on the basis of the size of ΔDRC, with Decile 1 (10) portfolio containing firms with
the smallest (largest) values of ΔDRC. A hedge strategy that takes a long position in Decile 10
(LEADSAR = 2.1%) and short position in Decile 1 (LEADSAR = -6.2%) yields future size-adjusted
abnormal returns of 8.4%. The t-statistics for a two-tailed test of LEADSAR difference in the two deciles
(hedge returns) is 2.26. Although the portfolio approach has the advantage of not assuming a linear
relationship between ΔDRC and future stock returns it suffers from a correlated-omitted-variables
problem as it does not control for any confounding effects.
7. Conclusion
The implementation of SOP 97-2 in 1997 for software firms and of SAB 101 in 2000 for firms in
other industries led to the deferral of many revenue items that were previously classified as revenue. As a
result, the incidence and size of deferred revenue liability on corporate balance sheets has increased
significantly in recent years. This paper provides evidence on the implications of changes in the deferred
revenue liability for firms’ financial statements and equity values and for analysts’ forecasts of sales and
earnings.
A combination of reasons complicates profitability prediction when the deferred revenue liability
changes. First, revenue deferrals are more likely in firms where period costs, which result from both
conservative accounting practices and due to significant indirect costs, are a relatively large proportion of
total operating costs. In the presence of period costs, revenue deferrals exacerbate the mismatch in the
timing of revenues and expense recognition. Because of this mismatch, small changes in sales can lead to
relatively large changes in margins. Second, the increased mismatch also weakens the ability of current
margins to predict future margins. Finally, changes in the deferred revenue liability have low persistence,
so the changes in profitability that they give rise to may be unsustainable.

31
As a result of this heightened complexity, both investors and analysts have trouble assessing the
future performance of firms that report changes in the deferred revenue liability. The results show that
such changes are significantly positively correlated with future abnormal returns. These mis-pricing
results are robust to controls for various risk factors and other market anomalies. Additional tests show
that the increased complexity affects even the more sophisticated market participants such as equity
analysts who underweight the significance of changes in the deferred revenue liability not just for
profitability but also for sales.
Both SOP 97-2 and SAB 101 were promulgated in response to the idea that firms were
recognizing revenue prematurely. Our results suggest that these guidelines that were issued to improve
the quality of earnings by making revenue recognition more consistent with the earnings generating
process have in fact, reduced the predictive ability of current earnings for future earnings. This reduced
informativeness is also relevant to the current discussion on the preliminary views document on revenue
recognition issued jointly by the FASB and the IASB in December 2008. In the proposed model, a
contract asset and a liability are recorded at contract inception; revenue is recognized when a contract
asset increases and/or when a contract liability decreases. The Preliminary Views document does not
directly address the issue of matching. It explicitly mentions that some specific expenses, like costs in
obtaining the contract, should be expensed in the period incurred, unless they are capitalized under any
other standard. This suggests that the mismatch in revenues and expenses arising from the lack of
capitalization of some costs will not change under the proposed revenue recognition guidance.
The concern for mismatched costs and revenues in long-term contracts is also reflected in
numerous comment letters on the Preliminary Views document, including those from FEI Canada, Dell,
Boeing, Nokia, Verizon and Intel.24 For instance, Hewlett Packard’s comment letter recommends:
24 The issue remains largely unaddressed in the current draft. Some comment letters are interpreting theambiguity in the draft in specific ways. For instance, FEI Canada says, “Where a vendor is not allowed torecognize revenue as progress is made on a long-term contract, we believe the model should allow thecontract costs to be deferred as well, assuming recoverability, until revenue is recognized. Ourinterpretation of paragraph 6.43 leads us to believe that is the intent of the proposed model.”

32
“ …. [In some cases] we believe that an accounting model which aligns with the historical concept ofmatching of costs and revenue recognition is still the best reflection of the economic substance ofthese transactions and provides the most decision useful information to the users of the financialstatements.”
The proposed standard does, however, do away with VSOE (or equivalent) requirements to
recognize revenue on delivered elements, thereby mitigating mismatching concerns by reducing revenue
deferrals that arise from lack of stand-alone prices for multiple-element contracts.
Most prior literature on deferred revenues has examined the impact of revenue deferrals on
managers’ discretion (Caylor 2008, Altamurro et al 2005). This paper adds to the literature by providing
evidence on the future profitability and valuation implications of changes in the deferred revenue liability.
Overall, the results suggest that revenue deferrals have increased the complexity and reduced the
transparency of firms’ financial statements. Not only has this increased complexity affected naïve
investors, even sophisticated investors like equity analysts are adversely affected by it.

33
Reference
American Institute of Certified Public Accountants (AICPA). 1997. Software revenue recognition.Statement of Position (SOP) 97-2.
Altamuro, J., A. L. Beatty, and J. P. Weber. 2005. The effects of accelerated revenue recognition onearnings management and earnings informativeness: Evidence from SEC staff accounting bulletinNo. 101. The Accounting Review 40(2): 373-401.
Bauman, M. P. 2000. The unearned revenue liability and firm value: Evidence from the publishingindustry. Working Paper, University of Illinois Chicago. (August, 2000). Available at SSRN:http://papers.ssrn.com/sol3/papers.cfm?abstract_id=238628
Beaver W., M. McNichols and R. Price 2007. Delisting Returns and their Effect on Accounting-BasedMarket Anomalies. Journal of Accounting and Economics (43): 341-368.
Caylor, M. 2008. Strategic revenue recognition to meet earnings benchmarks. Working Paper,University of South Carolina. (January 14, 2008). Available at SSRN:http://ssrn.com/abstract=885368
Dechow, P. 1994. Accounting earnings and cash flows as measures of firm performance. Journal ofAccounting and Economics 18(July): 3-42.
Desai, H. S. Rajgopal and M. Venkatachalam. 2004. Value-glamour and accruals mispricing: Oneanomaly or two? The Accounting Review 79(2): 355-385.
Dichev, I. and V. Tang. 2008. Matching and the changing properties of accounting earnings over the last40 years. Forthcoming, The Accounting Review (November 2008).
Fairfield, P., and T. Yohn. 2001. Using asset turnover and profit margin to forecast changes inprofitability. Review of Accounting Studies (December): 371–385.
Fairfield, P., J. Whisenant, and T. Yohn. 2003. Accrued earnings and growth: Implications for earningspersistence and market mispricing. The Accounting Review (January): 353–371.
Fama, E. and J. Macbeth. 1973. Risk, return and equilibrium: Emprirical tests. Journal of PoliticalEconomy 71(May/June): 607-636.
Financial Accounting Standards Board (FASB). 1984. Recognition and Measurement in FinancialStatements of Business Enterprises. Statement of Financial Accounting Concepts No.5. Norwalk, CT:FASB
Financial Accounting Standards Board (FASB). 1985. Elements of Financial Statements. Statement ofFinancial Accounting Concepts No.6. Norwalk, CT: FASB
Financial Accounting Standards Board (FASB). 2000. EITF00-21. Revenue arrangements with multipledeliverables (July 2000).
Financial Accounting Standards Board/ International Accounting Standards Board (FASB/IASB). 2007.Minutes of the October 22, 2007 FASB-IASB joint board meeting.

34
Financial Accounting Standards Board/ International Accounting Standards Board (FASB/IASB). 2008.Minutes of the April 9, 2008 FASB-IASB joint board meeting.
Financial Accounting Standards Board (FASB). 2008. Project Update, Revenue Recognition. (August,2008.)
Financial Accounting Standards Board / International Accounting Standards Board (FASB/IASB). December 2008. Preliminary Views on Revenue Recognition in Contracts with Customers. Discussion Paper.
Kothari, S. P. 2001. Capital market research in accounting. Journal of Accounting and Economics 31(1):233-253
Kraft, A., A. Leone; And C. Wasley. 2006. An analysis of the theories and explanations offered for themispricing of accruals and accrual components. Journal of Accounting Research 44 (2006): 297–339.
Kraft, A., A. Leone and C. Wasley. 2007. Regression based tests of the market pricing of accountingnumbers: The Mishkin test and the Ordinary Least Squares. Journal of Accounting Research 45(5):1081–1084.
Moffeit, K. S. and A. E. Eikner. 2003. Implementation of SAB 101. CPA Journal Online (January).
Penman S.H. and X. Zhang. 2002. Accounting Conservatism, the Quality of Earnings, and StockReturns. The Accounting Review 77(April): 237–264
Petersen, M.A. 2008. Estimating standard errors in Finance panel data sets: Comparing Approaches.Forthcoming, Review of Financial Studies.
Rajgopal, S., T. J. Shevlin and M. Venkatachalam. 2003. Does the stock market fully appreciate theimplications of leading indicators for future earnings? Evidence from order backlog" (December2001). Review of Accounting Studies 41(3): 135-162.
Richardson, S., R. Sloan, M. T. Soliman and I. Tuna. 2005. Accrual reliability, earnings persistence andstock prices. Journal of Accounting and Economics 39: 437-485.
Securities and Exchange Commission (SEC). 1999. Staff Accounting Bulletin No. 101 (SAB 101),Revenue recognition in financial statements (December 3).
Securities and Exchange Commission (SEC). 2003. Staff Accounting Bulletin No. 104 (SAB 104),Revenue recognition (December 17).
Shumway, T., Warther, V., 1999. The delisting bias in CRSP’s Nasdaq data and its implications for thesize effect. Journal of Finance 54 (6): 2361–2389
Soliman, M.T. 2008. The use of DuPont analysis by market participants. The Accounting Review 83:823–853.
Sondhi, A.C. and S. Taub. 2006. Revenue Recognition Guide 2007. Chicago, IL: CCH.
Sloan, R. 1996. Do stock prices fully reflect information in accruals and cash flows about futureearnings? The Accounting Review 71: 289–315.

35
Srivastava, A. 2008. Do firms use flexibility in revenue-recognition rules to convey value-relevantinformation or to manage earnings? Working Paper, Northwestern University. (September 10, 2008)Available at SSRN: http://ssrn.com/abstract=1078584
Thomas, J. and H. Zhang, 2002. Inventory changes and future returns. Review of Accounting Studies(June): 163-187.
Titman, S., J. Wei, and F. Xie. 2004. Capital investments and stock returns. Journal of Financial andQuantitative Analysis 39: 677–700.
Xie, H. 2001. The Mispricing of Abnormal Accruals, The Accounting Review 76: 357-373.
Zhang, F. 2007. Accruals, Investment, and the Accrual Anomaly. The Accounting Review 82(5):1333–1363.

36
Appendix A
Consider a firm that reported year t operating income of $5 with product and period costs of $65
and $30, respectively, when sales are $100. The gross margin and operating margin ratios, therefore, are
35% and 5%, respectively. (The ratio of period costs to total operating costs is 32%.) Assume further
that the balance in the current deferred revenue liability increased from $0 to $5 in year t. Related to the
transaction that gave rise to the $5 in deferred revenue the firm incurred $3.25 in product costs and $1.50
in incremental period costs. The incremental period costs of $1.50 are included in the $30 of total period
costs recognized in year t, while the gross margin of $1.75 is deferred to year t+1.
Suppose that in year t+1 sales and cost structures remain unchanged, except for the impact of the
$5 revenue deferral from the previous period. Assuming no further deferrals in year t+1 (so that the DRC
balance declines to zero), sales recognized this year will be $105 with product costs of $68.25
(=0.65*105) and period costs of $28.50 (=$30-$1.50 since the previous period’s $1.50 in period costs will
not be incurred). Thus, as a result of the additional $5 in sales, year-over-year reported operating income
will increase from $5 to $8.25, an increase of 65%. The PM ratio will increase from 5% of sales to 7.8%
of sales, a 56% increase.
If investors fail to note the impact of the deferral completely, a change in deferral that amounts to
only 5% of sales can potentially lead to earnings and margin forecast errors in excess of 50%. Even if
investors understand the impact of the deferral on sales and gross margin but are unable to detect the
impact on period costs, they may still predict earnings that are $1.50 (18%) lower than the $8.25 actually
reported.
It is also worth noting that had the additional $5 in year t+1 simply been unexpected “new”
revenue, rather than revenue that was deferred from the previous period, the associated period costs of
$1.50 would have been recognized in year t+1. The earnings in years t and t+1 would then be $6.50 and
$6.75, respectively. The potential for forecast errors for the same $5 of “unexpected” sales would be
much smaller in this case. The empirical tests of Hypothesis 6 confirm this intuition in our sample.

37
Table 1 Descriptive Statistics
Panel A: Descriptive Statistics of Regression Variables
Variable N Mean Median Std Dev P10 P90DRC/S 6684 0.097 0.034 0.175 0.003 0.260DRT/S 6684 0.149 0.041 0.542 0.004 0.318ΔDRC 6684 0.009 0.003 0.045 -0.013 0.039SALE ($MM) 6684 1689.9 148.1 11356.4 16.9 1877.6PMt+1 6121 -0.201 0.039 0.965 -0.557 0.209LEADSAR 6684 0.014 -0.071 0.646 -0.535 0.576PDCOST 6684 0.469 0.468 0.241 0.128 0.798Q-SCORE 6684 0.156 0.007 4.879 -0.248 0.905ACCR 6684 -0.001 0.000 0.007 -0.003 0.000ΔNOA 6683 -0.262 0.037 56.064 -0.627 1.162ΔNCO 6636 0.042 0.010 0.199 -0.099 0.219ΔWC 6665 0.042 0.014 0.239 -0.177 0.269ΔFIN 6684 0.023 0.000 0.282 -0.199 0.220BETA 6684 1.092 1.062 0.663 0.262 1.967SIZE 6684 5.510 5.330 1.796 3.314 7.853EP 6684 -0.095 0.013 0.471 -0.269 0.065BM 6684 0.491 0.382 0.480 0.132 0.913FE_SAL 9420 0.004 0.002 0.073 -0.013 0.019FE_EPS 9671 0.000 -0.004 0.346 -0.006 0.006
where:DRC/S current deferred revenue, scaled by sales (Compustat variable DRC/SALE)DRT/S total deferred revenue, scaled by sales ((DRC+DRLT)/SALE)ΔDRC annual change in current deferred revenue scaled by av. assets (DRCt - DRCt-1)/Av.AssetsSALE sales (in millions of dollars) (SALE)PMt+1 year-ahead profit margin, calculated as operating income/sales (OIADP/SALE)LEADSAR year-ahead size-adjusted returns, calculated as buy-and-hold returns over 12 months starting
the 4th month after fiscal year-end, adjusted for buy-and-hold returns on a size-matcheddecile portfolio. Adjustments made for missing and delisted returns as recommended in Kraftet al. (2006)
PDCOST period operating costs as a proportion of total operating costs, averaged over three years.((SALE-OIADP -COGS)/(SALE - OIADP)).
Q-Score change in the conservatism score, per Penman and Zhang (2002). (See text for details.) It isthe average of change in Cit and industry-adjusted Cit, where the conservatism score Cit ismeasured as: (INVres + RDres + ADVres)/NOA for firm i at time t. See text for details.
ACCR accruals, calculated as income before extraordinary items less operating cash flows minuscash from extraordinary items and discontinued operations, adjusted for deferred revenues(IB – (OANCF – XIDOC+ΔDRC)) scaled by average assets
ΔNOA annual percentage change in net operating assets, scaled by average assets (NOAt – NOA t-1).NOA is calculated as Operating Assets (OA) - Operating Liabilities (OL), OA= total assets(AT) - cash and short-term investments (CHE) - investments and advances to affiliates(IVAO) and OL=total assets (AT) - total debt (DLTT + DLC) - book value of total commonand preferred equity (CEQ+PSTK) - minority interest (MIB).

38
ΔNCO annual change in net non-current operating assets (a component of total accruals, ΔNOA),scaled by average assets (NCOt – NCO t-1) NCO is calculated as Non-Current Operating Assets(NCOA) - Non-Current Operating Liabilities (NCOL), and NCOA = Total Assets (AT) -Current Assets (ACT) - Investments and Advances (IVAO), and NCOL = Total Liabilities(LT) - Current Liabilities (LCT) – Long-Term Debt (DLTT).
ΔWC annual change working capital (a component of total accruals, ΔNOA), scaled by averageassets (WCt – WC t-1). WC is calculated after extracting DRC from current operating liabilities.Therefore, WC = Current Operating Assets (COA) – (Current Operating Liabilities (COL),where COA = Current Assets (ACT) - Cash and Short-Term Investments (CHE), and COL =Current Liabilities (LCT) - Debt in Current Liabilities (DLC) – Current Deferred Revenue(DRC).
ΔFIN annual change in net financial assets, scaled by average assets (FINt – FIN t-1). FIN = FinancialAssets (FINA) - Financial Liabilities (FINL). FINA = Short-Term Investments (IVST) +Long-Term Investments (LTI), and FINL= Long-Term Debt (DLTT) + Debt in CurrentLiabilities (DLC) + Preferred Stock (PSTK).
BETA market beta estimated using the market model and daily returns over the fiscal yearSIZE natural log of total assets (log(AT))EP earnings to price ratio; income before extraordinary items (IB) scaled by market value at
fiscal year end (CSHO*PRCC_F)BM book-to-market calculated as ratio of Stockholders Equity (SEQ) to Market Value (product of
common shares outstanding and stock price at fiscal year end, CSHO*PRCC_F)FE_SAL Actual quarterly sales per IBES – Forecast quarterly sales per IBES, scaled by average assetsFE_EPS Actual quarterly earnings per share per IBES – Forecast median quarterly earnings per share
per IBES, scaled by lagged price
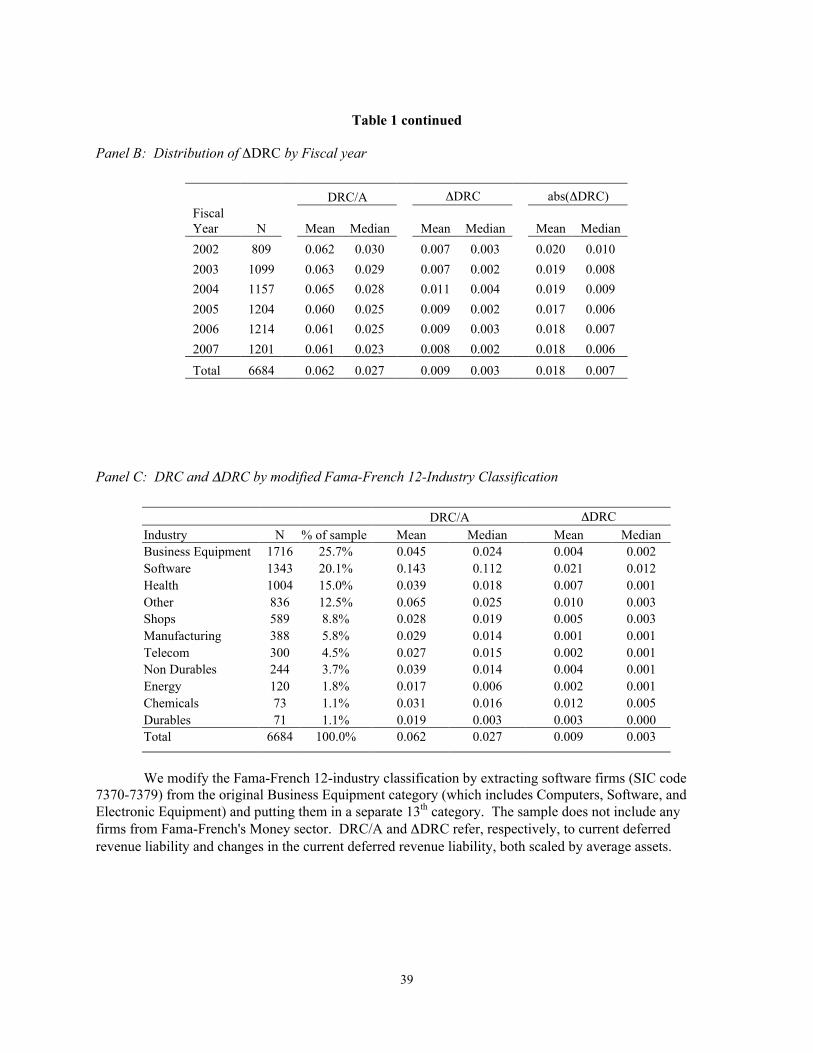
39
Table 1 continued
Panel B: Distribution of ΔDRC by Fiscal year
DRC/A ΔDRC abs(ΔDRC)FiscalYear N Mean Median Mean Median Mean Median2002 809 0.062 0.030 0.007 0.003 0.020 0.0102003 1099 0.063 0.029 0.007 0.002 0.019 0.0082004 1157 0.065 0.028 0.011 0.004 0.019 0.0092005 1204 0.060 0.025 0.009 0.002 0.017 0.0062006 1214 0.061 0.025 0.009 0.003 0.018 0.0072007 1201 0.061 0.023 0.008 0.002 0.018 0.006Total 6684 0.062 0.027 0.009 0.003 0.018 0.007
Panel C: DRC and ΔDRC by modified Fama-French 12-Industry Classification
DRC/A ΔDRCIndustry N % of sample Mean Median Mean MedianBusiness Equipment 1716 25.7% 0.045 0.024 0.004 0.002Software 1343 20.1% 0.143 0.112 0.021 0.012Health 1004 15.0% 0.039 0.018 0.007 0.001Other 836 12.5% 0.065 0.025 0.010 0.003Shops 589 8.8% 0.028 0.019 0.005 0.003Manufacturing 388 5.8% 0.029 0.014 0.001 0.001Telecom 300 4.5% 0.027 0.015 0.002 0.001Non Durables 244 3.7% 0.039 0.014 0.004 0.001Energy 120 1.8% 0.017 0.006 0.002 0.001Chemicals 73 1.1% 0.031 0.016 0.012 0.005Durables 71 1.1% 0.019 0.003 0.003 0.000Total 6684 100.0% 0.062 0.027 0.009 0.003
We modify the Fama-French 12-industry classification by extracting software firms (SIC code7370-7379) from the original Business Equipment category (which includes Computers, Software, andElectronic Equipment) and putting them in a separate 13th category. The sample does not include anyfirms from Fama-French's Money sector. DRC/A and ΔDRC refer, respectively, to current deferredrevenue liability and changes in the current deferred revenue liability, both scaled by average assets.

40
Table 1 continued
Panel D: Correlation Coefficients
DRC/S ΔDRC LEADSAR FPM PDCOST Q ACCR ΔNOA BETA SIZE EP BM
DRC/S 0.45 0.02 -0.23 0.22 -0.01 0.02 0.01 0.08 -0.08 -0.06 -0.15ΔDRC 0.40 0.03 0.11 0.11 0.02 0.07 0.05 0.01 -0.02 0.07 -0.13LEADSAR 0.02 0.06 0.07 0.03 0.00 0.02 -0.05 -0.02 0.00 -0.04 0.05FPM -0.13 0.15 0.25 0.10 -0.04 0.09 0.03 -0.07 0.16 0.20 -0.01PDCOST 0.34 0.10 0.01 -0.05 0.02 -0.09 -0.09 0.06 -0.20 -0.10 -0.10Q 0.13 0.01 0.01 -0.10 0.22 0.02 -0.06 0.03 0.00 0.01 -0.01ACCR -0.03 0.10 0.05 0.29 -0.13 -0.16 0.04 0.19 0.36 0.33 -0.02ΔNOA -0.11 0.09 -0.01 0.19 -0.06 -0.26 0.28 0.04 0.03 0.08 -0.05BETA 0.10 0.04 -0.01 0.03 0.06 0.08 0.17 0.04 0.28 0.09 -0.20SIZE -0.06 0.04 0.08 0.44 -0.21 -0.05 0.47 0.13 0.35 0.25 -0.05EP -0.21 0.07 0.10 0.64 -0.21 -0.13 0.42 0.25 0.02 0.39 -0.39BM -0.15 -0.16 0.03 -0.21 -0.12 -0.02 -0.05 -0.10 -0.18 0.01 -0.09
Pearson (Spearman) coefficients are presented above (below) the diagonal. Numbers in bold indicatessignificance at the 5% level. All variables are as defined in Table 1, Panel A.

41
Table 2 Association of ΔDRC with Future Profit Margins
This table reports results for a test of the association between ΔDRCt and future profit margin(PMt+1), after controlling for other factors that are also known to be associated with future profitability.The sign on ΔDRC is predicted to be positive to reflect the positive impact of changes in revenuedeferrals on year-ahead margins. SALEGRt is the annual percentage change in sales, (SALEt - SALEt-
1)/SALEt-1. RSST Controls refer to the decomposed elements of total accruals as described in Richardsonet al (2005). All other variables are as defined in Table1. All continuous variables are winsorized at the1% level. Standard errors are clustered by firm (GVKEY) and heteroscedasticity-robust t-statistics are inparentheses. All regressions include controls for fixed year and industry effects. Coefficients for year andindustry dummies are not shown.
PMit+1 = β0 + β1 ΔDRCit + β2 PMit + β3 SALESit + β4 SALEGRit + β5 Qit + β6 ΔNOAit
+ ∑γi•RSST Controlsit + εt+1
(1) (2) (3) (4) (5)ΔDRC 2.624 2.616 2.621 2.599 2.709
(5.87)*** (5.81)*** (5.83)*** (5.80)*** (5.89)***
PM 0.928 0.932 0.932 0.929 0.936(26.27)*** (25.92)*** (25.90)*** (25.71)*** (25.65)***
SALES 0.006 0.006 0.007 0.008(0.43) (0.44) (0.48) (0.52)
SALEGR -0.065 -0.065 -0.069 -0.054(2.15)** (2.15)** (2.28)** (1.68)*
Q -0.002 -0.001 -0.002(0.53) (0.21) (0.53)
ΔNOA 0.008(1.73)*
ΔWC -0.109(0.72)
ΔNCO -0.076(1.19)
ΔFIN -0.062(1.02)
Intercept 0.021 0.014 0.019 0.028 0.018(1.20) (0.67) (0.80) (0.99) (0.71)
Industry and YearDummies Yes Yes Yes Yes Yes
N 6121 6111 6111 6110 6069Adj R2 0.590 0.597 0.597 0.598 0.598
* significant at 10%; ** significant at 5%; *** significant at 1%
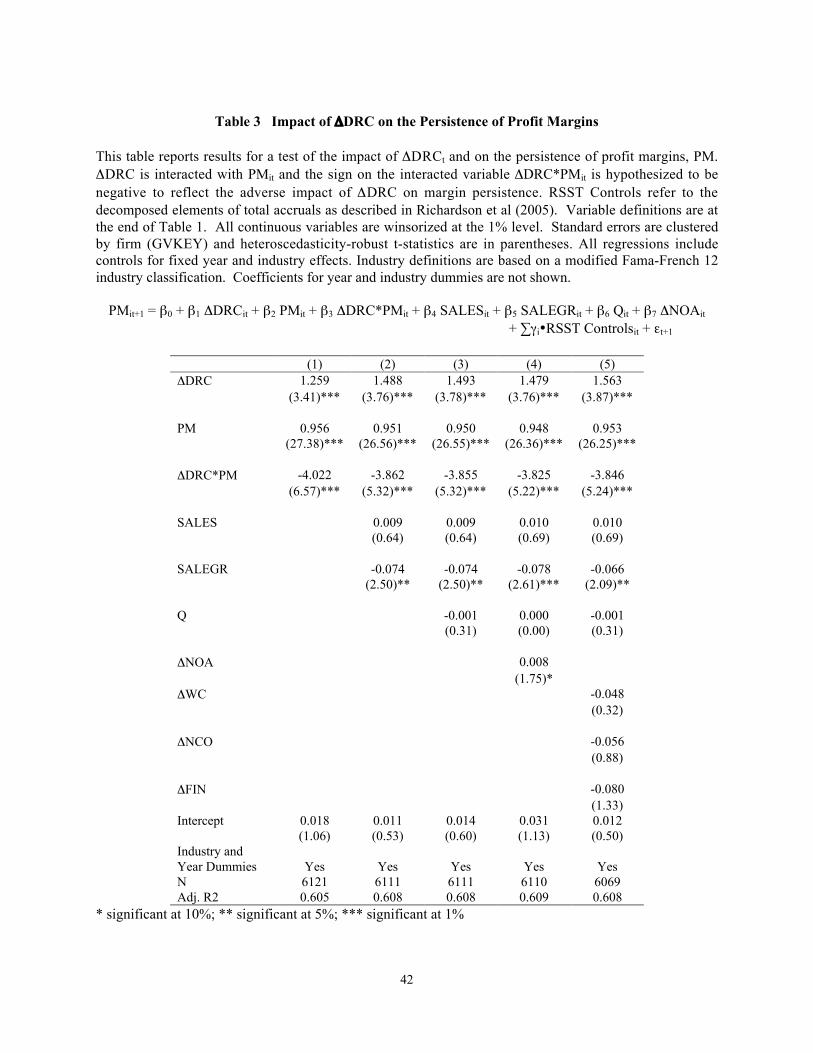
42
Table 3 Impact of ΔDRC on the Persistence of Profit Margins
This table reports results for a test of the impact of ΔDRCt and on the persistence of profit margins, PM.ΔDRC is interacted with PMit and the sign on the interacted variable ΔDRC*PMit is hypothesized to benegative to reflect the adverse impact of ΔDRC on margin persistence. RSST Controls refer to thedecomposed elements of total accruals as described in Richardson et al (2005). Variable definitions are atthe end of Table 1. All continuous variables are winsorized at the 1% level. Standard errors are clusteredby firm (GVKEY) and heteroscedasticity-robust t-statistics are in parentheses. All regressions includecontrols for fixed year and industry effects. Industry definitions are based on a modified Fama-French 12industry classification. Coefficients for year and industry dummies are not shown.
PMit+1 = β0 + β1 ΔDRCit + β2 PMit + β3 ΔDRC*PMit + β4 SALESit + β5 SALEGRit + β6 Qit + β7 ΔNOAit
+ ∑γi•RSST Controlsit + εt+1
(1) (2) (3) (4) (5)ΔDRC 1.259 1.488 1.493 1.479 1.563
(3.41)*** (3.76)*** (3.78)*** (3.76)*** (3.87)***
PM 0.956 0.951 0.950 0.948 0.953(27.38)*** (26.56)*** (26.55)*** (26.36)*** (26.25)***
ΔDRC*PM -4.022 -3.862 -3.855 -3.825 -3.846(6.57)*** (5.32)*** (5.32)*** (5.22)*** (5.24)***
SALES 0.009 0.009 0.010 0.010(0.64) (0.64) (0.69) (0.69)
SALEGR -0.074 -0.074 -0.078 -0.066(2.50)** (2.50)** (2.61)*** (2.09)**
Q -0.001 0.000 -0.001(0.31) (0.00) (0.31)
ΔNOA 0.008(1.75)*
ΔWC -0.048(0.32)
ΔNCO -0.056(0.88)
ΔFIN -0.080(1.33)
Intercept 0.018 0.011 0.014 0.031 0.012(1.06) (0.53) (0.60) (1.13) (0.50)
Industry andYear Dummies Yes Yes Yes Yes YesN 6121 6111 6111 6110 6069Adj. R2 0.605 0.608 0.608 0.609 0.608
* significant at 10%; ** significant at 5%; *** significant at 1%
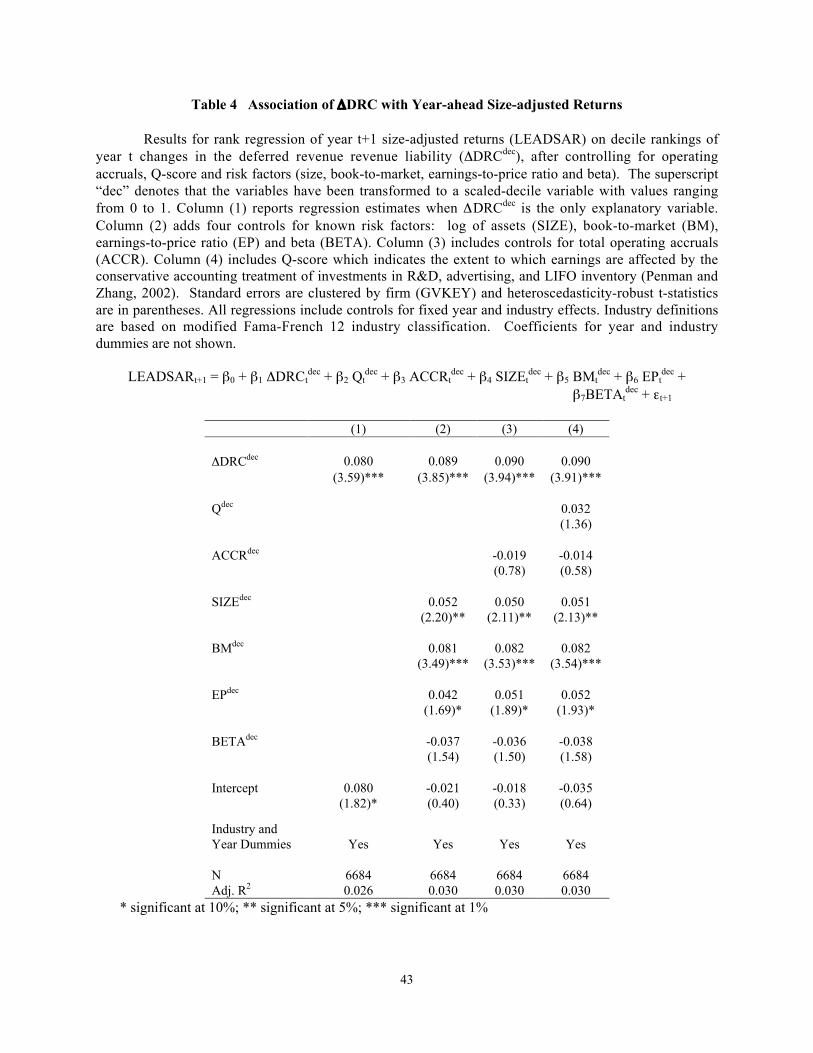
43
Table 4 Association of ΔDRC with Year-ahead Size-adjusted Returns
Results for rank regression of year t+1 size-adjusted returns (LEADSAR) on decile rankings ofyear t changes in the deferred revenue revenue liability (ΔDRCdec), after controlling for operatingaccruals, Q-score and risk factors (size, book-to-market, earnings-to-price ratio and beta). The superscript“dec” denotes that the variables have been transformed to a scaled-decile variable with values rangingfrom 0 to 1. Column (1) reports regression estimates when ΔDRCdec is the only explanatory variable.Column (2) adds four controls for known risk factors: log of assets (SIZE), book-to-market (BM),earnings-to-price ratio (EP) and beta (BETA). Column (3) includes controls for total operating accruals(ACCR). Column (4) includes Q-score which indicates the extent to which earnings are affected by theconservative accounting treatment of investments in R&D, advertising, and LIFO inventory (Penman andZhang, 2002). Standard errors are clustered by firm (GVKEY) and heteroscedasticity-robust t-statisticsare in parentheses. All regressions include controls for fixed year and industry effects. Industry definitionsare based on modified Fama-French 12 industry classification. Coefficients for year and industrydummies are not shown.
LEADSARt+1 = β0 + β1 ΔDRCtdec + β2 Qt
dec + β3 ACCRtdec + β4 SIZEt
dec + β5 BMtdec + β6 EPt
dec +β7BETAt
dec + εt+1
(1) (2) (3) (4)
ΔDRCdec 0.080 0.089 0.090 0.090(3.59)*** (3.85)*** (3.94)*** (3.91)***
Qdec 0.032(1.36)
ACCRdec -0.019 -0.014(0.78) (0.58)
SIZEdec 0.052 0.050 0.051(2.20)** (2.11)** (2.13)**
BMdec 0.081 0.082 0.082(3.49)*** (3.53)*** (3.54)***
EPdec 0.042 0.051 0.052(1.69)* (1.89)* (1.93)*
BETAdec -0.037 -0.036 -0.038(1.54) (1.50) (1.58)
Intercept 0.080 -0.021 -0.018 -0.035(1.82)* (0.40) (0.33) (0.64)
Industry andYear Dummies Yes Yes Yes Yes
N 6684 6684 6684 6684Adj. R2 0.026 0.030 0.030 0.030
* significant at 10%; ** significant at 5%; *** significant at 1%

44
Table 5 Association of ΔDRC with Analyst Forecasts of EPS and Sales
This table reports results for tests to determine if analysts fully incorporate ΔDRC information intheir quarterly EPS and SALES forecasts. In regressions (1) – (3) the dependent variables, respectively,are: Actual SALES in quarter t+1, analysts’ median forecast of SALES in quarter t+1 and the forecasterror for SALES in quarter t+1. The regressor ACTUAL represents actual value of quarter t SALES asreported by IBES. All SALES variables are scaled by average assets. Similarly, in regressions (4) – (6)the dependent variables are the actual, forecast and forecast error values of quarter t+1 EPS. The regressorACTUAL represents actual value of quarter t EPS as reported by IBES. All EPS variables are scaled byaverage lagged price. ΔDRCt represents change in quarterly current deferred revenue liability, scaled byaverage assets. SIZE is the log of average quarterly assets. All continuous variables are winsorized at topand bottom 1%. Panel data techniques with firm fixed effects are used to estimate the regressions.Standard errors are clustered by firm (GVKEY) and heteroscedasticity-robust t-statistics are inparentheses. All regressions also include controls for fixed year and industry effects. Industry definitionsare based on a modified Fama-French 12 industry classification. Coefficients for year and industrydummies are not shown.
ACTUAL_Yt+1 = α0 + α1 ACTUAL_Yt + α2 ΔDRCt + εt+1
FCAST_Yt+1 = β0 + β1 ACTUAL_Yt + β2 ΔDRCt + µt+1
FE_Yt+1 = (α0 - β0) + (α1 -β1) ACTUAL_Yt + (α2 - β2) ΔDRCt + (εt+1 - µt+1)
SALES EPS(1) (2) (3) (4) (5) (6)
Actual SALEt+1 ForecastSALEt+1
ForecastErrort+1
Actual EPSt+1 Forecast EPSt+1 ForecastErrort+1
ACTUALt 0.676 0.647 0.009 0.473 0.396 0.028(27.06)*** (30.30)*** (2.33)** (13.70)*** (12.36)*** (2.23)**
ΔDRCt 0.377 0.322 0.043 0.111 0.082 0.020(7.10)*** (6.47)*** (3.04)*** (6.29)*** (5.68)*** (2.80)***
SIZE -0.005 -0.005 0.000 0.002 0.002 0.000(4.79)*** (4.97)*** (1.48) (8.03)*** (7.30)*** (2.68)***
Intercept 0.114 0.125 -0.009 -0.010 -0.009 -0.002(5.69)*** (6.38)*** (1.62) (2.75)*** (2.77)*** (0.44)
N 9420 9420 9420 9671 9671 9671# firms 1085 1085 1085 1090 1090 1090
Within R2 0.21 0.25 0.01 0.06 0.12 0.00* significant at 10%; ** significant at 5%; *** significant at 1%
Variable definitions:ACTUAL_SAL actual sales as reported by IBES, scaled by average assetsFCAST_SAL median forecast of SALES in quarter t+1, scaled by average assetsACTUAL_EPS actual earnings per share as reported by IBES, scaled by lagged priceFCAST_EPS median forecast of earnings per share in quarter t+1, scaled by lagged priceFE_Y ACTUAL_Y – FCAST_Y, where Y is either EPS or SAL

45
Table 6 Association of EPS Forecast Errors with ΔDRC and Sales Forecast Errors
This table reports results for tests to determine if EPS forecast errors are due solely to analysts’failure to appropriately incorporate ΔDRC information in their sales forecasts or if they are due toanalysts failure to incorporate ΔDRC information in their sales forecasts as well as their marginpredictions. Quarter-ahead EPS forecast errors (FE_EPSt+1) are regressed on actual EPS, ΔDRC and salesforecast errors, FE_SALt+1. All continuous variables are winsorized at top and bottom 1%. Standard errorsare clustered by firm (GVKEY) and heteroscedasticity-robust t-statistics are in parentheses. Allregressions include controls for fixed year and industry effects. Coefficients for year and industrydummies are not shown.
FE_EPSit+1 = α0 + γi + α1 ACTUAL_EPSit + α2 ΔDRCit + α3 FE_SALit+1 + α4SIZEit + εt+1
(1) (2) (3) (4)
ACTUAL_EPSt 0.031 0.035 0.033 0.033(2.47)** (2.54)** (2.61)*** (2.75)***
ΔDRCt 0.021 0.021 0.022 0.015(2.79)*** (2.79)*** (2.90)*** (2.10)**
ACTUAL_SALEt -0.002(1.47)
FCAST_SALEt -0.003(1.73)*
FE_SALt+1 0.148(14.67)***
SIZEt 0.000 0.000 0.000 0.000(2.70)*** (2.19)** (2.26)** (2.78)***
Intercept 0.004 0.005 0.005 0.001(0.66) (0.85) (0.87) (0.27)
N 9403 9403 9403 9403# firms 1084 1084 1084 1084
Within R2 0.01 0.01 0.01 0.07* significant at 10%; ** significant at 5%; *** significant at 1%All variables are as defined in Table 5.

46
Table 7 Impact of Sales Forecast Errors on Earnings Forecasts: Matched Sample Tests
This table reports results for tests to determine if sales forecast errors lead to larger errors in EPSforecasts in firms that report non-zero ΔDRC. For each observation in the original sample, a matched firmthat reported zero or missing ΔDRCt was obtained from the same fiscal quarter, SIC2 industry and thesame Sale decile. A match was found for 6,942 observations from the original sample. Observations inthe original sample are identified by the indicator variable MAIN=1. Quarter-ahead EPS forecast errors(FE_EPSt+1) are regressed on actual EPS, ΔDRC and sales forecast errors, FE_SALt+1, in each sample.Column 1 and 2 show estimates for the Main and Matched sample, respectively. Column 3 combines thetwo samples. The differential impact of sales forecast errors on EPS forecast errors in the two sub-samples is captured by the coefficient on interacted variable MAIN*FE_SAL. All continuous variables arewinsorized at top and bottom 1%. Panel data techniques with fixed firm effects were used to estimate theregressions. Standard errors are clustered by firm (GVKEY) and heteroscedasticity-robust t-statistics arein parentheses. All regressions include controls for fixed year and industry effects. Coefficients for yearand industry dummies are not shown.
FE_EPSit+1 = α0 + γi + α1 ACTUAL_EPSit + α2 ΔDRCit + α3 FE_SALit+1 + α4 MAIN*FE_SALit+1 +α5MAIN + α6 SIZEit + εt+1
(1) (2) (3)Main Matched Main+Matched
ACTUAL_EPSt 0.026 0.028 0.030(1.66)* (1.42) (2.13)**
ΔDRCt 0.028(2.58)***
FE_SALt+1 0.155 0.120 0.125(12.14)*** (10.97)*** (11.65)***
MAIN*FE_SAL 0.032(1.98)**
MAIN -0.001(1.62)
SIZEt 0.000 0.001 0.000(2.15)** (2.53)** (3.50)***
Intercept -0.003 -0.007 -0.005(0.83) (2.32)** (2.12)**
N 6942 6942 13884# of firms 1059 1622 2090
Within R-sq 0.06 0.04 0.05