defending the ‘endowment model’
TRANSCRIPT
Defending the ‘Endowment Model’Quantifying liquidity risk in a post-credit crisis world
For InstItutIonal use only
s t r a t e g I c I n v e s t m e n t a d v I s o r y g r o u p
Abdullah Z. Sheikh, FIA, FSA , Director of Research, Strategic Investment Advisory Group (SIAG)
Jianxiong Sun, Analyst, Strategic Investment Advisory Group (SIAG
g l o b a l s t r a t e g I c r e s e a r c h

2 deFendIng the endowment model: quantIFyIng lIquIdIty rIsk
e x e c u t I v e s u m m a r y
This analysis utilizes a number of hypothetical portfolios, each of which will be discussed in greater detail in the ensuing sec-tions. But the highlights derived from our proprietary liquidity risk calculations are as follows:
A 5% allocation to even highly liquid fixed income invest-•ments (i.e., U.S. Treasuries) in an endowment portfolio—even one with no allocation to alternatives—has a 29% chance of incurring what we have defined as a liquidity crisis over any given year. But the average excess liquidity needed to overcome such a crisis (from non-fixed income investments or the capital markets) is low at around $3.2 million (based on an initial portfolio value of $1 billion).
Incorporating alternatives into the portfolio leads to a •higher likelihood of incurring a liquidity crisis. There is also a substantial increase in severity (i.e., a greater need for excess liquidity during a crisis). Moreover, the higher
t h i s p a p e r s e t s f o r t h t h e p r o p o s i t i o n that liquidity risk may be optimized in an attempt to
forestall or minimize the impact of a liquidity crisis. For a generic (but typical) endowment asset allocation, we
find that liquidity levels between 6% and 14% are optimal, all other things equal, because 95% of the time, an
allocation in this range would obviate situations in which a portfolio’s payout rate exceeds its liquidity pool (defined
for our analysis as the fixed income allocation).
likelihood and severity are driven primarily by increased incidences of rebalancing crises.1
Having committed (but not yet invested) private equity-type •capital slightly reduces the likelihood of a liquidity crisis, but increases its potential severity.
Leverage typically increases both the likelihood and •severity of a liquidity crisis, as it magnifies potential losses (and gains).
1 A rebalancing crisis occurs at year-end if there is a need to sell illiquid assets, such as alternatives, in order to buy more liquid assets, such as equities and fixed income, so as to rebalance back to the strategic benchmark. This con-stitutes a crisis as it may not be possible to sell a significant amount of illiquid assets at short notice. As seen in the latter half of 2008, a rebalancing crisis can occur if there is precipitous fall in equity markets (thereby resulting in an equity “underweight” relative to the strategic benchmark) combined with an increase in allocations to alternatives due to relative out performance versus equities (thus resulting in an alternatives “overweight” relative to the strategic benchmark).

J.p. morgan asset management 3
Incorporating alternatives, the potential for private equity-•type capital calls and leverage together significantly increas-es the likelihood of a liquidity crisis (from 29% to 40.5%) and its severity (from a potential $3.7 million payment deficit to $35.8 million).
The “optimal” fixed income allocation requisite to reduce •the likelihood of a crisis to below 5% ranges from 6.0% to 14.0%, depending on the characteristics of the endowment and portfolio composition.
Exhibit 1 illustrates these conclusions by summarizing the potential impact of alternatives, un-invested private capital commitments and leverage on both the likelihood and severity of a liquidity crisis for a generic endowment. The results in the first two columns assume a 5% allocation to fixed income with a payout rate of 5% per year (based on an average of the previous three year’s market value).
This framework also provides insights for tail risk events involving a particularly severe liquidity crisis. For a generic endowment portfolio, the analysis indicates that in order to reduce the severity of a liquidity crisis to zero (i.e., eliminate risk completely), the allocation to fixed income would have to be around 35% (close to seven times the payout rate
e x e c u t I v e s u m m a r y
scenario likelihood of crisis (%)3
average excess liquidity needed during crisis3 ($ millions)
desirable Fixed Income allocation (%)4
Base case (No Alternatives) 29.0 3.2 6.0
+60% Alternatives 36.0 16.8 10.0
+10% Un-invested PE Commitments 33.0 22.1 11.0
+20% Equity Leverage 44.0 28.2 12.0
Combined: 60% Alternatives +10% Un-invested PE Commitments +20% Equity Leverage 40.5 35.8 14.0
3 Based on initial portfolio value of $1 billion. Initial allocation: Treasuries 5%, Equities 35%, Alternatives of 60%. 4 Fixed income allocation necessary to reduce likelihood of liquidity crisis to under 5%.Source: J.P. Morgan Asset Management. Note: For illustrative purposes only.
exhIbIt 1: summary oF key results For generIc endowment portFolIo wIth 5% In FIxed Income
of 5%)2. Of course, such an allocation would entail a very significant opportunity cost in terms of forgone returns based solely on a desire to mitigate extreme liquidity events (the proverbial “100 year flood”). In our view, reducing the likelihood of a liquidity crisis to below 5%, as noted above, may be undesirable for all but the most risk averse and least return-sensitive endowments.
It is worth noting that although our discussion herein focuses on endowments, the need for adequate liquidity is equally valid for other institutional investors, such as foundations, corporate defined benefit pension plans and public sector pension plans that also have committed cash flow obligations. This concept can be extended to other institutional investor types to incorporate their specific liability characteristics. However, such an extension is not explicitly considered in this paper.
2 An allocation of 35% to fixed income would address the single most extreme multi-year liquidity crisis in our simulation model. To be clear, the likelihood of incurring such a crisis is extremely minute. We calculate it here simply to illustrate the point that it is difficult to fully protect against such extreme left tail risks without a significant opportunity cost in terms of expected return.

4 deFendIng the endowment model: quantIFyIng lIquIdIty rIsk
a s s e s s I n g l I q u I d I t y r I s k
To be sure, any number of risk variables affect investment returns and liquidity risk is merely one among many (others include upside potential, manager selection, extreme left tail risk, etc.) In the case of an extreme left tail event, for example, these calculations determine that a liquidity allocation of 35% would be required to avoid any liquidity crisis whatsoever. However, locking up such a large allocation in a lower return-ing asset class, such as Treasuries, would likely result in sub-optimal returns relative to long-term goals and, therefore, is not practicable in our view.
We recognize that each endowment handles the challenge of assessing risk in a way that is unique to its long-term return goals, risk tolerance and other circumstances. As such, it is not the objective of this study to put forth a “one-size-fits-all” model for every endowment, large and small. In fact, we believe that determining optimal liquidity risk exposure is a highly customized process and that the generic param-eters isolated herein provide no more than broad empirical guidelines. For a customized portfolio liquidity analysis, please contact your J.P. Morgan representative.
5 For more on this, see Abdullah Sheikh and Hongtao Qiao, “Non-normality of Market Returns: A Framework for Asset Allocation Decision-Making,” J.P. Morgan Asset Management, 2009.
o u r a n a l y s i s f o c u s e s o n several liquidity risk management case studies depicting likely scenarios for
generic endowment portfolios. All calculations are based on our proprietary non-normality analytical framework
(see the Appendix for more on this). Indeed, in many ways liquidity risk is an extension of J.P. Morgan Asset
Management’s existing research into risk management issues impacting endowments and other institutional
investors. In particular, it builds upon an exploration of the aforementioned non-normality paradigm detailed in
our 2009 white paper “Non-normality of Market Returns: A Framework for Asset Allocation Decision-Making.”5

J.p. morgan asset management 5
a word on the endowment modelAs we noted above, the term “endowment model” is somewhat of an elastic concept. Perhaps the best known articulation has been offered by David Swensen, chief investment officer of Yale University and one of the primary architects of what is commonly referred to as the modern endowment model (or, in some circles, the “Yale model”).6 While the aggressive invest-ment diversification precepts Swensen champions are widely admired, most endowments have been rather more conser-vative when it comes to their own asset allocation formulas and portfolio construction methodology. Yet prior to the early 1990s, most endowments invested only in traditional asset classes such as long-only equity and fixed income, rebalancing routinely in order to maintain their status quo allocations.7 By that yardstick, endowments in the 21st Century have warmly embraced alternatives.
Concerns about volatility and a desire for enhanced returns have led more and more endowments—along with other institutional investors—to move beyond the narrow confines of stocks and bonds and into less liquid strategies, often with an overlay of leverage at the portfolio level to provide higher returns. For nearly two decades, that trade-off between (low) liquidity and (high) returns seemed to be a winning strategy, encouraging endowments to venture out further and further from their once highly liquid moorings. According to the 2009 NACUBO Commonfund Study of Endowments, average allocations to “alternative” asset classes by large endow-ments with over $1 billion in assets under management hit 61%—a figure considerably higher than the average alloca-tions to alternatives by similar-sized corporate and public pension plans in the U.S.
The downside of maintaining high allocations to alternatives became patently evident during the course of 2008 and 2009 when credit markets seized up and, at the darkest hour, only the most liquid of investments found buyers at any price. The consequent liquidity squeeze has given pause to the broader investor community—and endowments in particular—by bring-ing into question some of the fundamental assumptions about that “trade-off” between liquidity and returns.
As noted above, for the most part, only the largest of endow-ments had allocations to alternatives well in excess of one-half of total assets. In general, endowments and foundations (small, mid-sized and large) have the highest average allocations to al-ternatives (26%) among a representative sample of institutional investors, according to a new J.P. Morgan Asset Management survey, but those allocations are expected to grow more slowly over the coming year (to 31%) than for other institutional inves-tors.8 It is our belief that the endowment model is not broken per se, but that endowments should be more cognizant of liquidity as a key risk variable, and use that knowledge to guide their approach to asset allocation and portfolio construction going forward.
liquidity: crisis and severityIt is tempting to create a very complex model with a detailed specification of each and every variable that may contribute to or detract from portfolio liquidity. However, given the binary nature of a liquidity crisis (i.e., it either happens or it doesn’t), an overly detailed specification—compared to the more intuitive approach as we outline below—may prove somewhat counter-productive. The limited number of historical precedents to the recent liquidity crisis faced by many endowments, the hetero-geneous nature of alternative asset classes and the ever-evolv-ing nature of portfolios all present significant obstacles to a factor-based approach to modeling illiquidity. How then can we calculate liquidity risk? Let’s start by defining what constitutes liquidity risk within our framework.
For any given endowment, the acid test of liquidity risk comes down to the likelihood and extent of a liquidity crisis. We define a liquidity crisis, or liquidity event, as a situation in which, due to adverse movements in the financial markets, a portfolio’s
6 For more on the “Yale model,” see David Swensen, Pioneering Portfolio Manage-ment: An Unconventional Approach to Institutional Investment, Free Press, 2000.
7 Leibowitz, Bova and Hammond.
8 For the purposes of the survey, “alternatives” were defined as: hedge funds, pri-vate equity, commercial real estate, infrastructure, commodities and other real assets. For more on the survey results, see “Market Pulse: Alternative Assets Survey,” J.P. Morgan Asset Management, July 2010.
9 We should note that our definition of a liquidity crisis is distinct from a solvency crisis. The latter is when the institution or individual does not have assets—liquid or illiquid—adequate to pay for maturing liabilities. One could argue that not having enough fixed income in the portfolio to cover payouts, which we describe as a liquidity crisis, does not constitute a liquidity crisis, but rather simply a liquidity “issue.” We acknowledge this as an equally valid alternative terminology for what our framework calculates.
a s s e s s I n g l I q u I d I t y r I s k

6 deFendIng the endowment model: quantIFyIng lIquIdIty rIsk
payout rate exceeds its liquidity pool (defined as the portfolio’s fixed income allocation).9 For example, if a portfolio’s fixed income allocation falls to 3% of total assets in a given portfolio and the payout rate remains at 5%, we would describe this event as a liquidity crisis. In such a scenario, the portfolio would need to rely on non-fixed income holdings to raise cash or capital through debt issuance to finance excess payouts.
The likelihood of encountering a liquidity crisis is perhaps the single most overriding concern among endowments today. But we contend the severity of a liquidity crisis is just as important—if not more so—because of the obvious logic that a limited liquidity event is much easier to cope with than a major liquidity event.
Severity is determined by the average amount a payout rate exceeds the fixed income allocation. So for a given allocation to fixed income, severity represents the excess liquidity that would need to be sourced in the event of a liquidity crisis—again, either from non-fixed income investments (through sales at distressed prices) or through the capital markets (at a potentially high cost of borrowing). The more severe a liquid-ity crisis, the higher the amount of funds needed to cover the excess payout. For example, if a $1 billion portfolio with a 3% fixed income allocation has to pay out 5% (i.e., is in the midst of a liquidity crisis) the excess payout would be 2% of that $1 billion, or $20 million.
Our attempt to analyze liquidity risk (both in terms of likeli-hood and severity) implies an optimal set of allocations to
liquid assets based on varying levels of payout rates, leverage, uncalled private equity-type capital commitments and asset allocation strategies. For any given asset allocation, includ-ing fixed income, our calculations also outline an additional allocation of “excess liquidity.” This refers to the liquidity that would potentially be required (beyond a regular fixed income allocation) in order to ride out a liquidity crisis should one materialize. The excess liquidity calculations used are not a recommendation to fixed income per se, but rather an outlier indicator designed to provide guidance on minimizing liquid-ity risk (albeit at a presumably large opportunity cost in the form of forgone returns.) Of course, excess liquidity will vary across endowments with different payout rates, asset alloca-tion strategies, leverage, private equity-type programs and rebalancing frequency.
To be sure, the calculations for these two core metrics—like-lihood and severity—do not include other possible sources of liquidity such as coupons, dividends, cash flow from invest-ments or access to capital markets, which are all potentially available to an endowment. We define liquidity in rather narrow terms as simply the fixed income allocations available to the fund. Our rationale for limiting the scope is that during periods of market crisis these other sources of liquidity may be either entirely unavailable or prohibitively expensive to access. Therefore, assuming other sources of liquidity are not available means that our analysis of liquidity crisis probabili-ties better informs the “worst case scenarios” than it does “best case scenarios.”
a s s e s s I n g l I q u I d I t y r I s k

J.p. morgan asset management 7
m o d e l I n g l I q u I d I t y r I s k
Based on our simulations, we calculate the number of occur-rences of a liquidity crisis at the total portfolio level for each of our simulated 10 years. We divide the total number of those liquidity events by the number of simulations (10,000) and the number of years (10) to arrive at a probability of occurrence. To determine severity figures, we calculate the average excess payout (i.e., the difference between the payout and fixed income allocation) when a liquidity crisis does occur across all of the simulated liquidity crises.
to a d d r e s s o u r c o r e c o n c e r n s around the likelihood and severity of a liquidity crisis, we simulate
10,000 values for our generic portfolio in real terms based on J.P. Morgan’s Long Term Capital Market Return
Assumptions over the next 10 years. For the purpose of this exercise, we assume payouts are executed at the
end of each year from the portfolio holdings—first out of the most liquid asset class, then in decreasing order of
liquidity. We also predicate that our portfolio is rebalanced on an annual basis back to its “strategic normal” in
order to ensure that liquid assets are replenished at the end of the year.
base case: simple scenarioIn order to determine the likelihood or severity of a liquidity crisis at the total portfolio level, a hypothetical endowment portfolio needs to be established. To illustrate the mechan-ics of our framework, we begin with a simple portfolio—one with no allocations to alternative asset classes or leverage. In subsequent sections, more realistic portfolios and models—incorporating alternative asset classes and leverage—are built to capture the dynamics of a liquidity crisis. Although this simple portfolio is not representative of a typical endow-ment, it does allow us to form a useful base case to compare our subsequent—more advanced—modeling results. Exhibit 2 shows this portfolio.

8 deFendIng the endowment model: quantIFyIng lIquIdIty rIsk
The results for various fixed income allocations are summa-rized in Exhibit 3. It comes as no surprise that the higher the fixed income allocation, the lower the likelihood and severity of a liquidity crisis. We should note here that in the various iterations we ran, any changes in fixed income allocations at the total portfolio level are taken from (or added to) equities.
For example, based on a payout rate rule of approximately 5.0% per year and a 5.0% allocation to U.S. Treasuries, the probability this simple portfolio experiences a liquidity crisis over a 10-year period is 28.8%. In statistical terms, that implies a liquidity crisis once every three years, but with a sever-ity level equivalent to only $3.2 million (based on an initial portfolio value of $1 billion). To restate the premise, that is the amount by which the payout rate would, on average, exceed the fixed income allocation—in the 28.8% of scenarios that a liquidity crisis does occur. For many endowments, even that
m o d e l I n g l I q u I d I t y r I s k
amount may be too high to contemplate given the likelihood of recurrence every third year. Our analysis indicates, however, that as long as a fixed income allocation near the 6.0% level is maintained, then the probability of a liquidity crisis may be cut to less than 5.0%, all other things equal. This result is driven to a great degree by the ability of the fund to constantly replenish its fixed income assets at the end of the year through rebalancing—an assumption relaxed in the next section. We will use the 5.0% “optimal” likelihood as a benchmark of sorts as we explore these other liquidity risk scenarios.
Fixed income allocation (%)
Like
lihoo
d of
liqu
idit
y cr
isis
(%)
Seve
rity
of l
iqui
dity
cri
sis
($m
m)
Likelihood (%) Severity ($ millions)
0
2
4
6
8
10
12
0
20
40
60
80
100
3.5 4.0 4.5 5.0 5.5 6.0
exhIbIt 3: sImple scenarIo—lIkelIhood and severIty (over 10- year perIod based on 5% payout rate rule)11
11 The payout rate is calculated as 5% of the average of the previous three years’ market value.
12 A liquidity crisis is defined as a scenario where, due to movements in the financial markets, the portfolio’s payout rate exceeds its fixed income allocation.
13 The severity of a liquidity crisis is defined as the average amount by which the payout rate exceeds the fixed income allocation, when a liquidity event does materialize.
Source: J.P. Morgan Asset Management. Note: For illustrative purposes only.
Fixed Income allocation (%)
equity allocation (%)
likelihood
(%)12
severity ($ millions)13
3.5 96.5 99.7 12.0
4.0 96.0 92.8 7.5
4.5 95.5 67.3 4.5
5.0 95.0 28.8 3.2
5.5 94.5 9.8 2.6
6.0 94.0 2.9 2.2
exhIbIt 2: sImple endowment portFolIo “a” (no alternatIves)
asset class benchmark Index allocation
FIxed Income 5%
U.S. Treasuries Barclays Capital Intermediate Treasury Index
5%
equIty 95%
U.S. Large Cap Equity S&P 500 Total Return Index 65%
International Equity MSCI EAFE (hedged) Total Return Index
30%
total 100%
key statistics10
Expected arithmetic return 8.6%
Expected volatility 14.2%
Expected compound return 7.7%
Sharpe ratio 0.36
10 Calculated based on J.P. Morgan’s Long Term Capital Market Return Assumptions. Source: J.P. Morgan Asset Management. Note: For illustrative purposes only. Sharpe ratio calculated assuming a risk-free rate of return of 3.5%.

J.p. morgan asset management 9
case study a: alternatives and rebalancing IssuesThe simple scenario in the last section did not allow for the impact illiquid investments, such as alternative asset classes, have on the likelihood and severity of a liquidity crisis. It also ignores potential rebalancing issues the fund may face at year end due to extreme movements in the financial markets. In practice, both illiquid investment holdings and frequent rebal-ancing schedules are key components of many endowments’ strategic policy. In this section, a more realistic hypothetical endowment portfolio is assumed, one with both liquid and illiquid investments from which to base the assessments. We also allow for potential rebalancing issues the fund may face during periods of crisis. Exhibit 4 shows an endowment portfolio (identified as “B”) with allocations across six major asset classes. As before, our endowment portfolio has assets worth $1 billion and a payout rate of 5% per year. We calculate
that rate by averaging the previous three years’ market value of assets.
Like many large endowments, our hypothetical endowment has employed a fairly aggressive asset allocation, at least compared to the typical institutional investor. The portfolio has an expectation of compound annual returns on the order of 8.1% with an expected volatility of 12.6% per annum based on our Long Term Capital Market Return Assumptions. Our calculations indicate that the portfolio has a Conditional Value at Risk (or expected shortfall) of $569 million, or 56.9% of the portfolio’s initial value. Additionally, we calculate the probability of preserving inter-generational equity over a given 10-year term at 58% (based on our payout rate of 5%). Although these two calculations are not referenced going forward, we show them for illustrative purposes, as they are generally considered important measures in assessing an endowment’s asset allocation policy.
m o d e l I n g l I q u I d I t y r I s k
exhIbIt 4: generIc endowment portFolIo “b”
asset class benchmark Index allocation liquid during crisis?
FIxed Income 5%
U.S. Treasuries Barclays Capital Intermediate Treasury Index 5% Yes
equIty 35%
U.S. Large Cap Equity S&P 500 Total Return Index 25% Yes, but potentially subject to distressed sale price
International Equity MSCI EAFE (hedged) Total Return Index 10% Yes, but potentially subject to distressed sale price
alternatIves 60%
Fund of Hedge Funds HFRI Fund of Funds Diversified Index 30% No
Private Equity Wilshire Micro Cap Total Return Index 30% No
total 100%
key statistics14
Expected arithmetic return 8.8%
Expected volatility 12.6%
Expected compound return 8.0%
Sharpe ratio .42
CVaR95 under non-normality15 $569 million
Probability of preserving inter-generational equity based on 5% payout rate16 58%
14 Calculated based on J.P. Morgan’s Long Term Capital Market Return Assumptions. 15 CVaR95 is defined as the average (real) portfolio loss in the worst 5% of simulations at the end of ten years.16 Inter-generational equity is preserved where the real value of the portfolio at the end of ten years is equal to or higher than its initial value. Source: J.P. Morgan Asset Management. Note: For illustrative purposes only. Sharpe ratio calculated assuming a risk-free rate of return of 3.5%.

10 deFendIng the endowment model: quantIFyIng lIquIdIty rIsk
As in the simple case study above, the portfolio rebalances annually back to its strategic benchmark. However, the pro-cess of rebalancing, in and of itself, entails risks. As observed in the second half of 2008, extreme market movements can compromise the ability of a given portfolio to rebalance back to its strategic benchmark. This is particularly true if rebal-ancing entails a need to sell illiquid alternative investments in order to fund added equity and fixed income allocations. To assess this type of liquidity risk, our analysis explicitly takes into account instances when the ability of the fund to rebalance back to a strategic benchmark is compromised. In particular, the framework suspends rebalancing during periods of precipitous declines in equity markets (thereby resulting in an equity “underweight” relative to the strategic benchmark) that are also coupled with significant increases in the allocation to alternatives, due to relative out performance versus equities (thus resulting in an alternatives “overweight” relative to the strategic benchmark).
Not being able to rebalance at year-end exacerbates the likelihood of a liquidity crisis since payouts—as defined in our model—are exclusively financed out of fixed income alloca-tions. As allocations of liquid assets dwindle without being replenished the likelihood and severity of a liquidity crisis both increase. Exhibit 5 summarizes results for various fixed income allocations within a generic portfolio. Changes in fixed income at the total portfolio level are taken from (or added to) “fund of hedge funds” and “private equity” in equal proportions.
To take one example, the likelihood of a liquidity crisis in a portfolio with a 6.0% fixed income allocation increases from 2.9% to 14.4%—which is significantly above the “optimal” 5.0% probability threshold. Moreover, not being able to rebalance also significantly increases the severity of liquidity crises. Our calculations show that the portfolio’s allocation to fixed income would need to reach 10.0% in order to reduce the likelihood of a liquidity crisis to below 5.0%. Yet even by nearly doubling the most liquid allocation in the portfolio, the severity figures only fall to $23.5 million. This indicates that despite mitigating the most likely of liquidity crises, the remainder (in the worst 5% of times) is still sufficiently severe to require consider-able additional liquidity. Budgeting for these extreme tail risk scenarios would require substantial increases in liquid alloca-tions. But we believe such increases entail too significant an opportunity cost in terms of forgone returns to be considered broadly worthwhile.
case study b: leverage The examples shown above may still not be representative of many actual endowment portfolios, especially at endowments that employ some form of leverage at the total portfolio level. Of course, the idea behind leverage is to expand the efficient frontier; maximizing return while minimizing the amount of risk undertaken. To address the very relevant issue of leverage’s impact on the likelihood and severity of a liquidity crisis, we implement varying levels of leverage on our generic portfolio with fixed income allocations of 4.0% and 10.0%, respectively. As was the case in the previous modeling, all portfolios have a payout rate of 5.0% (based on an average of the last three years’ portfolio value). We also
m o d e l I n g l I q u I d I t y r I s k
Fixed income allocation (%)
Like
lihoo
d of
liqu
idit
y cr
isis
(%)
Seve
rity
of l
iqui
dity
cri
sis
($m
m)
Likelihood (%) Severity ($ millions)
0
20
40
60
80
100
3.0 4.0 5.0 6.0 7.0 8.0 9.0 10.00
5
10
15
20
25
30
exhIbIt 5: IncorporatIng alternatIves and rebalancIng Issues—lIkelIhood and severIty oF lIquIdIty crIsIs (over 10-year perIod based on 5% payout rate rule)17
17 The payout rate is calculated as 5% of the average of the previous three years’ market value.
18 A liquidity crisis is defined as a scenario where, due to movements in the finan-cial markets, the portfolio’s payout rate exceeds its fixed income allocation.
19 The severity of a liquidity crisis is defined as the average amount by which the payout rate exceeds the fixed income allocation, when a liquidity event does materialize.
Source: J.P. Morgan Asset Management. Note: For illustrative purposes only.
Fixed Income allocation (%)
alternatives allocation (%)
likelihood
(%)18
severity ($ millions)19
3.0 62 100.0 22.3
4.0 61 91.4 13.4
5.0 60 35.5 16.8
6.0 59 14.4 29.0
7.0 58 12.0 26.0
8.0 57 10.8 19.0
9.0 56 7.1 17.1
10.0 55 3.4 23.5

J.p. morgan asset management 11
allow for potential rebalancing issues that the portfolio might face amid extreme market movements.
In this analysis, leverage in the form of a long position in S&P 500 equity futures is assumed at the total portfolio level. The cost of borrowing is a long-term cash rate of 3.5% per year. In arriving at the expected return assumption for the S&P 500 equity futures position, the following rationale is applied:
Long position in S&P 500 equity futures
Long position in risk free rate
long position in underlying s&p 500 equity index
+
=
This assumes that margin requirements for the future are funded exclusively from fixed income allocations so that margin calls work to reduce total portfolio liquidity. On the other hand, when the futures net positive (i.e., there is a gain from the levered position), it improves portfolio liquidity as allocations to fixed income rise (in order to fund cash outflows).
Exhibit 6 shows that for a portfolio with 4% in fixed income, increased leverage reduces the likelihood of a liquidity crisis, but increases its severity. In other words, the positive expected return from the levered S&P 500 position, coupled with the already relatively high likelihood of a crisis due to a low fixed income allocation, actually reduces the probability of the payout rate exceeding the fixed income allocation. At
m o d e l I n g l I q u I d I t y r I s k
the same time, when liquidity events do occur in a levered portfolio, their severity is magnified as a result of negative returns from the leverage. This is an example of how leverage can mitigate the likelihood of a liquidity crisis when the fixed income allocation is at or below the payout rate. (However, leverage also increases the severity of a liquidity crisis no matter what the fixed income allocation is in relation to the payout rate.)
But what about when a fixed income allocation is above the payout rate? To test this assumption, the likely impact on a portfolio with a 10% allocation to fixed income can be calculated. While this reduces the likelihood of a liquidity crisis to 5% (within our “optimized” benchmark range), the effect of leverage is very different compared to a sub-5% fixed income portfolio. In fact, as depicted in Exhibit 7, the analysis shows that leverage works to increase the likelihood of a liquidity crisis. Since the initial portfolio is already well protected against illiquidity risk (with a higher fixed income
Fixed income allocation (%)
Like
lihoo
d of
liqu
idit
y cr
isis
(%)
Seve
rity
of l
iqui
dity
cri
sis
($m
m)
Likelihood (%) Severity ($ millions)
0
10
20
30
40
50
60
70
80
90
100
0.0 5.0 10.0 15.0 20.0 25.0 30.0 35.0 40.0 45.00
10
20
30
40
50
60
70
exhIbIt 6: leverage—lIkelIhood and severIty oF lIquIdIty crIsIs
4% Fixed Income (61% alternatives)
10% Fixed Income (55% alternatives)
s&p 500 leverage (as % of
portfolio) likelihood
(%)20
severity ($ millions)21
likelihood
(%)20
severity ($ millions)21
0.0 91.4 13.4 3.4 23.5
5.0 70.3 16.9 4.9 21.0
10.0 61.1 21.7 6.0 22.7
15.0 56.8 26.3 6.1 27.0
20.0 54.0 31.1 7.2 28.7
25.0 52.0 36.2 9.2 28.5
30.0 50.5 41.4 12.0 29.4
35.0 49.3 46.8 14.8 31.7
40.0 48.3 52.3 17.2 35.4
45.0 47.6 57.7 19.5 39.4
20 A liquidity crisis is defined as a scenario where, due to movements in the finan-cial markets, the portfolio’s payout rate exceeds its fixed income allocation.
21 The severity of a liquidity crisis is defined as the average amount by which the payout rate exceeds the fixed income allocation, when a liquidity event does materialize.
Source: J.P. Morgan Asset Management. Note: For illustrative purposes only.
exhIbIt 7: leverage—lIkelIhood and severIty oF lIquIdIty crIsIs wIth 4% and 10% FIxed Income allocatIons

12 deFendIng the endowment model: quantIFyIng lIquIdIty rIsk
allocation), adding additional risk—in this case in the form of S&P 500 futures—simply increases the likelihood (albeit marginally) that the portfolio’s payout rate exceeds its fixed income allocation.
Exhibit 8 shows the impact of different fixed income alloca-tions for a portfolio 20% levered using S&P 500 futures. Our analysis indicates that to reduce the likelihood of a crisis to below 5.0%, allocations to fixed income would have to increase to 12.0% of the total portfolio. Notably, this is 2.0% higher than the “optimal” fixed income allocation for a port-folio with no leverage.
m o d e l I n g l I q u I d I t y r I s k
While we have used S&P 500 futures as a proxy for leverage at the total portfolio level, leverage may also be obtained through investments in Treasury futures. Given the effective-ness of Treasuries as a portfolio diversifier during periods of extreme market stress, this strategy is gaining traction amongst many of the largest institutional investors. So how does employing Treasury futures affect liquidity within our framework? Exhibit 9 displays calculations for the likeli-hood and severity of liquidity crises for varying fixed income allocations assuming a 20% levered portfolio using Treasury futures. The resultant analysis indicates that, although lever-age in general increases the likelihood of a crisis for any given fixed income allocation, overlaying 20% Treasury futures on a well-diversified portfolio does not necessarily increase the liquidity requirements of a portfolio. In other words, the “op-
Fixed income allocation (%)
Like
lihoo
d of
liqu
idit
y cr
isis
(%)
Seve
rity
of l
iqui
dity
cri
sis
($m
m)
Likelihood (%) Severity ($ millions)
0
10
20
30
40
50
60
4.0 5.0 6.0 7.0 8.0 9.0 10.0 11.0 12.00
5
10
15
20
25
30
35
exhIbIt 8: leverage usIng s&p 500 Futures—lIkelIhood and severIty oF lIquIdIty crIsIs
22 A liquidity crisis is defined as a scenario where, due to movements in the finan-cial markets, the portfolio’s payout rate exceeds its fixed income allocation.
23 The severity of a liquidity crisis is defined as the average amount by which the payout rate exceeds the fixed income allocation, when a liquidity event does materialize.
Source: J.P. Morgan Asset Management. Note: For illustrative purposes only.
20% s&p 500 levered portfolio
Fixed Income allocation (%)
alternatives allocation (%)
likelihood
(%)22
severity ($ millions)23
4.0 61 54.0 31.1
5.0 60 43.5 28.2
6.0 59 32.7 26.2
7.0 58 23.0 25.5
8.0 57 15.5 25.7
9.0 56 10.2 27.4
10.0 55 7.2 28.7
11.0 54 5.1 29.2
12.0 53 4.0 28.4
Fixed income allocation (%)
Like
lihoo
d of
liqu
idit
y cr
isis
(%)
Seve
rity
of l
iqui
dity
cri
sis
($m
m)
Likelihood (%) Severity ($ millions)
0
10
20
30
40
50
60
70
80
4.0 5.0 6.0 7.0 8.0 9.0 10.00
5
10
15
20
25
exhIbIt 9: leverage—lIkelIhood and severIty oF lIquIdIty crIsIs wIth 20% treasury Futures leverage
24 A liquidity crisis is defined as a scenario where, due to movements in the finan-cial markets, the portfolio’s payout rate exceeds its fixed income allocation.
25 The severity of a liquidity crisis is defined as the average amount by which the payout rate exceeds the fixed income allocation, when a liquidity event does materialize.
Source: J.P. Morgan Asset Management. Note: For illustrative purposes only.
20% treasury levered portfolio
Fixed Income allocation (%)
alternatives allocation (%)
likelihood
(%)24
severity ($ millions)25
4.0 61 74.7 17.3
5.0 60 44.0 16.4
6.0 59 22.2 19.7
7.0 58 13.1 22.3
8.0 57 9.3 21.3
9.0 56 6.4 20.1
10.0 55 4.1 20.2

J.p. morgan asset management 13
timal” fixed income allocation (to reduce the likelihood of a crisis to below 5.0%) remains at 10.0%. In fact, compared to a portfolio with no leverage, the severity of a potential liquidity crisis goes down—from $23.5 million to $20.2 million. In this respect, we find that Treasury futures do help portfolio liquid-ity in extreme market scenarios.
case study c: “uncalled” private equity capital commitmentsAnother dimension to the liquidity issue for endowments involves committed allocations to illiquid investments such as private equity or other private partnerships. A private equity-type program can create liquidity issues for an endowment through untimely capital calls for promised investment funds, especially during a market downturn. This is similar to the scenario that played out for many endowments in the second half of 2008.
To investigate this issue, we model a generic portfolio in which 30% of total assets have been allocated to private equity, but only two-thirds of that (20% of the portfolio) has actually been invested so far. In the interim, the remaining one-third in committed capital is invested in U.S. Large Cap Equity (see Exhibit 10). Importantly, this analysis allows for potential
m o d e l I n g l I q u I d I t y r I s k
rebalancing issues the portfolio might face as a result of extreme market movements.
Intuitively, in cases where the portfolio has committed but not invested private equity capital, rebalancing crises tend to occur less frequently than when fully invested because the portfolio is already “underweight” alternatives and “overweight” equities to begin with. Yet until it becomes fully invested, there is always the possibility of a capital call by the private equity manager at an inopportune time. In such an instance, the portfolio would need to liquidate its “interim” equity holdings—potentially at much depressed prices amid a market correction—and thereby be forced to rely on its fixed income allocation to fund any difference between the capital call and available capital.
Assuming such a “worst case” scenario, the situation for our generic portfolio is nearly identical to the liquidity analy-sis in the previous section, which involved the use of a le-vered S&P 500 position over the strategic portfolio to model probabilities. However, instead of the clearing house acting as a counterparty to the futures position, the counterparty in this case would be a private equity manager demanding capi-tal. Using this analogy, likelihood and severity calculations for a liquidity crisis can be derived using various allocation levels to private equity programs, as in Exhibit 11.
Our analysis indicates that an endowment with 10% commit-ted—but not yet invested—private equity capital would need to increase its allocation to fixed income to 11% in order to reduce the likelihood of a liquidity crisis to below our “optimized” level of 5%. Note that this is 1% higher than the recommended allocation to fixed income when the portfolio is fully invested (Case Study A). However, the additional liquidity required during crisis periods is, in fact, lower than in Case Study A.
exhIbIt 10: generIc portFolIo wIth uncalled prIvate equIty commItments
asset classInterim
allocation (%)strategic
allocation (%)
FIxed Income 5 5
U.S. Treasuries 5 5
equIty 45 35
U.S. Large Cap Equity 35 25
International Equity 10 10
alternatIves 50 60
Fund of Hedge Funds 30 30
Private Equity 20 30
total 100 100
Source: J.P. Morgan Asset Management. Note: For illustrative purposes only. Sharpe ratio calculated assuming a risk-free rate of return of 3.5%.
14 deFendIng the endowment model: quantIFyIng lIquIdIty rIsk
m o d e l I n g l I q u I d I t y r I s k
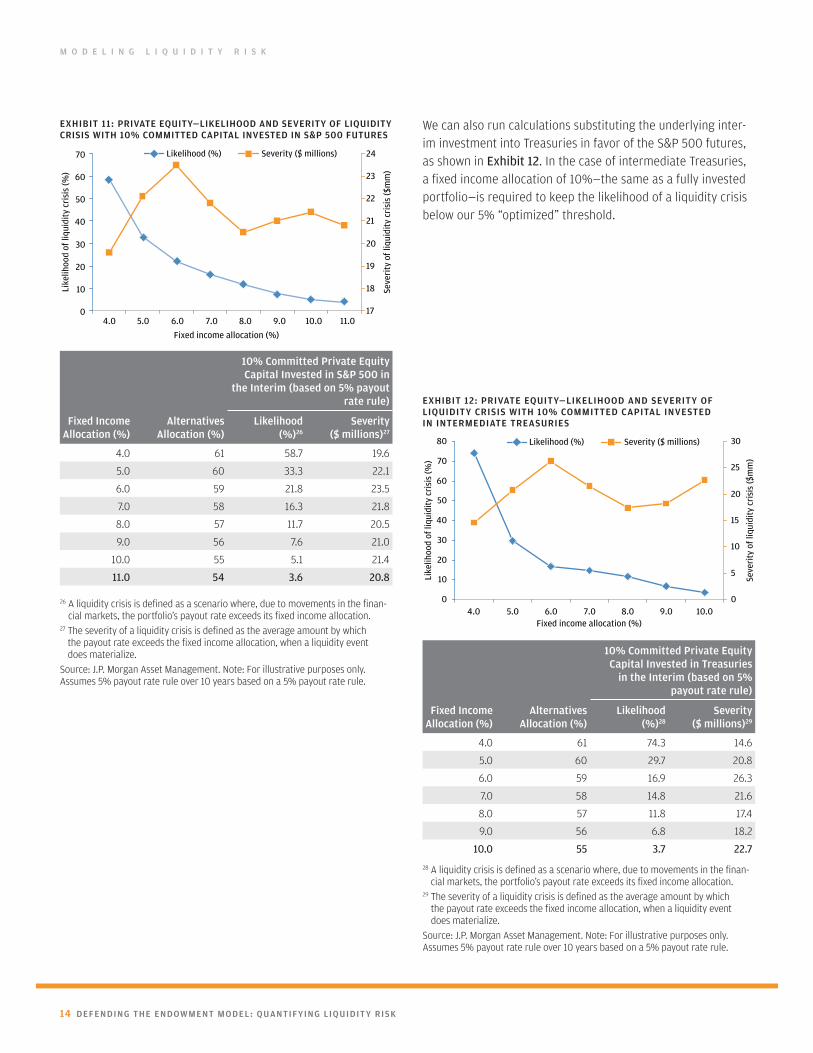
We can also run calculations substituting the underlying inter-im investment into Treasuries in favor of the S&P 500 futures, as shown in Exhibit 12. In the case of intermediate Treasuries, a fixed income allocation of 10%—the same as a fully invested portfolio—is required to keep the likelihood of a liquidity crisis below our 5% “optimized” threshold.
Fixed income allocation (%)
Like
lihoo
d of
liqu
idit
y cr
isis
(%)
Seve
rity
of l
iqui
dity
cri
sis
($m
m)
Likelihood (%) Severity ($ millions)
0
10
20
30
40
50
60
70
4.0 5.0 6.0 7.0 8.0 9.0 10.0 11.017
18
19
20
21
22
23
24
exhIbIt 11: prIvate equIty—lIkelIhood and severIty oF lIquIdIty crIsIs wIth 10% commItted capItal Invested In s&p 500 Futures
26 A liquidity crisis is defined as a scenario where, due to movements in the finan-cial markets, the portfolio’s payout rate exceeds its fixed income allocation.
27 The severity of a liquidity crisis is defined as the average amount by which the payout rate exceeds the fixed income allocation, when a liquidity event does materialize.
Source: J.P. Morgan Asset Management. Note: For illustrative purposes only. Assumes 5% payout rate rule over 10 years based on a 5% payout rate rule.
10% committed private equity capital Invested in s&p 500 in
the Interim (based on 5% payout rate rule)
Fixed Income allocation (%)
alternatives allocation (%)
likelihood
(%)26
severity ($ millions)27
4.0 61 58.7 19.6
5.0 60 33.3 22.1
6.0 59 21.8 23.5
7.0 58 16.3 21.8
8.0 57 11.7 20.5
9.0 56 7.6 21.0
10.0 55 5.1 21.4
11.0 54 3.6 20.8
Fixed income allocation (%)
Like
lihoo
d of
liqu
idit
y cr
isis
(%)
Seve
rity
of l
iqui
dity
cri
sis
($m
m)
Likelihood (%) Severity ($ millions)
0
10
20
30
40
50
60
70
80
4.0 5.0 6.0 7.0 8.0 9.0 10.00
5
10
15
20
25
30
exhIbIt 12: prIvate equIty—lIkelIhood and severIty oF lIquIdIty crIsIs wIth 10% commItted capItal Invested In IntermedIate treasurIes
28 A liquidity crisis is defined as a scenario where, due to movements in the finan-cial markets, the portfolio’s payout rate exceeds its fixed income allocation.
29 The severity of a liquidity crisis is defined as the average amount by which the payout rate exceeds the fixed income allocation, when a liquidity event does materialize.
Source: J.P. Morgan Asset Management. Note: For illustrative purposes only. Assumes 5% payout rate rule over 10 years based on a 5% payout rate rule.
10% committed private equity capital Invested in treasuries
in the Interim (based on 5% payout rate rule)
Fixed Income allocation (%)
alternatives allocation (%)
likelihood
(%)28
severity ($ millions)29
4.0 61 74.3 14.6
5.0 60 29.7 20.8
6.0 59 16.9 26.3
7.0 58 14.8 21.6
8.0 57 11.8 17.4
9.0 56 6.8 18.2
10.0 55 3.7 22.7

J.p. morgan asset management 15
m o d e l I n g l I q u I d I t y r I s k
case study d: aggregate impact of alternatives, “uncalled” private equity capital commitments and leverage In practice, portfolios are likely to have a combination of alternatives, leverage and uncommitted private equity capital. In Exhibit 13, the combined impact on likelihood and severity of a liquidity crisis—and the implied “optimal” fixed income allocations—of all three variables is illustrated.
On an aggregate basis, all three of these factors are additive to liquidity requirements. This type of portfolio with a 5.0% allocation to fixed income would face a 40.5% likelihood of experiencing a liquidity crisis, with an average severity of $35.8 million. Our analysis suggests that to reduce likelihood to less than 5%, the portfolio would need to increase its fixed income allocation to 14%. This also reduces the potential severity of the liquidity crisis from $35.8 million to $28.5 million.
Fixed income allocation (%)
Like
lihoo
d of
liqu
idit
y cr
isis
(%)
Seve
rity
of l
iqui
dity
cri
sis
($m
m)
Likelihood (%) Severity ($ millions)
0
10
20
30
40
50
60
4.0 5.0 6.0 7.0 8.0 9.0 10.0 11.0 12.0 13.0 14.00
5
10
15
20
25
30
35
40
45
exhIbIt 13: aggregatIng lIquIdIty rIsk: rebalancIng, leverage and uncalled prIvate equIty commItments
30 A liquidity crisis is defined as a scenario where, due to movements in the financial markets, the portfolio’s payout rate exceeds its fixed income allocation.
31 The severity of a liquidity crisis is defined as the average amount by which the payout rate exceeds the fixed income allocation, when a liquidity event does materialize.
Source: J.P. Morgan Asset Management. Note: For illustrative purposes only.
aggregate Impact of alternatives, 20% s&p 500 leverage and 10%
uncalled private equity commitments (based on 5%
payout rate rule)
Fixed Income allocation (%)
alternatives allocation (%)
likelihood
(%)30
severity ($ millions)31
4.0 61 47.9 38.7
6.0 59 33.0 33.4
8.0 57 20.1 31.0
10.0 55 12.0 30.5
12.0 53 7.5 29.2
14.0 51 4.5 28.5

16 deFendIng the endowment model: quantIFyIng lIquIdIty rIsk
c o n c l u s I o n
While liquidity is just one of many issues that come into play in any total portfolio risk assessment, we posit that an optimized level of liquidity risk in relation to expected returns may help forestall or minimize the impact of a liquidity crisis. As stated above, for a generic (but typical) endowment asset allocation, we have found that liquidity levels between 6% and 14% are optimal, all other things equal, because 95% of the time, an allocation in this range would obviate situations in which a portfolio’s payout rate exceeds its liquidity pool (defined for our analysis as the fixed income allocation).
Our other key findings include: a 5% allocation to even highly liquid fixed income investments has a 29% chance of
a l t h o u g h m a n y e n d o w m e n t s w e r e b u f f e t e d by liquidity crises amid the larger financial
market turmoil over the past two years, in our view this did not undermine the long-term validity and viability of
the “endowment model” of investing, which amongst other things, seeks greater exposure to innovative alternative
asset classes. However, we believe that the illiquidity of these assets must be accounted for by quantifying and—to
the greatest extent possible—managing their inherent liquidity risk.
incurring a liquidity crisis at any given point; incorporating alternatives and potential rebalancing issues increases both the likelihood and severity of a liquidity crisis; committed (but not yet invested) private equity capital slightly reduces the likelihood of a liquidity crisis, but increases its potential severity; and leverage typically increases both the likelihood and severity of a liquidity crisis.
Notwithstanding our contention that these findings are broad-ly applicable in a general way, our calculations are based on generic portfolios and are for reference only. For a customized liquidity analysis, please contact your J.P. Morgan representa-tive for details about our bespoke program.
J.p. morgan asset management 17
a p p e n d I x Capturing Asset Class Characteristics
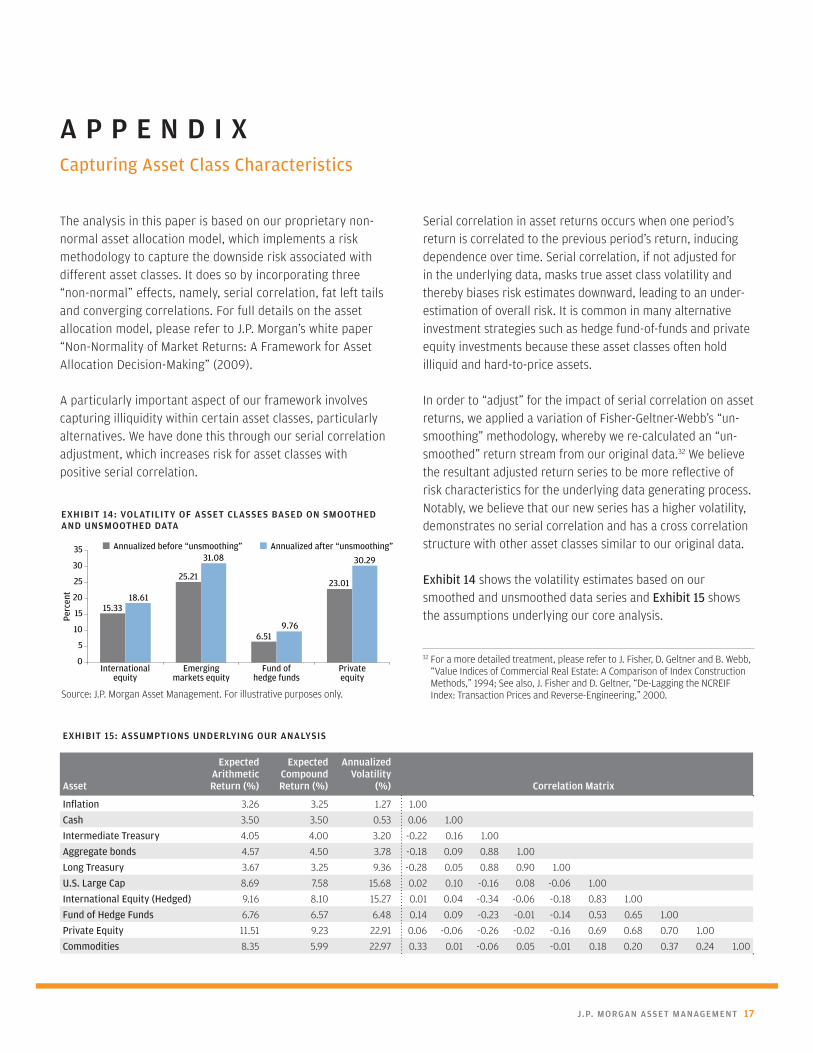
The analysis in this paper is based on our proprietary non-normal asset allocation model, which implements a risk methodology to capture the downside risk associated with different asset classes. It does so by incorporating three “non-normal” effects, namely, serial correlation, fat left tails and converging correlations. For full details on the asset allocation model, please refer to J.P. Morgan’s white paper “Non-Normality of Market Returns: A Framework for Asset Allocation Decision-Making” (2009).
A particularly important aspect of our framework involves capturing illiquidity within certain asset classes, particularly alternatives. We have done this through our serial correlation adjustment, which increases risk for asset classes with positive serial correlation.
Serial correlation in asset returns occurs when one period’s return is correlated to the previous period’s return, inducing dependence over time. Serial correlation, if not adjusted for in the underlying data, masks true asset class volatility and thereby biases risk estimates downward, leading to an under-estimation of overall risk. It is common in many alternative investment strategies such as hedge fund-of-funds and private equity investments because these asset classes often hold illiquid and hard-to-price assets.
In order to “adjust” for the impact of serial correlation on asset returns, we applied a variation of Fisher-Geltner-Webb’s “un-smoothing” methodology, whereby we re-calculated an “un-smoothed” return stream from our original data.32 We believe the resultant adjusted return series to be more reflective of risk characteristics for the underlying data generating process. Notably, we believe that our new series has a higher volatility, demonstrates no serial correlation and has a cross correlation structure with other asset classes similar to our original data.
Exhibit 14 shows the volatility estimates based on our smoothed and unsmoothed data series and Exhibit 15 shows the assumptions underlying our core analysis.
32 For a more detailed treatment, please refer to J. Fisher, D. Geltner and B. Webb, “Value Indices of Commercial Real Estate: A Comparison of Index Construction Methods,” 1994; See also, J. Fisher and D. Geltner, “De-Lagging the NCREIF Index: Transaction Prices and Reverse-Engineering,” 2000.
Perc
ent
Annualized before “unsmoothing” Annualized after “unsmoothing”
15.33
25.21
6.51
23.01
18.61
31.08
9.76
30.29
0
5
10
15
20
25
30
35
Internationalequity
Emergingmarkets equity
Fund ofhedge funds
Privateequity
exhIbIt 14: volatIlIty oF asset classes based on smoothed and unsmoothed data
Source: J.P. Morgan Asset Management. For illustrative purposes only.
exhIbIt 15: assumptIons underlyIng our analysIs
asset
expected arithmetic return (%)
expected compound return (%)
annualized volatility
(%) correlation matrix
Inflation 3.26 3.25 1.27 1.00
Cash 3.50 3.50 0.53 0.06 1.00
Intermediate Treasury 4.05 4.00 3.20 -0.22 0.16 1.00
Aggregate bonds 4.57 4.50 3.78 -0.18 0.09 0.88 1.00
Long Treasury 3.67 3.25 9.36 -0.28 0.05 0.88 0.90 1.00
U.S. Large Cap 8.69 7.58 15.68 0.02 0.10 -0.16 0.08 -0.06 1.00
International Equity (Hedged) 9.16 8.10 15.27 0.01 0.04 -0.34 -0.06 -0.18 0.83 1.00
Fund of Hedge Funds 6.76 6.57 6.48 0.14 0.09 -0.23 -0.01 -0.14 0.53 0.65 1.00
Private Equity 11.51 9.23 22.91 0.06 -0.06 -0.26 -0.02 -0.16 0.69 0.68 0.70 1.00
Commodities 8.35 5.99 22.97 0.33 0.01 -0.06 0.05 -0.01 0.18 0.20 0.37 0.24 1.00

18 deFendIng the endowment model: quantIFyIng lIquIdIty rIsk
about
J.p. morgan asset management’s strategIc Investment
advIsory group
about
J.p. morgan asset management
The Strategic Investment Advisory Group (SIAG) partners with clients to develop objective,
thoughtful solutions to the broad investment policy issues faced by corporate and public
defined benefit pension plans, insurance companies, endowments and foundations. Our global
team is one of J.P. Morgan’s primary centers for thought leadership and advisory services for
institutional clients in the areas of asset allocation, pension finance and risk management.
The team’s expertise is supported by powerful analytical capabilities for conducting asset/
liability, risk budgeting and optimal asset allocation analysis, in line with client-specific
investment guidelines, risk tolerance and return requirements. In response to the changing
needs of CFOs, treasurers and CIOs, our suite of tools has expanded to include corporate finance-
based risk management analytics for assessing and proactively managing the impact of the
pension plan on the corporation as a whole.
This paper represents the latest installment of our Global Strategic Research publication series
from SIAG. Our goal in this series is to challenge ourselves and the industry at large to think
beyond today’s immediate, tactical issues and seek insights and innovative thinking that break
new ground and newly define—or redefine—areas of opportunity for investors. Global Strategic
Research takes an in-depth, hard-nosed research perspective which draws on the firm’s thought
leadership across many asset classes and geographies.
For more than a century, institutional investors have turned to J.P. Morgan Asset Management
to skillfully manage their investment assets. This legacy of trusted partnership has been built
on a promise to put client interests ahead of our own, to generate original insight, and to
translate that insight into results.
Today, our advice, insight and intellectual capital drive a growing array of innovative strategies
that span U.S., international and global opportunities in equity, fixed income, real estate,
private equity, hedge funds, infrastructure and asset allocation.
This publication was edited, designed and produced by the Institutional Americas marketing
group at J.P. Morgan Asset Management.
©2010 JPMorgan Chase & Co.
All rights reserved.

J.p. morgan asset management 19
ImPorTAnT DISCLAImEr
This document is intended solely to report on various investment views held by J.P. Morgan Asset Management. All charts and graphs are shown for illustrative purposes only. Opinions, estimates, forecasts, and statements of financial market trends that are based on current market conditions constitute our judgment and are subject to change without notice. We believe the information provided here is reliable but should not be assumed to be accurate or complete. The views and strategies described may not be suitable for all investors. References to specific securities, asset classes and financial markets are for illustrative purposes only and are not intended to be, and should not be interpreted as, recommendations. Indices do not include fees or operating expenses and are not available for actual investment. The information contained herein employs proprietary projections of expected returns as well as estimates of their future volatility. The relative relationships and forecasts contained herein are based upon proprietary research and are developed through analysis of historical data and capital markets theory. These estimates have certain inherent limitations and, unlike an actual performance record, they do not reflect actual trading, liquidity constraints, fees or other costs. References to future net returns are not promises or even estimates of actual returns a client portfolio may achieve. The forecasts contained herein are for illustrative purposes only and are not to be relied upon as advice or inter-preted as a recommendation. The value of investments and the income from them may fluctuate and your investment is not guaranteed. Past performance is no guarantee of future results. Please note current performance may be higher or lower than the performance data shown. Please note that investments in foreign markets are subject to special currency, political, and economic risks. Exchange rates may cause the value of underlying overseas investments to go down or up. Investments in emerging markets may be more volatile than other markets and the risk to your capital is therefore greater. Also, the economic and political situations may be more volatile than in established economies and these may adversely influence the value of investments made.
J.P. Morgan Asset Management is the marketing name for the asset management businesses of JPMorgan Chase & Co. Those businesses include, but are not limited to, J.P. Morgan Investment Management Inc., Security Capital Research & Management Incorporated and J.P. Morgan Alternative Asset Management, Inc.
270 Park Avenue, New York, NY 10017
© 2010 JPMorgan Chase & Co.

jpmorgan.com/institutional
J . p. m o r g a n a s s e t m a n a g e m e n t
270 Park Avenue I New York, NY 10017