defect reduction on a shop floor in a very small scale industry (121-125).pdf · defect reduction...
TRANSCRIPT

Defect Reduction on a Shop Floor in a Very Small Scale Industry 121
Defect Reduction on a Shop Floor in a Very Small Scale IndustryKeywords: SIPOC, CTQ, Cause and Effect Analysis and Diagram
AbstrAct
This case demonstrates application of data based cooperative problem solving techniques by shop floor personnel in a very small scale unit. They have participated in data collection and analysis, brain storming and cause and effect analysis to find out causes of defects in two core production stages – Moulding and Deflashing. They have been finally able to decrease overall rejection from existing 7.74% to 1.5% for a Rubber Part component supplied to some of the well known customers.
Introduction
This case relates to a small scale unit located in Thane, Maharashtra. This unit manufactures Rubber Part Grommet, which are supplied to number of well known customers. It was found out that there has been a severe quality problem in making the part on their shop floor. Normally, this part is made through several stages consisting of procurement from supplier, inspection, machining, packing and dispatching. The machining stage has two vital operations – moulding and deflashing where rejection has been found to be very high. In moulding, defect is 6.21% and in deflashing defect is 1.53%. Overall rejection at the end of the operations has been 7.74%. Such high rejection percentage, which has a potentiality to cause customer’s dissatisfaction, has made the management to think in a different way. Finally, an improvement project has been envisaged to adopt a team based problem solving approach. Technical Director who is technically qualified person has himself acted as a team leader and he formed a team consisting of 6 operators, who are essentially related to critical operation, moulding and deflashing. The team decides to apply data based problem solving approach. After relevant training and collection of customer’s drawing and requirements, team starts applying problem solving steps. The team collects 3 months data related to all the relevant aspects of those two vital operations – moulding and deflashing. They collected records on production quantity and stage-wise defects. They also analyzed rejection percentage operator-wise, machine-wise, die-wise and by nature of defects. The team plotted the data and made analysis thereon.
The Projects
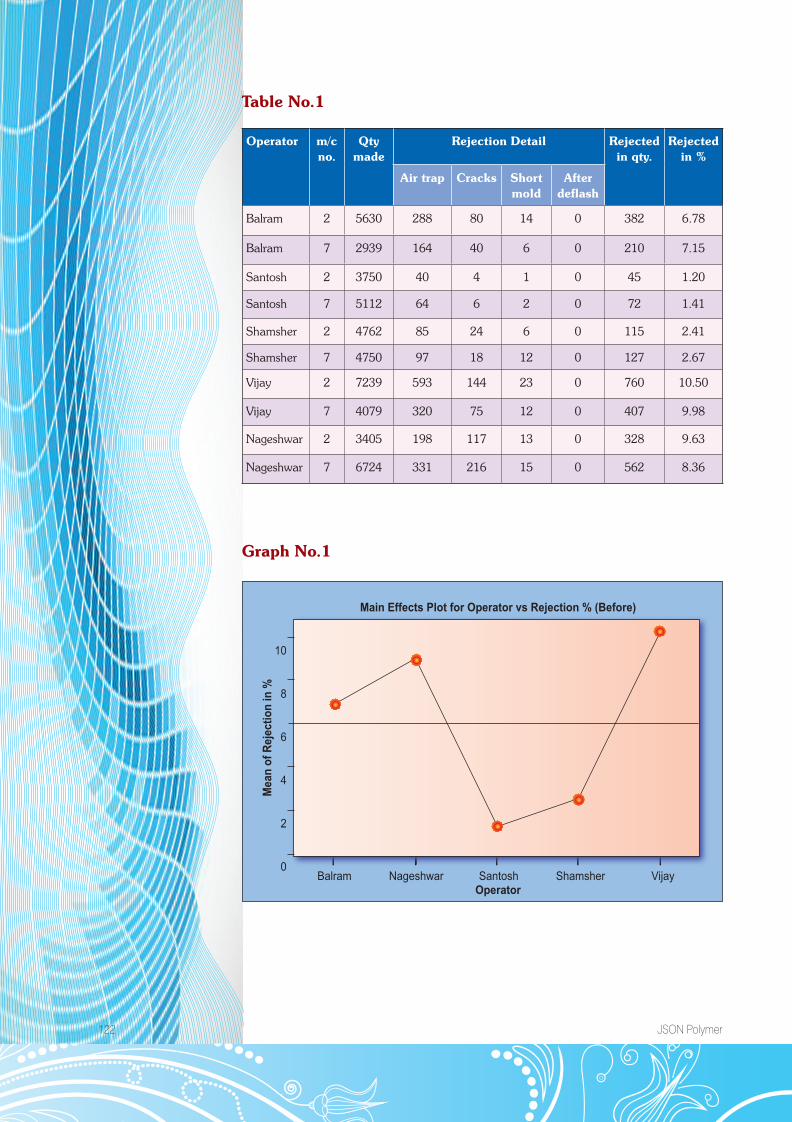
Based on the data collected, they made both tabular and graphical presentations and consequently isolated performance percentage as per operator, machine, nature of defects etc. A typical representation of such analysis could be seen from the Table No.1 and a Graph Nos.1 and 2 as shown below:
122 JSON Polymer
Table No.1
Operator m/c no.
Qty made
Rejection Detail Rejected in qty.
Rejected in %
Air trap Cracks Short mold
After deflash
Balram 2 5630 288 80 14 0 382 6.78
Balram 7 2939 164 40 6 0 210 7.15
Santosh 2 3750 40 4 1 0 45 1.20
Santosh 7 5112 64 6 2 0 72 1.41
Shamsher 2 4762 85 24 6 0 115 2.41
Shamsher 7 4750 97 18 12 0 127 2.67
Vijay 2 7239 593 144 23 0 760 10.50
Vijay 7 4079 320 75 12 0 407 9.98
Nageshwar 2 3405 198 117 13 0 328 9.63
Nageshwar 7 6724 331 216 15 0 562 8.36
Graph No.1
Main Effects Plot for Operator vs Rejection % (Before)
OperatorBalram Nageshwar Santosh Shamsher Vijay
Mea
n of
Rej
ectio
n in
%
10
8
6
4
2
0

Defect Reduction on a Shop Floor in a Very Small Scale Industry 123
Table No.1
Operator m/c no.
Qty made
Rejection Detail Rejected in qty.
Rejected in %
Air trap Cracks Short mold
After deflash
Balram 2 5630 288 80 14 0 382 6.78
Balram 7 2939 164 40 6 0 210 7.15
Santosh 2 3750 40 4 1 0 45 1.20
Santosh 7 5112 64 6 2 0 72 1.41
Shamsher 2 4762 85 24 6 0 115 2.41
Shamsher 7 4750 97 18 12 0 127 2.67
Vijay 2 7239 593 144 23 0 760 10.50
Vijay 7 4079 320 75 12 0 407 9.98
Nageshwar 2 3405 198 117 13 0 328 9.63
Nageshwar 7 6724 331 216 15 0 562 8.36
Graph No.1
Graph No.2
M/C No.
Main Effects Plot for M/C vs Rejection % (Before)
Mea
m o
f Rej
ectio
n in
%
2 7
6.10
6.05
6.00
5.95
5.90
The above shown graphs and data relate to moulding operations. Similar set of data arrangements have been also made based on details collected from Deflashing Operation.
Considering above data and representations, the team started in-depth analysis on the basis of their individual and collective knowledge and experience. Subsequently, the team went through the brain storming and made cause an effect analysis. A typical cause and effect diagram used by the team has been shown below:
Machine and Environment
Raw Material Defect
Rejection
M/C and Deflashing operator
(skill matrix)
124 JSON Polymer
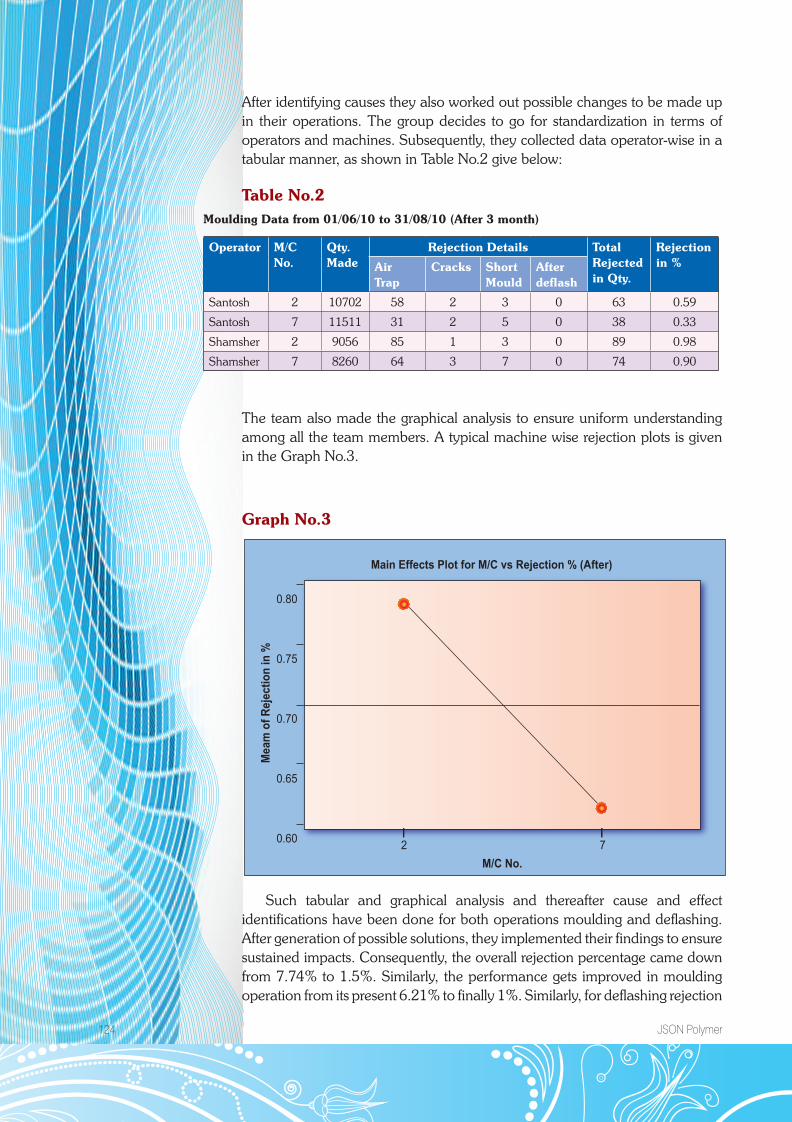
After identifying causes they also worked out possible changes to be made up in their operations. The group decides to go for standardization in terms of operators and machines. Subsequently, they collected data operator-wise in a tabular manner, as shown in Table No.2 give below:
Table No.2Moulding Data from 01/06/10 to 31/08/10 (After 3 month)
Operator M/C No.
Qty. Made
Rejection Details Total Rejected in Qty.
Rejection in %Air
TrapCracks Short
MouldAfter deflash
Santosh 2 10702 58 2 3 0 63 0.59
Santosh 7 11511 31 2 5 0 38 0.33
Shamsher 2 9056 85 1 3 0 89 0.98
Shamsher 7 8260 64 3 7 0 74 0.90
The team also made the graphical analysis to ensure uniform understanding among all the team members. A typical machine wise rejection plots is given in the Graph No.3.
Graph No.3
M/C No.
Main Effects Plot for M/C vs Rejection % (After)
Mea
m o
f Rej
ectio
n in
%
2 7
0.80
0.75
0.70
0.65
0.60
Such tabular and graphical analysis and thereafter cause and effect identifications have been done for both operations moulding and deflashing. After generation of possible solutions, they implemented their findings to ensure sustained impacts. Consequently, the overall rejection percentage came down from 7.74% to 1.5%. Similarly, the performance gets improved in moulding operation from its present 6.21% to finally 1%. Similarly, for deflashing rejection
Defect Reduction on a Shop Floor in a Very Small Scale Industry 125
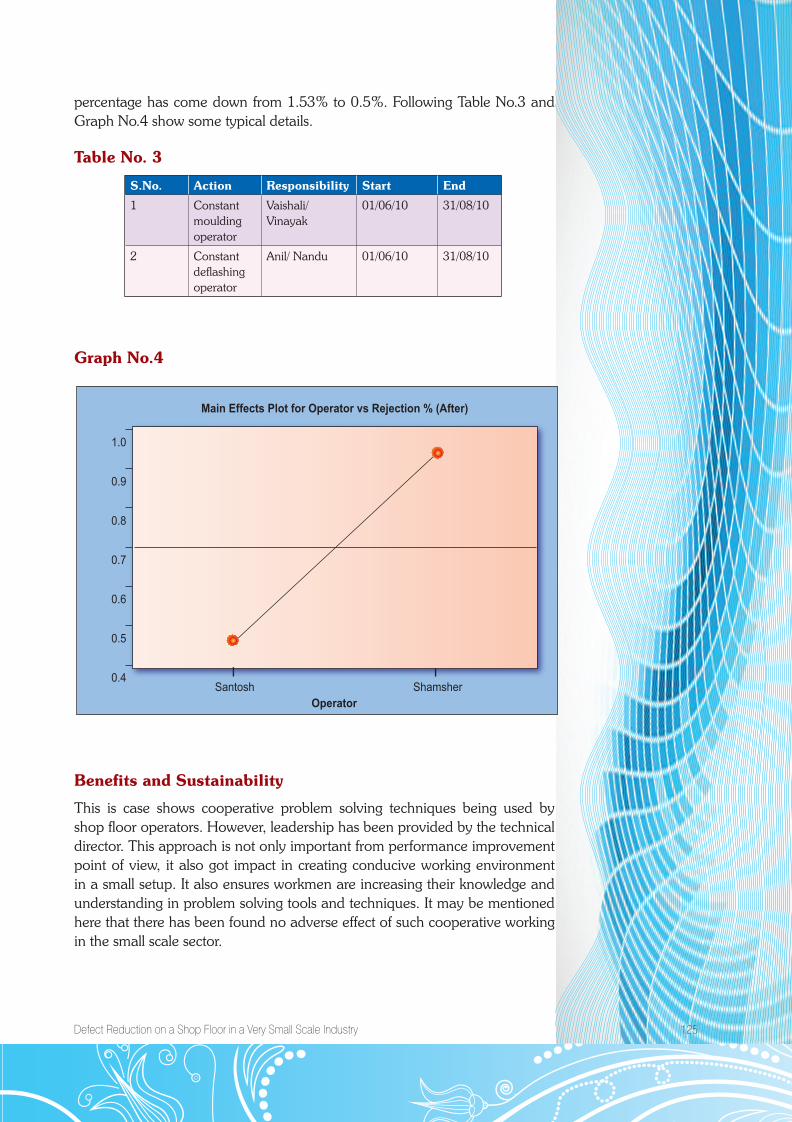
percentage has come down from 1.53% to 0.5%. Following Table No.3 and Graph No.4 show some typical details.
Table No. 3
S.No. Action Responsibility Start End
1 Constant moulding operator
Vaishali/ Vinayak
01/06/10 31/08/10
2 Constant deflashing operator
Anil/ Nandu 01/06/10 31/08/10
Graph No.4
1.0
0.9
0.8
0.7
0.6
0.5
0.4
OperatorShamsherSantosh
Main Effects Plot for Operator vs Rejection % (After)
Benefits and Sustainability
This is case shows cooperative problem solving techniques being used by shop floor operators. However, leadership has been provided by the technical director. This approach is not only important from performance improvement point of view, it also got impact in creating conducive working environment in a small setup. It also ensures workmen are increasing their knowledge and understanding in problem solving tools and techniques. It may be mentioned here that there has been found no adverse effect of such cooperative working in the small scale sector.