deere & company investor relations · pdf fileíintegral part of business strategy,...
TRANSCRIPT

John DeereCommitted to Those Linked to the Land
Strategy Overview
Deere & CompanyNovember 2013
| Deere & Company | November 2013
Safe Harbor Statement & Disclosures
This presentation includes forward-looking comments subject to important risks and uncertainties. It may also contain financial measures that are not in conformance with accounting principles generally accepted in the United States of America (GAAP).
Refer to Deere’s reports filed on Forms 8-K (current), 10-Q (quarterly), and 10-K (annual) for information on factors that could cause actual results to differ materially from information in this presentation and for information reconciling financial measures to GAAP.
Guidance noted in the following slides was effective as of the company’s most recent earnings release and conference call (20 November 2013). Nothing in this presentation should be construed as reaffirming or disaffirming such guidance.
This presentation is not an offer to sell or a solicitation of offers to buy any of Deere’s securities.
2
|
Table of Contents
Slide #John Deere Strategy 4
Macroeconomic Tailwinds 18
Appendix 25
Deere & Company | November 20133
John Deere Strategy
|5 Deere & Company | November 2013
*
* SVA: Shareholder Value Added
*

| Deere & Company | November 2013
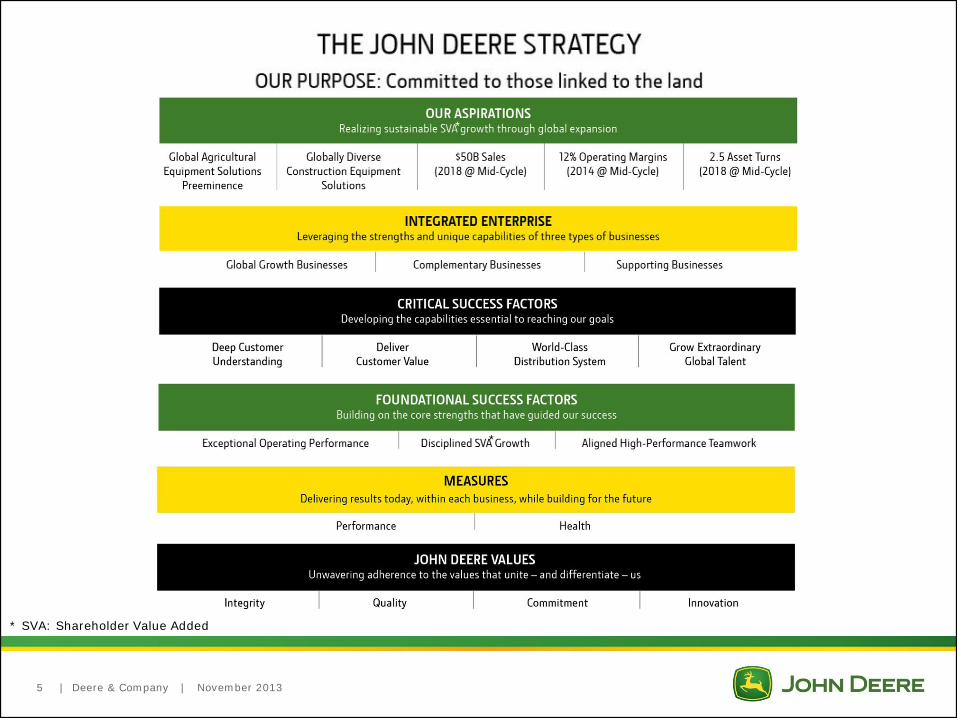
The John Deere StrategyOur Purpose: Committed to those linked to the land
6
Global macro-trends present significant opportunities for John Deere– Global population and income growth– Global infrastructure needs
New customer segments
Technology advances
744K Wheel Loader
460E Articulated Dump Truck
8360R Tractor
S690 Combine
X728 Riding Mower843K Wheeled Feller Buncher

|
Sustainable SVA* growth is delivered by distinctively serving our customers, employees, and investors
Extend and enhance our financial and operating achievements of recent years
Our challenge: to capture anticipated tailwinds by attracting more customers to the John Deere Experience across our six key geographies (US/Canada, EU 28, Brazil, CIS/Russia, China, India) in a manner that meets local needs while leveraging our global scale
7 Deere & Company | November 2013
The John Deere StrategyRealizing Sustainable Growth Through Global Expansion
* SVA: Shareholder Value Added

|
Agricultural Equipment Solutions Strategy– Defend and grow market share in
developed markets– Grow market share in developing
markets
Construction Equipment Solutions Strategy– Continue to grow strong #2
position in North America– Globalize the business
8 Deere & Company | November 2013
The John Deere StrategyAgricultural and Construction Equipment Aspirations
6488 Combine - China
755K Crawler Loader - USA
9530T Tractor - USA
435 Backhoe Loader - India
|
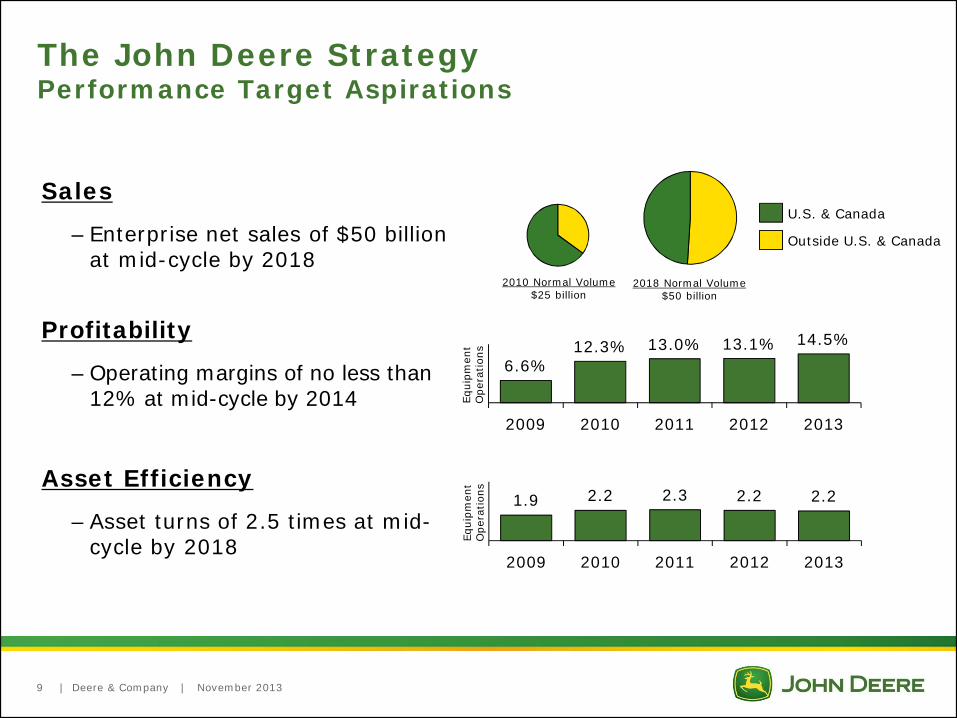
Sales
– Enterprise net sales of $50 billion at mid-cycle by 2018
Profitability
– Operating margins of no less than 12% at mid-cycle by 2014
Asset Efficiency
– Asset turns of 2.5 times at mid-cycle by 2018
2010 Normal Volume$25 billion
2018 Normal Volume$50 billion
U.S. & Canada
Outside U.S. & Canada
6.6%12.3% 13.0% 13.1% 14.5%
2009 2010 2011 2012 2013
1.9 2.2 2.3 2.2 2.2
2009 2010 2011 2012 2013
9 Deere & Company | November 2013
The John Deere StrategyPerformance Target Aspirations
Equi
pmen
tO
pera
tions
Equi
pmen
tO
pera
tions
|
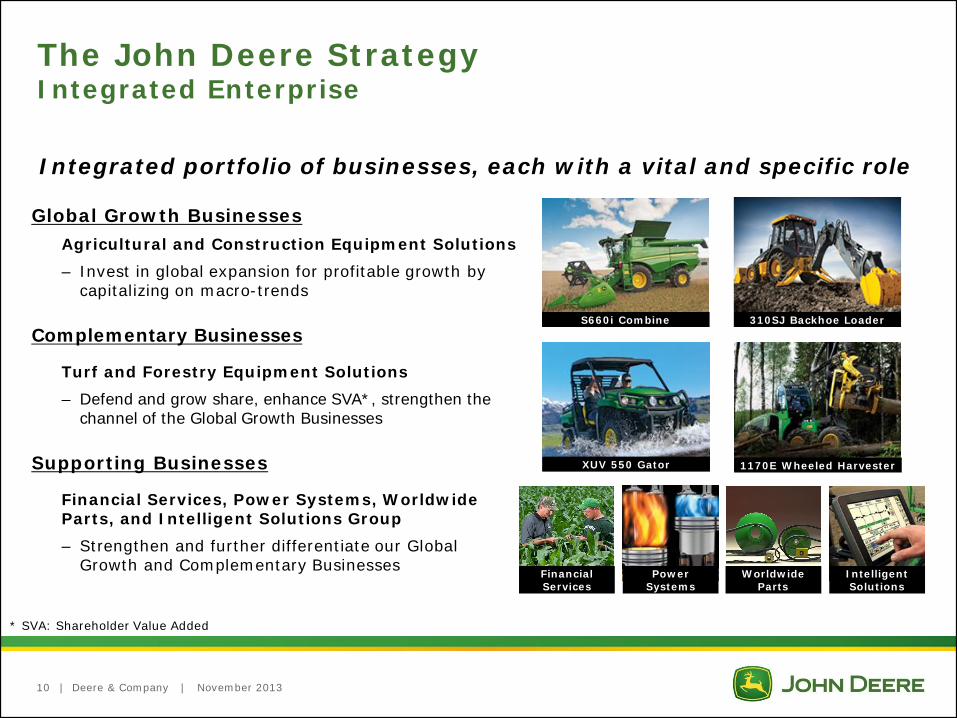
The John Deere StrategyIntegrated Enterprise
Integrated portfolio of businesses, each with a vital and specific role
10 Deere & Company | November 2013
Global Growth BusinessesAgricultural and Construction Equipment Solutions– Invest in global expansion for profitable growth by
capitalizing on macro-trends
Complementary Businesses
Turf and Forestry Equipment Solutions– Defend and grow share, enhance SVA*, strengthen the
channel of the Global Growth Businesses
Supporting Businesses
Financial Services, Power Systems, Worldwide Parts, and Intelligent Solutions Group– Strengthen and further differentiate our Global
Growth and Complementary Businesses
S660i Combine 310SJ Backhoe Loader
XUV 550 Gator 1170E Wheeled Harvester
Financial Services
Power Systems
Worldwide Parts
Intelligent Solutions
* SVA: Shareholder Value Added

|
The John Deere StrategyCritical Success Factors
11 Deere & Company | November 2013
Developing the capabilities essential to reaching our goalsDeep Customer Understanding (DCU) - Understanding our customers’ most important
local needs, and translating these into winning products and services better than any competitor
Deliver Customer Value (DCV) - Profitably translating our customers’ needs into products and services at prices our customers are willing to pay
World-Class Distribution System - Enabling our customers around the world to participate in the unique John Deere Experience by developing world-class channels of dealers that are professional, profitable and sustainable businesses, oriented to the customer, aligned with John Deere and achieving market preeminence
Grow Extraordinary Global Talent - Enabling pre-eminent customer value and business results through extraordinary leaders and engaged employees delivering aligned high-performance teamwork globally
| Deere & Company | November 2013
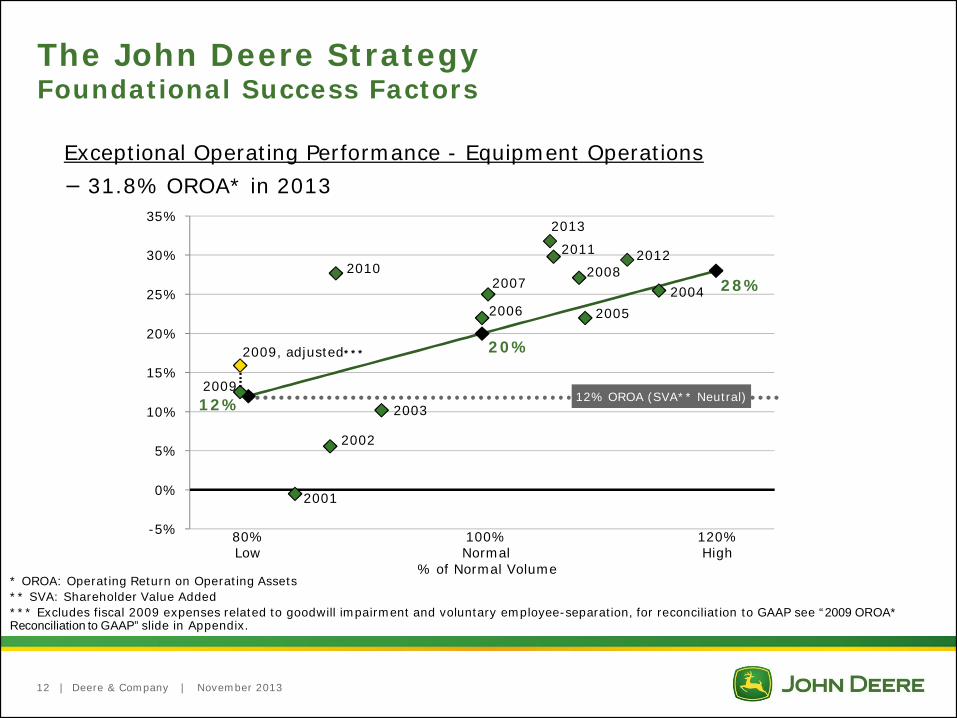
* OROA: Operating Return on Operating Assets** SVA: Shareholder Value Added*** Excludes fiscal 2009 expenses related to goodwill impairment and voluntary employee-separation, for reconciliation to GAAP see “2009 OROA* Reconciliation to GAAP” slide in Appendix.
The John Deere StrategyFoundational Success Factors
Exceptional Operating Performance - Equipment Operations31.8% OROA* in 2013
12%
20%
28%
2001
2002
2003
200420052006
20072008
2009
2009, adjusted***
20102011 2012
2013
-5%
0%
5%
10%
15%
20%
25%
30%
35%
% of Normal Volume
80%Low
100%Normal
120%High
12% OROA (SVA** Neutral)
12
| Deere & Company | November 2013
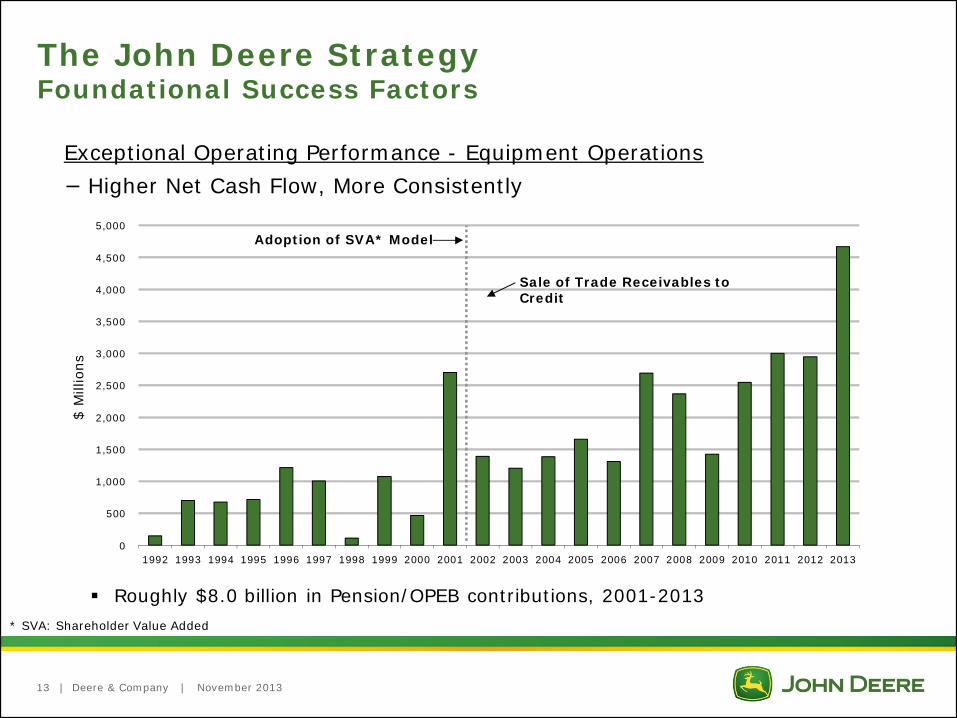
Exceptional Operating Performance - Equipment OperationsHigher Net Cash Flow, More Consistently
The John Deere StrategyFoundational Success Factors
0
500
1,000
1,500
2,000
2,500
3,000
3,500
4,000
4,500
5,000
1992 1993 1994 1995 1996 1997 1998 1999 2000 2001 2002 2003 2004 2005 2006 2007 2008 2009 2010 2011 2012 2013
$ M
illio
ns
Sale of Trade Receivables to Credit
Adoption of SVA* Model
Roughly $8.0 billion in Pension/OPEB contributions, 2001-2013
13
* SVA: Shareholder Value Added
|
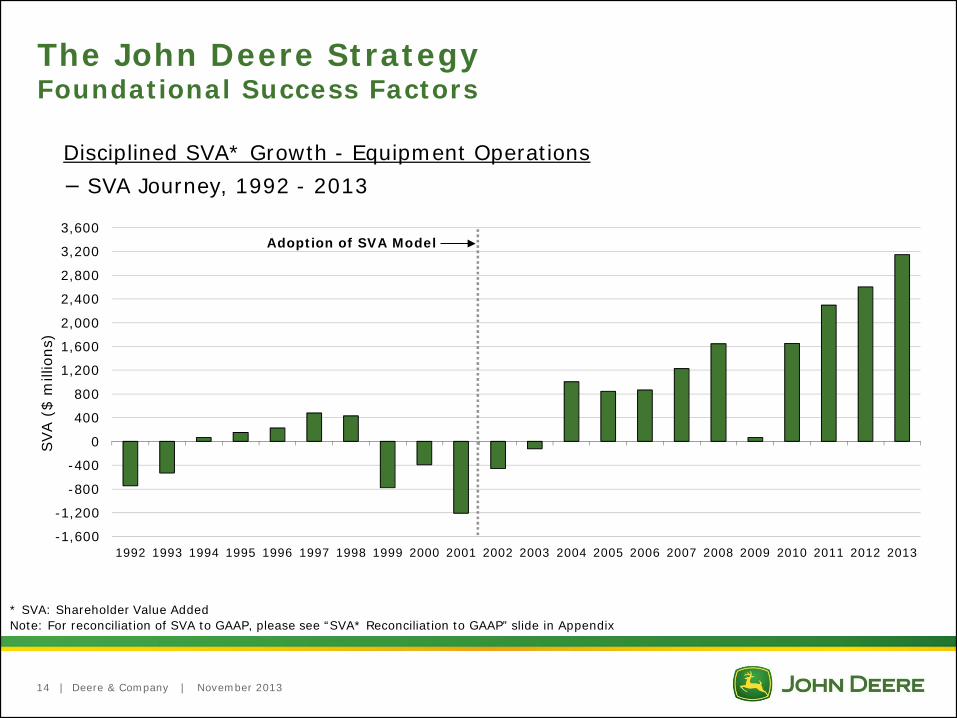
-1,600
-1,200
-800
-400
0
400
800
1,200
1,600
2,000
2,400
2,800
3,200
3,600
1992 1993 1994 1995 1996 1997 1998 1999 2000 2001 2002 2003 2004 2005 2006 2007 2008 2009 2010 2011 2012 2013
Deere & Company | November 2013
SVA
($ m
illio
ns)
* SVA: Shareholder Value AddedNote: For reconciliation of SVA to GAAP, please see “SVA* Reconciliation to GAAP” slide in Appendix
Disciplined SVA* Growth - Equipment OperationsSVA Journey, 1992 - 2013
14
The John Deere StrategyFoundational Success Factors
Adoption of SVA Model

| Deere & Company | November 2013
Aligned High-Performance TeamworkIntegral part of business strategy, reinforced with compensationGlobal Performance Management reinforces alignment Base pay changes linked to achieving goals
STI: Short-Term Incentive – Bonus focuses on OROA*/ROE**Covers most worldwide salaried employeesApplies one enterprise-wide bonus metric
MTI: Mid-Term Incentive – Bonus driven by sustained SVA*** creationAbout 10,400 management employees eligible
LTI: Long-Term Incentive – Primarily stock options Top 1,000 employees eligibleMinimum stock holding requirements for senior management (~ top 125)
15
The John Deere StrategyFoundational Success Factors
•* OROA: Operating Return on Operating Assets•** ROE: Return on Equity•*** SVA: Shareholder Value Added
| Deere & Company | November 2013
The John Deere StrategyMeasures
16
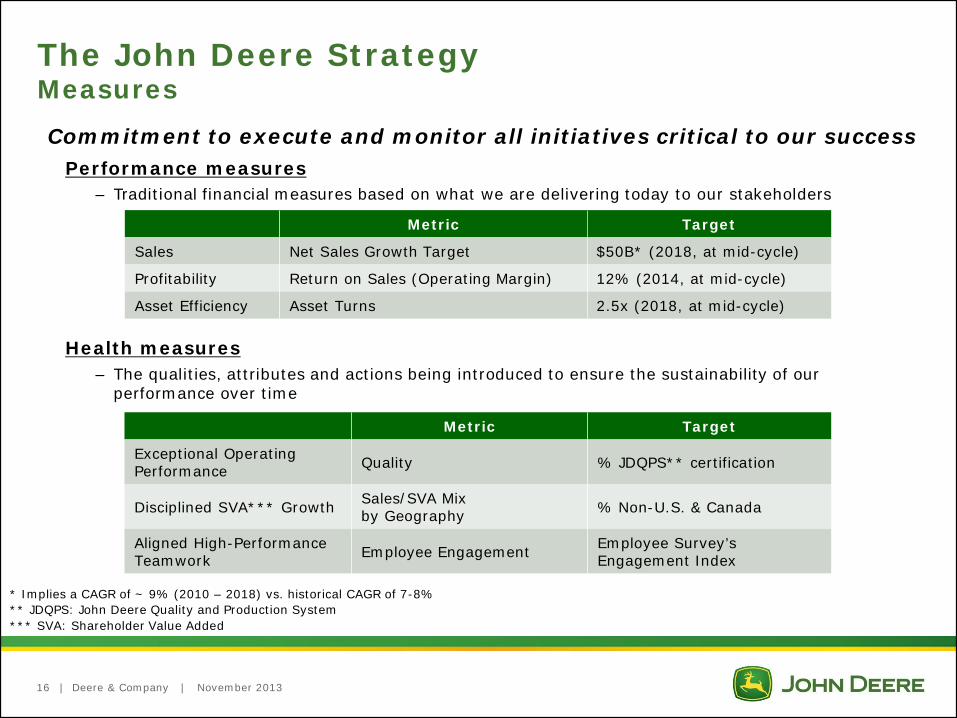
Commitment to execute and monitor all initiatives critical to our successPerformance measures
– Traditional financial measures based on what we are delivering today to our stakeholders
Health measures – The qualities, attributes and actions being introduced to ensure the sustainability of our
performance over time
Metric Target
Sales Net Sales Growth Target $50B* (2018, at mid-cycle)
Profitability Return on Sales (Operating Margin) 12% (2014, at mid-cycle)
Asset Efficiency Asset Turns 2.5x (2018, at mid-cycle)
Metric Target
Exceptional Operating Performance Quality % JDQPS** certification
Disciplined SVA*** Growth Sales/SVA Mix by Geography % Non-U.S. & Canada
Aligned High-Performance Teamwork Employee Engagement Employee Survey’s
Engagement Index
* Implies a CAGR of ~ 9% (2010 – 2018) vs. historical CAGR of 7-8%** JDQPS: John Deere Quality and Production System*** SVA: Shareholder Value Added
| Deere & Company | November 2013
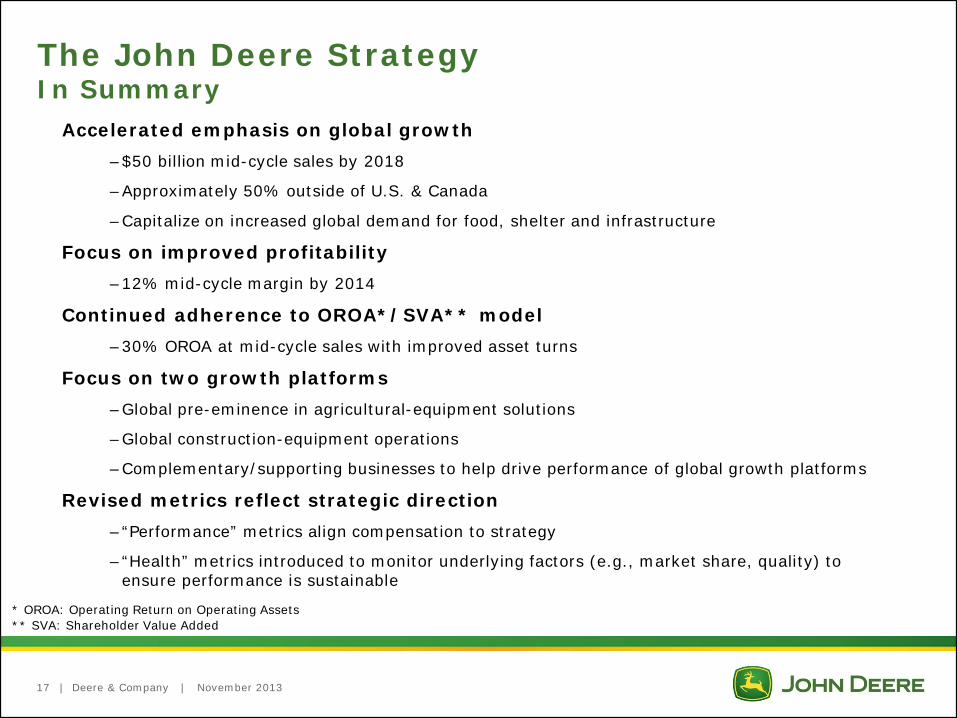
Accelerated emphasis on global growth –$50 billion mid-cycle sales by 2018
–Approximately 50% outside of U.S. & Canada
–Capitalize on increased global demand for food, shelter and infrastructure
Focus on improved profitability–12% mid-cycle margin by 2014
Continued adherence to OROA*/SVA** model–30% OROA at mid-cycle sales with improved asset turns
Focus on two growth platforms–Global pre-eminence in agricultural-equipment solutions
–Global construction-equipment operations
–Complementary/supporting businesses to help drive performance of global growth platforms
Revised metrics reflect strategic direction–“Performance” metrics align compensation to strategy
–“Health” metrics introduced to monitor underlying factors (e.g., market share, quality) to ensure performance is sustainable
17
The John Deere StrategyIn Summary
•* OROA: Operating Return on Operating Assets•** SVA: Shareholder Value Added

Macroeconomic Tailwinds
Support John Deere’sGlobal Growth Businesses

|19 Deere & Company | November 2013
Long-Term Macroeconomic TailwindsSupport Global Growth Opportunities
Population growing in size and affluence• By 2050, world population will exceed 9 billion, up from ~7 billion today,
with most growth in Asia and Africa• Large middle class emerging in Latin America, China, India, and other
developing economies
Opportunity #1: Feeding the world• Agricultural output must double by 2050• To achieve this, the rate of productivity growth must accelerate over recent
trend rates• Natural resources under strain, especially water and land
Opportunity #2: Massive urbanization• Migration from rural areas creates need for infrastructure development• More than 50% of the global population today lives in urban areas, will
surpass 70% by 2050

| Deere & Company | November 2013
Absolute increase in real value added 2012-20, $ BillionsSector
204
Real Estate & Dwellings
238
Wholesale Trade
266
Other Business Activities
276
Public Admin, Sanitary & Personal Srvs
303
Construction
305
Transportation & Storage
308
Financial Institutions
346
Medical, Dental, Veterinary, Other Health
416
Communications465
203
524
Agriculture, Hunting, Forestry, Fishing
610
Processed Food
636
Energy Mining and Quarrying
698
Restaurants and Hotels
789
Electricity, Gas, and Water
796
Computer and Related Activities
915
Motor Vehicle and Motorcycle Sales, Repair, Maint.
985
Insurance
1,042
Retail Trade except Motor Vehicle, and MotorcycleEducational Services
Radio, TV, and Communications Equipment
CAGR 2012-20 Percent
2.74.03.21.93.94.13.72.64.42.82.56.42.83.73.02.83.23.52.93.0
20.5
Retail Trade except Motor Vehicle, and Motorcycle
22.1Medical, Dental, Veterinary, Other Health
26.9Real Estate & Dwellings 29.7
Computer and Related Activities
33.7
Insurance
36.3
Communications
38.8
Restaurants and Hotels41.4Financial Institutions41.8
Educational Services
43.3
12.9
44.9
Radio, TV, and Communications Equipment
46.9
Transportation & Storage
52.1
Energy Mining and Quarrying56.8Electricity, Gas, and Water59.4
Construction
60.2
Public Admin, Sanitary & Personal Srvs
60.8
Wholesale Trade
67.3Processed Food79.5
Other Business Activities
Agriculture, Hunting, Forestry, Fishing
Motor Vehicle and Motorcycle Sales, Repair, Maint.
Share of growth from BRIIC1
PercentSector
While several sectors are expected to grow in the G-20 countries from 2012-2020 . . .
. . Agriculture and Construction will derive significant growth from the BRIIC countries
Strong Global Tailwinds in Ag & Construction Significant Growth from Developing Economies
Note: G20 countries account for 77% and 89% of agriculture and construction segments respectively.Total global growth for agriculture is $405B and construction is $890B
20
1Brazil, Russia, India, Indonesia, ChinaSource: Global Insight World Industry Service
Real value-added 2005 USD
|
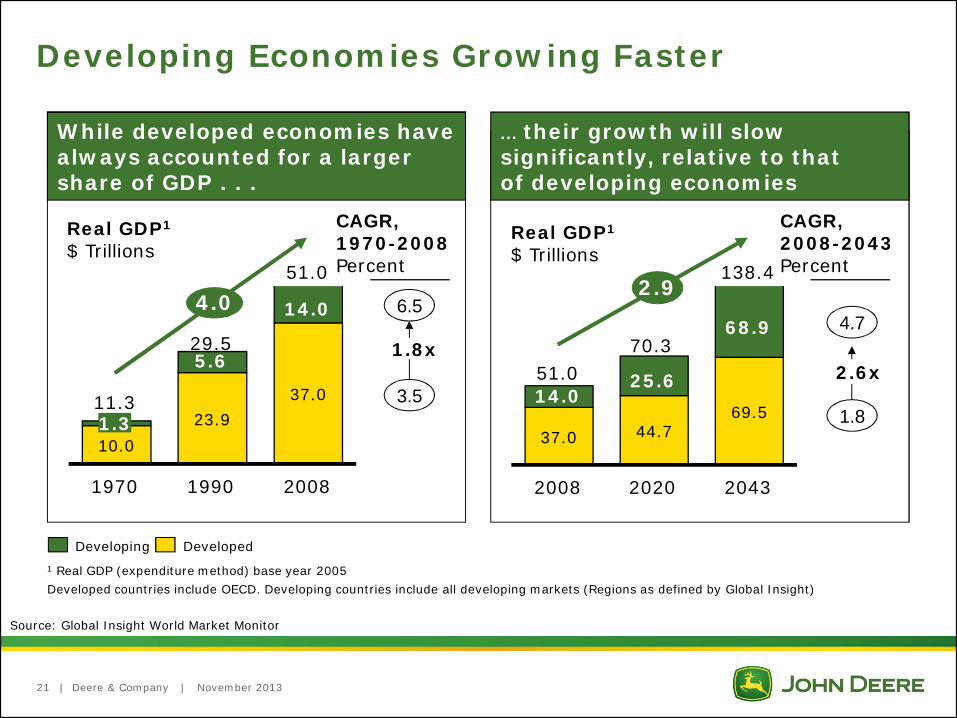
Developing Economies Growing Faster
While developed economies have always accounted for a larger share of GDP . . .
10.023.9
37.0
1.3
14.0
29.5
1990
5.6
11.3
1970
51.04.0
2008
Real GDP1
$ Trillions
6.5
CAGR,1970-2008Percent
3.5
37.0 44.769.5
14.0
2.9
204320202008
70.3
138.4
68.9
25.651.0
Real GDP1
$ Trillions
4.7
CAGR,2008-2043Percent
... their growth will slow significantly, relative to that of developing economies
1 Real GDP (expenditure method) base year 2005Developed countries include OECD. Developing countries include all developing markets (Regions as defined by Global Insight)
1.8x2.6x
1.8
Developing Developed
Deere & Company | November 2013
Source: Global Insight World Market Monitor
21

| Deere & Company | November 2013
Dynamics of Food Demand
Source: World Development Indicators 2010, The World Bank, April 2013
>$10.00per day
25% of world’s population(Most hunger problems solved at
$2.50 threshold)
Services
Processed Products
Livestock Products
Commodities
Per CapitaIncome
18% of world’s population(2/3rds experience hunger &
malnutrition)
$2.50-$10.00 per day
$1.25-$2.50 per day
<$1.25 per day
22
| Deere & Company | November 2013
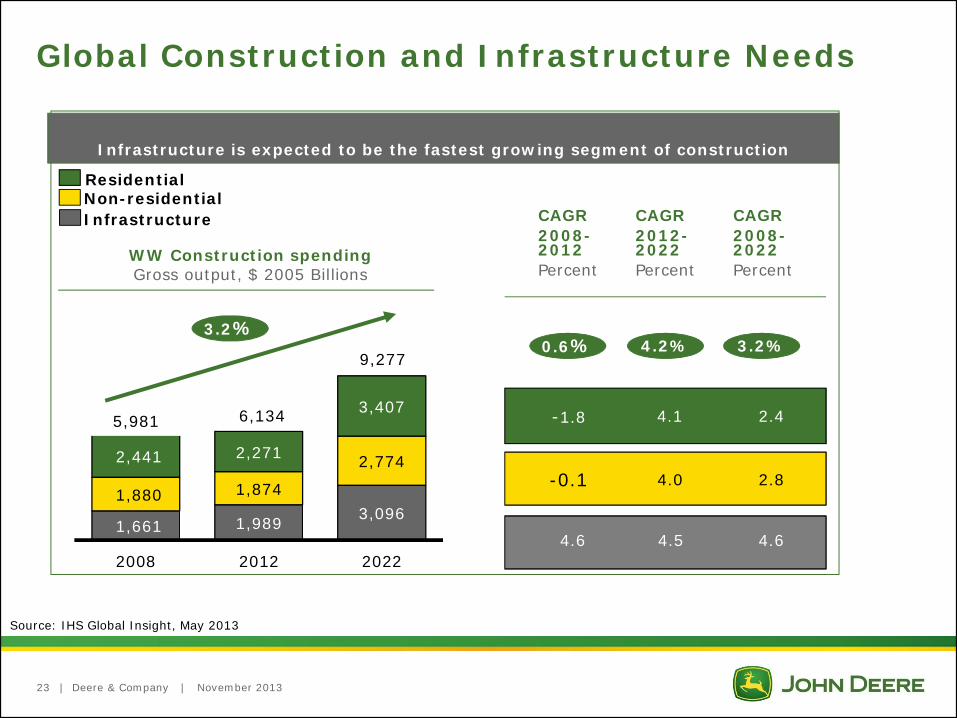
Global Construction and Infrastructure Needs
1,661 1,989 3,0961,880 1,874
2,7742,441 2,271
3,407
2008 2012 2022
3.2%
Infrastructure is expected to be the fastest growing segment of construction
ResidentialNon-residentialInfrastructure
WW Construction spendingGross output, $ 2005 Billions
Source: IHS Global Insight, May 2013
23
-1.8 4.1
-0.1 4.0
4.6 4.5
CAGR2008-2012Percent
CAGR2012-2022Percent
CAGR2008-2022Percent
2.8
5,981
4.6
2.46,134
9,2770.6% 4.2% 3.2%

|
Infrastructure
Non-residential
Residential
Construction spending 2022 absolute, Top 10 (Billions of 2005 $s)
China + U.S. & Canada 39% of 2022 absolute, compared to 33% todayChina + U.S. & Canada + Brazil, Russia, India 50% of 2022 absolute, compared to 42% today
Construction spending 2012-2022 change, Top 10 (Billions of 2005 $s)
Infrastructure
Non-residential
Residential
Global Construction Spending in 2022Concentrated in a Small Number of Markets
Deere & Company | November 2013
Source: IHS Global Insight, Deere Analysis, March 2013
24
China
U.S.
Japan
India
UK
Germany
France
Australia
Italy
Canada
1,014
702
676
444
322
315
211
209
199
China
U.S.
Japan
India
UK
Germany
France
Australia
Italy
Canada
1,232
286
122
377
122
32
41
65
30
19
2,374
Appendix
| Deere & Company | November 2013
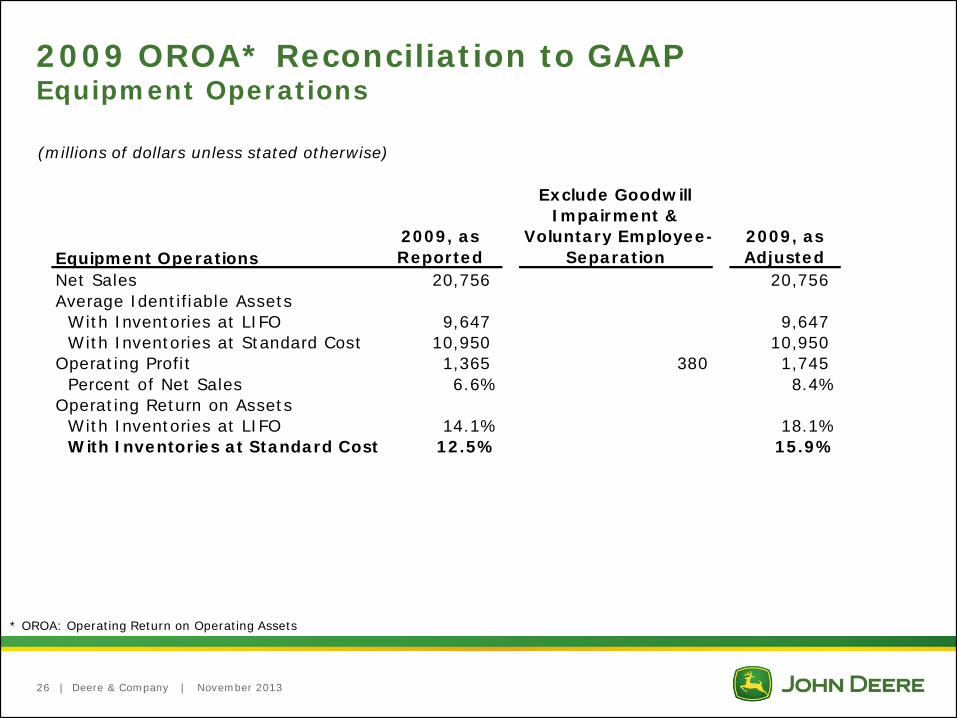
2009 OROA* Reconciliation to GAAPEquipment Operations
Equipment Operations2009, as Reported
Exclude Goodwill Impairment &
Voluntary Employee-Separation
2009, as Adjusted
Net Sales 20,756 20,756 Average Identifiable Assets
With Inventories at LIFO 9,647 9,647 With Inventories at Standard Cost 10,950 10,950
Operating Profit 1,365 380 1,745 Percent of Net Sales 6.6% 8.4%
Operating Return on AssetsWith Inventories at LIFO 14.1% 18.1%With Inventories at Standard Cost 12.5% 15.9%
(millions of dollars unless stated otherwise)
26
* OROA: Operating Return on Operating Assets

| Deere & Company | November 2013
SVA* Reconciliation to GAAPEquipment Operations
Equipment Operations 1992 1993 1994 1995 1996 1997 1998 1999 2000 2001 2002Net Sales 5,723 6,479 7,663 8,830 9,640 11,082 11,926 9,701 11,169 11,077 11,703 Average Identifiable Assets
With Inventories at LIFO 5,765 5,449 5,551 6,187 6,502 6,682 7,672 7,724 8,069 8,743 6,229 With Inventories at Standard Cost 6,846 6,442 6,494 7,131 7,488 7,703 8,711 8,739 9,039 9,678 7,147
Operating Profit 77 242 847 1,006 1,125 1,402 1,476 272 693 (46) 401 Percent of Net Sales 1.3% 3.7% 11.1% 11.4% 11.7% 12.6% 12.4% 2.8% 6.2% -0.4% 3.4%
Operating Return on AssetsWith Inventories at LIFO 1.3% 4.4% 15.3% 16.3% 17.3% 21.0% 19.3% 3.5% 8.6% -0.5% 6.4%With Inventories at Standard Cost 1.1% 3.8% 13.0% 14.1% 15.0% 18.2% 16.9% 3.1% 7.7% -0.5% 5.6%
SVA Cost of Assets (821) (773) (780) (856) (898) (924) (1,045) (1,049) (1,085) (1,162) (858) SVA (744) (531) 67 150 227 477 431 (776) (392) (1,208) (457)
Equipment Operations 2003 2004 2005 2006 2007 2008 2009 2010 2011 2012 2013Net Sales 13,349 17,673 19,401 19,884 21,489 25,803 20,756 23,573 29,466 33,501 34,998 Average Identifiable Assets
With Inventories at LIFO 5,965 6,482 7,248 7,546 8,092 9,652 9,647 9,196 11,516 13,594 14,569 With Inventories at Standard Cost 6,925 7,477 8,312 8,634 9,205 10,812 10,950 10,494 12,875 14,965 15,924
Operating Profit 708 1,905 1,842 1,905 2,318 2,927 1,365 2,909 3,839 4,397 5,058 Percent of Net Sales 5.3% 10.8% 9.5% 9.6% 10.8% 11.3% 6.6% 12.3% 13.0% 13.1% 14.5%
Operating Return on AssetsWith Inventories at LIFO 11.9% 29.4% 25.4% 25.2% 28.6% 30.3% 14.1% 31.6% 33.3% 32.3% 34.7%With Inventories at Standard Cost 10.2% 25.5% 22.2% 22.1% 25.2% 27.1% 12.5% 27.7% 29.8% 29.4% 31.8%
SVA Cost of Assets (831) (897) (998) (1,036) (1,094) (1,284) (1,301) (1,259) (1,545) (1,795) (1,911) SVA (123) 1,008 844 869 1,224 1,643 64 1,650 2,294 2,602 3,147
(millions of dollars unless stated otherwise)
27
* SVA: Shareholder Value Added

|