deere & company investor relations - john deere us ... · this presentation includes...
TRANSCRIPT

John Deere Committed to Those Linked to the Land
Deere & Company December 2012 / January 2013

| Deere & Company | December 2012 / January 2013
Safe Harbor Statement & Disclosures
This presentation includes forward-looking comments subject to important risks and uncertainties. It may also contain financial measures that are not in conformance with accounting principles generally accepted in the United States of America (GAAP).
Refer to Deere’s reports filed on Forms 8-K (current), 10-Q (quarterly), and 10-K (annual) for information on factors that could cause actual results to differ materially from information in this presentation and for information reconciling financial measures to GAAP.
Guidance noted in the following slides was effective as of the company’s most recent earnings release and conference call (21 November 2012). Nothing in this presentation should be construed as reaffirming or disaffirming such guidance.
This presentation is not an offer to sell or a solicitation of offers to buy any of Deere’s securities.
2
|
Table of Contents
Slide #
John Deere Strategy 4
2012 in Review 6
Looking Ahead 11
Supplemental Information:
Foundational Success Factors 20
Global Markets and Opportunities 30
John Deere Financial Services 48
Farm Fundamentals 51
Appendix 55
Deere & Company | December 2012 / January 2013 3

John Deere Strategy

| 5 Deere & Company | December 2012 / January 2013
2012 in Review

|
2012 in Review Equipment Operations
Deere & Company | December 2012 / January 2013 7
Exceptional Results
• Record net sales… $33.501 billion
• Record net income… $3.065 billion
• 13.1% operating profit margin
• Cash flow from operations… $2.9 billion
• SVA… $2.602 billion
• OROA… 29.4%
Attributable to Deere & Company

|
Net Sales by Major Market Equipment Operations
Deere & Company | December 2012 / January 2013 8
$13.8 $15.1
$13.0 $14.8
$17.4
$20.8
20
07
20
08
20
09
20
10
20
11
20
12
U.S. & Canada 9% CAGR
$3.9 $4.6
$3.4 $3.4 $4.4 $4.3
20
07
20
08
20
09
20
10
20
11
20
12
Western Europe 2% CAGR
$1.0
$1.9
$0.7 $0.7 $1.4 $1.7
20
07
20
08
20
09
20
10
20
11
20
12
Central Europe & CIS 11% CAGR
$1.6 $2.6
$1.8 $2.6
$3.6 $3.6
20
07
20
08
20
09
20
10
20
11
20
12
Central & South America 18% CAGR
$0.8 $1.1 $1.2 $1.4 $1.9 $2.1
20
07
20
08
20
09
20
10
20
11
20
12
Asia, Africa & Middle East 21% CAGR
$0.4 $0.6 $0.6 $0.6 $0.8 $1.0
20
07
20
08
20
09
20
10
20
11
20
12
Australia & New Zealand 20% CAGR

|
2012 in Review
Deere & Company | December 2012 / January 2013 9
Investments in the Business
• Capex and R&D for equipment operations… ~ $2.750 billion
• Announced three capacity increases in the United States
• Established financial services operations in Russia, India, Chile, and Thailand
Capital Returned to Shareholders
• Operating cash flow returned to shareholders… ~ 75% • Quarterly dividend… increased to $0.46 per share (+12%) • Shares repurchased… 20.2 million shares
| Deere & Company | December 2012 / January 2013
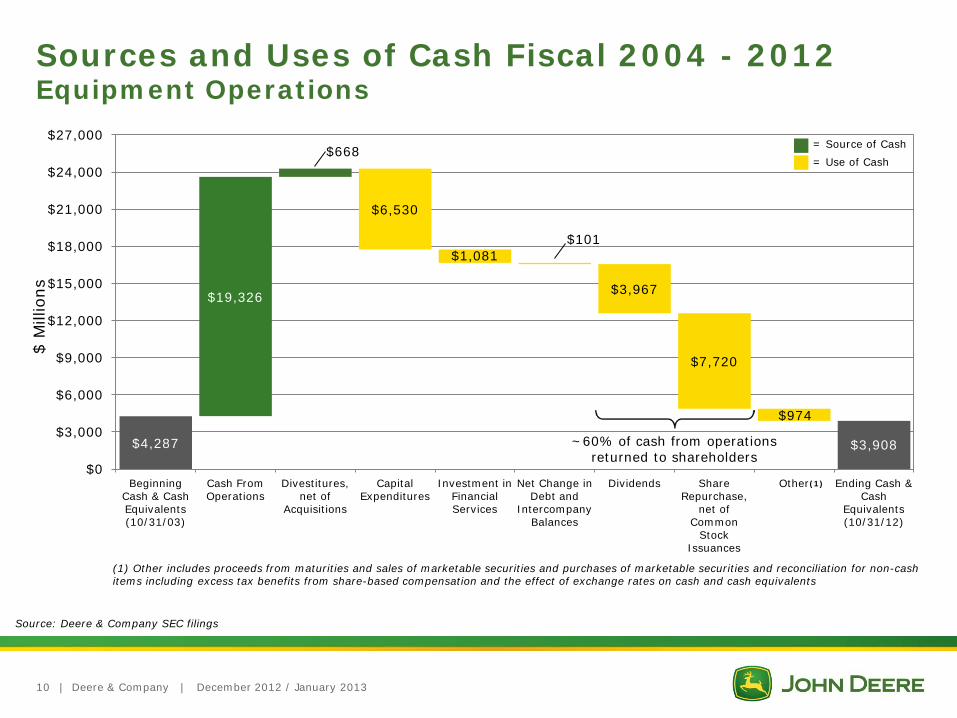
Sources and Uses of Cash Fiscal 2004 - 2012 Equipment Operations
Source: Deere & Company SEC filings
10
(1) Other includes proceeds from maturities and sales of marketable securities and purchases of marketable securities and reconciliation for non-cash items including excess tax benefits from share-based compensation and the effect of exchange rates on cash and cash equivalents
$4,287
$19,326
$668
$6,530
$1,081 $101
$3,967
$7,720
$974
$0
$3,000
$6,000
$9,000
$12,000
$15,000
$18,000
$21,000
$24,000
$27,000
Beginning Cash & Cash Equivalents (10/31/03)
Cash From Operations
Divestitures, net of
Acquisitions
Capital Expenditures
Investment in Financial Services
Net Change in Debt and
Intercompany Balances
Dividends Share Repurchase,
net of Common
Stock Issuances
Other Ending Cash & Cash
Equivalents (10/31/12)
(1)
$ M
illio
ns
$3,908 ~60% of cash from operations returned to shareholders
= Source of Cash
= Use of Cash

Looking Ahead
|
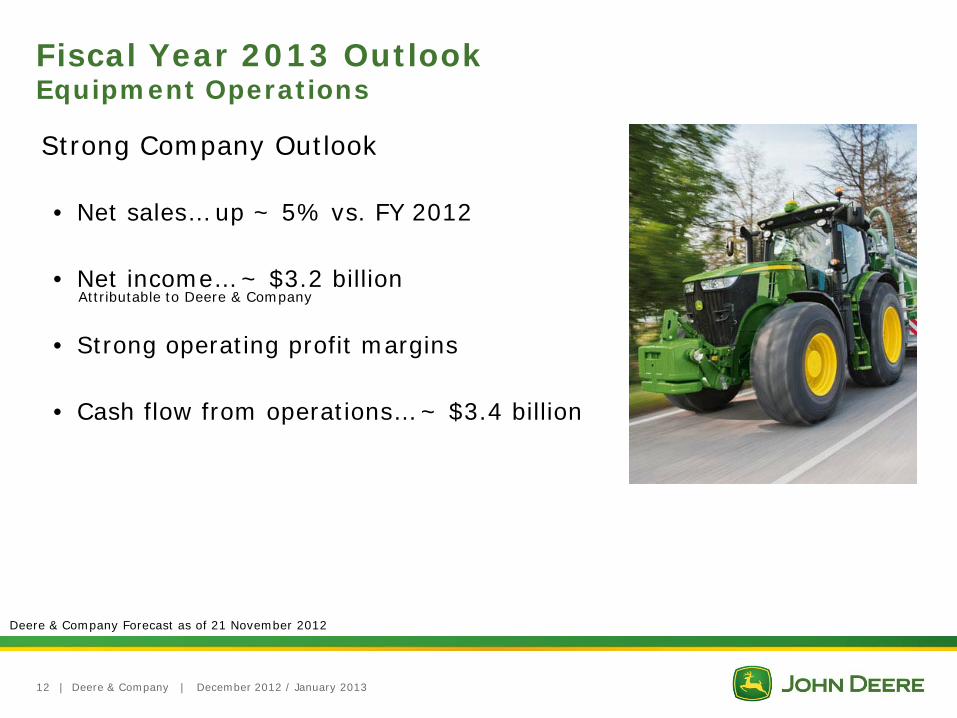
Fiscal Year 2013 Outlook Equipment Operations
Deere & Company | December 2012 / January 2013 12
Strong Company Outlook
• Net sales… up ~ 5% vs. FY 2012
• Net income… ~ $3.2 billion
• Strong operating profit margins
• Cash flow from operations… ~ $3.4 billion
Deere & Company Forecast as of 21 November 2012
Attributable to Deere & Company

|
Absorbing Our Investments to Grow the Business
• Capital expenditures • 2012… ~ $1.3 billion • 2013 forecast… ~ $1.3 billion
• SA&G expense • 2012… ~ $3.0 billion • 2013 forecast… up ~ 7%
• R&D expense • 2012… ~ $1.4 billion • 2013 forecast… up ~ 3%
Global Growth Equipment Operations
Deere & Company | December 2012 / January 2013 13
Deere & Company Forecast as of 21 November 2012

|
Global Growth Major Equipment Factory Investments
Deere & Company | December 2012 / January 2013 14
New Factories Major Expansions or Modernizations
Indaiatuba, Brazil C&F Division
• Backhoe Loaders • 4WD Loaders
Indaiatuba, Brazil (JV) C&F Division
• Excavators
Orenburg, Russia A&T Division
• Seeding Equipment • Tillage Equipment • Spraying Equipment
Dewas, India A&T Division
• Tractors
Harbin, China A&T Division
• Combine Front-End Equipment • Tractors • Planters • Sprayers • Irrigation Products
Tianjin (TEDA), China C&F Division
• 4WD Loaders • Excavators
Tianjin (TEDA), China John Deere Power Systems
• Engines
Des Moines, IA, USA A&T Division
• Spraying Equipment • Cotton Harvesting Equipment • Tillage Equipment • Seeding Equipment
Domodedovo, Russia A&T and C&F Division
• Tractors • Combine Harvesters • Combine Front-End Equipment • Backhoes, Loaders, Graders • Skidders
Pune, India A&T Division
• Engines • Transmissions • Tractors
Rosario, Argentina A&T Divison and
John Deere Power Systems • Engines • Tractors • Combines
Waterloo, IA, USA A&T Division
• Foundry
Waterloo, IA, USA A&T Division
• Ag Tractors
Davenport, IA, USA C&F Division
• Articulated Dump Trucks • 4WD Loaders • Motor Graders • Skidders • Wheeled Feller Bunchers
Moline, IL, USA Cylinder Division
• Hydraulic Cylinders
Valley City, ND, USA A&T Division
• Seeding Equipment • Tillage Equipment
Moline, IL, USA A&T Division
• Planting Equipment
|
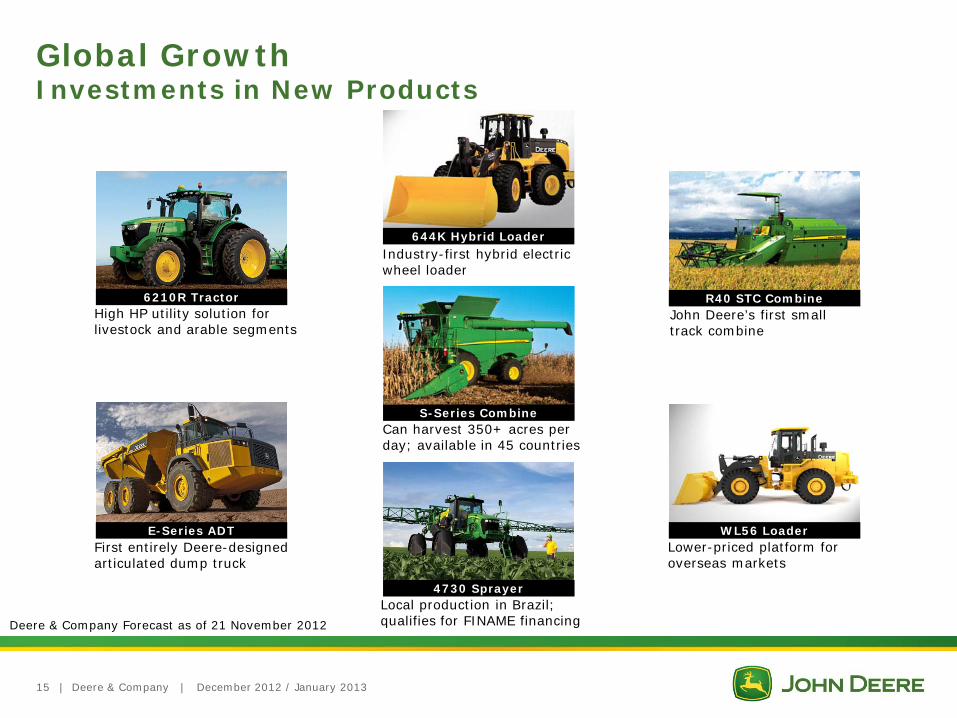
Global Growth Investments in New Products
Deere & Company | December 2012 / January 2013 15
Deere & Company Forecast as of 21 November 2012
John Deere’s first small track combine
R40 STC Combine
Lower-priced platform for overseas markets
WL56 Loader First entirely Deere-designed articulated dump truck
E-Series ADT
Can harvest 350+ acres per day; available in 45 countries
S-Series Combine
Local production in Brazil; qualifies for FINAME financing
4730 Sprayer
Industry-first hybrid electric wheel loader
644K Hybrid Loader
High HP utility solution for livestock and arable segments
6210R Tractor
|
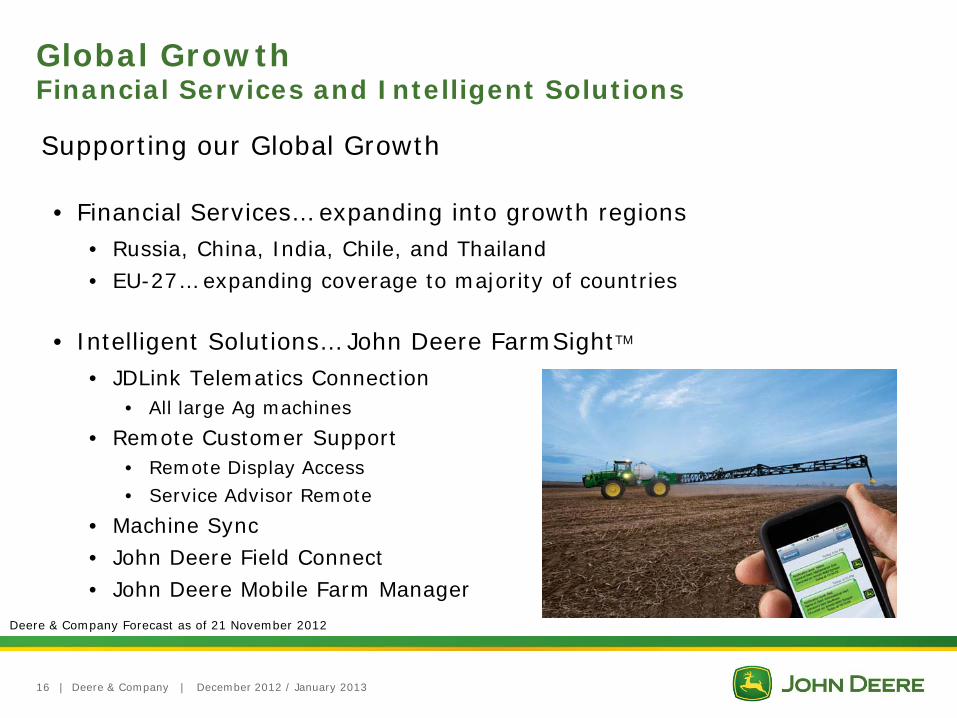
Global Growth Financial Services and Intelligent Solutions
Deere & Company | December 2012 / January 2013 16
Supporting our Global Growth
• Financial Services… expanding into growth regions • Russia, China, India, Chile, and Thailand • EU-27… expanding coverage to majority of countries
• Intelligent Solutions… John Deere FarmSightTM
• JDLink Telematics Connection • All large Ag machines
• Remote Customer Support • Remote Display Access • Service Advisor Remote
• Machine Sync • John Deere Field Connect • John Deere Mobile Farm Manager
Deere & Company Forecast as of 21 November 2012
|
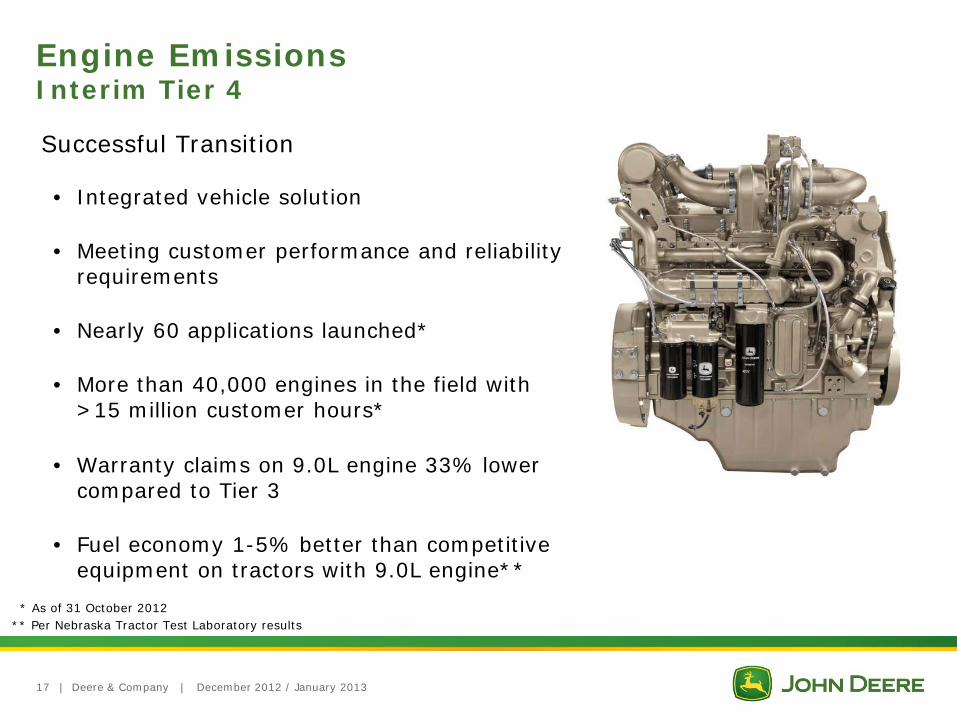
Engine Emissions Interim Tier 4
Deere & Company | December 2012 / January 2013 17
Successful Transition
• Integrated vehicle solution
• Meeting customer performance and reliability requirements
• Nearly 60 applications launched*
• More than 40,000 engines in the field with >15 million customer hours*
• Warranty claims on 9.0L engine 33% lower compared to Tier 3
• Fuel economy 1-5% better than competitive equipment on tractors with 9.0L engine**
• * As of 31 October 2012 •** Per Nebraska Tractor Test Laboratory results

|
Engine Emissions Final Tier 4
Deere & Company | December 2012 / January 2013 18
• Challenge to absorb costs of continuing new emissions technologies
• SCR introduces packaging and other new challenges • DEF freezing can be a concern in colder
climates
• Shorter implementation horizon than iT4
• More applications to transition to FT4 than past programs
• Maintain Tier 2 and Tier 3 solutions for global markets
iT4 success gives confidence in our ability to meet FT4 challenges
|
Feet on the Ground, Eyes on the Horizon
Deere & Company | December 2012 / January 2013 19
Feet on the Ground • Cautiously optimistic in the near-term
• Fiscal Cliff and Euro Zone could prove to be major disruptors to our 2013 plan
• Prepared to pull levers if needed
Eyes on the Horizon • Global economy supports our confidence in long-term macroeconomic trends
• By 2050 • World population will reach ~ 9 billion • Agricultural output must double • Migration from rural areas creates boom for infrastructure
• Making the global investments to meet these challenges
Performance the past three years supports confidence in the John Deere Strategy and our 2018 Ambitions
Supplemental Information Foundational Success Factors
| Deere & Company | December 2012 / January 2013
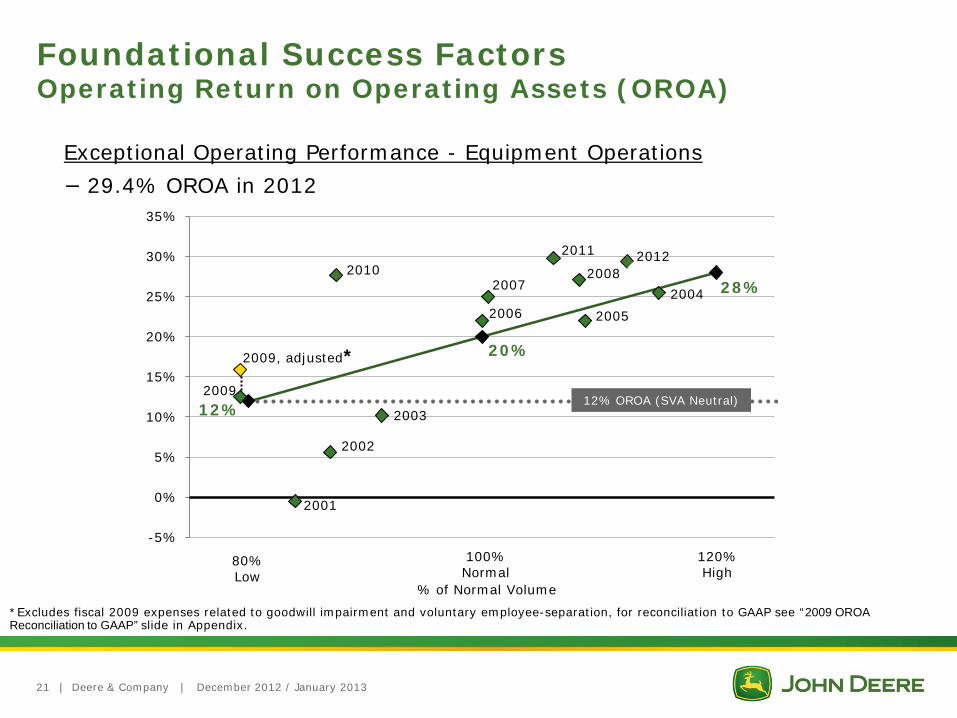
*Excludes fiscal 2009 expenses related to goodwill impairment and voluntary employee-separation, for reconciliation to GAAP see “2009 OROA Reconciliation to GAAP” slide in Appendix.
Foundational Success Factors Operating Return on Operating Assets (OROA)
21
Exceptional Operating Performance - Equipment Operations
− 29.4% OROA in 2012
12%
20%
28%
2001
2002
2003
2004
2005 2006
2007 2008
2009
2009, adjusted*
2010 2011 2012
-5%
0%
5%
10%
15%
20%
25%
30%
35%
% of Normal Volume
80% Low
100% Normal
120% High
12% OROA (SVA Neutral)

| Deere & Company | December 2012 / January 2013
Foundational Success Factors Cash Flow From Operations
22
Exceptional Operating Performance - Equipment Operations
− Higher Net Cash Flow, More Consistently
0
500
1,000
1,500
2,000
2,500
3,000
3,500
1991 1992 1993 1994 1995 1996 1997 1998 1999 2000 2001 2002 2003 2004 2005 2006 2007 2008 2009 2010 2011 2012
$ M
illio
ns
Sale of Trade Receivables to Credit
Adoption of SVA Model
Over $7.5 billion in Pension/OPEB contributions, 2001-2012

| Deere & Company | December 2012 / January 2013
Note: For reconciliation of SVA to GAAP, please see “Equipment Ops SVA Reconciliation to GAAP” slide in Appendix
23
Foundational Success Factors Shareholder Value Added (SVA)
Disciplined SVA Growth - Equipment Operations
− SVA Journey, 1991 - 2012
-1,600
-1,200
-800
-400
0
400
800
1,200
1,600
2,000
2,400
2,800
1991 1992 1993 1994 1995 1996 1997 1998 1999 2000 2001 2002 2003 2004 2005 2006 2007 2008 2009 2010 2011 2012
SVA (
$ m
illio
ns)
| Deere & Company | December 2012 / January 2013
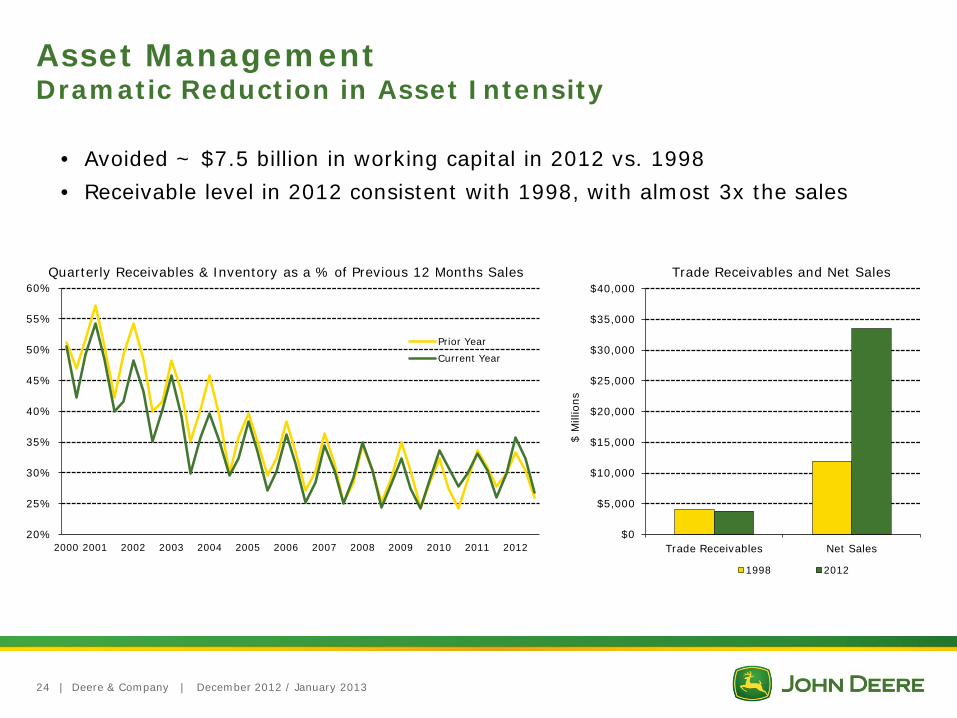
Asset Management Dramatic Reduction in Asset Intensity
20%
25%
30%
35%
40%
45%
50%
55%
60%
2000 2001 2002 2003 2004 2005 2006 2007 2008 2009 2010 2011 2012
Prior Year
Current Year
Trade Receivables and Net Sales
$0
$5,000
$10,000
$15,000
$20,000
$25,000
$30,000
$35,000
$40,000
Trade Receivables Net Sales
$ M
illio
ns
1998 2012
• Avoided ~ $7.5 billion in working capital in 2012 vs. 1998
• Receivable level in 2012 consistent with 1998, with almost 3x the sales
Quarterly Receivables & Inventory as a % of Previous 12 Months Sales
24

| Deere & Company | December 2012 / January 2013
Investment in New Products and Technologies
R&D as Percent of Net Sales
Source: Deere & Company and competitor SEC filings
0.00%
1.00%
2.00%
3.00%
4.00%
5.00%
6.00%
$0
$200
$400
$600
$800
$1,000
$1,200
$1,400
$1,600
2000 2001 2002 2003 2004 2005 2006 2007 2008 2009 2010 2011 2012
Deere R&D $ Deere % Competitor A % Competitor B % Competitor C %
25
|
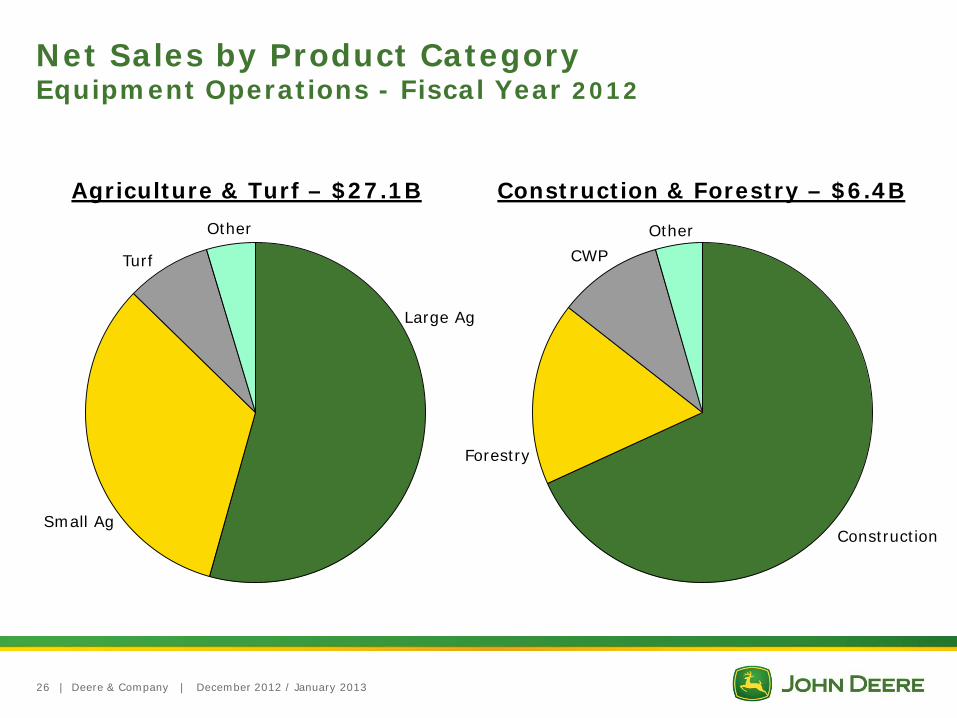
Net Sales by Product Category Equipment Operations - Fiscal Year 2012
Deere & Company | December 2012 / January 2013
Agriculture & Turf – $27.1B Construction & Forestry – $6.4B
Construction
Forestry
CWP
Other
Large Ag
Small Ag
Turf
Other
26
| Deere & Company | December 2012 / January 2013
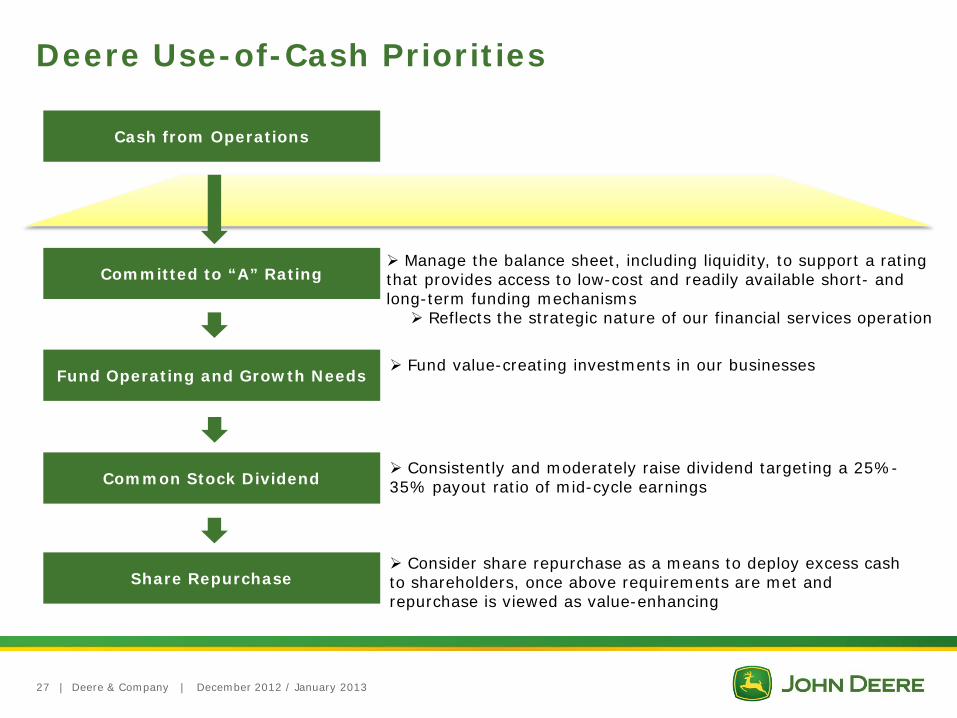
Deere Use-of-Cash Priorities
Manage the balance sheet, including liquidity, to support a rating that provides access to low-cost and readily available short- and long-term funding mechanisms Reflects the strategic nature of our financial services operation
Committed to “A” Rating
Cash from Operations
Fund Operating and Growth Needs
Common Stock Dividend
Share Repurchase
Fund value-creating investments in our businesses
Consistently and moderately raise dividend targeting a 25%-35% payout ratio of mid-cycle earnings
Consider share repurchase as a means to deploy excess cash to shareholders, once above requirements are met and repurchase is viewed as value-enhancing
27

| Deere & Company | December 2012 / January 2013
Share Repurchase As Part of Publicly Announced Plans
28
Cumulative cost of repurchases 2004-2012: ~ $9.2 billion Amount remaining on May 2008 authorization of $5 billion: ~ $2.5 billion 31 October 2012 period ended shares (basic): ~ 387.8 million (diluted): ~ 392.5 million Shares repurchased 2004-2012: ~ 160.7 million Average repurchase price 2004-2012: $57.10
* All shares adjusted for two-for-one stock split effective 26 November 2007 ** Rounded totals for each period – sum may not tie to cumulative cost of repurchases 2004-2012
Actual Shares
Repurchased* (in millions)
Total Amount** (in billions)
2004 5.9 $0.2
2005 27.7 $0.9
2006 34.0 $1.3
2007 25.7 $1.5
2008 21.2 $1.7
2009 0.0 $0.0
2010 5.2 $0.4
2011 20.8 $1.7
2012 20.2 $1.6

|
$0.11
$0.14 $0.16
$0.20 $0.22
$0.25
$0.28 $0.30
$0.35
$0.41
$0.46
$0.00
$0.05
$0.10
$0.15
$0.20
$0.25
$0.30
$0.35
$0.40
$0.45
$0.50
'03 Q
1
Q2
Q3
Q4
'04 Q
1
Q2
Q3
Q4
'05 Q
1
Q2
Q3
Q4
'06 Q
1
Q2
Q3
Q4
'07 Q
1
Q2
Q3
Q4
'08 Q
1
Q2
Q3
Q4
'09 Q
1
Q2
Q3
Q4
'10 Q
1
Q2
Q3
Q4
'11 Q
1
Q2
Q3
Q4
'12 Q
1
Q2
Q3
Q4
Deere & Company | December 2012 / January 2013
Deere Quarterly Dividends Declared* Q1 2003 – Q4 2012
* Adjusted for 2 for 1 stock split on 26 November 2007 ** See slide 5 for revised John Deere Strategy
29
Dividend raised 64% since launch of the revised John Deere Strategy in 2010**

Supplemental Information Global Markets and Opportunities

| Deere & Company | December 2012 / January 2013
Net Sales by Major Markets Fiscal Years 2012, 2011, 2010, 2009
(in millions of dollars) 2012 2011 %
Change 2010 2009
United States 18,128 15,028 +21% 13,027 11,568
Canada 2,679 2,329 +15% 1,767 1,454
Western Europe 4,271 4,382 -3% 3,360 3,427
Central Europe & CIS 1,720 1,407 +22% 746 749
Central & South America 3,589 3,613 -1% 2,623 1,787
Asia, Africa & Middle East 2,124 1,930 +10% 1,430 1,166
Australia & New Zealand 990 777 +27% 620 605
Total 33,501 29,466 +14% 23,573 20,756
31
|
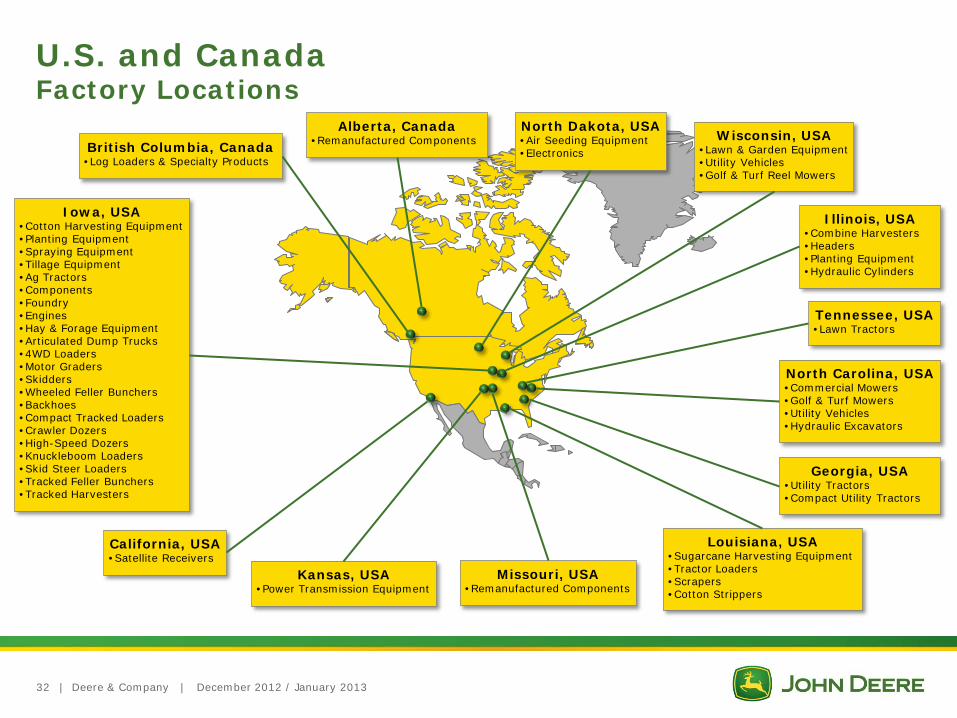
U.S. and Canada Factory Locations
Deere & Company | December 2012 / January 2013 32
Iowa, USA • Cotton Harvesting Equipment • Planting Equipment • Spraying Equipment • Tillage Equipment • Ag Tractors • Components • Foundry • Engines • Hay & Forage Equipment • Articulated Dump Trucks • 4WD Loaders • Motor Graders • Skidders • Wheeled Feller Bunchers • Backhoes • Compact Tracked Loaders • Crawler Dozers • High-Speed Dozers • Knuckleboom Loaders • Skid Steer Loaders • Tracked Feller Bunchers • Tracked Harvesters
Illinois, USA • Combine Harvesters • Headers • Planting Equipment • Hydraulic Cylinders
North Dakota, USA • Air Seeding Equipment • Electronics
North Carolina, USA • Commercial Mowers • Golf & Turf Mowers • Utility Vehicles • Hydraulic Excavators
Alberta, Canada • Remanufactured Components British Columbia, Canada
• Log Loaders & Specialty Products
California, USA • Satellite Receivers
Kansas, USA • Power Transmission Equipment
Missouri, USA • Remanufactured Components
Louisiana, USA • Sugarcane Harvesting Equipment • Tractor Loaders • Scrapers • Cotton Strippers
Georgia, USA • Utility Tractors • Compact Utility Tractors
Tennessee, USA • Lawn Tractors
Wisconsin, USA • Lawn & Garden Equipment • Utility Vehicles • Golf & Turf Reel Mowers
| Deere & Company | December 2012 / January 2013
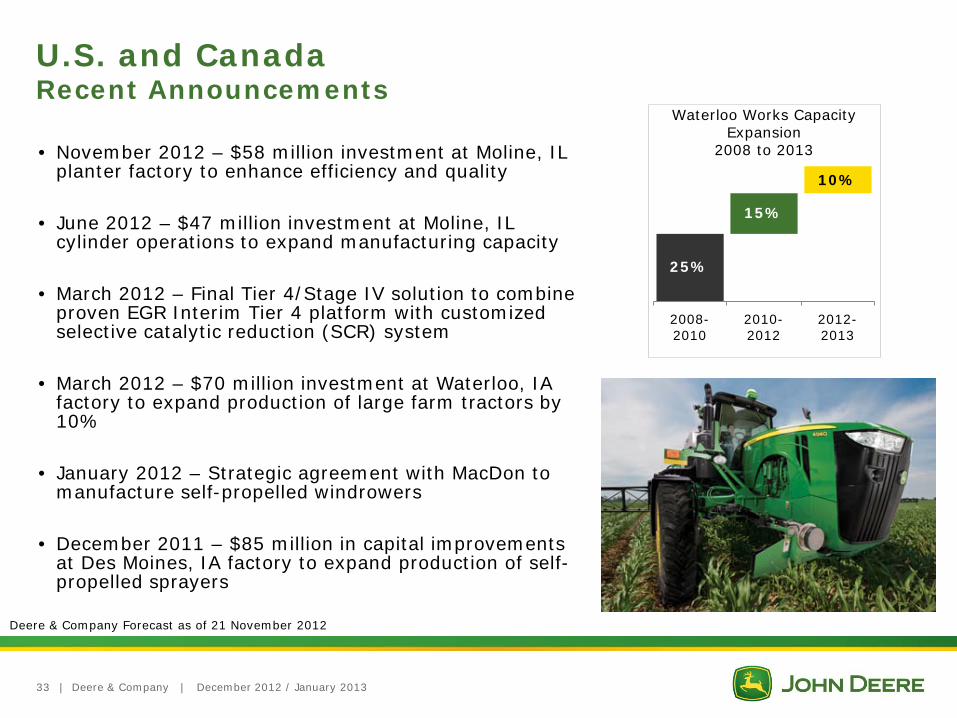
U.S. and Canada Recent Announcements
• November 2012 – $58 million investment at Moline, IL planter factory to enhance efficiency and quality
• June 2012 – $47 million investment at Moline, IL cylinder operations to expand manufacturing capacity
• March 2012 – Final Tier 4/Stage IV solution to combine proven EGR Interim Tier 4 platform with customized selective catalytic reduction (SCR) system
• March 2012 – $70 million investment at Waterloo, IA factory to expand production of large farm tractors by 10%
• January 2012 – Strategic agreement with MacDon to manufacture self-propelled windrowers
• December 2011 – $85 million in capital improvements at Des Moines, IA factory to expand production of self-propelled sprayers
33
2008- 2010
2010- 2012
2012- 2013
25%
15%
10%
Waterloo Works Capacity Expansion
2008 to 2013
Deere & Company Forecast as of 21 November 2012

| Deere & Company | December 2012 / January 2013
EU 27 Factory Locations
Joensuu, Finland • Wheel Forwarders • Wheel Harvesters • Forestry Attachments
Bruchsal, Germany • Tractor, Harvesting & Forestry Cabs
Mannheim, Germany • Tractors
Zweibrücken, Germany • Combine & Forage Harvesters
Arc-les-Gray, France • Forage Equipment • Balers • Ag Loaders
Saran, France • Engines
Madrid, Spain • Components
Horst, The Netherlands • Spraying Equipment
Stadtlohn, Germany • Forage Harvesters • Headers
Gummersbach, Germany • Walk-Behind Mowers
34
|
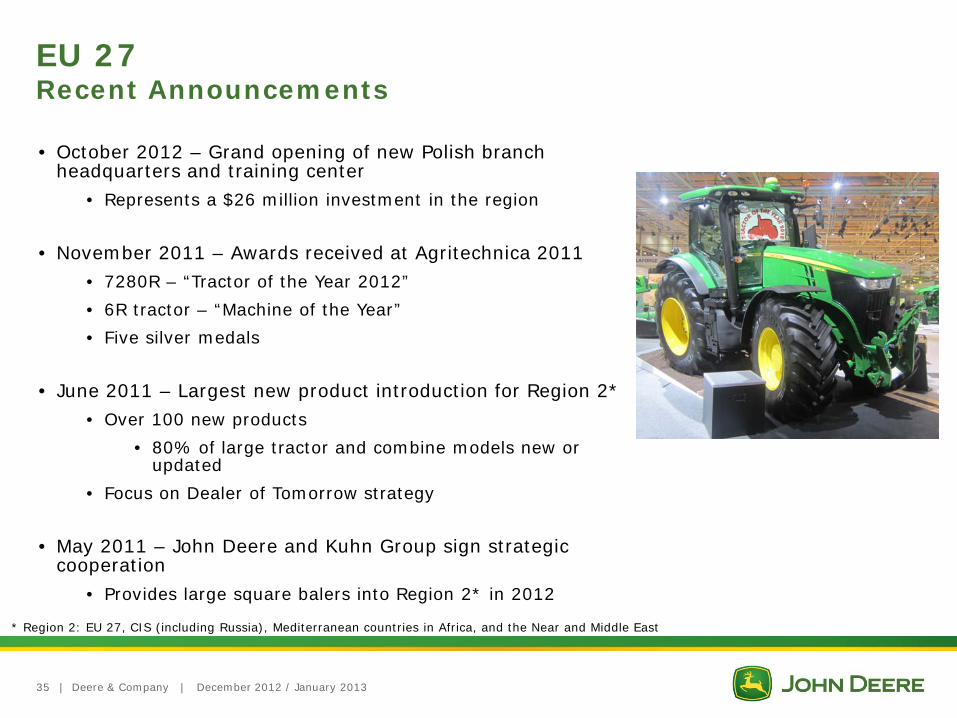
• October 2012 – Grand opening of new Polish branch headquarters and training center
• Represents a $26 million investment in the region
• November 2011 – Awards received at Agritechnica 2011
• 7280R – “Tractor of the Year 2012”
• 6R tractor – “Machine of the Year”
• Five silver medals
• June 2011 – Largest new product introduction for Region 2*
• Over 100 new products
• 80% of large tractor and combine models new or updated
• Focus on Dealer of Tomorrow strategy
• May 2011 – John Deere and Kuhn Group sign strategic cooperation
• Provides large square balers into Region 2* in 2012
Deere & Company | December 2012 / January 2013
EU 27 Recent Announcements
* Region 2: EU 27, CIS (including Russia), Mediterranean countries in Africa, and the Near and Middle East
35
|
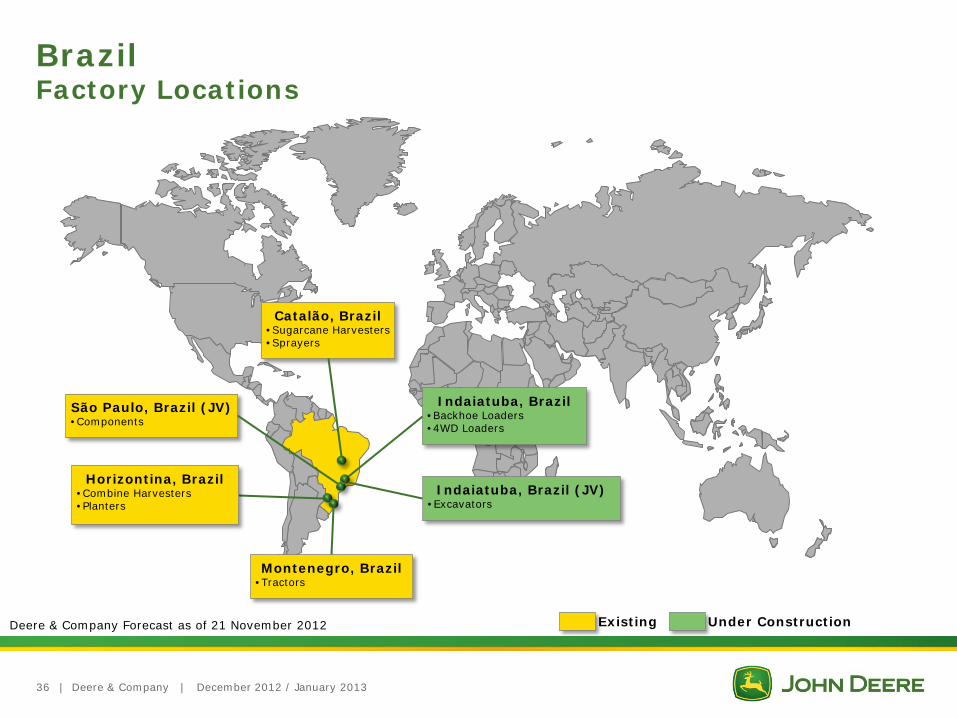
Brazil Factory Locations
Deere & Company | December 2012 / January 2013
São Paulo, Brazil (JV) • Components
Catalão, Brazil • Sugarcane Harvesters • Sprayers
Montenegro, Brazil • Tractors
Horizontina, Brazil • Combine Harvesters • Planters
Indaiatuba, Brazil • Backhoe Loaders • 4WD Loaders
Indaiatuba, Brazil (JV) • Excavators
Deere & Company Forecast as of 21 November 2012
36
Existing Under Construction
| Deere & Company | December 2012 / January 2013
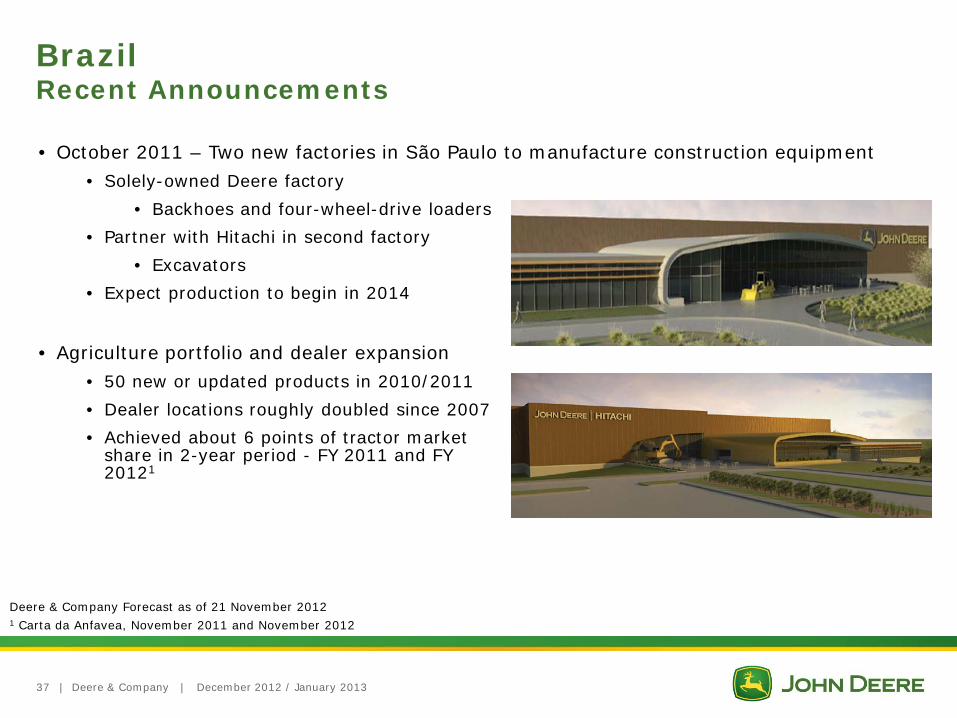
Brazil Recent Announcements
• October 2011 – Two new factories in São Paulo to manufacture construction equipment
• Solely-owned Deere factory
• Backhoes and four-wheel-drive loaders
• Partner with Hitachi in second factory
• Excavators
• Expect production to begin in 2014
Deere & Company Forecast as of 21 November 2012
1 Carta da Anfavea, November 2011 and November 2012
• Agriculture portfolio and dealer expansion
• 50 new or updated products in 2010/2011
• Dealer locations roughly doubled since 2007
• Achieved about 6 points of tractor market share in 2-year period - FY 2011 and FY 20121
37

|
CIS Factory Locations
Orenburg, Russia • Seeding Equipment • Tillage Equipment • Spraying Equipment
Deere & Company | December 2012 / January 2013 38
Orenburg, Russia • Seeding Equipment • Tillage Equipment • Spraying Equipment
Domodedovo, Russia • Tractors • Combine Harvesters • Combine Front-End Equipment • Backhoes, Loaders, Graders • Skidders
Existing Under Construction Deere & Company Forecast as of 21 November 2012
| Deere & Company | December 2012 / January 2013
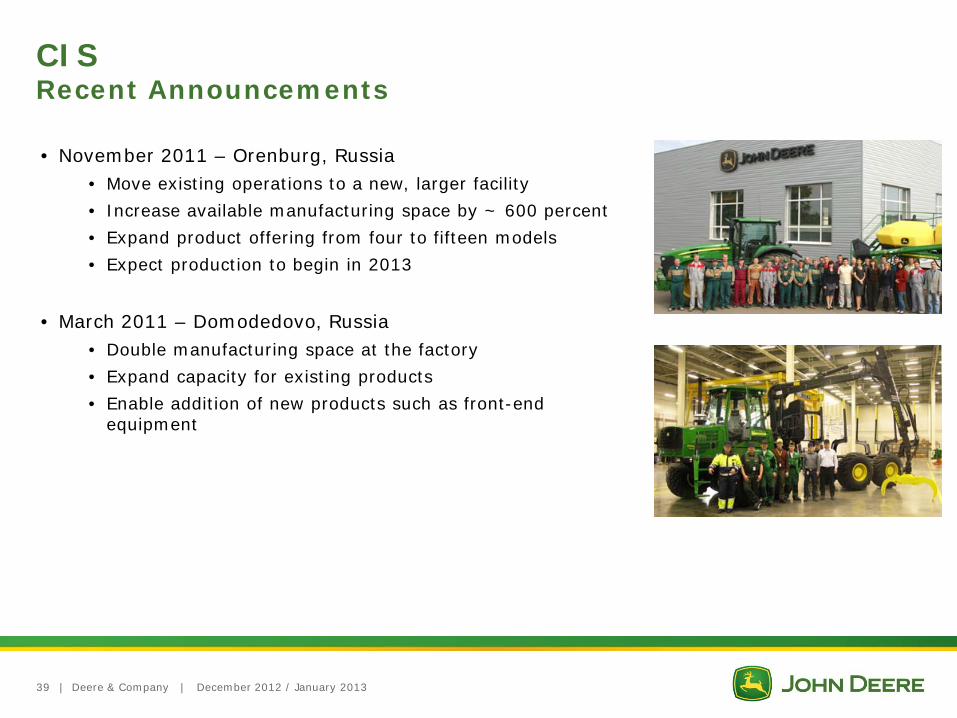
CIS Recent Announcements
• November 2011 – Orenburg, Russia • Move existing operations to a new, larger facility
• Increase available manufacturing space by ~ 600 percent
• Expand product offering from four to fifteen models
• Expect production to begin in 2013
• March 2011 – Domodedovo, Russia • Double manufacturing space at the factory
• Expand capacity for existing products
• Enable addition of new products such as front-end equipment
39

|
India Factory Locations
Deere & Company | December 2012 / January 2013
Gummidipoondi, India (JV) • Side-Shift Backhoes • 4WD Loaders (planned production 2014)
Pune, India • Engines • Transmissions • Tractors (36-75 hp) • Electronics
Sirhind, India • Combine Harvesters
Dewas, India • Tractors (36-50 hp)
Deere & Company Forecast as of 21 November 2012
40
Existing Under Construction
|
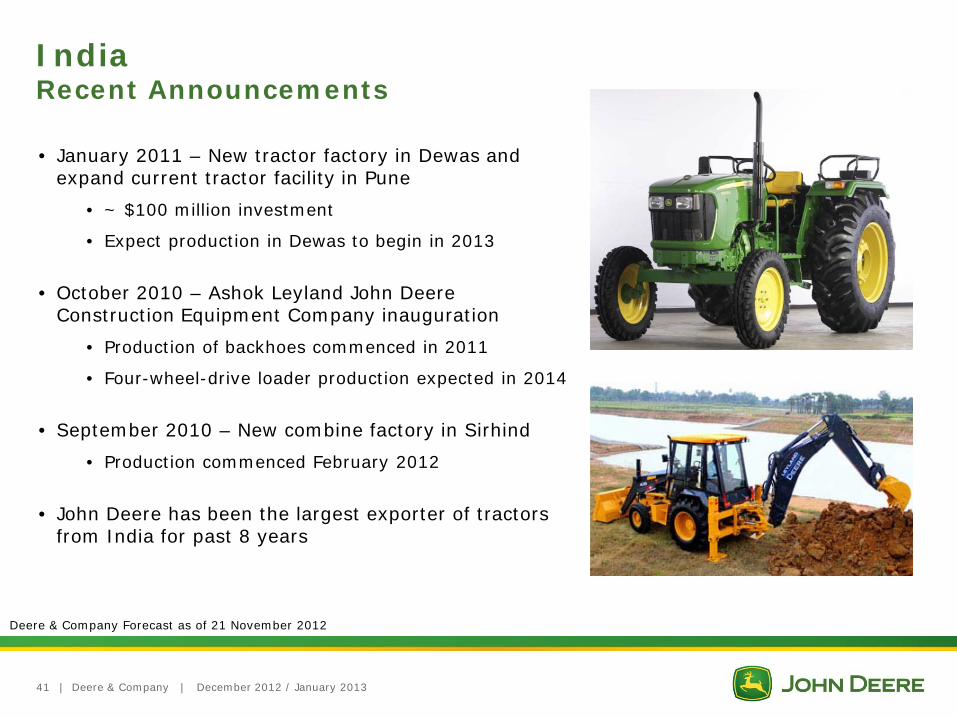
• January 2011 – New tractor factory in Dewas and expand current tractor facility in Pune
• ~ $100 million investment
• Expect production in Dewas to begin in 2013
• October 2010 – Ashok Leyland John Deere Construction Equipment Company inauguration
• Production of backhoes commenced in 2011
• Four-wheel-drive loader production expected in 2014
• September 2010 – New combine factory in Sirhind
• Production commenced February 2012
• John Deere has been the largest exporter of tractors from India for past 8 years
Deere & Company | December 2012 / January 2013
India Recent Announcements
Deere & Company Forecast as of 21 November 2012
41

|
China Factory Locations
Deere & Company | December 2012 / January 2013
Xuzhou, China (JV) • Excavators
Ningbo, China • Tractors (28-70 hp) • Small Combine Harvesters
Tianjin, China (JV) • Tractors (75-135 hp)
Tianjin (TEDA), China • Transmissions
Jiamusi, China • Large Combine Harvesters • Corn Pickers • Cotton Pickers
Harbin, China • Combine Front-End Equipment • Tractors (150+ hp) • Planters • Sprayers • Irrigation Products
Tianjin (TEDA), China • 4WD Loaders • Excavators
Tianjin (TEDA), China • Engines
Deere & Company Forecast as of 21 November 2012
42
Existing Under Construction

| Deere & Company | December 2012 / January 2013
China Recent Announcements
Deere & Company Forecast as of 21 November 2012
Construction Equipment (New)
Engines (New)
Product Test (PV&V)
Office (New)
Tianjin Economic-Technological Development Area (TEDA) Site
Drivetrain
• May 2011 – New engine facility in Tianjin
• ~ $60 million investment
• Initial occupancy July 2012
• Expect production to begin in 2013
• May 2011 – New factory in Harbin
• ~ $80 million initial outlay
• Mid- and large-sized tractors
• Harvesting front-end equipment
• Planters and sprayers
• Irrigation products
• Opened November 2012
• Expect production to begin in 2013
• December 2010 – New construction equipment factory in Tianjin
• ~ $50 million investment
• Initial occupancy July 2012
• Expect production to begin in 2013
43

|
Other Regions Factory Locations
Deere & Company | December 2012 / January 2013 44
Kibbutz Beit Hashita, Israel • Cotton Picker Components
Rosario, Argentina • Engines • Tractors • Combines
Monterrey, Mexico • Rotary Cutters • Implements • Components
Ramos, Mexico • Ag Loaders • Compact Utility Tractor Loaders • Utility Tractor Cabs
Saltillo, Mexico • Ag Tractors • Transaxles
Torreon, Mexico • Axles • Engines • Electronics
Richards Bay, South Africa • Articulated Dump Trucks • Loaders
Tokoroa, New Zealand • Forestry Harvester Heads

|
Worldwide Parts Services Supporting the Global Growth of Our Equipment Operations
Deere & Company | December 2012 / January 2013 45
Highlights: ● Nagpur, India
Announced India Parts Distribution Center… target to open in 4Q 2013
● Johannesburg, South Africa New Regional Distribution Center opened 4Q 2012
● Rosario, Argentina New, larger Regional Distribution Center opened 4Q 2012
● Stockholm, Sweden New Regional Distribution Center serving C&F and A&T opened May 2012
● Bruchsal, Germany E-PDC deconsolidation & packaging facility opened Nov 2011
Anchor Parts Distribution Centers
Regional Parts Distribution Centers or Depots Distribution Centers under construction
| Deere & Company | December 2012 / January 2013
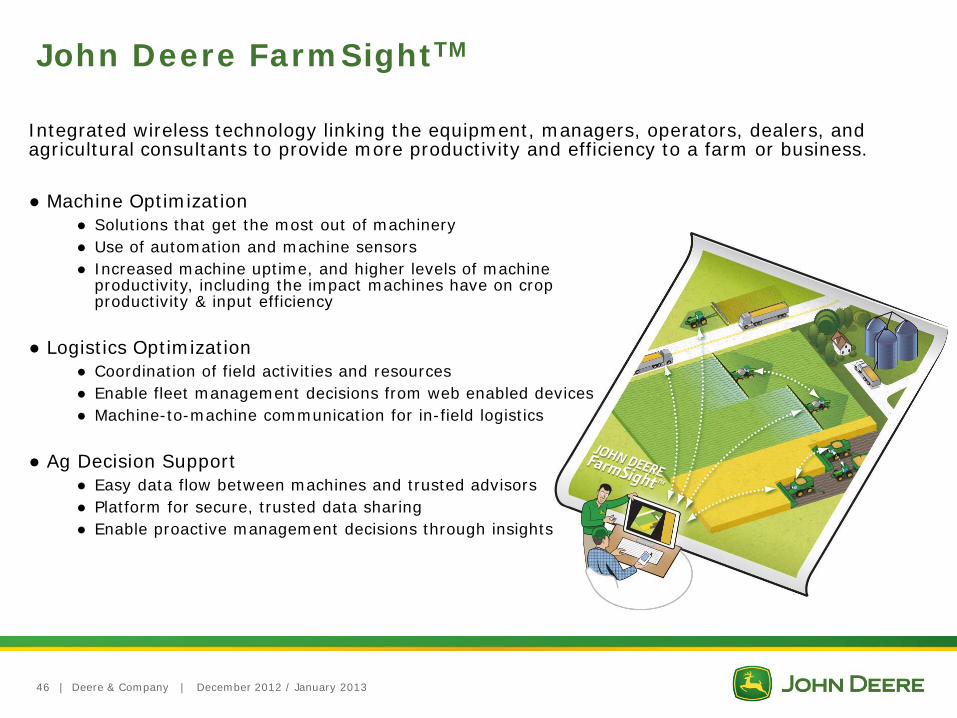
Integrated wireless technology linking the equipment, managers, operators, dealers, and agricultural consultants to provide more productivity and efficiency to a farm or business.
John Deere FarmSightTM
46
● Machine Optimization ● Solutions that get the most out of machinery ● Use of automation and machine sensors ● Increased machine uptime, and higher levels of machine
productivity, including the impact machines have on crop productivity & input efficiency
● Logistics Optimization ● Coordination of field activities and resources ● Enable fleet management decisions from web enabled devices ● Machine-to-machine communication for in-field logistics
● Ag Decision Support ● Easy data flow between machines and trusted advisors ● Platform for secure, trusted data sharing ● Enable proactive management decisions through insights
| Deere & Company | December 2012 / January 2013
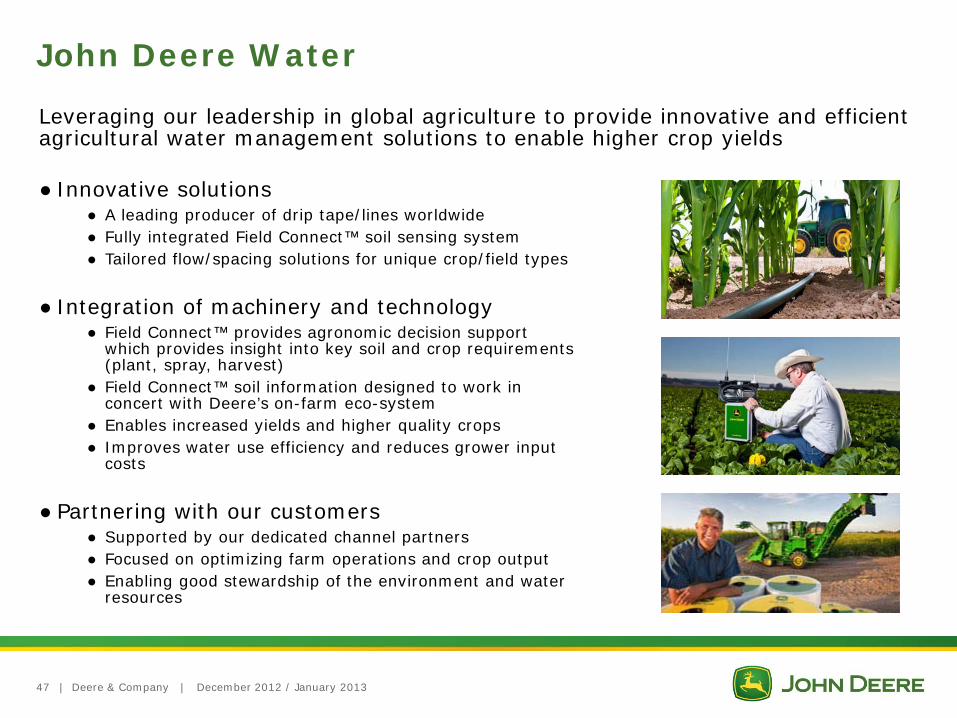
John Deere Water
Leveraging our leadership in global agriculture to provide innovative and efficient agricultural water management solutions to enable higher crop yields
● Innovative solutions ● A leading producer of drip tape/lines worldwide ● Fully integrated Field Connect™ soil sensing system ● Tailored flow/spacing solutions for unique crop/field types
● Integration of machinery and technology ● Field Connect™ provides agronomic decision support
which provides insight into key soil and crop requirements (plant, spray, harvest)
● Field Connect™ soil information designed to work in concert with Deere’s on-farm eco-system
● Enables increased yields and higher quality crops ● Improves water use efficiency and reduces grower input
costs
● Partnering with our customers ● Supported by our dedicated channel partners ● Focused on optimizing farm operations and crop output ● Enabling good stewardship of the environment and water
resources
47

Supplemental Information John Deere Financial Services
| Deere & Company | December 2012 / January 2013
Portfolio Composition by Market
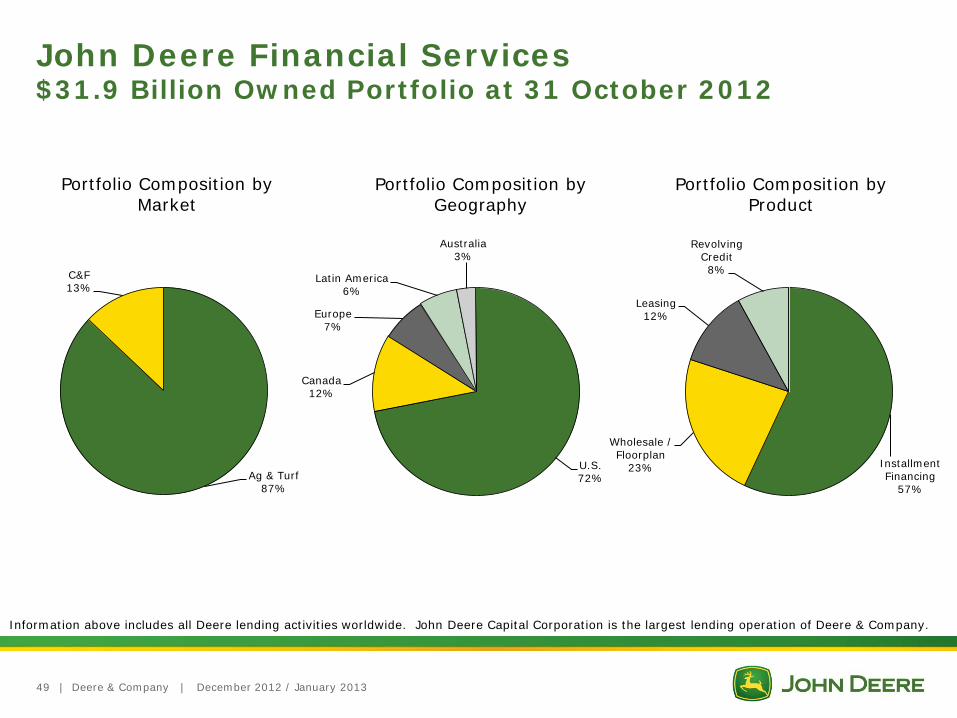
John Deere Financial Services $31.9 Billion Owned Portfolio at 31 October 2012
Portfolio Composition by Geography
Portfolio Composition by Product
Information above includes all Deere lending activities worldwide. John Deere Capital Corporation is the largest lending operation of Deere & Company.
Ag & Turf 87%
C&F 13%
U.S. 72%
Canada 12%
Europe 7%
Latin America 6%
Australia 3%
49
Installment Financing
57%
Wholesale / Floorplan
23%
Leasing 12%
Revolving Credit 8%

| Deere & Company | December 2012 / January 2013
John Deere Capital Corporation Profitability and Growth
50
383
275 291 311
282
149
319 364
2005 2006 2007 2008 2009 2010 2011 2012
Net Income ($ Millions)
0.16% 0.22% 0.29% 0.33%
0.70%
0.48%
0.12% 0.05%
2005 2006 2007 2008 2009 2010 2011 2012
Write-offs/Average Owned Portfolio
17.7 18.6 19.0 19.1 19.3 21.1
23.3
26.6
2005 2006 2007 2008 2009 2010 2011 2012
Administered Portfolio Growth ($ Billions)
Supplemental Information Farm Fundamentals
|
$0
$50
$100
$150
$200
$250
$300
$350
$400
$450
1998 1999 2000 2001 2002 2003 2004 2005 2006 2007 2008 2009 2010 2011 2012F 2013F
$ B
illio
ns
Government Payments Total Cash Receipts
Deere & Company | December 2012 / January 2013
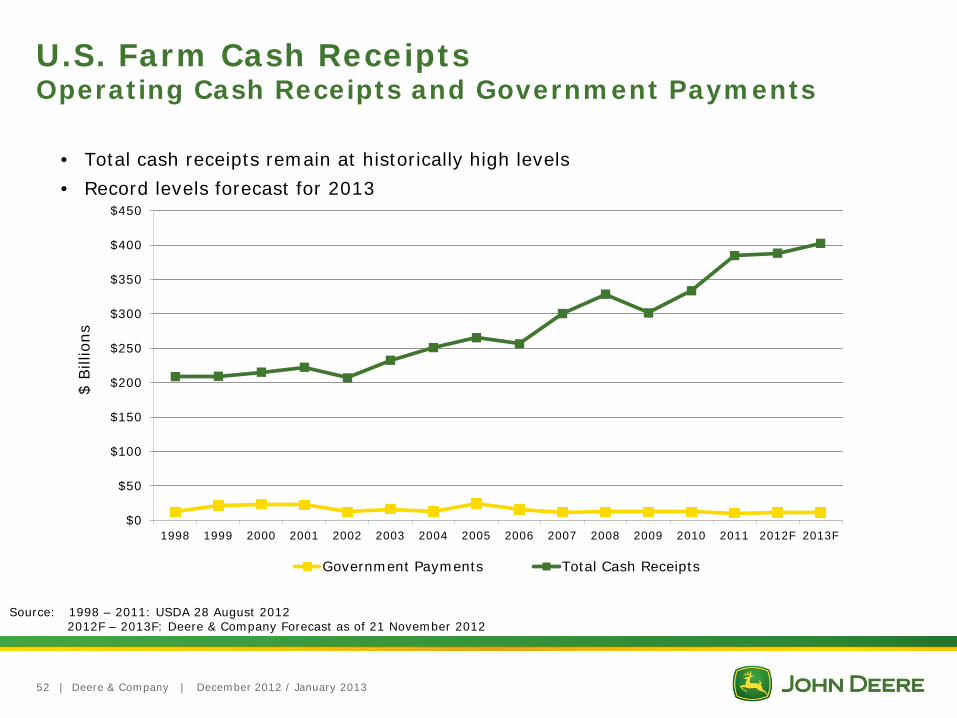
U.S. Farm Cash Receipts Operating Cash Receipts and Government Payments
• Total cash receipts remain at historically high levels
• Record levels forecast for 2013
Source: 1998 – 2011: USDA 28 August 2012 2012F – 2013F: Deere & Company Forecast as of 21 November 2012
52

| Deere & Company | December 2012 / January 2013
U.S. Farm Balance Sheet Strong
53
10%
12%
14%
16%
18%
20%
22%
24%
26%
28%
30%
$0
$500
$1,000
$1,500
$2,000
$2,500
$3,000 1970
1971
1972
1973
1974
1975
1976
1977
1978
1979
1980
1981
1982
1983
1984
1985
1986
1987
1988
1989
1990
1991
1992
1993
1994
1995
1996
1997
1998
1999
2000
2001
2002
2003
2004
2005
2006
2007
2008
2009
2010
2011
2012F
2013F
$ B
illio
ns
Farm Debt Farm Equity Debt to Equity Ratio (%) Debt to Asset Ratio (%)
Source: 1970 – 2011: USDA 27 November 2012 2012F – 2013F: Deere & Company Forecast as of 21 November 2012

|
World Farm Fundamentals Global Stocks-To-Use Ratios
Deere & Company | December 2012 / January 2013 54
0%
10%
20%
30%
40%
50%
60%
70%
80% 1992
1993
1994
1995
1996
1997
1998
1999
2000
2001
2002
2003
2004
2005
2006
2007
2008
2009
2010
2011E
2012P
Source: USDA - 11 December 2012
Cotton
Wheat
Corn
Soybeans
Supplemental Information Appendix

| Deere & Company | December 2012 / January 2013
Equipment Ops SVA Reconciliation to GAAP
Equipment Operations 1991 1992 1993 1994 1995 1996 1997 1998 1999 2000 2001Net Sales 5,848 5,723 6,479 7,663 8,830 9,640 11,082 11,926 9,701 11,169 11,077 Average Identifiable Assets
With Inventories at LIFO 5,585 5,765 5,449 5,551 6,187 6,502 6,682 7,672 7,724 8,069 8,743 With Inventories at Standard Cost 6,702 6,846 6,442 6,494 7,131 7,488 7,703 8,711 8,739 9,039 9,678
Operating Profit 16 77 242 847 1,006 1,125 1,402 1,476 272 693 (46) Percent of Net Sales 0.3% 1.3% 3.7% 11.1% 11.4% 11.7% 12.6% 12.4% 2.8% 6.2% -0.4%
Operating Return on AssetsWith Inventories at LIFO 0.3% 1.3% 4.4% 15.3% 16.3% 17.3% 21.0% 19.3% 3.5% 8.6% -0.5%With Inventories at Standard Cost 0.2% 1.1% 3.8% 13.0% 14.1% 15.0% 18.2% 16.9% 3.1% 7.7% -0.5%
SVA Cost of Assets (804) (821) (773) (780) (856) (898) (924) (1,045) (1,049) (1,085) (1,162) SVA (788) (744) (531) 67 150 227 477 431 (776) (392) (1,208)
Equipment Operations 2002 2003 2004 2005 2006 2007 2008 2009 2010 2011 2012Net Sales 11,703 13,349 17,673 19,401 19,884 21,489 25,803 20,756 23,573 29,466 33,501 Average Identifiable Assets
With Inventories at LIFO 6,229 5,965 6,482 7,248 7,546 8,092 9,652 9,647 9,196 11,516 13,594 With Inventories at Standard Cost 7,147 6,925 7,477 8,312 8,634 9,205 10,812 10,950 10,494 12,875 14,965
Operating Profit 401 708 1,905 1,842 1,905 2,318 2,927 1,365 2,909 3,839 4,397 Percent of Net Sales 3.4% 5.3% 10.8% 9.5% 9.6% 10.8% 11.3% 6.6% 12.3% 13.0% 13.1%
Operating Return on AssetsWith Inventories at LIFO 6.4% 11.9% 29.4% 25.4% 25.2% 28.6% 30.3% 14.1% 31.6% 33.3% 32.3%With Inventories at Standard Cost 5.6% 10.2% 25.5% 22.2% 22.1% 25.2% 27.1% 12.5% 27.7% 29.8% 29.4%
SVA Cost of Assets (858) (831) (897) (998) (1,036) (1,094) (1,284) (1,301) (1,259) (1,545) (1,795) SVA (457) (123) 1,008 844 869 1,224 1,643 64 1,650 2,294 2,602
(millions of dollars unless stated otherwise)
56
| Deere & Company | December 2012 / January 2013
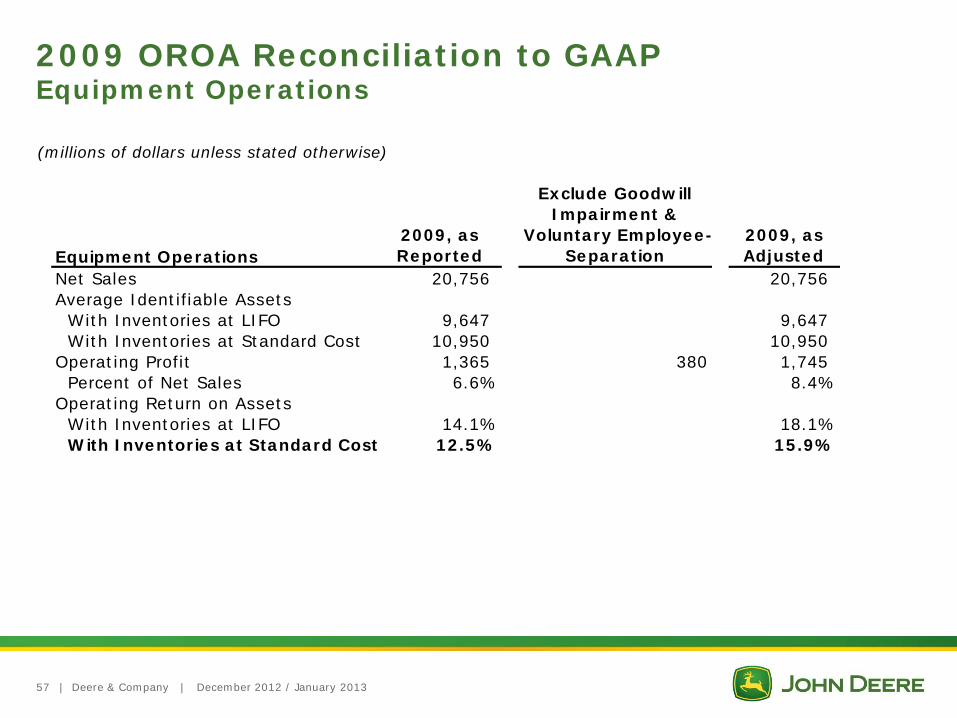
2009 OROA Reconciliation to GAAP Equipment Operations
Equipment Operations2009, as Reported
Exclude Goodwill Impairment &
Voluntary Employee-Separation
2009, as Adjusted
Net Sales 20,756 20,756 Average Identifiable Assets
With Inventories at LIFO 9,647 9,647 With Inventories at Standard Cost 10,950 10,950
Operating Profit 1,365 380 1,745 Percent of Net Sales 6.6% 8.4%
Operating Return on AssetsWith Inventories at LIFO 14.1% 18.1%With Inventories at Standard Cost 12.5% 15.9%
(millions of dollars unless stated otherwise)
57