deer creek-sugar creek watershed plan - wabash river
TRANSCRIPT

Deer Creek-Sugar
Creek Watershed Plan
Purdue University: FNR 498 Capstone
Courtney Blouzdis, Lexis Butler, Jessica Johnson, Josh Ketron,
Elizabeth Monell, and Zhifen Pan

1
TABLE OF CONTENTS
Executive Summary 3
Section 1: Introduction of the Plan 4
Section 2: Current Conditions of the Watershed 6
I. Human Dimensions 6
I.1. Population Growth
I.2. Public Views
I.3. Development
II. Public Land (Recreation) 8
II.1. State Parks and Reservoirs
II.2. County Recreation
III. Land Use Type 10
III.1. Overview of the Watershed
III.2. Land Use Overview
IV. Vegetative Cover 11
IV.1. Cultivated Crops
IV.2. Deciduous Forest
IV.3. Herbaceous Grassland
V. Agriculture 14
V.1. Agriculture Practices
V.2. Livestock Operations
VI. Ecoregions and Geology 20
VI.1. Ecoregions
VI.2. Soils
VI.3. Natural Communities
VII. Climatology 30
VIII. Water and Fishery Quality 31
VIII.1. Hydrology
VIII.2. Flooding
VIII.3. Contamination

2
VIII.4. Stream Flow
IX. Endangered, Threatened or Rare Species 36
IX.1. Mammals
IX.2. Birds
IX.3. Reptiles
X. Fisheries 37
X.1. Sport Species
X.2. Non-sport Species
X.3. Endangered Species
X.4. Invasive Species
XI. Opportunities and Constraints 39
XI.1. Opportunities
XI.2. Constraints
Section 3: Goals, Alternatives, and Objectives 42
Section 4: Implementations 55
Section 5: Appendix 93
Section 6: Literature Cited 112

3
Executive Summary
The Deer Creek- Sugar Creek Watershed is a 345 square mile watershed located
in central Indiana and contains five counties: Carroll, Cass, Howard, Miami, and
Tippecanoe. It covers drainages of three tributaries to the Wabash River- Deer Creek,
Sugar Creek, and Buck Creek. A majority of the land is privately owned with 83% in row
crop agriculture, and the watershed is home to more than 100 confined feeding operations
and several small towns including Delphi, Flora, Galveston and Americus.
This watershed currently faces many issues that cause harm to the surrounding
environment. If erosion, sedimentation and nutrient loading problems continue, there will
be further degradation of water quality. Habitat loss has threatened biodiversity within
the area, recreational activity is limited, and residents could become more involved with
the conservation of the watershed. Measures should be taken in order to improve the
overall environmental quality of the watershed.
Our management plan focuses on four areas of improvement: increase water quality,
increase biodiversity and manage wildlife habitat, increase public awareness and
involvement, and increase recreational opportunities.
We suggest that decreasing erosion and sedimentation, decreasing E. Coli levels,
reducing nutrient loading, and developing a water quality monitoring system will
improve the water quality in the watershed.
We suggest that connecting fragmented forest patches, restoring and managing
wetlands, and restoring native grasslands will increase biodiversity and manage
wildlife habitat
We suggest informing the public of various federal and state conservation
programs, educating the public on water quality concerns, and informing the
public of funding opportunities will increase public awareness and involvement
We suggest establishing bike and walking trails, increase amenities like benches,
restrooms, etc, and increasing public access areas will increase recreational
opportunities.
In order to help stakeholders implement this plan, we provide further information on
which stakeholders should be involved and how different jurisdictions should work
together. Spatial analysis was incorporated throughout the plan using ArcGIS software.
The timeline for each alternative and budget and funding opportunities are also listed in
detail.

4
Section 1: Introduction of the Plan
Purpose
The Deer Creek- Sugar Creek Watershed faces a number of issues that threaten
environmental quality. If these issues continue to trend in the same direction, there will
be degrading water quality, declining levels of biodiversity and lack of recreational
resources. This plan aims to point out the current needs of the watershed and provide
methods and suggestions to aid stakeholders in building a desired future condition.
Cooperation between Purdue University and the Wabash River Enhancement
Corporation has been established to compose this comprehensive management plan
which is tailored to fit the specific issues within the watershed. Since 83% of the land
within the watershed is agricultural, we have suggested a range of Best Management
Practices (BMPs) that can lead to an improvement in water quality and biodiversity in the
area. Many funding opportunities were explored and listed to provide reference for
interested stakeholders. Forest patches should be connected and wetlands, grasslands
should be restored and properly managed to provide more wildlife habitat. Workshops
and public meetings were proposed to inform local residents of conservation issues
within the area. Suggestions to improve recreation resources were also made so that
citizens can have a better chance to appreciate the outdoors.
Vision
The intention of this plan is to determine the current needs of the watershed and
provide a comprehensive management plan that can aid local stakeholders in
management decisions of their land. The desired future conditions would be a healthy
watershed with clean water, balanced ecosystem, more recreational opportunities, and
better public appreciation. We will achieve this through our four main goals: improve
water quality, increase biodiversity and wildlife habitat, increase public awareness and
involvement, and increase recreational opportunities. Specific methods such as planting
filter strips and grassed waterways can help with erosion and sedimentation problems,
while wetland restoration can help reestablish historical land use within the area as well
as provide wildlife habitat. Recreation allows citizens to enjoy the outdoors and hopefully
will lead them to better appreciate nature. Community involvement and education can
promote environmental stewardship and stress the importance of conservation.
Vision Statement:
Through the encouragement of sustainable farming methods, biodiversity conservation,
stakeholder involvement, and recreation development, this plan supports management of
all land within the watershed in a manner that sustains natural resources and that will, in
turn, contribute to economic and community stability within the Deer Creek-Sugar Creek
Watershed.

5
Time frame
We have assigned this plan a 15 year lifespan, so it is intended to reach all goals and
objectives by 2027. It is broken down into 5 year segments: 2012-2017, 2017-2022,
2022-2027, so that reevaluations can be made every 5 years. There will be consistent
monitoring of improvements made in the watershed throughout these time periods.
Map of watershed provided by the Wabash River Enhancement Corporation:

6
Section 2: Current Conditions of the Watershed
I. Human Dimensions
II.1 Population Growth
Figure I.1.1. Population growth for the five different counties within -the Deer Creek-Sugar Creek
watershed is shown above. Data collected for each county comes from the census bureau on 2000, 2010,
and projected year 2015. As shown in the table above Carroll, Cass, Howard, and Miami provide a
relatively constant population throughout the 15 year projection. On the other hand, Tippecanoe County has
an increase in population from 2000 to 2010 then has a projected decrease in population growth from 2010
to 2015.
I.2 Public Views
The stakeholders of the Deer Creek-Sugar Creek watershed spoke out at the
watershed public meeting on October 19, 2011 (see Appendix I). This public meeting met
at Flora 4-H Building in Flora, IN. Stakeholders who attended the public meeting
consisted of people with in the watershed. Most of the stakeholders held occupations of
farmers, professors, students, and miscellaneous. The watershed quality was examined by
the stakeholders of the watershed and was said to be of medium quality overall. Yet, the
stakeholders involved at the meeting noticed a change in the Deer Creek-Sugar Creek
flow. Stakeholders mentioned that the “low flow” or “loss of volume” in the watershed
has been worse then it has in the last 5-10 years, thus affecting the watershed quality.
According to the stakeholders the poor quality of the watershed was due to agriculture
drainage and manure from various swine farms. Stakeholders observed discoloration in
the water after rainfall. The discoloration has a negative effect on the water quality this
being true they were unsure of the direct cause of the discolorations.
The public’s view of the watershed problems included major issues of erosion,
flooding, and containments. Lack of buffers or filter strips were mentioned at the meeting
as potential problem sources. Illegal septic tanks and over flow issues were also noticed
Population Growth
0
50000
100000
150000
200000
2000 2010 2015
Years
Nu
mb
er
of
Peo
ple Caroll
Cass
Howard
Miami
Tippacanoe

7
contributing to risk of health relating to E. coli. A future predicted problem voiced by
watershed stakeholders came from the incoming Hoosier Heartland Highway. Major
issues of the Hoosier Heartland Highway were thought to be erosion issues, ecosystem
disruptions, and flooding. Stakeholders at the meeting spoke about the use of insecticides
having a negative impact to the ecosystems and its biota.
Solutions to the watershed problems started with the use of buffers or filter strips
along the creeks or pools of water flow. Stakeholders wanted to increase water
monitoring which could alert officials of any negative changes in the water quality before
those issues became harmful to the watershed. Many of the stakeholders attending the
meeting said they would invest personal time or effort to increase the quality of the
watershed.
I.3 Development
Most of the development within the Deer Creek-Sugar Creek watershed happens
in the major cities in the five counties where the largest percentage of the population is
located. Table I.3.1 below shows how a large proportion of the counties populations are
in the heavily developed urban areas.
Watershed County Largest Populated City/Percentage of
County’s Population
Carroll Delphi/14.6%
Cass Logansport/47.1%
Howard Kokomo/54.8%
Miami Peru/32.2%
Tippecanoe Lafayette/39.8%, West Lafayette/17.6%
Table I.3.1 The table above shows that the higher percentages of the population within the watershed
inhabit highly urbanized areas.

8
Carroll Cass Howard Miami Tippecanoe
Percentage
of
Employment
of farms
11.8% 4.9% 1% 5.1% 0.8%
Percentage
of
Employment
of Non-
Farmers
88.2% 95.1% 99% 94.6% 99.2%
Table I.3.2 This table shows the employment percentage of the counties population that are farmers and
those who are non-farmers. These statistics show how counties within the Deer Creek-Sugar Creek
watershed are used to analyze the land use cover type in the next section. The non-farmers are focused in
the developed urban area within the watershed where as farmers are sparse throughout the non-urbanized
croplands of the watershed.
The major project, Hoosier Heartland Highway, will provide a large portion of
economic development for stakeholders in the Deer Creek-Sugar Creek watershed.
Hoosier Heartland Highway project involves changing State Road 25 from a two lane
highway into a four lane highway. This highway will stretch from Lafayette to Fort
Wayne, with a link to Highway 24. This project will promote economic development in
Tippecanoe, Carroll, and Cass counties. The purposes of providing a four lane highway
from Lafayette to Fort Wayne will be a critical link in the Heartland Industrial Corridor,
be a safe facility, and serve traffic. Although there are numerous benefits associated with
this project, there are also several environmental problems that may arise. The removal of
forested lands, grasslands, and the movement of dirt will result in erosion problems. Final
records of the committee decisions and planning can be seen at:
http://www.tippecanoe.in.gov/egov/docs/1290093658_52459.pdf.
II. Public Land (Recreation)
II.1 State Parks and Reservoirs
The Deer Creek-Sugar Creek watershed has many activities to offer for its
residents to participate in throughout its five counties. Canoeing and boating are offered
in the Deer Creek with 23 miles of floatable area. Fishing can be available year around at
Deer Creek Park. Some of these activities include: canoeing, bike trails, walking trails,
campgrounds, parks, and golf courses. Prophetstown State Park is located in
Battleground, IN, Tippecanoe County, and covers approximately 2000 acres. It is
partnered with Historic Prophetstown, which recreates agriculture in the 1920’s over a
restored prairie. The natural area is one that is recently new in the state of Indiana, and

9
offers its visitors hiking trails ranging easy to moderate level. Individuals also have the
option of biking or camping (Indiana DNR).
II.2 County Recreation
The town of Delphi is located in Carroll County, contains six parks, and up to 10
miles of hiking/biking trails. Wabash and Erie Canal Park host a recreated pioneer
village to educate on the years past, and to preserve the history of the Wabash and Erie
Canal. People can opt for boat rides down the canal, camping, and hiking are also
available. Trailhead Park and Deer Creek Park are places to retreat for hiking, camping,
and excellent fishing. Riley Park, Flora Community Park, and Camden-Jackson
Township Park are available for other recreational uses, such as sports, and playground
equipment. Eller Pond WCA is also located within Carroll County and are public
hunting lands, targeted at waterfowl (Carroll County).
Figure II.2.1. This figure shows the available trails throughout Delphi, Indiana which is in Carroll County.
Cass County houses fifteen different parks, but only a few are geared towards
outdoor recreational activities such as swimming, picnicking, and fishing. Some of these
parks include: River Bluff Trail, Little Turtle Waterway, and Hervey Preserve and
Labyrinth (Cass County).
10
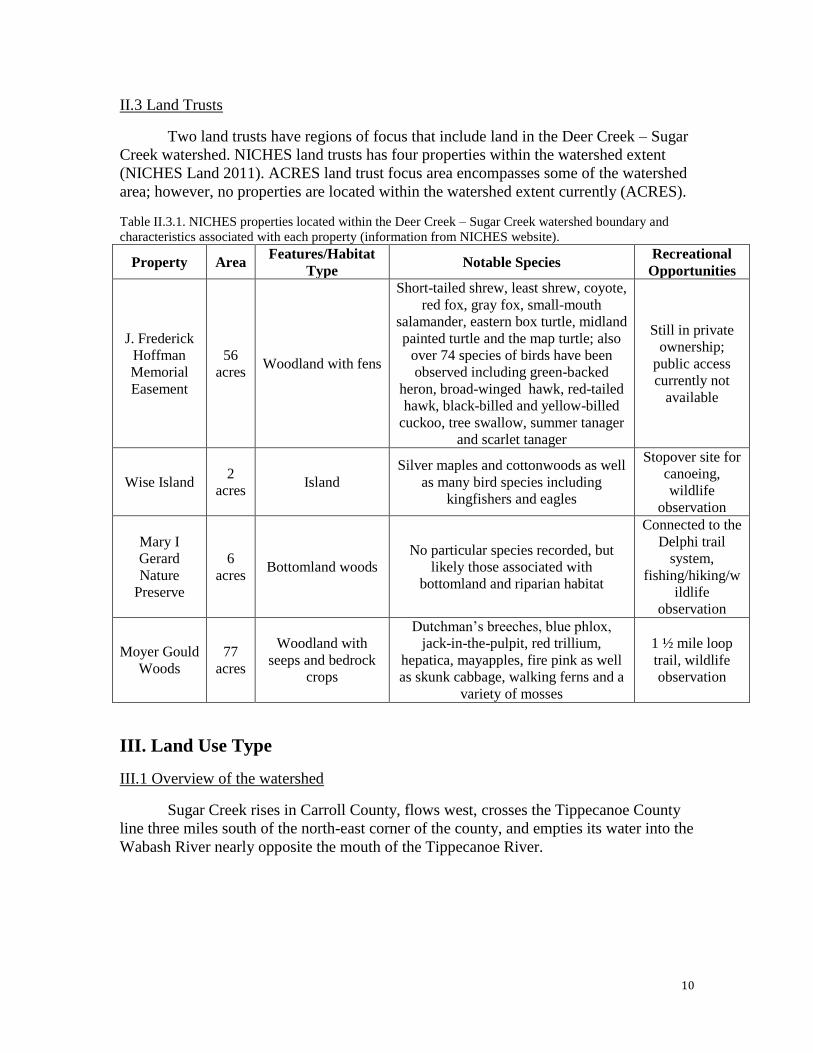
II.3 Land Trusts
Two land trusts have regions of focus that include land in the Deer Creek – Sugar
Creek watershed. NICHES land trusts has four properties within the watershed extent
(NICHES Land 2011). ACRES land trust focus area encompasses some of the watershed
area; however, no properties are located within the watershed extent currently (ACRES).
Table II.3.1. NICHES properties located within the Deer Creek – Sugar Creek watershed boundary and
characteristics associated with each property (information from NICHES website).
Property Area Features/Habitat
Type Notable Species
Recreational
Opportunities
J. Frederick
Hoffman
Memorial
Easement
56
acres Woodland with fens
Short-tailed shrew, least shrew, coyote,
red fox, gray fox, small-mouth
salamander, eastern box turtle, midland
painted turtle and the map turtle; also
over 74 species of birds have been
observed including green-backed
heron, broad-winged hawk, red-tailed
hawk, black-billed and yellow-billed
cuckoo, tree swallow, summer tanager
and scarlet tanager
Still in private
ownership;
public access
currently not
available
Wise Island 2
acres Island
Silver maples and cottonwoods as well
as many bird species including
kingfishers and eagles
Stopover site for
canoeing,
wildlife
observation
Mary I
Gerard
Nature
Preserve
6
acres Bottomland woods
No particular species recorded, but
likely those associated with
bottomland and riparian habitat
Connected to the
Delphi trail
system,
fishing/hiking/w
ildlife
observation
Moyer Gould
Woods
77
acres
Woodland with
seeps and bedrock
crops
Dutchman’s breeches, blue phlox,
jack-in-the-pulpit, red trillium,
hepatica, mayapples, fire pink as well
as skunk cabbage, walking ferns and a
variety of mosses
1 ½ mile loop
trail, wildlife
observation
III. Land Use Type
III.1 Overview of the watershed
Sugar Creek rises in Carroll County, flows west, crosses the Tippecanoe County
line three miles south of the north-east corner of the county, and empties its water into the
Wabash River nearly opposite the mouth of the Tippecanoe River.

11
III.2 Land Use Overview
Most (83.3%) of the Deer Creek-Sugar Creek watershed is used as cropland. Less
than 1% of the land is urban developed space, and the remaining 16% consists of
deciduous forests, developed open space, pasturelands and grasslands (USGS Land Cover
Data from IndianaMap.com).
Land Use Area (acres) Percent of Watershed
Woody Wetlands 1063.27 0.44
Shrub/Scrub 418.1 0.17
Pasture/Hay 4551.53 1.9
Open Water 708.99 0.3
Grasslands/Herbaceous 2507.72 1.04
Table III.2.1. Land Use Data for Deer Creek-Sugar Creek Watershed (GIS Data from
USGS Land Cover 2001)
IV. Vegetative Cover
Historically, the natural vegetation within the watershed consisted of wetland,
marshland, grassland and deciduous forests. As settlers came into the area, they drained
and cleared the land for agricultural use, which is the vast majority of land use activity
that we see within the watershed today (Tormoehlen et al., 2000).
IV.1 Cultivated Crops
Agriculture is the largest land use type at 83.3% of total land cover. These lands
mainly consist of corn and soybeans, though some farmers have planted small grains such
as cereal rye. Hay and pasture are also present. Because of Best Management Practices
(BMPs) and other conservation programs such as the Environmental Quality Incentives
Program (EQIP) and the Wetland Reserve Program (WRP), crop cover has been reducing
over recent years and more land has been returned to its natural vegetation
(www.in.nrcs.usda.gov).
IV.2 Deciduous forests
GIS analysis shows that approximately 5.8% of the land within the watershed
boundary is categorized as deciduous forest. The forest types and species that are listed
below are very common across northern Indiana, and should be abundant in our
watershed.
On various well-drained uplands there are traditional oak-hickory forests that
contain hardwood species of oaks and hickories (Smith et al., 2001).

12
Some common oak species are: northern red oak (Quercus rubra), white oak
(Quercus alba), black oak (Quercus velutina), and chinkapin oak (Quercus
muehlenbergii); and some common hickory species are: pignut hickory (Carya glabra),
bitternut hickory (Carya cordiformis), mockernut hickory (Carya tomentosa), and
shagbark hickory (Carya ovata).
Another forest type would be the sugar maple-American beech- yellow birch
forest. The main tree species in these forests are more shade tolerant, such as sugar maple
(Acer saccharum), red maple (Acer rubrum), American beech (Fagus grandifolia), and
yellow birch (Betula alleghaniensis) (Smith et al., 2001).
Many of these deciduous forests have been reduced into scattered woody parcels.
These privately owned woody parcels lead to habitat fragmentation. Because of the small,
fragmented forest patches, some wildlife populations will experience a decrease in
population numbers since they need large continuous forested areas in order to survive
and reproduce (Fahrig, 2003). If these current trends continue and more forested land is
converted into cropland, we can expect many negative environmental impacts. Along
with the loss of forests, wildlife habitat would also decrease which would hurt the
population of many forest species. As a response, there are various conservation
programs and funding opportunities that aim to reduce habitat fragmentation such as
conservation easements, which restrict development in environmentally sensitive areas.
Another program would be the Indiana Classified Forest and Wildlands Program which
encourages wildlife habitat management on private lands in Indiana. Details on this
program can be found on the Indiana Department of Natural Resources website:
http://www.in.gov/dnr/forestry/4801.htm.
Example of a fragmented forest patch in Carroll County (Image courtesy of Google Maps).

13
One more important forest type that should be mentioned is riparian zones. These are
vegetation strips that grow along stream and river banks (Smith et al., 2001). Some
commons species that grow here are: silver maple (Acer saccharinum), American
sycamore (Platanus occidentalis), eastern cottonwood (populous deltoids), and hackberry
(Celtis occidentalis). These forests are important because they can play an important role
in preventing soil erosion and maintaining water quality. The trees act like a line of filters
that stop sediments from entering the waterways (Gregory et al., 1991). If landowners
choose to clear the woody vegetation along the river on their land, they would increase
the risk of making the riverbank erodible and cause water quality degradation. Within the
watershed boundary, it has been observed that in some areas landowners only leave a
very narrow strip of vegetation along the creek, which could lead to the problems
mentioned above.
Example of very thin strip of vegetation along Deer Creek in Carroll County (Image courtesy of Google
Maps).

14
IV.3 Herbaceous Grassland
A small 1.04% of the watershed is categorized as herbaceous grassland. This is a
diverse ecosystem in which many grass and wildflower species are present. The species
listed below are native grassland species in northern Indiana, which would be abundant
throughout the grasslands in our watershed.
Some wildflower species are: wild bergamot (Monarda fistulosa), blazing star
(Liatris spp.), black-eyed Susan (Rudbeckia serotina), and the purple coneflower
(Echinacea purpurea).
Examples of grass species would be: Indian grass (Sorghastrum nutans), big bluestem
(Andropogon gerardii), little bluestem (Andropogon scoparius), and sideoats grama grass
(Bouteloua curtipendula).
The most dominant grassland would be in Tippecanoe County within Prophetstown
State Park. There they have been restoring native habitats such as prairie, wetlands and
open woodlands and if current trends continue, people would be able to appreciate a
landscape that the Native Americans experienced pre-settlement (www.in.gov/dnr).
Image of prairie grasses at Prophetstown State Park (Image courtesy of Indiana Department of
Natural Resources).
V. Agriculture
V.1 Agricultural Practices
Agriculture is the primary land use constituting 83.3% of the total watershed
extent with corn and soybeans constituting the major agricultural crops in the watershed.
Corn and soybean rotation is a traditional crop rotation system in Indiana, due to the
increased yield that can result (Vyn 2006). In the watershed, corn and soybean acreage in
proportion to total cropland varies annually and appears cyclical likely in part due to
15
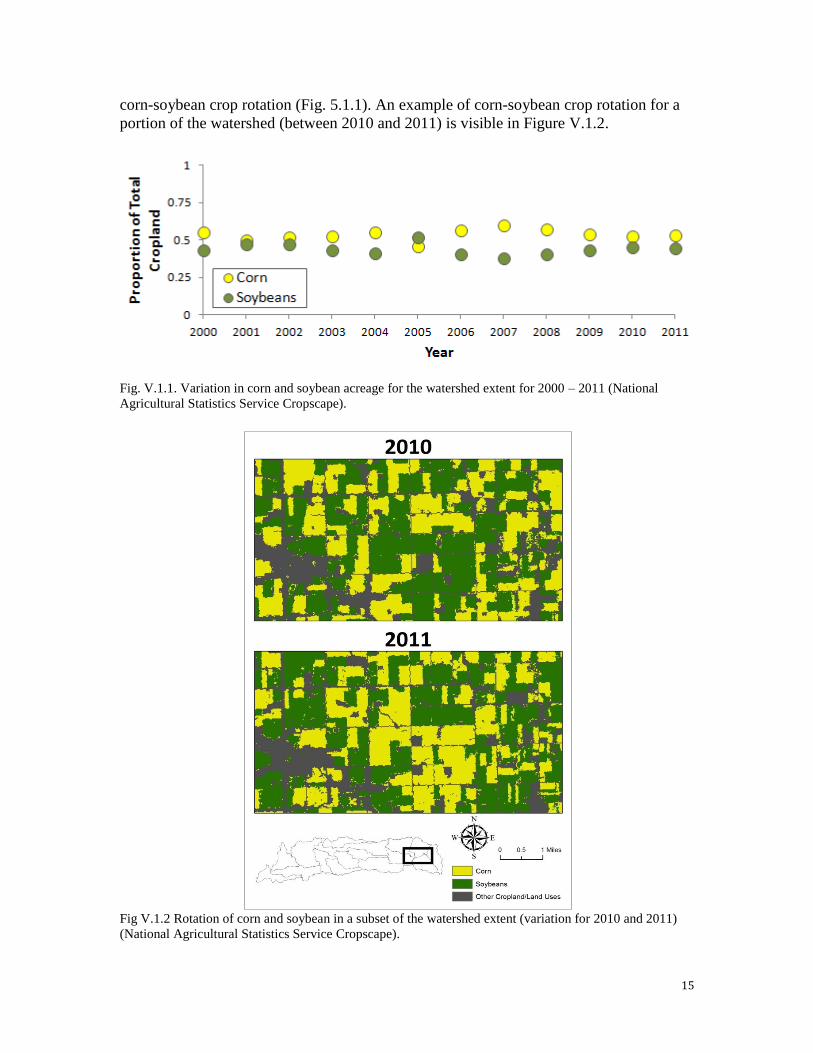
corn-soybean crop rotation (Fig. 5.1.1). An example of corn-soybean crop rotation for a
portion of the watershed (between 2010 and 2011) is visible in Figure V.1.2.
Fig. V.1.1. Variation in corn and soybean acreage for the watershed extent for 2000 – 2011 (National
Agricultural Statistics Service Cropscape).
Fig V.1.2 Rotation of corn and soybean in a subset of the watershed extent (variation for 2010 and 2011)
(National Agricultural Statistics Service Cropscape).

16
Nitrogen recommendations are less for corn following soybeans than corn
following corn due to the benefits of nitrogen fixation associated with soybeans
(Environmental Protection Agency 2010). Fertilizer application greatly increases yield of
agricultural crops; however, fertilizer nutrients can leach into groundwater and runoff
into local streams (Environmental Protection Agency 2010). Generally, for the counties
encompassed in the watershed, fertilizer tonnage has decreased during the time period
2008 – 2010 (Table V.1.1).
Table V.1.1. Tonnage of total fertilizer and total N, P205, and K20 (in all fertilizers) per county for 2008,
2009, and 2010.
County Year
Total
Fertilizer Total N
Total
P205
Total
K20
Carroll
2008 60,570 15,594 4,758 7,533
2009 25,867 5,101 2,061 3,314
2010 26,209 4,906 1,912 3,810
Cass
2008 40,647 8,940 3,023 5,544
2009 38,573 9,352 2,932 5,244
2010 27,516 4,890 2,154 5,523
Howard
2008 15,402 3,506 1,387 2,256
2009 19,375 4,072 1,788 2,931
2010 10,992 1,531 1,224 2,252
Miami
2008 28,700 6,546 2,736 4,605
2009 23,686 6,223 2,026 2,886
2010 11,778 1,452 980 1,905
Tippecanoe
2008 57,409 14,044 3,874 6,619
2009 36,646 9,281 2,941 4,569
2010 32,285 4,269 2,315 4,428
For agricultural land in the Midwest, soil erosion by water is a significant
concern. Such erosion is affected by rainfall quantity and patterns, soil erodibility, slope,
soil cover, and crop management practices (Janssen and Hill 1994). Following
conventional tillage, soil is more at risk to erosion due to the loosening of soil particles
and lack of cover. Conservation tillage practices (mulch-till, reduced-till, and no-till)
leave a percentage of cover on fields in order to allow for infiltration and prevent against
wind and water erosion. In the watershed, conservation tillage has been more avidly
adopted for soybeans than corn (Fig.V.1.3).
Of land producing corn, conventional-till practices typically represent the highest
percentage of acres in production (Fig. V.1.3). An increasing percentage of reduced-till
practices are noted across time, particularly in Carroll and Howard County. Contrarily,
no-till is frequently the preferred tillage practice for land producing soybeans, noted
particularly for Cass, Miami, and Tippecanoe County. Tillage practices appear more
consistent across years for Cass, Miami, and Tippecanoe County in comparison to Carroll
and Howard County. It has been noted by stakeholders of the Little Deer Creek

17
Headwaters watershed in Howard County that no-till practices are compatible with crop
management issues, such as soil temperature, weed pressure, and planting time, for
soybeans but not for corn (Howard County Soil and Water Conservation District 2005)
signaling feasibility constraints in the adoption of no-till conservation practices for corn.
If extension could offer information on new beneficial technologies or methodologies for
no-till corn in the future, trends in conservation tillage for corn could increase.
Fig. V.1.3. Variation in tillage practices across 2004, 2007, 2009, and 2011 for soybeans and corn (Indiana
State Department of Agriculture). No-till is defined as system of seeding, including site preparation, with
minimal disturbance to the soil (Indiana State Department of Agriculture). Mulch-till is defined as a system
of tillage with 30% - 75% residue cover remaining after planting (excludes no-till). Reduced-till is defined
as a system of tillage with 16% - 30% residue cover remaining after planting. Conventional-till is defined
as a system of tillage with less than 15% residue cover after planting.

18
The Conservation Reserve Program (CRP) allows farmers to receive rental
payments and cost share assistance for utilizing practices that minimize erosion as well as
reduce sedimentation and runoff (Farm Service Agency 2012). Enrollment of land into
CRP has varied in the counties represented in the watershed with a decrease in enrolled
land toward the end of the 1990s (particularly pronounced for Miami and Cass County)
and a slight increase following decline (Fig. V.1.4). Cass and Miami County throughout
the time period contained the most CRP enrolled land.
Fig. V.1.4. Cumulative Conservation Reserve Program (CRP) enrollment (in acres) by fiscal year for the 5
counties represented in the watershed (Farm Service Agency – USDA).
Due to the prevalence of agricultural production in the watershed, agricultural
productivity is important and impacts the livelihood of those involved. However, nutrient
loading due to fertilizers can have an impact on local surface water quality and can also
affect distant aquatic systems as far as the Gulf of Mexico through transport via the
Mississippi River (Rabalais et al. 2002). Therefore, practices reducing nutrient loading
must be implemented, while striving to maintain agricultural productivity, or cumulative
impacts of nutrient loading in local and distant aquatic systems may accrue. In addition,
there is concern that with increasing interest in the production of corn for ethanol that
farmers with either convert to 2-year corn 1-year soybean rotations or to continuous corn.
Such changes would lead to increases in the amount of fertilizer and pesticides used as
well as potentially more erosion due to more intensive tillage practices common with
corn production (Vyn 2006).
V.2 Livestock Operations
Confined feeding operations are common throughout the Deer Creek – Sugar
Creek watershed. Indiana law defines a confined feeding operation (CFO) as 300 cattle,
500 horses, 600 swine or sheep, or 30,000 fowl (chickens, turkeys or other poultry;
Sutton et al. 2007). A concentrated animal feeding operation (CAFO) is defined as a CFO

19
operation that produces or is likely to produce significant pollution discharge into
waterways. CAFOs contain at least 1,000 beef cattle, 700 mature dairy cattle, 1,000 veal
calves, 2,500 swine (over 55 lbs), 10,000 swine (less than 55 lbs), 500 horses, 10,000
sheep, 55,000 turkeys, 125,000 chickens (dry systems), 82,000 laying hens (dry systems),
30,000 ducks (dry systems), 30,000 chickens or laying hens (liquid systems), and 5,000
ducks (liquid systems); however, animal feeding operations with fewer animals can be
classified as an CAFO if there is significant discharge from the operation. CFOs are
prominent throughout the Deer Creek-Sugar Creek watershed (Fig. V.2.1), and swine
CAFOs are the most common throughout the region (Fig. V.2.2.; Sutton et al. 2007).
Fig. V.2.1. Distribution of confined feeding operations (CFOs) in the watershed extent (IDEM).
Most of these operations are concentrated in the eastern and southern portions of
the area (Fig. V.2.1). CAFOs, typically due to their high numbers of livestock animals,
produce large amounts of manure. This manure can serve as a cheap, organic form of
fertilizer in which farmers will spread onto agricultural fields. However, during rain
events storm waters can cause this manure to runoff into adjacent aquatic systems.
Nutrients, organic matter, and pathogens as well as trace amounts of antibiotics,
pesticides, and hormones originating from animal waste potentially can discharge into
surface waters (Copeland 2010). High levels of nutrient loading can lead to
eutrophication in streams affecting aquatic communities and impacts of human health can
result from high levels of nitrate in drinking water wells and E. coli, Salmonella, or
Giardia can have negative effects when contact occurs while swimming or boating. A
high concentration of CFOs occurs in the south central portion of the watershed south of
Galveston (Fig. V.2.1). Efforts under the Little Deer Creek Headwaters watershed 205j
project have focused on implementing BMPs on CFOs in order to improve manure
management and water quality (Howard County Soil and Water Conservation District
2010). If such efforts continuous, E. coli levels in waterways may decrease significantly.

20
Fig. V.2.2. Distribution of CAFOs in the state of Indiana and type and amount of livestock at each
operation. Figure taken from Sutton et al. 2007.
VI. Ecoregions and Geology
This entire watershed falls within the Eastern Corn Belt Plain. The Eastern Corn
Belt Plain contains different types of ecoregions and two of these ecoregions, the Clayey
High Lime Till Plains and the Loamy High Lime Till Plains, are present within this
watershed. These two ecoregions have many similarities in geology, soil, climate,
vegetation, land use and land cover. Another ecosystem present within this watershed is
the Eastern Temperate ecoregion (EPA 2011).
VI.1 Ecoregions
There are many different ecosystems across the United States and they are defined
at different levels of coarseness so one area can consist of multiple ecoregions. The
World Wildlife Fund defines an ecosystem as a “large unit of land or water containing a
geographically distinct assemblage of species, natural communities, and environmental
conditions.” (WWF).
The Clayey High Lime Till Plains make up 10.71% of the watershed at the
eastern end. These plains consist of an almost level glacial till plain with basins, end
moraines and streams. The elevation is typically 700-1300 feet. This area consists of
clayey, high lime, late-Wisconsinan glacial till, lacustrine deposits and scattered loess
that overlies Palezoic shales, carbonates and sandstone. The orders of soils present
include Alfisols and Mollisols. Widespread soil types in this area include Blount,
Pewamo, Glynwood and Morley soils (EPA 2011).

21
The Loamy High Lime Till Plains make up 89.29% of the watershed. These
plains consist of level to rolling glacial till plains with end moraines, glacial outwash
landforms and low gradient streams. The elevation is typically 500-1550 feet. The area
consists of loamy, high lime, late-Wisconsinan glacial till and glacial outwash and
scattered loess overlie Paleozoic carbonates and shale. Soil orders present include
Alfisols, Mollisols and Entisols. Widespread soil types in this area include Miamian,
Crosby, Fincastle, Treaty, Cyclone, Xenia, Ockley and Shoals(EPA 2011).
Figure VI.1.1. The ecoregions of Clayey High Lime Till Plains and of Loamy High Lime Till Plains for the
study area (United States Environmental Protection Agency, Ecoregions Shapefile)
The area is Mesic with Aquic and Udic moisture regimes. The natural vegetation
is mostly beech forest with scattered elm-ash swamp forest in poorly-drained areas.
Agriculture is common in these areas. The area is also classified as being part of the
Eastern Temperate Forest ecoregion which typically has a mild to moderately humid
climate with much forest cover (EPA 2011).
Types of rock that are common in this area are limestone, dolomite, blackshale
and siltstone. The rocks are from Devonian, Mississippian and Silurian times (USDA
Geology Data Layer).
VI.2 Soils
There are around 20,000 soil series present in the United States and around 90 of
these soil series present in the watershed study area. All of the soils in the watershed are
in the soil orders of Alfisols, Mollisols, Entisols, Histosols and Inceptisols (NRCS).
Soil Series
There are around 90 soil series present in the study area. The top 15 most
common soil types comprise 79.58% of the area. If the top 20 most common soil types
are included, 85.45% of the area is covered. Water and pits (both gravel and quarry)
make up 0.53% of the area.

22
Table VI.2.1. This table shows the area and percent of total area for soil series in the study area (Natural
Resources Conservation Service, Soil Data Mart).
Since there are so many soil series present in the area, details will only be given about
soil series that take up 5% or more of the area.
FINCASTLE:
The Fincastle series typically consists of deep, somewhat poorly drained soils
formed in loess or other silty material and in the underlying loamy till. The
potential for surface runoff is low to high and these soils are mostly cultivated.
Geographically associated soils include the Cyclone, Miami, Russell, Treaty,
Williamstown and Xenia soil series (USDA-NRCS).
CYCLONE:
The Cyclone series typically consists of very deep, poorly drained soils that either
formed in loess or another silty material and in the underlying drift. These soils
usually occur in depressions and on broad flats on till plains and are usually
cultivated in corn or soybeans. Geographically related soils are the Fincastle,
Ragsdale and Starks series (USDA-NRCS).
23
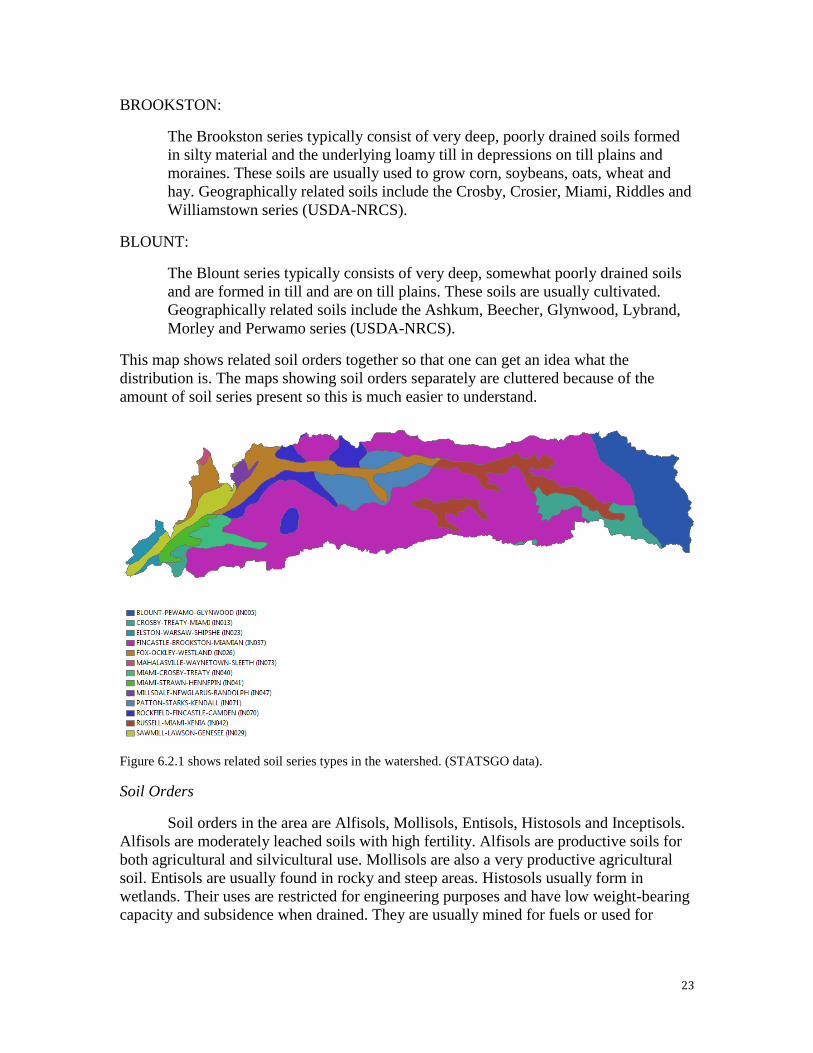
BROOKSTON:
The Brookston series typically consist of very deep, poorly drained soils formed
in silty material and the underlying loamy till in depressions on till plains and
moraines. These soils are usually used to grow corn, soybeans, oats, wheat and
hay. Geographically related soils include the Crosby, Crosier, Miami, Riddles and
Williamstown series (USDA-NRCS).
BLOUNT:
The Blount series typically consists of very deep, somewhat poorly drained soils
and are formed in till and are on till plains. These soils are usually cultivated.
Geographically related soils include the Ashkum, Beecher, Glynwood, Lybrand,
Morley and Perwamo series (USDA-NRCS).
This map shows related soil orders together so that one can get an idea what the
distribution is. The maps showing soil orders separately are cluttered because of the
amount of soil series present so this is much easier to understand.
Figure 6.2.1 shows related soil series types in the watershed. (STATSGO data).
Soil Orders
Soil orders in the area are Alfisols, Mollisols, Entisols, Histosols and Inceptisols.
Alfisols are moderately leached soils with high fertility. Alfisols are productive soils for
both agricultural and silvicultural use. Mollisols are also a very productive agricultural
soil. Entisols are usually found in rocky and steep areas. Histosols usually form in
wetlands. Their uses are restricted for engineering purposes and have low weight-bearing
capacity and subsidence when drained. They are usually mined for fuels or used for

24
horticultural products. Inceptisols are very widespread in the world and have different
uses such as recreation and forestry (UI).
Natural and Tile Drainage
Natural drainage of the soils varies. Natural soil drainage is broken up into several
classes. Excessively-drained soils have high hydraulic conductivity, low water-holding
capacity and a depth to the water table of more than 6 feet. Moderately well-drained soils
have a layer of low hydraulic conductivity and the depth to the water table is 3 to 6 feet.
Poorly-drained soils have a layer of low hydraulic conductivity, may have a saturated
zone and may have seepage. The depth to the water table is less than one foot in these
soils. Somewhat excessively-drained soils have high hydraulic conductivity, low water
capacity and a depth of more than 6 feet to the water table. Somewhat poorly-drained
soils have a layer of low hydraulic conductivity with a wet state high in the profile. The
depth to the water table is 1 to 3 feet in these soils. Very poorly-drained soils are wet to
the surface for a majority of the time and the depth to the water table is less than 1 foot.
These soils may be ponded. Well-drained soils have intermediate water holding capacity
and the depth to the water table is more than 6 feet (STATSGO).
The natural drainage of the land strongly relates to where tile drainage is needed
for agricultural purposes. Tile drainage is used for effective agricultural production.
Poorly drained areas in crop fields can cause ponding and damage the crop yield. Poorly-
drained, very poorly-drained and somewhat poorly-drained areas make up 74.46% of the
total area of agricultural land in the watershed. This indicates that tile drainage is needed
throughout much of the agricultural land in the watershed. This is important because tile
drainage can cause loss of wetlands and increased loss of nitrate through the drains. This
can have water quality impacts. Nitrate flow from subsurface drains has been found to be
a major source of nitrate in rivers and streams in the Midwest. The nitrate in these rivers
and streams can cause hypoxia in the Gulf of Mexico and this is a problem that needs to
be monitored and addressed (EPA 2009).
Well-drained soils take up 16.14% of the agricultural land, moderately well-drained is
8.07%, poorly-drained soils take up 29.10% and somewhat poorly-drained is 40.67%.
Table VI.2.2. This table shows the area and percent of total area for different ratings of natural drainage in
the study area. The percentages of ratings on only agricultural land were almost identical to the percentages
of ratings over all land uses (Natural Resources Conservation Service).

25
Figure VI.2.2 This figure shows the natural drainage ratings in the study area for all land types-top image
and the natural drainage ratings for only agricultural land-bottom image (Soil Data Mart).
Hydric Ratings
Hydric ratings of the soil consist of the ratings of All Hydric, Not Hydric or
Unknown. A hydric soil is a soil that formed under saturated conditions, flooding or
ponding for a time period during the growing season long enough to develop anaerobic
conditions in the upper part (NRCS-Hydric). Not hydric soils make up 66.30% of the
study area and all hydric soils make up 33.45%.

26
Table VI.2.3. This table shows the area and percent of total area for different hydric ratings in the study
area (Natural Resources Conservation Service).
Figure VI.2.3. This figure shows the hydric ratings in the study area (Soil Data Mart).
Farmland Suitability
Whether or not an area is considered prime farmland is based on several factors. The
factors used to determine this are: soil properties, growing season, and moisture supply
needed to produce sustained high yields of crops economically if managed with
acceptable farm methods. Other factors considered include frequency of flooding and
erodibilty. Most of the study area is considered prime farmland if drained (NRCS-
Ecological).
Table VI.2.4. This table shows the area and percent of total area for different farmland suitability in the
study area for all landuses (Natural Resources Conservation Service).

27
Figure VI.2.4. This figure shows the farmland suitability in the study area (Soil Data Mart).
Septic Tank Absorption Fields
Septic tank absorption fields are systems of tile or perforated pipe that are below
the surface. These pipes distribute effluent from septic tanks into the soil. Only soils
between 24 and 60 inches are considered in the septic ratings because the centerline depth
of the tile is assumed to be 24 inches or deeper. Soil properties such as permeability,
depth to the water table, depth to bedrock, depth to cemented pan and susceptibility to
flooding are considered to come up with this rating. Erosion and slope are other issues
that are considered in this rating. The soils are placed into three rating classes: not rated,
somewhat limited and very limited. The rating classes are determined by the indices that
are calculated using the various factors listed above.
Rating index=0 Not Limited (Good)
Rating index > 0 Somewhat limited (Moderate)
Rating index < 0 Very limited (Not suitable)
Approximately one-third of Indiana homes use a septic system to treat household
waste (Lee et al. 2004). These septic systems typically consist of a septic tank and
absorption field to remove waste contaminants. Issues with septic systems can include
sewage backflow, sewage surfacing on property, decline in groundwater quality, and
environmental degradation (Lee et al. 2005). Sewage from septic systems contains high
nutrient levels as well as microbial populations which can discharge into surface waters
Septic system issues can arise with soil wetness due to seasonally high water tables,
undersized systems, older septic systems, and soil absorption fields in limited spaces. The
percent of the total watershed area that has a ‘very limited’ septic rating is 97.14%. This
indicated that septic tank systems should be monitored closely and that there are more
likely to be issues than if the rating was ‘not limited’.

28
Table VI.2.5. This table shows the area and percent of total area for different septic ratings in the study area
(Natural Resources Conservation Service).
Figure VI.2.5. This figure shows the septic ratings in the study area (Soil Data Mart).
Erosion
Erosion is thought to be an issue in this area. Erosion is influenced by several
factors including climatic factors (rainfall amount, rainfall intensity, rainfall frequency,
temperature, wind), vegetation, slope (higher slopes are more inclined to erode), and
physical characteristics of soil (Van Buren County Community Center 2003). Agriculture
practices, such as the tillage practice, can also contribute to accelerated erosion.
The soil erodibilty factor is called the K-factor. The K-factor quantifies the
susceptibility of soil particles to be detached and moved by water. The K factor is one
factor in the Universal Soil Loss Equation. The kffact column in the soil data mart data
determines the K-factor, but does not factor in the effect of rock fragments in the soil
erodibility. The kwfact column in the soil data mart data determines the K-factor and
factors in the effect of rock fragments in the soil erodibility. The kwfact and kffact
columns have almost identical values in this area.

29
Table VI.2.6: This table shows how erodible ranges of K-Factors are and what percent of the study area is
made up of each erodibility rating.
Figure VI.2.6. This figure shows the K-factor ratings from the STATSGO data.
Judging solely by the soil erodibility in the watershed, soil erosion is low to
moderate. However, this only looks at the soil erodibility and other factors also lead to
erosion, such as slope. Steep slopes can lead to increased erosion especially if the other
factors dealing with soil erodibility are high on the steep slopes.
Figure VI.2.7. This figure shows the slope percentage within the watershed (IU Spatial Data Portal).

30
Sediment loss is an issue of the Deer Creek- Sugar Creek Watershed health.
Erosion decreases water quality and reduces soil productivity. Farmers and stakeholders
expressed erosion concern, but the K-factor does not indicate that there is a severe
erosion issue within the watershed. Many farmers have shifted from cultivation to no till
practices to reduce the amount of soil lost to erosion. Also, the typical practice
throughout the watershed (and Indiana) is the annual crop rotation of soybean and corn.
This is a management practice that not only deals with erosion, but the access of nutrients
in the soil. Current trends of soil erosion indicate that this is an issue that needs to be
addressed as it could continue to worsen and cause water quality problems throughout the
watershed.
VI.3 Natural Communities
Natural community types are recurring groups of organisms found in specific
physical environments. Natural communities are distinguished by three characteristics: 1)
the plant species composition, 2) the vegetation structure, and 3) the combination of
physical conditions (Division of Forest and Lands).
The endangered natural communities present in the counties in the watershed are listed
below(IDNR):
Cass County: Floodplain Mesic Forest
Carroll County: Wetland-Fen
Wetland-Circumneutral Seep
Howard County: Flatwoods Central Till Plain Forest
Miami County: Upland Dry Mesic Forest
Upland Mesic Forest
Tippecanoe County: Upland Dry Mesic Forest
Upland Mesic Forest
Dry Mesic Praire
Wetland-Fen
Wetland-Marsh
Wetland-Circumneutral Seep
VII. Climatology
For the watershed extent based on 1981 – 2010 climate normals (National
Oceanic and Atmospheric Administration 2012), average annual precipitation is 40.4 in
and average temperature is 50.7 F° (with average maximum 60.9 F°; average minimum
40.5 F°). For autumn (September, October, November), average precipitation is 9.34 in
with an average temperature of 53.2 F° (with average maximum 64.1 F°; average
minimum 42.2 F°). For spring (March, April, May), average precipitation is 10.5 in with

31
an average temperature of 50.3 F° (with average maximum 61.1 F°; average minimum
39.4 F°). For summer (June, July, August) average precipitation is 12.9 in with an
average temperature of 71.6 F° (with average maximum 82.6 F°; average minimum 60.6
F°). For winter (December, January, February), average precipitation is 7.1 in with an
average temperature of 27.4 F° (with average maximum 35.3 F°; average minimum 19.4
F°). El Niño-Southern Oscillation (ENSO) climate events, due to changes in ocean
surface temperature, wind flow, and air pressure patterns, have an effect on climate in the
state of Indiana resulting in deviations from normal temperatures and precipitation in a
relatively periodic manner (Mays et al. 2009).
Climate models have predicted increases in precipitation throughout the state of
Indiana in the next century as well as an increase in temperature (EPA 1998). Climate
change may impact agricultural productivity and practices as harvest time may shift,
more flooding could result due to increased precipitation, and more extreme heat events
could lead to heat stress for crops. More extreme weather events may also occur as a
result of climate change. Although it is unclear to what extent, more severe tornados,
greater flooding, and other extreme weather events may result in local impacts including
damage to local properties and loss in agricultural yields.
VIII. Water and Fishery Quality
VIII.1 Hydrology
The Deer Creek- Sugar Creek Watershed consists of drainages of three tributaries
to the Wabash River- Deer Creek, Sugar Creek, and Buck Creek. The watershed area
begins with Deer Creek starting in north of Kokomo, Indiana and flows west through
Miami, Howard and Carroll Counties before emptying into the Wabash River in Delphi.
Sugar Creek rises and flows west of Flora through Carroll and Tippecanoe Counties
before entering the Wabash River near Americus, while Buck Creek follows the same
path south of Sugar Creek. A small portion of the Wabash River is also included in the
Deer Creek- Sugar Creek Watershed plan.
VIII.2 Flooding
An estimated 83% of the Deer Creek- Sugar Creek Watershed is primarily
agriculture. Farmers have expressed concern with flooding in agricultural fields as a
result of poor quality tile drainage systems. Most of these inadequate tile drain systems
takes place throughout the water shed, concentrating throughout the northern section, the
west end, and eastern south.

32
Table VIII.3.1. Flood frequency and natural drainage type for agricultural land.
VIII.3 Contamination
E. Coli:
The state standard for E. coli in Indiana indicates that for full body contact from
recreational use E. coli levels should not exceed a geometric mean of 125 cfu/100 mL
from 5 equally spaced samples obtained over a 30 day period nor 235cfu/100 mL in any
one sample (IDEM). Approximately 80% percent of streams in the watershed exhibit E.
coli levels above recommended levels (303(d) list of impaired streams; IDEM 2006).
Throughout the watershed E. coli levels are consistently high with averages of available
data across a range of time periods frequently above 235 cfu/100 mL (Fig. 8.4.1a).
Maximum E. coli levels observed at each of the sampling sites are frequently much
higher than the average (Fig. 8.4.1b) indicating the variation in E. coli levels likely
associated with rain events or other methods of discharge into water bodies. DNA
matching analysis from the Little Deer Creek Headwaters watershed 205j project (located
within this watershed; Howard County Soil and Water Conservation District 2005)
revealed samples of E. coli to be primarily of animal origin but also a few of human
origin. Sources of E. coli contamination can include runoff from animal feeding
operations, livestock access to streams, issues with septic systems, wildlife or pet waste
(Pennsylvania SeaGrant).

33
a) Average E. coli readings at various sampling sites
b) Maximum E. coli readings at various sampling sites
Fig. VIII.4.1. Indiana STORET, Hoosier Riverwatch, and data from the Little Deer Creek Headwaters
watershed 205j project for E. coli. a) Average and b) maximum E. coli readings are displayed. Average E.
coli readings are displayed only for sites with more than 1 sampling event.
Fish Consumption Advisory:
Deer-Sugar Creek Watershed is made up of 71 total stream segments sampled for
contaminants. The three major issues of contaminants in the water include: PCB’s,
Mercury, and E. coli. The E. coli levels, as mentioned earlier, exceed state limits in
approximately 80% of the watershed’s aquatic systems. Mercury and PCB’s are also
problems that need to be addressed. For each of these pollutants, 32 of the 71 stream
segments currently hold consumption advisories for fish (Table 8.4.1). Both PCBs and
mercury impact 45% percent of stream segments.

34
Table VIII.4.1. Stream segments and associated impairments for the 71 stream segments in the watershed
(303(d) list of impaired streams; IDEM 2006).
Impairment Number of
Stream Segments
Percent of Stream
Segments
Fish Consumption Advisory for
Mercury 32 45.1%
Fish Consumption Advisory for
PCBs 32 45.1%
E. coli Exceeds State Limits 57 80.3%
Impaired Biotic Community (fish
and aquatic invertebrate indicators) 8 11.3%
Nutrients (inorganic nutrients
driving physio/chemical stream
imbalance)
13 18.3%
VIII.4 Stream Flow
Stakeholders and members of neighboring communities expressed concern about
low flow in many of the creeks in the watershed as well as instances of high flooding.
Trends in annual stream flow have remained relatively constant with a slight increase
over the past years (1945 – 2010; Fig 8.5.1). However, annual discharge also exhibits
high variation (Fig. 8.5.1), and there is also cyclical seasonal variation in flow (Fig 8.5.2).
Periods of low flow, or even variable flow, could be a contributing factor to low species
diversity of fish (Bain et al. 1988) . Low water flow can result in nutrient and
sedimentation accumulation, and eutrophic conditions can cause lower oxygen content in
the water, hereby potentially creating unstable aquatic habitat. This not only inhibits the
ability for fish to survive, but can also have an adverse impact on the aquatic vegetation
community. Stream impairments take place in 11% of the stream segments with respect
to the biotic community determined by fish and aquatic invertebrate indicators (Table
8.5.1). Nutrient impairments in 18% of the stream segments can cause an imbalance in
the physiological and chemical properties of the water. Runoff from CFOs and
agricultural fields can contribute to this sedimentation and organic matter accumulation.

35
Fig. VIII.5.1. Average annual discharge levels at USGS gauge site #03329700 on Deer Creek near Delphi
(1945 – 2010).
Fig. VIII.5.2. Monthly average discharge levels at USGS gauge site #03329700 on Deer Creek near Delphi
(2000 – 2009). Each year is comprised of 12 bars (each representing a month); the time series extends from
January 2000 through December 2009.
VIII.5. Previous Water Sampling
Various historic water quality data is available in the watershed extent across a
range of time periods and sites (Fig. 8.6.1). Such data is available through Hoosier
Riverwatch, Indiana STORET, IDEM, and through a surface water quality monitoring
program for the Little Headwaters watershed 205j project. Data is available for different
water quality parameters dependent on site, collecting organization, and time period.
Hoosier Riverwatch is a water sampling program that involves trained citizen
volunteers to collect data on chemical composition, invertebrate abundance, flow rates,
and habitat quality. Chemical data can include water temperature, turbidity, total

36
phosphorus, pH, nitrite, nitrate, biological oxygen demand, dissolved oxygen, E. coli, and
other parameters at various sites during 2001 – 2003, 2005, and 2008 – 2009.
Indiana STORET data is available from 1990 – 2005 for a variety of water quality
parameters including water temperature, turbidity, phosphorus, pH, Kjeldahl nitrogen,
inorganic nitrogen, hardness, dissolved oxygen, E. coli, and other parameters in addition
to concentrations of metals, PCBs, herbicides, and other contaminants.
IDEM data is available from 2008 – 2009 for a variety of water quality
parameters including water temperature, total dissolved solids, turbidity, phosphorus, pH,
Kjeldahl nitrogen, inorganic nitrogen, hardness, dissolved oxygen, and other parameters
as well as metal concentrations and other contaminants.
A surface water quality monitoring program was conducted in conjunction with
the Little Headwaters watershed 205j project. In 2003 water temperature, pH, dissolved
oxygen, ammonia, total Kjeldahl nitrogen, nitrate + nitrite, total phosphorus, E. coli,
conductivity, and atrazine were sampled for in both spring and fall.
Fig. VIII.6.1. Various sampling efforts (Little Deer Creek Headwaters, Hoosier Riverwatch, IDEM, Indiana
STORET) in the watershed extent.
IX. Endangered, Threatened, or Rare Species
Within the Deer Creek- Sugar Creek Watershed, there are a variety of endangered
(see Appendix II), threatened, or rare species according to the Indiana Department of
Natural Resources (IDNR). Some of the causes of wildlife population declines are due to:
invasive species, habitat loss, fragmentation, decreased water quality, and contamination.
It is important to look at the causes and types of species loss, because many of them are
indicators of future declinations. In order to help the public have a greater connection to
the goals and objectives of this report, the highlighted species are familiar to the general
public in the watershed.

37
IX.1 Mammals
There are five mammal species that are endangered, threatened, or rare in the
counties included in the Deer Creek- Sugar Creek Watershed: bobcat (Lynx rufus),
Indiana bat (Myotis sodalis), American bagger (Taxidea taxus), northern river otter
(Lutra canadensis), and least weasel (Mustela nivalis). Of these five species Bobcats are
most impaired. They once ranged throughout the state of Indiana, but not are found in
mostly in the south-central part of the state. Bobcats need large ranges of well-forested
areas of robust topography. Because of their habitat needs, conversion of forested land to
agriculture and development is the main cause of declination.
IX.2 Birds
There are four bird species that are endangered or threatened in the Deer Creek-
Sugar Creek Watershed: Bald Eagle (Haliaeetus leucocephalus), Barn Owl (Tyto alba),
Northern Harrier (Circus cyaneus), and Peregrine Falcon (Falco pergrinus). All of these
species are state endangered and imperiled in state, with the Bald Eagle also being
federally threatened. Populations of these birds have been declining due to suburban
sprawl, industrial development, fragmented land and conversion of habitat to agricultural
use. Many of these species have responded well to management implementations. With
reintroduction and habitat restoration, it is likely these species will be able to repopulate
Indiana.
IX.3 Reptiles
There are six reptile species that are endangered, threatened, or threatened in the
Deer Creek- Sugar Creek Watershed: Butler’s garter snake (Thamnophis butleri),
Blanding’s turtle (Emydoidea blandingii), western ribbon snake (Thamnophis proximus
proximus), spotted turtle (Clemmys guttata), Kirtland’s snake (Clonophis kirtlandii), and
eastern massasauga (Sistrurus catenatus catenatus). Of these species, eastern massasuga
is stated as endangered and a federal candidate. They are also rare globally and imperiled
in state. They require graminoid dominant plant communities, such as fens, sedge
meadows, peatlands, wet prairies, open woodlands, and scrublands. They are found in the
northeastern United States. The most common reasons for declination of the populations
are eradication and habitat loss. Kirtland’s snake is state endangered, as well as imperiled
globally and in state. They are found in damp meadows, vacant lots, and open swampy
woodlands. Habitat loss is the main reason for declining populations.
X. Fisheries
Combined with the information below, IDEM has a data file from1998 listing at
least fifty-one additional species sampled in the watershed, see Appendix III for list of
common names and scientific names. All non-endangered and non-threatened species
described here are taken from scientific papers describing fish communities in stream
habitats in Indiana, as well as from the Fishes of Tippecanoe Country. This is due to the
basic assumption that Indiana landscapes are typically uniform with the use of
agriculture, and therefore stream habitats should be mildly similar. As mentioned before
in stream flow, low stream flow and varying flow cycles can have implication on fish

38
species by altering or creating unstable habitat. It is important to not that many parts of
this plan will help to improve water quality issues in multiple ways. In this way, species
numbers and diversity will most likely also increase. A list of all species, common and
scientific names, is provided in the index. Alterations can be made to the species listed
here. The Peterson Field Guide to Freshwater Fishes (1991) provides the habitat selected
by each species.
X.1 Sport Species
Between the three main tributaries leading into the Wabash River, Buck Creek,
Sugar Creek, and Deer Creek are sources of flathead catfish (Pylodictis olivaris) (Buck
Creek) and bass to the Cannelton Pool of the Ohio River. The creek also harbors an array
of bass species, including largemouth bass (Micropterus salmoides), smallmouth bass
(Micropterus dolomieu), and occasionally spotted bass (Micropterus punctulatus) (The
Ohio River 2011). A variety of sunfish can also be found throughout the watershed,
mainly bluegill (Lepomis macrochirus) (Fishes of Tippecanoe County).
Flathead catfish, like many species, is native to the Mississippi River Basin,
although they are considered a nuisance species in other aquatic systems. They typically
inhabit small to large rivers, lakes or impoundments. Catfish species can usually tolerate
a broader range of water turbidity and dissolved oxygen.
Largemouth bass are a generalist species. The can be found in nearly any type of
aquatic system, as long as water clarity and submerged vegetation is present. Most
common habitats include lakes, ponds, pools of creeks, and rivers.
Smallmouth bass can be found in lakes nearly rocky bottoms. They have the
ability to tolerate more water current than largemouth, and are more commonly found in
rivers and streams with little vegetation and more cobble, or rock.
Bluegill, like largemouth bass, is also a generalist species. The body morphology
of the bluegill allows it the skill of maneuverability. It prefers lakes and ponds that
harbor dense vegetation, but they can be found in stream pools quite frequently [Page and
Brooks 1991].
X.2 Non-sport Species
The non-game groups most likely to be in northern Indiana include varieties of
chubs, minnows, shiners, daces, darters, and sculpin. Different species of crayfish are
also found anywhere where water is present.
X.3 Endangered Species
Two species of mussel, rabbitsfoot (Quadrula cylindrica cylindrica) and rayed
bean (Villosa fabalis) are listed as endangered or threatened in Indiana. Rabbitsfoot is
threatened species of riverine mussel, and requires clear, rocky bottoms with continuous
current in lotic systems (KDWPT 2012). The rayed bean mussel is endangered in
headwater streams and creeks (preferred habitat) throughout much of the eastern United

39
States. See Figure 10.3.1 for mussel species locations and Appendix IV for a list of
species found in the watershed.
Figure X.3.1. Mussel species richness in the watershed extent (Indiana DNR – Nongame Aquatic Mussel
Collection Summary).
Mussels are stationary for the majority of their life, which can make them
susceptible to environmental or physical changes in the bodies of water they inhabit. In
the Deer-Sugar Creek Watershed, many streams contain high sedimentation from erosion
and nutrient loading from agricultural farm runoff. This sedimentation along will low
stream flow can suffocate mussels where they dwell (USFWS 2010).
X.4 Invasive Species
While few places in the counties bordering the watershed have been identified as
containing zebra mussels (Dreissena polymorpha), the threat on establishment in the
watershed should not be taken lightly. Fibers, called byssal threads, hang from the foot
of the hinge and can attach to many different types of substrate, allowing them to
establish almost anywhere. Zebra mussels can reproduce as early as age 2, and females
can release up to one million eggs during one spawning season. The mussels are
extremely effective feeders, being able to filter up to a liter of water per day. They can
tolerate a wide range of temperatures of 0-35°C. All of these characteristics combined
make zebra mussels a large threat to native mussels, and planktivorous fish species
(IDNR 2005).
XI. Opportunities and Constraints in the Area
In order to determine the needs and vision a desired future condition for the Deer
Creek-Sugar Creek Watershed, current conditions of human dimensions, agriculture,
water quality, soil types, vegetation cover and wildlife were extensively researched and
assessed. Through analysis and discussion, many opportunities and constraints became
apparent.
XI.1 Constraints
One major constraint is that the watershed faces a number of problems in many
different aspects. The current trends of the Deer Creek-Sugar Creek Watershed show
various problematic issues such as nutrient loading and sedimentation problems, flooding

40
problems, water quality issues, habitat fragmentation, loss of biodiversity, and lack of
recreational resources. To solve these problems there is a need for interaction and
communication between various stakeholder groups, technical assistance from agencies
and institutions, and a well-thought comprehensive watershed management plan. The
process, which could prove to be effective, will be time-consuming and very costly while
resources are limited.
Another restraining factor would be that the watershed is spread amongst five
different counties and includes a wide range of stakeholders all with different needs and
concerns. This increases the difficulty of reaching consensus on decisions and the
complexity of finding appropriate government funding and assistance programs.
Funding and financial issues are always a constraint to watershed management
plans and within the Deer Creek-Sugar Creek it is also a problem. Landowners may be
reluctant to pay for restoration or conservation projects and incentives are needed to
implement conservation practices. Government funding to provide improvements on
private land may also be limited.
There is also difficulty to develop recreational possibilities due to the fact that
there have been low water levels in the creeks and there are many other recreation sites in
adjacent watersheds. A public meeting was conducted by Purdue University students in
October, 2011 to discuss the stakeholders’ concerns opinions of the watershed, and many
respondents brought up the fact that they appreciate the aesthetic view of the Deer Creek-
Sugar Creek Watershed, but because there aren’t many recreational sites to access, they
choose to kayak, canoe and hike in close-by areas that are not within the watershed.
XI.2 Opportunities
The constraints discussed above seem to be large obstacles that are hard to
overcome, but on the other hand, there are many opportunities that can help make this
watershed management plan successful.
There are many organizations and institutions that can provide information,
resources and various other types of support to stakeholders. The Wabash River
Enhancement Corporation (WREC), Purdue University Extension, Northern Indiana
Citizens Helping Ecosystems Survive (NICHES) Land Trust and many Non Governmental
Organizations (NGOs) and not-for-profit organizations can provide outreach, education,
technical assistance or even funding for the implementation of good management plans.
Workshops could be held to educate landowners on the benefits of using agricultural
conservation practices, and to promote environmental stewardship.
Many conservation and restoration programs are available and some of them
provide funding for the implementation of these programs. Examples of some programs
that are relevant to this watershed are: Environmental Quality Incentives Program
(EQIP), Conservation Reserve Program (CRP), Wetlands Reserve Program (WRP),
Wildlife Habitat Incentive Program (WHIP), and Conservation Reserve Enhancement

41
Program (CREP). There are also Farm Service Agency (FSA) Programs and U.S.
Environmental Protection Agency (USEPA) Section 319 Grants. More information on
various programs can be found on EPA, NRCS (Natural Resource Conservation Service),
FSA and DNR (Department of Natural Resources) websites.
There are opportunities for improving natural conditions too. The forest and
wetland patches within the watershed may be connected with corridors through
conservation and restoration programs. This could greatly increase wildlife habitat and
promote recreational activities. Water quality may be improved through Best
Management Practices (BMPs) and sustainable farming methods.
We should know the constraints to the area and take full advantage of the
opportunities when formulating goals and deciding on implementation plans. It is through
these ways that we can ensure a successful watershed management plan.
42
Section 3: Goals, Objectives and Alternatives
After researching current conditions, analyzing current trends and identifying
opportunities and constraints within the watershed, we held discussion to develop
methods that could make potential improvements for a desired future condition- a healthy
watershed with clean water, balanced ecosystem, more recreational opportunities, and
better public appreciation. In a broader context, the improvement of the watershed’s
natural environment would also benefit the larger surrounding area. This is due to the fact
that many waterways are interconnected, and the pollutants that drain into this watershed
may eventually flow into major rivers such as the Ohio River, the Mississippi River and
ultimately event the Gulf of Mexico could be impacted.
Four main goals were determined for our watershed management plan, focusing
on a range of subjects that we felt were most relevant to the current problems. The
improvement of water quality is essential for the well being of the local communities and
wildlife populations; Managing wildlife habitat and promoting the biodiversity of the
area would greatly increase the health of the ecosystem and the aesthetic beauty of the
area; Increasing public awareness and involvement can stress the importance of
conservation within the watershed and help the public learn to understand about various
components of their surrounding ecosystem; Increasing recreational opportunities not
only brings in certain business opportunities and increases revenue for local residents, but
also provides a chance for people to enjoy the outdoors and learn to appreciate nature.
Flooding was also an issue that we carefully considered. During the public
meeting held in October 2011, many stakeholders expressed their concerns on flooding
within the watershed, so we wanted to find ways to resolve the issues. We proposed to set
“Control Flooding” as an additional goal and researched methods to mitigate these
flooding problems such as using drainage tiles, filter strips, and some erosion control
methods. It seemed that many of these methods were already incorporated in the
alternatives of our other goals. So we did not list “Control Flooding” as a separate goal,
because by simply implementing the other alternatives, we would also be able to mitigate
flooding problems.
For each of the four goals there are several objectives which divide the goals into
manageable components where the time and amount of achievement is decided. For each
objective, several alternatives are developed that provide different ways to meet the
objectives. These are then narrowed down to one strategy that can receive widespread
support. In order to determine which alternative is most suitable, we used various criteria
that were weighted according to their importance to our plan. The criteria are as shown
below:
- Time (how long the alternative would take to complete) - weighted x 1
- Cost (how much the alternative would cost/likelihood of alternative to have funding) -
weighted x 2

43
- Feasibility (public feasibility and acceptance/reality and practicality of the proposed
alternative) - weighted x 3
- Effectiveness (how effective would the proposed alternative be in accomplishing the
objective/goal) - weighted x 3
- Ease of maintenance (how easily could the proposed alternative be maintained over
time/would extra labor or cost be needed to keep the proposed alternative functional and
useful) - weighted x 2
We assigned time the weight of 1 because it would be acceptable as long as the
project meets the required timeline and is completed. A shorter time span in which the
project could be completed would be preferred, yet this would not be the principle factor
in determining suitability of an alternative.
We assigned cost the weight of 2 because cost can limit the implementation of the
alternative; however there are external funding opportunities that could be utilized.
We assigned feasibility and effectiveness the weight of 3 because we considered
these two factors the most important in determining the suitability of an alternative. For
feasibility, if a proposed alternative is not accepted by the public or a practical alternative
there would be difficulty in implementing such an alternative. For effectiveness, an
alternative must be effective to accomplish the goal otherwise it would not be considered
a suitable or efficient solution.
We assigned ease of maintenance the weight of 2 because the long term state of
the alternative must be considered. The effects of an alternative and its continued ability
to achieve the desired goal must be a considered factor.
The next step was to give each alternative a rating between 1 and 5 for each
criterion. For time and cost, 1 meant the most and 5 meant the least; for feasibility,
effectiveness and maintenance, 1 meant least and 5 meant most. Our overall idea was to
choose the alternative that received the highest score.

44
Goal 1: Improve Water Quality
Objective 1: Decrease erosion and sedimentation rates by 5% by 2017; 20%
by 2027
Alternative 1: Do nothing.
Alternative 2: Encourage land owners to plant vegetation on high sloped
lands for soil stabilization.
Alternative 3: Use cost-share program to provide incentives for farmers
to install filter-strips on their land.
Alternative 4: Use workshops to provide information to farmers about
new technology and offer support for conservation tillage.
Alternative 5: Use cost-share program to provide incentives for land
owners to plant vegetation on high slope lands as well as farmers to
install filter-strips.
Alternative 6: Encourage farmers to use various Best Management
Practices (BMPs) that include grassed waterway plantations, using cover
crops, conservation tillage, and introduce them to various funding
programs through workshops or information sessions.
Time
(x 1)
Cost
(x 2)
Feasibility
(x 3)
Effectiveness
(x 3)
Ease of
Maintenance
(x 2)
Total
Score
Alternative 1 5 (1) 5 (2) 1 (3) 1 (3) 5 (2) 31
Alternative 2 3 (1) 4 (2) 2 (3) 2 (3) 4 (2) 31
Alternative 3 2 (1) 2 (2) 4 (3) 4 (3) 2 (2) 34
Alternative 4 2 (1) 4 (2) 3 (3) 2 (3) 3 (2) 31
Alternative 5 1 (1) 2 (2) 4 (3) 4 (3) 2 (2) 33
Alternative 6 1 (1) 2 (2) 4 (3) 5 (3) 2 (2) 36
Alternative 6 was chosen as the preferred option due to the effectiveness of the
alternative for addressing erosion using grassed waterways as well as encouraging
conservation tillage. As discussed in the public meeting by stakeholders in the watershed,
a restraint to the implementation of Best Management Practices for erosion is primarily
cost. Stakeholders that attended the public meeting expressed willingness to provide the
labor for installing such practices if costs could be deferred. Therefore, introducing them
to the various funding programs through workshops may best meet their needs.
Objective 2: Reduce E. coli level to below 500 cfu/100mL by 2020; meet State
Water Quality Standards for E. coli by 2027.
Alternative 1: Do nothing.
Alternative 2: Educate the public about proper pet waste disposal.

45
Alternative 3: Work with landowners to identify septic issues, eliminate
failing septic systems, and prevent septic overflow through workshops
and outreach.
Alternative 4: Provide information through extension to confined feeding
operations regarding BMPs for reduction of E. coli contamination of
surface waters.
Alternative 5: Improve manure management for confined feeding
operations to reduce E. coli contamination of water resources
Alternative 6: Work with landowners to identify septic issues, eliminate
failing septic systems, and prevent septic overflow through workshops
and outreach as well as improve manure management for confined
feeding operations to reduce E. coli contamination of water resources.
Time
(x 1)
Cost
(x 2)
Feasibility
(x 3)
Effectiveness
(x 3)
Ease of
Maintenance
(x 2)
Total
Score
Alternative 1 5 (1) 5 (2) 1 (3) 1 (3) 5 (2) 31
Alternative 2 3 (1) 4 (2) 3 (3) 2 (3) 3 (2) 32
Alternative 3 2 (1) 2 (2) 4 (3) 3 (3) 3 (2) 33
Alternative 4 3 (1) 4 (2) 3 (3) 2 (3) 3 (2) 32
Alternative 5 2 (1) 2 (2) 4 (3) 3 (3) 2 (2) 31
Alternative 6 1 (1) 2 (2) 4 (3) 5 (3) 1 (2) 34
Alternative 6 is the preferred alternative since addressing both manure storage and
management for confined feeding operations and septic system quality will lead to a
more effective solution due to the high prevalence of confined feeding operations and
septic systems in the watershed. The combined approach in alternative 6 will address two
main potential sources of high E. coli in waters allowing for multiple points of origin to
be considered. Concern was expressed by stakeholders regarding failing septic systems
in the watershed, thus this would be an important potential source to address in
attempting to lower E. coli levels. Providing support for livestock producers in installing
BMPs through government programs or cost-share will likely increase the willingness to
become involved and work towards reducing E. coli levels as funding for such projects is
often a deterrent.
Objective 3: Reduce nutrient loading by 5% by 2017; 20% by 2027.
Alternative 1: Do nothing
Alternative 2: Use controlled drainage methods to reduce nutrient
transport
Alternative 3: Use vegetative filter strips to reduce runoff from fields.
Alternative 4: Emphasize proper soil conservation tillage practices to
reduce soil and nutrient loss.

46
Alternative 5: Encourage landowners to use Best Management Practices
(BMPs) that includes correct fertilizer application methods, installing
filter strips, using conservation tillage and controlled drainage.
Time
(x 1)
Cost
(x 2)
Feasibility
(x 3)
Effectiveness
(x 3)
Ease of
Maintenance
(x 2)
Total
Score
Alternative 1 5(1) 5(2) 1(3) 1(3) 5(2) 31
Alternative 2 3(1) 2(2) 2(3) 2(3) 2(2) 23
Alternative 3 2(1) 2(2) 2(3) 2(3) 2(2) 22
Alternative 4 2(1) 2(2) 3(3) 3(3) 3(2) 30
Alternative 5 1(1) 1(2) 5(3) 5(3) 2(2) 37
Alternative 5 was chosen even thought it was the most costly and time consuming of the 5
alternatives. This was because we felt that using a combination of BMPs would be more
inclusive and therefore greatly raise the feasibility and effectiveness. We believe to
promote BMPs as a whole would also be easier for landowners to accept and they may
choose for themselves the practices that are most suitable for their fields.
Objective 4: Improve water quality monitoring system by 2017.
Alternative 1: Do nothing.
Alternative 2: Encourage volunteer monitoring with chances to be hired on
for full or part time paid positions with gradual additions of sites and
frequency as more people monitor.
Alternative 3: Employ more employees to be hired and increase frequency
and sites of water monitoring.
Alternative 4: Encourage coordination between those who monitor the
water quality and encourage volunteer participation.
Time
(x 1)
Cost
(x 2)
Feasibility
(x 3)
Effectiveness
(x 3)
Ease of
Maintenance
(x 2)
Total
Score
Alternative 1 5(1) 5(2) 1(3) 1(3) 5(2) 31
Alternative 2 1(1) 3(2) 4(3) 4(3) 3(2) 37
Alternative 3 2(1) 1(2) 2(3) 5(3) 3(2) 31
Alternative 4 3(1) 4(2) 3(3) 3(3) 3(2) 26
Alternative 2 was chosen because it was the most effective method in feasibility and was
also highly effective. Hiring several employees directly at the beginning and starting
sampling at other sites immediately would cost too much. Relying solely on volunteers
and coordination may not be effective enough. This alternative is in-between these two
and seems to be the best option.
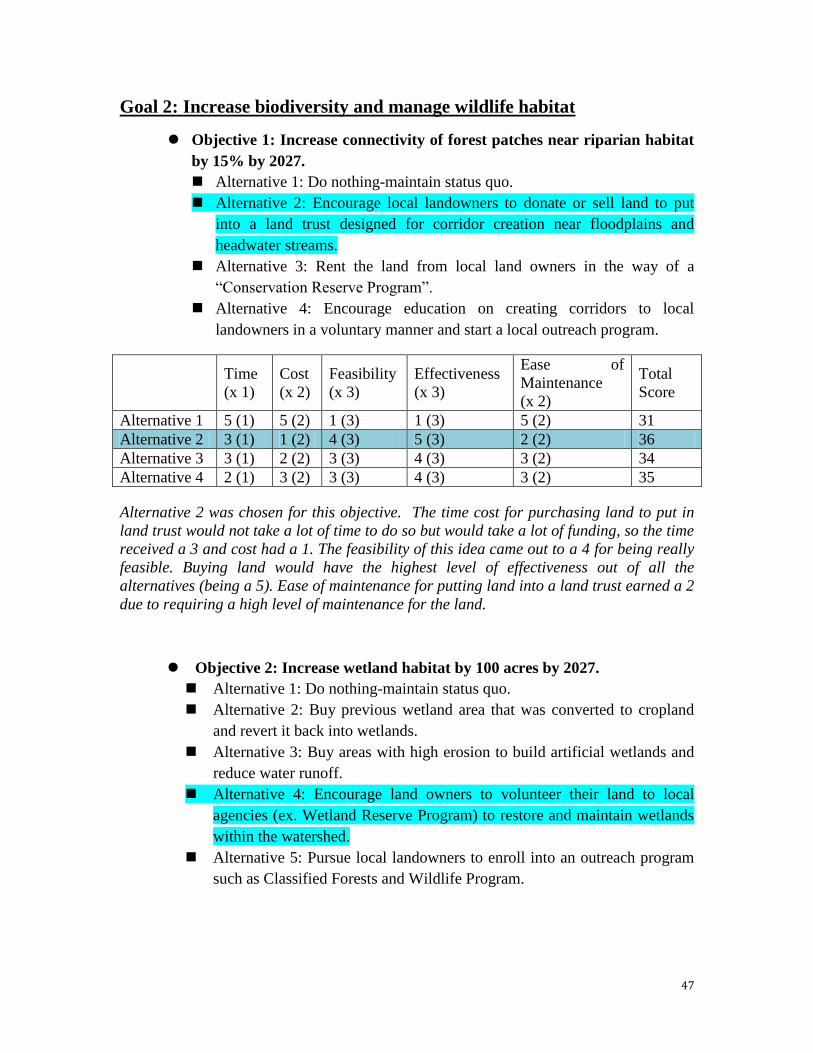
47
Goal 2: Increase biodiversity and manage wildlife habitat
Objective 1: Increase connectivity of forest patches near riparian habitat
by 15% by 2027.
Alternative 1: Do nothing-maintain status quo.
Alternative 2: Encourage local landowners to donate or sell land to put
into a land trust designed for corridor creation near floodplains and
headwater streams.
Alternative 3: Rent the land from local land owners in the way of a
“Conservation Reserve Program”.
Alternative 4: Encourage education on creating corridors to local
landowners in a voluntary manner and start a local outreach program.
Time
(x 1)
Cost
(x 2)
Feasibility
(x 3)
Effectiveness
(x 3)
Ease of
Maintenance
(x 2)
Total
Score
Alternative 1 5 (1) 5 (2) 1 (3) 1 (3) 5 (2) 31
Alternative 2 3 (1) 1 (2) 4 (3) 5 (3) 2 (2) 36
Alternative 3 3 (1) 2 (2) 3 (3) 4 (3) 3 (2) 34
Alternative 4 2 (1) 3 (2) 3 (3) 4 (3) 3 (2) 35
Alternative 2 was chosen for this objective. The time cost for purchasing land to put in
land trust would not take a lot of time to do so but would take a lot of funding, so the time
received a 3 and cost had a 1. The feasibility of this idea came out to a 4 for being really
feasible. Buying land would have the highest level of effectiveness out of all the
alternatives (being a 5). Ease of maintenance for putting land into a land trust earned a 2
due to requiring a high level of maintenance for the land.
Objective 2: Increase wetland habitat by 100 acres by 2027.
Alternative 1: Do nothing-maintain status quo.
Alternative 2: Buy previous wetland area that was converted to cropland
and revert it back into wetlands.
Alternative 3: Buy areas with high erosion to build artificial wetlands and
reduce water runoff.
Alternative 4: Encourage land owners to volunteer their land to local
agencies (ex. Wetland Reserve Program) to restore and maintain wetlands
within the watershed.
Alternative 5: Pursue local landowners to enroll into an outreach program
such as Classified Forests and Wildlife Program.
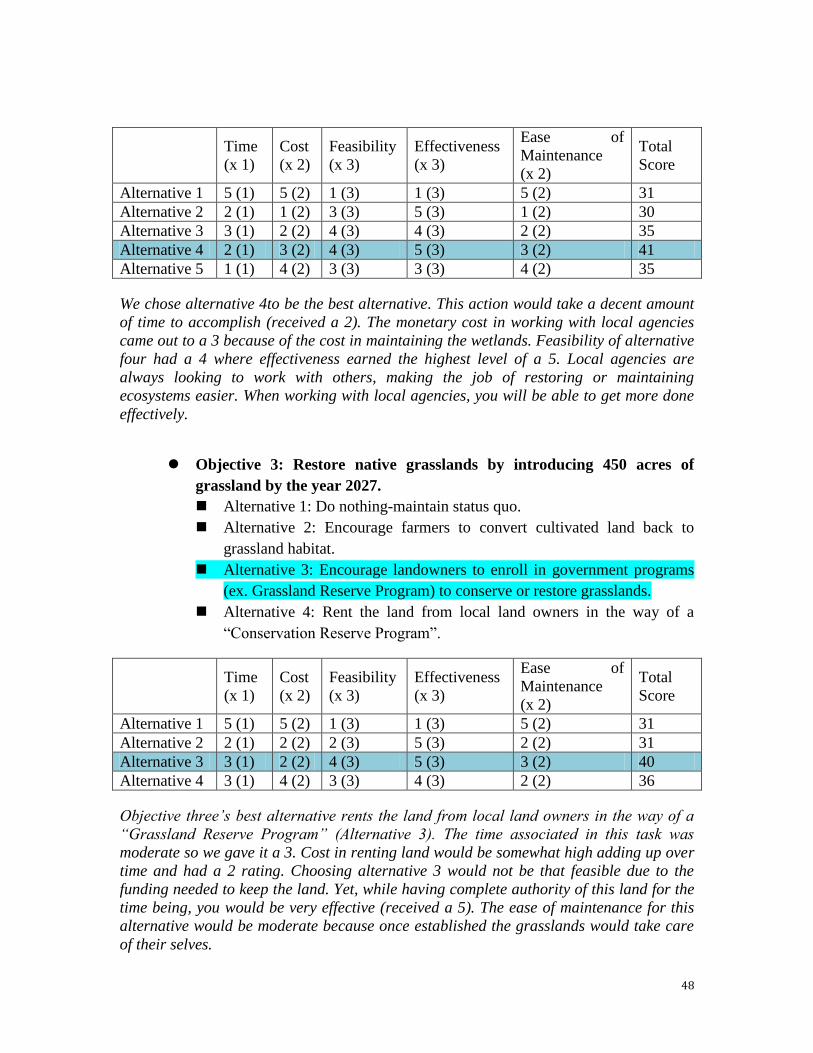
48
Time
(x 1)
Cost
(x 2)
Feasibility
(x 3)
Effectiveness
(x 3)
Ease of
Maintenance
(x 2)
Total
Score
Alternative 1 5 (1) 5 (2) 1 (3) 1 (3) 5 (2) 31
Alternative 2 2 (1) 1 (2) 3 (3) 5 (3) 1 (2) 30
Alternative 3 3 (1) 2 (2) 4 (3) 4 (3) 2 (2) 35
Alternative 4 2 (1) 3 (2) 4 (3) 5 (3) 3 (2) 41
Alternative 5 1 (1) 4 (2) 3 (3) 3 (3) 4 (2) 35
We chose alternative 4to be the best alternative. This action would take a decent amount
of time to accomplish (received a 2). The monetary cost in working with local agencies
came out to a 3 because of the cost in maintaining the wetlands. Feasibility of alternative
four had a 4 where effectiveness earned the highest level of a 5. Local agencies are
always looking to work with others, making the job of restoring or maintaining
ecosystems easier. When working with local agencies, you will be able to get more done
effectively.
Objective 3: Restore native grasslands by introducing 450 acres of
grassland by the year 2027.
Alternative 1: Do nothing-maintain status quo.
Alternative 2: Encourage farmers to convert cultivated land back to
grassland habitat.
Alternative 3: Encourage landowners to enroll in government programs
(ex. Grassland Reserve Program) to conserve or restore grasslands.
Alternative 4: Rent the land from local land owners in the way of a
“Conservation Reserve Program”.
Time
(x 1)
Cost
(x 2)
Feasibility
(x 3)
Effectiveness
(x 3)
Ease of
Maintenance
(x 2)
Total
Score
Alternative 1 5 (1) 5 (2) 1 (3) 1 (3) 5 (2) 31
Alternative 2 2 (1) 2 (2) 2 (3) 5 (3) 2 (2) 31
Alternative 3 3 (1) 2 (2) 4 (3) 5 (3) 3 (2) 40
Alternative 4 3 (1) 4 (2) 3 (3) 4 (3) 2 (2) 36
Objective three’s best alternative rents the land from local land owners in the way of a
“Grassland Reserve Program” (Alternative 3). The time associated in this task was
moderate so we gave it a 3. Cost in renting land would be somewhat high adding up over
time and had a 2 rating. Choosing alternative 3 would not be that feasible due to the
funding needed to keep the land. Yet, while having complete authority of this land for the
time being, you would be very effective (received a 5). The ease of maintenance for this
alternative would be moderate because once established the grasslands would take care
of their selves.

49
Objective 4: Increase the amount of native vegetation along floodplains by
40% by 2027.
Alternative 1: Do nothing-maintain status quo
Alternative 2: Encourage landowners to reduce runoff into streams by
increasing the amount of vegetation along floodplains (implementation of
BMPs).
Alternative 3: Encourage farmers to use buffers or filter strips every 2
acres in their cropland.
Alternative 4: Discourage the construction of culvers at places that are
unnecessary.
Time
(x 1)
Cost
(x 2)
Feasibility
(x 3)
Effectiveness
(x 3)
Ease of
Maintenance
(x 2)
Total
Score
Alternative 1 5 (1) 5 (2) 1 (3) 1 (3) 5 (2) 31
Alternative 2 3 (1) 3 (2) 4 (3) 4 (3) 4 (2) 41
Alternative 3 2 (1) 2 (2) 4 (3) 3 (3) 2 (2) 31
Alternative 4 4 (1) 4 (2) 2 (3) 2 (3) 2 (2) 28
Objective four’s best alternative choice was to encourage landowners to reduce runoff
into streams by increasing the amount of vegetation along floodplains (implementation of
BMPs). The time associated with increasing the amount of vegetation would be
moderately high until you planted all of the vegetation for the area (time received a 3).
The cost also received a 3 due to the cost of materials needed for the vegetation and
labor, but implementation of BMPs will allow for a reduced cost for the landowner.
Feasibility in this idea would be somewhat unreasonable because of the difficulty of
getting stakeholders to plant vegetation in their area. The effectiveness of this activity
would be large because of the reduction of runoff that the vegetation would provide.
Once the vegetation was planted though, there would be hardly any maintenance
required, so for that reason it earned a 4.
Goal 3: Increase public awareness and involvement
Objective 1: Inform 45% of the public of various federal and state
conservation programs by 2027.
Alternative 1: Do nothing-maintain status quo
Alternative 2: Hold public hearings (bi-annual); guest speakers
Alternative 3: Mail informational brochures and surveys to identify
current public knowledge
Alternative 4: Send surveys to residents of the watershed that will locate
the uninformed residents and target those stakeholders with informational
brochures.

50
Time
(x 1)
Cost
(x 2)
Feasibility
(x 3)
Effectiveness
(x 3)
Ease of
Maintenance
(x 2)
Total
Score
Alternative 1 5 (1) 5 (2) 1 (3) 1 (3) 5 (2) 31
Alternative 2 3 (1) 3 (2) 2 (3) 4 (3) 4 (2) 35
Alternative 3 2 (1) 2 (2) 3 (3) 4 (3) 2 (2) 31
Alternative 4 2 (1) 4 (2) 4 (3) 4 (3) 2 (2) 38
Objective one’s best alternative choice was alternative 4. Alternative 4 was to send
surveys to residents of the watershed that will locate the uninformed residents and target
those stakeholders with informational brochures. When calculating the time cost
associated with this alternative was considered to be a 2 on the scale from 1 to 5 (5 using
the least amount of time and 1 using the most amount of time). The monetary cost of
sending surveys was a 4, on a scale or 1 to 5 and 1 being the largest cost and 5 being the
minimal cost. The feasibility of alternative 4, compared to the other alternatives, was a 4
for maximum feasibility. Alternative 4 received a rating of 4 in effectiveness for being the
most effective compared to the other alternatives. The informational alternative received
a 2 in ease of maintenance which meant that the alternative would need a decent amount
of maintenance. Overall the alternative four had a 38 ranking which was the best
alternative overall.
Objective 2: Educate 50% of public on water quality concerns by 2027.
Alternative 1: Do nothing-maintain status quo
Alternative 2: Hold public hearings (bi-annual) to update the public on
current conditions of water quality within the watershed
Alternative 3: Local newspaper listing results of bi-annual water quality
testing
Alternative 4: Start a sampling program for the watershed, and encourage
the public to volunteer to help
Time
(x 1)
Cost
(x 2)
Feasibility
(x 3)
Effectiveness
(x 3)
Ease of
Maintenance
(x 2)
Total
Score
Alternative 1 5 (1) 5 (2) 1 (3) 1 (3) 5 (2) 31
Alternative 2 3 (1) 3 (2) 2 (3) 4 (3) 4 (2) 35
Alternative 3 2 (1) 2 (2) 3 (3) 4 (3) 2 (2) 31
Alternative 4 1 (1) 4 (2) 4 (3) 4 (3) 2 (2) 37
Objective one’s best alternative choice was alternative 4. Alternative 4 was to start a
public outreach program to inform the public on local and state conservation programs.
When calculating the time cost associated with this alternative was considered to be a 2
on the scale from 1 to 5 (5 using the least amount of time and 1 using the most amount of
time). The monetary cost of starting an outreach program was a 4, on a scale or 1 to 5

51
and 1 being the largest cost and 5 being the minimal cost. The feasibility of an outreach
program being compared to the other alternatives was a 4 for most feasible. This got a
rating of 4 in effectiveness for being the most effective. The outreach program alternative
also received a 2 in ease of maintenance which means that the alternative would need a
decent amount of maintenance. Overall the alternative four had a 38 ranking the best
alternative over the other 3 alternatives.
Objective 3: Inform 50% of public of personal opportunities by 2027.
Alternative 1: Do nothing-maintain status quo
Alternative 2: Hold public hearings (bi-annual) to update public on new
opportunities for individual involvement
Alternative 3: Issue a non-profit seasonal newsletter describing ways
individuals can help to improve water quality and sustainability within the
watershed
Alternative 4: Offer discounts and subsidies to landowners on tools ( e.g.
rain gardens, barrels) if willing to agree to use
Time
(x 1)
Cost
(x 2)
Feasibility
(x 3)
Effectiveness
(x 3)
Ease of
Maintenance
(x 2)
Total
Score
Alternative 1 5 (1) 5 (2) 1 (3) 1 (3) 5 (2) 31
Alternative 2 3 (1) 2 (2) 4 (3) 2 (3) 4 (2) 33
Alternative 3 2 (1) 3 (2) 4 (3) 4 (3) 2 (2) 36
Alternative 4 4 (1) 2 (2) 3 (3) 4 (3) 2 (2) 33
Objective three’s best alternative wants to issue a non-profit seasonal newsletter describing ways
individuals can help to improve water quality and sustainability within the watershed. Alternative
three had a total score of 36, higher than the other alternatives by 3 points. The alternative had a
time cost of 2, monetary cost of 3, feasibility score of 4, effectiveness score of 4, and ease of
maintenance score of 2. The reason we gave a 2 for time was that it would take awhile to type up
a newsletter and take a lot of time to get people to actively participate in helping. The monetary
cost of producing a newsletter would not have been more then offering subsidies or holding
public hearings so we gave it a 3. Sending a newsletter out to stakeholders can be very
effectiveness due to the in depth reach that a newsletter can provide. Also due to how simple it is
to produce a newsletter we gave a 4 to feasibility. The ease of maintenance for a newsletter would
be a 2 because of constant updating of the information.

52
Goal 4: Increase Recreational Opportunities
Objective 1: Add five public access points in the watershed by 2027.
Alternative 1: Do nothing.
Alternative 2: Purchase land to provide public access points to surface
waters.
Alternative 3: Ask landowners to donate land for public access through
conservation easements.
Alternative 4: Establish additional points of access on currently held
public lands.
Alternative 5: Purchase land to provide public access points to surface
waters and ask landowners to donate land for public access through
conservation easements.
Alternative 6: Purchase land to provide public access points to surface
waters and establish additional points of access on currently held public
lands.
Alternative 7: Ask landowners to donate land for public access through
conservation easements and establish additional points of access
on currently held public lands.
Time
(x 1)
Cost
(x 2)
Feasibility
(x 3)
Effectiveness
(x 3)
Ease of
Maintenance
(x 2)
Total
Score
Alternative 1 5 (1) 5 (2) 1 (3) 1 (3) 5 (2) 31
Alternative 2 3 (1) 1 (2) 2 (3) 3 (3) 3 (2) 26
Alternative 3 2 (1) 4 (2) 2 (3) 3 (3) 3 (2) 31
Alternative 4 4 (1) 4 (2) 3 (3) 4 (3) 3 (2) 39
Alternative 5 3 (1) 3 (2) 3 (3) 4 (3) 3 (2) 36
Alternative 6 3 (1) 3 (2) 3 (3) 4 (3) 3 (2) 36
Alternative 7 3 (1) 4 (2) 4 (3) 5 (3) 3 (2) 44
Alternative 7 was viewed as the best alternative because currently there are no INDNR public
access sites along Deer Creek or Sugar Creek, yet potential properties may exist in the form of
abandoned highways, areas near bridges, current county parks, or land donated by willing
landowners. Establishing public access sites on currently held public land would allow for an
inexpensive and feasible method of acquiring access sites. However, the goal may not be able to
be met solely based on use of currently held public lands since not all potential sites may be
easily accessible or feasible as public access sites. Also, since the goal is to provide more
recreational opportunities for the watershed community, asking landowners for donations would
allow for additional sites in other regions to be considered for public access making access more
available to the watershed community at large. Therefore, the combination of these two methods
was deemed the best alternative for accomplishing this objective.

53
Objective 2: Increase amenities such as benches and restrooms in
existing parks by 20% by 2027.
Alternative 1: Do nothing
Alternative 2: Create a fund-raiser for frequent users of the parks and ask
for public donations to build more amenities.
Alternative 3: Ask the local government for funding and donations to
construct more amenities for the public.
Alternative 4: Ask private business owners to donate to the existing parks
for amenity construction, providing them the incentive of being
advertised at the parks.
Alternative 5: Combine funding from the local government with
donations made by both the public and private businesses to build more
amenities
Time
(x 1)
Cost
(x 2)
Feasibility
(x 3)
Effectiveness
(x 3)
Ease of
Maintenance
(x 2)
Total
Score
Alternative 1 5(1) 5(2) 1(3) 1(3) 5(2) 31
Alternative 2 3(1) 3(2) 2(3) 3(3) 3(2) 30
Alternative 3 2(1) 2(2) 2(3) 3(3) 3(2) 27
Alternative 4 2(1) 2(2) 2(3) 2(3) 3(2) 24
Alternative 5 1(1) 2(2) 4(3) 4(3) 2(2) 33
Alternative 5 was chosen mainly because it has a mixture of funding sources, making the plan
more feasible and effective. This is why we gave it the highest feasibility and effectiveness scores
out of all the alternatives. Using incentives for private businesses such as offering to advertise
them at the parks would be an effective way to raise funds. Although getting funding from the
local government, the public, and private businesses may be quite time consuming, it is believed
that more amounts could be collected to go towards the construction of amenities at current park
locations.
Objective 3: Establish 20% more miles of walking and biking trails
throughout the watershed by 2027.
Alternative 1: Do nothing
Alternative 2: Petition the local government for more funding for trails
and try to obtain donations from private businesses.
Alternative 3: Hold fundraisers and ask for public donations to raise
money.
Alternative 4: Petition the local government for more funding for trails
and seek out grants from organizations that support the building of trails
(National Trails Fund).
Alternative 5: Try to find funding through the government, private
business donations, grants and public donations.

54
Time
(x 1)
Cost (x
2)
Feasibility
(x 3)
Effectiveness
(x 3)
Ease of
Maintenance
(x 2)
Total
Score
Alternative 1 5(1) 5(2) 1(3) 1(3) 5(2) 31
Alternative 2 3(1) 4(2) 3(3) 3(3) 4(2) 38
Alternative 3 3(1) 3(2) 5(3) 4(3) 4(2) 44
Alternative 4 3(1) 4(2) 4(3) 3(3) 4(2) 40
Alternative 5 3(1) 4(2) 5(3) 4(3) 4(2) 46
Alternative 5 was chosen because we thought it was most likely to actually succeed in getting
enough funds to accomplish our goal. The cost of all of these alternatives would be low, but some
would likely generate more money than the others. Petitioning the government for funds may get
some money, but the government has been cutting costs in many areas so this may not be the best
option. Alternative 5 was chosen because it combines several ways of getting money and will be
the most likely to succeed. The public will be likely to donate if they care about the project.
Private businesses may be encouraged to donate if plaques or something that acknowledges that
they donated is put around the trails. This will make the businesses look good to the public.

55
Section 4: Implementations
Goal 1: Improve Water Quality
- Objective 1: Decrease erosion and sedimentation rates by 5% by 2017; 20% by
2027
Selected Alternative: Encourage farmers to use various Best Management
Practices (BMPs) that include grassed waterway plantations, using cover crops,
conservation tillage, and introduce them to various funding programs through
workshops or information sessions.
A. What, When, How:
Due to flooding problems and wind/water transportations, soil erosion and
sedimentation has caused large amounts of soil loss and has become a leading cause of
water quality degradation. We encourage farmers to take measures that can help prevent
or delay these problems. A grassed waterway is a channel that is constructed to redirect
storm water and prevent gully erosion. Cover crops are planted specifically to prevent
water and wind erosion, and common crops include winter legumes and cereal grains.
Conservation tillage leaves the soil surface covered with crop residues which help retain
the soil. Many governmental programs provide funding to encourage BMPs, and we wish
to hold information sessions or workshops that help local landowners become aware of
these different opportunities.
Usually, the Farm Service Agency (FSA), the Natural Resources Conservation
Service (NRCS) and the Soil and Water Conservation District (SWCD) will be involved
in financing, surveying, designing and supervising the installation of the BMPs. All
services from these agencies are provided free of charge, but landowners still have certain
responsibilities. The landowner would need to determine the location of the proposed
practice, choose a contractor and pay for seeding/mulching/fertilizer, and maintain the
practice for contracted life, which is usually 10 years.
The workshops/info sessions will be held twice a year during the first 5 years of our
plan, and a co-operation between the Wabash River Enhancement Corporation (WREC),
Purdue University and local communities should be established in order to ensure the
events are smoothly run. In order to encourage stakeholders to attend such meetings,
much advertisement is needed. Ads can be posted in local newspapers and magazines,
and invitations could be sent by mail. We could provide various incentives such as
providing food during the meetings or a chance to win a prize if the stakeholder attended.
Additional expertise may be needed from agencies such as the local Natural Resources
Conservation Service, Soil and Water Conservation District, or Farm Service Agency
office, and we could invite guest speakers from these agencies to come in and talk about
various opportunities. In the next 10 years, events can be reduced to once a year since
more landowners would know about different opportunities.
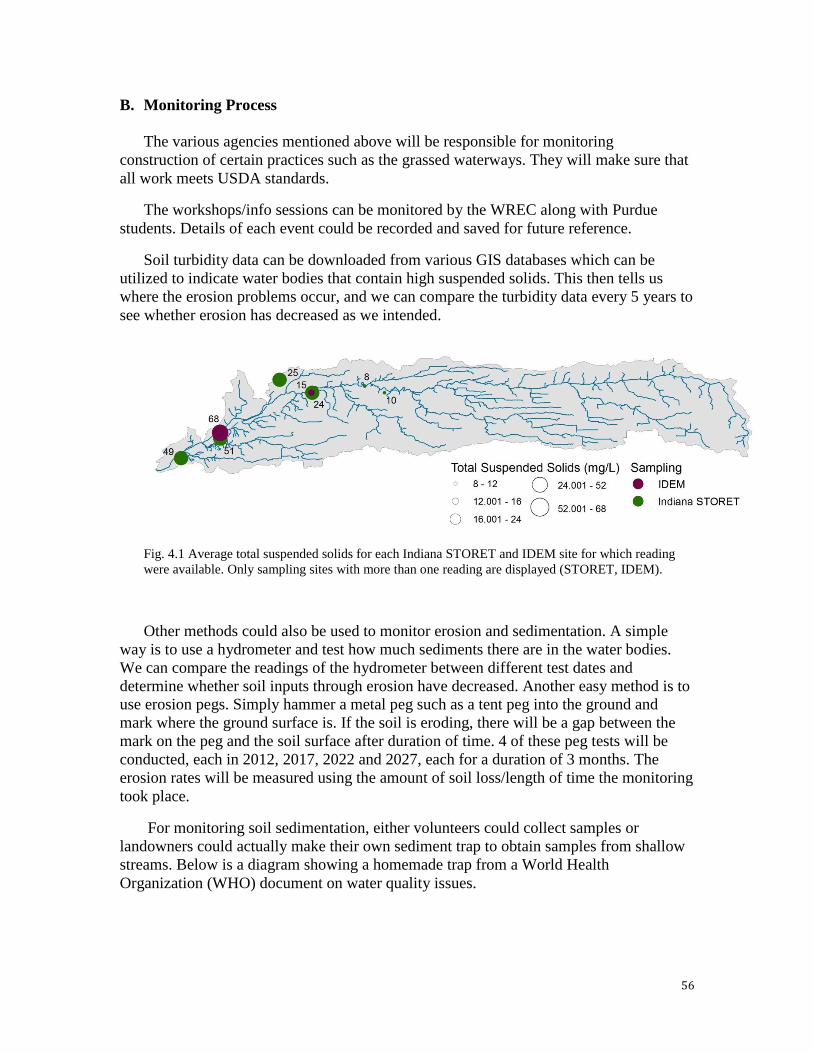
56
B. Monitoring Process
The various agencies mentioned above will be responsible for monitoring
construction of certain practices such as the grassed waterways. They will make sure that
all work meets USDA standards.
The workshops/info sessions can be monitored by the WREC along with Purdue
students. Details of each event could be recorded and saved for future reference.
Soil turbidity data can be downloaded from various GIS databases which can be
utilized to indicate water bodies that contain high suspended solids. This then tells us
where the erosion problems occur, and we can compare the turbidity data every 5 years to
see whether erosion has decreased as we intended.
Fig. 4.1 Average total suspended solids for each Indiana STORET and IDEM site for which reading
were available. Only sampling sites with more than one reading are displayed (STORET, IDEM).
Other methods could also be used to monitor erosion and sedimentation. A simple
way is to use a hydrometer and test how much sediments there are in the water bodies.
We can compare the readings of the hydrometer between different test dates and
determine whether soil inputs through erosion have decreased. Another easy method is to
use erosion pegs. Simply hammer a metal peg such as a tent peg into the ground and
mark where the ground surface is. If the soil is eroding, there will be a gap between the
mark on the peg and the soil surface after duration of time. 4 of these peg tests will be
conducted, each in 2012, 2017, 2022 and 2027, each for a duration of 3 months. The
erosion rates will be measured using the amount of soil loss/length of time the monitoring
took place.
For monitoring soil sedimentation, either volunteers could collect samples or
landowners could actually make their own sediment trap to obtain samples from shallow
streams. Below is a diagram showing a homemade trap from a World Health
Organization (WHO) document on water quality issues.

57
(http://www.who.int/water_sanitation_health/resourcesquality/wqmchap13.pdf)
They could then send the sediment sample to laboratories to be tested.
C. Timeline
The first stage will be from 2012-2017. This is where 2 workshops/info sessions will
be held each year. Landowners should start thinking about what kind of practices they
wish to implement and where to place them, and then start applying for different cost-
share programs. Certain erosion levels should be monitored and recorded to be used for
future comparison. The next stage is from 2017-2022 where the funding should be in
place and landowners can start to implement the practices. Workshops/info session will
only be held once a year. The final stage is from 2022-2027 where the emphasis should
be maintenance and monitoring.
D. Budget and Funding
Through contact with the WREC, we understand that a cost share program will be
available with a total amount of approximately $150,000 (granted) plus $100,000 (match)
for the first two years. This fund can provide up to 75% of the total cost for agricultural
projects focused on improving water quality.
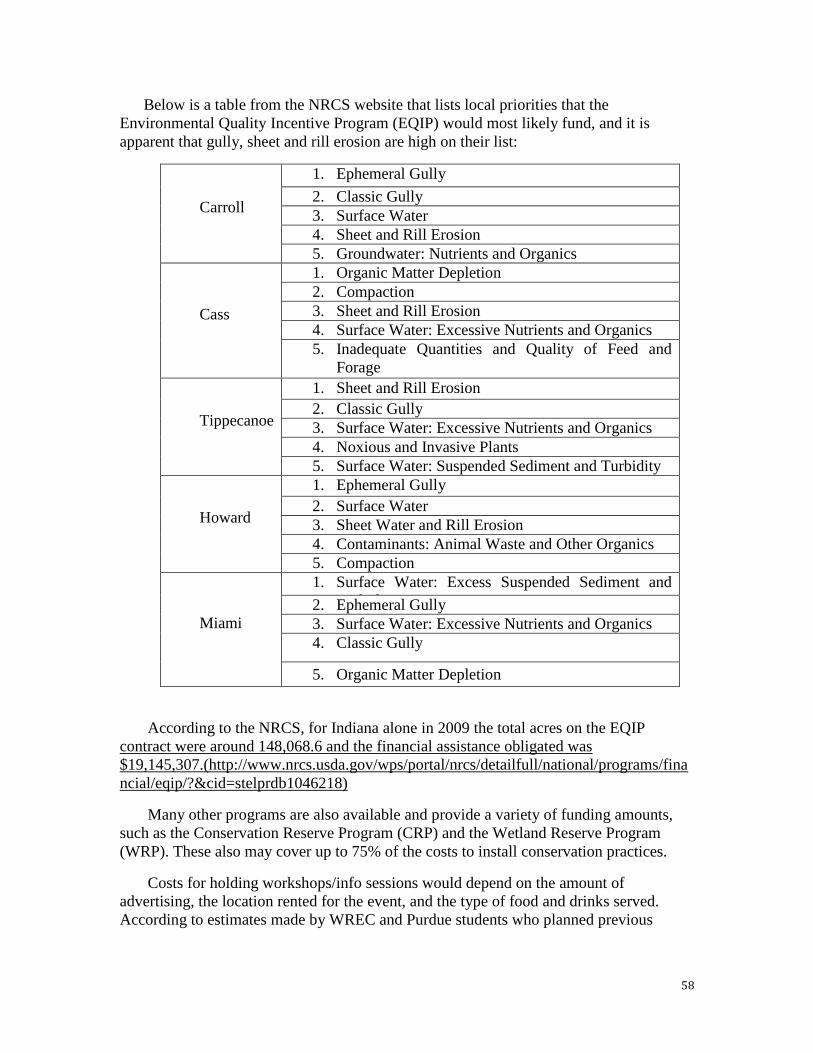
58
Below is a table from the NRCS website that lists local priorities that the
Environmental Quality Incentive Program (EQIP) would most likely fund, and it is
apparent that gully, sheet and rill erosion are high on their list:
Carroll
1. Ephemeral Gully
2. Classic Gully
3. Surface Water
4. Sheet and Rill Erosion
5. Groundwater: Nutrients and Organics
Cass
1. Organic Matter Depletion
2. Compaction
3. Sheet and Rill Erosion
4. Surface Water: Excessive Nutrients and Organics
5. Inadequate Quantities and Quality of Feed and
Forage
Tippecanoe
1. Sheet and Rill Erosion
2. Classic Gully
3. Surface Water: Excessive Nutrients and Organics
4. Noxious and Invasive Plants
5. Surface Water: Suspended Sediment and Turbidity
Howard
1. Ephemeral Gully
2. Surface Water
3. Sheet Water and Rill Erosion
4. Contaminants: Animal Waste and Other Organics
5. Compaction
Miami
1. Surface Water: Excess Suspended Sediment and
Turbidity 2. Ephemeral Gully
3. Surface Water: Excessive Nutrients and Organics
4. Classic Gully
5. Organic Matter Depletion
According to the NRCS, for Indiana alone in 2009 the total acres on the EQIP
contract were around 148,068.6 and the financial assistance obligated was
$19,145,307.(http://www.nrcs.usda.gov/wps/portal/nrcs/detailfull/national/programs/fina
ncial/eqip/?&cid=stelprdb1046218)
Many other programs are also available and provide a variety of funding amounts,
such as the Conservation Reserve Program (CRP) and the Wetland Reserve Program
(WRP). These also may cover up to 75% of the costs to install conservation practices.
Costs for holding workshops/info sessions would depend on the amount of
advertising, the location rented for the event, and the type of food and drinks served.
According to estimates made by WREC and Purdue students who planned previous

59
meetings, the average cost to hold such an event with dinner provided would be
approximately $1000, and the cost to hold a meeting without any food is around $100.
- Objective 2: Reduce E. coli levels to below 500 cfu/100mL by 2020; meet State
Water Quality Standards for E. coli by 2027.
Selected Alternative: Work with landowners to identify septic issues, eliminate
failing septic systems, and prevent septic overflow through workshops and
outreach as well as improve manure management for confined feeding
operations to reduce E. coli contamination of water resources.
A. What, When, How
E. coli DNA matching analysis from the Little Deer Creek Headwaters watershed
205j project (located within this watershed) revealed samples of E. coli to be primarily of
animal origin but also a few of human origin (Howard County Soil and Water
Conservation District 2005). Therefore, an approach addressing both potential sources of
E. coli was deemed essential in reducing E. coli contamination. Due to the extent of
CFOs throughout the watershed and issues raised by stakeholders concerning the status
and quality of septic systems, these two issues will be the focus of implementations
Many households in the watershed use septic systems to treat waste. If properly
managed septic systems can treat waste effectively; however, issues can arise including
sewage surfacing on property and negative effects on groundwater quality resulting in
contamination of water resources (Lee et al. 2005). Addressing septic issues would
involve working with the County Health Departments to assess septic issues in the
watershed and then encouraging landowners to get inspections and cleaning of septic
systems as well as replacing failing septic systems.
For increasing the quality of septic systems throughout the watershed, two workshops
would be held regarding proper septic tank maintenance and care by the County Health
Department of the county where the workshop is being held. These workshops would be
held at two different locations in the watershed (likely in areas different than where such
workshops were held in association with the Little Deer Creek Headwaters watershed
project). One workshop should be held in the Camden area as stakeholders had expressed
concern about septic issues in the surrounding area at the public meeting in October 2011
(see Appendix I for more information). Prior to these workshops, pamphlets would be
distributed to the local population regarding proper septic care and maintenance to
encourage attendance of meetings and to reach a larger population that may not attend a
meeting but could benefit from such information. Such pamphlets could advertise the
first workshop allowing those citizens who would like additional information or someone
to consult about septic issues an avenue to do so. Additional advertisement for workshops
could potentially be needed. Regions where septic drainage is very limited as well as
noted problem areas (noted in public meetings, water sampling, or from other sources)
would be potential areas of focus for the additional workshop.

60
CAFOs are required to formulate and adhere to a manure management plan in Indiana
(Ebner 2007). Such plans aim to minimize phosphorus and nitrogen loading into surface
waters yet do not explicitly address lowering pathogen contamination risk such as E. coli.
In order to reduce risk of contamination, manure storage time is essential as this allows E.
coli to be destroyed naturally. Additional BMPs for reducing E. coli contamination risk
include avoiding manure application on wet and frozen land or land prone to flooding,
injecting or incorporating manure on the day applied, utilizing cover crops and other
BMPs to prevent erosion, and ensuring that manure storage facilities are well maintained.
Thus, in order to determine what issues BMPs would most likely reduce risk of E. coli
contamination for a particular operation, an open discussion with CFOs would be
required regarding current manure management practices, how E. coli is currently being
addressed, and what can be done on their operations to further reduce risk of surface
water E. coli contamination. Implementation would focus on both CAFO operations as
well as other confined feeding operations that may contribute to E. coli contamination of
surface waters.
The Natural Resources Conservation Service (NRCS) and the Soil and Water
Conservation District (SWCD) will be involved with working with livestock producers to
determine which BMPs could potentially be utilized on their land to improve manure
management. The type and necessity of BMPs would vary depending on preexisting
manure management infrastructure, classification as CAFO or CFO, preexisting manure
management plans, and proximity of land to waterways. Filter strips at the edges of
manure applied fields and improvement or creation of manure storage facilities would be
potential practices that could result in pathogen reduction. Fecal coliforms from runoff on
manure applied fields have been observed to be decrease by 75 – 91% with 15 – 30 ft
grass filter strips while animal confinement areas near waterways would require a 66 – 99
ft filter strip reduces pathogen contamination of waterways (Spiehs and Goyal 2007).
B. Monitoring Process
Monitoring to determine BMP installation effectiveness and the success of the septic
system workshops would include E. coli sampling as part of an expanded water quality
monitoring throughout the watershed including sample locations near those previously
used by other organizations as well as areas of noted concern by stakeholders and regions
where water sampling has historically been lacking (for an expanded description of water
testing see goal 1 objective 4). Soil testing for E. coli following application to fields
would be encouraged to determine if the proper amount of manure storage time is being
allowed for the natural destruction of E. coli prior to field applications. Implementation in
regards to septic system quality can be monitored based on the number of attendees at the
workshops as well as the number of septic systems cleaned or fixed in the county during
the time span (2012 – 2027) in comparison to past levels.
C. Timeline
As soon as feasible, brochures regarding proper septic tank care and maintenance
would be distributed to residents throughout the watershed. Within six months of sending
out brochures, a public workshop near Camden on septic care and maintenance would be

61
held. Following acquisition of water quality results and additional information from
watershed residents through public meetings, another site for an additional workshop
would be chosen and held by 2017. As soon as possible, communication with confined
feeding operations would begin to determine which BMPs would work best to reduce E.
coli contamination risk for specific operations and to define which operators are
interested in participation. Subsequently, funding sources for each BMP would be
determined and installation of BMPs would occur. Maintenance of BMPs would be
required and additional water quality sampling would continue until 2027 to observe to
what extent such practices assisted in E. coli level reduction.
D. Budget and Funding
For distribution of brochures to the public, printing brochure would cost
approximately $257 per 500 brochures (www.fullcolorprint.com), envelopes would
cost $23.95 per 500 envelopes, and the current rate for stamps is 45 cents per stamp
(US Postal Service). Additionally, the cost to hold a public workshop would be
approximately $100 (as stated in goal 1 objective 1); however, additional costs would
be associated with additional incentives offered to attend workshops (such as food or a
raffle for a free septic tank inspection). Such costs could be funded by sources such as
IDEM 319 grants which can provide outreach and education for reducing nonpoint
source water pollution (IDEM). For a landowner, it costs $3,000 to $10,000 to replace
a failing septic system, and only $150 to $250 to have a septic tank pumped, cleaned,
and inspected (Tippecanoe County Health Department 2012). Landowner would have
to pay these costs; however, the workshops would likely assist in encouraging proper
maintenance of septic systems decreasing the cost to the landowner in the long term.
Total costs to livestock producers would be dependent on funding available and
the number of operations interested in integrating additional BMPs to reduce E. coli
contamination risk. This would involve working with the producers to determine
which practices would best reduce potential E. coli contamination, their suitability for
EQIP funds, and plans for cost-share if other funding cannot be secured. Potential
practices supported under EQIP include (Ribaudo et al. 2003):
- Nutrient Management (590) – covers costs associated with developing and
implementing nutrient management plans including the proper use of manure as a
nutrient source for crops
- Waste Utilization (633) – covers waste management plan development and
implementation of utilizing manure and wastewater from livestock and poultry
operations as a nutrient source for agricultural fields
- Manure Transfer (634) – includes structures and equipment for the transfer and
movement of manure
- Waste Storage Facilities (313) – covers the construction of waste storage
facilities including concrete and earthen pits as well as other forms of waste
storage

62
- Other EQIP funds potentially relevant to certain operations may include waste
treatment, lagoon expansion, various forms of waste digesters, and cover crops or
filters strip for preventing erosion and runoff
Limitations of EQIP funds would include the cap total paid over 6 years ($300,000;
NRCS 2012) as well as the amount of EQIP funds, funding demands, and ranking
dependent on the magnitude of environmental benefit a practice would generate. EQIP
funds are determined via a ranking system established annually of “local resource
priorities” per county (NRCS 2012; see goal 1 objective 1 for more detail). Payment caps
and unit payment rates for EQIP practices can be found here:
http://www.in.nrcs.usda.gov/programs/ eqip/2012_EQIP_ Practice_Details.pdf.
If a practice or operation is ineligible for EQIP funding, funding via the cost share
program will then be utilized to implement BMPs. Costs will vary dependent on BMP
chosen for a particular operator. For example, table 1.2.1 indicates the approximate cost
of various types of manure storage systems. In general, costs can range from $100 per
cow for earthen ponds to $1,000 per cow for above ground tanks (USDA 1998). Cost for
filter strips could be as low as $264/year for an acre of rented land (as noted in objective
1 goal 1). Costs for monitoring water for E. coli would be approximately $20 per sample
(to test swimming water bacteria; Department of Environmental Services). Soil testing
for E. coli would cost approximately $35 per sample
(www.harringtonsorganiclandscapecare.com).
Table 4.1. Estimated cost of manure storage facilities per 1,000 gal from Harrison 2004.
- Objective 3: Reduce nutrient loading 5% by 2017; 20% by 2027.
Selected Alternative: Encourage landowners to use Best Management Practices
(BMPs) that includes correct fertilizer application methods, installing filter
strips, using conservation tillage and controlled drainage.

63
A. What, When, How
In addition to erosion and sedimentation problems, nutrient loading can decrease
water quality and impose threats to both humans and the surrounding environment.
Excess nitrogen and phosphorus can runoff from fields and enter waterways which could
then lead to unwanted algae growth or contamination of drinking water. So it is important
that fertilizers are applied in a correct way- Nitrogen and phosphorus are less likely to be
lost by erosion or runoff if they are banded directly into the soil or applied to the soil
surface and promptly mixed into the soil by disking, plowing, or rotary tilling. Planting
filter strips can help trap some if these pollutants and potentially decrease the damage of
floods. Conservation tillage reduces runoff, conserves soil moisture and helps keep
nutrients and pesticides on the field. Controlled drainage methods can be used to prevent
excessive nutrient loading and could also lower flooding risks.
Starting in 2012, locations to for the BMPs should be determined- areas of
importance could be ditch banks, drainage channels, field edges and sloped land. Then,
the next stage involves securing funding for the plan through the cost-share program or
conservation easements and other government funding programs. After that we may
move forward to the implementation stage, and finally the monitoring stage.
The public meetings mentioned in the previous implementation plan could also be
used to inform stakeholders on various conservation programs and funding opportunities
for nutrient loading problems. Once landowners identify their issues, they may act
accordingly to find a BMP that suites their needs. Several groups should cooperate in
order to achieve this goal. Governmental departments such as the EPA, DNR can provide
expertise on specific mechanisms and funding opportunities, the Wabash River
Enhancement Corporation along with Purdue students and faculty may assist in holding
the public meetings.
B. Monitoring Process
To monitor nutrient loading, both soil and water should be tested. Current
conservation programs such as the Wabash River Sampling Blitz and the Hoosier River
Watch ask volunteers to sample stream water quality and test variables such as nitrogen
and phosphorus content. We can promote these activities by putting more effort into
advertising, and hold more events throughout the year. There could also be partnerships
with schools and colleges to encourage students to participate in soil and water quality
monitoring.
C. Timeline
Testing and monitoring will be done every 5 years, and the collected data would be
compared. From 2012-2017, we aim to reduce nutrient loading by 5%, so we will
compare the data for soil and water quality for 2012 and 2017. From 2017-2022, we will
do another 5year comparison, and from 2022-2027, we will perform a final comparison
to see if our goal of a 20% reduction was achieved.

64
D. Budget and Funding
In terms of using correct methods to apply fertilizers and practicing conservation
tillage, the landowner does not need to pay anything for implementation. The costs of
installing and maintaining filter strips include: land rental costs, equipment and labor
costs, and seed and fertilizer costs. The cost of farmland in Indiana for purchase as of
2010 ranged from $3501-$5310 per acre, and the cost to rent was $124-$202 per acre
(Purdue Extension). The current prices are not clear. Farmers can either sell their land or
voluntarily enroll their land for a filter strip cost-share. Seeding for cool-season grasses
cost around $90/acre (www.seedland.com). Labor and equipment would cost around
$50/acre (Indiana farm custom rates 2007). So the total estimated cost for planting an
acre of filter strip can be as low as $264/year if the land were to be rented.
The cost of soil testing in a lab is approximately $7-$10 per sample, and the price
could go up if you wanted to test for more nutrients (NRCS 2011). The NRCS and
Purdue Extension can provide more information on labs that are available in the area.
The cost to send water samples to a commercial testing laboratory ranges from $25-
$100 per sample depending on what types of nutrients and bacteria you wish to test for
(Purdue Extension). Unfortunately, Purdue University does not provide any water testing
services.
We mentioned before that the WREC cost-share program can provide a total amount
of approximately $150,000 (granted) plus $100,000 (match) for the first two years, and
cover up to 75% of the individual’s costs. Other opportunities include the Conservation
Reserve Program (CRP), Wetland Reserve Program (WRP), Environmental Quality
Incentive Program (EQIP), and Forest Incentive Program (FIP). The Conservation
Reserve Program appears to be the most economically feasible option for farmers,
although the economic results may vary depending on the farmer's specific conditions
and needs. Under Conservation Reserve Program, farmers are reimbursed up to 50% of
establishment costs, and 50% of rental rates for the life of the contract. For more
information on incentive programs, landowners may contact their local Natural
Resources Conservation Service, Soil and Water Conservation District, or Farm Service
Agency office.
- Objective 4: Improve water quality monitoring system by 2017.
Selected Alternative: Encourage volunteer monitoring with chances to be
hired on for full or part time paid positions with gradual additions of sites
and frequency as more people monitor.
A. What, When, How
More monitoring sites need to be added to this watershed because there are large
areas with no data. The more data that we have, the better the water quality will be able to
be monitored and trouble areas focused on.

65
The chosen alternative for this goal was to encourage volunteer monitoring with
chances to be hired on for full or part time paid positions with gradual additions of sites
and frequency as more people monitor.
The placements of the new monitoring sites will be based on where current sites
are, problem areas in regard to E. coli and runoff and where there are large gaps with no
monitoring sites. Public input on where water should be monitored was also considered.
Several new sites were added at the eastern end of the watershed because there was a
distinct lack of testing sites in that area and there are little riparian vegetation buffers in
that area. Fifteen new sites were added in total. If there are excess funds, adding more
monitoring sites should be considered. The timeline for this project is 10 years broken
into two 5 year segments. The timeline details will be detailed in the timeline section
below.
Figure 4.2: This map shows where current monitoring sites are, the locations of CAFOS, hydrology and
landcover in the watershed. This map also shows in green where stateholders suggested where monitoring
sites should be placed.

66
Figure 4.3: This map shows the 15 proposed new water monitoring sites for the watershed in addition to
everything shown in Figure 1 above.
B. Monitoring Process
The monitoring process will be largely volunteer-based due to financial
constraints and will be run by organizations that already do water testing in the area such
as Wabash River Enhancement Corporation and Hoosier Riverwatch. In the long-term,
part-time and full-time employees would need to be added in order to effectively
coordinate and monitor all of the new and existing sites. Offering hiring preference to
people who already volunteer would encourage volunteering and help out the community.
C. Timeline
2012-2017
During this time period, volunteering needs to be encouraged. This can be done
by fliers, advertising, word of mouth and by social media. More volunteers need to be
recruited so that new monitoring sites can be checked. Public meetings can also be held
to determine problem areas and places that need better monitoring in addition to the sites
that exist and that have been proposed. During this time period, it would be ideal to add
50% of the new testing sites.
2017-2022
During this time period, volunteer participation still needs to be encouraged. New
full-time and part-time staff can be hired on to assist with water monitoring and
coordination and these staff members can be picked from the existing pool of volunteers
if there is interest there. The remaining new testing sites need to be added and the old
sites need to be retained in this time period. Plans can also be revised based on issues
encountered during this time.

67
E. Budget and Funding
The budget for the volunteers would be minimal so most of the money would be
needed for supplies and salaries for the new employees. Salary will depend on whether
the employee is part-time or full-time, experience and education. The salary could vary
from $15,000 to $45,000 a year. This financing would come from donors and grants that
the non-profit organizations, such as the Wabash River Enhancement Corporation,
already obtain their funding from in addition to new grants that are available through
other organizations and the Environmental Protection Agency.
Goal 2: Increase biodiversity and manage wildlife habitat
- Objective 1: Increase connectivity of forest patches near riparian habitat by
15% by 2027.
Selected Alternative: Encourage local landowners to and put into a land
trust designed for corridor creation near floodplains and headwater
streams.
A. What, When, How
We suggest that, due to a lack in linkage in riparian habitat along floodplains
(especially in the eastern portion of the watershed) to increase corridor connection in
these areas by 15% by the year 2027. To accomplish this, we recommend that local
landowners be encouraged to donate portions of their land near these flood plains,
especially those in the eastern half of the watershed.
Areas that are the largest forested areas occur along floodplains. We believe that
connection of the fragmented edges of these areas is important for decreasing edge
effects, increase habitat for forest bird species, amphibians, and various aquatic species
(Burnett et al. 2010). Increasing corridor occurrence and the forest corridor connections
can also decrease nutrient loading, sedimentation, and debris flow into adjacent streams.
This donated land will enter into a land trust, which means that the landowners
will still own the land (unless directly bought), but specific organizations will fund the
restoring and conserving of the land. This can usually be accomplished through donating
land, life estates, bargain sale, or conservation easements. Donating land is as the
description says. The landowner donates land, and can receive immediate benefits, such
as income and estate tax deductions. Life estates are designated when landowners wish
to remain and use the property they donate. Once the individual passes, the title is
assigned to the land trust. A bargain sale is one where the landowner sells the land rights
to the land trust organization. The difference between the appraisal value and the bargain
value will serve as a tax deduction. Finally, a conservation easement is an agreement that
landowners use to designate what type of activity takes place on his or her property.
Some of the rights are given to the land trust organization. The property is still owned by
the landowner and may still be given or sold to whom ever, but the easement stays with

68
the specific property. Depending on the type of land donation given, the landowner can
restrict certain practices that could otherwise take place (such as public access for
educational purposes). Below are two different two different organizations in northern
Indiana that currently work property within the Deer-Sugar Creek Watershed (NICHES
2011).
These two organizations are NICHES and ACRES. NICHES mission statement is
as follows: “protects, restores and sustains Northern Indiana’s ecosystems by providing
habitat for native species and offering natural places for the education, appreciation and
enjoyment of current and future generations” (NICHES 2011). NICHES already hold
rights on properties in Carroll, Cass, and Tippecanoe counties. All three land donation
options are available through NICHES. NICHES does not have a specific criteria that the
land in question needs to follow. However, NICHES will be more willing to buy land that
is adjacent to other NICHES land location, or land that is of more ecological concern.
ACRES land trust organization is similar to NICHES and already have rights to
properties in Miami County. Purposes of ACRES include: to incorporate charity,
education and science into preserving natural areas and discouraging unnecessary
development, allow citizens to understand the value of these natural areas, to permit
access (recreational, scientific, educational) in the protected areas without damaging the
preservation of nature, and to encourage individuals and organizations to continue
participating conservation efforts (ACRES 2011). ACRES is geared more towards
preservation than restorations. ACRES is an option in order to minimize impact upon the
natural environment that already exists. ACRES does have an obligated criteria that the
specific area to be donated must follow (ACRES 2011).
1. Minimum size: 20 acres
2. Preference given to endangered or rare species
3. Watershed protection of lakes, rivers, streams (high priority)
4. Possible to expand n the future
5. Property must be dominated by natural systems

69
Fig. 4.4. Forest patches of different areas (less than 13ha, 13 – 49.99ha, and 50ha and greater) throughout the watershed
extent. Subsets indicate potential areas for increasing forest connectivity a/d) location in the southwestern portion of the
watershed near J. Frederick Hoffman Memorial Easement, b/e) section near Delphi near Mary I Gerard Nature
Preserve, and c/f) region in the eastern portion of the water shed with a large forest patch; a – c) show location of forest
patches and association with NICHES properties and stream location, d – f) show NAIP imagery of forest vegetation
and highlighted patches. Source: NLCD 2001 land cover data, NAIP imagery, and Indiana DNR/DFIRM.
*The Corridor Designer tool was used (http://corridordesign.org/) in order to determine forest patches. This tool used a
model to define forest patches of varying areas based on habitat suitability. In this case, suitable habitat was defined as
30% and greater forest cover.

70
Negative effects of patch size and isolation when patches were observed when forest
cover decreased to 10 – 30% cover (Andrén 1994); therefore, 30% and greater forest
cover was defined as suitable habitat. Ten to thirteen hectares has been noted to be a
threshold for the number of interior avian species present (McIntyre 1995), thus patches
were defined into 3 different size classes: less than 13ha, 13 – 49.99ha, and 50ha and
greater.
The three highlighted locations would be prime locations for acquiring land to allow
for connections between patches or expansion of patches to allow for more interior
habitat; however, locations would depend on what land can be feasibly acquired and
which landowners would be willing to donate land to easements.
A) Large patch of forest (1018ha) near J. Frederick Hoffman Memorial Easement
(Fig. 4.4a and 4.4d)
B) Large patch of forest (1253ha) near Mary I Gerard Nature Preserve (Fig. 4.4b and
4.4e)
C) A larger forest patch in the eastern portion of the watershed; less forest currently
exists in the eastern half of the watershed and addition to this region would allow
for increased riparian habitat and water quality protection (Fig. 4.4c and 4.4f).
Smaller patches surround the larger patch which could potentially be connected
given acquisition of such land.
Table 4.2. Area (in hectares and acres) for the different size categories of forest patches.
Patch Size Number of
Patches Total Hectares Total Acres
Less than 13ha 832 1,839.20 4,544.75
13 - 49.99ha 53 1,065.14 2,632.01
50ha and greater 29 3,649.11 9,017.11
Total: 914 6,553.45 16,193.87
B. Monitoring Process
For this alternative, the maintenance is low. The landowner may be required to
submit an annual or biannual survey of the land depending on his/her donation option,
and which organization the land was donated. The beginning of restoration through
NICHES may take work, but the longer the land is preserved, the less maintenance it will
require.

71
C. Timeline
We selected for 15% of the riparian habitat in the watershed (those that reside in the
floodplains) to be connected by the year 2027. While the percentage may seem small for
a 15 year timeline, establishment of forest cover takes time and effort.
D. Budget and Funding
These two programs are non-profit organizations, and also pay for
restoration/preservation of the property. This means that there is no immediate cost to
the donor (landowner). There may be, however, a financial limit to what the organization
can put forth towards the property.
-Objective 2: Increase wetland habitat by 100 acres by 2027.
Selected Alternative: Encourage land owners to volunteer their land to local
agencies (ex. Wetland Reserve Program) to restore and maintain wetlands within
the watershed.
A. What, When, How
Currently there are 1063.27 acres of wetlands in the Deer Creek- Sugar Creek
Watershed. Our goal is to increase that number to 1163.27 acres by 2027. When
considering other options, encouraging landowners enrolling in government agencies was
the best alternative. The Wetland Reserve Program (WRP) is a voluntary program for
landowners to offer their land in order to protect, restore, and enhance wetlands on their
property. This program is overseen and conducted through the USDA Natural Resources
Conservation Service (NRCS). The NRCS provides technical and financial support to
assist landowners with their wetland restoration project. The goal of this program is to
achieve optimal wetland functions and values, as well as provide the best wildlife habitat.
This is a long-term conservation and wildlife protection project for landowners to get
involved with.
Who qualifies: Land eligible for WRP must be restorable and suitable for wildlife
benefits. The includes: prior converted agricultural land with hydric soils, agriculture
lands substantially altered by flooding, wetlands previously restored under a Local, State,
or Federal program without permanent protection (NRCS 2012).

72
Figure 4.5: This map shows features of wetlands, lakes, ponds, streams and other water resources.
Hydric data is from soil data mart, wetland data is from Indiana map and geospatial data portal
B. Monitoring Process
It is the NRCS duty to manage and maintain the land enrolled in the program.
After the land has been restored to wetland habitat, it will be continually monitored and
maintained. It will be monitored to ensure native species are abundant and exotics have
not established on the land. It will also be monitored for species diversity and water
quality.
C. Timeline
Our goal is to restore 100 acres of wetland habitat by 2027. The actual timeline
will vary depending on funding and cooperation of the landowners. If adequate funds are
available, then wetlands will be restored in a shorter amount of time. Once the 15 years
has past, an analysis will be conducted to determine if the project succeeded and if more
acres will need to be restored.
D. Budget and Funding
The amount of funding will determine the budget of the project. The WRP
program offers three options for land owners. First is permanent easements, in which the
easement is attached to the property deed to ensure the future land owners will preserve
the wetland for generations. In this instance, the NRCS will pay 100 percent of the cost,
and the landowners receives a payment for a permanent easement which will be the lesser
or the geographical area rate cap or an amount offered by the landowner. Second is a 30
year-easement in which the NRCS pays 75 percent of what would be paid for permanent
easement and 75 percent of the restoration costs. Third is a 10-year restoration cost-share

73
agreement in which the NRCS pays up to 75 percent of the cost of restoration and no
easement is places on the property.
- Objective 3: Restore native grasslands by introducing 450 acres of grassland by
the year 2027.
Selected Alternative: Encourage land owners to enroll in government
programs (ex. Grassland Reserve Program) to conserve or restore grasslands.
A. What, When, How
Currently, there are 2507.72 acres (1.04 %) of grassland in the Deer Creek- Sugar
Creek watershed. Our goal is to increase that number to 2957.72 acres (1.23 %) by 2027.
What: The Grassland Reserve Program (GRP) is a voluntary program for landowners to
offer their land in order to protect, restore, and enhance grassland including rangeland,
pastureland, shrub land and certain other lands on their property. This program is
overseen and conducted through the USDA NRCS and Farm Service Agency. The goal
of this program is to protect valuable grasslands from conversion to cropland or other
uses.
Fig. 4.6. Extent of grassland land use, NICHES properties, and Indiana DNR managed lands in the watershed.
Locations of potential grassland preservation or restoration a) near Prophetstown, b) near Delphi and the Mary I Gerard
Nature Preserve and c) in the southern portion of the watershed near Eller Pond. Source: NLCD 2001 land cover data,
Indiana DNR, and NICHES.
The three highlighted locations would be prime locations that would allow for more
continuous habitat and addition to currently preserved sites; however, location of new
grassland preserved sites or restoration would be dependent on which landowners would

74
be willing to participate in the Grassland Reserve Program or put land in easement and
allow for restoration efforts.
A) Prophetstown currently holds and manages patches of grassland. Additional patches
are located around the management boundary for Prophetstown (Fig. 4.6a).
B) Large patches of grassland are located in this region; a NICHES site is located to the
north of some of the largest grassland patches (Fig. 4.6b).
C) Sparse grassland areas are located near Eller Pond, a site managed by the Indiana
DNR (Fig. 4.6c).
Who qualifies: There is no minimum or maximum amount of land the participant
may offer to be enrolled in the program. Eligible land includes: privately owned lands
and grassland for which grazing is the leading use, (or) land located in an area that has
been historically dominated by grasslands that are compatible with grazing uses, and land
that has potential to provide habitat for animal or plant populations of significant
ecological value if the land is retained.
There are four types of enrollment options for land owners. A rental contract for
10, 15, or 20 year duration, permanent easement held by the United States, restoration
cost-share agreement, and cooperative agreement with eligible entity holding permanent
easements (USDA 2011).
B. Monitoring Process
It is the NRCS duty to manage and maintain the land enrolled in the program.
After the land has been restored to grassland, it will be continually monitored and
maintained. It will be monitored to ensure native species are abundant and exotics have
not established on the land. It will also be monitored for species diversity.
C. Timeline
Our goal is to introduce 450 acres of grassland in the first 15 years. This means
every year at least 30 acres will need to be established. The amount participants and
funds will determine the actual length of the project. If adequate amounts are met, the
acres restored will be restored in a shorter amount of time. Once the 15 years has past, an
analysis will be conducted to determine if the project succeeded and if more acres will
need to be introduced.
D. Budget and Funding
In many cases, the funding provided through GRP leverages landowner donations,
local government monies, and non-governmental contributions to preserve current land
use in grazing. Permanent easements option will pay equal the fair market value. With the
rental agreement option, USDA will provide up to 75 percent of the grazing value of the
land covered by the agreement for the life of the agreement. If the land is able to be
restored to grassland habitat, 90 percent of the restoration costs for land that has never

75
been cultivated will be provided or up to 75 percent of the cost on restored grasslands.
USDA covers all survey and monitoring costs, title insurance, and recording fees.
- Objective 4: Increase the amount of native vegetation along floodplains by 40%
by 2027.
Selected Alternative: Encourage landowner to reduce runoff into streams by
increasing the amount of vegetation along floodplains (implementation of
BMPs).
A. What, When, How
Floodplains are defined as a natural feature of rivers and streams. They are
considered the flat land that runs adjacent to the waterway in question. The soil is
usually a mixture between sand and mud. Floodplains are important for reducing floods,
but they also provide habitat for a diverse number of animal species (riparian habitat)
(CEES, IUPUI). We suggest that reducing agricultural runoff and sedimentation in
streams will improve water quality, and allow for direct enhancement of diversity of
aquatic species (where these species can establish and thrive. This will allow waterways
in the watershed to thrive not only ecologically, but recreationally as well.

76
Fig. 4.7. Land cover on floodplain for the watershed extent. Potential locations of concern are located a/d)
southwest of Delphi, b/e) near an airport in the southeastern section of the watershed, and c/f) the eastern
most stream in the watershed extent; a – c) show land cover type on the floodplain, d – f) show NAIP
imagery of vegetation in the floodplain outline. Source: NLCD 2001 land cover data, NAIP imagery, and
Indiana DNR/DFIRM.

77
The three highlighted locations would be prime locations for planting vegetation or
implementing filter strips; however, this would depend on the landowner’s willingness to
adopt such BMPs as well as likelihood of runoff (amount of fertilizer applied on fields,
slope of field, and conservation tillage practices).
A) Large section of floodplain that is mostly in agricultural land use. A thin line of trees
(Fig. 4.7d) is located along the stream; however, most land in this region beyond a
small riparian strip is agricultural.
B) A section in the central portion of the watershed where many water quality issues and
concerns were expressed by stakeholders. Vegetation is sparse and a large portion of
the floodplain region is agricultural (Fig. 4.7e)
C) Little vegetation is located in the headwaters on the eastern edge of the watershed.
Riparian vegetation (Fig. 4.7f) is sparse and thin along the stream and land use is
almost ubiquitously agricultural beyond the thin vegetation strips.
*The floodplain in the watershed extent was determined to consist of 36.5% vegetated
land uses (deciduous forest, shrub/scrub, grassland/herbaceous, pasture/hay, woody
wetlands, emergent herbaceous wetlands).
This will be achieved through establishment of conservation buffers.
Conservation buffers can be filter strips that run along field borders, or water bodies.
These strips can be can be a combination of native vegetation of either grasses, shrubs or
trees. The establishment of vegetation can be slow runoff because root systems can allow
for water to penetrate the soil, and lessen the amount of impervious surfaces. These
buffers can be up to 100 feet wide, but we recommend strips of 50 feet. When these
buffers are properly installed, they can remove 50% or more of the contaminants
contained in effluent (Thom 2001). Filter strips established on agricultural fields can also
contribute to the increase of native vegetation due to the fact that filter strips will also
decrease agricultural runoff.
Conservation buffer installment is considered to be a best management practice
(BMP). BMPs are part of a program called a cost-share program. Cost-share programs
partially fund landowners and farmers to establish these BMPs on their land for
ecological and financial incentives. This is a way for landowners, who wish to be more
environmentally friendly, to afford to establishing ecological practices on their land.
There are several cost-share programs that fund specific BMPs for various activities. For
this objective, we recommend either the Wildlife Habitat Incentive Program (WHIP)
which aid landowners to promote habitat for wildlife private land. Land is usually
enrolled in this cost-share for 5-10 years (NRCS, WHIP). The other cost-share program
that may be considered is Environmental Quality Incentive Program (EQIP), which
funds, among other practices, wildlife habitat enhancement in the form of stream buffers.
78
B. Monitoring Process
Maintenance for our objective will vary depending on what type of habitat and
vegetation is assigned to each specific piece of land donated to these cost share programs.
Each cost-share program is in place for the land for at least 5-10 years, in which
landowner can receive funding to continue establishment and maintenance of their land.
C. Timeline
The timeline for this alternative will be to increase the amount of native
vegetation by 40% by the year of 2027. To meet a halfway point, we recommend that the
amount of vegetation established by 2017 (after approximately 5 years) should be about
15%. During the first five years, financial aid for this project can be raised though
enrollment in BMPs as well as donations. The area to be covered will be extensive, and
covers a large portion of the watershed, but this will allow more area for aquatic species
to thrive.
D. Budget and Funding
As mentioned before, the establishment of conservation buffers along floodplains
is considered a BMP. Under the Federal Clean Water Act (section 319), the government
can provide funding for practices that aim to improve water quality by lowering the
impact of non-point pollution sources. By implementation of BMPs, to receive funding
the land must be entered into a cost-share program. After this has been done, it must be
submitted to the Indiana Department of Environmental Management (IDEM). The cost-
share program must be under the Section 319 (H) Program Development Guidelines. An
example will be listed in Appendix V. For the choice of EQIP, there is a form that list the
price caps for specific practices and establishment of specific vegetation. Landowners
may choose to have their land surveyed in order to determine the best vegetation to be
installed on the floodplains. Keep in mind that vegetation must be able to withstand
sandy soils. See Appendix VI for and example of pricing by EQIP. According to the
WHIP website, funding can cover up to 75% of the cost per acre of land to establish
stream buffers. As with EQIP, it would be an excellent idea to speak with natural
resource managers to determine the best type of vegetation to be established in the area.
See Appendix VII for an example of funding caps for specific vegetation installed for
these buffers. Full price sheets can be found on these programs’ websites.
Goal 3: Increase public awareness and involvement
- Objective 1: Inform 45% of the public of various federal and state
conservation programs by 2027.
Selected Alternative: Send surveys to residents of the watershed that will
locate the uninformed residents and target those stakeholders with
informational brochures.

79
A. What, When, How
We believe that sending surveys to residents and targeting the uninformed
stakeholders; we can produce a measurable method of educating the public. The surveys
will contain non-bias, unloaded, and measurable questions. There will be a specific
section decided to offering informational brochures to the stakeholders on what help they
can receive to give back to the environment through use of federal and state conservation
programs.
The start of sending these surveys and informational brochures should happen as soon
as funding received from IDEM's Section 319 or community foundations. This funding
will go towards communication methods of notifying the public release dates for surveys,
delivery methods, and materials. The informational brochure will focus on spreading the
word of available federal and state conservation programs. The brochure will list
coupons, new opportunities for participation, and how they can be part of a sustainable
world.
Informing the public of various conservation programs will be accomplished by use
of the informational brochure. The brochure will be available by funding donated from
private businesses in the community. Main source of funding will be applied for to the
federal government in the IDEM’s 319 programs, although we will push to collect as
many donations as possible.
B. Monitoring Process
The monitoring of the selected alternative will use nearly zero resources due to the
use of knowledgeable professionals who can keep an eye on the program. The
knowledgeable professionals will have up to date information on all local and state
conservation programs on the information brochures. Stakeholders will be able to ask any
questions they have about programs with use of electronic mail to these professionals
constructing the brochures. The first survey will gage how much of the residents in the
watershed will need to be educated and a second survey in 2027 will be taken. The
difference from these two surveys will show what percentages of the residents within the
watershed have been educated.
C. Timeline
As seen from above, the intent of informing 45% of the public should be
accomplished by the year 2027. The first couple of years will be utilized to access
funding and set up advertising, identifying the uninformed stakeholders, and producing
informational brochures. The rest of the 15 years will be used to targeting the uninformed
stakeholders and educating them on the various state and local conservation programs
available for them to utilize.

80
D. Budget and Funding
As mentioned before, funding will be found through applying to IDEM’s section 319
for aid. Other funding will be added from community foundations which are local
businesses donating for the benefit of the environment. We could also ask local
businesses to provide materials for the survey and delivering. The budget for this
implementation would be mostly devoted producing the surveys/information brochures,
delivery of survey/information brochures, and labor involved in creating the
survey/information brochures.
- Objective 2: Educate 50% of public on water quality concerns by 2027.
Selected Alternative: Start a sampling program for the watershed, and
encourage the public to volunteer to help.
A. What, When, How
By educating the public on water quality problems, they will be more willing to pitch
in time and effort in increasing the quality of the water by 2027. Increasing the public
awareness of water quality with in the watershed will greatly affect the conditions of
ecosystem. Stakeholders in the watershed will be able to notice the difference in their
area and invoke them to provide their involvement. Education for stakeholders will be in
the form of personal experience. By participating in sampling water quality the
stakeholders will be exposed to issues of the watershed. This would most likely shock the
stakeholders to ask others in their neighborhood to help as well. The results of the
sampling will be sent by electronic mail and posted on a home page under an adjacent
agency.
Sampling program for the watershed will be initiated in the first 2 years. Projections
for educating 30 percent of the public should happen in ten years (2018) and reach the
other 20 percent in the last 5 years. Sampling for the water quality should be bi-annually
to ensure accuracy. Water quality sampling should be accomplished by public volunteers,
which will reduce the cost of this program greatly. The specific dates for sampling water
quality bi-annually will be decided when all factors are taken in consideration about the
schedule of stakeholders.
Education of the public will allow the program to receive funding through IDEM’s
319 program. The cost to implement a sampling program will be minimal. With
volunteering from the public, the only major cost will be in materials and testing of water
quality. Another pathway of funding could come from private business donations.
Education on water quality issues could be through newsletters, fliers, or at the sampling
center.
B. Monitoring Process
The monitoring process of the sampling program and encouragement of public
involvement would be moderately intensive. The areas needing monitoring would
involve the sampling program and how many public stakeholders have been educated on

81
the water quality. Sampling program will monitor the water quality twice a year as stated
above. The percentage of stakeholders educated could be identified every 5 year intervals
to make sure progress is on schedule.
C. Timeline
As mentioned above, the projection of educating 50 percent of the public on water
quality by 2027 is the goal. The selected alternative of using a sampling program to
measure the water quality and encouraging the public to volunteer in the sampling will be
a bi-annual activity. A survey will be administrated at the beginning of this program, at
the ten year mark (2018), and at the end to determine how much of the public are
educated over the water quality.
D. Budget and Funding
The budget for this program will be mostly invested in the sampling program. There
will only be a moderate need of funding because of the bulk of the labor will be provided
by public volunteers. People will be willing to devote some time to this program because
of the close relation to the land. The rest of the funding will be from donations of
corporations that need the good public relations.
- Objective 3: Inform 50% of public of personal opportunities by 2027.
Selected Alternative: Issue a non-profit seasonal newsletter describing ways
individuals can help to improve water quality and sustainability within the
watershed.
A. What, When, How
This objective intends to inform 50 percent of the public of opportunities they can
utilize to improve their watershed. The objective plans to do so by issuing a non-profit
seasonal newsletter. The seasonal newsletter will contain current or up coming events in
which they can volunteer. Also with in the newsletter will be topics such as sustainability
and improving water quality. These two topics will provide opportunities for the public
that would include discounts or coupons for items promoting sustainability and better
water quality.
The non-profit newsletter will attack the issue of reaching the audience intended. An
electronic newsletter will be established to reach stakeholders that have access to the
internet. An electronic newsletter would be functional and be available with in the first
year. The paper form of a newsletter will take up to two or three years before printing.
Relations with local news printers will have to be available to reduce the cost of
producing a paper form. These local news organizations will have to be willing to donate
time for printing of the newsletter 4 times a year. One issue per season is the
recommended amount to inform the public of opportunities.

82
Informing the public of various personal opportunities will be accomplished by use of
the internet and transportation for the paper version. A lot of the cost associated for fuel
and electronic design will come from government aid or private sector donation.
Government aid for educating the public would come from an IDEM 319 program.
B. Monitoring Process
Monitoring the effectiveness of the newsletter will be done by including a survey that
measures the knowledge of the public. Another way to monitor the awareness of the
public is keeping track of how many items in the magazine are sold. There will be a
positive correlation in public awareness and sells of items in the magazine, which would
show a growth in awareness. Also by seeing an increase in public involvement shows that
the newsletter is working as well.
C. Timeline
The timeline for this objective will start in 2012 and end in 2027. This 15 year
timeline allows the first five years (maximum) being dedicated to funding and starting up
of the program. There will be four newsletters per year. Seasons will be the topic for the
four newsletters.
D. Budget and Funding
The budget for informing the public by way of newsletter will based around obtaining
materials for the paper form, hiring a professional to create the electronic version, and
fuel to drop off the paper version. Most of the funding will come from IDEM 319
program as mention above. The IDEM 319 program funds programs that intend to
educate the public and implement these objectives. Other funding for this program would
be found from local businesses.
Goal 4: Increase Recreational Opportunities
- Objective 1: Add five public access points in the watershed by 2027.
Selected Alternative: Purchase land to provide public access points to
surface waters and ask landowners to donate land for public access
through conservation easements.
A. What, When, How
Canoeing and fishing appeared to be the most common recreational activities
highlighted by stakeholders at the October 2011 meeting likely due to Deer Creek and
Sugar Creek being the main natural features in the watershed and lack of large patches of

83
forest or grassland. Access is typically from private property or along state highways and
roads near bridges since there are no DNR public access sites within the watershed for
boating or canoeing on these streams (Carroll County Indiana 2012). For instance,
Sycamore Row is a commonly used access sites since it is an abandoned quarter mile
state highway. The creek accessible by a steep slope and there is potential for parking but
turning around is difficult. Eller Pond is the only public DNR site, which allows fishing,
boating/canoeing, and hunting (Archibald 2005). Therefore, utilizing existing parks and
public locations to enable, encourage, and better establish public access in these areas
was viewed as an accessible and lower cost option. Currently, such options are not easily
available to the watershed residents at large since such sites are not officially established
and there is some difficulty with access. In addition, deterioration of natural areas due to
public access is also a valid concern and establishing permanent public access sites may
protect areas where concern exists regarding effects of public access (i.e., erosion from
walking down steep slopes to access waters or trampling of native vegetation).
Implementation would include an assessment of the current publicly held lands that
could be utilized as public access sites or are currently used by citizens yet are not
established as official public access sites. Following determination of these locations,
additional public access sites may be desired (particularly in different regions of the
watershed or at unique and scenic areas). Landowners would be asked if they would like
to contribute lands to a conservation easement (would involve working with a land trust
such as NICHES) with a highlighted status as a public access site.
B. Monitoring Process
Measurement of the impacts of those recreating within in first few years of public
access establishment (i.e., compaction or erosion) would be necessary to determine if any
other measures (i.e., fencing, soil stabilization, etc.) would be required to maintain
ecological integrity. In addition, sign-in books could be temporarily attached to the
established signage to determine the amount of use by residents in the watershed. Along
with water quality monitoring efforts, some monitoring of stream flow beyond the USGS
gauge station near Delphi may be considered, particularly when siting public access sites
for canoeing. Stakeholders had noted issues with safety and canoeing in low flow periods
C. Timeline
As soon as possible, determination of existing public sites (i.e., abandoned highways,
county parks, etc.) that could potentially be suitable for use a public access sites would
occur. Fundraising for access site improvements would be completed according to
timeline outlined in goal 4 objective 2. By 2017, improvements would be made at these
sites to indicate them as public access sites and to increase accessibility. Subsequently,
landowners would be asked to donate land as conservation easements to serve as the
remaining public access sites to reach the goal of five public access sites by 2027.
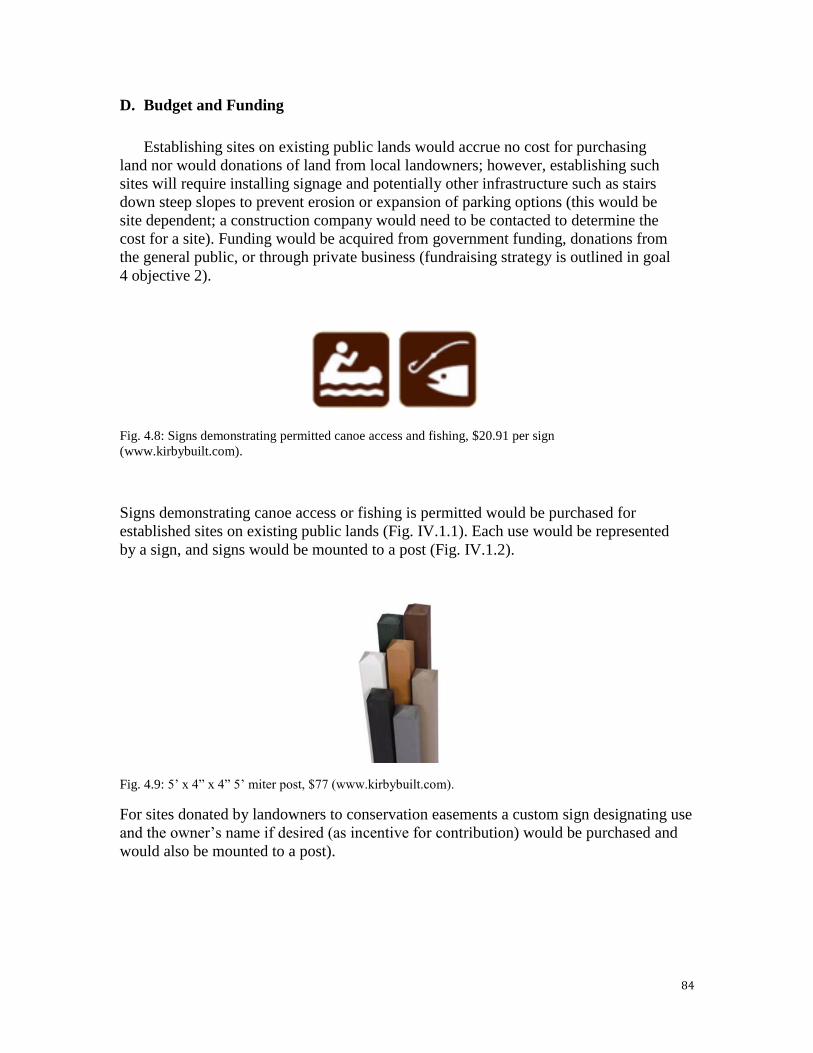
84
D. Budget and Funding
Establishing sites on existing public lands would accrue no cost for purchasing
land nor would donations of land from local landowners; however, establishing such
sites will require installing signage and potentially other infrastructure such as stairs
down steep slopes to prevent erosion or expansion of parking options (this would be
site dependent; a construction company would need to be contacted to determine the
cost for a site). Funding would be acquired from government funding, donations from
the general public, or through private business (fundraising strategy is outlined in goal
4 objective 2).
Fig. 4.8: Signs demonstrating permitted canoe access and fishing, $20.91 per sign
(www.kirbybuilt.com).
Signs demonstrating canoe access or fishing is permitted would be purchased for
established sites on existing public lands (Fig. IV.1.1). Each use would be represented
by a sign, and signs would be mounted to a post (Fig. IV.1.2).
Fig. 4.9: 5’ x 4” x 4” 5’ miter post, $77 (www.kirbybuilt.com).
For sites donated by landowners to conservation easements a custom sign designating use
and the owner’s name if desired (as incentive for contribution) would be purchased and
would also be mounted to a post).

85
Fig. 4.10: Example of single-sided custom engraved sign (18” x 24” single-sided custom engraved sign
$158; www.kirbybuilt..com)
- Objective 2: Increase amenities such as benches and restrooms in existing parks
and recreation sites by 20% by 2027. Selected Alternative: Combine funding from the local government with
donations made by both the public and private businesses to build more
amenities.
A. What, When, How
We believe by adding amenities such as benches, picnic tables, restrooms and trash
receptacles, we can create a more enjoyable experience for those who visit the current
parks and public access areas. The additional amenities could enlarge the capacity of the
recreational grounds and encourage more people to visit while still ensuring a clean,
relaxing environment within the park.
Starting as soon as possible, a marketing team should be created to produce fliers,
posters, or any other type of advertisement that informs the public about the need to raise
funds to purchase additional amenities in existing parks. This team can consist of current
park employees, members of local communities or volunteers willing to work on this
project. A 15 year time line was assigned to this objective, with the first 5 years as the
initiative stage where funds should be raised to initiate the project, and we thought funds
should be able to cover expenses for at least a 5% increase in amenities. The next 5 years
would be the implementation stage where the amenities are purchased and installed in
place using the existing funds. Additional funds could also be raised in this period given
that funding was limited during the previous stage. The last 5 years would be used to
continue fund raising and installation of amenities until our goal of 20% more amenities
is matched. If it is already matched, then we will use the final 5 years for maintenance of
the amenities.
We will meet the financial requirements through three different pathways. The
first one will be through government funding. The DNR (Department of Natural
Resources) has information on parks and reservoirs within Indiana as well as funding
opportunities. Contact information can be found at: http://www.in.gov/dnr/parklake/2392.htm. The second pathway is through donations by

86
the general public. Fund raising activities could be held on current recreation sites and
visitors could be encouraged to donate in order to help make the site more enjoyable.
There could be incentives to thank the donors such as setting up signs display their
names. The last one would be asking private businesses to pay for the amenities in
exchange for advertising their companies’ name on the amenities. We believe the
majority of funding will come through this third method and our marketing team should
put more effort in reaching out to private businesses. The personnel involved in
organizing these events could be current park rangers, local community groups, or groups
of volunteers. Each group involved should be clear of their duties and cooperate with
other groups to ensure that the plan runs smoothly.
B. Monitoring Process
The monitoring process of this alternative requires comparatively less resources. We
need to ensure the proper installation of the amenities at the time of the implementation,
and then the monitoring process could be done through routine park inspections and
public supervision. By public supervision, we mean that we could provide suggestion
boxes around the park or provide a phone-number for concerns and complaints.
C. Timeline
Like mentioned above, we set a 15 year timeline to meet our objective of increasing
amenities by 20% by the year 2027. Starting in 2012, the first 5 years will be used to
initiate the plan by securing funds and financial aid enough to purchase an amount of
amenities equal to 5% of the current amenities. From 2017 to 2022, our plan is to raise
funds in order to increase the current amenities up to 115%. From 2022 to 2027, we will
attempt to achieve our objective of 120% amenities.
D. Budget and Funding
Like mentioned above, funding should be met through three pathways: Government
aid, general public donations and private business donations. We researched several
companies that sell park amenities and decided to average the prices advertised on their
websites in order to form a budget. In terms of choosing products, we took into account
the durability and environmental friendliness of the materials used, so this may be a
reason why our budget is quite high since we want to purchase products that can be used
throughout our timeline and require minimal maintenance.

87
The companies we chose were:
1. The Bench Factory, http://www.thebenchfactory.com/
2. Belson Outdoors, http://www.belson.com/benches.htm
3. Global Industrial, http://www.globalindustrial.com/c/office/outdoor-furniture
4. Romtec Pre-engineered buildings, http://www.romtec.com/restrooms
The average price of a recycled plastic park bench was: $400
(www.belson.com)
The average price of a recycled plastic picnic table was: $800
(www.belson.com)
The average price of a recycled plastic trash receptacle was: $300

88
(www.belson.com)
The average price of a portable restroom was: $100/month
$1200/year$18,000/15 years (Source: Park spokeswoman of Montgomery
County).
The price of a permanent single-room restroom would be approximately $35,000.
(www.romtec.com)
(Prices all varied with the size and amount of products purchased)
If we increased amenities at an existing site by 2 new benches, 1 new picnic table,
2 new trash receptacles and 1 portable restroom, the estimated total cost would then be:
$20,200 for one site. Currently, the biggest park within the watershed is Prophetstown
State Park, and only this park would require an increase of this amount. Other
recreational sires in the watershed may require fewer amenities, maybe just adding a
picnic table or a trash receptacle would be adequate, so the cost would be reduced. If
stakeholders chose to build a permanent restroom, the costs would then rise.

89
- Objective 3: Establish 20% more miles of walking and biking trails throughout
the watershed by 2027.
Selected Alternative: Try to find funding through the government, private
business donations, grants and public donations.
A. What, When, How
Adding walking and biking trails to natural areas will help increase public interest
and involvement in the preservation of natural resources. The more the community cares
and knows about a resource, the better the chances of preserving that resource are. Many
of the people in this watershed already enjoy activities that involve the outdoors and the
easier it is to access and enjoy these natural places the better it will be for the populace.
The chosen alternative for achieving the goal of adding walking and biking trails is to
try to find funding through the government, private business donations, grants and public
donations. The timeline was broken down about and is over a 15 year period. The
implementation of this project will take place in three 5 year stages and is further
explained in the timeline section below.
Where these trails will be added depends on several factors. Population density,
locations of current trails and recreational facilities, and where scenic natural areas exist
were the factors involved in planning where to put these new trails. Figure 1 shows the
existence of current trails, proposed sites of new trails, recreational sites and landcover.

90
Figure 4.11: Landcover, trails and recreational areas are shown. The recreational sites include outdoor
recreational sites and does not include private recreational sites that are not open to the public
(IndianaMap).
B. Monitoring Process
The monitoring process for this alternative will include a few steps. The monitoring
of the trails can be done with volunteer trail monitors and maintenance volunteers and by
park employees. The monitoring of the condition of the trails can be monitored both by
volunteer monitors who routinely check the trails and inform park employees of any
issues and by the park employees themselves. Maintenance of the trails can also be done
by volunteer trail maintenance members and by park employees. Other parks have
volunteer maintenance and monitoring crews and it is a method that saves money and
allows citizens to be more involved in their community. Fairfax County in Virginia uses
volunteer monitoring and has much success with the program (Fairfax County). East Bay
Regional Park District in California has a volunteer maintenance program and has
experienced success with this (EBCD). Other places that have volunteer monitoring and
maintenance program success indicate that this method may be both low-cost, effective
and works well to involve those from the community.
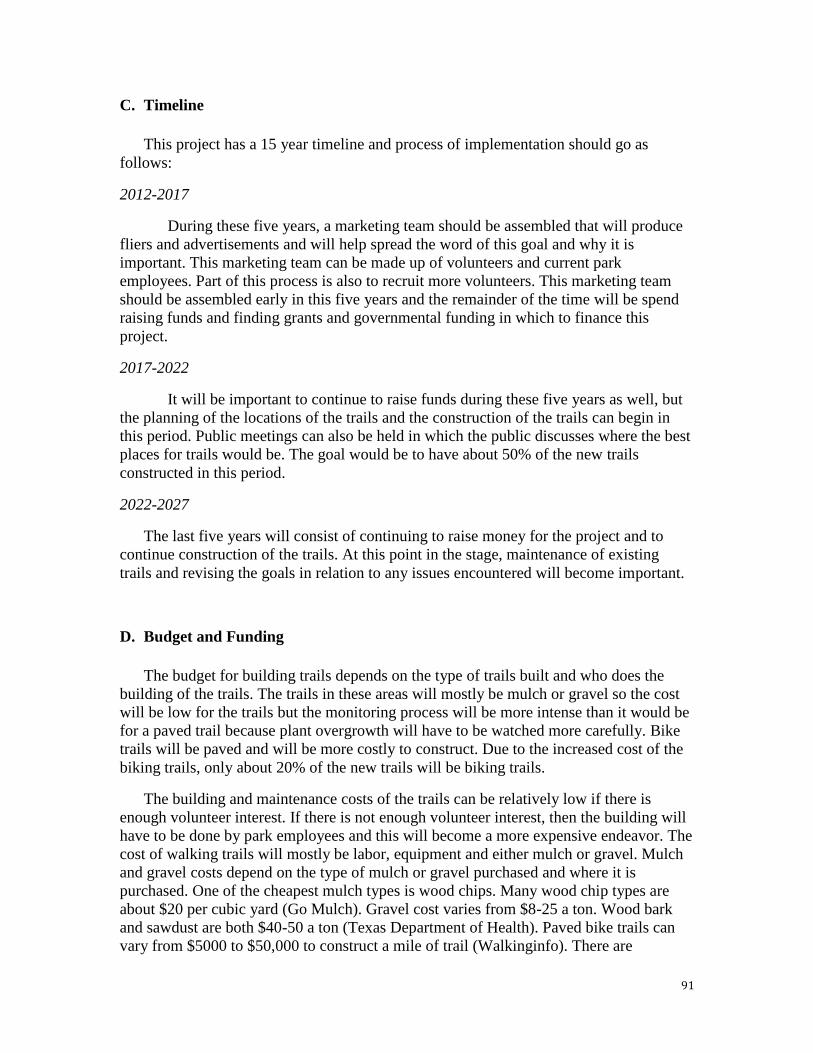
91
C. Timeline
This project has a 15 year timeline and process of implementation should go as
follows:
2012-2017
During these five years, a marketing team should be assembled that will produce
fliers and advertisements and will help spread the word of this goal and why it is
important. This marketing team can be made up of volunteers and current park
employees. Part of this process is also to recruit more volunteers. This marketing team
should be assembled early in this five years and the remainder of the time will be spend
raising funds and finding grants and governmental funding in which to finance this
project.
2017-2022
It will be important to continue to raise funds during these five years as well, but
the planning of the locations of the trails and the construction of the trails can begin in
this period. Public meetings can also be held in which the public discusses where the best
places for trails would be. The goal would be to have about 50% of the new trails
constructed in this period.
2022-2027
The last five years will consist of continuing to raise money for the project and to
continue construction of the trails. At this point in the stage, maintenance of existing
trails and revising the goals in relation to any issues encountered will become important.
D. Budget and Funding
The budget for building trails depends on the type of trails built and who does the
building of the trails. The trails in these areas will mostly be mulch or gravel so the cost
will be low for the trails but the monitoring process will be more intense than it would be
for a paved trail because plant overgrowth will have to be watched more carefully. Bike
trails will be paved and will be more costly to construct. Due to the increased cost of the
biking trails, only about 20% of the new trails will be biking trails.
The building and maintenance costs of the trails can be relatively low if there is
enough volunteer interest. If there is not enough volunteer interest, then the building will
have to be done by park employees and this will become a more expensive endeavor. The
cost of walking trails will mostly be labor, equipment and either mulch or gravel. Mulch
and gravel costs depend on the type of mulch or gravel purchased and where it is
purchased. One of the cheapest mulch types is wood chips. Many wood chip types are
about $20 per cubic yard (Go Mulch). Gravel cost varies from $8-25 a ton. Wood bark
and sawdust are both $40-50 a ton (Texas Department of Health). Paved bike trails can
vary from $5000 to $50,000 to construct a mile of trail (Walkinginfo). There are

92
approximately 27.5 miles of existing trails in this watershed (IndianaMap). This means
that a total of 5.5 miles of trail will be added to this area with 4.5 miles of the additional
trails being mulch or gravel walking trails and 1.0 miles of the additional trails being
paved bike trails. This would make the total cost for the mile of paved bike trail between
$5000-$50,000. The walking trails could be built with varying types of mulch, wood
chips or gravel and this would impact the cost.
Funding for this project will be done in many ways. First, governmental funding
will be sought. Donations from private business owners will also be sought and can be
encouraged by placing plaques or by some other means of letting the community know
that the business donated thereby making the business look good. Grants for building
trails, such as the National Trails fund, which gives out awards of $500-5000 can also be
sought (National Trails Fund). Public funding and donations will also be important for
this project.

93
Section 5: Appendix
Appendix I. Deer and Sugar Creek Watershed Management Plan Meeting
(Fall 2011)
Public Meeting Final Report
Freeland/Gall/Eitrem Holmgren/Kalcic/Shoaf
FNR 573, Linda Prokopy
November 11, 2011
The Deer and Sugar Creek watershed management plan meeting was held at the Flora 4-H Building in Flora, IN on October 19, 2011. The comments gathered during the meeting were comprised of stakeholder input from table discussions, questionnaires and a brief survey. 22 stakeholders attended from various counties in or around the watershed, and 13 Purdue graduate students facilitated discussion at multiple tables and collected information recorded on paper table cloths and post-meeting evaluations. Each section of this report is built around a common theme
or aspect of the meeting. Qualitative responses are included at the end of the report, which provide an in depth analysis of stakeholder input gathered during the meeting.
Meeting Purpose/Logistics
Many stakeholders mentioned that the purpose of the meeting (to gather information) was stated clearly by Sara Peel and Margaret Kalcic. Most everyone enjoyed the food and seemed to appreciate the opportunity to have dinner before engaging in discussion. The informal setting and environment allowed for relaxed conversation between stakeholders before any discussion/information gathering. The Flora 4-H Building seemed to be a good location because most of the stakeholders present were from Flora or Delphi, but the acoustics of the building proved to be noisy, which frustrated many who attended (including students). The date of the meeting (October 19, 2011) was not ideal considering that it coincided with harvest, but the rain prevented the farmers from working in the fields and allowed them to attend the meeting. Several stakeholders mentioned that the rain increased the attendance of farmers.
Watershed Use
Most stakeholders explained that they use the watershed for general recreation and water sports such as kayaking, canoeing, and hiking. Others live in or around the watershed; whereas, others farm in or around the watershed. Some aspects of watershed use discussed by farmers were problem-related issues such as drainage and flooding caused by deteriorated or inadequate drainage tiles. A few

94
stakeholders remarked that, in addition, to these uses that they valued the aesthetic beauty of the watershed, and that valuing the beauty of the watershed was sufficient “use.” Several stakeholders mentioned that Delphi had the most watershed-related recreational opportunities, along with a section of Deer Creek east of Camden, or near Wildcat Creek to the south.
Watershed Quality
Several stakeholders mentioned that although they believed the quality of the watershed is high, there seems to be less volume, or “low flow,” in Deer Creek compared to 5-10 years ago, which equals less run-off moving downstream. One stakeholder claimed she would not wade in Deer Creek because of low water flow creating elevated contaminants levels. She has, therefore, been concerned about potential health risks related to human consumption of fish in this area. Other stakeholders mentioned increased water flow in Deer Creek. Agricultural drainage was also a concern, especially waste from pig farms. Several stakeholders mentioned that the yellow appearance of Deer Creek after rains worried them, but they were unsure as to the direct cause of this appearance.
Watershed Problems
Flooding and erosion were the primary problems mentioned throughout the meeting. Lack of buffers and filter strips were mentioned as problem sources, but the cost of filter strips would likely limit implementation. Dredging occurring on Deer Creek was a concern of several stakeholders. Agricultural run-off was another problem mentioned, particularly from confined animal-feeding operations. Illegal septic tanks and overflow issues were also of concern to several stakeholders due to possible risks associated with E. coli. Others mentioned deteriorated infrastructure near Deer Creek and in Delphi as problem sources. Lack of signage for historical sites and Sugar Creek were problems mentioned by a couple of stakeholders. Several stakeholders added that the upcoming Hoosier Heartland Highway project might be a problem for the watershed. The spraying of insecticides on woodlot edges near Deer Creek has been attributed to a decrease in biodiversity, especially in fish and frog populations. An area north of Flora once considered a desired fishing location 15 years ago is now undesirable because of over-spraying of these insecticides reducing fish populations. Several stakeholders mentioned the hand-dug wells in the German-Baptist communities as areas of concern due to agricultural runoff/groundwater contamination because many of the wells might be too shallow. One stakeholder mentioned that he conducted water sampling/testing south of Galveston, and that there were issues in this area related to nutrient loading and runoff from agriculture that can lead to hypoxia in the Gulf of Mexico.
Watershed Solutions
Creating more drainage by increasing quantity and size of tile drains in fields was one solution proposed. Adding buffer and filter strips when/if economically feasible would be another solution. Increased water monitoring/testing at various locations

95
in the watershed was mentioned as a possible solution to test watershed quality and to identify sources/causes of pollution/erosion. Several stakeholders mentioned that increased awareness/education about the watershed regarding soil quality and how to maintain/improve the quality would be beneficial. Grant money should be made available for the general public, especially for engineering/development-related costs. Several stakeholders mentioned they were willing to invest personal time in projects; such as, tile drain installation if engineering/development-related costs could be covered by grants. More input from the German-Baptist communities in addition with independent monitoring/testing would be valuable to determine the water quality of hand-dug wells.
Stakeholder Participation
The general consensus from all students and stakeholder feedback was that the public meeting was inclusive and that all stakeholders present had an opportunity to provide input in a comfortable, non-threatening format. Several students commented that there was a lack of diversity at individual tables, which might have led to “one-sided” conversations. Conversely, each table seemed to yield rich, detail-specific conversation because many stakeholders were familiar and comfortable discussing topics/ideas with one another. Many individuals represent multiple stakeholder groups; so, the actual depth and diversity of stakeholder input might actually be diverse and substantial. There were no instances of inappropriate comments or argumentative discussion reported.
Map Activity
The map activity seemed to be well received by all stakeholders. Students and stakeholders commented that the map activity increased conversation and broadened the scope of discussion at most tables.
Meeting Expectations/Participant Satisfaction
The stakeholders present generally appeared to be satisfied and their expectations seemed to be met in that most stakeholders understood the purpose of the meeting. Most stakeholders wanted to gather information about watershed plan/grant, and they also wanted to learn about problems and solutions in order to improve the overall quality of the watershed. Additionally, several stakeholders expressed that they had no expectations.
Beneficial Information Learned by Stakeholders
Several stakeholders commented that they learned more about the purpose of watershed/grant study. They learned more about the process of obtaining grant money for local projects. Others commented that the meeting provided an opportunity to hear various concerns about the watershed and share agricultural information from different perspectives.

96
Topics/Issues Stakeholders Wanted to Discuss
Stakeholders wanted to discuss potential areas for water sampling; as well as, suggested areas for buffering and filter strips. Others wanted more information about specific areas of concern for watershed management, especially related to flooding/drainage/erosion issues. Several stakeholders mentioned that more detail on the maps (e.g., county roads) would have been helpful in order to provide more detailed input regarding flooding and erosion concerns. The effect of the Hoosier Heartland Highway project on the watershed was a topic many stakeholders wanted to discuss. Others mentioned that the perspective/input from a local historian regarding historical site preservation would have been valued/appreciated. The lack of, or lack of access to, recreation sites in/around the watershed were topics of interest for several stakeholders.
Comments/Suggestions
Stakeholders mentioned that while they were happy with the attendance, more attendance would have been valuable to gain diverse input/information. Most everyone enjoyed the food and appreciated the format of the meeting. Most everyone appreciated and enjoyed the opportunity to discuss the watershed with the understanding that their input/values were respected and documented. Most stakeholders did not express interest in being part of a steering committee.
Recommendations
The following recommendations were created from both the personal experiences of the students facilitating the watershed management meeting and from the interpretation of stakeholder comments:
Increased advertisement for the meeting as early as possible might have led to an increase in attendance, or least an increase in awareness of the meeting for the general public in/around the watershed. The format of the meeting seemed to work well with the time selected for the meeting (5-7 p.m.), considering that dinner was provided. Providing dinner seemed to increase the overall comfort and participation levels of most stakeholders before “official” watershed-related discussions began. Perhaps mixing up the seating for future meetings might provide additional insight and discussions that did not occur during this meeting. Selecting a different location for the meeting, reducing the overall noise (poor acoustics) of the building, or reconfiguring seating options might be beneficial and might foster more conversation between stakeholders who expressed having difficulties hearing during the meeting. Also, more consideration needs to be given to the stakeholders who may be in attendance. The time of the year (harvest) does not generally work for many farmers in the area and a fair amount of the population of the area is farmers. Had it not rained, there may not have been very many people in attendance. Also, not giving consideration to time/ seasonal constraints such as this could potentially alienate some of the stakeholders.

97
Appendices
Participant Evaluation from meeting
Graphical Summary of Information from the Evaluations
PUBLIC INPUT SESSION OCT 19th
Evaluation Form
1) How did you hear about tonight’s meeting?
(please circle all that apply)
E-mail Flyer Neighbor/Friend Newspaper Other:
2) How long have you lived in the area?
less than 1 year 1-5 years 5-10 years more than 10 years
3) Where do you live?
near Flora near Delphi near Lafayette near Galveston
4) How do you use the watershed?
5) What were you expectations of the meeting?
6) Do you feel your expectations were met?
7) Was there anything beneficial you learned during the meeting?
8) Overall, how satisfied were you with the meeting?
not satisfied somewhat satisfied very satisfied
9) Do you have any feedback on the meeting logistics (food, location, time, date)?

98
10) Is there anything you would have liked to see discussed tonight that didn’t get
covered?
11) Other comments/suggestions:
Thank you for taking your time!

99

100

101

102

103

104
Appendix II. Watershed Endangered Species List
Mammals
1. Bobcats (Lynx rufus)
No status federally
State species of special concern
Critically imperiled in state
2. Indiana Bats (Myotis sodalis)
Federally endangered
State endangered
Imperiled globally
3. American Bagers (Taxidea taxus)
State species of special concern
Widespread and abundant globally
Imperiled in state
4. Northern River Otter (Lutra canadensis)
State species of special concern
Widespread and abundant globally
Imperiled in state
5. Least Weasel (Mustela nivalis)
State species of special concern
Widespread and abundant globally
Imperiled in state
Birds
1. Bald Eagle (Haliaeetus leucocephalus)
Federally threatened
State endangered
Widespread and abundant globally
Imperiled in state
2. Barn Owl (Tyto alba)
State endangered
Widespread and abundant globally
Imperiled in state
3. Northern Harrier (Circus cyaneus)
State endangered
Widespread and abundant globally
Imperiled in state

105
4. Peregrine Falcon (Falco pergrinus)
State endangered
Widespread and abundant globally but with long term concerns
Imperiled in state
Reptiles
1. Butler’s Garter Snake (Thamnophis butleri)
State endangered
Widespread and abundant globally but with long term concerns
Critically imperiled by state
2. Blanding’s Turtle (Emydoidea blandingii)
State endangered
Widespread and abundant globally but with long term concerns
Imperiled in state
3. Western Ribbon Snake (Thamnophis proximus proximus)
State species of special concern
Widespread and abundant globally
Rare or uncomment in state
4. Spotted Turtle (Clemmys guttata)
State endangered
Widespread and abundant globally
Imperiled in state
5. Kirtland’s Snake (Clonophis kirtlandii)
State endangered
Imperiled globally
Imperiled in state
6. Eastern Massasauga (Sistrurus catenatus catenatus)
Federal candidate
State endangered
Rare or uncommon globally
Widespread and abundant globally but with long term concerns
Imperiled in state

106
Appendix III. Watershed Fish Species List (IDEM)
Rock Bass (Ambloplites rupestris)
Yellowbullhead (Ameiurus natalis)
Freshwater Drum (Aplodinotus grunniens)
Central Stoneroller (Campostoma anomalum)
River Carpsucker (Carpiodes carpio)
White Sucker (Catostomus commersoni)
Mottled Sculpin (Cottus bairdii)
Spotfin Shiner (Cyprinella spiloptera)
Stealcolor Shiner (Cyprinella whipplei)
Common Carp (Cyprinus carpio)
Gizzard Shad (Dorosoma cepedianum)
Silverjaw Minnow (Ericymba buccata)
Greenside Darter (Etheostoma blennioides)
Rainbow Darter (Etheostoma caeruleum)
Fantail Darter (Etheostoma flabellare)
Johnny Darter (Etheostoma nigrum)
Blackstripe Topminnow (Fundulus notatus)
Bigeye Chub (Hybopsis amblops)
Northern Hogsucker (Hypentelium nigricans)
Channel Catfish (Ictalurus punctatus)
Longnose Gar (Lepisosteus osseus)
Green Sunfish (Lepomis cyanellus)
Bluegill (Lepomis macrochirus)
Longear Sunfish (Lepomis megalotis)
Striped Shiner (Luxilus chrysocephalus)
Shoal Chub (Macrhybopsis hyostoma)
Smallmouth Bass (Micropterus dolomieu)
Largemouth Bass (Micropterus salmoides)
Silver Redhorse (Moxostoma anisurum)
Black Redhorse (Moxostoma duquesnei)
Golden Redhorse (Moxostoma erythrurum)
Shorthead Redhorse (Moxostoma macrolepidotum)
River Shiner (Notropis blennius)
Rosyface Shiner (Notropis rubellus)
Sand Shiner (Notropis stramineus)
Channel Shiner (Notropis wickliffi)
Mountain Madtom (Noturus eleutherus)
Stonecat (Noturus flavus)

107
Brindled Madtom (Noturus miurus)
Logperch (Percina caprodes)
Blackside Darter (Percina maculata)
Slenderhead Darter (Percina phoxocephala)
Dusky Darter (Percina sciera)
Suckermouth Minnow (Phenacobius mirabilis)
Southern Redbelly Dace (Phoxinus erythrogaster)
Bluntnose Minnow (Pimephales notatus)
Bullhead Minnow (Pimephales vigilax)
Flathead Catfish (Pylodictis olivaris)
Blacknose Dace (Rhinichthys obtusus)
Sauger (Sander canadensis)
Creek Chub (Semotilus atromaculatus)

108
Appendix IV. Watershed Nongame Aquatic Mussel Species List
Scientific Name Common Name
Actinonaias ligamentina mucket
Alasmidonta marginata elktoe
Alasmidonta viridis slippershell mussel
Amblema plicata threeridge
Anodontoides ferussacianus cylindrical papershell
Corbicula fluminea Asian clam
Elliptio dilatata Spike
Fusconaia flava Wabash pigtoe
Lampsilis cardium plain pocketbook
Lampsilis fasciola wavyrayed lampmussel
Lampsilis siliquoidea fatmucket
Lasmigona complanata white heelsplitter
Lasmigona compressa creek heelsplitter
Lasmigona costata flutedshell
Leptodea fragilis fragile papershell
Pleurobema sintoxia round pigtoe
Potamilus alatus pink heelsplitter
Ptychobranchus fasciolaris kidneyshell
Pyganodon grandis giant floater
Quadrula pustulosa pustulosa pimpleback
Quadrula quadrula mapleleaf
Strophitus undulatus creeper
Toxolasma lividus purple lilliput
Toxolasma parvus lilliput
Tritogonia verrucosa pistolgrip
Truncilla truncata deertoe
Utterbackia imbecillis paper pondshell
Villosa iris rainbow
Total Species 28

109
Appendix V. Checklist for IDEM Section 319 (H) Program Development Guidelines

110
Appendix VI. Example of Payment Rates and Guidelines of EQIP

111
Appendix VII. Example of Payment Rates and Guidelines of WHIP

112
Section 6: Literature Cited
ACRES Land Trust. ACRES preserves. Web.
<http://www.acreslandtrust.org/Preserves.>
Agriculture and Agri-Food Canada. Soil Layer Erodibility (K-factor). Web.
<http://nlwis-snite1.agr.gc.ca/apaq-aapq/doc/T28Erodib_e.pdf>
Andrén, H. 1994. Effects of habitat fragmentation on birds and mammals in landscapes
with different proportions of suitable habitat: a review. Oikos 71(3): 355 – 366.
Archibald, J. 2005. Eller Pond an oasis in the country. Carroll County Comet. Web.
<http://www. carrollcountycomet.com/news/2005-11-02/Local_News/073.html>
Bain M.B. and J.T. Finn. 1988. Streamflow regulation and fish community structure.
Ecology 69(2) 382-392
Bartram J., and R. Ballance. 1996. Water Quality Monitoring- A Practical Guide to the
Design and Implementation of Freshwater Quality Studies and Monitoring
Programmes. Ch. 13. United Nations Environmental Programme and the World
Health Organization. PDF
Bicycle Lanes. Walkinginfo. Web.
<http://www.walkinginfo.org/engineering/roadway-bicycle.cfm>
Burnett K. and D. Olson. 2010. Linked in: connecting riparian areas to support forest
biodiversity. Science Findings: Pacific Northwest Research Station (120)
Cannelton Pool | The Ohio River. The Ohio River. Web. <http://theohioriver.com/ohio-
river-anglers-notes/cannelton-pool/>
Canoeing and boating. Deer Creek. Carroll County Indiana. Web.
<http://www.carrollcounty indiana.com/index.php?option=com_content&view
=article&id=208&Itemid=157>
Climate Data Online. 2012. National Oceanic and Atmospheric Administration. Web.
<http://gis.ncdc.noaa.gov/map/cdo/>
Conservation Innovation Grants. Environmental Quality Incentives Program. NRCS
Web.
<http://www.nrcs.usda.gov/wps/portal/nrcs/detailfull/national/programs/financial/
eqip/>.

113
Conservation Reserve Program Overview. 2012. Conservation Programs. Farm Service
Agency USDA. Web.
<http://www.fsa.usda.gov/FSA/ webapp? area=home&subject=copr&topic=crp.>
Copeland, C. 2010. Animal waste and water quality: EPA regulation of concentration
animal feeding operations. Congressional Research Service 7-5700.
CorridorDesigner. 2007. CorridorDesigner toolbox. Web.
<http://www.corridordesign.org/downloads>
Deer Creek- Sugar Creek Watershed. WREC. Web.
< http://www.wabashriver.net/deer-creek-sugar-creek/>
Department of Environmental Services. Water testing guide. State of New Hampshire.
PDF.
Delphi Parks and Recreation. Recreation. Carroll County Portal. Web.
<http://www.carrollcountyindiana.com/index.php?option=com_content&view=art
icle&id=235&Itemid=167>
DNR: List of Endangered, Threatened, & Rare Species by County. IN.gov: Home. Web.
<http://www.in.gov/dnr/naturepreserve/4666.htm>
DNR: List of Endangered, Threatened, & Rare Species by County. IN.gov: Home. Web.
<http://www.in.gov/dnr/naturepreserve/4666.htm>
DNR: Parks & Reservoirs. IN.gov: Home. Web.
<http://www.in.gov/dnr/parklake/2392.htm>.
Ebner, P. 2007. CAFOs and public health: pathogens and manure. Purdue University
Extension ID-356.
Ecological and Interpretive Groups”. Natural Resources Conservation Service (NRCS).
Web.<http://soils.usda.gov/technical/handbook/contents/part622.html>
EPA. 1998. Climate change and Indiana. Office of Policy, EPA 236-F-98-007g.
EPA. 2009. Drainage. Ag 101. EPA. Web.
<http://www.epa.gov/oecaagct/ag101/cropdrainage.html>
EPA. 2010. Managing agricultural fertilizer application to prevent contamination of
drinking water. Source water protection practices bulletin. PDF
EPA. 2011. Ecoregions of Indiana and Ohio. Western Ecology Division. EPA. Web.
<http://www.epa.gov/wed/pages/ecoregions/ohin_eco.htm>.

114
EPA. Environmental Protection Agency. Web.
<http://www.epa.gov/wed/pages/ecoregions/ohin_eco.htm>.
Fahrig, L. 2003. Effects of habitat fragmentation on biodiversity. Annual Review of
Ecology, Evolution, and Systematics 34 (2003) 487-515
Fertilizer section: regulates the storage and distribution of commercial fertilizers in
Indiana. 2011. Office of the Indiana State Chemist. Web.
http://www.isco.purdue.edu/fertilizer/index_fert.htm
Fisher B.E., Wente S.P., Simon T.P., Spacie A. 1999. The Fishes of Tippecanoe County,
Indiana. Proceedings of the Indiana Academy of Science. Issue: Winter-Fall 1999.
Gregory,S.V., Swanson,F.J., McKee, W.A., Cummins K.W. 1991. An ecosystem
perspective of riparian zones. BioScience. Vol. 41 (8) 540-551
Harrison, J. D. 2004. Manure storage selection: process improvement for animal feeding
operations. Utah State University Extension AG/AWM-01-3.
Howard County Soil and Water Conservation District. 2005. Little Deer Creek
Headwaters watershed management plan. IDEM Contract No. ARN A305-3-669.
Hydric Soils - Introduction. NRCS Soils. Web.
<http://soils.usda.gov/use/hydric/intro.html>
Indiana Bat (Myotis sodalis)" USFWS. Web.
<http://www.fws.gov/midwest/Endangered/mammals/inba/index.html>.
Indiana Department of Environmental Management. Water Quality Targets. Web.
<http://www.in.gov/idem/6242.htm.>
Indiana Department of Natural Resources. 2001 – 2005. Non-game Mussel Collection
Summary.
Indiana Department of Natural Resources. 2005. Aquatic Invasive Species: Zebra
Mussel. DNR: Aquatic Invasive Species-Invertebrates. PDF.
Introduction to Natural Communities. Division of Forest and Lands. Web.
<http://www.nhdfl.org/about-forests-and-lands/bureaus/natural-heritage-
bureau/about-us/naturalcommunities.aspx>
Janssen, C., and P. Hill. 1994. What is conservation tillage? Conservation Tillage Series.
Cooperative Extensive Service. Purdue University.
Kansas Department of Wildlife and Parks. 2005. Rabbitsfoot Mussel Quadrula
cylindrical. Kansas Department of Wildlife, Paqrks and Tourism.

115
Lee, B., D. Jones, and H. Peterson. 2005. Septic system failure. Purdue Extension,
Publication HENV-1-W, Purdue University, IN.
Little Deer Creek Headwaters watershed management plan. 2005. Howard County Soil
and Water Conservation District. IDEM Contract No. ARN A305-3
Mays, J. W., Niyogi, D., and K. Scheeringa. 2009. An introduction to ENSO and its
impact on Indiana weather and climate. Indiana State Climate Office, West
Lafayette, IN.
McIntyre, N. E. 1995. Effects of forest patch size on avian diversity. Landscape Ecology
10(2):85-99.
Metal Park Benches. Park Benches. The Bench Factory. Web.
<http://www.thebenchfactory.com/>.
Musial P. 2002. Mulch Types: Advantages vs. Disadvantages: Cover all the bases when
choosing right mulch. Orlando Sentinel.
National Agriculture Imagery Program. 2010. Geospatial Data Gateway. Web.
<http://datagateway.nrcs.usda.gov/>
National Trails Fund. National Trails Fund. American Hiking Society. Web.
<http://www.americanhiking.org/our-work/national-trails-fund/>.
NICHES Land Trust. 2011. Our properties. Web.
http://www.nicheslandtrust.org/properties/
NRCS. 2012. Indiana Wetland Reserve Program. Web. < http://www.in.nrcs.usda.gov/
programs/WRP/WRPhomepage.html>
Official Soil Series Descriptions. USDA-NRCS Soil Survey Divison. Web.
<https://soilseries.sc.egov.usda.gov/osdname.asp>
Outdoor Recreation. Miami County Tourism. Web.
<http://enjoymiamicounty.org/outdoor-recreation/>
Page LM, Burr BM. Freshwater Fishes. Peterson Field Guides. Houghton Mifflin
Company. New York City, NY. 1991.
Park Benches | Outdoor Park Bench. Park Benches. Belson Outdoor. Web.
<http://www.belson.com/benches.htm>.
Park Furniture, Outdoor Furniture, Bicycle Racks. Outdoor Furniture and Equipment.
Global Industrial. Web.
<http://www.globalindustrial.com/c/office/outdoor-furniture>

116
Parks and Recreation. Cass County Visitor’s Bureau. Web.
<http://www.visit-casscounty.com/what-to-do/parks-and-recreation/>
The facts about E. coli. Pennsylvania Sea Grant. Web. PDF.
Prophetstown State Park. Parks and Recreation. Indiana Department of Natural
Resources. Division of State Parks and Recreation. Web.
<http://www.in.gov/dnr/parklake/2971.htm>
Rabalais, N. N., Turner, R. E., and D. Scavia. 2002. Beyond science into policy: Gulf of
Mexico hypoxia and the Mississippi River. Bioscience 52 (2): 129 – 141.
Ribaudo, M. O., J. Agapoff, and A. Cattaneo. 2003. Can EQIP be effective in helping
farmers meet manure management goals? American Agricultural Economics
Association Annual Meeting, Montreal, Canada.
Simplified Orders Key. Soil Science Division. University of Idaho. Web.
<http://soils.cals.uidaho.edu/soilorders/orders.htm>.
Smith, W.B., Vissage, J.S., Darr, D.R., Sheffield, R.M. 2001. Forest resources of the
United States, 1997. USDA Forest Service, General Technical Report NC-219.
Soil Formation and Classification. Soils Education. NRCS Soils. Web.
<http://soils.usda.gov/education/facts/formation.html>.
Soil Data Mart. NRCS. Web
<http://soildatamart.nrcs.usda.gov/SDM%20Web%20Application/default.aspx>
Spiehs, M. and S. Goyal. 2007. Best management practices for pathogen control in
manure management systems. University of Minnesota.
Statistics. 2012 Conservation Programs. Farm Service Agency USDA. Web.
<http://www.fsa.usda.gov/FSA/webapp? area=home&subject=copr&topic=rns-
css.>
Sutton, A., D. Jones, and K. Darr. 2007. What is a CFO, CAFO? Purdue Extension ID-
350.
Texas Department of Health. How to Build a Walking Trail. Community & Worksite
Wellness Program. PDF.
Tippecanoe County Health Department. 2012. Sewage Disposal. Web.
<http://www.tippecanoe.in. gov/health/division.asp?fDD=15-107>

117
Tormoehlen, B.; Gallion, J.; Schmidt, T.L. 2000. Forests of Indiana: A 1998 Overview.
United States Department of Agriculture Forest Service. Northeastern Area, State
and Private Forestry NA-TP-03-00
Trail Maintenance Volunteers | East Bay Regional Park District. East Bay Regional Park
District. Web.
<http://www.ebparks.org/getinvolved/volunteer/trail>
United States Department of Agriculture (USDA) Geology Data Layer. GeoSpatial Data
Gateway. Web.
<http://datagateway.nrcs.usda.gov/GDGOrder.aspx>
USDA. 2011. Grassland Reserve Program. Conservation Programs. <www.fsa.usda.
gov/FSA/webapp?area=home&subject=copr&topic=grp>
U.S. Fish and Wildlife Service. 2010. Rayed Bean (freshwater mussel). U.S. Fish and
Wildlife Endangered Species. PDF
USDA National Agricultural Statistics Service Cropland Data Layer. 2000 – 2011.
Published crop-specific data layer. Web.
<http://nassgeodata.gmu.edu/>
USDA Natural Resources Conservation Service. 1998. Manure management choices: for
Wisconsin dairy and beef cattle operations. University of Wisconsin Extension, Madison,
WI.
Various spatial data files. Various Organizations. IndianaMap. Web.
<http://indianamap.org/>
Volunteers: Park Monitor Program. Fairfax County, Virginia. Web.
<http://www.fairfaxcounty.gov/parks/volunteer/parkmonitors.htm>.
Vyn, T. J. 2006. Meeting the ethanol demand: consequences and compromises associated
with more corn on corn in Indiana. Purdue University, Purdue Extension ID-336.
WWF. 2012. Ecoregions. World Wildlife Fund.
<http://www.worldwildlife.org/science/ecoregions/item1847.html>