deeplog: anomaly detection and diagnosis from system logs ...€¦ · deeplog: anomaly detection...
TRANSCRIPT
DeepLog: Anomaly Detection and Diagnosis from System Logsthrough Deep Learning
Min Du, Feifei Li, Guineng Zheng, Vivek SrikumarSchool of Computing, University of Utah
{mind, lifeifei, guineng, svivek}@cs.utah.edu
ABSTRACTAnomaly detection is a critical step towards building a secure andtrustworthy system. �e primary purpose of a system log is torecord system states and signi�cant events at various critical pointsto help debug system failures and perform root cause analysis. Suchlog data is universally available in nearly all computer systems.Log data is an important and valuable resource for understandingsystem status and performance issues; therefore, the various sys-tem logs are naturally excellent source of information for onlinemonitoring and anomaly detection. We propose DeepLog, a deepneural network model utilizing Long Short-Term Memory (LSTM),to model a system log as a natural language sequence. �is allowsDeepLog to automatically learn log pa�erns from normal execution,and detect anomalies when log pa�erns deviate from the modeltrained from log data under normal execution. In addition, wedemonstrate how to incrementally update the DeepLog model inan online fashion so that it can adapt to new log pa�erns over time.Furthermore, DeepLog constructs work�ows from the underlyingsystem log so that once an anomaly is detected, users can diagnosethe detected anomaly and perform root cause analysis e�ectively.Extensive experimental evaluations over large log data have shownthat DeepLog has outperformed other existing log-based anomalydetection methods based on traditional data mining methodologies.
CCS CONCEPTS•Information systems→ Online analytical processing; •Securityand privacy→ Intrusion/anomaly detection and malware mitiga-tion;
KEYWORDSAnomaly detection; deep learning; log data analysis.
1 INTRODUCTIONAnomaly detection is an essential task towards building a secureand trustworthy computer system. As systems and applicationsget increasingly more complex than ever before, they are subjectto more bugs and vulnerabilities that an adversary may exploit tolaunch a�acks. Such a�acks are also ge�ing increasingly moresophisticated. As a result, anomaly detection has become more
Permission to make digital or hard copies of all or part of this work for personal orclassroom use is granted without fee provided that copies are not made or distributedfor pro�t or commercial advantage and that copies bear this notice and the full citationon the �rst page. Copyrights for components of this work owned by others than ACMmust be honored. Abstracting with credit is permi�ed. To copy otherwise, or republish,to post on servers or to redistribute to lists, requires prior speci�c permission and/or afee. Request permissions from [email protected]’17, Oct. 30–Nov. 3, 2017, Dallas, TX, USA.© 2017 ACM. ISBN 978-1-4503-4946-8/17/10. . .$15.00DOI: h�p://dx.doi.org/10.1145/3133956.3134015
challenging and many traditional anomaly detection methods basedon standard mining methodologies are no longer e�ective.
System logs record system states and signi�cant events at variouscritical points to help debug performance issues and failures, andperform root cause analysis. Such log data is universally availablein nearly all computer systems and is a valuable resource for un-derstanding system status. Furthermore, since system logs recordnoteworthy events as they occur from actively running processes,they are an excellent source of information for online monitoringand anomaly detection.
Existing approaches that leverage system log data for anomalydetection can be broadly classi�ed into three groups: PCA basedapproaches over log message counters [39], invariant mining basedmethods to capture co-occurrence pa�erns between di�erent logkeys [21], and work�ow based methods to identify execution anom-alies in program logic �ows [42]. Even though they are successful incertain scenarios, none of them is e�ective as a universal anomalydetection method that is able to guard against di�erent a�acks inan online fashion.
�is work proposes DeepLog, a data-driven approach for anom-aly detection that leverages the large volumes of system logs. �ekey intuition behind the design of DeepLog is from natural lan-guage processing: we view log entries as elements of a sequencethat follows certain pa�erns and grammar rules. Indeed, a sys-tem log is produced by a program that follows a rigorous set oflogic and control �ows, and is very much like a natural language(though more structured and restricted in vocabulary). To that end,DeepLog is a deep neural network that models this sequence of logentries using a Long Short-Term Memory (LSTM) [18]. �is allowsDeepLog to automatically learn a model of log pa�erns from nor-mal execution and �ag deviations from normal system executionas anomalies. Furthermore, since it is a learning-driven approach,it is possible to incrementally update the DeepLog model so that itcan adapt to new log pa�erns that emerge over time.Challenges. Log data are unstructured, and their format and se-mantics can vary signi�cantly from system to system. It is alreadychallenging to diagnose a problem using unstructured logs evena�er knowing an error has occurred [43]; online anomaly detectionfrom massive log data is even more challenging. Some existingmethods use rule-based approaches to address this issue, whichrequires speci�c domain knowledge [41], e.g., using features like“IP address” to parse a log. However, this does not work for generalpurpose anomaly detection where it is almost impossible to knowa priori what are interesting features in di�erent types of logs (andto guard against di�erent types of a�acks).
Anomaly detection has to be timely in order to be useful so thatusers can intervene in an ongoing a�ack or a system performanceissue [10]. Decisions are to be made in streaming fashion. As
a result, o�ine methods that need to make several passes overthe entire log data are not applicable in our se�ing [22, 39]. Wewould also like to be able to detect unknown types of anomalies,rather than gearing towards speci�c types of anomalies. �erefore,previous work [44] that use both normal and abnormal (for speci�ctypes of anomalies) log data entries to train a binary classi�er foranomaly detection is not useful in this context.
Another challenge comes from concurrency. Clearly, the or-der of log messages in a log provides important information fordiagnosis and analysis (e.g., identify the execution path of a pro-gram). However, in many system logs, log messages are producedby several di�erent threads or concurrently running tasks. Suchconcurrency makes it hard to apply work�ow based anomaly de-tection methods [42] which use a work�ow model for a single taskas a generative model to match against a sequence of log messages.
Lastly, each log message contains rich information such as a logkey and one or more metric values, as well as its timestamp. Aholistic approach that integrates and utilizes these di�erent piecesof information will be more e�ective. Most existing methods [22,32, 39, 41, 42, 44] analyze only one speci�c part of a log message(e.g., the log key) which limits the types of anomalies they candetect.Our contribution. A Recurrent Neural Network (RNN) is an arti-�cial neural network that uses a loop to forward the output of laststate to current input, thus keeping track of history for making pre-dictions. Long Short-Term Memory (LSTM) networks [13, 18, 27]are an instance of RNNs that have the ability to remember long-termdependencies over sequences. LSTMs have demonstrated successin various tasks such as machine translation [35], sentiment analy-sis [8], and medical self-diagnosis [20].
Inspired by the observation that entries in a system log are asequence of events produced by the execution of structured sourcecode (and hence can be viewed as a structured language), we designthe DeepLog framework using a LSTM neural network for onlineanomaly detection over system logs. DeepLog uses not only logkeys but also metric values in a log entry for anomaly detection,hence, it is able to capture di�erent types of anomalies. DeepLogonly depends on a small training data set that consists of a sequenceof “normal log entries”. A�er the training phase, DeepLog canrecognize normal log sequences and can be used for online anomalydetection over incoming log entries in a streaming fashion.
Intuitively, DeepLog implicitly captures the potentially non-linear and high dimensional dependencies among log entries fromthe training data that correspond to normal system execution paths.To help users diagnose a problem once an anomaly is identi�ed,DeepLog also builds work�ow models from log entries during itstraining phase. DeepLog separates log entries produced by concur-rent tasks or threads into di�erent sequences so that a work�owmodel can be constructed for each separate task.
Our evaluation shows that on a large HDFS log dataset exploredby previous work [22, 39], trained on only a very small fraction(less than 1%) of log entries corresponding to normal system exe-cution, DeepLog can achieve almost 100% detection accuracy onthe remaining 99% of log entries. Results from a large OpenStacklog convey a similar trend. Furthermore, DeepLog also provides
the ability to incrementally update its weights during the detec-tion phase by incorporating live user feedback. More speci�cally,DeepLog provides a mechanism for user feedback if a normal logentry is incorrectly classi�ed as an anomaly. DeepLog can then usesuch feedback to adjust its weights dynamically online over timeto adapt itself to new system execution (hence, new log) pa�erns.
2 PRELIMINARIES2.1 Log parserWe �rst parse unstructured, free-text log entries into a structuredrepresentation, so that we can learn a sequential model over thisstructured data. As shown by several prior work [9, 22, 39, 42, 45],an e�ective methodology is to extract a “log key” (also known as“message type”) from each log entry. �e log key of a log entry erefers to the string constant k from the print statement in the sourcecode which printed e during the execution of that code. For example,the log key k for log entry e =“Took 10 seconds to build instance.” isk =Took * seconds to build instance., which is the string constant fromthe print statement printf(”Took %f seconds to build instance.”, t). Notethat the parameter(s) are abstracted as asterisk(s) in a log key. �esemetric values re�ect the underlying system state and performancestatus. Values of certain parameters may serve as identi�ers fora particular execution sequence, such as block_id in a HDFS logand instance_id in an OpenStack log. �ese identi�ers can grouplog entries together or untangle log entries produced by concurrentprocesses to separate, single-thread sequential sequences [22, 39,42, 45]. �e state-of-the-art log parsing method is represented bySpell [9], an unsupervised streaming parser that parses incominglog entries in an online fashion based on the idea of LCS (longestcommon subsequence).
Past work on log analysis [22, 39, 42, 44] have discarded times-tamp and/or parameter values in a log entry, and only used log keysto detect anomalies. DeepLog stores parameter values for each logentry e , as well as the time elapsed between e and its predecessor,into a vector −→v e . �is vector is used by DeepLog in addition tothe log key. An example is given in Table 1, which shows the pars-ing results for a sequence of log entries from multiple rounds ofexecution of virtual machine (VM) deletion task in OpenStack.
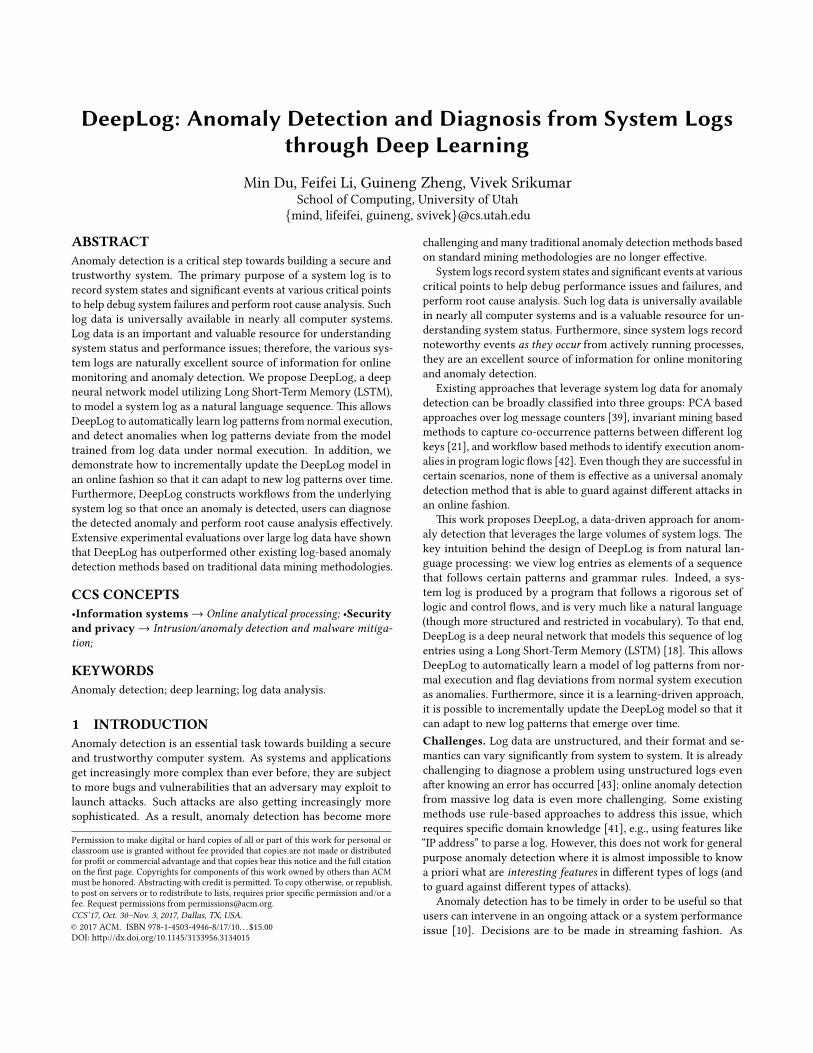
2.2 DeepLog architecture and overview�e architecture of DeepLog is shown in Figure 1 with three maincomponents: the log key anomaly detection model, the parame-ter value anomaly detection model, and the work�ow model todiagnose detected anomalies.Training stage. Training data for DeepLog are log entries fromnormal system execution path. Each log entry is parsed to a log keyand a parameter value vector. �e log key sequence parsed from atraining log �le is used by DeepLog to train a log key anomaly de-tection model, and to construct system execution work�ow modelsfor diagnosis purposes. For each distinct key k , DeepLog also trainsand maintains a model for detecting system performance anomaliesas re�ected by these metric values, trained by the parameter valuevector sequence of k .Detection stage. A newly arrived log entry is parsed into a logkey and a parameter value vector. DeepLog �rst uses the log key

log message (log key underlined) log key parameter value vectort1 Deletion of �le1 complete k1 [t1 − t0, �le1Id]t2 Took 0.61 seconds to deallocate network … k2 [t2 − t1, 0.61]t3 VM Stopped (Lifecycle Event) k3 [t3 − t2]… … …
Table 1: Log entries from OpenStack VM deletion task.
Tra
inin
g S
tage
Detectio
n S
tage
Log Key
Anomaly Detection
model
......
Parameter Value
Anomaly Detection
model
for each log key
Workflows
normal execution
log file
Log
Parser......
......
......
......
each log entry = log key + parameter value vector A new log entryLog
Parser
parameter
value vector
+
Train model
Construct workflowAnomaly?
Yes No,
check
vector
Anomaly?
Yes
DiagnosisUpdate
model if
false positive
log key
Tra
in m
odels
No
Figure 1: DeepLog architecture.
anomaly detection model to check whether the incoming log key isnormal. If yes, DeepLog further checks the parameter value vectorusing the parameter value anomaly detection model for that log key.�e new entry will be labeled as an anomaly if either its log key orits parameter value vector is predicted being abnormal. Lastly, ifit is labeled being abnormal, DeepLog’s work�ow model providessemantic information for users to diagnose the anomaly. Executionpa�erns may change over time or were not included in the originaltraining data. DeepLog also provides the option for collecting userfeedback. If the user reports a detected anomaly as false positive,DeepLog could use it as a labeled record to incrementally updateits models to incorporate and adapt to the new pa�ern.2.3 �reat modelDeepLog learns the comprehensive and intricate correlations andpa�erns embedded in a sequence of log entries produced by normalsystem execution paths. Henceforth, we assume that system logsthemselves are secure and protected, and an adversary cannot a�ackthe integrity of a log itself. We also assume that an adversary cannotmodify the system source code to change its logging behavior andpa�erns. �at said, broadly speaking, there are two types of a�acksthat we consider.
(1) A�acks that lead to system execution misbehavior and henceanomalous pa�erns in system logs. For instance, Denial of Service(DoS) a�acks which may cause slow execution and hence perfor-mance anomalies re�ected in the log timestamp di�erences fromthe parameter value vector sequence; a�acks causing repeatedserver restarts such as Blind Return Oriented Programming (BROP)a�ack [5] shown as too many server restart log keys; and any at-tack that may cause task abortion such that the corresponding logsequence ends early and/or exception log entries appear.
(2) A�acks that could leave a trace in system logs due to thelogging activities of system monitoring services. An example issuspicious activities logged by an Intrusion Detection System (IDS).
3 ANOMALY DETECTION3.1 Execution path anomalyWe �rst describe how to detect execution path anomalies using thelog key sequence. Since the total number of distinct print statements(that print log entries) in a source code is constant, so is the totalnumber of distinct log keys. Let K = {k1,k2, . . . ,kn } be the set ofdistinct log keys from a log-producing system source code.
Once log entries are parsed into log keys, the log key sequencere�ects an execution path that leads to that particular executionorder of the log print statements. Let mi denote the value of thekey at position i in a log key sequence. Clearly,mi may take one ofthe n possible keys from K , and is strongly dependent on the mostrecent keys that appeared prior tomi .
We can model anomaly detection in a log key sequence as a multi-class classi�cation problem, where each distinct log key de�nesa class. We train DeepLog as a multi-class classi�er over recentcontext. �e input is a history of recent log keys, and the output is aprobability distribution over the n log keys from K , representing theprobability that the next log key in the sequence is a key ki ∈ K .
Figure 2 summarizes the classi�cation setup. Suppose t is thesequence id of the next log key to appear. �e input for classi-�cation is a window w of the h most recent log keys. �at is,w = {mt−h , . . . ,mt−2,mt−1}, where each mi is in K and is the logkey from the log entry ei . Note that the same log key value mayappear several times in w . �e output of the training phase is amodel of the conditional probability distribution Pr[mt = ki |w] foreach ki ∈ K(i = 1, . . . ,n). �e detection phase uses this model tomake a prediction and compare the predicted output against theobserved log key value that actually appears.Training stage. �e training stage relies on a small fraction of logentries produced by normal execution of the underlying system.For each log sequence of length h in the training data, DeepLog

DeepLogInput: h recent
log keys up toOutput: conditional probability
of next log key given the input
recent sequence
Figure 2: An overview of log key anomaly detection model.
updates its model for the probability distribution of having ki ∈ Kas the next log key value. For example, suppose a small log �leresulted from normal execution is parsed into a sequence of logkeys: {k22, k5, k11, k9, k11, k26}. Given a window size h = 3, theinput sequence and the output label pairs to train DeepLog will be:{k22, k5, k11 → k9}, {k5, k11, k9 → k11}, {k11, k9, k11 → k26}.Detection stage. DeepLog performs anomaly detection in an on-line, streaming se�ing. To test if an incoming log keymt (parsedfrom an incoming log entry et ) is to be considered normal or abnor-mal, we send w = {mt−h , ...,mt−1} to DeepLog as its input. �eoutput is a probability distribution Pr[mt |w] = {k1 : p1, k2 : p2, ...,kn : pn } describing the probability for each log key from K toappear as the next log key value given the history.
In practice, multiple log key values may appear as mt . For in-stance, if the system is a�empting to connect to a host, then mtcould either be ‘Waiting for * to respond’ or ‘Connected to *’; bothare normal system behavior. DeepLog must be able to learn suchpa�erns during training. Our strategy is to sort the possible logkeys K based on their probabilities Pr[mt |w], and treat a key valueas normal if it’s among the top д candidates. A log key is �aggedas being from an abnormal execution otherwise.
3.1.1 Traditional N-gram language model. �e problem of as-cribing probabilities to sequences of words drawn from a �xedvocabulary is the classic problem of language modeling, widelystudied by the natural language processing (NLP) community [24].In our case, each log key can be viewed as a word taken fromthe vocabulary K . �e typical language modeling approach forassigning probabilities to arbitrarily long sequences is the N-grammodel. �e intuition is that a particular word in a sequence isonly in�uenced by its recent predecessors rather than the entirehistory. In our se�ing, this approximation is equivalent to se�ingPr(mt = ki |m1, . . . ,mt−1) = Pr(mt = ki |mt−N , . . . ,mt−1) whereN denotes the length of the recent history to be considered.
For training, we can calculate this probability using relative fre-quency counts from a large corpus to give us maximum likelihoodestimates. Given a long sequence of keys {m1,m2, . . . ,mt }, wecan estimate the probability of observing the ith key ki using therelative frequency counts of {mt−N , . . . ,mt−1,mt = ki } with re-spect to the sequence {mt−N , . . . ,mt−1}. In other words, Pr(mt =
ki |m1, . . . ,mt−1) = count(mt−N , . . .,mt−1,mt = ki )/count(mt−N ,. . .,mt−1). Note that we will count these frequencies using a slidingwindow of size N over the entire key sequence.
To apply the N-gram model in our se�ing, we simply use N asthe history window size, i.e., we set h = N in our experiments whenthe N-gram model is used where h is the history sliding windowsize as depicted in Figure 2. We use this as a baseline method.
3.1.2 The LSTM approach. In recent years, neural language mod-els that use recurrent neural networks have been shown to be highlye�ective across various NLP tasks [3, 25]. Compared to a N-gram
LSTM
blockOutput of last state
is forwarded as
current input state
LSTM
block
LSTM
block
DeepLogOutput
Input
LSTM
block
LSTM
block
LSTM
block
Roll out
Stack up
LSTM
block
LSTM
block
LSTM
block
LSTM
block
Figure 3: A detailed view of log key anomaly detectionmodel using stacked LSTM.
language model, a LSTM-based one can encode more intricate pat-terns and maintain long-range state over a sequence [34]. Complexpa�erns and interleaving log entries from concurrent tasks in a sys-tem log can render a traditional language model less e�ective. �us,DeepLog uses a LSTM neural network [18] for anomaly detectionfrom a log key sequence.
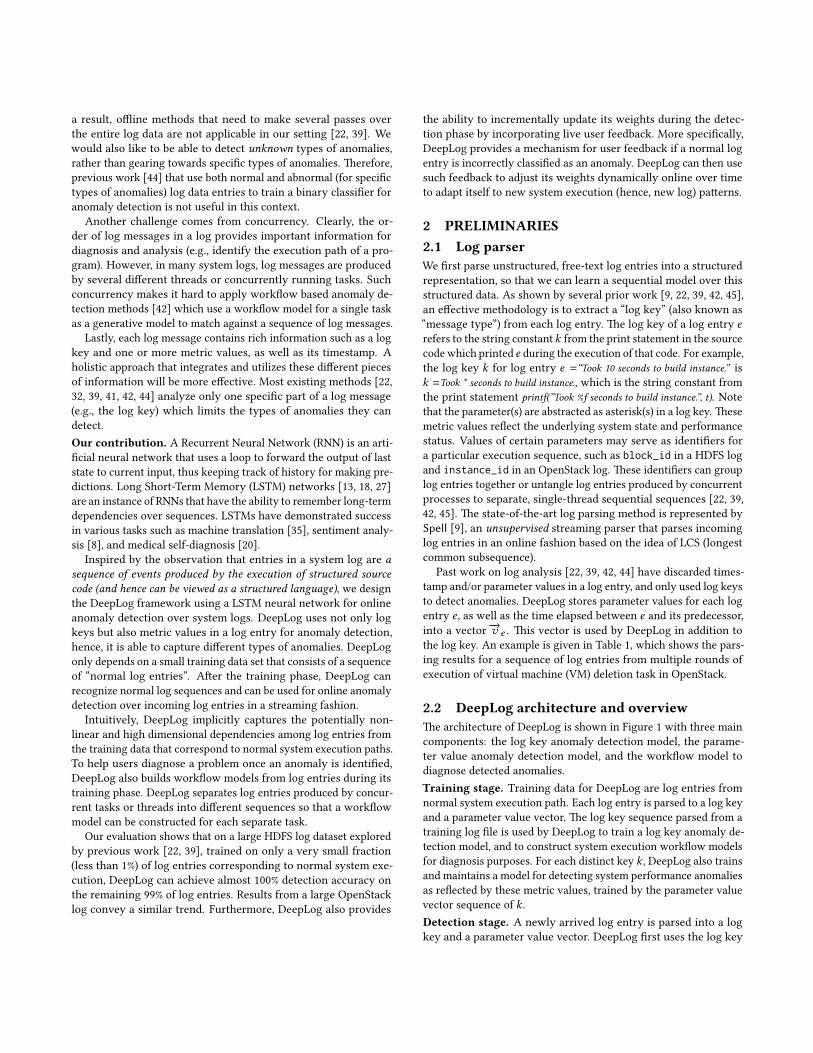
Given a sequence of log keys, a LSTM network is trained tomaximize the probability of having ki ∈ K as the next log key valueas re�ected by the training data sequence. In other words, it learnsa probability distribution Pr(mt = ki |mt−h , . . ., mt−2, mt−1) thatmaximizes the probability of the training log key sequence.
Figure 3 illustrates our design. �e top of the �gure shows asingle LSTM block that re�ects the recurrent nature of LSTM. EachLSTM block remembers a state for its input as a vector of a �xeddimension. �e state of an LSTM block from the previous timestep is also fed into its next input, together with its (external) datainput (mt−i in this particular example), to compute a new stateand output. �is is how historical information is passed to andmaintained in a single LSTM block.
A series of LSTM blocks form an unrolled version of the recurrentmodel in one layer as shown in the center of Figure 3. Each cellmaintains a hidden vector Ht−i and a cell state vector Ct−i . Bothare passed to the next block to initialize its state. In our case, weuse one LSTM block for each log key from an input sequence w (awindow of h log keys). Hence, a single layer consists of h unrolledLSTM blocks.
Within a single LSTM block, the input (e.g. mt−i ) and the previ-ous output (Ht−i−1) are used to decide (1) how much of the previouscell state Ct−i−1 to retain in state Ct−i , (2) how to use the currentinput and the previous output to in�uence the state, and (3) howto construct the output Ht−i . �is is accomplished using a set ofgating functions to determine state dynamics by controlling theamount of information to keep from input and previous output, andthe information �ow going to the next step. Each gating functionis parameterized by a set of weights to be learned. �e expressivecapacity of an LSTM block is determined by the number of memory

units (i.e. the dimensionality of the hidden state vector H ). Due tospace constraints, we refer the reader to NLP primers (e.g., [12])for a formal characterization of LSTMs.
�e training step entails �nding proper assignments to the weightsso that the �nal output of the sequence of LSTMs produces the de-sired label (output) that comes with inputs in the training data set.During the training process, each input/output pair incrementallyupdates these weights, through loss minimization via gradient de-scent. In DeepLog, an input consists of a window w of h log keys,and an output is the log key value that comes right a�er w . We usethe categorical cross-entropy loss for training.
A�er training is done, we can predict the output for an input(w = {mt−h , . . . ,mt−1}) using a layer of h LSTM blocks. Each logkey in w feeds into a corresponding LSTM block in this layer.
If we stack up multiple layers and use the hidden state of theprevious layer as the input of each corresponding LSTM block inthe next layer, it becomes a deep LSTM neural network, as shown atthe bo�om of Figure 3. For simplicity, it omits an input layer and anoutput layer constructed by standard encoding-decoding schemes.�e input layer encodes the n possible log keys from K as one-hotvectors. �at is, a sparse n-dimensional vector −→u i is constructedfor the log key ki ∈ K , such that −→u i [i] = 1 and −→u i [j] = 0 for allother j , i . �e output layer translates the �nal hidden state intoa probability distribution function using a standard multinomiallogistic function to represent Pr[mt = ki |w] for each ki ∈ K .
�e example at the bo�om of Figure 3 shows only two hiddenlayers, but more layers can be used.
3.2 Parameter value and performance anomaly�e log key sequence is useful for detecting execution path anom-alies. However, some anomalies are not shown as a deviation froma normal execution path, but as an irregular parameter value. �eseparameter value vectors (for the same log key) form a parame-ter value vector sequence, and these sequences from di�erent logkeys form a multi-dimensional feature space that is important forperformance monitoring and anomaly detection.Baseline approach. A simple approach is to store all parametervalue vector sequences into a matrix, where each column is a pa-rameter value sequence from a log key k (note that it is possible tohave multiple columns for k depending on the size of its parametervalue vector). Row i in this matrix represents a time instance ti .
Consider the log entries in Table 1 as an example. �ere are3 distinct log key values in this example, and the sizes of theirparameter value vectors are 2, 2, and 1 respectively. Hence, row1 in this matrix represents time instance t1 with values [t1 − t0,�le1Id, null, null, null]. Similarly, row 2 and row 3 are [null, null,t2 − t1, 0.61, null] and [null, null, null, null, t3 − t2] respectively.
We may also ask each row to represent a range of time instancesso that each row corresponds to multiple log messages within thattime range and becomes less sparse. But the matrix will still be verysparse when there are many log key values and/or exists some largeparameter value vectors. Furthermore, this approach introducesa delay to the anomaly detection process, and it is also di�cult to�gure out a good value for the length of each range.
Given this matrix, many well-known data-driven anomaly detec-tion methods can be applied, such as principal component analysis
(PCA) and self-organizing maps (SOM). �ey are useful towardscapturing correlation among di�erent feature dimensions. How-ever, a major limitation of this method in the context of log data isthat o�en times the appearance of multiple log keys at a particulartime instance is equally likely. For instance, the order of k1 andk2 in Table 1 is arbitrary due to concurrently running tasks. �isphenomena, and the fact that the matrix is sparse, render these tech-niques ine�ective in our se�ing. Lastly, they are not able to modelauto-correlation that exists in a parameter value vector sequence(regular pa�erns over time in a single vector sequence).Our approach. DeepLog trains a parameter value anomaly detec-tion model by viewing each parameter value vector sequence (for alog key) as a separate time series.
Consider the example in Table 1. �e time series for the parame-ter value vector sequence of k2 is: {[t2−t1, 0.61], [t ′2−t
′1, 1]}. Hence,
our problem is reduced to anomaly detection from a multi-variatetime series data. It is possible to apply an LSTM-based approachagain. We use a similar LSTM network as shown in Figure 3 tomodel a multi-variate time series data, with the following adjust-ments. Note that a separate LSTM network is built for the parametervalue vector sequence of each distinct log key value.
Input. �e input at each time step is simply the parameter valuevector from that timestamp. We normalize the values in each vectorby the average and the standard deviation of all values from thesame parameter position from the training data.
Output. �e output is a real value vector as a prediction for thenext parameter value vector, based on a sequence of parametervalue vectors from recent history.
Objective function for training. For the multi-variate time seriesdata, the training process tries to adjust the weights of its LSTMmodel in order to minimize the error between a prediction and anobserved parameter value vector. �us, mean square loss is used tominimize the error during the training process.
Anomaly detection. �e di�erence between a prediction and anobserved parameter value vector is measured by the mean squareerror (MSE). Instead of se�ing a magic error threshold for anomalydetection purpose in an ad-hoc fashion, we partition the train-ing data to two subsets: the model training set and the validationset. For each vector −→v in the validation set, we apply the modelproduced by the training set to calculate the MSE between the pre-diction (using the vector sequence from before −→v in the validationset) and −→v . At every time step, the errors between the predictedvectors and the actual ones in the validation group are modeled asa Gaussian distribution.
At deployment, if the error between a prediction and an ob-served value vector is within a high-level of con�dence intervalof the above Gaussian distribution, the parameter value vector ofthe incoming log entry is considered normal, and is consideredabnormal otherwise.
Since parameter values in a log message o�en record importantsystem state metrics, this method is able to detect various types ofperformance anomalies. For example, a performance anomaly mayre�ect as a “slow down”. Recall that DeepLog stores in each param-eter value vector the time elapsed between consecutive log entries.�e above LSTM model, by modeling parameter value vector as amulti-variate time series, is able to detect unusual pa�erns in one
or more dimensions in this time series; the elapsed time value isjust one such dimension.
3.3 Online update of anomaly detection modelsClearly, the training data may not cover all possible normal execu-tion pa�erns. System behavior may change over time, additionallydepending on workload and data characteristics. �erefore, it isnecessary for DeepLog to incrementally update weights in its LSTMmodels to incorporate and adapt to new log pa�erns. To do this,DeepLog provides a mechanism for the user to provide feedback.�is allows DeepLog to use a false positive to adjust its weights. Forexample, suppose h = 3 and the recent history sequence is {k1, k2,k3}, and DeepLog has predicted the next log key to be k1 with prob-ability 1, while the next log key value is k2, which will be labeledas an anomaly. If user reports that this is a false positive, DeepLogis able to use the following input-output pair {k1, k2, k3 → k2}to update the weights of its model to learn this new pa�ern. Sothat next time given history sequence {k1, k2, k3}, DeepLog canoutput both k1 and k2 with updated probabilities. �e same updateprocedure works for the parameter value anomaly detection model.Note that DeepLog does not need to be re-trained from scratch.A�er the initial training process, models in DeepLog exist as sev-eral multi-dimensional weight vectors. �e update process feeds innew training data, and adjusts the weights to minimize the errorbetween model output and actual observed values from the falsepositive cases.
4 WORKFLOW CONSTRUCTION FROMMULTI-TASKS EXECUTION
Each log key is the execution of a log printing statement in thesource code, while a task like VM creation will produce a sequenceof log entries. Intuitively, the order of log entries produced by a taskrepresents an execution order of each function for accomplishingthis task. As a result, we can build a work�ow model as a �nite stateautomaton (FSA) to capture the execution path of any task. �iswork�ow model can also be used to detect execution path anom-alies, but it is less e�ective compared to DeepLog’s LSTM modeldue to its inability to capture inter-task dependencies and non-deterministic loop iterations. However, the work�ow model is veryuseful towards enabling users to diagnose what had gone wrong inthe execution of a task when an anomaly has been detected.
Given a log sequence generated by the repeated executions of atask, there have been several works exploring the problem of work-�ow inference [4, 21, 42]. CloudSeer [42] represents the state of theart in anomaly detection using a work�ow model. CloudSeer hasseveral limitations. Firstly, the anomalies it can detect are limitedto log entries having ”ERROR” logging level and log entries notappearing. Furthermore, its work�ow model construction requiresa log �le with repeated executions of only one single task. Otherprevious works [4, 21] on work�ow construction from a log �lealso su�er from this limitation. In practice, a log �le o�en containsinterleaving log entries produced by multiple tasks and potentiallyconcurrently running threads within a task.
4.1 Log entry separation from multiple tasksAn easy case is when multiple programs concurrently write to thesame log (e.g., Ubuntu’s system log). O�en each log entry contains
the name of the program that created it. Another easy case is whenthe process or task id is included in a log entry. Here, we focus onthe case where a user program is executed repeatedly to performdi�erent, but logically related, tasks within that program. An impor-tant observation is that tasks do not overlap in time. However, thesame log key may appear in more than one task, and concurrencyis possible within each task (e.g., multiple threads in one task).
Consider OpenStack administrative logs as an example. Foreach VM instance, its life cycle contains VM creation, VM stop,VM deletion and others. �ese tasks do not overlap, i.e., VM stopcan only start a�er VM creation has completed. However, the samelog key may appear in di�erent tasks. For example, a log message“VM Resumed (Lifecycle Event)” may appear in VM creation, VM start,VM resume and VM unpause. �ere could be concurrently runningthreads inside each task, leading to uncertainty in the orderingof log messages corresponding to one task. For instance, duringVM creation, the order of two log messages “Took * seconds to buildinstance” and “VM Resumed (Lifecycle Event)” is uncertain.
Our goal is to separate log entries for di�erent tasks in a log �le,and then build a work�ow model for each task based on its logkey sequence. �at said, the input of our problem is the entire logkey sequence parsed from a raw log �le, and the output is a set ofwork�ow models, one for each task identi�ed.
4.2 Using DeepLog’s anomaly detection model4.2.1 Log key separation. Recall that in DeepLog’s model for
anomaly detection from log keys, the input is a sequence of logkeys of length h from recent history, and the output is a probabilitydistribution of all possible log key values. An interesting observa-tion is that its output actually encodes the underlying work�owexecution path.
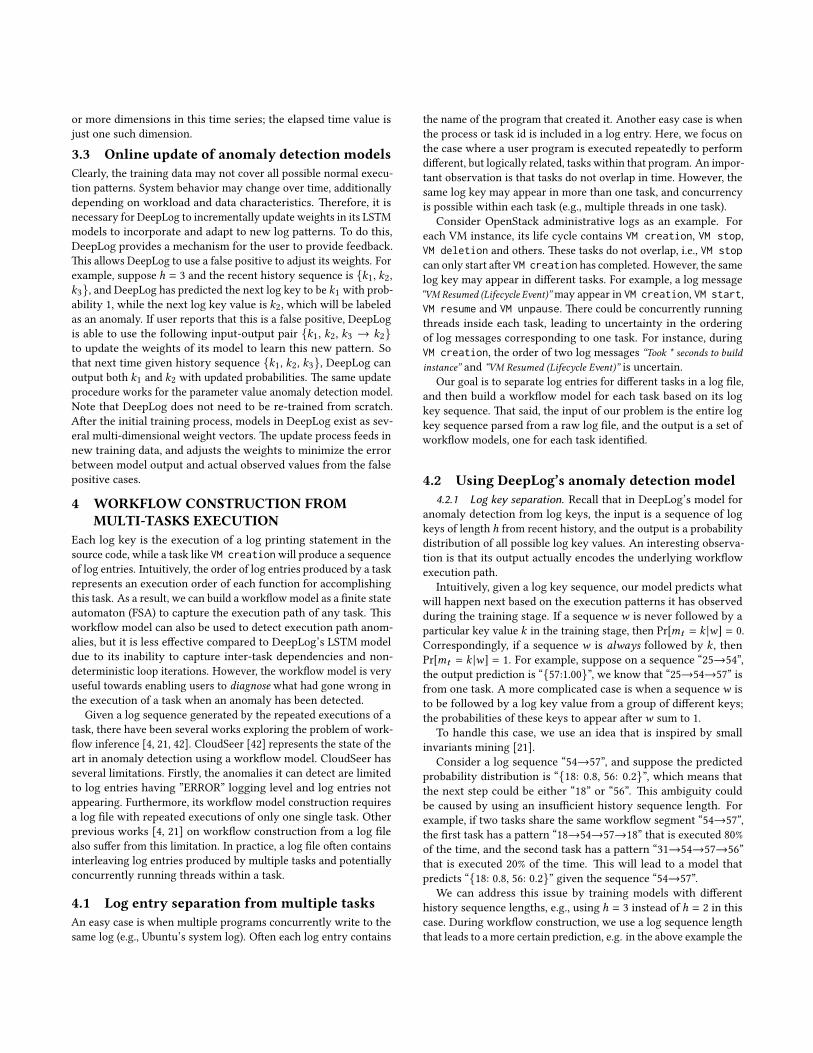
Intuitively, given a log key sequence, our model predicts whatwill happen next based on the execution pa�erns it has observedduring the training stage. If a sequence w is never followed by aparticular key value k in the training stage, then Pr[mt = k |w] = 0.Correspondingly, if a sequence w is always followed by k , thenPr[mt = k |w] = 1. For example, suppose on a sequence “25→54”,the output prediction is “{57:1.00}”, we know that “25→54→57” isfrom one task. A more complicated case is when a sequence w isto be followed by a log key value from a group of di�erent keys;the probabilities of these keys to appear a�er w sum to 1.
To handle this case, we use an idea that is inspired by smallinvariants mining [21].
Consider a log sequence “54→57”, and suppose the predictedprobability distribution is “{18: 0.8, 56: 0.2}”, which means thatthe next step could be either “18” or “56”. �is ambiguity couldbe caused by using an insu�cient history sequence length. Forexample, if two tasks share the same work�ow segment “54→57”,the �rst task has a pa�ern “18→54→57→18” that is executed 80%of the time, and the second task has a pa�ern “31→54→57→56”that is executed 20% of the time. �is will lead to a model thatpredicts “{18: 0.8, 56: 0.2}” given the sequence “54→57”.
We can address this issue by training models with di�erenthistory sequence lengths, e.g., using h = 3 instead of h = 2 in thiscase. During work�ow construction, we use a log sequence lengththat leads to a more certain prediction, e.g. in the above example the

54 57182518 56
1856
1. [25, 18, 54] -> {57: 1.00}
2. [18, 54, 57] -> {18: 0.8, 56: 0.2}
3. [54, 57, 18] -> {56: 1.00}
[54, 57, 56] -> {18: 1.00}
54 571825
18
56
31
31
(a) An example of concurrency detection
54 57182524 60
3726
1. [25, 18, 54] -> {57: 1.00}
2. [18, 54, 57] -> {24: 0.8, 26: 0.2}
3. [54, 57, 24] -> {60: 1.00}
[54, 57, 26] -> {37: 1.00}
54 571825
24
26 37
60
(b) An example of new task detection
26 37 39 40 39 40
1. H: [26, 37, 39] -> {40: 1.00}
2. H: [37, 39, 40] ->{39: 1.00}
3. H: [39, 40, 39] -> {40: 1.00}
26 37 39 40
(c) An example of loop identi�cation
Figure 4: Examples of using LSTM for task separation and work�ow construction.
sequence “18→54→57” will lead to the prediction {18: 1.00} andthe sequence “31→54→57” will lead to the prediction {56: 1.00}.
If we have ruled out that a small sequence is a shared segmentfrom di�erent tasks (i.e., increasing the sequence length for trainingand prediction doesn’t lead to more certain prediction), the chal-lenge now is to �nd out whether the multi-key prediction outputis caused by either concurrency in the same task or the start of adi�erent task. We call this a divergence point.
We observe that, as shown in Figure 4a, if the divergence point iscaused by concurrency in the same task, a common pa�ern is thatkeys with the highest probabilities in the prediction output willappear one a�er another, and the certainty (measured by higherprobabilities for less number of keys) for the following predictionswill increase, as keys for some of the concurrent threads havealready appeared. �e prediction will eventually become certaina�er all keys from concurrent threads are included in the historysequence.
On the other hand, if the divergence point is caused by the start ofa new task, as shown in Figure 4b, the predicted log key candidates(“24” and “26” in the example) will not appear one a�er another. Ifwe incorporate each such log key into the history sequence, thenext prediction is a deterministic prediction of a new log key (e.g.,“24→60”, “26→37”). If this is the case, we stop growing the work�owmodel of the current task (stop at key “57” in this example), andstart constructing work�ow models for new tasks. Note that thetwo “new tasks” in Figure 4b could also be an “if-else” branch, e.g.,“57→if (24→60→…) else (26→37→…)”. To handle such situations,we apply a simple heuristic: if the “new task” has very few log keys(e.g., 3) and always appears a�er a particular task Tp , we treat it aspart of an “if-else” branch of Tp , otherwise as a new task.
4.2.2 Build a workflow model. Once we can distinguish diver-gence points caused by concurrency (multiple threads) in the sametask and new tasks, we can easily construct work�ow models asillustrated in Figure 4a and Figure 4b. Additional care is needed toidentify loops. �e detection of a loop is actually quite straightfor-ward. A loop is always shown in the initial work�ow model as anunrolled chain; see Figure 4c for an example. While this work�owchain is initially “26→37→39→40→39→40”, we could identify therepeated fragments as a loop execution (39→40 in this example).
4.3 Using density-based clustering approach4.3.1 Log key separation. Another approach is to use a density-
based clustering technique. �e intuition is that log keys in the
Table 2: Co-occurrence matrix within distance d
k1 … kj … knk1 pd (1, 1) pd (1, j)…ki pd (i, 1) pd (i, j) =
fd (ki ,kj )d ·f (ki )
…kn pd (n, 1) pd (n, j)
same task always appear together, but log keys from di�erent tasksmay not always appear together as the ordering of tasks is not�xed during multiple executions of di�erent tasks. �is allows usto cluster log keys based on co-occurrence pa�erns, and separatekeys into di�erent tasks when co-occurrence rate is low.
In a log key sequence, the distance d between any two log keys isde�ned as the number of log keys between them plus 1. For example,given the sequence {k1,k2,k2}, d(k1,k2) = [1, 2],d(k2,k2) = 1(note that there are two distance values between the pair (k1,k2)).
We build a co-occurrence matrix as shown in Table 2, where eachelement pd (i, j) represents the probability of two log keys ki and kjappearing within distance d in the input sequence. Speci�cally, letf (ki ) be the frequency of ki in the input sequence, and fd (ki ,kj )be the frequency of pair (ki ,kj ) appearing together within distanced in the input sequence. We de�ne pd (i, j) =
fd (ki ,kj )d ·f (ki )
, which showsthe importance of kj to ki .
For example, when d = 1, p1(i, j) = f1(ki ,kj )f (ki )
= 1 means that forevery occurrence ofki , there must be akj next to it. Note that in thisde�nition, f (ki ) in the denominator is scaled by d because whilecounting co-occurrence frequencies within d , a key ki is counted byd times. Scaling f (ki ) by a factor of d ensures that
∑nj=1 fd (i, j) = 1
for any i . Note that we can build multiple co-occurrence matricesfor di�erent distance values of d .
With a co-occurrence matrix for each distance value d that wehave built, our goal is to output a set of tasks TASK = (T1,T2, ...).�e clustering procedure works as follows. First, for d = 1, wecheck if any p1(i, j) is greater than a threshold τ (say τ = 0.9), whenit does, we connect ki , kj together to form T1 = [ki ,kj ]. Next, werecursively check if T1 could be extended from either its head ortail. For example, if there exists kx ∈ K such that p1(ki ,kx ) > τ ,we further check if p2(kj ,kx ) > τ , i.e., if kj and kx have a largeco-occurrence probability within distance 2. If yes,T1 = [kx ,ki ,kj ],otherwise we will add T2 = [ki ,kx ] to TASK .
�is procedure continues until no task T in TASK could be fur-ther extended. In the general case when a task T to be extended

has more than 2 log keys, when checking if kx could be includedas the new head or tail, we need to check if kx has a co-occurrenceprobability greater than τ with each log key in T up to distance d ′,where d ′ is the smaller of: i) length ofT , and ii) the maximum valueof d that we have built a co-occurrence matrix for. For example,to check if T = [k1,k2,k3] should connect k4 at its tail, we need tocheck if min(p1(k3,k4),p2(k2,k4),p3(k1,k4)) > τ .
�e above process connects sequential log keys for each task.When a task T1 = [ki ,kj ] cannot be extended to include any sin-gle key, we check if T1 could be extended by two log keys, i.e., ifthere exists kx ,ky ∈ K , such that p1(ki ,kx ) + p1(ki ,ky ) > τ , orp1(kj ,kx ) + p1(kj ,ky ) > τ . Suppose the la�er case is true, the nextthing to check is whether kx and ky are log keys produced by con-current threads in task T1. If they are, pd (kj ,kx ) always increaseswith larger d values, i.e., p2(kj ,kx ) > p1(kj ,kx ), which is intuitivebecause the appearance ordering of keys from concurrent threadsis not certain. Otherwise kx and ky do not belong to T1, thus weadd T2 = [kj ,kx ] and T3 = [kj ,ky ] into TASK instead.
Finally, for each task T in TASK , we eliminate T if its sequenceis included as a sub-sequence in another task.
4.3.2 Build workflow model. Once a log key sequence is sep-arated out and identi�ed for each task, the work�ow model con-struction for a task follows the same discussion from Section 4.2.2.
4.4 Using the work�ow model4.4.1 Set parameters for DeepLog model. In Section 3.1, we’ve
shown that DeepLog requires several input parameters, in particu-lar, it needs the length of history sequence window h (for trainingand detection), and the number of top д log keys in the predictedoutput probability distribution function to be considered normal.
Se�ing a proper value for h and д is problem dependent. Gen-erally speaking, larger h values will increase the prediction accu-racy because more history information is utilized in LSTM, untilit reaches a point where keys that are far back in history do notcontribute to the prediction of keys to appear. At this point contin-uing to increase h does not hurt the prediction accuracy of LSTM,because LSTM is able to learn that only the recent history in a longsequence ma�ers thus ignore the long tail. However, a large h valuedoes have a performance impact. More computations (and layers)are required for both training and prediction, which slows downthe performance of DeepLog. �e value of д, on the other hand,regulates the trade-o� between true positives (anomaly detectionrate) and false positives (false alarm rate).
�e work�ow model provides a guidance to set a proper valuefor both h and д. Intuitively, h needs to be just large enough toincorporate necessary dependencies for making a good prediction,so we can set h as the length of the shortest work�ow. �e numberof possible execution paths represents a good value for д, hence, weset д as the maximum number of branches at all divergence pointsfrom the work�ows of all tasks.
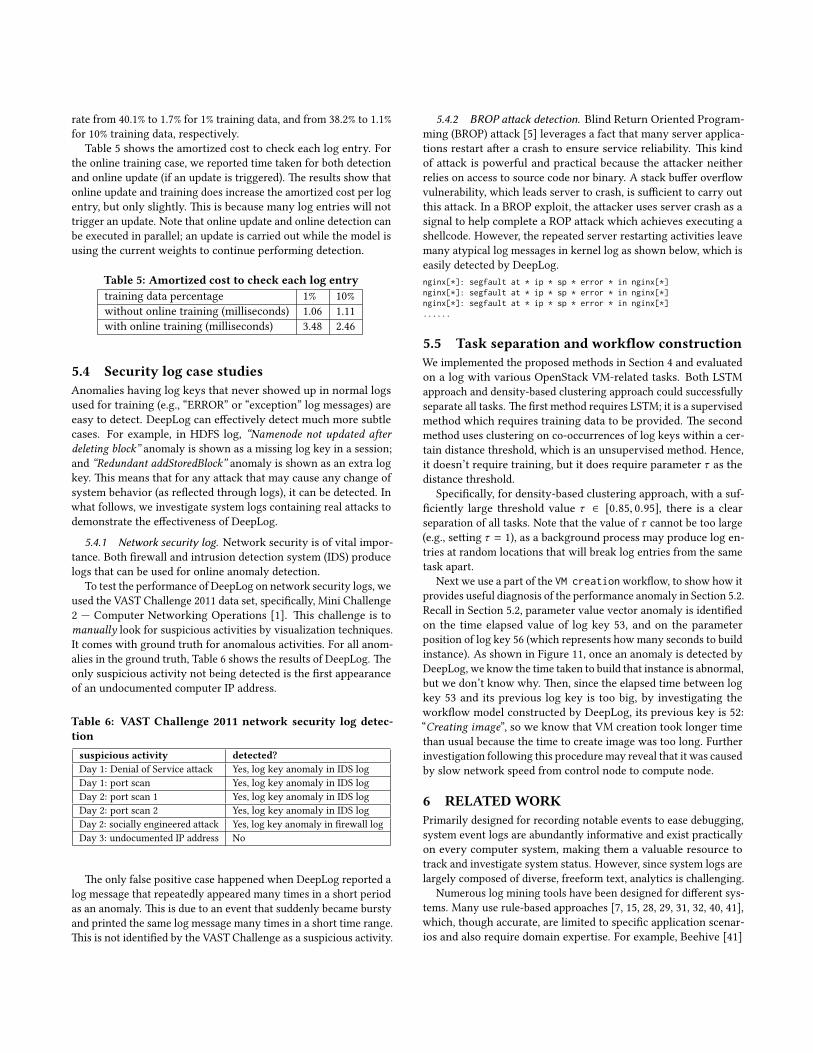
4.4.2 Using workflow to diagnose detected anomalies. Wheneveran anomaly is detected by DeepLog, the work�ow model can beused to help diagnose this anomaly and understand how and whyit has happened. Figure 5 shows an example. Using a historysequence [26, 37, 38], the top prediction from DeepLog is log key39 (suppose д = 1), however the actual log key appeared is 67,which is an anomaly. With the help of a work�ow model for this
26 37 38 39 40 41
67Actual Execution
Prediction (Correct Path)
37: instance: * Terminating instance
38: instance: * Instance destroyed successfully
39: instance: * Deleting instance files *
40: instance: * Deletion of * complete
41: instance: * Took * seconds to destroy the instance on the hypervisor
67: instance: * Error from libvirt during unfilter. Code=* Error=*
Figure 5: Anomaly diagnosis using work�ow.
task, users could easily identify the current execution point inthe corresponding work�ow, and further discover that this errorhappened right a�er “Instance destroyed successfully” and before“Deleting instance �les *”, which means that this error occurredduring cleanup a�er destroying a VM.
4.5 DiscussionPrevious works [4, 21, 42] focused on constructing work�ows frommultiple executions of just one task. �e basic idea in their approachfollows 3 steps: 1) mine temporal dependencies of each pair of logkeys; 2) construct a basic work�ow from the pairwise invariantsidenti�ed in step 1; 3) re�ne work�ow model using the input log keysequence. A major limitation is that they are not able to work witha log sequence that contains multiple tasks or concurrent threadsin one task, which is addressed by our study. Our task separationmethodology also provides useful insights towards the work�owconstruction for each task.
5 EVALUATIONDeepLog is implemented using Keras [6] with TensorFlow [2] as thebackend. In this section, we show evaluations of each componentand the overall performance of DeepLog, to show its e�ectivenessin �nding anomalies from large system log data.
5.1 Execution path anomaly detection�is section focuses on evaluating the log key anomaly detectionmodel in DeepLog. We �rst compare its e�ectiveness on largesystem logs with previous methods, and then investigate the impactof di�erent parameters in DeepLog.
5.1.1 Previous methods. Previous work on general-purpose loganomaly detection follows a similar procedure: they �rst extract alog key from each log message, and then perform anomaly detectionon the log key sequence.
�e Principal Component Analysis (PCA) method [39] assumesthat there are di�erent “sessions” in a log �le that can be easilyidenti�ed by a session id a�ached to each log entry. It �rst groupslog keys by session and then counts the number of appearancesof each log key value inside each session. A session vector is ofsize n, representing the number of appearances for each log keyin K in that session. A matrix is formed where each column isa log key, and each row is one session vector. PCA detects anabnormal vector (a session) by measuring the projection lengthon the residual subspace of transformed coordinate system. �isapproach is shown to be more e�ective than its online counterpart

online PCA [38] especially in reducing false positives, but this isclearly an o�ine method and cannot be used for online anomalydetection. �e implementation is open-sourced by [17].
Invariant Mining (IM) [22] constructs the same matrix as the PCAapproach does. IM �rst mines small invariants that could be satis�edby the majority of vectors, and then treats those vectors that donot satisfy these invariants as abnormal execution sessions. �isapproach is shown to be more e�ective than an earlier work [11]which utilizes work�ow automata. �e implementation is open-sourced by [17].
TFIDF is developed in [44]. Although its objective is for IT systemfailure prediction, which is di�erent from anomaly detection asshown in [39]. Nevertheless, we still included this method in ourevaluation as it also uses a LSTM-based approach. �ere are severalkey di�erences. TFIDF groups log keys by time windows (each timewindow is de�ned by a user parameter), and then models each timewindow (called “epoch”) using a TF-IDF (term-frequency, inversedocument frequency) vector. �e Laplace smoothing procedure ituses requires the knowledge of the total number of epochs (hencethe entire log �le). TFIDF constructs a LSTM model as a binaryclassi�er, which needs both labeled normal and abnormal data fortraining. Not only are anomaly log entries hard to obtain, but also,new types of anomalies that are not included in training data maynot be detected. In contrast, DeepLog trains its LSTM model to bea multi-class classi�er, and only requires normal data to train.
CloudSeer is a method designed speci�cally for multi-user Open-Stack log [42]. It builds a work�ow model for each OpenStack VM-related task and uses the work�ow for anomaly detection. �ough itachieves acceptable performance on OpenStack logs (a precision of83.08% and a recall of 90.00% as reported in the paper), this methoddoes not work for other types of logs (e.g., HDFS log) where thepa�erns of log keys are much more irregular. For example, Cloud-Seer only models log keys that “appear the same number of times”in every session. In HDFS logs, only 3 out of 29 log keys satisfythis criterion. Furthermore, this method cannot separate log entriesfor di�erent tasks in one log into separate sequences. It relies onmultiple identi�ers to achieve this, which is not always possible forgeneral-purpose logs. �us it is not compared against here.
5.1.2 Log data sets and set up.
HDFS log data set. It is generated through running Hadoop-basedmap-reduce jobs on more than 200 Amazon’s EC2 nodes, and la-beled by Hadoop domain experts. Among 11, 197, 954 log entriesbeing collected, about 2.9% are abnormal, including events suchas “write exception”. �is was the main data set �rstly used by ano�ine PCA-based [39] method, and subsequently used by severalother work including online PCA [38] and IM-based [22] methods.Details of this dataset could be found in [38, 39].OpenStack log data set. We deployed an OpenStack experiment(version Mitaka) on CloudLab [30] with one control node, one net-work node and eight compute nodes. Among 1, 335, 318 log entriescollected, about 7% are abnormal. A script was running to con-stantly execute VM-related tasks, including VM creation/deletion,stop/start, pause/unpause and suspend/resume. VM tasks werescheduled with the pa�ern of a regular expression (Create (Stop Start){0,3} (Pause Unpause) {0,3} (Suspend Resume) {0,3} Delete)+. A VM lifecycle starts with “VM create” and ends with “VM delete”, while task
pairs such as “Stop-Start”, “Pause-Unpause” and “Suspend-Resume”may randomly appear from 0 to 3 times within a life cycle. INFOlevel logs from nova-api, nova-scheduler and nova-compute werecollected and forwarded for analysis using Elastic Stack [33]. �reetypes of anomalies were injected at di�erent execution points: 1)neutron timeout during VM creation; 2) libvirt error while destroy-ing a VM; 3) libvirt error during cleanup a�er destroying a VM.Set up. To execute PCA-based and IM-based methods, we grouplog entries into di�erent sessions by an identi�er �eld, which forHDFS log is block_id and for OpenStack log is instance_id. Eachsession group is a life cycle of one block or a VM instance respec-tively. We then parse each log entry into a log key. DeepLog can beapplied directly on log keys to train its weights and subsequentlybe used to detect anomalies, while other methods require one morestep. �ey need to count the number of appearances for each dis-tinct log key within each session, and build a matrix where eachcolumn is a distinct log key (so there will be n columns) and eachrow represents a session vector, and the value of a cell Vi j in thematrix represents the count of log key kj in the i-th session.
DeepLog needs a small fraction of normal log entries to train itsmodel. In the case of HDFS log, only less than 1% of normal sessions(4,855 sessions parsed from the �rst 100,000 log entries comparedto a total of 11,197,954) are used for training. Note that DeepLogcan pinpoint which log entry (with its corresponding log key) isabnormal, but in order to use the same measures to compare withcompeting methods, we use “session” as the granularity of anomalydetection, i.e., a sessionC is considered an abnormal session as longas there exists at least one log key fromC being detected abnormal.
Table 3 summarizes the two data sets. Note that PCA and IMare unsupervised o�ine methods that do not require training data,whereas DeepLog only needs a training data produced by normalsystem execution, and TFIDF requires both normal and abnormaldata to train.
Log Number of sessions n: Numberdata set Training data (if needed) Test data of log keysHDFS 4,855 normal; 553,366 normal; 29
1,638 abnormal 15,200 abnormalOpenStack 831 normal; 5,990 normal; 40
50 abnormal 453 abnormalTable 3: Set up of log data sets (unit: session).
In addition to the number of false positives (FP) and false nega-tives (FN), we also use standard metrics such as Precision, Recalland F-measure. Precision= TP
TP+FP (TP stands for true positive) showsthe percentage of true anomalies among all anomalies detected;Recall= TP
TP+FN measures the percentage of anomalies in the dataset (assume that we know the ground-truth) being detected; andF-measure= 2·Precision·Recall
Precision+Recall is the harmonic mean of the two.By default, we use the following parameter values for DeepLog:
д = 9, h = 10, L = 2, and α = 64 and investigate their impactsin our experiments. Recall д decides the cuto� in the predictionoutput to be considered normal (i.e., the д log key values with top-дprobabilities to appear next are considered normal), and h is thewindow size used for training and detection. L and α denote thenumber of layers in DeepLog and the number of memory units inone LSTM block respectively. For all other methods, we explored

PCA IM TFIDF N-gram DeepLogfalse positive (FP) 277 2122 95833 1360 833false negative (FN) 5400 1217 1256 739 619
Table 4: Number of FPs and FNs on HDFS log.
their parameter space and report their best results. When the N-gram method is used, we set N = 1 unless otherwise speci�ed sincethis shows the best performance for the N-gram method.
5.1.3 Comparison. Table 4 shows the number of false positivesand false negatives for each method on HDFS data. PCA achievesthe fewest false positives, but at the price of more false negatives.Figure 6a shows a more in-depth comparison using recall, precisionand F-measure. Note that TFIDF is omi�ed from this �gure becauseof limited space and its very poor relative performance.
Clearly, DeepLog has achieved the best overall performance, withan F-measure of 96%. Our baseline solution N-gram also achievesgood performance when history length is 1. But, its performancedrops dramatically as history window becomes longer. In contrast,LSTM-based approach is more stable as shown in Section 5.1.4.
Figure 6b investigates the top-д approach used by DeepLog’sprediction algorithm. Let Dt be the set of top-д log key valuespredicted by DeepLog at t , and mt be the actual log key valueappeared in the data at t . To see the impact of this strategy, westudy the CDF of Pr[mt ∈ Dt ] for di�erent д values. Among over11,000,000 log keys (that are labeled as normal) to predict, 88.9%of DeepLog’s top prediction matches mt exactly; and 96.1% mt ’sare within DeepLog’s top 2 predictions. When д = 5, 99.8% ofnormal mt ’s are within Dt , meanwhile the anomaly detection rateis 99.994% (only one anomalous session was undetected).
Figure 7a shows the performance over OpenStack data set. �ePCA approach shows reasonable performance on this data set butwith low precision (only 77%), whereas even though IM has achieveda perfect recall in this case, it has very poor precision of only 2%(almost all VM instances are detected as abnormal executions).�is is because that OpenStack logs were generated randomly asdescribed in Section 5.1.2. Note that how many times that log keyslike (Stop Start) may appear in a life cycle of a VM (de�ned by apair of Create and Delete) is uncertain. �is makes it really hard forIM to �nd the “stable small invariants” for anomaly detection.
To test this hypothesis, we generated a second data set witha deterministic pa�ern like (Create Delete)+, resulting in a total of5,544 normal VM executions and 170 anomalous ones. We denotethis data set as OpenStack II and the result is shown in Figure 7b.IM performs very well on this data set with more regular pa�erns.However the recall for the PCA method drops to only 2% in thiscase because the normal pa�ern in the data is too regular, renderingPCA method which detects anomalies by variance not working.
On the other hand, DeepLog demonstrates excellent performanceon both OpenStack logs with a F-measure of 98% and 97% respec-tively. Lastly, it is also important to note that PCA and IM are o�inemethods, and they cannot be used to perform anomaly detectionper log entry. �ey are only able to detect anomaly at session level,but the notion of session may not even exist in many system logs.
5.1.4 Analysis of DeepLog. We investigate the performance im-pact of various parameters in DeepLog including: д, h, L, and α . �eresults are shown in Figure 8. In each experiment, we varied thevalues of one parameter while using the default values for others.
Precision Recall F-measure(a) Accuracy on HDFS.
0.5
0.6
0.7
0.8
0.9
1.0
1.1
0.98
0.67
0.79
0.88
0.950.910.92
0.960.940.95 0.96 0.96
PCA
IM
N-gram
DeepLog
g=1 g=3 g=5 g=7 g=9 g=11(b) Cumulative probability of top g predictions.
0.86
0.88
0.90
0.92
0.94
0.96
0.98
1.00
0.889
0.961
0.981
0.9930.998 0.9994 0.9998
Figure 6: Evaluation on HDFS log.
Precision Recall F-measure(a) Accuracy on OpenStack I.
0.0
0.2
0.4
0.6
0.8
1.0
0.77
0.99
0.87
0.02
1.0
0.05
0.91
1.00.950.96
1.0 0.98
Precision Recall F-measure(b) Accuracy on OpenStack II.
0.0
0.2
0.4
0.6
0.8
1.0 1.0
0.02 0.03
0.83
1.0
0.91
0.83
1.0
0.910.94
0.99 0.97
PCA IM N-gram DeepLog
Figure 7: Evaluation on OpenStack log.
In general, the performance of DeepLog is fairly stable with respectto di�erent values, i.e., it is not very sensitive to the adjustment ofany one or combinations of these parameter values. �is makesDeepLog easy to deploy and use in practice. �e results are fairlyintuitive to understand as well. For example, Figure 8c shows thata larger д value leads to higher precision but lower recall. �us,д could be adjusted to achieve higher true positive rate or lowerfalse positive rate. Lastly, DeepLog’s prediction cost per log entryis only around 1 millisecond on our standard workstation, whichcould be further improved by be�er hardware such as using a GPU.
1 2 3 4 5(a) Number of layers: L.
0.5
0.6
0.7
0.8
0.9
1.0
32 64 128 192 256(b) Number of memory units: ®.
0.5
0.6
0.7
0.8
0.9
1.0
g=7 g=8 g=9 g=10 g=11 g=12
(c) Top g predictions as normal.0.5
0.6
0.7
0.8
0.9
1.0
5 6 7 8 9 10(d) Window size: h.
0.5
0.6
0.7
0.8
0.9
1.0
Precision Recall F-measure
Figure 8: DeepLog performance with di�erent parameters.
5.2 Parameter value and performance anomalyTo evaluate the e�ectiveness of DeepLog at detecting parametervalue and performance (including elapsed time between log entries)

anomalies, we used system logs from the OpenStack VM creationtask. �is data set includes both types of anomalies: performanceanomaly (late arrival of a log entry) and parameter value anomaly(a log entry with a much longer VM creation time than others).Experiment setup. As before, we deployed an OpenStack exper-iment on CloudLab, and wrote a script to simulate that multipleusers are constantly requesting VM creations and deletions. DuringOpenStack VM creation, an important procedure is to copy therequired image from controller node to a compute node (where theVM will be created). To simulate a performance anomaly whichcould be possibly caused by a DoS a�ack, we thro�le the networkspeed from the controller to compute nodes at two di�erent points,to see if these anomalies could be detected by DeepLog.Anomaly detection. As described in Section 3.2, we separate logentries into two sets, one set is for model training and the otherset (called the validation set) is to apply the model to generate theGaussian distribution of MSEs (mean square error). In subsequentonline detection phase, for every incoming parameter value vector−→v , DeepLog checks if the MSE between −→v and the predicationoutput (a vector as well) from its model is within an acceptablecon�dence interval of the Gaussian distribution of MSEs from thevalidation set.
Figure 9 shows the detection results for the parameter valuevectors of di�erent log keys, where x-axis represents the id of theVM being created (i.e., di�erent VM creation instances), and y-axisrepresents the MSE between the parameter value vector and theprediction output vector from DeepLog. �e horizontal lines in each�gure are the con�dence interval thresholds for the correspondingMSE Gaussian distributions. Figure 9a and 9b represent two log keyswhere their parameter value vectors are normal during the entiretime. Figure 9c and 9d illustrate that the parameter value vectorsfor keys 53 and 56 are successfully detected as being abnormal atexactly the two time instances where we thro�led the networkspeed (i.e., injected anomalies).
For each abnormal parameter value vector detected, we identi-�ed the value that di�ers the most with the prediction, to identifythe abnormal column (feature). We found out that the two abnor-mal parameter value vectors for key 53 are due to unusually largeelapsed time values. On the other hand, key 56 is “Took * seconds tobuild instance.”, and not surprisingly, its two abnormal parametervalue vectors were caused by unusually large values (for seconds).
5.3 Online update and training of DeepLogSection 5.1 has demonstrated that DeepLog requires a very smalltraining set (less than 1% of the entire log) and does not requireuser feedback during its training phase. But it is possible that anew system execution path may show up during detection stage,which is also normal, but is detected as anomalous since it was notre�ected by the training data. To address this issue, this sectionevaluates the e�ectiveness of DeepLog’s online update and trainingmodule as described in Section 3.3. We demonstrate this usingthe di�erence in detection results with and without incrementalupdates, in terms of both e�ectiveness and e�ciency.
5.3.1 Log data set. �e log data set used in this section is BlueGene/L supercomputer system logs 1, which contains 4,747,963 log1CFDR Data, h�ps://www.usenix.org/cfdr-data
0 50 100 150 200 250 300VM id
(a) Value vectors for log key 25
0.0
0.5
1.0
1.5
2.0
MSE
CI=99%
CI=99.9%
CI=98%
0 50 100 150 200 250 300VM id
(b) Value vectors for log key 45
0.0
0.5
1.0
1.5
MSE
CI=99%
CI=99.9%
CI=98%
0 50 100 150 200 250 300VM id
(c) Value vectors for log key 53
0
1
2
3
4
5
6
MSE
CI=99%
CI=99.9%
CI=98%
0 50 100 150 200 250 300VM id
(d) Value vectors for log key 56
0
1
2
3
4
5
6
MSE
CI=99%
CI=99.9%
CI=98%
Figure 9: Anomaly detection for parameter value vectors with dif-ferent con�dence intervals (CIs).
entries, of which 348,460 entries are labeled as anomalies. We chosethis data set because of an important characteristic: many log keysonly appeared during a speci�c time period. �is means that thetraining data set may not contain all possible normal log keys, letalone all possible normal execution pa�erns.
5.3.2 Evaluation results. We conducted two experiments, oneuses the �rst 1% normal log entries as training data and the otheruses the �rst 10% log entries for training. In both se�ings, theremaining 99% or 90% entries are used for anomaly detection. Weset L = 1, α = 256, д = 6, h = 3.
Precision Recall F-measure(a) First 1% dataset for training.
0.0
0.2
0.4
0.6
0.8
1.0
0.16
1.00
0.27
0.82
1.00
0.90
Precision Recall F-measure(b) First 10% dataset for training.
0.0
0.2
0.4
0.6
0.8
1.0
0.16
1.00
0.28
0.88
1.000.93
without online training with online training
Figure 10: Evaluation on Blue Gene/L log.
Figure 10 shows the results for without and with online trainingfor both experiments. In the case of “without online training”, werun DeepLog to test incoming log entries without any incrementalupdate. While for the case of “with online training”, we assumethere is an end user who reports if a detected anomaly is a falsepositive. If so, DeepLog uses that sample (now a labeled record)to update its model to learn this new pa�ern. Figure 10 showsthat without online training, with only 1% o�ine training data,this results in many false positives (hence very low Precision rate).�ough increasing its training data to 10% slightly increases thePrecision, its performance is still unsatisfactory. On the other hand,DeepLog with online training signi�cantly improves its Precision,and hence F-measure scores. With a true positive rate of 100%(perfect recall) in both se�ings, online training reduces false positive
rate from 40.1% to 1.7% for 1% training data, and from 38.2% to 1.1%for 10% training data, respectively.
Table 5 shows the amortized cost to check each log entry. Forthe online training case, we reported time taken for both detectionand online update (if an update is triggered). �e results show thatonline update and training does increase the amortized cost per logentry, but only slightly. �is is because many log entries will nottrigger an update. Note that online update and online detection canbe executed in parallel; an update is carried out while the model isusing the current weights to continue performing detection.
Table 5: Amortized cost to check each log entrytraining data percentage 1% 10%without online training (milliseconds) 1.06 1.11with online training (milliseconds) 3.48 2.46
5.4 Security log case studiesAnomalies having log keys that never showed up in normal logsused for training (e.g., “ERROR” or “exception” log messages) areeasy to detect. DeepLog can e�ectively detect much more subtlecases. For example, in HDFS log, “Namenode not updated a�erdeleting block” anomaly is shown as a missing log key in a session;and “Redundant addStoredBlock” anomaly is shown as an extra logkey. �is means that for any a�ack that may cause any change ofsystem behavior (as re�ected through logs), it can be detected. Inwhat follows, we investigate system logs containing real a�acks todemonstrate the e�ectiveness of DeepLog.
5.4.1 Network security log. Network security is of vital impor-tance. Both �rewall and intrusion detection system (IDS) producelogs that can be used for online anomaly detection.
To test the performance of DeepLog on network security logs, weused the VAST Challenge 2011 data set, speci�cally, Mini Challenge2 — Computer Networking Operations [1]. �is challenge is tomanually look for suspicious activities by visualization techniques.It comes with ground truth for anomalous activities. For all anom-alies in the ground truth, Table 6 shows the results of DeepLog. �eonly suspicious activity not being detected is the �rst appearanceof an undocumented computer IP address.
Table 6: VAST Challenge 2011 network security log detec-tionsuspicious activity detected?Day 1: Denial of Service a�ack Yes, log key anomaly in IDS logDay 1: port scan Yes, log key anomaly in IDS logDay 2: port scan 1 Yes, log key anomaly in IDS logDay 2: port scan 2 Yes, log key anomaly in IDS logDay 2: socially engineered a�ack Yes, log key anomaly in �rewall logDay 3: undocumented IP address No
�e only false positive case happened when DeepLog reported alog message that repeatedly appeared many times in a short periodas an anomaly. �is is due to an event that suddenly became burstyand printed the same log message many times in a short time range.�is is not identi�ed by the VAST Challenge as a suspicious activity.
5.4.2 BROP a�ack detection. Blind Return Oriented Program-ming (BROP) a�ack [5] leverages a fact that many server applica-tions restart a�er a crash to ensure service reliability. �is kindof a�ack is powerful and practical because the a�acker neitherrelies on access to source code nor binary. A stack bu�er over�owvulnerability, which leads server to crash, is su�cient to carry outthis a�ack. In a BROP exploit, the a�acker uses server crash as asignal to help complete a ROP a�ack which achieves executing ashellcode. However, the repeated server restarting activities leavemany atypical log messages in kernel log as shown below, which iseasily detected by DeepLog.nginx[*]: segfault at * ip * sp * error * in nginx[*]nginx[*]: segfault at * ip * sp * error * in nginx[*]nginx[*]: segfault at * ip * sp * error * in nginx[*]......
5.5 Task separation and work�ow constructionWe implemented the proposed methods in Section 4 and evaluatedon a log with various OpenStack VM-related tasks. Both LSTMapproach and density-based clustering approach could successfullyseparate all tasks. �e �rst method requires LSTM; it is a supervisedmethod which requires training data to be provided. �e secondmethod uses clustering on co-occurrences of log keys within a cer-tain distance threshold, which is an unsupervised method. Hence,it doesn’t require training, but it does require parameter τ as thedistance threshold.
Speci�cally, for density-based clustering approach, with a suf-�ciently large threshold value τ ∈ [0.85, 0.95], there is a clearseparation of all tasks. Note that the value of τ cannot be too large(e.g., se�ing τ = 1), as a background process may produce log en-tries at random locations that will break log entries from the sametask apart.
Next we use a part of the VM creation work�ow, to show how itprovides useful diagnosis of the performance anomaly in Section 5.2.Recall in Section 5.2, parameter value vector anomaly is identi�edon the time elapsed value of log key 53, and on the parameterposition of log key 56 (which represents how many seconds to buildinstance). As shown in Figure 11, once an anomaly is detected byDeepLog, we know the time taken to build that instance is abnormal,but we don’t know why. �en, since the elapsed time between logkey 53 and its previous log key is too big, by investigating thework�ow model constructed by DeepLog, its previous key is 52:“Creating image”, so we know that VM creation took longer timethan usual because the time to create image was too long. Furtherinvestigation following this procedure may reveal that it was causedby slow network speed from control node to compute node.
6 RELATEDWORKPrimarily designed for recording notable events to ease debugging,system event logs are abundantly informative and exist practicallyon every computer system, making them a valuable resource totrack and investigate system status. However, since system logs arelargely composed of diverse, freeform text, analytics is challenging.
Numerous log mining tools have been designed for di�erent sys-tems. Many use rule-based approaches [7, 15, 28, 29, 31, 32, 40, 41],which, though accurate, are limited to speci�c application scenar-ios and also require domain expertise. For example, Beehive [41]

44 23 52 53
3225
51
185457
56
18
44: instance: * Attempting claim: memory * disk * vcpus * CPU
51: instance: * Claim successful
23: instance: * GET * HTTP\/1.1" status: * len: * time: *
52: instance: * Creating image
53: instance: * VM Started (Lifecycle Event)
32: instance: * VM Paused (Lifecycle Event)
18: instance: * VM Resumed (Lifecycle Event)
.......
56: instance: * Took * seconds to build instance
Figure 11: OpenStack VM Creation work�ow.
identi�es potential security threats from logs by unsupervised clus-tering of data-speci�c features, and then manually labeling outliers.Oprea [28] uses belief propagation to detect early-stage enterpriseinfection from DNS logs. PerfAugur [32] is designed speci�cally to�nd performance problems by mining service logs using special-ized features such as predicate combinations. DeepLog is a generalapproach that does not rely on any domain-speci�c knowledge.
Other generic methods that use system logs for anomaly detec-tion typically apply a two-step procedure. First, a log parser [9, 14,16, 23, 36, 37] is used to parse log entries to structured forms, whichtypically only contain “log keys” (or “message types”). Parametervalues and timestamps are discarded except for identi�ers whichare used to separate and group log entries. �en, anomaly detectionis performed on log key sequences. A typical way is to generatea numeric vector for each session or time window, by countingunique log keys or using more sophisticated approaches like TF-IDF.�e matrix comprising of these vectors is then amenable to matrix-based unsupervised anomaly detection methods such as PrincipalComponent Analysis (PCA) [38, 39] and invariant mining (IM) [22].Constructing such a matrix is o�en an o�ine process, and thesemethods are not able to provide log-entry level anomaly detection(rather, they can only operate at session level). We refer the readerto [17] for an overview and comparison on these methods.
Supervised methods [17, 44] use normal and abnormal vectors totrain a binary classi�er that detects future anomalies. A downside ofsuch methods is that unknown anomalies not in training data maynot be detected. Furthermore, anomalous data are hard to obtainfor training. We have shown in our evaluation that using only asmall portion of normal data to train, DeepLog can achieve onlineanomaly detection with be�er performance. Moreover, DeepLogalso uses timestamps and parameter values for anomaly detectionwhich are missing in previous work.
Work�ow construction has been studied largely using log keysextracted from o�ine log �les [4, 11, 21, 42] . It has been shownthat work�ow o�ers limited advantage for anomaly detection [11,42]. Instead, a major utility of work�ows is to aid system diagno-sis [4, 21]. However, all past work assumes a log �le to model onlycontains repeated executions of one single task. In this paper, wepropose methods to automatically separate di�erent tasks from log�les in order to build work�ow models for di�erent tasks.
Besides work�ows, other systems that perform anomaly diag-nosis using system logs include DISTALYZER [26] that diagnosessystem performance issues by comparing a problematic log against
a normal one, LogCluster [19] which clusters and organizes histori-cal logs to help future problem identi�cation, and Stitch [45] thatextracts di�erent levels of identi�ers from system logs and buildsa web interface for users to visually monitor the progress of eachsession and locate performance problems. Note that they are fordiagnosis purposes once an anomaly has been detected, and cannotbe used for anomaly detection itself.
7 CONCLUSION�is paper presents DeepLog, a general-purpose framework foronline log anomaly detection and diagnosis using a deep neuralnetwork based approach. DeepLog learns and encodes entire logmessage including timestamp, log key, and parameter values. Itperforms anomaly detection at per log entry level, rather than atper session level as many previous methods are limited to. DeepLogcan separate out di�erent tasks from a log �le and construct a work-�ow model for each task using both deep learning (LSTM) andclassic mining (density clustering) approaches. �is enables e�ec-tive anomaly diagnosis. By incorporating user feedback, DeepLogsupports online update/training to its LSTM models, hence is ableto incorporate and adapt to new execution pa�erns. Extensive eval-uation on large system logs have clearly demonstrated the superiore�ectiveness of DeepLog compared with previous methods.
Future work include but are not limited to incorporating othertypes of RNNs (recurrent neural networks) into DeepLog to testtheir e�ciency, and integrating log data from di�erent applicationsand systems to perform more comprehensive system diagnosis (e.g.,failure of a MySQL database may be caused by a disk failure asre�ected in a separate system log).
8 ACKNOWLEDGMENT�e authors appreciate the valuable comments provided by theanonymous reviewers. Authors thank the support from NSF grants1314945 and 1514520. Feifei Li is also supported in part by NSFCgrant 61729202. We wish to thank all members of the TCloudproject and the Flux group for helpful discussion and feedback,especially Cai (Richard) Li, for his valuable input on BROP a�ack.
REFERENCES[1] VAST Challenge 2011. 2011. MC2 - Computer Networking Operations.
(2011). h�p://hcil2.cs.umd.edu/newvarepository/VAST%20Challenge%202011/challenges/MC2%20-%20Computer%20Networking%20Operations/ [Online; ac-cessed 08-May-2017].
[2] Martın Abadi, Paul Barham, Jianmin Chen, Zhifeng Chen, Andy Davis, Je�reyDean, Ma�hieu Devin, Sanjay Ghemawat, Geo�rey Irving, Michael Isard, andothers. 2016. TensorFlow: A system for large-scale machine learning. In Proc.USENIX Symposium on Operating Systems Design and Implementation (OSDI).264–285.
[3] Yoshua Bengio, Rejean Ducharme, Pascal Vincent, and Christian Jauvin. 2003. Aneural probabilistic language model. Journal of machine learning research 3, Feb(2003), 1137–1155.
[4] Ivan Beschastnikh, Yuriy Brun, Michael D Ernst, and Arvind Krishnamurthy.2014. Inferring models of concurrent systems from logs of their behavior withCSight. In Proc. International Conference on So�ware Engineering (ICSE ). 468–479.
[5] Andrea Bi�au, Adam Belay, Ali Mashtizadeh, David Mazieres, and Dan Boneh.2014. Hacking blind. In Security and Privacy (SP), 2014 IEEE Symposium on. IEEE,227–242.
[6] Franois Chollet. 2015. keras. h�ps://github.com/fchollet/keras. (2015). [Online;accessed 08-May-2017].
[7] Marcello Cinque, Domenico Cotroneo, and Antonio Pecchia. 2013. Event logsfor the analysis of so�ware failures: A rule-based approach. IEEE Transactionson So�ware Engineering (TSE) (2013), 806–821.

[8] Andrew M Dai and �oc V Le. 2015. Semi-supervised sequence learning. In Proc.Neural Information Processing Systems Conference (NIPS). 3079–3087.
[9] Min Du and Feifei Li. 2016. Spell: Streaming Parsing of System Event Logs. InProc. IEEE International Conference on Data Mining (ICDM). 859–864.
[10] Min Du and Feifei Li. 2017. ATOM: E�cient Tracking, Monitoring, and Orches-tration of Cloud Resources. IEEE Transactions on Parallel and Distributed Systems(2017).
[11] Qiang Fu, Jian-Guang Lou, Yi Wang, and Jiang Li. 2009. Execution anomalydetection in distributed systems through unstructured log analysis. In Proc. IEEEInternational Conference on Data Mining (ICDM). 149–158.
[12] Yoav Goldberg. 2016. A primer on neural network models for natural languageprocessing. Journal of Arti�cial Intelligence Research 57 (2016), 345–420.
[13] Ian Goodfellow, Yoshua Bengio, and Aaron Courville. 2016. Deep Learning. MITPress. h�p://www.deeplearningbook.org.
[14] Hossein Hamooni, Biplob Debnath, Jianwu Xu, Hui Zhang, Guofei Jiang, andAbdullah Mueen. 2016. LogMine: Fast Pa�ern Recognition for Log Analytics. InProc. Conference on Information and Knowledge Management (CIKM). 1573–1582.
[15] Stephen E Hansen and E Todd Atkins. 1993. Automated System Monitoringand Noti�cation with Swatch.. In Proc. Large Installation System AdministrationConference (LISA). 145–152.
[16] Pinjia He, Jieming Zhu, Shilin He, Jian Li, and Michael R Lyu. 2016. An evaluationstudy on log parsing and its use in log mining. In Proc. International Conferenceon Dependable Systems and Networks (DSN). 654–661.
[17] Shilin He, Jieming Zhu, Pinjia He, and Michael R Lyu. 2016. Experience Report:System Log Analysis for Anomaly Detection. In Proc. International Symposiumon So�ware Reliability Engineering (ISSRE). 207–218.
[18] Sepp Hochreiter and Jurgen Schmidhuber. 1997. Long short-term memory. Neuralcomputation (1997), 1735–1780.
[19] Qingwei Lin, Hongyu Zhang, Jian-Guang Lou, Yu Zhang, and Xuewei Chen.2016. Log clustering based problem identi�cation for online service systems. InProc. International Conference on So�ware Engineering (ICSE ). 102–111.
[20] Chaochun Liu, Huan Sun, Nan Du, Shulong Tan, Hongliang Fei, Wei Fan, TaoYang, Hao Wu, Yaliang Li, and Chenwei Zhang. 2016. Augmented LSTM Frame-work to Construct Medical Self-diagnosis Android. In Proc. IEEE InternationalConference on Data Mining (ICDM). 251–260.
[21] Jian-Guang Lou, Qiang Fu, Shengqi Yang, Jiang Li, and Bin Wu. 2010. Miningprogram work�ow from interleaved traces. In Proc. ACM SIGKDD InternationalConference on Knowledge Discovery and Data Mining (SIGKDD).
[22] Jian-Guang Lou, Qiang Fu, Shengqi Yang, Ye Xu, and Jiang Li. 2010. MiningInvariants from Console Logs for System Problem Detection.. In Proc. USENIXAnnual Technical Conference (ATC). 231–244.
[23] Adetokunbo AO Makanju, A Nur Zincir-Heywood, and Evangelos E Milios.2009. Clustering event logs using iterative partitioning. In Proc. ACM SIGKDDInternational Conference on Knowledge Discovery and Data Mining (SIGKDD).1255–1264.
[24] Christopher D Manning and Hinrich Schutze. 1999. Foundations of statisticalnatural language processing. MIT Press.
[25] Tomas Mikolov, Martin Kara�at, Lukas Burget, Jan Cernocky, and Sanjeev Khu-danpur. 2010. Recurrent neural network based language model.. In Interspeech,Vol. 2. 3.
[26] Karthik Nagaraj, Charles Killian, and Jennifer Neville. 2012. Structured compara-tive analysis of systems logs to diagnose performance problems. In Proc. USENIXSymposium on Networked Systems Design and Implementation (NSDI). 26–26.
[27] Christopher Olah. 2015. Understanding LSTM Networks. (2015). h�p://colah.github.io/posts/2015-08-Understanding-LSTMs [Online; accessed 16-May-2017].
[28] Alina Oprea, Zhou Li, Ting-Fang Yen, Sang H Chin, and Sumayah Alrwais. 2015.Detection of early-stage enterprise infection by mining large-scale log data. In
Proc. International Conference on Dependable Systems and Networks (DSN). 45–56.[29] James E Prewe�. 2003. Analyzing cluster log �les using Logsurfer. In Proc. Annual
Conference on Linux Clusters.[30] Robert Ricci, Eric Eide, and �e CloudLab Team. 2014. Introducing CloudLab:
Scienti�c Infrastructure for Advancing Cloud Architectures and Applications.USENIX ;login: 39, 6 (Dec. 2014). h�ps://www.usenix.org/publications/login/dec14/ricci
[31] John P Rouillard. 2004. Real-time Log File Analysis Using the Simple EventCorrelator (SEC).. In Proc. Large Installation System Administration Conference(LISA). 133–150.
[32] Sudip Roy, Arnd Christian Konig, Igor Dvorkin, and Manish Kumar. 2015. Per-faugur: Robust diagnostics for performance anomalies in cloud services. In Proc.IEEE International Conference on Data Engineering (ICDE). IEEE, 1167–1178.
[33] Elastic Stack. 2017. �e Open Source Elastic Stack. (2017). h�ps://www.elastic.co/products [Online; accessed 16-May-2017].
[34] Martin Sundermeyer, Ralf Schluter, and Hermann Ney. 2012. LSTM NeuralNetworks for Language Modeling.. In Interspeech. 194–197.
[35] Ilya Sutskever, Oriol Vinyals, and �oc V Le. 2014. Sequence to sequence learningwith neural networks. In Proc. Neural Information Processing Systems Conference(NIPS). 3104–3112.
[36] Liang Tang and Tao Li. 2010. LogTree: A framework for generating systemevents from raw textual logs. In Proc. IEEE International Conference on DataMining (ICDM). 491–500.
[37] Liang Tang, Tao Li, and Chang-Shing Perng. 2011. LogSig: Generating systemevents from raw textual logs. In Proc. Conference on Information and KnowledgeManagement (CIKM). 785–794.
[38] Wei Xu, Ling Huang, Armando Fox, David Pa�erson, and Michael Jordan. 2009.Online system problem detection by mining pa�erns of console logs. In Proc.IEEE International Conference on Data Mining (ICDM). 588–597.
[39] Wei Xu, Ling Huang, Armando Fox, David Pa�erson, and Michael I Jordan. 2009.Detecting large-scale system problems by mining console logs. In Proc. ACMSymposium on Operating Systems Principles (SOSP). 117–132.
[40] Kenji Yamanishi and Yuko Maruyama. 2015. Dynamic syslog mining for networkfailure monitoring. In Proc. ACM SIGKDD International Conference on KnowledgeDiscovery and Data Mining (SIGKDD). 499–508.
[41] Ting-Fang Yen, Alina Oprea, Kaan Onarlioglu, Todd Leetham, William Robertson,Ari Juels, and Engin Kirda. 2013. Beehive: Large-scale log analysis for detectingsuspicious activity in enterprise networks. In Proc. International Conference onDependable Systems and Networks (ACSAC). 199–208.
[42] Xiao Yu, Pallavi Joshi, Jianwu Xu, Guoliang Jin, Hui Zhang, and Guofei Jiang. 2016.CloudSeer: Work�ow Monitoring of Cloud Infrastructures via Interleaved Logs.In Proc. ACM International Conference on Architectural Support for ProgrammingLanguages and Operating Systems (ASPLOS). 489–502.
[43] Ding Yuan, Haohui Mai, Weiwei Xiong, Lin Tan, Yuanyuan Zhou, and ShankarPasupathy. 2010. SherLog: error diagnosis by connecting clues from run-timelogs. In ACM SIGARCH computer architecture news. ACM, 143–154.
[44] Ke Zhang, Jianwu Xu, Martin Renqiang Min, Guofei Jiang, Konstantinos Pelechri-nis, and Hui Zhang. 2016. Automated IT system failure prediction: A deep learn-ing approach. In Proc. IEEE International Conference on Big Data (IEEE BigData).1291–1300.
[45] Xu Zhao, Kirk Rodrigues, Yu Luo, Ding Yuan, and Michael Stumm. 2016. Non-intrusive performance pro�ling for entire so�ware stacks based on the �owreconstruction principle. In Proc. USENIX Symposium onOperating Systems Designand Implementation (OSDI). 603–618.