deep supervised t-distributed embedding - laurens … supervised t-distributed embedding renqiang...
TRANSCRIPT

Deep Supervised t-Distributed Embedding
Renqiang Min [email protected]
Department of Computer Science, University of Toronto
Laurens van der Maaten [email protected]
Department of Computer Science and Engineering, University of California, San DiegoFaculty of Electrical Engineering, Mathematics and Computer Science, Delft University of Technology
Zineng Yuan [email protected]
Department of Molecular Genetics, University of Toronto
Anthony Bonner [email protected]
Department of Computer Science, University of Toronto
Zhaolei Zhang [email protected]
Banting and Best Department of Medical Research, University of Toronto
Abstract
Deep learning has been successfully appliedto perform non-linear embedding. In this pa-per, we present supervised embedding tech-niques that use a deep network to collapseclasses. The network is pre-trained usinga stack of RBMs, and finetuned using ap-proaches that try to collapse classes. Thefinetuning is inspired by ideas from NCA, butit uses a Student t-distribution to model thesimilarities of data points belonging to thesame class in the embedding. We investi-gate two types of objective functions: deept-distributed MCML (dt-MCML) and deep t-distributed NCA (dt-NCA). Our experimentson two handwritten digit data sets reveal thestrong performance of dt-MCML in super-vised parametric data visualization, whereasdt-NCA outperforms alternative techniqueswhen embeddings with more than two orthree dimensions are constructed, e.g., to ob-tain good classification performances. Over-all, our results demonstrate the advantage ofusing a deep architecture and a heavy-tailedt-distribution for measuring pairwise similar-ities in supervised embedding.
Appearing in Proceedings of the 27 th International Confer-ence on Machine Learning, Haifa, Israel, 2010. Copyright2010 by the author(s)/owner(s).
1. Introduction
Given the class information of training data points,linear feature transformations and linear dimension-ality reductions have been widely applied to performhigh-dimensional data embedding either for data visu-alization or for k-NN classification. Various techniqueshave been proposed that learn a linear transforma-tion or Mahalanobis metric that tries to decrease thepairwise distances between data points with the sameclass, while increasing the separation between datapoints with dissimilar classes (Globerson & Roweis,2006; Goldberger et al., 2005; Weinberger et al., 2006;Xing et al., 2003). In other words, the techniques aimto collapse classes in a low-dimensional embedding1.
However, making data points that correspond thesame class collapse cannot always be achieved simplelinear transformations, especially when the data con-sists of one or more complex nonlinear (sub)manifolds.Hence, we need to resort to more powerful non-lineartransformations. Recent advances in the training ofdeep networks provide a way to model non-lineartransformations of data. Such deep networks are typ-ically pre-trained using, e.g., a stack of RestrictedBoltzmann Machines (RBMs; Hinton et al. (2006)) ordenoising autoencoders (Larochelle et al., 2007). Sub-sequently, the pre-trained networks are finetuned as to,
1In techniques that learn a Mahalanobis metric, thisembedding can be computed by projecting the data ontothe eigenvectors of the metric M (weighted by the square-root of the corresponding eigenvalues).

Deep Supervised t-Distributed Embedding
e.g., construct a generative model of the data (Hintonet al., 2006), learn a classifier (Larochelle et al., 2007),increase the separation between classes (Min et al.,2009; Salakhutdinov & Hinton, 2007; Weston et al.,2008), or preserve pairwise similarities between datapoints (van der Maaten, 2009).
In this paper, we present two supervised embed-ding techniques, called deep t-distributed MCML (dt-MCML) and deep t-distributed NCA (dt-NCA), thatuse a deep feedforward neural network to model thetransformation from the high-dimensional to the low-dimensional space. The networks are pre-trained us-ing a stack of RBMs, and finetuned by minimiz-ing objective functions that aim to collapse classes.The objective functions are inspired by the objectivefunctions of Maximally Collapsing Metric Learning(MCML; Globerson & Roweis (2006)) and Neighbor-hood Components Analysis (NCA; Goldberger et al.(2005)), but they use a Student t-distribution tomeasure the similarities for pairwise data points inlow-dimensional space. The advantage of using a t-distribution to measure these pairwise similarities isfour-fold: (1) due to the heavier tail of the distri-bution, it works better on data sets in which (someof) the class distributions are multimodal, (2) due tothe more peaked mode of the distribution, it leads totighter clusters, i.e., it collapses classes better, (3) theheavier tails lead to more separation between classes,and (4) due to the steeper gradient along the tail of thet-distribution, the optimization using gradient descentis easier.
We performed experiments with dt-MCML and dt-NCA on the USPS and MNIST handwritten digit datasets. The results of the experiments reveal the strongperformance of both techniques. In particular, dt-MCML performs very well in learning settings in whichthe dimensionality of the latent space is very low, e.g.,when performing data visualization. In contrast, if thedimensionality of the latent space is higher than two,dt-NCA obtains a superior performance.
The outline of this paper is as follows. In Section 2, weintroduce the two new embedding techniques, calleddt-MCML and dt-NCA. In Section 3, we present theresults of our experiments with the new techniques ontwo data sets. Section 4 concludes the paper.
2. Deep Supervised Embedding
In this section, we present the two new techniquesfor supervised parametric embedding. We present dt-MCML in Section 2.1, and dt-NCA in Section 2.2.
Figure 1. The deep network used in dt-MCML and dt-NCA(left) and an illustration of the pre-training of the deepneural network (right). Adopted from Min et al. (2009).
2.1. Deep t-distributed MCML
Suppose we are given a set of high-dimensional datapoints and their corresponding labels D = {x(i), y(i) :i = 1, . . . , n}, where x(i) ∈ RD, and y(i) ∈ {1, . . . , c},where c is the total number of classes. MCML learnsa Mahalanobis metric M that aims to simultaneouslyachieve two main goals: (1) it tries to maximize thesum of the pairwise similarities of data points withthe same class, and (2) it tries to minimize the sum ofthe pairwise similarities of data points with dissimilarclasses. In fact, learning a Mahalanobis metric is iden-tical to learning a linear mapping A of the data: thelinear mapping A is given by the eigenvectors of theMahalanobis metric M (weighted by the square-rootof their corresponding eigenvalues). MCML can thus
be thought of as learning a function f(x(i)) = Ax(i)
that transforms the high-dimensional data points toa latent space with d dimensions (i.e., A is a d × Dmatrix, where typically, d < D).
MCML measures the pairwise similarity of the trans-formed data point f(x(i)) and the transformed datapoint f(x(j)) using a stochastic neighborhood crite-rion. In other words, it centers a Gaussian distributionover f(x(i)), measures the density of f(x(j)) under thisGaussian, and renormalizes:
qj|i =exp(−d2ij)∑
k:k 6=i exp(−d2ik), qi|i = 0, (1)
where we defined:
d2ij = ||f(x(i))− f(x(j))||2.
The probabilities qj|i can be viewed as the probability

Deep Supervised t-Distributed Embedding
that the point f(x(i)) picks point f(x(j)) as its nearestneighbor in the latent space. MCML tries to minimizethe sum of the Kullback-Leibler divergences betweenthe conditional probabilities qj|i and “ground-truth”probabilities pj|i that are defined based on the classlabels of the data. Specifically, MCML defines pj|i ∝ 1
iff y(i) = y(j), and pj|i = 0 iff y(i) 6= y(j). The costfunction that MCML minimizes is given by:
`MCML =∑i
KL(Pi||Qi) =∑i
∑j:j 6=i
pj|i logpj|i
qj|i.
In deep t-distributed MCML, we follow a similar ap-proach as in MCML, however, we introduce three ma-jor changes. First, instead of parametrizing the func-tion f by means of a linear mapping A, we define thefunction f to be a feedforward neural network map-ping that is parametrized by the weights of the net-work W . Second, instead of measuring the similaritiesof the transformed data points by means of a Gaussiandensity, we measure densities under a Student-t distri-bution. Third, we change the normalization of thepairwise similarities, as this leads to significant simpli-fications in the gradient. Mathematically, we define:
qij =(1 + d2ij/α)−
1+α2∑
kl:k 6=l(1 + d2kl/α)−1+α2
, qii = 0, (2)
where α is represents the number of degrees of freedomof the Student-t distribution. The reader should notethat the following special cases of the t-distribution:when α = 1, the t-distribution is a Cauchy distribu-tion, whereas when α = ∞, the t-distribution is aGaussian distribution. The cost function is now de-fined to be:
`dt−MCML = KL(P ||Q) =∑i
∑j:j 6=i
pij logpijqij,
where pij ∝ 1 iff y(i) = y(j), pij = 0 iff y(i) 6= y(j), and∑ij pij = 1.
In the definition of qij above, the pairwise distanced2ij is defined similarly as in NCA, except for that thetransformation function f is not linear anymore. Inparticular, the function f : RD → Rd is a nonlinearfunction that is defined by a feed-forward neural net-work with weights W . The advantage of using a deepnetwork to parametrize the function f instead of a lin-ear mapping is that a deep network is better at learn-ing the complex nonlinear function that is presumablyrequired to collapse classes in the latent space, in par-ticular, when the data consists of very complex non-linear (sub)manifolds.
The use of a Student-t distribution in the pairwisesimilarities in Equation 2 has four main advantages
over the use of a Gaussian distribution (as in Equa-tion 1). First, the heavy tails of the Student-t distri-bution make the cost function somewhat more happywhen groups of dissimilar points with the same classare modeled far apart in the latent space. This isbeneficial in cases in which the distribution of one ormore classes is bimodal or multimodal: collapsing datapoints from the different modes onto a single mode inthe latent space is bound to lead to severe overfitting.Second, the peaked mode of the t-distribution (com-pared to a Gaussian distribution) leads the cost func-tion to favor solutions in which similar points with thesame class are modeled closer together, i.e., it leadsto tighter clusters in the embedding. Third, the useof t-distribution forces points with different classes tobe further apart in the latent space in order for theirsimilarity to become infinitesimal. Fourth, the use ofStudent-t distributions makes the gradient optimiza-tion easier, because the gradient of the tail of a Studentt-distribution is much steeper than that of a Gaussiandistribution. As a result, the t-distribution providesmore “long-range forces”, which makes it easier to col-lapse groups of points with the same class that areseparated at some point in the optimization.
The gradient of the cost function of dt-MCML withrespect to the location of a latent point f(x(i)) is givenby:
∂`dt−MCML
∂f(x(i))=∑j:j 6=i
2(α+ 1)
α
(1 +
d2ijα
)− 1+α2
(pij − qij)(f(x(i))− f(x(j))).
Using the gradient above, the gradients of the costfunction with respect to the weights W of the neuralnetwork can be computed using standard backpropa-gation. Although it is possible to treat the degrees offreedom α as a parameter, we can also try to learnits optimal value using gradient descent. The requiredgradient is given by:
∂`dt−MCML
∂α=∑ij:i 6=j
(pij − qij)
(1
2log
(1 +
d2ijα
)
−(1 + α)d2ij
2α2(1 +d2ijα )
.
We should note that for visualization purposes, a valueof α = 1 usually performs very well (van der Maaten,2009), and learning α is superfluous.
2.2. Deep t-distributed NCA
Collapsing classes typically works well for data visu-alization tasks (Globerson & Roweis, 2006), but col-

Deep Supervised t-Distributed Embedding
lapsing classes is unnecessary to obtain low nearestneighbor errors after high-dimensional data was em-bedded in a space with a dimensionality that is largerthan, say, two. If the dimensionality of the data isreduced to, say, 30 dimensions, the volume differencebetween the data space and the latent space is expo-nentially smaller than when the dimensionality of thedata is reduced to two dimensions. More importantly,the dimensionality of the latent space can be selectedas to match the intrinsic dimensionality of input data.In that case, it is not necessary to completely collapseclasses to obtain low nearest neighbor errors, in par-ticular, since collapsing classes may lead to overfitting.Hence, in learning settings in which the dimensionalityof the latent space is relatively large, directly minimiz-ing a smooth approximation to the nearest neighborerror, as is done in NCA, may work much better. Tothis end, we investigate a variant of NCA, called deept-distributed NCA (dt-NCA), that also parametrizesthe mapping from the data to the latent space bymeans of a deep neural network2 and that measuressimilarities in the latent space using a t-distribution.
The key difference between dt-NCA and dt-MCML,analogous to the key difference between NCA andMCML, is in the cost function that is minimized.In particular, dt-NCA tries to minimize the expectednearest neighbor error by minimizing a smooth ap-proximation of the nearest neighbor error:
`dt−NCA = −∑ij:i 6=j
δijqj|i,
where δij represents an indicator function, i.e., δijequals 1 if y(i) = y(j) and 0 otherwise, and where weused an asymmetric definition for the similarities qj|i:
qj|i =(1 + d2ij/α)−
1+α2∑
k:k 6=i(1 + d2ik/α)−1+α2
, qi|i = 0.
The motivation behind this definition of the similari-ties in the latent space is identical to the motivation forthe similarities in dt-MCML: it helps preventing over-fitting, it constructs tighter natural clusters of pointswith the same class, it improves separation betweenpoints with different classes, and it makes the gradi-ent optimization easier due to the presence of morelonge-range forces.
If we define uij =(
1 +d2ijα
)− 1+α2
and vij = f(x(i)) −f(x(j)), the gradient of `dt−NCA with respect to the
2The reader should note another nonlinear variant ofNCA was previously investigated by Salakhutdinov & Hin-ton (2007).
data representation in the latent space f(x(i)) is givenby:
∂`dt−NCA∂f(x(i))
=1 + α
α
∑j:j 6=i
δijqj|i
∑k:k 6=i
qk|iuikvik
+∑j:j 6=i
qi|jujivji
∑k:k 6=j
δjkqk|j
−∑j:j 6=i
δijqj|iuijvij −∑j:j 6=i
δjiqi|jujivji
.The gradient of `dt−NCA with respect to α can be cal-culated as follows:
∂`dt−NCA∂α
=∑i
∑j:i 6=j
δijqi|j
(1 + α
2uijd
2ijα−2
−1
2log uij
)−∑i
∑j:j 6=i
δijqj|i∑k:k 6=i
qk|i
(1 + α
2uikd
2ikα−2 − 1
2log uik
) .
3. Experiments
We performed experiments with dt-MCML and dt-NCA on the USPS and MNIST handwritten digit datasets in order to evaluate their performance. In order toinvestigate the effect of using a t-distribution insteadof a Gaussian distribution to measure similarities inthe latent space, we compare dt-MCML and dt-NCAto their counterparts that use a Gaussian distributionto measure the similarities (but that use the same deepneural network as parametrization of the function f).We refer to these variants as dG-MCML and dG-NCA,respectively. Both the pre-training and the finetuningfor dG-MCML and dG-NCA are identical to the pre-training and the finetuning of dt-MCML and dt-NCA,except for that the Student-t distributions in the def-inition of qij and qj|i are replaced by Gaussian distri-
butions (with variance σ = 1√2), respectively. Note
that this replacement also leads to different gradientsof the respective cost functions (the gradients for dG-NCA are derived by Salakhutdinov & Hinton (2007)).
In our experiments, we used the same network struc-ture that was proposed by Salakhutdinov & Hinton(2007), i.e, we use a D−500−500−2000−d network.Our selection of this architecture facilitates compar-isons with methods used in other papers. We pre-trained all neural networks using the pre-training pro-cedure described by Hinton & Salakhutdinov (2006).Following Hinton & Salakhutdinov (2006), we trained
Deep Supervised t-Distributed Embedding
Dimensionality d 2D 30DMCML 35.63± 0.44 5.53± 0.39dG-MCML 3.37± 0.18 1.67± 0.21dt-MCML (α = d− 1) 2.46± 0.35 1.73± 0.47dt-MCML (learned α) 2.80± 0.36 1.61± 0.36dG-NCA 10.22± 0.76 1.91± 0.22dt-NCA (α = d− 1) 5.11± 0.28 1.15± 0.21dt-NCA (learned α) 6.69± 0.92 1.17± 0.07
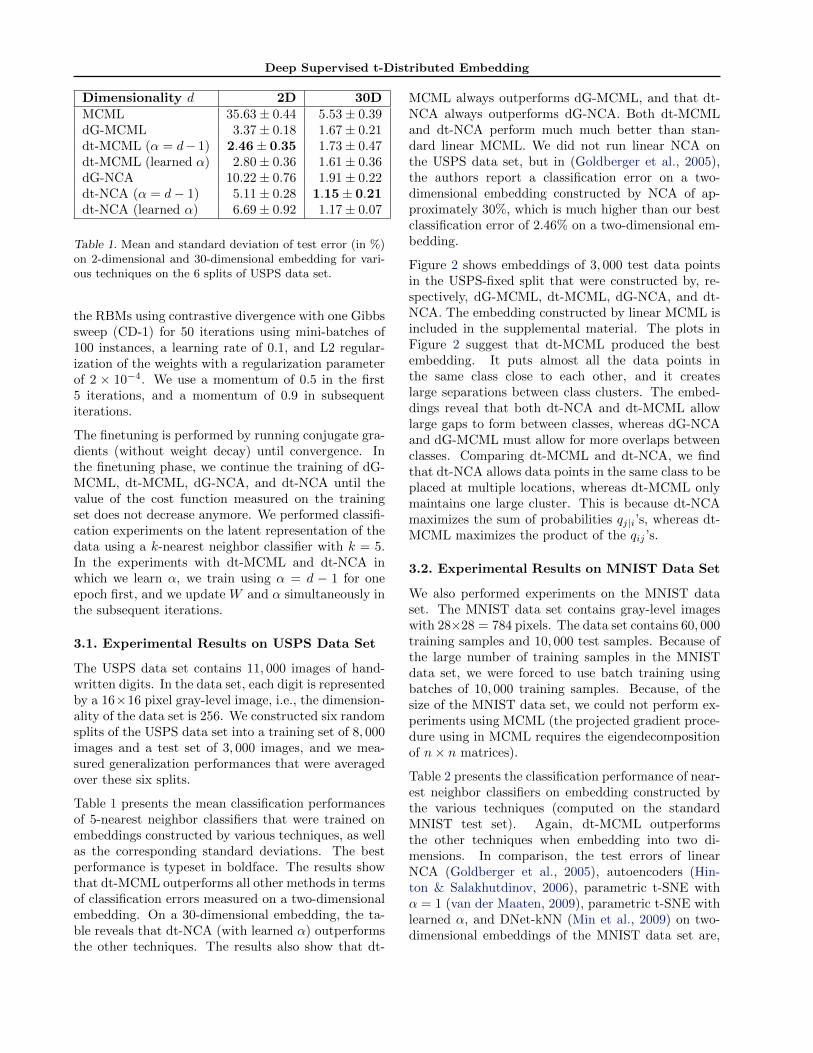
Table 1. Mean and standard deviation of test error (in %)on 2-dimensional and 30-dimensional embedding for vari-ous techniques on the 6 splits of USPS data set.
the RBMs using contrastive divergence with one Gibbssweep (CD-1) for 50 iterations using mini-batches of100 instances, a learning rate of 0.1, and L2 regular-ization of the weights with a regularization parameterof 2 × 10⁻⁴. We use a momentum of 0.5 in the first5 iterations, and a momentum of 0.9 in subsequentiterations.
The finetuning is performed by running conjugate gra-dients (without weight decay) until convergence. Inthe finetuning phase, we continue the training of dG-MCML, dt-MCML, dG-NCA, and dt-NCA until thevalue of the cost function measured on the trainingset does not decrease anymore. We performed classifi-cation experiments on the latent representation of thedata using a k-nearest neighbor classifier with k = 5.In the experiments with dt-MCML and dt-NCA inwhich we learn α, we train using α = d − 1 for oneepoch first, and we update W and α simultaneously inthe subsequent iterations.
3.1. Experimental Results on USPS Data Set
The USPS data set contains 11, 000 images of hand-written digits. In the data set, each digit is representedby a 16×16 pixel gray-level image, i.e., the dimension-ality of the data set is 256. We constructed six randomsplits of the USPS data set into a training set of 8, 000images and a test set of 3, 000 images, and we mea-sured generalization performances that were averagedover these six splits.
Table 1 presents the mean classification performancesof 5-nearest neighbor classifiers that were trained onembeddings constructed by various techniques, as wellas the corresponding standard deviations. The bestperformance is typeset in boldface. The results showthat dt-MCML outperforms all other methods in termsof classification errors measured on a two-dimensionalembedding. On a 30-dimensional embedding, the ta-ble reveals that dt-NCA (with learned α) outperformsthe other techniques. The results also show that dt-
MCML always outperforms dG-MCML, and that dt-NCA always outperforms dG-NCA. Both dt-MCMLand dt-NCA perform much much better than stan-dard linear MCML. We did not run linear NCA onthe USPS data set, but in (Goldberger et al., 2005),the authors report a classification error on a two-dimensional embedding constructed by NCA of ap-proximately 30%, which is much higher than our bestclassification error of 2.46% on a two-dimensional em-bedding.
Figure 2 shows embeddings of 3, 000 test data pointsin the USPS-fixed split that were constructed by, re-spectively, dG-MCML, dt-MCML, dG-NCA, and dt-NCA. The embedding constructed by linear MCML isincluded in the supplemental material. The plots inFigure 2 suggest that dt-MCML produced the bestembedding. It puts almost all the data points inthe same class close to each other, and it createslarge separations between class clusters. The embed-dings reveal that both dt-NCA and dt-MCML allowlarge gaps to form between classes, whereas dG-NCAand dG-MCML must allow for more overlaps betweenclasses. Comparing dt-MCML and dt-NCA, we findthat dt-NCA allows data points in the same class to beplaced at multiple locations, whereas dt-MCML onlymaintains one large cluster. This is because dt-NCAmaximizes the sum of probabilities qj|i’s, whereas dt-MCML maximizes the product of the qij ’s.
3.2. Experimental Results on MNIST Data Set
We also performed experiments on the MNIST dataset. The MNIST data set contains gray-level imageswith 28×28 = 784 pixels. The data set contains 60, 000training samples and 10, 000 test samples. Because ofthe large number of training samples in the MNISTdata set, we were forced to use batch training usingbatches of 10, 000 training samples. Because, of thesize of the MNIST data set, we could not perform ex-periments using MCML (the projected gradient proce-dure using in MCML requires the eigendecompositionof n× n matrices).
Table 2 presents the classification performance of near-est neighbor classifiers on embedding constructed bythe various techniques (computed on the standardMNIST test set). Again, dt-MCML outperformsthe other techniques when embedding into two di-mensions. In comparison, the test errors of linearNCA (Goldberger et al., 2005), autoencoders (Hin-ton & Salakhutdinov, 2006), parametric t-SNE withα = 1 (van der Maaten, 2009), parametric t-SNE withlearned α, and DNet-kNN (Min et al., 2009) on two-dimensional embeddings of the MNIST data set are,

Deep Supervised t-Distributed Embedding
−19 −14 −9
−23
−18
−13
−73 −58 −43 −28 −13 2 17 32 47 62 76−52
−42
−32
−22
−12
−2
8
18
28
38
48
58
68
0
1
2
3
4
5
6
7
8
9
−50 0 50 100
−40
−20
0
20
40
60
80
−200 −100 0 100 200
−100
−50
0
50
100
150
200
250
Figure 2. Two-dimensional embeddings of 3, 000 USPS test data points constructed by dG-MCML (top left), dt-MCML(top right), dG-NCA (bottom left), and dt-NCA (bottom right).
respectively, 56.84%, 24.7%, 9.9%, 12.68%, and 2.65%.By contrast, the error obtained by dt-MCML is 2.03%.
The results in Table 2 also reveal that, when we areembedding into 30 dimensions, dt-NCA (learned α)outperforms all other techniques. The best perfor-mance of dt-NCA of 0.92% is on par with the state-of-the-art results on the MNIST techniques (if addingperturbed digits to the training data is not allowed).
Figure 3 shows embeddings of the 10, 000 test datapoints in the MNIST data set constructed by the var-ious techniques. The embeddings reveal that bothdt-NCA and dt-MCML form large separations be-tween classes, whereas dG-NCA and dG-MCML pro-duce overlaps between many of the classes in the data.
4. Concluding Remarks
In this paper, we presented two techniques for super-vised parametric dimensionality reduction that useddeep networks. The experimental results presentedin the previous section reveal that dt-MCML out-performs its linear counterpart MCML and its Gaus-sian counterpart with a deep architecture (dG-MCML)when it is used to construct two-dimensional em-beddings, whereas dt-NCA outperforms its linearcounterpart and its Gaussian counterpart (dG-NCA;Salakhutdinov & Hinton (2007)) when it is used to em-bed data into a space with a dimensionality larger thantwo. Taken together, our results demonstrate the ad-vantage of using a deep architecture to parametrize the

Deep Supervised t-Distributed Embedding
−28 −23 −18 −157
12
16
−60 −40 −20 0 20 40
−20
0
20
40
60
0
1
2
3
4
5
6
7
8
9
−26 −24 −22 −20 −18 −16
8
9
10
11
12
13
14
15
−150 −100 −50 0 50 100 150 200
−150
−100
−50
0
50
100
Figure 3. Two-dimensional embeddings of 10, 000 MNIST test data points constructed by dG-MCML (top left), dt-MCML(top right), dG-NCA (bottom left), and dt-NCA (bottom right).
Dimensionality d 2D 30DdG-MCML 2.13 1.49dt-MCML (α = d− 1) 2.03 1.63dt-MCML (learned α) 2.14 1.49dG-NCA 7.95 1.11dt-NCA (α = d− 1) 3.48 0.92dt-NCA (learned α) 3.79 0.93
Table 2. Test error (in %) on 2-dimensional and 30-dimensional embedding for various techniques on theMNIST data set.
mapping, as well as the merits of using a heavy-tailedStudent t-distribution to measure the pairwise sim-ilarities between the low-dimensional representationsof the data points.
We did not yet explain in detail why dt-MCML per-forms better than dt-NCA when constructing two-dimensional embeddings, wheras dt-NCA performsbetter than dt-MCML when constructing embeddingsof a higher dimensionality. This is because dt-MCMLtries to collapse all the data points in each class toone point by maximizing the product of the probabil-ities qij , whereas dt-NCA tries to bring data points inthe same class together by maximizing the sum of theasymmetric probabilities qj|i. As a result, when em-bedding into two dimensions, the objective of dt-NCAcan be roughly maximized by setting some of the qi|j ’svery large and others very small on training data, tocompromise for the limited amount of space availablein a two-dimensional space. By contrast, such a set-ting of the qij ’s is not favored by dt-MCML. In fact,the dt-MCML cost function typically does not allow

Deep Supervised t-Distributed Embedding
some of the qij ’s to be set very small, thus prohibitingdata points in the same class from spreading out. Thisproperty of dt-MCML has advantages and disadvan-tages. When embedding in a two-dimensional space,collapsing classes is often good because the availablespace to accommodate multiple clusters correspondingto the same class is very limited. However, in latentspaces with a higher dimensionality, there is enoughspace to accommodate dissimilar data points, as a re-sult of which the collapsing of classes becomes super-fluous and leads to overfitting. In contrast, dt-NCAdoes not require all the data points in the same classto stay very close to each other in the latent space, asa result of which it performs better when embeddingin a, say, 30-dimensional latent space.
The success of dt-MCML is closely related to the re-cent success of t-SNE (van der Maaten & Hinton, 2008)in unsupervised dimensionality reduction. However,the reader should note that the reason for the suc-cess of t-SNE is a different one. In t-SNE, the use ofthe Student t-distribution helps to avoid the crowd-ing problem. The crowding problem occurs when onetries to preserve local similarity structure in a low-dimensional data representation, which forces one tomodel dissimilar points to far apart. The use of theStudent-t distribution resolves this problem, because itallows dissimilar points to modeled to far apart. In dt-MCML, the aim of the use of a Student t-distributionis to force data points with the same class to collapsebetter, i.e., to form tight clusters, while increasing thegaps between points with dissimilar labels. The lattercharacteristic of dt-MCML and dt-NCA is shared witht-SNE: they all encourage larger separations to formbetween different natural clusters.
An additional advantage of dt-MCML over MCMLthat we did not discuss yet is its computational com-plexity. Even though dt-MCML is the deep non-linear extension of MCML, dt-MCML scales very wellto massive high-dimensional data sets (although thisdoes require a batch training procedure). By contrast,MCML is slow when it is applied on large data sets(even in batch training procedures) because it usesa projected gradient descent optimizer that performsmany eigendecompositions of n× n matrices.
In future work, we aim to investigate extensions of dt-MCML and dt-NCA that include an additional termpenalizing reconstruction error from a deep autoen-coder in order to improve the performance of our ap-proach in semi-supervised learning settings. Moreover,we aim to investigate pre-training approaches using de-noising autoencoders instead of RBMs.
Acknowledgements
Laurens van der Maaten is supported by the Nether-lands Organisation for Scientific Research (NWO;grant no. 680.50.0908), and by EU-FP7 Social SignalProcessing. The authors thank Geoffrey Hinton, AmirGloberson, and Xiaojian Shao for helpful discussions.
References
Globerson, A. and Roweis, S. Metric learning by col-lapsing classes. In NIPS, pp. 451–458. 2006.
Goldberger, J., Roweis, S., Hinton, G., and Salakhut-dinov, R. Neighbourhood components analysis. InNIPS, pp. 513–520. 2005.
Hinton, G. and Salakhutdinov, R. Reducing the di-mensionality of data with neural networks. Science,313(5786):504–507, 2006.
Hinton, G., Osindero, S., and Teh, Y.W. A fast learn-ing algorithm for deep belief nets. Neural Computa-tion, 18(7):1527–1554, 2006.
Larochelle, H., Erhan, D., Courville, A., Bergstra, J.,and Bengio, Y. An empirical evaluation of deep ar-chitectures on problems with many factors of varia-tion. In ICML, pp. 473–480. 2007.
Min, R., Stanley, D., Yuan, Z., Bonner, A., and Zhang,Z. A deep non-linear feature mapping for large-margin kNN classification. In ICDM, pp. 357–366.2009.
Salakhutdinov, R. and Hinton, G. Learning a nonlin-ear embedding by preserving class neighbourhoodstructure. In AI-STATS, pp. 412–419, 2007.
van der Maaten, L. Learning a parametric embeddingby preserving local structure. AI-STATS, pp. 384–391, 2009.
van der Maaten, L. and Hinton, G. Visualizing datausing t-SNE. JMLR, 9:2579–2605, November 2008.
Weinberger, K., Blitzer, J., and Saul, L. Distance met-ric learning for large margin nearest neighbor clas-sification. In NIPS, pp. 1473–1480. 2006.
Weston, J., Ratle, F., and Collobert, R. Deep learningvia semi-supervised embedding. In ICML, pp. 1168–1175, 2008.
Xing, E., Ng, A., Jordan, M., and Russell, S. Distancemetric learning with application to clustering withside-information. In NIPS, pp. 505–512. 2003.