deep learning in histopathology - vu · deep learning in histopathology research paper business...
TRANSCRIPT

Deep Learning in Histopathology
Research Paper Business Analytics
Bram Rodenburg
Supervisor: Ted Meeds
June 2016
VU University AmsterdamFaculty of SciencesBusiness AnalyticsDe Boelelaan 1081a
1081 HV AmsterdamThe Netherlands
ii
Preface
This research paper was written as part of the Business Analytics master pro-gram at the VU University Amsterdam. The research paper (6 EC) is a requiredcomponent within the program in which the student should address a topic ofchoice that incorporates the business-related aspect of the program as well asthe computer-science and mathematics aspects. The production of the paper isplanned at the end of the second semester (June) of the master.
In this paper I address how deep learning, a field of study within computerscience, could assist (histo)pathologists with some of their tasks. Tasks thatare often time consuming and tedious, and known for being exposed to inter-observer variability. My goal throughout this paper is twofold. On one hand, Ihope to show how deep learning can assist pathologists in their work. On theother, I like to show practitioners of machine learning some problems withinhistopathology that are currently addressed with deep learning techniques.
Bram RodenburgAmsterdam, June 2016

iii
Management Summary
In clinical practice a task of the pathologist is to analyze human tissue fordisease by microscopic examination. However, many of these tasks are exposedto inter-observer variability and are time consuming (therefore costly). Clearly,automating these tasks has two main advantages. First, the quality of diagnosescould be improved since an automated approach could give more consistent andaccurate outcomes. This in turn can result in a better assessment of a patient’streatment. Second, time and costs of these tasks can be reduced since manuallyperformed tasks by a pathologist are now automated.
The automation of tasks within pathology is now possible since in the recentyears pathology labs started to move towards more digital workflows. In theseapproaches microscopes are substituted by scanners, resulting in the availabilityof digital tissue images (called whole slides). As a result, it is now possible toapply image analysis techniques - techniques that can perform some of the tasksa pathologist would normally need to do manually.
A technique for image analysis that has proven to work extremely effectivein practice is called deep learning. Deep learning is a class of methods that canautomatically discover representations from raw data. One such a method isthe convolutional neural network (CNN). Namely, CNNs have shown to workparticularly well on image detection and classification tasks. For this paper, aliterature study was conducted to demonstrate how deep learning is applied tocertain tasks in histopathology.
One task in histopathology is mitosis counting. Namely, the mitotic countcan be used as a factor to grade the severity of breast cancer. For this task, apathologist needs to select several regions of interest within a whole-slide andcount the mitotic figures in these regions. Several deep learning techniques havebeen researched for the actual mitosis counting, outperforming all other non-deep learning methods. However, selecting the regions of interest has not beenaddressed yet in a deep learning setting.
Another task addressed with deep learning is that of gland segmentation.Namely, to determine the severity of colon cancer, a pathologists requires toobtain several statistics of the glands in the colon to make a correct diagnosis.To automatically obtain these statistics an automated approach must first needto segment the glands and determine whether the gland is malignant or benign.CNNs have shown to be able to perform these tasks also quite well.
Two other tasks addressed with deep learning are glioma grading and tissuesegmentation. For the glioma grading, a deep learning approach was capableof accurately determining the grade of a glioma. For the second task, a CNNwas used to segment regions in a whole slide into epithelial and stromal regions.Although this task is not directly related to grading a disease, it can be viewedas an intermediate step that could be required for such a task.
To bring automated tasks such as the previous mentioned into clinical prac-tice at least three obstacles need to be addressed. First, more data needs tobe made publicly available so that other tasks than the ones described in thispaper can be addressed as well using automated methods. Second, bringing au-

iv
tomated methods into clinical practice requires regulatory approval. Obtainingthis approval can be a costly and time consuming process. Third, training deeplearning models requires a sufficient amount of data. However, this data canoften not leave the hospital due to regulations and privacy concerns. Therefore,methods should need to be developed that enable the training of deep learn-ing models that can be shared between hospitals while respecting the privacyconcerns.

Contents
Preface ii
Management Summary iii
Introduction 1
1 Histopathology 31.1 Need for Image Analysis Techniques . . . . . . . . . . . . . . . 31.2 Clinical Use . . . . . . . . . . . . . . . . . . . . . . . . . . . . 3
2 Deep Learning 62.1 Feed-Forward Neural Networks . . . . . . . . . . . . . . . . . 62.2 Convolutional Neural Networks . . . . . . . . . . . . . . . . . 8
3 Deep learning in Histopathology 93.1 Mitosis Counting . . . . . . . . . . . . . . . . . . . . . . . . . 93.2 Grading Gliomas . . . . . . . . . . . . . . . . . . . . . . . . . 123.3 Segmenting Epithelial and Stromal Regions . . . . . . . . . . 133.4 Gland Segmentation . . . . . . . . . . . . . . . . . . . . . . . 14
4 Challenges and Opportunities 164.1 Availability of Data . . . . . . . . . . . . . . . . . . . . . . . . 164.2 Regulatory Approval . . . . . . . . . . . . . . . . . . . . . . . 164.3 Privacy . . . . . . . . . . . . . . . . . . . . . . . . . . . . . . . 16
Conclusion 18
References 21
v

1
Introduction
One approach to study a disease is by microscopic examination of human tissue.Often, this tissue is obtained by means of a biopsy. After a biopsy is performedin an operating room, the tissue is send to a pathology lab. In this lab apathologist prepares the tissue and then analyzes it for a specific disease. Thefield concerned with analyzing human tissue for a particular decease is calledhistopathology.
Common practice in pathology labs is to analyze the tissue using micro-scopes. However, in the recent years pathology labs started to move towardsdigital workflows [1]. Instead of using a microscope, a scanner is used that pro-cesses the tissue and produces a digital image of the tissue, called a whole-slideimage. As a result, it is now possible to apply image analysis techniques tothese images - techniques that could aid pathologists in solving several existingproblems.
An example of a problem that could be addressed using image analysis tech-niques is mitosis counting. Namely, the number of mitotic figures can be usedas a factor for grading the severity of breast cancer [2]. However, obtaining themitotic count can be time consuming [3] and is exposed to inter-observer vari-ability (different pathologists recognizing different mitotic figures) [4]. Clearly,if an image analysis tool could perform this task, the inter-observer variabilityand the duration of the task could be reduced.
A technique that has proven to be very successful in discovering complexstructures within high-dimensional data, such as whole-slide images, is calleddeep learning [5]. Deep learning methods are capable of automatically learningrepresentations of the data that are needed for tasks such as detection andclassification. There already have been several scientific competitions in whichimage analysis techniques were applied to histopathological problems [3][6][7].In all of these competitions, deep learning methods were the best performingmethods.
This research paper addresses how deep learning is currently applied in thefield of histopathology and some opportunities on how it could be applied.Therefore, the research question addressed in this paper is as follows:
Research Question. How can deep learning be used in the field of histopathol-ogy to improve the quality of diagnoses while reducing time and costs?
To address this research question, a literature study was conducted to determinehow deep learning is currently applied within the field of histopathology. Thishas not yet been performed. In [8] a general review of image analysis techniqueswas given but did not address any deep learning techniques for histopathology.In [9] the potential of deep learning in histopathology was shown but no reviewof the actual techniques were given.

2
Organization of This Paper
The remainder of this paper is organised as follows. In the first section, a briefoverview of the field of histopathology is given. In the second section, an intro-duction to deep learning is given. In the third section, deep learning techniquesused in histopathology are reviewed. The fourth section discusses challengesthat need to be addressed to successfully embed deep learning techniques intoclinical practice.

1 Histopathology 3
1 Histopathology
Histopathology is the field concerned with analyzing human tissue for a certaindisease. In clinical practice, the process of analyzing human tissue roughly goesas follows [1]. First, a biopsy is taken from a patient and send to the pathologylab. Next, in the lab the tissue is stained and prepared on a glass slide. Thepurpose of the staining is to highlight specific structures of the tissue. Forexample, staining tissue with hematoxylin and eosin (H&E) gives nuclei a darkpurple color and other structures a pink color. After the tissue is prepared andstained, a pathologist can examine the tissue using a microscope.
1.1 Need for Image Analysis Techniques
In the recent years, pathology labs started to favor scanners instead of micro-scopes [1]. Such a scanner can process a tissue and store the scan as a digitalimage, called a whole-slide image. This whole-slide image can then be visual-ized on a screen, substituting the need to examine the tissue using a microscope.As a result of working digitally, pathology labs now start to collect whole-slideimage data. The presence of this data enables pathology labs to automate somemanual tasks by using image analysis techniques.
There are numerous of advantages for automating tasks performed by apathologist. First, automating tasks can increase the quality of the diagnosis.Namely, several (histo)pathological tasks are exposed to inter-observer variabil-ity, meaning pathologists can differ in their assessment. As a result, a patholo-gist can (unknowingly) assign the wrong grade to the disease. Obviously, thiscan result in giving the patient the wrong treatment. This can have (dramatic)consequences for the patient, but it can also result in giving the patient a toocostly therapy.
A second advantage is cost reduction. Enabling a software solution to per-form some of the work a pathologist does can reduce the amount of pathologicalwork. Depending on the degree of automation, a hospital could potentially de-crease the number of working hours of the pathologist, assign the pathologistto a different task or even employ less pathologists.
The third advantage is more pleasant working conditions for the pathologist.Namely, some tasks within histopathology are regarded as tedious. Clearly,automating these tasks can make the work of the pathologist more pleasant.Furthermore, it also allows the pathologist to focus more on the diagnosis itselfand less on the supportive tasks required to do the diagnosis.
1.2 Clinical Use
Throughout the remainder of this section, a brief introduction is given to someof the tasks in histopathology for which image analysis techniques have beendeveloped. Since a complete overview is out-of-scope for this paper, only tasksare discussed for which deep learning techniques are presented in section 3 ofthis paper.
1 Histopathology 4
1.2.1 Mitosis Counting in Breast Cancer
A commonly used grading system for breast cancer is the Nottingham gradingsystem [10]. The system differentiates three types of grades, indicating theseverity of the cancer. To determine the grade, three morphological features areused by microscopic examination of the tissue. These features are:
1. Tubule formation
2. Nuclear grade
3. Mitotic activity
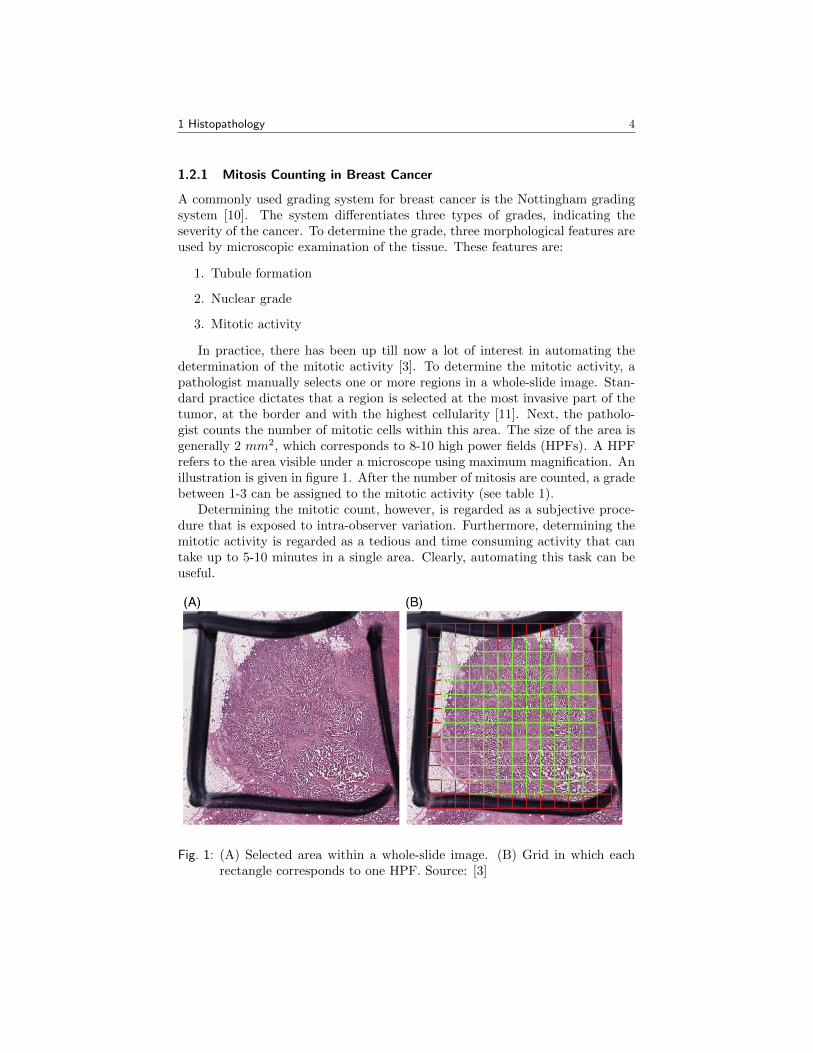
In practice, there has been up till now a lot of interest in automating thedetermination of the mitotic activity [3]. To determine the mitotic activity, apathologist manually selects one or more regions in a whole-slide image. Stan-dard practice dictates that a region is selected at the most invasive part of thetumor, at the border and with the highest cellularity [11]. Next, the patholo-gist counts the number of mitotic cells within this area. The size of the area isgenerally 2 mm2, which corresponds to 8-10 high power fields (HPFs). A HPFrefers to the area visible under a microscope using maximum magnification. Anillustration is given in figure 1. After the number of mitosis are counted, a gradebetween 1-3 can be assigned to the mitotic activity (see table 1).
Determining the mitotic count, however, is regarded as a subjective proce-dure that is exposed to intra-observer variation. Furthermore, determining themitotic activity is regarded as a tedious and time consuming activity that cantake up to 5-10 minutes in a single area. Clearly, automating this task can beuseful.
Fig. 1: (A) Selected area within a whole-slide image. (B) Grid in which eachrectangle corresponds to one HPF. Source: [3]
1 Histopathology 5
Mitotic Count Score< 6 1
6− 10 2> 10 3
Tab. 1: The mitotic count in a 2 mm2 area is used to determine the score forthe mitotic activity.
1.2.2 Grading Brain Gliomas
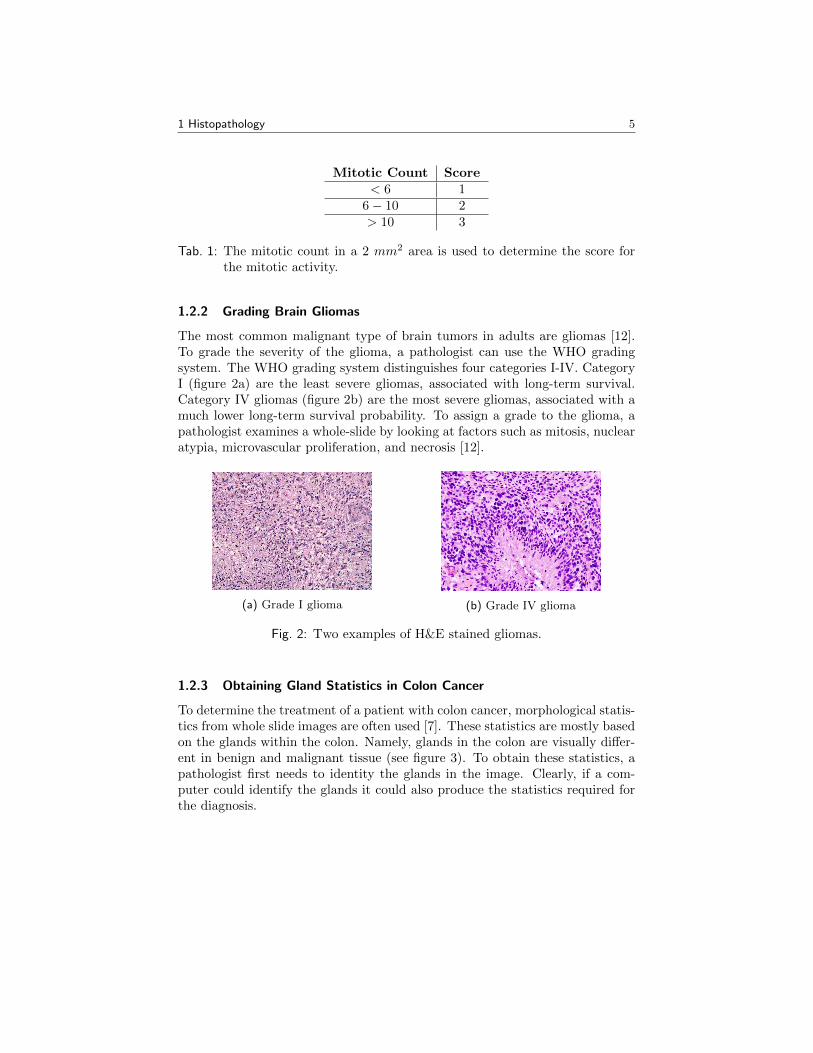
The most common malignant type of brain tumors in adults are gliomas [12].To grade the severity of the glioma, a pathologist can use the WHO gradingsystem. The WHO grading system distinguishes four categories I-IV. CategoryI (figure 2a) are the least severe gliomas, associated with long-term survival.Category IV gliomas (figure 2b) are the most severe gliomas, associated with amuch lower long-term survival probability. To assign a grade to the glioma, apathologist examines a whole-slide by looking at factors such as mitosis, nuclearatypia, microvascular proliferation, and necrosis [12].
(a) Grade I glioma (b) Grade IV glioma
Fig. 2: Two examples of H&E stained gliomas.
1.2.3 Obtaining Gland Statistics in Colon Cancer
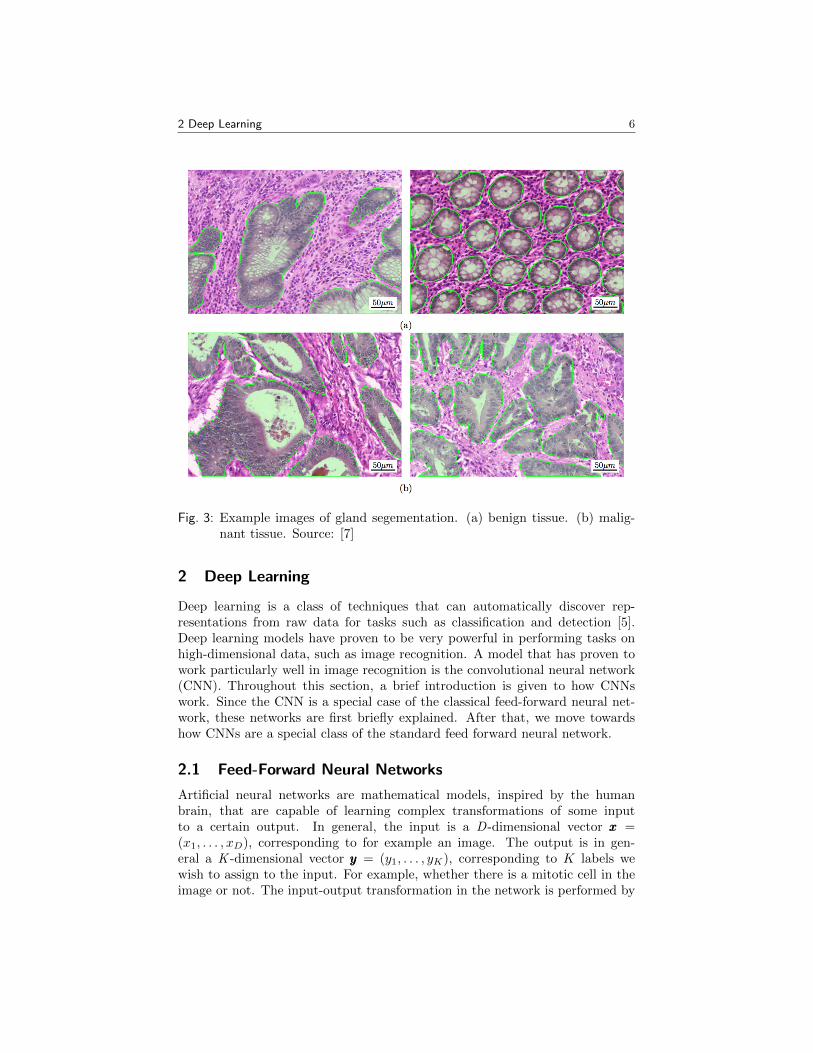
To determine the treatment of a patient with colon cancer, morphological statis-tics from whole slide images are often used [7]. These statistics are mostly basedon the glands within the colon. Namely, glands in the colon are visually differ-ent in benign and malignant tissue (see figure 3). To obtain these statistics, apathologist first needs to identity the glands in the image. Clearly, if a com-puter could identify the glands it could also produce the statistics required forthe diagnosis.
2 Deep Learning 6
Fig. 3: Example images of gland segementation. (a) benign tissue. (b) malig-nant tissue. Source: [7]
2 Deep Learning
Deep learning is a class of techniques that can automatically discover rep-resentations from raw data for tasks such as classification and detection [5].Deep learning models have proven to be very powerful in performing tasks onhigh-dimensional data, such as image recognition. A model that has proven towork particularly well in image recognition is the convolutional neural network(CNN). Throughout this section, a brief introduction is given to how CNNswork. Since the CNN is a special case of the classical feed-forward neural net-work, these networks are first briefly explained. After that, we move towardshow CNNs are a special class of the standard feed forward neural network.
2.1 Feed-Forward Neural Networks
Artificial neural networks are mathematical models, inspired by the humanbrain, that are capable of learning complex transformations of some inputto a certain output. In general, the input is a D-dimensional vector xxx =(x1, . . . , xD), corresponding to for example an image. The output is in gen-eral a K -dimensional vector yyy = (y1, . . . , yK), corresponding to K labels wewish to assign to the input. For example, whether there is a mitotic cell in theimage or not. The input-output transformation in the network is performed by

2 Deep Learning 7
neurons - the basic building blocks of a neural network. In these networks neu-rons are grouped together in layers. Between these layers neurons are connectedto each other, feeding the output of the neurons in one layer as input to theneurons in a consecutive layer. Furthermore, each of these connections betweenneurons have a weight associated with them. In this section, we assume neuronsin a layer are only connected to neurons in a previous and next layer. Networksthat exploit this property are called feed-forward neural networks.
In a feed-forward neural network the output i of a neuron i in one layer is fedas input to the neurons in a consecutive layer. Each neuron j in this consecutivelayer first linearly transforms the output of the neurons in the previous layer bytaking the dot product of the weights of the connections wwwj with the outputs ofthe neurons. Next, a nonlinear activation function φ(·) is applied to the outputof the linear transformation (1). The output zj of this neuron is then fed to thenext layer in the neural network unless it is the last layer in the network. Inthis case yyy is used as notation for the output.
zj = φ(∑i
[wjizi]) (1)
Now to evaluate an input for the network, one simply starts by computingthe outputs of the first layer. Next, the outputs of the first layer can then begiven to second layer and so on. Finally, the last layer of the network gives theactual output. The process of transforming the input, using the network, to theoutput is called the forward pass. However, to correctly predict the output thenetwork first needs to be trained. That is, the weights of the connections needto be determined.
A common approach to train a neural network is by stochastic gradientdescent. In order to do this, a ground-truth labelled dataset {xxxn, tttn}Nn=1 isused, where xxxn and tttn correspond respectively to the n’th input vector and then’th output label. For each input vector xxxn we can compare the output of thenetwork yyyn with the desired output tttn. Using an certain error metric E(yyy, ttt) wecan then compute the error of the network. Using this error and the gradientof the error function we can then update the weights www of the network. Theseupdates can then be repeated through the dataset for numerous iterations. Theupdate rule for stochastic gradient descent takes in general the following form(2), where τ corresponds to the current training iteration.
www(τ+1) = www(τ) − η∇En(www(τ)) (2)
To determine the gradient of the error function En, a technique called back-propagation is used. Backpropagation basically consists out of four steps. First,a forward pass is made through the network by applying an input vector xxxn tothe network and evaluating all activations of the hidden and output units. Sec-ond, all the outputs of the network are evaluated, using the error function En.Third, using the evaluated outputs, we can compute backwards to determineall the errors throughout the network. Lastly, we can use the outputs of eachneuron and the corresponding errors to determine the gradient.

2 Deep Learning 8
2.2 Convolutional Neural Networks
A CNN is a special type of feed-forward neural network that works specificallywell for images. CNNs can be trained in the same manner as feed-forwardneural networks. However, CNNs basically differ from ’classical’ feed-forwardneural networks by exploiting two properties, namely: 1) local-connectivity and2) weight sharing. The local-connectivity property implies that neurons fromone layer are only partially connected to the neurons in the previous or nextlayer. This in contrast to the standard feed-forward neural network in which allneurons from one layer are fully connected to the neurons in an adjacent layer.The weight sharing property implies that groups of neurons within a layer sharethe same parameters. The two properties together enable the CNN to learnmore complex feature representations in each layer. Furthermore, it ensurestraining the neural network remains computationally feasible.
The type of layer within the CNN that incorporates the previous mentionedproperties is called the convolutional layer (see figure 4). Groups of neuronswithin this layer that share the same weights are called filters. Each neuronis such a filter is only locally connected to the previous layer. A layer canhave multiple of these filters (corresponding to the depth of a layer), each thatbasically will learn an aspect of the data. Furthermore, each filter also has awidth and height, multiplied together corresponding to the number of neuronsin the filter.
Fig. 4: An illustration of how a convolutional layer is connected to a previouslayer. Here the depth of the cube corresponds to the number of filterswithin the layer. Source: [13]
Another type of layer that is commonly used within a CNN is the subsam-pling layer (see figure 5). The purpose of the subsampling layer is to reducethe dimensionality of the network. As a result, the number of parameters inthe network that need to be estimated are reduced. The max-pooling layer isgenerally used as subsampling layer. An unit in the max-pooling layer takes themaximum of a certain area within a filter. However, it maintains the depth ofthe layer it is applied to.

3 Deep learning in Histopathology 9
3 Deep learning in Histopathology
In this section several deep learning approaches to tasks within in histopathologyare discussed.
3.1 Mitosis Counting
As discussed in the histopathology section of this paper, the mitotic activitycan be used as a factor to grade the severity of breast cancer. To determine themitotic activity, two tasks need to be performed. First, a pathologist selects oneor more areas in the whole-slide image in which to perform the mitosis counting.This task is referred to as region of interest selection task. After the areas aredetermined, the pathologist can perform the actual mitosis counting. In orderto do this, the pathologist needs to correctly identify mitosis in the selectedareas. This task is referred to as the mitosis detection task.
3.1.1 Region of interest selection
Although selecting the regions of interest within a whole-slide image for themitosis counting is required, it has not yet been addressed in a deep learningsetting. Most deep learning approaches up till now solely address the mitosisdetection task. However, at the time of the writing of this paper a competitionwas organized that incorporates both the mitosis detection as well as the regionof interest selection task [11].
3.1.2 Mitosis detection
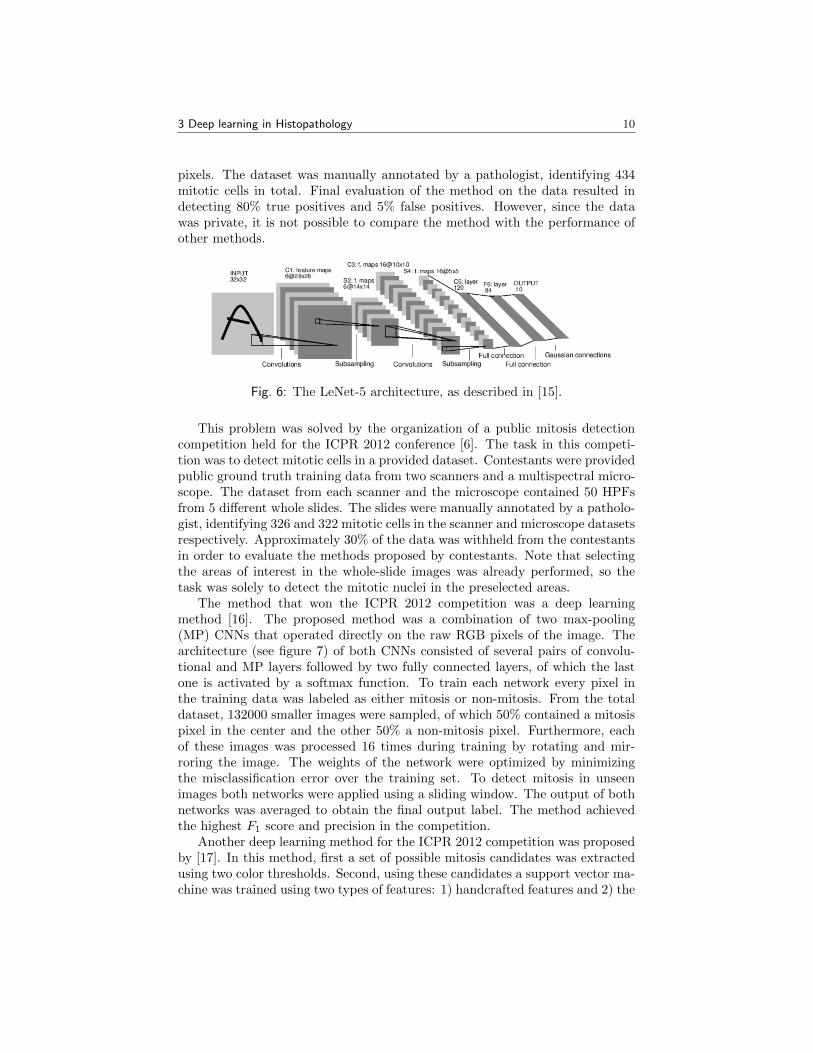
In 2008, [14] were the first to apply deep learning to mitosis detection. To detectmitotic cells in an image, two different classifiers were used. First, support vectorregression (SVR) was applied to the color histogram of the image to predict amitotic color threshold. The rational behind this threshold is that mitotic nucleiexhibit a different color than ordinary nuclei. Therefore, the threshold can beused to filter obvious non-mitotic figures. Images that pass the SVR classifierare passed to the second classifier, a CNN. Although the exact architecture ofthe CNN is not given, it is revealed that it is loosely based on LeNet5 [15] (seefigure 6). The complete mitosis detection method was trained and evaluated ona private dataset of 728 images. Each image had a resolution of 1024 by 768
Fig. 5: An illustration of the pooling layer, in which the size of the filters isshrunk but the number of filters remained the same. Source:[13]
3 Deep learning in Histopathology 10
pixels. The dataset was manually annotated by a pathologist, identifying 434mitotic cells in total. Final evaluation of the method on the data resulted indetecting 80% true positives and 5% false positives. However, since the datawas private, it is not possible to compare the method with the performance ofother methods.
Fig. 6: The LeNet-5 architecture, as described in [15].
This problem was solved by the organization of a public mitosis detectioncompetition held for the ICPR 2012 conference [6]. The task in this competi-tion was to detect mitotic cells in a provided dataset. Contestants were providedpublic ground truth training data from two scanners and a multispectral micro-scope. The dataset from each scanner and the microscope contained 50 HPFsfrom 5 different whole slides. The slides were manually annotated by a patholo-gist, identifying 326 and 322 mitotic cells in the scanner and microscope datasetsrespectively. Approximately 30% of the data was withheld from the contestantsin order to evaluate the methods proposed by contestants. Note that selectingthe areas of interest in the whole-slide images was already performed, so thetask was solely to detect the mitotic nuclei in the preselected areas.
The method that won the ICPR 2012 competition was a deep learningmethod [16]. The proposed method was a combination of two max-pooling(MP) CNNs that operated directly on the raw RGB pixels of the image. Thearchitecture (see figure 7) of both CNNs consisted of several pairs of convolu-tional and MP layers followed by two fully connected layers, of which the lastone is activated by a softmax function. To train each network every pixel inthe training data was labeled as either mitosis or non-mitosis. From the totaldataset, 132000 smaller images were sampled, of which 50% contained a mitosispixel in the center and the other 50% a non-mitosis pixel. Furthermore, eachof these images was processed 16 times during training by rotating and mir-roring the image. The weights of the network were optimized by minimizingthe misclassification error over the training set. To detect mitosis in unseenimages both networks were applied using a sliding window. The output of bothnetworks was averaged to obtain the final output label. The method achievedthe highest F1 score and precision in the competition.
Another deep learning method for the ICPR 2012 competition was proposedby [17]. In this method, first a set of possible mitosis candidates was extractedusing two color thresholds. Second, using these candidates a support vector ma-chine was trained using two types of features: 1) handcrafted features and 2) the

3 Deep learning in Histopathology 11
Fig. 7: The architectures of the two CNNs used in [16].
output of a CNN. The CNN itself was trained using all positive mitosis instancesand approximately 1000 randomly chosen negative non-mitosis instances. Eachinstance was processed multiple times by mirroring and rotating. The CNN it-self was modelled after the LeNet 5 architecture, using two convolutional layers.The method achieved an f -measure of 0.659 and 0.589 on respectively the colorscanner and multispectral scanner images.
The dataset used for the ICPR 2012 competition was however relativelysmall. Furthermore, the dataset also did not take variability in the tissueappearance and staining into account. To address this problem, in 2013 theAMIDA13 challenge was organized [3]. The dataset from the challenge con-sisted of 23 whole slides images. From these images, HPFs (represented asimages of 2000 by 2000 pixels) were extracted that at least contained one mi-totic cell. Furthermore, variability in tissue appearance and staining was alsotaking into account. Namely, the slides were selected from a longer period oftime to incorporate the differences in staining. Furthermore, pathologists fromdifferent institutions were asked to annotate the data in order to reduce theinter-observer variance.
The same team that won the 2012 competition also won the AMIDA13 com-petition. The team used a similar approach to their previous work [16], butinstead employed a Multi-Column MP CNN [3]. Three CNNs were trained on20 million samples extracted from the dataset. Of these 20 million samples, 10percent were randomly sampled images with a mitosis pixel in the center. Theremaining images were images in which the center had a non-mitosis pixel. Ofthese remaining images, 50 percent were non-mitosis images that looked rela-tively similar to the mitosis images. The training of each network took approx-imately 3 days for GPU optimized implementation. The output probabilities ofthe CNNs were averaged and used to obtain the final mitotic figures.
Another deep learning method was proposed by [18], in which an approachwas presented that combines a lightweight CNN with handcrafted features. Theapproach consists out of two stages. In the first stage a CNN on the raw pixelsand a random forest classifier using handcrafted features are trained indepen-dently to classify whether an instance contains mitosis or not. If both classifiers

3 Deep learning in Histopathology 12
Fig. 8: Classification workflow as described [18].
agree upon the label, the label is assigned to the instance. For the instanceson which the classifiers disagree, a second stage exists. In this stage, a thirdclassifier is trained that combines the outputs of the previous two classifiersand makes the final decision on the label (see figure 8 for an illustration of theprocess).
After the competition ended, [19] proposed a deep cascaded neural networkapproach that consists out of two phases. In the first phase a CNN is usedfor fast retrieval of mitosis candidates in the image. The model processes non-overlapping patches of 94 by 94 pixels extracted from the image and assigns anoutput score to the patch in the image. The CNN is composed out of threepairs of convolutional and max-pooling layers, followed by two fully connectedlayers. In the second step three CNNs are used to detect mitosis in all positivepatches determined by the first CNN. To detect mitotic cells in these patches,the CNNs moves through the patch by using a sliding window. The CNNs inthe second step were based on CaffeNet [20]. However, the CNNs differ in thenumber of neurons in the output layers.
3.2 Grading Gliomas
In [12] deep learning is used for the automated grading of gliomas. For thistask, a pipeline of two CNNs was used. The first CNN in the pipeline classifieswhether the grade of the tumor is IV or II−III. If the first CCN assigns gradeII − III to the tumor, a second CNN is used to provide whether the grade isactually II or III. Grade I tumors were not considered since these are usuallycured by surgical resection.
The architecture of the first CNN is modelled after the LeNet-architecture[15] (see figure 9). The CNN consists of 8 layers, including convolution, pooling,ReLU and fully connected layers. The last layer in a softmax layer. The secondCNN is deeper than the first CNN, incorporating 19 layers. To classify tissue ina whole-slide image, the image was first split into smaller tiles of 1024 by 1024pixels. If a tile contained less than 90% tissue it was rejected. The accepted tileswere segmented into smaller images of 256 by 256 pixels, called e-microbiopsies(see figure 10). The e-microbiopsies were eventually fed to the classificationpipeline. The proposed method was trained and evaluated on publicly avail-able whole-slide images from The Cancer Genome Atlas (TCGA). The first andsecond CNN achieved an accuracy of respectively 96% and 71% on this dataset.

3 Deep learning in Histopathology 13
Fig. 9: Overview of the architecture of the two CNNs used for glioma grading[12].. (Left) Shows the architecture of the first CNN in the pipeline.(Right) Shows the architecture of the other CNN.
Fig. 10: (A) An whole-slide image is split into tiles of size 1024 by 1024 pixels.(B) A tile is split into smaller images of 256 by 256 pixels called e-microbiopsy samples. (C) The e-microbiopsy samples are eventuallyfed to the classification pipeline. Source: [12]
3.3 Segmenting Epithelial and Stromal Regions
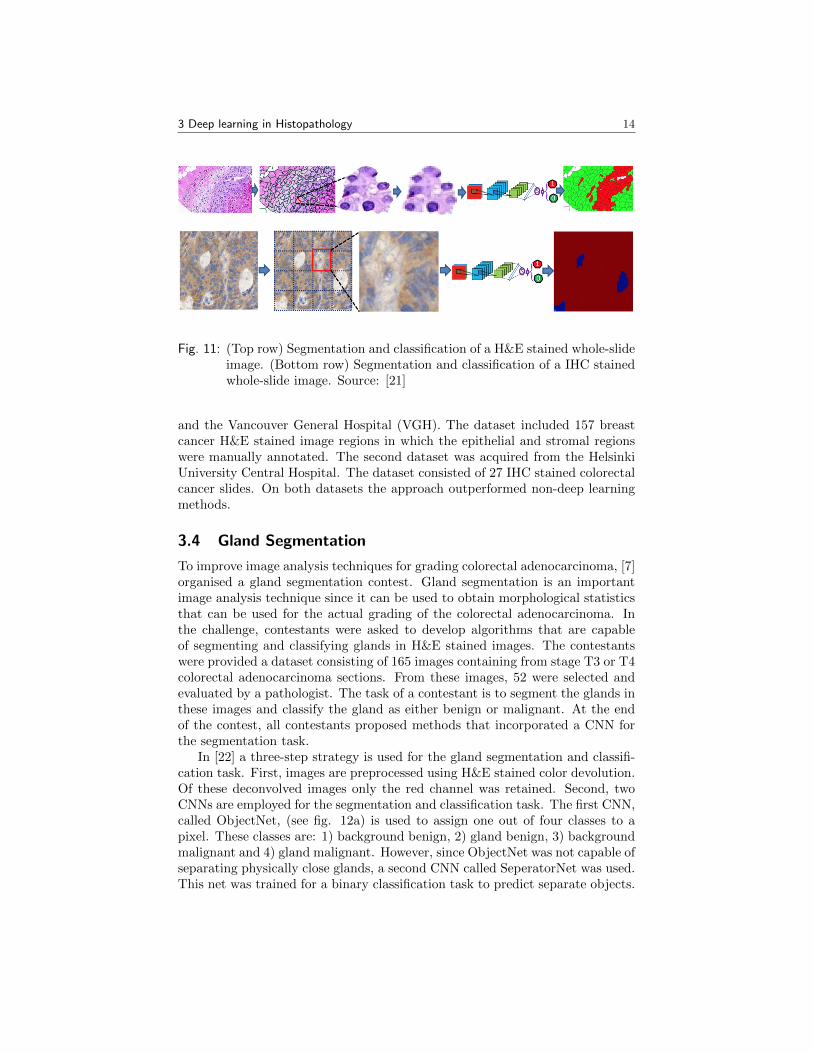
In [21] the task of segmenting and classifying epithelial and stromal regions inboth H&E and IHC stained tissue images is presented. The address this task atwo step process is described (see figure 11). First, the tissue is segmented us-ing machine learning clustering techniques. H&E stained slides were segmentedusing the Normalized Cut (Ncut) algorithm or the Simple Linear Iterative Clus-tering (SLIC) algorithm, whereas the IHC stained images were segmented usinga fixed-size windows. Second, the segmented areas were classified as either ep-ithelial or stromal by employing a CNN.
The CNN consisted out of two concecutive pairs of convolutional and pool-ing layers, followed by two fully connected layers. The final classification wasperformed by using a support vector machine (SVM) or soft-max. The architec-ture of the CNN is as follows. First, two consecutive pairs of layers consisting ofa convolutional and pooling layer were used. Second, two fully connected layerswere employed. Lastly, the classification was performed using a support vectormachine (SVM) or using soft-max.
The complete approach was trained and evaluated on two different datasets.The first dataset was acquired from the Netherlands Cancer Institute (NKI)
3 Deep learning in Histopathology 14
Fig. 11: (Top row) Segmentation and classification of a H&E stained whole-slideimage. (Bottom row) Segmentation and classification of a IHC stainedwhole-slide image. Source: [21]
and the Vancouver General Hospital (VGH). The dataset included 157 breastcancer H&E stained image regions in which the epithelial and stromal regionswere manually annotated. The second dataset was acquired from the HelsinkiUniversity Central Hospital. The dataset consisted of 27 IHC stained colorectalcancer slides. On both datasets the approach outperformed non-deep learningmethods.
3.4 Gland Segmentation
To improve image analysis techniques for grading colorectal adenocarcinoma, [7]organised a gland segmentation contest. Gland segmentation is an importantimage analysis technique since it can be used to obtain morphological statisticsthat can be used for the actual grading of the colorectal adenocarcinoma. Inthe challenge, contestants were asked to develop algorithms that are capableof segmenting and classifying glands in H&E stained images. The contestantswere provided a dataset consisting of 165 images containing from stage T3 or T4colorectal adenocarcinoma sections. From these images, 52 were selected andevaluated by a pathologist. The task of a contestant is to segment the glands inthese images and classify the gland as either benign or malignant. At the endof the contest, all contestants proposed methods that incorporated a CNN forthe segmentation task.
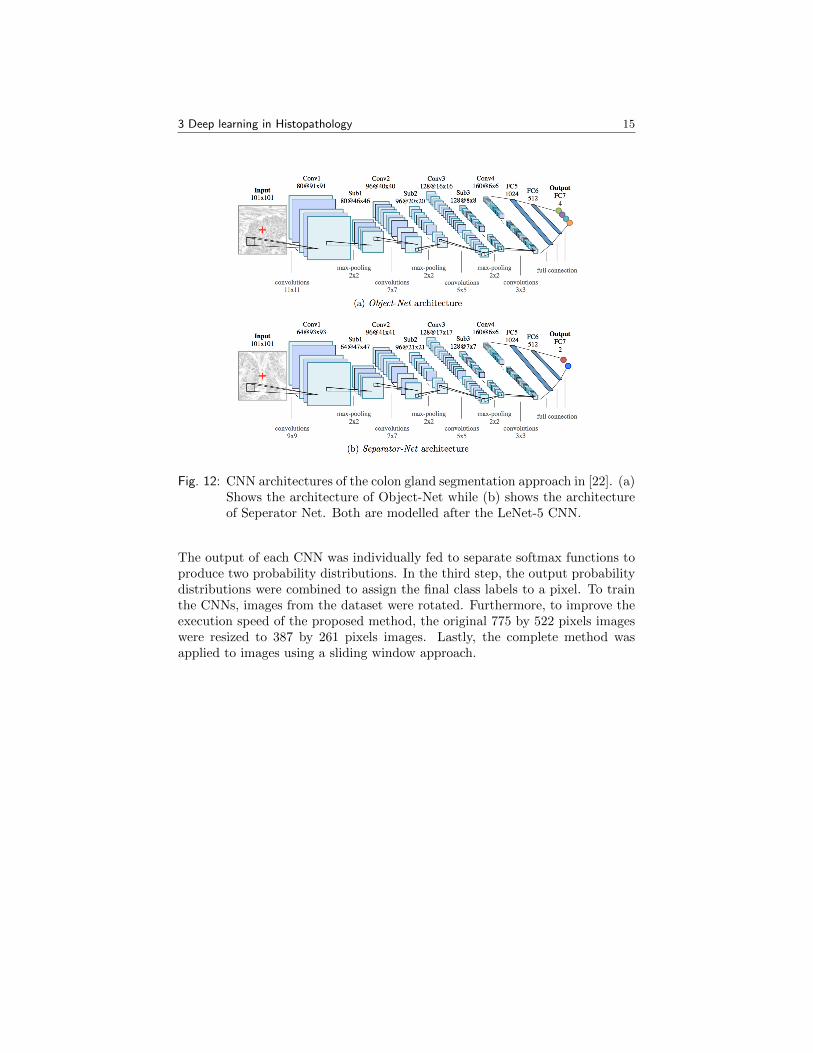
In [22] a three-step strategy is used for the gland segmentation and classifi-cation task. First, images are preprocessed using H&E stained color devolution.Of these deconvolved images only the red channel was retained. Second, twoCNNs are employed for the segmentation and classification task. The first CNN,called ObjectNet, (see fig. 12a) is used to assign one out of four classes to apixel. These classes are: 1) background benign, 2) gland benign, 3) backgroundmalignant and 4) gland malignant. However, since ObjectNet was not capable ofseparating physically close glands, a second CNN called SeperatorNet was used.This net was trained for a binary classification task to predict separate objects.
3 Deep learning in Histopathology 15
Fig. 12: CNN architectures of the colon gland segmentation approach in [22]. (a)Shows the architecture of Object-Net while (b) shows the architectureof Seperator Net. Both are modelled after the LeNet-5 CNN.
The output of each CNN was individually fed to separate softmax functions toproduce two probability distributions. In the third step, the output probabilitydistributions were combined to assign the final class labels to a pixel. To trainthe CNNs, images from the dataset were rotated. Furthermore, to improve theexecution speed of the proposed method, the original 775 by 522 pixels imageswere resized to 387 by 261 pixels images. Lastly, the complete method wasapplied to images using a sliding window approach.

4 Challenges and Opportunities 16
4 Challenges and Opportunities
Although research on deep learning in histopathology made real progress, therestill exists a gap between the proposed methods in research and actually usingthose methods in clinical practice. Throughout this section, three challenges arepresented that need to be addressed to bring deep learning into clinical practice.
4.1 Availability of Data
As the mitosis detection competitions [6] [3] and the gland segmentation com-petition [7] showed, making data available in the form of a challenge can greatlyhelp advance image analysis techniques in histopathology. Namely, these chal-lenges can greatly incentivize others to develop new methods. Furthermore,these challenges also make the evaluation of different types of methods moretransparent and easier to compare.
However, there are clearly many other tasks within histopathology that couldbenefit from image analysis techniques but that not yet have been addressed yet.Making data publicly available could create an incentive for others to developand test methods for this. Clearly, this can help to create better and moreadvanced methods.
4.2 Regulatory Approval
A major obstacle for a business or institution can be to get regulatory approvalfor using deep learning in clinical practice [23]. Regulatory approval is given inthe US by the Food and Drug Administration whereas in the EU this is doneby the European Medicines Agency (EMA).
To get approval in the US clinical software that employs deep learning needsto be cleared under the agency’s 510(k) process. However, this process is knownfor being both time and cost consuming. According to [24] the average cost toget a 510(k) product from concept to market is 31$ million. Moreover, it takesa company on average 51 months from first communication with the FDA toapproval. This in contrast to CE approval in the EU that takes on average 11months according to the same report. Although the costs of solely a softwareproduct is possibly lower than the average, getting approval is a huge barrierfor getting deep learning software into clinical practice.
4.3 Privacy
Another challenge for both business and hospitals that needs to be addressedis that of privacy. Namely, hospitals and other health care providers are oftenrequired to keep medical data of a patient confidential. As a result, medical datacan often not leave the institution. This imposes a challenge for deep learningtechniques since these techniques often are highly dependent on vasts amountof data to be available for training. Clearly, both businesses as well as healthcare providers need to determine how to address this problem.

4 Challenges and Opportunities 17
A possible solution to this problem is employing decentralized learning [25].That is, instead of having a central data repository on which the learning algo-rithm is trained, hospitals keep their data local. Instead, an algorithm is locallytrained on the data of the hospital and the parameters of the algorithm are thenpushed to a central host. From this central location the parameters can thenagain be redistributed among other hospitals. As a result, health care providerscan still maximally make use of deep learning techniques while keeping theirdata confidential.

4 Challenges and Opportunities 18
Conclusion
In this paper was reviewed how deep learning is used for several tasks within thefield of histopathology. Namely, it was discussed why image analysis techniquessuch as deep learning can be beneficial for (histo)pathologists. Furthermore, itwas shown how deep learning is applied to 1) mitosis counting, 2) glioma grad-ing, 3) gland segmentation and 4) epithelial and stromal region segmentation.Lastly, three challenges for bringing deep learning into clinical practice werediscussed.
For future work, a more extensive review of deep learning techniques withinhistopathology is possible. Namely, in this work only a handful of tasks to whichdeep learning is applied were described. However, these tasks are not the onlytasks addressed with deep learning in histopathology.

REFERENCES 19
References
[1] N. Stathonikos, M. Veta, A. Huisman, and P. van Diest, “Going fully digi-tal: perspective of a dutch academic pathology lab,” Journal of PathologyInformatics, vol. 4, no. 1, p. 15, 2013.
[2] E. A. Rakha, M. E. El-Sayed, A. H. Lee, C. W. Elston, M. J. Grainge, Z.Hodi, R. W. Blamey, and I. O. Ellis, “Prognostic significance of notting-ham histologic grade in invasive breast carcinoma,” Journal of ClinicalOncology, 2008.
[3] M. Veta, P. J. van Diest, S. M. Willems, H. Wang, A. Madabhushi, A.Cruz-Roa, F. Gonzalez, A. B. Larsen, J. S. Vestergaard, A. B. Dahl, D.C. Ciresan, J. Schmidhuber, A. Giusti, L. M. Gambardella, F. B. Tek, T.Walter, C.-W. Wang, S. Kondo, B. J. Matuszewski, F. Precioso, V. Snell,J. Kittler, T. E. de Campos, A. M. Khan, N. M. Rajpoot, E. Arkoumani,M. M. Lacle, M. A. Viergever, and J. P. Pluim, “Assessment of algorithmsfor mitosis detection in breast cancer histopathology images,” MedicalImage Analysis, vol. 20, no. 1, pp. 237 –248, 2015.
[4] H. F. Frierson, R. A. Wolber, K. W. Berean, D. W. Franquemont, M. J.Gaffey, J. C. Boyd, and D. C. Wilbur, “Interobserver reproducibility of thenottingham modification of the bloom and richardson histologic gradingscheme for infiltrating ductal carcinoma,” American Journal of ClinicalPathology, vol. 103, no. 2, pp. 195–198, 1995.
[5] Y. LeCun, Y. Bengio, and G. Hinton, “Deep learning,” Nature, vol. 521,pp. 436–444, 2015.
[6] L. Roux, D. Racoceanu, N. Lomenie, M. Kulikova, H. Irshad, J. Klossa,F. Capron, C. Genestie, G. Naour, and M. Gurcan, “Mitosis detection inbreast cancer histological images an icpr 2012 contest,” Journal of Pathol-ogy Informatics, vol. 4, no. 1, p. 8, 2013.
[7] K. Sirinukunwattana, J. P. W. Pluim, H. Chen, X. Qi, P. Heng, Y. B.Guo, L. Y. Wang, B. J. Matuszewski, E. Bruni, U. Sanchez, A. Bohm,O. Ronneberger, B. B. Cheikh, D. Racoceanu, P. Kainz, M. Pfeiffer, M.Urschler, D. R. J. Snead, and N. M. Rajpoot, “Gland segmentation incolon histology images: The glas challenge contest,” CoRR, 2016. [Online].Available: http://arxiv.org/abs/1603.00275.
[8] M. N. Gurcan, L. E. Boucheron, A. Can, A. Madabhushi, N. M. Rajpoot,and B. Yener, “Histopathological image analysis: A review,” IEEE Re-views in Biomedical Engineering, vol. 2, pp. 147–171, 2009.
[9] G. Litjens, C. Sanchez, N. Timofeeva, M. Hermsen, I. Nagtegaal, I. Kovacs,C. Hulsbergen-van de Kaa, P. Bult, B. van Ginneken, and J. van derLaak, “Deep learning as a tool for increased accuracy and efficiency ofhistopathological diagnosis,” Scientific Reports, vol. 6,

REFERENCES 20
[10] C. Elston and I. Ellis, “Pathological pronostic factors in breast cancer. i.the value of histological grade in breast cancer: Experience from a largestudy with long-term follow-up.,” Histpathology, vol. 5, pp. 403–410, 1991.
[11] Tumor proliferation assesment challenge 2016, Accessed: 2016-06-29, 2016.[Online]. Available: http://tupac.tue-image.nl.
[12] M. Ertosun and D. Rubin, “Automated grading of gliomas using deeplearning in digital pathology images: A modular approach with ensembleof convolutional neural networks,” AMIA Annual Symposium Proceedings,2015.
[13] A. Karpathy, L. Fei-Fei, and J. Johnson, Convolutional neural networksfor visual recognition, Accessed: 2016-06-29. [Online]. Available: http:
//cs231n.github.io/convolutional-networks/.
[14] C. Malon, M. Miller, H. Burger, E. Cosatto, and H. Graf, “Identifying his-tological elements with convolutional neural networks,” in Proceedings ofthe 5th International Conference on Soft Computing As TransdisciplinaryScience and Technology, ACM, 2008, pp. 450–456.
[15] Y. LeCun, L. Bottou, Y. Bengio, and P. Haffner, “Gradient-based learningapplied to document recognition,” Proceedings of the IEEE, 1998.
[16] D. C. Ciresan, A. Giusti, L. M. Gambardella, and J. Schmidhuber, “Mito-sis detection in breast cancer histology images with deep neural networks,”2013.
[17] C. Malon and E. Cosatto, “Classification of mitotic figures with convo-lutional neural networks and seeded blob features,” Journal of PathologyInformatics, 2013.
[18] H. Wang, A. Cruz-Roa, A. Basavanhally, G. H., N. Shih, M. Feldman,J. Tomaszewski, F. Gonzalez, and A. Madabhushi, “Mitosis detection inbreast cancer pathology imgaes by combining handcrafted and convolu-tional neural network features,” Journal of Medical Images, 2014.
[19] H. Chen, Q. Dou, X. Wang, J. Qin, and P.-A. Heng, “Mitosis detection inbreast cancer histology images via deep cascaded networks,” 2016.
[20] Y. Jia, E. Shelhamer, J. Donahue, S. Karayev, J. Long, R. Girshick, andS. Guadarrama, “Caffe: Convolutional architecture for fast feature em-bedding,” 2014.
[21] J. Xu, X. Luo, G. Wang, H. Gilmore, and M. Madabhushi, “A deep con-volutional neural network for segmenting and classifying epithelial andstromal regions in histopathological images,” Neurocomputing, 2016.
[22] P. Kainz, M. Pfeiffer, and M. Urschler, “Semantic segmentation of colonglands with deep convolutional neural networks and total variation seg-mentation,” 2015.
[23] G. Freiherr, Will the fda be too much for intelligent machines? Accessed:2016-06-25, 2015. [Online]. Available: http : / / www . itnonline . com /
content/will-fda-be-too-much-intelligent-machines.

REFERENCES 21
[24] J. Makower, A. Meer, and L Denend, “Fda impact on u.s. - medical tech-nology innovation,” 2010.
[25] R. Shokri and V. Shmatikov, “Privacy-presevering deep learning,” in Pro-ceedings of the 22Nd ACM SIGSAC Conference on Computer and Com-munications Security, ACM, 2015, pp. 1310–1321.