deep learning based autonomous underground cavity
TRANSCRIPT

9th
European Workshop on Structural Health Monitoring
July 10-13, 2018, Manchester, United Kingdom
Creative Commons CC-BY-NC licence https://creativecommons.org/licenses/by-nc/4.0/
Deep learning-based autonomous underground cavity detection using
3D GPR
Man-Sung Kang1, Namgyu Kim
2, Yun-Kyu An
1* and Jong Jae Lee
2
1 Department of Architectural Engineering, Sejong University, Republic of Korea,
[email protected], [email protected]
2 Department of Civil and Environmental Engineering, Sejong University, Republic of
Korea, [email protected], [email protected]
Abstract
This study presents deep convolutional neural network (CNN)-based autonomous
underground cavity detection using 3D ground penetrating radar (GPR) data. The 3D
GPR data interpretation is often ambiguous and complex for making-decision to detect
only underground cavities, because similar GPR features reflected from various
underground objects are all mixed with the cavity one. To tackle the ambiguity issue, a
deep CNN-based underground cavity detection technique is proposed. First, a basis
pursuit-based background filtering algorithm is developed to enhance the visibility of
underground objects. Then, the deep CNN is established and applied to automatically
classify underground objects using the filtered 3D GPR data. In particular, the cavity,
manhole, pipe and intact features extracted from in-situ 3D GPR data are used for
establishing the CNN architecture. The proposed technique is thoroughly tested using
the real 3D GPR data obtained from urban roads at Seoul, South Korea.
1. Introduction
A sinkhole is one of the most severe concerns in urban roads in these days, because the
sudden collapse in the ground may lead not only road closures and economic loss but
also countless victims. Recently, several sinkhole accidents have been reported
worldwide such as Hangzhou, China (April 2016) [1], Fukuoka, Japan (November
2016) [2] and Cheltenham township, PA, USA (January 2017) [3]. As a sinkhole
appears without any forewarning, there is an increasing demand for its early detection in
urban area. To early detect such sinkhole, several techniques have been developed. For
instance, the electrical resistivity tomography is a representative geophysical inspection
technique. Electrical resistivity tomography has been widely used for subsurface
structure imaging by measuring electrical resistivity [4, 5]. Although it is simple and
reliable for various applications such as soil moisture content determination, ground
water table investigation and so on, it typically needs boreholes to investigate
underground. Thus, large area inspection is limiting. Another widely accepted technique
is a rolling dynamic deflectometer, which makes an impact force onto the road and
measure the corresponding responses to evaluate the road bearing capacity [6]. Albeit
rolling dynamic deflectometer has advantages of noninvasive and fast inspection over a
wide inspection area, it may make additional defects on the road due to the high impact
force. Moreover, since its device is typically massive and expensive.
Mor
e in
fo a
bout
this
art
icle
: ht
tp://
ww
w.n
dt.n
et/?
id=
2335
5

2
Ground penetrating radar (GPR) is a representative non-destructive testing technique
gaining popularity in the field of geology for underground visualization thanks to its
noncontact nature, fast scanning speed and 3D visibility. GPR emits high frequency
electromagnetic waves into the underground and receives the returned electromagnetic
waves reflected from the underground objects. If there is any change in electromagnetic
characteristics such as relative permittivity of the medium, and underground
compositions, their boundaries can be identified through received signal analysis. Its
main applications have been archaeological and geological purposes for mapping
subsurface features [7, 8], and recently extended to detect underground cavities and
potential sinkholes [9-11]. The current technical problem on the GPR signal analysis is
that the data interpretation highly depends on well-trained experts’ subjective judgment,
because various underground objects especially in urban roads often make similar
reflection signals as the underground cavity. Moreover, the data interpretation may
become more challenging due to the urban roads’ harsh environments such as complex
geometry, moisture content, unexpected contaminants and so on. However, the expert-
dependent data interpretation is time-consuming and labor-intensive. For example, an
expert can analyse 3D GPR data of only several kilometres in a few days. Sometimes,
the interpretation results may not be reliable.
To overcome the technical challenges, convolutional neural network (CNN)-based data
classification techniques have been recently proposed. Zhang et al. proposed CNN for
detecting underground object using computationally-generated GPR B-scan image [12],
and Lameri et al. utilized CNN for detecting landmine using pipeline B-scan image [13].
Klesk et al. tried to use machine learning technique for detecting the landmine using
GPR C-scan image [14]. However, such ideal approach may not suitable for
underground object classification especially in complex urban areas.
In this study, a deep learning-based autonomous underground cavity detection technique
which can applied to complex urban roads is proposed. First, a basis pursuit-based
background filtering algorithm is developed to automatically enhance the visibility of
underground objects on urban roads. Then, a tailored CNN is established by transfer
learning using well-designed AlexNet [15]. Subsequently, the filtered 3D GPR data
collected from in-situ urban roads are used for training and validating the tailored CNN.
The trained CNN is tested using various in-situ 3D GPR data obtained from different
urban road areas in Seoul, South Korea.
This paper is organized as follows. Section 2 proposes the deep learning-based
underground cavity detection technique. Then, the performance of the proposed
technique is experimentally validated using in-situ 3D GPR data obtained from urban
roads in Chapter 3. This paper is briefly summarized and discussed in Section 4.
2. Deep learning-based autonomous underground cavity detection
technique
In this section, a deep learning-based autonomous underground cavity detection
technique is explained. Based on the brief working principles of GPR, a basis pursuit-
based background filtering algorithm and the tailored CNN established for
automatically detecting the underground cavities are described.

3
2.1 Working principles of GPR
Fig. 1 shows the schematic of a typical GPR-based underground visualization process.
3D GPR consists of multiple transmitter and receiver antennas and a data acquisition
system. The transmitter emits high frequency electromagnetic waves, and the receiver
receives the returned electromagnetic waves. The typical frequency range of the
electromagnetic waves is 10 MHz to 2.6 GHz, which is selected depending on a target
object size and depth. The electromagnetic waves are reflected where there is any
change in medium electromagnetic characteristics like relative permittivity [16]. These
reflected electromagnetic waves are then collected by the data acquisition system and
analysed for underground object detection. When 3D GPR scans along the region of
interests, three different data types, i.e. A-, B- and C-scans, can be typically obtained as
shown in Fig. 1. The A-scan provides the punctual time domain information (z-axis in
Fig. 1) at a certain spatial point. By collecting multiple A-scan data along the scanning
route (x-axis in Fig. 1), the B-scan image can be constructed in the x-z domain. If there
is abrupt permittivity change due to an underground object at a specific area as shown in
Fig. 1, the parabola feature typically appears. This parabola feature is often used to
detect the object inside underground. Then, the C-scan image can be obtained in the x-y
domain by gathering the B-scan images measured using multiple antennas. Here,
several C-scan images can be obtained along the z-axis physically representing the
depth. Similarly, the C-scan images revealing the cross-sectional images of the object is
often used as the detection feature. Note that the almost straight and dominant line
feature often appears in the B-scan image due to strong ground surface reflection. The
ground surface reflection typically overwhelms the underground reflections because of
the sudden permittivity change from air (=1 F/m-1
) to pavement (=5 F/m-1
). This line
feature of the B-scan image often disturbs the visibility of underground objects.
Figure 1. Working principles of GPR: T and R represent transmitter and receiver, respectively.
2.2 Basis pursuit-based background filtering algorithm
In this subsection, the basis pursuit-based background filtering algorithm is proposed to
improve the visibility of underground objects by removing the dominant line feature in
the B-scan image as well as unwanted pattern noises. The filtered image is able to

4
significantly enhance the underground object visibility, making it possible to be
effectively used for the subsequent deep CNN process. Fig. 2 provides the overview of
the proposed background filtering algorithm.
Figure 2. Schematic flow of the basis pursuit-based background filtering algorithm.
5
Step 1. Collection of 3D GPR data and pre-processing: 3D GPR data are collected from
each spatial scanning location along the region of interest, as described in Fig. 1. The
measured GPR signals are typically attenuated when they propagate along a certain
medium [17]. Thus, the pre-processing for the wave attenuation along the depth
direction is performed by applying gain factors to each A-scan data.
Step 2. Construction of a self-referencing dictionary: To enhance identification of the
interactions between the electromagnetic waves and the underground objects, the
measured A-scan signal � (T×1 vector, T means length of measured A-scan signal) is
represented as a weighted linear combination of bases via following transformation [18].
� = �� where � = �!,�!,… ,�! (1)
where � is the representation of � in the transformed domain and has a dimension of
�×1. D is the �×� dictionary matrix and consists of �! bases (i = 1, …, L). Each basis
�! is the A-scan signal with the same dimension as �.
Let us assume that we have a pristine scanning location without underground object
within the inspection area of interest. This location is called a reference point, and the
corresponding A-scan signal is called a reference signal.
�!"# � = ��!!"# (2)
�!"# denotes a reference signal, and E represents the amplitude of the incident electric
field with a specific time delay. � refer to the frequency. In the dictionary used in this
study, each basis represents a reference signal with a specific time delay. For example,
�! denotes the reference signal with a time delay of (�/2− �)Δ�.
�! = � � + (�/2− �)�� = � � + (�′− �)�� = ��!!"(!!(!!!!)!") (3)
Step 3. Transformation of A-scan signals using a basis pursuit approach: Because a
large L value is preferred to achieve a high resolution in the transformed domain,
typically an underdetermined system of equations (L > T), which creates non-unique
solutions for �. A unique solution for � can be obtained via the assumption that the
actual solution has the sparsest representation, minimizing the number of nonzero
entities in � [19]. Based on this assumption, Chen and Donoho proposed the basis
pursuit approach to solve the underdetermined system [20]. The sparsest representation
is obtained by solving the following problem with a given dictionary D.
��� � ! �. �. � = ��, (4)
where � ! denotes the ℓ! norm of �. A-scan signals can be sparsely represented using
the dictionary.
If the current scanning location does not include any underground object, the measured
GPR signal � can be represented with only a single basis, corresponding to the reference
signal. This is the only nonzero element in �, and a sparse representation of the A-scan
signal is possible in the dictionary domain. Then, � can be represented as
� = � � = �!! = �
!!�!! (5)
where �!! and �
!! denote the basis and transformed domain of the reference signal. On
the other hand, Equation (6) represents the GPR signal measured from a scanning

6
location with an underground object in the dictionary domain. The measured signal �
can be represented as the superposition of the reference signal and the underground
object reflected signal.
� = � � + � � +��� = �!!�!! + �
!!!!�!!!!
(6)
where ��� indicates the depth of the underground object.
Step 4. Background removal filtering and inverse transformation of filtered data: As
described in Equations (5) and (6), a new basis appears as an underground object exists.
Then, the background signals can be filtered out by removing the basis corresponding to
the reference signal, �!!. The resultant dictionary domain data is inversely transformed
into the A-scan signal ones.
Step 5. Filtered underground image construction: Finally, the underground image is
constructed from the filtered A-scan data obtained in Step 4, making it possible to
eliminate unnecessary background signals and highlight the underground object
reflection signals.
2.3 Deep CNN-based autonomous underground cavity detection
Figure 3. Deep CNN architecture tailored for 3D GPR data classification
This subsection shows how the deep CNN architecture is established and applied to real
3D GPR data. The established CNN architecture is modified by using AlexNet [15]
which is a pre-built CNN for 3D GPR data classification. As shown in Fig. 3, the
AlexNet consists of 5 convolutional layers, 3 fully-connected layers and 1000 soft-max
neurons, containing 650,000 neurons and 60 million parameters. In order to feed the
pre-trained CNN into 3D GPR data classification, the fully-connected layers at the end
of AlexNet are modified to have four classification outputs such as cavity, manhole,
pipe and intact.

7
As for the training and validation datasets, the combination of the B- and C-scan images
are used as shown in Fig. 4. The B-scan images between the cavity and manhole cases
reveal the quite different changing pattern, making it possible to be easily classified as
shown in Figs. 4 (a) and (c). On the other hand, Figs. 4 (a) and (b) shows that the cavity
and pipe cases have similar parabola features in the B-scan images. However, the
corresponding C-scan images between the cavity and pipe cases along the depth
direction provide the distinctive features each other. In case of intact, no obvious pattern
can be observed as shown in Fig. 4 (d).
(a) (b) (c) (d)
Figure 4. Typical B- and C-scan images: (a) cavity, (b) pipe, (c) manhole and (d) intact.
In order to enhance the automated classification performance, both filtered B- and C-
scan images are simultaneously reconstructed into the 2D grid image which consists of
24 C-scan images and 8 B-scan images as depicted in Fig. 3. For the training dataset,
5,187 cavity, 3,549 manhole, 5,733 pipe and 1,911 intact images are prepared by
segmentation and augmentation of 19 cavity, 13 manhole, 21 pipe and 7 intact raw
filtered images confirmed by partial underground boreholes. Then, 819 cavity, 546
manhole, 819 pipe and 273 intact images are selected as the validation dataset. Note that
the training and validation datasets are completely different from each other.
3. Field validation tests
The proposed deep learning-based autonomous underground cavity detection technique
is experimentally validated using 3D GPR data collected from urban roads in Seoul,
South Korea.
3.1 Experimental setup
Fig. 5 (a) shows the in-situ data collection using the 3D GPR device integrated with a
vehicle. The vehicle can scan the road up to 30 km/h with 1.5 m width. The used 3D
8
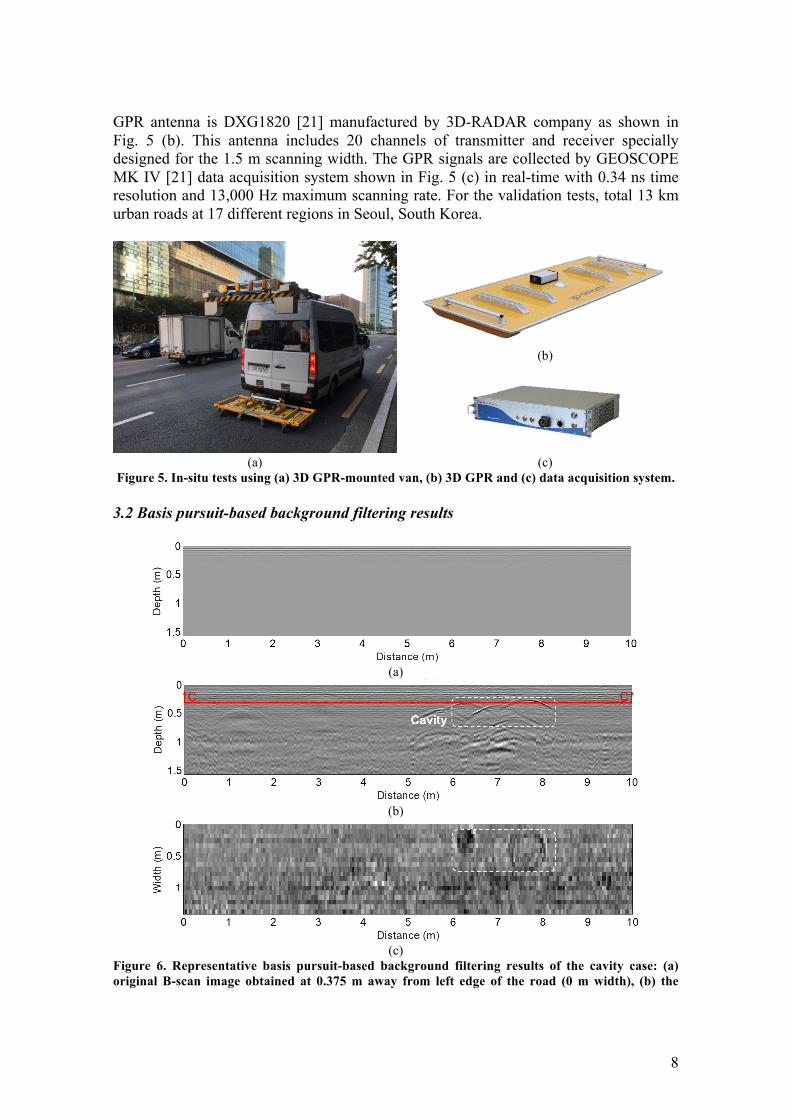
GPR antenna is DXG1820 [21] manufactured by 3D-RADAR company as shown in
Fig. 5 (b). This antenna includes 20 channels of transmitter and receiver specially
designed for the 1.5 m scanning width. The GPR signals are collected by GEOSCOPE
MK IV [21] data acquisition system shown in Fig. 5 (c) in real-time with 0.34 ns time
resolution and 13,000 Hz maximum scanning rate. For the validation tests, total 13 km
urban roads at 17 different regions in Seoul, South Korea.
(b)
(a) (c)
Figure 5. In-situ tests using (a) 3D GPR-mounted van, (b) 3D GPR and (c) data acquisition system.
3.2 Basis pursuit-based background filtering results
(a)
(b)
(c)
Figure 6. Representative basis pursuit-based background filtering results of the cavity case: (a)
original B-scan image obtained at 0.375 m away from left edge of the road (0 m width), (b) the

9
corresponding background filtered B-scan image and (c) the corresponding filtered C-scan image
at 0.3517 m depth corresponding to the C-C line in (b).
Fig. 6 (a) shows the representative original B-scan images collected at 0.375 m from the
left edge of the road (0 m width). As expected, the near-surface line feature caused by
the pavement surface reflection is predominant, hindering the visualization of the
underground reflection features. After the basis pursuit-based background filtering
process, the underground parabolas of the B-scan image and circular cross-section
features of the C-scan image are clearly observed in Figs. 6 (b) and (c), respectively.
Note that the cavities are identified by partial underground borehole.
3.3 Autonomous underground cavity detection results
Once the filtered B- and C-scan images are prepared for the validation tests, they are fed
into the trained CNN. The 13 km GPR data including 27 cavities, 18 manholes and 29
pipes are tested. The detailed number of the training and test datasets are summarized in
Table 1.
Table 1. The number of cavity, manhole, pipe and intact datasets for training and testing.
Types The number of training images The number of testing images
Cavity 4,368 2,184
Manhole 3,003 1,365
Pipe 4,914 2,184
Intact 1,638 819
The deep CNN test results are shown in Fig. 7. All test cases except for the cavity case
are successfully classified using the trained CNN. 11 % and 3 % of the cavity test cases
are misclassified as the pipe and intact cases, respectively, although the remain 86 %
datasets are properly classified as the cavity case. The performance of the proposed
technique can be acceptable, but it is speculated that the reinforced learning using more
high-quality datasets may help to enhance the classification performance.
(a) (b)

10
(c) (d)
Figure 7. Underground object classification results: (a) cavity, (b) pipe, (c) manhole and (d) intact
4. Conclusion
This paper proposed a deep learning-based autonomous underground cavity detection
technique. It has superiority over the existing GPR techniques in that fast and fully
automated data interpretation can be achieved. The proposed technique was
experimentally validated using real 3D GPR data obtained on urban roads in Seoul,
South Korea, which is very rare opportunity to obtain. Although the performance of the
proposed technique revealed the acceptable accuracy for underground cavity detection,
technical improvement is still needed using a reinforced learning process, which is not
being developed. As the follow-up study, more high-quality training datasets confirmed
by other inspection methods will be gathered and used for the reinforced learning. Also,
it is warranted that the autonomous classification study for various types of
underground objects will be extended.
Acknowledgements
This research was supported by a grant (18TLRP-C099510-04) from the Construction
Technology Research Program, which is funded by the Ministry of Land, Infrastructure
and Transport of the Korean government.
References
1. Huge sinkhole opens at busy Chinese intersection. Available online:
http://www.independent.co.uk/news/world/asia/huge-sinkhole-opens-at-busy-
chinese-intersection-a7000321.html (accessed on 2 Apr. 2018).
2. Huge sinkhole swallows street in Fukuoka, Japan. Available online:
http://www.bbc.com/news/world-asia-37906065 (accessed on 3 Apr. 2017).
3. Massive sinkhole nearly swallows home in Pennsylvania. Available online:
http://philadelphia.cbslocal.com/2017/01/25/massive-sinkhole-opens-up-in-
cheltenham-twp/ (accessed on 3 Apr. 2017).
4. D H Griffiths and R D Barker, “Two-dimensional resistivity imaging and modeling
in areas of complex geology”, Journal of Applied Geophysics, 29, pp 211-226,
1993.
5. V S Michael, “Detection of sinkholes using 2D electrical resistivity imaging”,
Journal of Applied Geophysics, 50(4), pp 393-399, 2002.
6. J A Bay, K H Stokoe � and J D Jackson, “Development and preliminary
investigation of rolling dynamic deflectometer”, Transportation Research Record,
1473, pp 43-54, 1995.
11
7. L Nuzzo, G Leucci, S Negri, M T Carrozzo and T Quarta, “Application of 3D
visualization techniques in the analysis of GPR data for archaeology”, Annals of
Geophysics-Italy, 45(2), pp 321-337, 2002.
8. L B Conyers, Ground-Penetrating Radar for Archaeology, 3rd
ed, AltaMira Press:
Plymouth, UK, 2013.
9. A T Batayneh, A A Abdelruhman and K A Moumani, “Use of ground-penetrating
radar for assessment of potential sinkhole conditions: an example from Ghor al
Haditha area, Jordan”, Environmental Geology, 41(8), pp 977-983, 2002.
10. O Pueyo-Anchuela, A P Juan, M A Soriano and A M Casas-Sainz,
“Characterization of karst hazards from the perspective of the doline triangle using
GPR — Examples from Central Ebro Basin (Spain)”, Engineering Geology 108(3-
4), pp 225-236, 2009.
11. V Rodriguez, F Gutiérrez, A G Green, D Carbonel, H Horstmeyer and C
Schmelzbach, “Characterizing Sagging and Collapse Sinkholes in a Mantled Karst
by Means of Ground Penetrating Radar (GPR)”, Environmental and Engineering
Geoscience 20(2), pp 109-132, 2014.
12. Y Zhang, D Huston and T Xia, “Underground object characterization based on
neural networks for ground penetrating radar data”, Proceedings of the SPIE, pp 1-9,
2016.
13. S Lameri, F Lombardi, P Bestagini, M Lualdi and S Tubaro, “Landmine detection
from GPR data using convolutional neural networks”, 25th
European Signal
Processing Conference, pp 538-542, 2017.
14. P Klesk, A Godziuk, M Kapruziak and B Olech, “Fast Analysis of C-scans from
Ground Penetrating Radar vis 3-D Haar-Like Features with Application to
Landmine Detection”, IEEE Transaction Geoscience Remote Sensing 53(7), pp
3996-4009, 2015.
15. A Krizhevsky, I Sutskever and G E Hilton, “ImageNet Classification with Deep
Convolutional Neural Networks,” Advances in Neural Information Processing
Systems 1, pp 1097–1105, 2012.
16. D J Griffiths, Introduction to Electrodynamics, 4th
ed, Pearosn: London, UK, 2012.
17. H M Jol, Ground Penetrating Radar Theory and Applications, Elsevier:
Amsterdam, Netherlands, 2009.
18. H Anton and R C Busby, Contemporary linear algebra, Wiley: New York, US,
2003.
19. R Gribonval and M Nielsen, “Sparse representations in unions of bases”, IEEE
Transactions on Information Theory 49(12), pp 3320-3325, 2003.
20. S Chen and D Donoho, “Basis pursuit”, Proc. of 28th
Asilomar Conf. on Signals,
Systems and Computers, 1994.
21. 3d-radar company 2001, Available online: http://3d-radar.com/ (accessed on 6 Apr.
2018).