deep digital maintenance - link. · pdf filemaintenance planning, ... trays a matrix of trends...
TRANSCRIPT

Deep digital maintenance
Harald Rødseth1 • Per Schjølberg1 • Andreas Marhaug1
Received: 7 April 2017 / Accepted: 10 November 2017 / Published online: 1 December 2017
� The Author(s) 2017. This article is an open access publication
Abstract With the emergence of Industry 4.0, mainte-
nance is considered to be a specific area of action that is
needed to successfully sustain a competitive advantage. For
instance, predictive maintenance will be central for asset
utilization, service, and after-sales in realizing Industry 4.0.
Moreover, artificial intelligence (AI) is also central for
Industry 4.0, and offers data-driven methods. The aim of
this article is to develop a new maintenance model called
deep digital maintenance (DDM). With the support of
theoretical foundations in cyber-physical systems (CPS)
and maintenance, a concept for DDM is proposed. In this
paper, the planning module of DDM is investigated in more
detail with realistic industrial data from earlier case studies.
It is expected that this planning module will enable inte-
grated planning (IPL) where maintenance and production
planning can be more integrated. The result of the testing
shows that both the remaining useful life (RUL) and the
expected profit loss indicator (PLI) of ignoring the failure
can be calculated for the planning module. The article
concludes that further research is needed in testing the
accuracy of RUL, classifying PLI for different failure
modes, and testing of other DDM modules with industrial
case studies.
Keywords Maintenance planning � Integrated planning
(IPL) � Digital maintenance � Predictive maintenance �Industry 4.0
1 Introduction
With the onset of Industry 4.0, there will be a game change
in manufacturing. To ensure future competitive advantage,
manufacturing companies must employ cyber-physical
systems (CPS) [1]. One priority area for action in Industry
4.0 is the management of complex systems. The models in
this system offer huge potential in Industry 4.0. For
instance, the models can offer transparency of information
and improve interdisciplinary cooperation. The focus of
this paper is the cooperation between production and
maintenance planning, which is denoted as integrated
planning (IPL) [2]. In particular, in this concept, a key
performance indicator (KPI) denoted profit loss indicator
(PLI) is promising in data-driven predictive maintenance
[3].
The digital world in Industry 4.0 will include two types
of models [1]:
(i) Planning models. These models make it possible to
build complex systems. An example of a planning
model could be a reliability model used by an
engineer to evaluate the reliability of a system.
Here, the model will contain the engineers’
knowledge.
(ii) Explanatory models. These models are often used
to validate the engineers’ design choices, e.g., a
simulation model that can calculate the energy
consumption in a factory.
McKinsey [4] points out 8 main value drivers for
Industry 4.0: time to market, service/aftersales, resource/
process, asset utilization, labor, inventories, quality and
supply/demand match. Among these value drivers, main-
tenance is included in the following:
& Harald Rødseth
1 Department of Mechanical and Industrial Engineering,
Norwegian University of Science and Technology,
Trondheim, Norway
123
Adv. Manuf. (2017) 5:299–310
https://doi.org/10.1007/s40436-017-0202-9

(i) Asset utilization. Predictive maintenance can drive
value by decreasing the planned machine down-
time, unplanned machine downtime, or changeover
times. The predictive maintenance typically
decreases the total machine downtime from 30%
to 50% and extends the operation life from 20% to
40%.
(ii) Services and aftersales. Predictive maintenance
combined with remote maintenance will typically
reduce the maintenance cost from 10% to 40%.
It is, therefore, no surprise that the largest expected
change in future maintenance is the shift from corrective to
predictive maintenance [5]. To ensure the highest perfor-
mance of an asset, an intelligent maintenance system must
bring together technology, data, analyses, prognosis, and
resources. This will also improve the maintenance planning
function where more real-time data support the planner.
Artificial intelligence (AI) should be central for data-
driven methods in Industry 4.0. A pure data-driven method
should be regarded as a mathematical method where no
phenomenological knowledge is needed [6]. An example of
phenomenological knowledge in maintenance is the
knowledge about physical processes involved in the
degradation or reliability theory with support from expert
judgment. In future maintenance, it is believed from the
authors point of view that there will be a combination of
data-driven methods and model-driven methods. This is
also supported in future EU projects where ‘‘…measure-
ments of a range of parameters at the level of components,
machines and production systems should be carried out to
provide data for building trend reference models for pre-
diction of equipment condition, to improve physically-
based models and to synchronize maintenance with pro-
duction planning and logistics options.’’ [7]. An important
tool for the program DeepMind from Google is one among
several that offer the next generation of AI [8]. Currently, it
seems that DeepMind is able to learn more like a human;
the program can learn tasks sequentially using skills it
acquires on the way [9]. For maintenance, AI is considered
to be a data-driven method, where an artificial neural net-
work (ANN) is applied to estimate the remaining useful life
[10]. In the context of process industry, a literature study
has been conducted on data-driven methods [6]. This study
presents the most popular data-driven methods in this
industry branch: multivariate principle component analysis,
partial least squares, ANN, neuro-fuzzy systems, support
vector machines.
For example, ANN has been applied to predict failure of
wind energy conversion systems [11]. The challenge today
in AI is ‘‘catastrophic forgetting’’ where knowledge of the
previously learned task is abruptly lost as information
relevant to the current task is incorporated [12]. It seems
that deep neural networks are currently the most successful
machine-learning technique to solve this challenge. Thus,
what was previously considered to be pure fiction, seems to
be soon the reality. This will also affect the maintenance
science and improve the maintenance models.
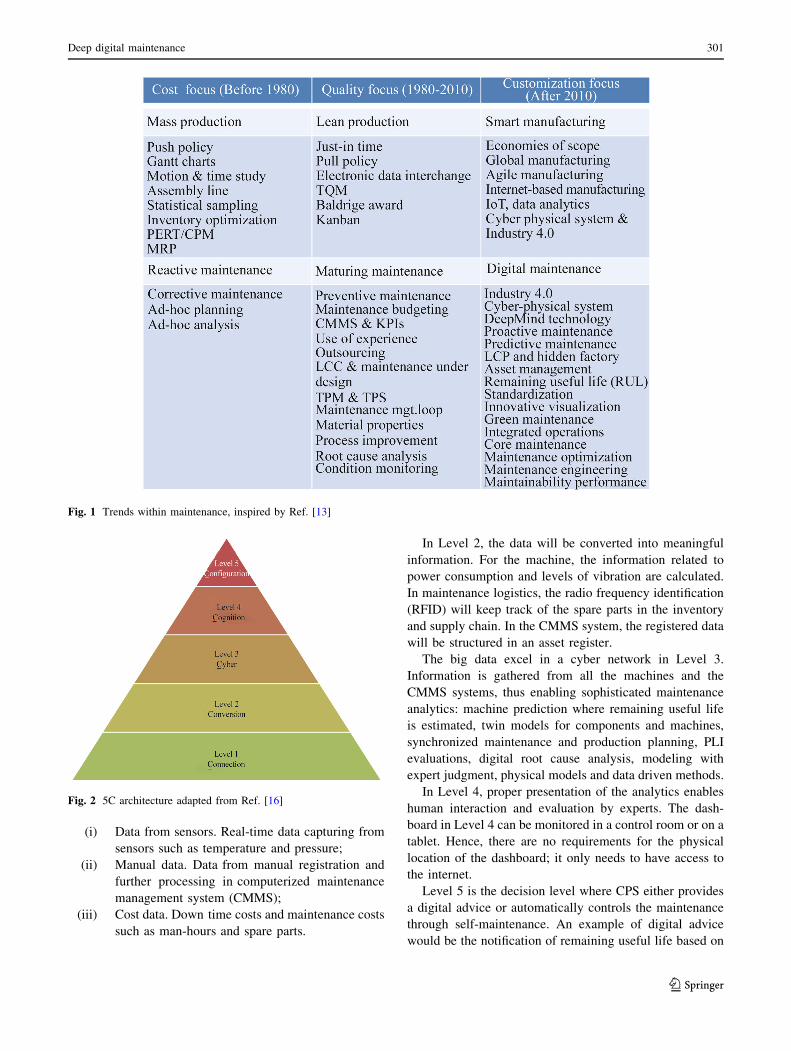
Figure 1 is based on earlier evaluations [13] and por-
trays a matrix of trends in Industry 4.0 and digital main-
tenance. Likewise, there has been a shift from lean
production towards smart manufacturing; it is also expec-
ted to be a shift from maturing maintenance towards digital
maintenance.
Inspired by the emergence of Industry 4.0 in manufac-
turing and the ever-increasing opportunities in AI, a new
concept should emerge in maintenance management. The
aim in this paper is, therefore, to develop a new mainte-
nance model called deep digital maintenance (DDM).
The rest of this article is structured as follows: Section 2
presents the relevance and trends of maintenance in
Industry 4.0. Section 3 develops the DDM model with
relevant modules. Section 4 describes along with a
demonstration of the modules. This article is concluded in
section 5 with a brief discussion of the result from the
testing.
2 Maintenance in Industry 4.0
Although there are several definitions of Industry 4.0, most
of them agree that CPS is a design principle [14]. To
succeed with Industry 4.0, an architecture for cyber phys-
ical production control has been constructed [15]. CPS for
maintenance is also central in Industry 4.0-based manu-
facturing systems [16]. In particular, Deutsches Institut fur
Normung (DIN) (in English, the German Institute for
Standardization) points out in a roadmap for Industry 4.0
that smart maintenance will contribute to successful
implementation [17]. Smart maintenance would enable
Industry 4.0 and implement CPS, which are notable for its
high degree of networking, digitization, decentralization
and autonomy, efficiency, and availability.
2.1 5C architecture for Industry 4.0
Figure 2 illustrates the 5C architecture of CPS with 5 levels
[16]. CPS can be comprehended as the use of logical
properties of computers to control and monitor the dynamic
properties of a physical asset [18]. In Industry 4.0, the
logical properties of computers will improve the mainte-
nance functions in a company and will control the technical
conditions of physical assets better.
Level 1 of CPS comprises of connection to all relevant
data. This connection performs digital data capturing of
several types of data:
300 H. Rødseth et al.
123
(i) Data from sensors. Real-time data capturing from
sensors such as temperature and pressure;
(ii) Manual data. Data from manual registration and
further processing in computerized maintenance
management system (CMMS);
(iii) Cost data. Down time costs and maintenance costs
such as man-hours and spare parts.
In Level 2, the data will be converted into meaningful
information. For the machine, the information related to
power consumption and levels of vibration are calculated.
In maintenance logistics, the radio frequency identification
(RFID) will keep track of the spare parts in the inventory
and supply chain. In the CMMS system, the registered data
will be structured in an asset register.
The big data excel in a cyber network in Level 3.
Information is gathered from all the machines and the
CMMS systems, thus enabling sophisticated maintenance
analytics: machine prediction where remaining useful life
is estimated, twin models for components and machines,
synchronized maintenance and production planning, PLI
evaluations, digital root cause analysis, modeling with
expert judgment, physical models and data driven methods.
In Level 4, proper presentation of the analytics enables
human interaction and evaluation by experts. The dash-
board in Level 4 can be monitored in a control room or on a
tablet. Hence, there are no requirements for the physical
location of the dashboard; it only needs to have access to
the internet.
Level 5 is the decision level where CPS either provides
a digital advice or automatically controls the maintenance
through self-maintenance. An example of digital advice
would be the notification of remaining useful life based on
Fig. 1 Trends within maintenance, inspired by Ref. [13]
Fig. 2 5C architecture adapted from Ref. [16]
Deep digital maintenance 301
123
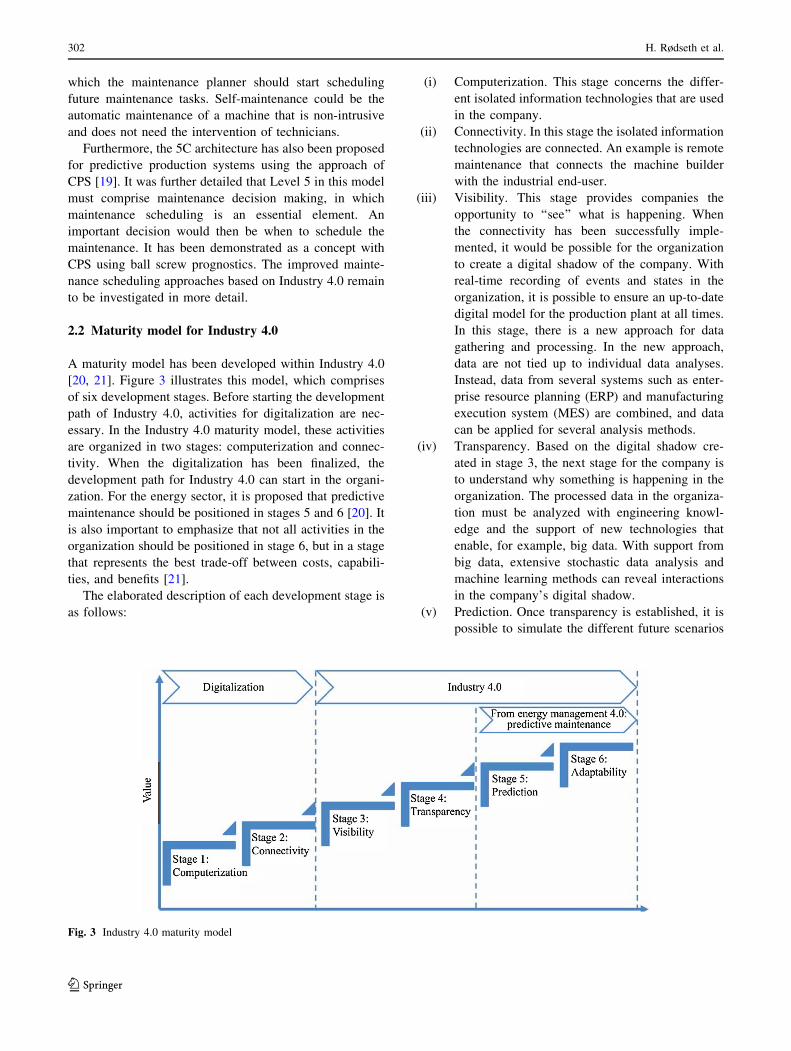
which the maintenance planner should start scheduling
future maintenance tasks. Self-maintenance could be the
automatic maintenance of a machine that is non-intrusive
and does not need the intervention of technicians.
Furthermore, the 5C architecture has also been proposed
for predictive production systems using the approach of
CPS [19]. It was further detailed that Level 5 in this model
must comprise maintenance decision making, in which
maintenance scheduling is an essential element. An
important decision would then be when to schedule the
maintenance. It has been demonstrated as a concept with
CPS using ball screw prognostics. The improved mainte-
nance scheduling approaches based on Industry 4.0 remain
to be investigated in more detail.
2.2 Maturity model for Industry 4.0
A maturity model has been developed within Industry 4.0
[20, 21]. Figure 3 illustrates this model, which comprises
of six development stages. Before starting the development
path of Industry 4.0, activities for digitalization are nec-
essary. In the Industry 4.0 maturity model, these activities
are organized in two stages: computerization and connec-
tivity. When the digitalization has been finalized, the
development path for Industry 4.0 can start in the organi-
zation. For the energy sector, it is proposed that predictive
maintenance should be positioned in stages 5 and 6 [20]. It
is also important to emphasize that not all activities in the
organization should be positioned in stage 6, but in a stage
that represents the best trade-off between costs, capabili-
ties, and benefits [21].
The elaborated description of each development stage is
as follows:
(i) Computerization. This stage concerns the differ-
ent isolated information technologies that are used
in the company.
(ii) Connectivity. In this stage the isolated information
technologies are connected. An example is remote
maintenance that connects the machine builder
with the industrial end-user.
(iii) Visibility. This stage provides companies the
opportunity to ‘‘see’’ what is happening. When
the connectivity has been successfully imple-
mented, it would be possible for the organization
to create a digital shadow of the company. With
real-time recording of events and states in the
organization, it is possible to ensure an up-to-date
digital model for the production plant at all times.
In this stage, there is a new approach for data
gathering and processing. In the new approach,
data are not tied up to individual data analyses.
Instead, data from several systems such as enter-
prise resource planning (ERP) and manufacturing
execution system (MES) are combined, and data
can be applied for several analysis methods.
(iv) Transparency. Based on the digital shadow cre-
ated in stage 3, the next stage for the company is
to understand why something is happening in the
organization. The processed data in the organiza-
tion must be analyzed with engineering knowl-
edge and the support of new technologies that
enable, for example, big data. With support from
big data, extensive stochastic data analysis and
machine learning methods can reveal interactions
in the company’s digital shadow.
(v) Prediction. Once transparency is established, it is
possible to simulate the different future scenarios
Fig. 3 Industry 4.0 maturity model
302 H. Rødseth et al.
123

and evaluate the most likely ones. In this stage, the
organization can predict future developments and
take decisions before it is too late. For predictive
maintenance, this involves the estimation of
remaining useful life, thus providing sufficient
time to schedule the maintenance activities for the
relevant machine.
(vi) Adaptability. When the organization is able to
predict future situations, this stage concerns the
ability of the organization to become adaptive,
whereby more actions are automated. This
depends on the complexity of the decisions, the
risk related to the decision, and the cost-benefit
ratio in automating the decision. An example
would be the rescheduling of planned orders due
to machine breakdown. In predictive maintenance,
this could concern rescheduling the maintenance
plan due to change in the production schedule.
As in the case of 5C architecture, the maintenance
scheduling and planning approaches based on Industry 4.0
still remains to be investigated in more detail.
3 DDM management model
Figure 4 illustrates the behavior of the DDM in terms of work
processes. To ensure continuous improvement of DDM, the
work processes follow the logic of the Deming cycle; PLAN-
DO-CHECK-ACT [22]. The objectives and requirements for
DDM comprise several maintenance functions:
(i) Technical: reduction of downtime,
(ii) Organizational: increase man-hours for predictive
maintenance,
(iii) Economic: reduction of maintenance costs.
When the objectives and requirements for DDM have
been established, the DDM modules can be applied.
Table 1 elaborates the modules in DDM.
To focus on future maintenance work, IPL enables
synchronization between maintenance and production
planning. With a well-established maintenance dashboard
and interaction with the production planner, the mainte-
nance planner will be able to provide better and faster
maintenance decisions. In parallel with IPL, the physical
system conducts self-maintenance without requiring human
interaction. Based on pre-defined rules, the system will
adjust the production or automatically perform standard
maintenance of the physical system.
After the self-maintenance and maintenance execu-
tion, the physical system achieves a certain level of
technical condition. Based on the maintenance execution
and self-maintenance, the DDM reports the results of the
maintenance. Based on the findings in the report, a root
cause analysis (RCA) will be conducted. In addition to
traditional RCA methods such as Isikawa diagram and
5-why analysis, the analytics from data driven methods
will be able to cluster the information into different
cause categories. The maintenance dashboard enables the
decision maker to evaluate the root cause. Once RCA
has been conducted, the following improvements will be
performed.
To ensure that each work process in DDM is followed
up, deep digital maintenance management is positioned at
the center of the loop. When necessary, this function will
also include the audit of DDM. Further, in this section, the
DDM modules AI, PLI, and planning are elaborated in
more detail.
Fig. 4 Work processes for DDM, inspired by Ref. [22]
Deep digital maintenance 303
123
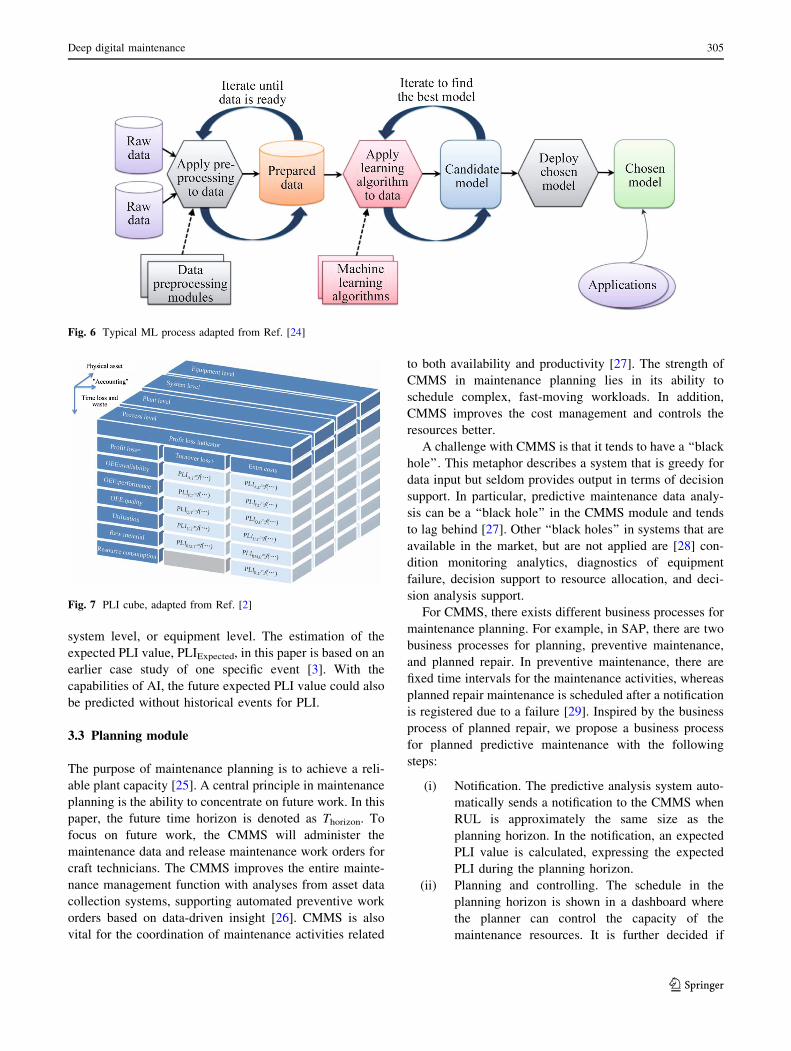
3.1 AI module
The purpose of the AI module is to provide accurate pre-
dictions of RUL for all known failure modes. Accurate
predictions of RUL can contribute to lesser critical failures
and lesser unnecessary maintenance, in addition to
improved resource- and spare part planning [11]. Figure 5
shows the structure of the AI module.
Data are collected through an IoT hub, which commu-
nicates with IoT units using standard protocols. The IoT
units can be IP-connected metering devices or non-IP-
connected units through a connected gateway. Real-time
data are fed to the data stream analytics and then stored in a
database.
Machine learning (ML) is used to train the prediction
models to recognize healthy patterns, un-healthy patterns,
and anomalies. The prediction models are generated as
code and applied to the datastream of the sensor readings to
obtain real-time prediction of RUL [10]. The prediction
results are communicated with the CMMS via e-mail or
customized dashboards.
ML uses statistical techniques to learn and recognize
patterns in big data. A code is generated from the predic-
tion model and used for recognizing the patterns in a
stream of data [23]. The output is the probability for the
machine being in a particular state. For example, a binary
parameter that indicates whether the machine will fail
within x cycles is engineered, and the model is trained to
predict the value of this parameter. In this case, the code
will output a probability for this parameter being true or
false, i.e., the probability that the machine will fail in less
than x cycles. Deciding what to do with this probability is a
business decision [24]. Figure 6 shows the typical ML
process.
3.2 PLI module
When estimating the PLIScenario, the PLI cube shown in
Fig.7 is needed [2]. This cube classifies the hidden factory
in terms of time loss and waste. The time loss is based on
the categories of overall equipment effectiveness (OEE),
utilization degree of the equipment, amount of raw material
consumed, and resource consumption. In resource con-
sumption, the energy consumption is identified. For each
category of time loss and waste, PLI will be the sum of the
turnover loss and extra costs. For example, if an unplanned
downtime occurs, PLI will calculate both the turnover loss
in terms of reduced number of goods to sell as well as the
extra costs in terms of corrective maintenance. Moreover,
PLI can be calculated at the process level, plant level,
Table 1 Deep digital maintenance modules
Modules Description
AI This module offers the most successful machine-learning techniques such as deep neural networks, clustering, etc.
PLI PLI will provide scenarios of unwanted events (e.g., breakdown) and provide analysis for RCA (taxonomy of the hidden
factory).
Planning The planning module will analysis the maintenance window and offer alternative maintenance plans. Furthermore, it will
enable IPL where maintenance and production planning is integrated.
Fig. 5 Structure of the AI module
304 H. Rødseth et al.
123
system level, or equipment level. The estimation of the
expected PLI value, PLIExpected, in this paper is based on an
earlier case study of one specific event [3]. With the
capabilities of AI, the future expected PLI value could also
be predicted without historical events for PLI.
3.3 Planning module
The purpose of maintenance planning is to achieve a reli-
able plant capacity [25]. A central principle in maintenance
planning is the ability to concentrate on future work. In this
paper, the future time horizon is denoted as Thorizon. To
focus on future work, the CMMS will administer the
maintenance data and release maintenance work orders for
craft technicians. The CMMS improves the entire mainte-
nance management function with analyses from asset data
collection systems, supporting automated preventive work
orders based on data-driven insight [26]. CMMS is also
vital for the coordination of maintenance activities related
to both availability and productivity [27]. The strength of
CMMS in maintenance planning lies in its ability to
schedule complex, fast-moving workloads. In addition,
CMMS improves the cost management and controls the
resources better.
A challenge with CMMS is that it tends to have a ‘‘black
hole’’. This metaphor describes a system that is greedy for
data input but seldom provides output in terms of decision
support. In particular, predictive maintenance data analy-
sis can be a ‘‘black hole’’ in the CMMS module and tends
to lag behind [27]. Other ‘‘black holes’’ in systems that are
available in the market, but are not applied are [28] con-
dition monitoring analytics, diagnostics of equipment
failure, decision support to resource allocation, and deci-
sion analysis support.
For CMMS, there exists different business processes for
maintenance planning. For example, in SAP, there are two
business processes for planning, preventive maintenance,
and planned repair. In preventive maintenance, there are
fixed time intervals for the maintenance activities, whereas
planned repair maintenance is scheduled after a notification
is registered due to a failure [29]. Inspired by the business
process of planned repair, we propose a business process
for planned predictive maintenance with the following
steps:
(i) Notification. The predictive analysis system auto-
matically sends a notification to the CMMS when
RUL is approximately the same size as the
planning horizon. In the notification, an expected
PLI value is calculated, expressing the expected
PLI during the planning horizon.
(ii) Planning and controlling. The schedule in the
planning horizon is shown in a dashboard where
the planner can control the capacity of the
maintenance resources. It is further decided if
Fig. 6 Typical ML process adapted from Ref. [24]
Fig. 7 PLI cube, adapted from Ref. [2]
Deep digital maintenance 305
123
the planner will ignore this notification and wait
for a new one, or if he will then schedule the
maintenance activities into the planning horizon.
(iii) Implementation. This phase comprises both with-
drawal of spare parts and processing of the actual
maintenance work order.
(iv) Completion. After the maintenance task has been
completed, the feedback is reported back to the
maintenance planner.
3.3.1 Notification
The notification is a trigger mechanism for maintenance
planning, when the request is registered. In DDM, the
following information is automatically registered in the
CMMS: PLIExpected, which will occur at the end of time
horizon Thorizon.
There can be several occasions for this notification in
CMMS. To ease the administrative planning function, three
opportunities are offered to the planner with a notification
(see Table 2).
3.3.2 Planning and controlling
Once the notification has been registered in the CMMS, the
maintenance planner can plan the future maintenance work
and control if necessary maintenance resources are avail-
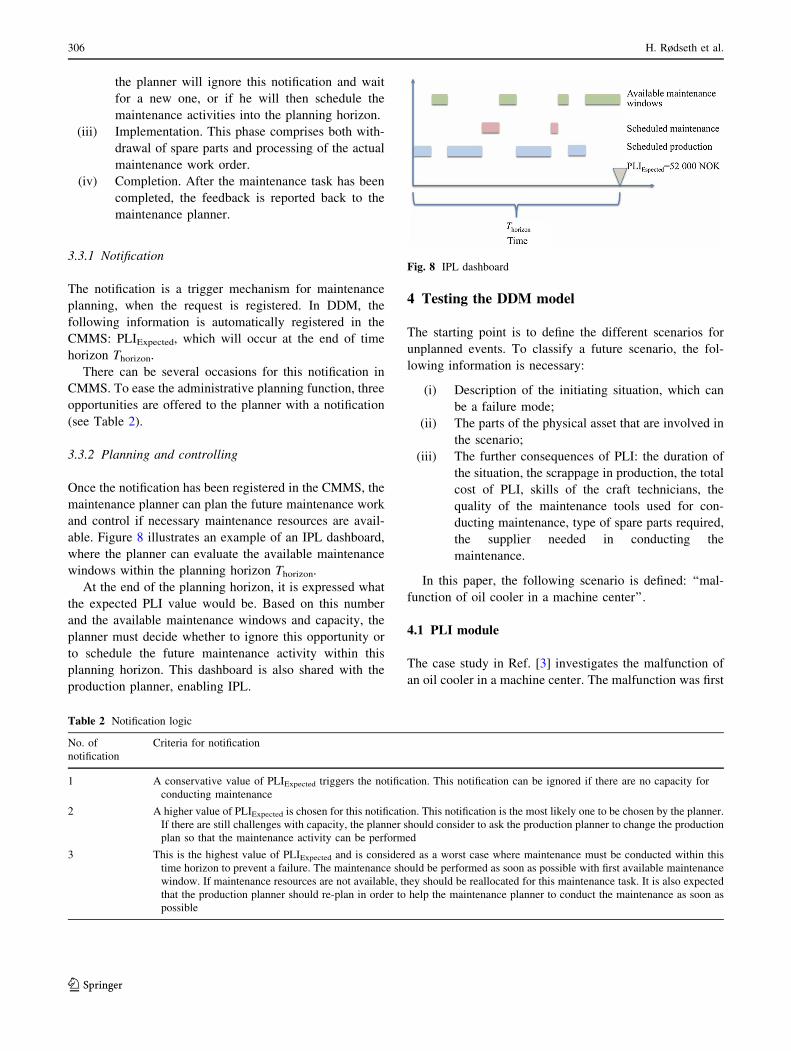
able. Figure 8 illustrates an example of an IPL dashboard,
where the planner can evaluate the available maintenance
windows within the planning horizon Thorizon.
At the end of the planning horizon, it is expressed what
the expected PLI value would be. Based on this number
and the available maintenance windows and capacity, the
planner must decide whether to ignore this opportunity or
to schedule the future maintenance activity within this
planning horizon. This dashboard is also shared with the
production planner, enabling IPL.
4 Testing the DDM model
The starting point is to define the different scenarios for
unplanned events. To classify a future scenario, the fol-
lowing information is necessary:
(i) Description of the initiating situation, which can
be a failure mode;
(ii) The parts of the physical asset that are involved in
the scenario;
(iii) The further consequences of PLI: the duration of
the situation, the scrappage in production, the total
cost of PLI, skills of the craft technicians, the
quality of the maintenance tools used for con-
ducting maintenance, type of spare parts required,
the supplier needed in conducting the
maintenance.
In this paper, the following scenario is defined: ‘‘mal-
function of oil cooler in a machine center’’.
4.1 PLI module
The case study in Ref. [3] investigates the malfunction of
an oil cooler in a machine center. The malfunction was first
Table 2 Notification logic
No. of
notification
Criteria for notification
1 A conservative value of PLIExpected triggers the notification. This notification can be ignored if there are no capacity for
conducting maintenance
2 A higher value of PLIExpected is chosen for this notification. This notification is the most likely one to be chosen by the planner.
If there are still challenges with capacity, the planner should consider to ask the production planner to change the production
plan so that the maintenance activity can be performed
3 This is the highest value of PLIExpected and is considered as a worst case where maintenance must be conducted within this
time horizon to prevent a failure. The maintenance should be performed as soon as possible with first available maintenance
window. If maintenance resources are not available, they should be reallocated for this maintenance task. It is also expected
that the production planner should re-plan in order to help the maintenance planner to conduct the maintenance as soon as
possible
Fig. 8 IPL dashboard
306 H. Rødseth et al.
123
observed in terms of scrappage of product with unplanned
downtime. Before the failure occurred, the temperature of
the oil cooler increased significantly, causing instability in
the production process. After the observed scrappage, a
quality audit meeting was conducted to evaluate the cause
and consequence of the scrappage. In addition, mainte-
nance personnel performed inspection on the machine
center when the unplanned downtime occurred. They found
out that the cause of downtime was the malfunction of the
oil cooler. The oil cooler was then replaced with a new one.
Due to anonymity, the time window for the downtime is
not accurate. Instead, it is assumed that a realistic duration
of the downtime is 6 days.
Table 3 shows the results of calculating the PLI value
for this event [3]. Both the availability and quality losses
can be traced to PLI. The main contribution of the PLI
value is the damaged part (scrappage) and loss of internal
machine revenue. The internal machine revenue is the
expected revenue for operating the machine. The loss of
internal machine revenue is the expected revenue loss due
to the downtime of the machine. The revenue rate should
be based on the norm decided by the company.
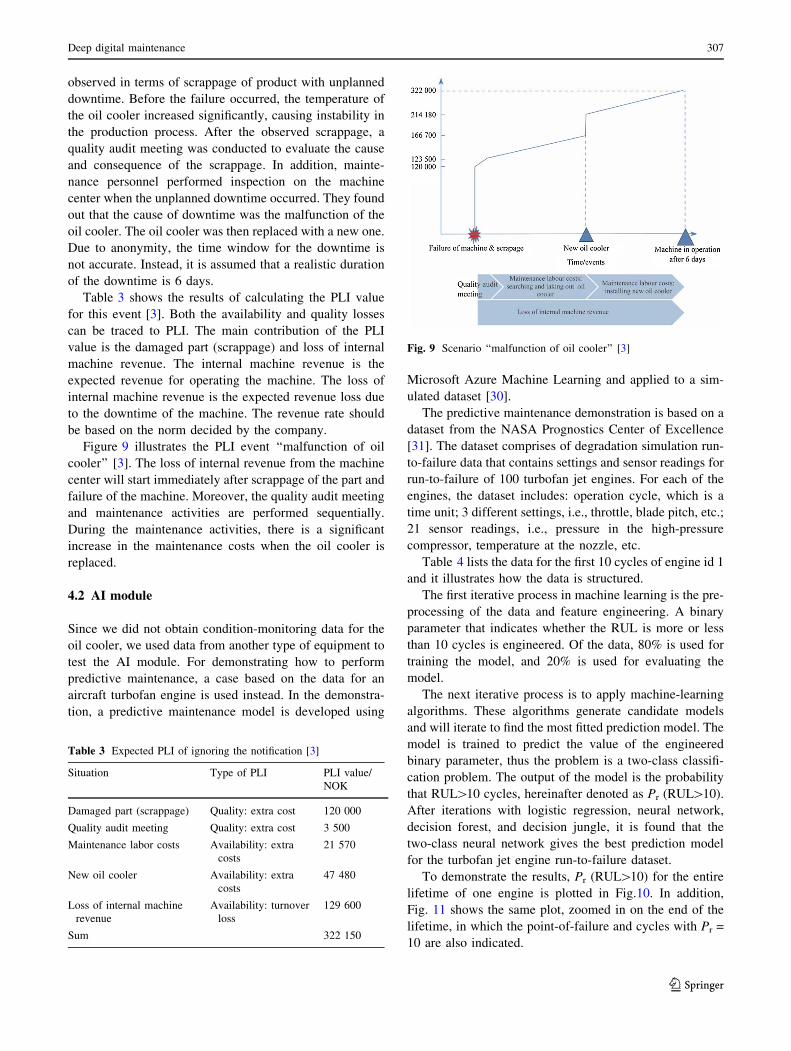
Figure 9 illustrates the PLI event ‘‘malfunction of oil
cooler’’ [3]. The loss of internal revenue from the machine
center will start immediately after scrappage of the part and
failure of the machine. Moreover, the quality audit meeting
and maintenance activities are performed sequentially.
During the maintenance activities, there is a significant
increase in the maintenance costs when the oil cooler is
replaced.
4.2 AI module
Since we did not obtain condition-monitoring data for the
oil cooler, we used data from another type of equipment to
test the AI module. For demonstrating how to perform
predictive maintenance, a case based on the data for an
aircraft turbofan engine is used instead. In the demonstra-
tion, a predictive maintenance model is developed using
Microsoft Azure Machine Learning and applied to a sim-
ulated dataset [30].
The predictive maintenance demonstration is based on a
dataset from the NASA Prognostics Center of Excellence
[31]. The dataset comprises of degradation simulation run-
to-failure data that contains settings and sensor readings for
run-to-failure of 100 turbofan jet engines. For each of the
engines, the dataset includes: operation cycle, which is a
time unit; 3 different settings, i.e., throttle, blade pitch, etc.;
21 sensor readings, i.e., pressure in the high-pressure
compressor, temperature at the nozzle, etc.
Table 4 lists the data for the first 10 cycles of engine id 1
and it illustrates how the data is structured.
The first iterative process in machine learning is the pre-
processing of the data and feature engineering. A binary
parameter that indicates whether the RUL is more or less
than 10 cycles is engineered. Of the data, 80% is used for
training the model, and 20% is used for evaluating the
model.
The next iterative process is to apply machine-learning
algorithms. These algorithms generate candidate models
and will iterate to find the most fitted prediction model. The
model is trained to predict the value of the engineered
binary parameter, thus the problem is a two-class classifi-
cation problem. The output of the model is the probability
that RUL[10 cycles, hereinafter denoted as Pr (RUL[10).
After iterations with logistic regression, neural network,
decision forest, and decision jungle, it is found that the
two-class neural network gives the best prediction model
for the turbofan jet engine run-to-failure dataset.
To demonstrate the results, Pr (RUL[10) for the entire
lifetime of one engine is plotted in Fig.10. In addition,
Fig. 11 shows the same plot, zoomed in on the end of the
lifetime, in which the point-of-failure and cycles with Pr =
10 are also indicated.
Table 3 Expected PLI of ignoring the notification [3]
Situation Type of PLI PLI value/
NOK
Damaged part (scrappage) Quality: extra cost 120 000
Quality audit meeting Quality: extra cost 3 500
Maintenance labor costs Availability: extra
costs
21 570
New oil cooler Availability: extra
costs
47 480
Loss of internal machine
revenue
Availability: turnover
loss
129 600
Sum 322 150
Fig. 9 Scenario ‘‘malfunction of oil cooler’’ [3]
Deep digital maintenance 307
123

The results of the case study show that the prediction
model for the turbofan jet engine has close to zero false
predictions during the lifetime of the engine and that it
accurately predicts the RUL close to the selected alarm
level.
4.3 Planning module
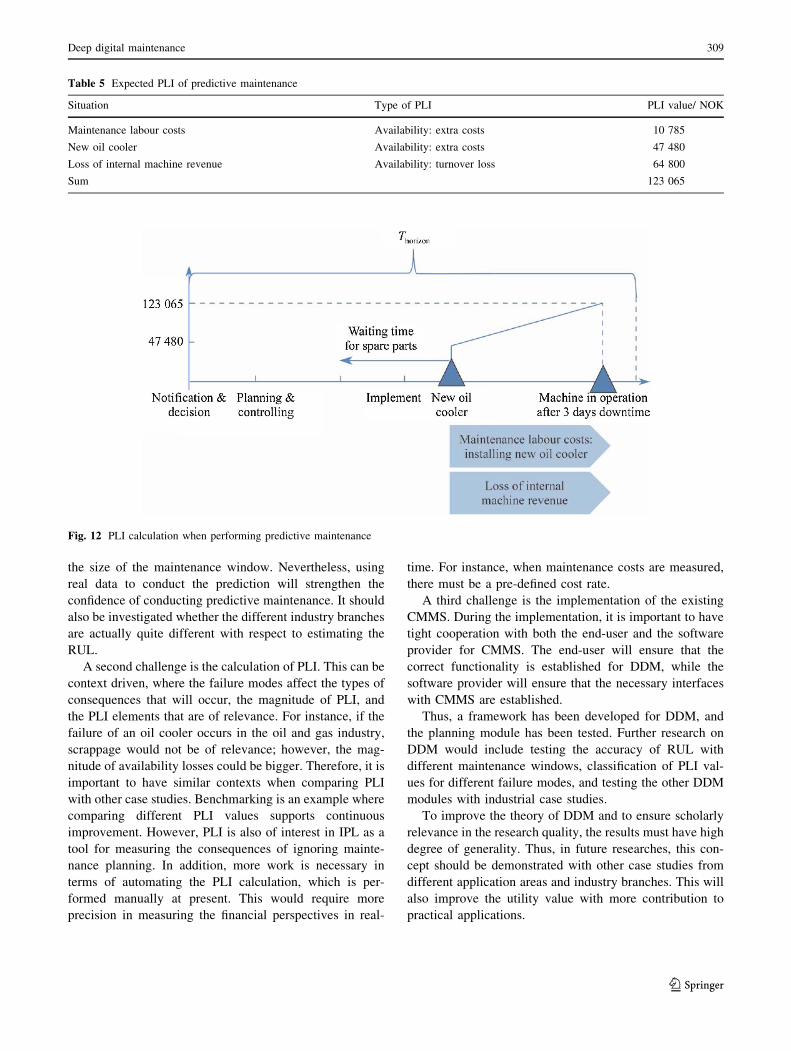
The result of the AI module will also result in an expected
PLI value, PLIPredictive maintenance. As an example we
assume that the planned downtime of oil cooler is in
average 3 days and that the maintenance activity is com-
pleted within the maintenance window. Table 5 there-
fore shows the PLI elements that will occur during the
period. Figure 12 further illustrates the event of performing
predictive maintenance. The PLI in the predictive mainte-
nance is based on the PLI value from the case study of
malfunction of oil cooler.
5 Discussions and concluding remarks of DDM
The aim of this article was to develop a new maintenance
model called DDM. The DDM is based on both the
architecture for CPS and the work processes from the
deming cycle. The DDM model was also tested to evaluate
the applicability.
As the first attempt for testing this model, the planning
module for predictive maintenance was investigated. The
quality of this test relied on having realistic data. With PLI
calculation from a case study in manufacturing, and esti-
mation of RUL based on simulated data from a gas turbine,
this article should be considered to increase the quality of
testing the planning module.
Several challenges for DDM must be identified and
discussed. A challenge with this testing is that the condi-
tion monitoring data for prediction are based on an
industrial context other than the manufacturing industry.
For predictions related to the manufacturing industry, there
could be other results in terms of the precision of RUL and
Table 4 Data example for the 10 first cycles of engine id 1 [31]
Cycle Setting Sensor
1 2 3 1 2 … 20 21
1 - 0.0007 - 0.0004 100 518.67 641.82 … 39.06 23.4190
2 0.0019 - 0.0003 100 518.67 642.15 … 39.00 23.4236
3 - 0.0043 0.0003 100 518.67 642.35 … 38.95 23.3442
4 0.0007 0 100 518.67 642.35 … 38.88 23.3739
5 - 0.0019 - 0.0002 100 518.67 642.37 … 38.90 23.4044
6 - 0.0043 - 0.0001 100 518.67 642.10 … 38.98 23.3669
7 0.0010 0.0001 100 518.67 642.48 … 39.10 23.3774
8 - 0.0034 0.0003 100 518.67 642.56 … 38.97 23.3106
9 0.0008 0.0001 100 518.67 642.12 … 39.05 23.4066
10 0.0033 0.0001 100 518.67 641.71 … 38.95 23.4694
Fig. 10 Predicted probability that RUL[10 cycles for entire lifetime
of the engine
Fig. 11 Predicted probability that RUL[10 cycles for end-of-life of
the engine
308 H. Rødseth et al.
123
the size of the maintenance window. Nevertheless, using
real data to conduct the prediction will strengthen the
confidence of conducting predictive maintenance. It should
also be investigated whether the different industry branches
are actually quite different with respect to estimating the
RUL.
A second challenge is the calculation of PLI. This can be
context driven, where the failure modes affect the types of
consequences that will occur, the magnitude of PLI, and
the PLI elements that are of relevance. For instance, if the
failure of an oil cooler occurs in the oil and gas industry,
scrappage would not be of relevance; however, the mag-
nitude of availability losses could be bigger. Therefore, it is
important to have similar contexts when comparing PLI
with other case studies. Benchmarking is an example where
comparing different PLI values supports continuous
improvement. However, PLI is also of interest in IPL as a
tool for measuring the consequences of ignoring mainte-
nance planning. In addition, more work is necessary in
terms of automating the PLI calculation, which is per-
formed manually at present. This would require more
precision in measuring the financial perspectives in real-
time. For instance, when maintenance costs are measured,
there must be a pre-defined cost rate.
A third challenge is the implementation of the existing
CMMS. During the implementation, it is important to have
tight cooperation with both the end-user and the software
provider for CMMS. The end-user will ensure that the
correct functionality is established for DDM, while the
software provider will ensure that the necessary interfaces
with CMMS are established.
Thus, a framework has been developed for DDM, and
the planning module has been tested. Further research on
DDM would include testing the accuracy of RUL with
different maintenance windows, classification of PLI val-
ues for different failure modes, and testing the other DDM
modules with industrial case studies.
To improve the theory of DDM and to ensure scholarly
relevance in the research quality, the results must have high
degree of generality. Thus, in future researches, this con-
cept should be demonstrated with other case studies from
different application areas and industry branches. This will
also improve the utility value with more contribution to
practical applications.
Table 5 Expected PLI of predictive maintenance
Situation Type of PLI PLI value/ NOK
Maintenance labour costs Availability: extra costs 10 785
New oil cooler Availability: extra costs 47 480
Loss of internal machine revenue Availability: turnover loss 64 800
Sum 123 065
Fig. 12 PLI calculation when performing predictive maintenance
Deep digital maintenance 309
123

Open Access This article is distributed under the terms of the
Creative Commons Attribution 4.0 International License (http://crea
tivecommons.org/licenses/by/4.0/), which permits unrestricted use,
distribution, and reproduction in any medium, provided you give
appropriate credit to the original author(s) and the source, provide a
link to the Creative Commons license, and indicate if changes were
made.
Reference
1. Kagermann H, Wahlster W, Helbig J (2013) Recommendations
for implementing the strategic initiative Industrie 4.0: securing
the future of German manufacturing industry. Forschungsunion,
Berlin
2. Rødseth H, Skarlo T, Schjølberg P (2015) Profit loss indicator: a
novel maintenance indicator applied for integrated planning.
Advances in Manufacturing 3(2):139–150
3. Rødseth H, Schjølberg P (2016) Data-driven predictive mainte-
nance for green manufacturing. In: Proceedings of the 6th inter-
national workshop of advanced manufacturing and automation.
Advances in Economics, Business and Management Research,
Atlantis Press, pp 36–41
4. McKinsey Company (2016) Industry 4.0: how to navigate digi-
tization of the manufacturing sector. World mobility leadership
form, September 28–29, 2016, Detroit. Michigan, USA
5. Langedijk E (2017) Smart maintenance management. http://
www.maintworld.com/Asset-Management/Smart-Maintenance-
Management. Accessed 29th of March, 2017
6. Kadlec P, Gabrys B, Strandt S (2009) Data-driven soft sensors in
the process industry. Computers Chemical Engineering
33(4):795–814
7. European Commision (2016) TOPIC : novel design and predic-
tive maintenance technologies for increased operating life of
production systems. http://ec.europa.eu/research/participants/por
tal/desktop/en/opportunities/h2020/topics/fof-09-2017.html,
Accessed 8th of December 2016
8. Samuelson D (2016) AI takeover: Google’s ‘DeepMind’ platform
can learn and think on it’s own without human input. http://glitch.
news/2016-11-04-ai-takeover-googles-deepmind-platform-can-
learn-and-think-on-its-own-without-human-input.html. Accessed
21st of March 2017
9. Sample I (2017) Google’s DeepMind makes AI program that can
learn like a human. https://www.theguardian.com/global/2017/
mar/14/googles-deepmind-makes-ai-program-that-can-learn-like-
a-human. Accessed 21st of March 2017
10. Archetti F, Arosio G, Candelieri A et al (2014) Smart data driven
maintenance: improving damage detection and assessment on
aerospace structures. In: Proceedings of 2014 IEEE international
workshop on metrology for aerospace, metroaerospace. Ben-
evento, Italy. http://doi.org/10.1109/MetroAeroSpace.2014.
6865902
11. Krueger M, Haghani A, Ding SX et al (2014) A data-driven
maintenance support system for wind energy conversion systems.
In: The 19th IFAC world congress on international federation of
automatic control, IFAC 2014, August 24, 2014, Cape Town,
South Africa
12. Kirkpatrick J, Pascanu R, Rabinowitz N et al (2016) Overcoming
catastrophic forgetting in neural networks. Proceedings of the
National Academy of Sciences of the United States of America
114(13):3521
13. Rødseth H, Schjølberg P, Larsen LT (2016) Industrie 4.0: a new
trend in predictive maintenance and maintenance management.
In: Proceedings of Euro maintenance artion conferences &
events, pp 267–273
14. Vogel-Heuser B, Hess D (2016) Guest editorial Industry 4.0:
prerequisites and visions. IEEE Transactions on Automation
Science and Engineering 13 (2):411–413
15. Stich V, Hering N, Meißner J (2015) Cyber physical production
control: transparency and high resolution in production control.
In: Umeda S et al (eds) IFIP Advances in Information and
Communication Technology. Springer, Berlin, pp 308–315
16. Lee J, Bagheri B, Kao HA (2015) A cyber-physical systems
architecture for Industry 4.0 : based manufacturing systems.
Manufacturing Letters 3:18–23
17. DIN (2016) German standardization roadmap: Industry 4.0. 2nd
edn. Berlin
18. Hu F, Lu Y, Vasilakos AV et al (2016) Robust cyber-physical
systems: concept, models, and implementation. Future Genera-
tion Computer Systems 56:449–475
19. Lee J, Jin C, Bagheri B (2017) Cyber physical systems for pre-
dictive production systems. Production Engineering 11(2):
155–165
20. Nienke S, Frolian H, Zeller V et al (2017) Energy-management
4.0: roadmap towards the self-optimizing production of the
future. In: Proceeding of international conference of ACM. http://
doi.org/10.1145/3070617.3070621
21. Schuh G, Anderi R, Gausemeier J et al (2017) Industrie 4.0
maturity index. Managing the Digital Transformation of Com-
panies (acatech STUDY). Hebert Utz Verlag, Munich
22. Deming WE (2000) Out of the crisis. MIT Press, Cambridge,
Mass
23. Witten I, Eibe F, Hall M et al (2016) Data mining practical
machine learning tools and techniques. Morgan Kaufmann, San
Francisco
24. Chappell D (2015) Introduction to Azure machine learning.
Chappell & Associates, San Francisco
25. Palmer D (2013) Maintenance planning and scheduling hand-
book. McGraw-Hill, New York
26. Lachance P (2016) How the transportation industry can keep pace
with mobile computerized maintenance management systems.
ITE Journal (Institute of Transportation Engineers) 86(7):28–29
27. Labib A (2008) Computerised maintenance management systems.
In: Complex system maintenance handbook. Springer, London,
pp 417-435. http://doi.org/10.1007/978-1-84800-011-7_17
28. Lopes I, Senra P, Vilarinho S et al (2016) Requirements speci-
fication of a computerized maintenance management system: a
case study. Procedia CIRP 52:268–273
29. Liebstuckel K (2014) Plant maintenance with SAP : practical
guide. SAP Press, Bonn & Boston
30. Microsoft (2017) Microsoft azure machine learning. https://azure.
microsoft.com/nb-no/services/machine-learning/. Accessed 18th
of February 2017
31. NASA (2008) Prognostics center of excellence PCoE datasets.
https://ti.arc.nasa.gov/tech/dash/pcoe/prognostic-data-repository/
#turbofan. Accessed 18th of February 2017
310 H. Rødseth et al.
123