dedicated to my mother, father and sister
TRANSCRIPT

Dedicated to my mother, father and sister


MUSTARD AND RAPESEED OILS: AUTHENTICITY, SEED
ROASTING AND OXIDATIVE STABILITY
Thesis submitted in fulfillment of the requirements for the degree of Doctor
(PhD) in Applied Biological Sciences: Chemistry
Promotor: Prof. Dr. ir. Bruno De Meulenaer
NutriFOODchem Unit, Department of Food Safety and Food Quality,
Faculty of Bioscience Engineering, Ghent University
Examination committee:
Prof. Dr. ir. Christophe Blecker
Unité de Science des Aliments et Formulation, Gembloux Agro-Bio
Tech, Université de Liège
Prof. Dr. ir. Stefaan De Smet (Chairman)
Department of Animal Production, Ghent University
Prof. Dr. ir. Matthias D’hooghe
SynBioC Research Group, Department of Sustainable Organic
Chemistry and Technology, Ghent University
Dr. Bertrand Matthäus
Max Rubner-Institut (MRI), Bundesforschungsinstitut für Ernährung
und Lebensmittel, Institut für Sicherheit und Qualität bei Getreide
Prof. Dr. Ashok Patel
Laboratory of Food Technology and Engineering, Department of Food
Safety and Food Quality, Ghent University
Prof. Dr. ir. Paul Van der Meeren
Research Group Particle and Interfacial Technology, Department of
Applied Analytical and Physical Chemistry, Ghent University
Dean: Prof. Dr. ir. Guido Van Huylenbroeck
Rector: Prof. Dr. Anne De Paepe

Dutch translation of the title:
Mosterd en raapzaad olie: authenticiteit, zaad roosteren en oxidatieve stabiliteit
Cover photo: http://deliciousontap.co.uk/
Printed by: University Press BVBA- [email protected]
To refer to this thesis:
Shrestha, K. (2014). Mustard and rapeseed oils: authenticity, seed roasting and oxidative
stability. PhD dissertation, Faculty of Bioscience Engineering, Ghent University, Ghent.
ISBN: 978-90-5989-682-6
The author and promotor give the authorization to consult and copy parts of this work for
personal use only. Every other use is subject to the copyright laws. Permission to reproduce
any material contained in this work should be obtained from the author.

MSc Kshitij Shrestha was financially supported by the Special Research Fund (BOF), Ghent
University.
The research was performed in the laboratory of the Research Group Food Chemistry and
Human Nutrition, Department of Food Safety and Food Quality, Faculty of Bioscience
Engineering, Ghent University.


Acknowledgements
My journey to Belgium began when I got a VLIR scholarship in 2007 to pursue a Master‟s
degree in Food Technology at Ghent University. During that time, I got an opportunity to
work with my current promotor. It was his advice and guidance that led me to start my PhD
research with the support from Special Research Fund (BOF). I am extremely grateful to
BOF (Ghent University) for funding my PhD research.
After coming to Belgium, I came to learn a new word “promotor”, which is not common in
my country. At first, I was wondering what actually does this terminology mean? After
working for so long time with my promotor, I slowly came to understand the meaning behind
it. I realized that promotor is not just a supervisor to monitor your work and a guide to show
you the path. But a promotor is the one who promotes your work, understands your strength
and weakness, motivates you when you are frustrated, and pulls you out when you are stuck
with a problem. I would like to express my sincere gratitude to my promotor Prof. Dr. ir.
Bruno De Meulenaer for all the support he has given to me, both personally and
professionally. Thank you for believing me and motivating me even during my difficult and
challenging days.
I am also thankful to Prof. Dr. ir. Liesbeth Jacxsens and Prof. Dr. ir. Christian V. Stevens for
the fruitful discussions, guidance and support during my research.
I would also like to thank all the members of the examination committee for the time, critical
evaluation and insightful questions.
Frederic and Barbara, you were supervisors during my master thesis and you also helped me
during the starting days of my PhD. Thank you so much for all your support . Tania, Nathalie,
Sofie, Evelien, Bryan, Laurens, Laurent, Angelique, Johana, Charlotte, Anne, Kimberley,
Nanou, Dieter and Karin, I would like to express my gratitude and thanks for all the help you
provided me during the research. Remembering all those past days, I feel very lucky as I was
always accompanied by so many good friends around me all the time. Edward, and Antonios,
we had a great group. I will always remember those crazy ideas and great memories we
shared. Imen and Stas, we shared the same office room during the start of our work and both
of you remained very good friends till the end. Monica, Loan, Bea, Agnieszka, Amr, Merry,

Gustavo, Kathy, I will always remember the great time I spent with all of you. Theeba and
Mai, you remained very good friends from the start of our Master course until now. To all of
you and other colleagues, thank you for the great company, smiles, friendship, help, support
and fun you gave to me. I would also like to thank all the Master thesis students, who helped
me during my studies.
Srijana and Gokarna, thanks for your great company and help. Sashi dai, Durga dai, Ashish
and Sambridhi, thanks for your help during my stay.
I would also like to express my sincere gratitude to the Director General of DFTQC Jiwan
Prava Lama for her continuous support and help during my study.
Luna, Krishna, Jitendra and Achyut, thanks for the help during the collection of samples.
Special thanks go to Roji for her continuous support, help and patience during the entire
period of my work.
I am grateful to my sister, Roshana Shrestha, who has been the most inspiring and supporting
person during my entire life. I also thank my brother-in-law for his help and express love to
my daughter-in-law Ayusha. Finally, I would like to express my sincere gratitude to my
parents for their continuous support, guidance, inspiration, blessings and love, without
which, I could neither have succeeded in this research work nor in my life. I am indebted to
you for my entire life. I would like to dedicate my PhD thesis to you. Thank you all.
Kshitij Shrestha
12th February, 2014
Ghent

i
TABLE OF CONTENTS
LIST OF ABBREVIATIONS ..................................................................................................... v
INTRODUCTION AND OBJECTIVES ................................................................................. vii
SUMMARY .................................................................................................................................. xi
SAMENVATTING ..................................................................................................................... xv
1 LITERATURE REVIEW ON MUSTARD AND RAPESEED OILS:
ADULTERATION, LIPID OXIDATION, OXIDATIVE STABILITY AND SEED
ROASTING ........................................................................................................................... 1
1.1 INTRODUCTION TO MUSTARD AND RAPESEED .............................................. 3
1.2 ADULTERATION/AUTHENTICITY.......................................................................... 6
1.2.1 Problem of oil blending/adulteration in the Nepalese market .............................. 6
1.2.2 Chemometric approaches used previously to authenticate oils and estimate oil
adulteration .............................................................................................................. 7
1.3 LIPID OXIDATION AND OXIDATIVE STABILITY .............................................. 8
1.3.1 Introduction ............................................................................................................. 8
1.3.2 Factors affecting lipid oxidation .......................................................................... 10
1.4 EFFECT OF SEED ROASTING ON OIL OXIDATIVE STABILITY ................... 16
2 MONTE CARLO SIMULATION BASED PREDICTION OF BLENDED OIL
COMPOSITION CONTAINING MUSTARD, RAPESEED AND SOBYEAN OILS
................................................................................................................................................ 19
2.1 INTRODUCTION ........................................................................................................ 22
2.2 MATERIALS AND METHODS ................................................................................. 22
2.2.1 Samples and chemicals ......................................................................................... 22
2.2.2 Analytical methods................................................................................................ 23
2.2.3 Monte Carlo simulation and statistical analysis .................................................. 24
2.3 RESULTS AND DISCUSSION .................................................................................. 26

ii
2.3.1 Development of a Monte Carlo simulation based method for the prediction of
blend composition ................................................................................................. 26
2.3.2 Evaluation of the developed Monte Carlo simulation method in the real mixture
of soybean oil and HEARM oil (step 7 and 8 of Figure 2-1) ............................. 32
2.3.3 Evaluation of the developed Monte Carlo method by simulation study and
calculation of limit of detection (LOD) (step 9 of Figure 2-1) .......................... 35
2.3.4 Application of the Monte Carlo simulation method in the Nepalese samples
(step 10 of Figure 2-1) .......................................................................................... 37
2.4 CONCLUSIONS ........................................................................................................... 44
3 ISOLATION AND IDENTIFICATION OF A POTENT RADICAL SCAVENGER
(CANOLOL) FROM ROASTED MUSTARD SEED OIL FROM NEPAL AND ITS
FORMATION DURING ROASTING ............................................................................ 45
3.1 INTRODUCTION ........................................................................................................ 48
3.2 MATERIALS AND METHODS ................................................................................. 48
3.2.1 Materials ................................................................................................................ 48
3.2.2 TLC analysis .......................................................................................................... 49
3.2.3 Isolation and purification of the compound of interest ....................................... 49
3.2.4 Identification of the isolated compound by spectroscopic measurements......... 50
3.2.5 Synthesis of 2,6-dimethoxy-4-vinylphenol (canolol) ......................................... 51
3.2.6 HPLC analysis of tocopherol and canolol in oil.................................................. 51
3.2.7 Roasting of seed and powder samples of mustard and rapeseed and oil
extraction ............................................................................................................... 52
3.2.8 Analysis of the free sinapic acid (FSA) content .................................................. 52
3.2.9 Analysis of the total sinapic acid content after basic hydrolysis (TSAH) ......... 53
3.2.10 UHPLC−diode array detector (DAD) analysis for the quantification of sinapic
acid and canolol ..................................................................................................... 53
3.2.11 Statistical analysis ................................................................................................. 53
3.3 RESULTS AND DISCUSSION .................................................................................. 54

iii
3.3.1 Isolation and identification of a potent radical scavenger from roasted mustard
seed oil obtained from the Nepalese market ........................................................ 54
3.3.2 Comparison of canolol formation among different varieties of mustard and
rapeseed during roasting ....................................................................................... 59
3.4 CONCLUSIONS ........................................................................................................... 63
4 A NOVEL INSIGHT IN THE HIGH OXIDATIVE STABILITY OF ROASTED
MUSTARD SEED OIL IN RELATION TO PHOSPHOLIPID, MAILLARD TYPE
REACTION PRODUCTS, TOCOPHEROL AND CANOLOL CONTENT............ 65
4.1 INTRODUCTION ........................................................................................................ 68
4.2 MATERIALS AND METHODS ................................................................................. 68
4.2.1 Samples .................................................................................................................. 68
4.2.2 Reagents and chemicals ........................................................................................ 69
4.2.3 Synthesis of canolol .............................................................................................. 69
4.2.4 Analytical methods................................................................................................ 69
4.2.5 Oxidative stability of different mustard seed oil samples .................................. 71
4.2.6 Fractionation of oil on a silica gel column and the study of the oxidative
stability of different fractions ............................................................................... 71
4.2.7 Statistical analysis ................................................................................................. 72
4.3 RESULTS AND DISCUSSION .................................................................................. 72
4.3.1 Oxidative stability of the mustard seed oil samples ............................................ 72
4.3.2 Correlations between different parameters .......................................................... 80
4.3.3 Effect of fractionation of mustard seed oil on the oxidative stability ................ 83
4.4 CONCLUSIONS ........................................................................................................... 86
5 SEED ROASTING INCREASES THE OXIDATIVE STABILITY OF MUSTARD
AND RAPESEED OILS IN A DIFFERENT MANNER - AN EXPLORATORY
STUDY.................................................................................................................................. 87
5.1 INTRODUCTION ........................................................................................................ 90
5.2 MATERIALS AND METHODS ................................................................................. 91

iv
5.2.1 Materials and Reagents ......................................................................................... 91
5.2.2 Synthesis of canolol .............................................................................................. 91
5.2.3 Analytical methods................................................................................................ 91
5.2.4 Experimental setup ................................................................................................ 92
5.2.5 Statistical analysis ................................................................................................. 92
5.3 RESULTS AND DISCUSSION .................................................................................. 93
5.3.1 Oxidative stability of roasted seed oil of different varieties ............................... 93
5.3.2 Role of browning reactions on the oxidative stability ........................................ 97
5.4 CONCLUSIONS ......................................................................................................... 104
6 ANTIOXIDANT ACTIVITY OF MAILLARD TYPE REACTION PRODUCTS
BETWEEN PHOSPHATIDYLETHANOLAMINE AND GLUCOSE.................... 105
6.1 INTRODUCTION ...................................................................................................... 108
6.2 MATERIALS AND METHODS ............................................................................... 110
6.2.1 Materials and Reagents ....................................................................................... 110
6.2.2 Analytical methods.............................................................................................. 110
6.2.3 Experimental setup .............................................................................................. 112
6.3 RESULTS AND DISCUSSION ................................................................................ 113
6.3.1 Changes in the absorbance spectra of the different oils during heat treatment
.............................................................................................................................. 113
6.3.2 Evaluation of the oxidative stability of the different samples .......................... 113
6.3.3 LC-TOF MS identification of some of the reaction products between PE and
glucose ................................................................................................................. 120
6.4 CONCLUSIONS ......................................................................................................... 123
7 GENERAL CONCLUSIONS AND FUTURE PERSPECTIVES ............................. 125
8 APPENDIX ........................................................................................................................ 129
REFERENCES.......................................................................................................................... 155
CURRICULUM VITAE .......................................................................................................... 161

v
LIST OF ABBREVIATIONS
BJ Brassica juncea
BJO Brassica juncea var. oriental
BN Brassica nigra
CD conjugated dienes
CDA canonical discriminant analysis
DM dry matter
EA fraction ethyl acetate fraction
FA fatty acid
FAME fatty acid methyl ester
FFDM fat free dry matter
FSA free sinapic acid
HEARM high erucic acid rapeseed and mustard
HI fraction hexane with 1% isopropanol fraction
HI-EA fraction combination of HI and EA fractions
LC-TOF MS liquid chromatography- time of flight mass spectrometry
LEAR low erucic acid rapeseed
LOD limit of detection
LS-group less stable group
MeOH fraction methanol with 0.1% trifluoroacetic acid fraction
MS-group moderately stable group
NMR nuclear magnetic resonance
O oil degummed mustard seed oil
OG oil glucose added oil
OP oil phosphatidylethanolamine added oil
OPG oil both phosphatidylethanolamine and glucose added oil
PE phosphatidylethanolamine
(e.g. 1,2-dioleoyl-sn-glycero-3-phosphoethanolamine)
PV peroxide value
PV40 peroxide value after 40 days of storage
RS rapeseed
SA Sinapis alba

vi
TAG triacylglycerides
TSAH total sinapic acid after basic hydrolysis
VS-group very stable group

vii
INTRODUCTION AND OBJECTIVES
In many South Asian countries like India and Nepal, high erucic acid rapeseed and mustard
(HEARM) seed oils are commonly used as liquid cooking oils, and are preferred by the local
consumers for their aroma and taste. On the other hand, low erucic acid rapeseed (LEAR)
does not have such a strong flavor and taste, and is less preferred by the local consumers. As
a consequence, there is an increasing tendency of blending HEARM oil and LEAR oil by the
manufacturers, without properly mentioning the product as blended oil. This is an obvious
misbranding of the product and is a problem of authentication. Furthermore, because of the
high popularity of these oils, there are some frequent problems of adulteration with cheaper
and easily available oils such as soybean oil in the local market. These fraudulent activities
have raised the concern to both the regulatory entities and the consumers. Therefore, the first
objective of the research was to develop a rapid and effective method for the estimation of
oil blend composition containing HEARM, LEAR and soybean oils.
A Monte Carlo simulation based method was developed for the estimation of oil blend
composition containing HEARM, LEAR and soybean oils (Chapter 2). The developed
method was applied in the oil samples collected from the Nepalese market to study the status
of adulteration practices.
Mustard seeds are generally roasted before oil extraction to give a characteristic flavor. The
crude roasted seed oil, extracted using a screw expeller, is generally consumed without
refining. Scientific studies on roasted mustard seed oil are very rare. The recent studies have
shown that roasting of mustard seed before oil extraction could significantly improve the
oxidative stability of oil together with the stability of tocopherol and lutein during storage
(Vaidya & Choe, 2011a; Vaidya & Choe, 2011b). This observation showed the possibility of
the formation of some potent antioxidants during roasting of mustard seeds. Accordingly, the
second objective of the research was to study the formation of antioxidants during roasting
of mustard seeds. At first, the study was carried out to isolate and identify one of the potent
radical scavengers from roasted mustard seed oil, apart from those occurring in the unroasted
seed oil. It was aimed to synthesize that antioxidant compound (canolol) in order to obtain a
standard for quantification. Afterwards, its formation during seed roasting of different
mustard varieties and rapeseed was studied quantitatively (Chapter 3).

viii
These novel findings opened a new avenue to investigate the oxidative stability of roasted
mustard and rapeseed oil. As a consequence, the third objective of the research was to
elucidate the oxidative stability of roasted mustard and rapeseed oil.
At first, the possible factors that could play a role in the oxidative stability of roasted mustard
seed oil were studied (Chapter 4). In this experiment, the oxidative stability of different
mustard seed oils, collected from the Nepalese market, were evaluated by incubating at 50 oC.
The possible role of canolol, tocopherol, phospholipids and Maillard type reaction products
on the oxidative stability were evaluated by a correlation study (Chapter 4).
Afterwards, the research was carried out to compare the differences in the manner seed
roasting improves the oxidative stability of mustard and rapeseed oils (Chapter 5). In this
experiment, mustard and rapeseed were roasted for different durations at 160 oC, and the
oxidative stability of roasted seed oils was evaluated by incubating them at 104 oC for
accelerated oxidation. The changes in tocopherol and phospholipid content of these oils
during roasting were also monitored. The role of canolol in the oxidative stability was
evaluated by comparing the oxidative stability of roasted seed oil with that of canolol
enriched unroasted seed oil (equivalent to the amounts formed during roasting). The
occurrence of Maillard reactions during seed roasting was evaluated by monitoring changes
in the free amino acids and the reducing sugars. Maillard type reaction products extracted in
the roasted seed oils were monitored by analyzing the changes in absorbance and
fluorescence of the oil.
These experiments (Chapter 4 and Chapter 5) showed that phospholipids and its Maillard
type reaction products due to amino group containing phospholipids (such as
phosphatidylethanolamine) could be mainly responsible for the high oxidative stability of
roasted mustard seed oil. As a consequence, it was decided to study the antioxidant activity of
the Maillard type reaction products between phosphatidylethanolamine and glucose (Chapter
6). In this experiment, degummed unroasted mustard seed oil was mixed with pure
phosphatidylethanolamine and glucose. The mixture was heated to induce browning reactions
and the oxidative stability of the oil was evaluated by incubating at 104 oC and 40
oC. The
occurrence of such Maillard type reactions in an apolar medium (octane) was also evaluated
by analyzing the reaction products by liquid chromatography-time of flight mass
spectrometry (LC-TOF MS).

ix
The general scheme of this PhD study is shown in Figure I.
Figure I. Schematic outline of the objectives of the PhD study
OBJECTIVE II
Formation of antioxidants during roasting of mustard seeds
OBJECTIVE I
Authenticity/ adulteration/ estimation of blended oil composition
OBJECTIVE III
Elucidation of the oxidative stability of roasted mustard and rapeseed oil
Monte Carlo simulation based prediction of blended oil composition containing mustard,
rapeseed and soybean oils (Chapter 2)
Literature review (Chapter 1)
Isolation and identification of a potent radical scavenger (canolol) from roasted high erucic
mustard seed oil and its formation during roasting (Chapter 3)
A novel insight on the high oxidative
stability of roasted mustard seed oil
in relation to phospholipid, Maillard
type reaction products, canolol and
tocopherol content (Chapter 4)
General discussions, conclusions, and perspectives (Chapter 7)
Antioxidant activity of Maillard type reaction products between phosphatidylethanolamine and
glucose (Chapter 6)
Seed roasting increases the oxidative
stability of mustard and rapeseed
oils in a different manner- an
exploratory study (Chapter 5)


xi
SUMMARY
This PhD thesis contributes to a better understanding of the chemistry of mustard and
rapeseed oils by, (1) developing a chemometric method to determine the authenticity of these
oils, (2) studying the effect of seed roasting on the formation of antioxidants, and (3)
elucidating the role of various factors on the oxidative stability of mustard and rapeseed oils.
In the first part of Chapter 1, the problem of oil blending and adulteration in the context of
Nepal is discussed. Afterwards, an overview of the chemometric approaches described
previously to authenticate different oils is presented. In the second part of this introductory
chapter, a review on the various factors affecting the oil oxidative stability is explained.
Finally, the third part of this chapter describes the effect of seed roasting on the oxidative
stability of various seed oils.
In Chapter 2, a chemometric methodology based on Monte Carlo simulation was developed
for the prediction of the composition of blended oils containing high erucic acid rapeseed and
mustard (HEARM) oil, low erucic acid rapeseed (LEAR) oil and soybean oil. After
validating the developed method, both in real and simulated blends, it was applied in forty-
nine mustard and rapeseed oil samples collected from the Nepalese market. The results
showed that around 55% of the oil samples were found to be adulterated with considerably
cheaper soybean oil. Thus, the developed method was suitable for the detection of such
fraudulent activities.
In Chapter 3, the isolation and identification of a potent radical scavenger from the roasted
mustard seed oil is discussed. On the basis of spectrometric data (NMR, UV, MS), the
isolated compound was found to be 2,6-dimethoxy-4-vinyl phenol (commonly known as
canolol). The identity of this compound was also confirmed by chemical synthesis. Canolol
was found to be formed during seed roasting by decarboxylation of sinapic acid. In addition,
there was an important contribution by the hydrolysis of sinapic acid derivatives. The canolol
formation was compared among rapeseed and several mustard varieties. After 10 min of seed
roasting at 162 oC, the canolol contents of mustard varieties Brassica juncea, B. juncea var.
oriental, B. nigra and Sinapis alba were 212.3, 135.6, 143.0 and 75.9 µg/g dry matter
respectively, while that of rapeseed (B. napus) was 707.7 µg/g dry matter. Canolol formed
during seed roasting was also extracted in the roasted seed oil. The canolol content of the

xii
roasted seed oil of B. juncea, B. juncea var. oriental, B. nigra, S. alba and rapeseed were
297.8, 171.6, 117.3, 266.2 and 808.5 µg/g oil respectively.
In Chapter 4, the oxidative stability of roasted and unroasted mustard seed oils collected
from the Nepalese market was evaluated. This study showed a wide variability in the
oxidative stability among different oil samples. The differences in the oxidative stability
among different oils were not linked with their tocopherol and canolol content. For instance,
the tocopherol and canolol content of some of the very stable oils were lower compared to
that of oils with a lower oxidative stability. This study showed that the oxidative stability of
roasted mustard seed oil was mainly correlated with phospholipid content and the Maillard
type browning reaction products formed in roasted oils.
Furthermore, the effects of seed roasting on the oxidative stability of mustard and rapeseed
oils were investigated, and the results are discussed in Chapter 5. In this experiment,
mustard and rapeseed were roasted for different durations. Afterwards, the oxidative stability
of the unroasted seed oil, roasted seed oil and canolol added unroasted seed oil (equivalent to
the amount present in roasted seed oil) was evaluated. Oil extracted from 10 min roasted
seeds showed a significant improvement in the oxidative stability, while longer roasting time
had a smaller additional effect. Although roasted rapeseed oil contained more than 2.5 times
canolol compared to the roasted mustard seed oils, it had a considerably lower oxidative
stability compared to the latter. This study showed that canolol could play an important role
in the oxidative stability of roasted rapeseed oil; in contrast, it could only play a limited role
in the oxidative stability of roasted mustard seed oil. Furthermore, the browning reactions
were more prominent in the roasted mustard seeds compared to that in roasted rapeseed. The
phospholipid content and Maillard type browning markers were also higher in the roasted
mustard seed oils than in the roasted rapeseed oils. These experiments supported the
conclusion made in Chapter 4, that phospholipids and Maillard type browning reaction
products were mainly linked with the oxidative stability of roasted mustard seed oil. Since the
browning reaction products were lipophilic in nature and the various browning markers
showed high correlation with phospholipids content, such browning reaction products were
suggested to be mainly attributed by the Maillard type reactions between amino group
containing phospholipids (such as phosphatidylethanolamine) and reducing sugars or other
carbonyl compounds.

xiii
Thus, in Chapter 6, the antioxidant potential of such Maillard type reaction products
between phosphatidylethanolamine and glucose was evaluated. This study demonstrated that
such Maillard type reaction products were lipophilic enough to be mixed with oil. The
reaction products not only increased the oil oxidative stability but also increased the stability
of tocopherol and plastochromanol-8 during oil storage. The occurrence of such reactions in
an apolar medium was demonstrated by identifying some of the key intermediates and the
reaction products such as the Amadori product, phosphatidylethanolamine-linked
pyrrolecarbaldehyde and 2,3-dihydro-1H-imidazo[1,2-α]pyridine-4-ylium derivatives by
liquid chromatography-time of flight mass spectrometry (LC-TOF MS).
The general discussions, conclusions and future perspectives are presented in Chapter 7.


xv
SAMENVATTING
Dit proefschrift draagt bij tot een beter inzicht in de chemie van raap- en mosterdzaadolie
door (1) een chemometrische methode te ontwikkelen die toelaat om de authenticiteit van
deze oliën te bepalen; (2) de effecten van het roosteren van de zaden op de vorming van
antioxidanten te onderzoeken en (3) door de rol van diverse factoren op de verschillende
oxidatieve stabiliteit van mosterd- en raapzaadolieaan het licht te brengen.
In het eerste deel van Hoofdstuk 1 wordt de problematiek van authenticiteit van oliën in het
kader van Nepal door het mengen van verschillende oliën toegelicht. Vervolgens wordt een
overzicht gegeven van de chemometrische methoden die reeds beschreven zijn om
olieauthenticiteit na te gaan. In het tweede deel van dit inleidend hoofdstuk worden de
verschillende factoren die een impact hebben op de oxidatieve stabiliteit van oliën
voorgesteld. Tot slot wordt stil gestaan bij het effect van het roosteren van zaden op de
oxidatieve stabiliteit van diverse zaadoliën.
In Hoofdstuk 2 wordt een chemometrische methodologie voorgesteld, gebaseerd op Monte
Carlo simulatie, welke toelaat de samenstelling te voorspellen van mengsels bestaande uit
hoog erucazuurhoudende raapzaad- en mosterdolie, laag erucazuurhoudende raapzaad- en
sojaolie. Na validatie van de ontwikkelde methode aan de hand van echte gesimuleerde
mengsels, werd ze toegepast op 49 stalen mosterd- en raapzaadolie afkomstig van de
Nepalese markt. Hieruit bleek dat 55% van de onderzochte stalen gemengd waren met de
veel goedkopere sojaolie. De ontwikkelde methode bleek dus geschikt om deze fraude op te
sporen.
In Hoofdstuk 3 wordt de isolatie en identificatie van een krachtige radicaalvanger uit
geroosterde mosterdzaadolie beschreven. Aan de hand van de spectrometrische data (NMR,
UV, MS) bleek de component 2,6-dimethoxy-4-vinylfenol te zijn, die beter gekend is als
canolol. De identiteit van de component werd ook bevestigd door hem chemisch te
synthetiseren. Canolol bleek gevormd te worden door een decarboxylatie van sinapiczuur
tijdens het roosteren van de mosterdzaden. Bovendien bleek er een belangrijke bijdrage te
zijn door de hydrolyse van andere sinapiczuurderivaten. De canololvorming werd opgevolgd
in diverse mosterzaad variëteiten en in raapzaad. Na 10 minuten roosteren bij 162 °C bleek
het canololgehalte op droge stof basis in de mosterdzaad variëteiten Brassica juncea, B.

xvi
juncea var oriental, B. nigra en Sinapis alba respectievelijk 212.3, 135.6, 143.0 en 75.9 µg/g
te bedragen, terwijl dat in het geroosterde raapzaad (B. napus) 707.7 µg/g bedroeg. Het
gevormde canolol werd ook teruggevonden in de geëxtraheerde olie. Het canololgehalte in de
olie van de geroosterde zaden bedroeg 297.8, 171.6, 117.3, 266.2 en 808.5 µg/g olie voor
respectievelijk B. juncea, B. juncea var. oriental, B. nigra, S. alba en raapzaad.
In Hoofdstuk 4 werd de oxidatieve stabiliteit van geroosterde en niet geroosterde
mosterdzaadoliën, gecollecteerd van de Nepalese markt, onderzocht. Er bleek een enorme
variabiliteit te bestaan in de oxidatieve stabiliteit van de diverse oliën. De verschillen konden
niet gelinkt worden aan de verschillen in tocoferol- en canololgehalte. Zo bleek het gehalte
van deze radicaalvangers in een zeer stabiele olie lager te zijn dan deze in een olie met een
lagere oxidatieve stabiliteit. Op basis van een correlatie studie bleek dat de oxidatieve
stabiliteit van de zeer stabiele geroosterde mosterdzaadoliën in verband gebracht kon worden
met het gehalte aan fosfolipiden en Maillard type bruinkleuringscomponenten in de olie.
Daarom werd in Hoofdstuk 5 de impact van het roosteren op de oxidatieve stabiliteit van
mosterd- en raapzaadoliën bestudeerd. Hierbij werden de zaden voor verschillende tijden
onderworpen aan een droge verhitting en werd de oxidatieve stabiliteit van de olie uit de niet
geroosterde zaden, al of niet met toevoeging van canolol (equivalent aan de hoeveelheid die
gevormd werd door het roosteren) vergeleken met de olie uit de geroosterde zaden. Door de
zaden 10 minuten te roosteren werd reeds een significante toename in de oxidatieve stabiliteit
van de olie vastgesteld. Langer roosteren had slechts een marginaal bijkomend effect.
Ondanks het feit dat de olie uit geroosterde raapzaadolie tot 2.5 keer meer canolol bevatte dan
de olie uit geroosterde mosterdzaden, vertoonde ze een significant lagere oxidatieve stabiliteit.
Uit dit onderzoek bleek dat canolol een belangrijke rol speelt in de verhoogde stabiliteit van
olie uit geroosterde raapzaden, doch dat zijn bijdrage tot de verhoogde stabiliteit van olie uit
geroosterde mosterdzaden beperkt was. Er werd tevens vastgesteld dat de
bruinkleuringsreacties, als gevolg van het roosteren, in de mosterdzaden meer uitgesproken
was dan in het raapzaad. Deze bevindingen bevestigden de conclusies gemaakt in Hoofdstuk
4 in die zin dat vooral het verhoogde fosfolipidegehalte en Maillardachtige
bruinkleuringscomponenten gelinkt konden worden aan de verhoogde oxidatieve stabiliteit
van de geroosterde mosterdzaadoliën. De bruinkleuringscomponenten bleken bovendien sterk
lipofiel te zijn. In combinatie met het feit dat al de verschillende merkers een sterke correlatie

xvii
vertoonden met het fosfolipidegehalte van de olie werd de hypothese naar voor geschoven dat
met name de Maillard-type bruinkleuringscomponenten, ontstaan door de reactie tussen
aminohoudende fosfolipiden en reducerende suikers of andere carbonylverbindingen,
verantwoordelijk waren voor de verhoogde oxidatieve stabiliteit van de olie uit geroosterde
mosterdzaden.
Daarom werd in Hoofdstuk 6 het antioxidatieve potentieel van de Maillardachtige
reactieproducten tussen fosfatidylethanolamine en glucose geëvalueerd. Hieruit bleek dat
deze reactieproducten lipofiel genoeg zijn om op te lossen in de olie en zodoende hun
antioxidatieve werking daar te bewerkstelligen. De reactieproducten bleken niet enkel de
oxidatieve stabiliteit van de olie te verhogen maar tevens andere antioxidanten zoals
tocoferolen en het verwante plastochromanol-8 te beschermen tijdens bewaring van de olie.
De aanwezigheid van deze reactiecomponenten werd aangetoond in een apolair
reactiemedium door een aantal sleutelintermediairen te identificeren aan de hand van
vloeistofchromatografie gekoppeld aan hoge resolutiemassaspectrometrie (LC-TOF-MS),
zoals het Amadoriproduct, het fosfatidylethanolamine gelinkte pyroolcarbaldehyde en het
2,3-dihydro-1H-imidazo1,2-α]pyridine-4-ylium derivaat.
De algemene discussie, conclusies en toekomst perspectieven worden voorgesteld in
Hoofdstuk 7.

xviii

1
CHAPTER
1
LITERATURE REVIEW ON MUSTARD AND RAPESEED OILS:
ADULTERATION, LIPID OXIDATION, OXIDATIVE STABILITY
AND SEED ROASTING


3
1.1 INTRODUCTION TO MUSTARD AND RAPESEED
Mustard and rapeseed are close relatives, belonging to the genus Brassica. The traditional
varieties of rapeseed (turnip rape, B. campestris) and mustard (B. juncea) are widely grown in
Bangladesh, India, Nepal and other South Asian countries. The oil from these varieties
contains high amounts of erucic acid ((Z)-Docos-13-enoic acid) (Mortuza, Dutta, & Das,
2006; Przybylski, Mag, Eskin, & McDonald, 2005). Hereafter, these traditional varieties will
be grouped together as high erucic acid rapeseed and mustard (HEARM) varieties.
Because of the abundant presence of erucic acid (22-60%), the HEARM varieties are
generally not considered suitable for human consumption. However, the stigma of erucic acid
seems to be a bit of an exaggeration, as it is known that this fatty acid can be converted to
oleic acid in the peroxisomes (Ackman, 1990; Przybylski et al., 2005). Moreover, it has been
shown during animal studies that peroxisomes can be induced by dietary fats. After
conversion into oleic acid, it is catabolized in the mitochondria similar to other fatty acids
(Ackman, 1990; Przybylski et al., 2005).
In addition, HEARM varieties are also rich in glucosinolates (100-205 µmol/g) (Shahidi,
1990), which are converted into isothiocyanates by the action of the thioglucosidase enzyme
called myrosinase (EC 3.2.3.1), released after cell rupture (Figure 1-1). For instance, allyl
isothiocyanate formed from the sinigrin glucoside is largely responsible for the pungent odor
and taste of the mustard paste. Similarly, p-hydroxybenzyl isothiocyanate formed from the
sinalbin glucosinolate is less volatile and mainly contributes to the sharp taste of the mustard
paste (Belitz, Grosch, & Schieberle, 2009).
O
S
HH
H
OH
OH
H OH
H
OH
R
NO
S
O
O-
O
R N C S
general structure of glucosinolates
general structure of isothiocyanates
myrosinase
Figure 1-1. Formation of isothiocyanates from glucosinolates by the action of
myrosinase enzyme

4
Various low erucic acid rapeseed (LEAR) varieties (e.g. B. napus) have been developed by
breeding practices. Among them, canola is the most well-known variety and is widely
produced in the world. The canola type low erucic variety grown in Europe is simply called
rapeseed. They also contain a low glucosinolate content (< 30 µmol/g) (Shahidi, 1990).
Based on the latest statistics from the Food and Agriculture Organization of the United
Nations (FAO), Nepal is the largest producer and the third largest importer of the mustard
seed in the world (Figure 1-2). Canada is the largest producer of rapeseed (Figure 1-3) and
the second largest producer of the mustard seed (Figure 1-2). Canada is also the largest
exporter of both the mustard seed and rapeseed (FAO, 2011).
Figure 1-2. Top ten countries in the world producing, importing and exporting the
mustard seeds (FAO, 2011)
0
50000
100000
150000
200000
Nepal Canada Russia Myanmar Ukraine China Czech Republic
France Germany America
Mustard seed production (MT)
0
20000
40000
60000
80000
America Germany Nepal France Netherlands Poland Belgium Bangladesh Japan Thailand
Mustard seed import quantity (tonnes)
0
20000
40000
60000
80000
100000
120000
140000
Canada Ukraine Russia Germany Czech Republic
Netherlands Belgium Hungary Australia Romania
Mustard seed export quantity (tonnes)

5
Figure 1-3. Top ten countries in the world producing, importing and exporting the
rapeseed (FAO, 2011)
The largest exporter of rapeseed oil in the world is Canada followed by France, Netherlands,
Germany and Belgium (Figure 1-4). America imports the largest amount of mustard seeds
and rapeseed oil. No data on the mustard seed oil was available.
0
2000000
4000000
6000000
8000000
10000000
12000000
14000000
16000000
Canada China India France Germany United Kingdom
Australia Poland Ukraine Russia
Rapeseed production (MT)
0
500000
1000000
1500000
2000000
2500000
3000000
3500000
Germany Japan Netherlands Belgium Mexico China United Arab Emirates
Pakistan America France
Rapeseed import quantity (tonnes)
0
1000000
2000000
3000000
4000000
5000000
6000000
7000000
8000000
9000000
Canada France Australia Ukraine United Kingdom
Hungary Romania Bulgaria Belgium Slovakia
Rapeseed export quantity (tonnes)

6
Figure 1-4. Top ten countries in the world importing and exporting the rapeseed oil
(FAO, 2011)
1.2 ADULTERATION/AUTHENTICITY
1.2.1 Problem of oil blending/adulteration in the Nepalese market
In the Indian subcontinent countries including Nepal, undeodorized crude oil from HEARM
variety is one of the most popular oils and is widely used as a cooking oil because of the high
preference by the local consumers for its strong pungency. On the other hand, the oil from
LEAR varieties does not have a strong flavor and taste like that from HEARM varieties, and
thus cannot compete in the local market (Przybylski et al., 2005). Although the price of
HEARM and LEAR oils are comparable, there is an increasing tendency to mix LEAR oil
with some HEARM oil to increase its pungency and hence consumer acceptance (Przybylski
et al., 2005). Such practice would contaminate LEAR oil with erucic acid. Blending of any
edible oils can be considered as a fraudulent activity, unless both the qualitative and
0
200000
400000
600000
800000
1000000
1200000
1400000
1600000
America China Germany Netherlands Belgium France Norway Italy Sweden Austria
Rapeseed oil import quantity (tonnes)
0
500000
1000000
1500000
2000000
2500000
3000000
Canada France Netherlands Germany Belgium United Arab Emirates
America United Kingdom
Poland Czech Republic
Rapeseed oil export quantity (tonnes)

7
quantitative information is properly labeled. In addition, adulteration with cheaper and easily
available oils (for economical reasons) has been an ever increasing problem in the Nepalese
market. Soybean oil is one of the cheapest and most widely available oils in the local market,
and hence frequently used as an adulterant. Other common vegetable oils like sunflower oil,
corn oil have a market price comparable to the mustard/rapeseed oils, and hence not
commonly used for adulteration. The Department of Food Technology and Quality Control
(Government of Nepal) has frequently observed adulteration of mustard seed oil with
soybean oil during industry inspection (Himalayan News service, 2011). Therefore, there is
an immediate necessity for a simple and rapid method for the estimation of the composition
of the blended oils containing HEARM oil, LEAR oil and soybean oil.
1.2.2 Chemometric approaches used previously to authenticate oils and estimate oil
adulteration
The estimation of the concentration of individual oils in a blend is typically carried out by
applying chemometric approaches based on analytical data. The impossibility of physical
separation of the individual oils from the blended oil complicates the accurate estimation of
the blend composition (van Vliet, van Kempen, Reinders, & de Ridder, 2005). Various
methods were used in the past for the discrimination of different oils and for the estimation of
oil adulteration. Linear discriminant analysis along with the back propagation artificial neural
network method was studied to authenticate Italian extra virgin olive oil varieties (Marini et
al., 2004). Furthermore, the counter propagation neural network method was found to be
useful for the classification of different vegetable oils on the basis of fatty acid composition
(Brodnjak-Voncina, Kodba, & Novic, 2005). However, it remained confined to the
classification and it did not allow estimation of the oil blend composition. Afterwards, van
Vliet et al. (2005) introduced strategies that could be adopted for the qualitative and
quantitative estimation of oil blend composition. In addition, the study on the use of an
electronic nose for the detection of maize oil adulteration in camellia seed oil and sesame oil
was carried out later. This study showed that linear discriminant analysis was more effective
than principal component analysis (PCA) in adulterant discrimination (Hai & Wang, 2006). A
recent study on the adulteration of extra virgin olive oil with other oils has used the partial
least squares (PLS) method for multivariate calibration based on Fourier transform infrared
spectroscopy (FTIR) (Maggio, Cerretani, Chiavaro, Kaufman, & Bendini, 2010). In an

8
another study, dielectric spectroscopy data has been used to predict the adulteration of olive
oil applying the PLS method (Lizhi, Toyoda, & Ihara, 2010). Recently, blend prediction of
sunflower and olive oil using different chemometric tools based on fatty acid data has also
been described (Monfreda, Gobbi, & Grippa, 2012).
1.3 LIPID OXIDATION AND OXIDATIVE STABILITY
1.3.1 Introduction
Lipid oxidation is one of the most important mechanisms of chemical deterioration of food. It
results in off-flavor, degradation of essential fatty acids and antioxidants, and formation of
toxic compounds. The oil oxidative stability refers to its resistance to oxidation and is
commonly expressed as the period of time required to reach a certain critical level of
oxidation (Choe & Min, 2006)
The classical theory of lipid oxidation suggests the involvement of a free radical mechanism
and involves three steps: initiation, propagation and termination as outlined below.
Step 1: initiation
RH R·+H·
Step 2: propagation
R·+3O2 ROO·
ROO·+RH ROOH+R·
Step 3: termination
ROO·+R· ROOR
R· + R· RR
(R: lipid alkyl)
Because of the triplet state of atmospheric oxygen, it cannot directly react with the nonradical
singlet state double bond of the fatty acids. Either the double bond must be excited to a triplet

9
state requiring a large amount of energy (Ea = 146-272 kJ/mol) or oxygen must be brought to
the singlet state using light in the presence of a photo-sensitizer (Schaich, 2005). Therefore,
lipid oxidation is not a spontaneous reaction, and it requires initiators or catalysts to
overcome this spin barrier.
The integrated scheme of lipid oxidation showing multiple pathways competing with the
classical hydrogen abstraction is shown in Figure 1-5.
Figure 1-5. Scheme for lipid oxidation showing multiple reactions pathways. Dotted
lines indicate paths for oxygen addition to secondary radicals (Schaich, 2005)
Heat, metal catalysts and ultraviolet light can catalyze the free radical formation of fatty acids
or acylglycerols. These alkyl radicals can directly react with triplet oxygen to form a lipid
peroxy radical, which can abstract hydrogen from another lipid molecule to form a
hydroperoxide and an alkyl radical. In this way, autoxidation propagates via a self catalyzed
free radical mechanism (Frankel, 2005; Schaich, 2005).
LH
L˙
LOO˙
LOOH
˙OL LO˙
Epoxides-˙
LOO+
or LOO─
O2
1e- oxidation E
β-Scission of O2
Isomerization
Cis trans
Hydrogen
abstraction from LH or RH
+/- Electron
transfer Epoxides-˙ + LO˙
Dimers-˙
Polymers
Addition
hγ, Δ Mn+
O2
H+
HO˙ +
Aldehydes, Alkanes, Oxo compounds, Scission radicals˙
Epoxides (Hydroxy-, hydroperoxy-)
Cyclization
Scission
Secondary oxidations
Polymers
C=C
Addition
Peroxides, ketones
Recombination
Cyclization
+ OH─ + M
(n+1)+
LOH + L˙
H abstraction
Epidioxides-˙,
Endoperoxides-˙
O2
Cyclization
O2
Dimers
-CH=CH- addition
Scission

10
Lipid hydroperoxides are readily decomposed in the presence of metals or at high
temperature. The homolytic cleavage between the oxygen-oxygen bond results in the
formation of alkoxy radicals and a highly reactive hydroxyl radical. The alkoxy radical can
also undergo homolytic β-scission of the carbon-carbon bond to produce oxo-compounds and
alkyl radicals. In this way, multiple competing reactions of peroxy and alkoxy radicals such
as hydrogen abstraction, cyclization, addition, α- and β-scission etc. result in the formation of
the ultimate secondary lipid oxidation products (e.g. low molecular-weight aldehydes,
ketones, alcohols, short-chain hydrocarbons etc.) (Choe & Min, 2006).
1.3.2 Factors affecting lipid oxidation
Lipid oxidation is a complex array of reactions affected by the interaction of multiple factors
occurring at the same time. Hence it is difficult to differentiate the individual effect of each
factor. Some of the important factors known to affect the lipid oxidation are shortly discussed
below:
1.3.2.1 Fatty acid composition
The oils with higher degree of unsaturation are oxidized more quickly than that with lower
degree of unsaturation. For instance, soybean, safflower or sunflower oils have significantly
shorter induction period compared to coconut or palm kernel oils (Tan, Che Man, Selamat, &
Yusoff, 2002).
1.3.2.2 Oil processing
The processing methods greatly affect the oil oxidative stability. For example, crude soybean
oil is the most stable against autoxidation at 55 oC followed by deodorized, degummed,
refined and bleached oil (Jung, Yoon, & Min, 1989). Seed roasting is also known to increase
the oxidative stability of oils of different seeds, such as mustard (Vaidya & Choe, 2011a),
sesame (Lee, Jeung, Park, Lee, & Lee, 2010), terebinth (Pistacia terebinthus) (Durmaz &
Gokmen, 2011) etc. Such effect of seed roasting in oxidative stability of oil is discussed in
more details in the later part (section 1.4).

11
1.3.2.3 Temperature
Both the autoxidation and the decomposition of hydroperoxides increase with the increasing
temperature. Only frying temperatures have sufficient energy to break the covalent C-C and
C-H bonds to form alkyl radicals. Moderate temperatures primarily act by breaking O-O
bonds of hydroperoxides, formed during the initiation step, to form varieties of alkoxy and
hydroxyl radicals, which further catalyze the autoxidation reactions (Schaich, 2005).
1.3.2.4 Oxygen
The amount of oxygen dissolved in oil is sufficient to oxidize oil to a peroxide value of
approximately 10 meq/kg oil (Przybylski & Eskin, 1988). Oil oxidation is independent of the
headspace oxygen concentration above 5% at moderate temperatures. At higher temperatures,
the dependency of oil oxidation on oxygen concentration increases due to a decrease in
solubility of oxygen in the oil (Choe & Min, 2006).
1.3.2.5 Minor components of oils
1.3.2.5.1 Free fatty acids and mono- and diacylglycerols
Because of the presence of both hydrophilic and lipophilic groups, they prefer to remain
concentrated on the surface of edible oils. Hence, they decrease the surface tension and
increase the diffusion rate of oxygen from the headspace into the oil, and thus accelerate the
oil autoxidation (Choe & Min, 2006).
1.3.2.5.2 Metals
Redox-active metals undergoing one electron transfer (such as cobalt, iron, copper) are the
most important catalyst of the lipid oxidation (Schaich, 2005). Higher valence metals (e.g.
Cu2+
, Fe3+
) can directly remove an electron from a double bond, or a labile H from C-H bond
in the lipid molecule (e.g. allylic hydrogen) to generate alkyl radicals. The lower valence
metals (e.g. Cu1+
, Fe2+
) form a complex with oxygen and then react directly with lipid
molecules to generate alkyl and alkoxy radicals. In addition, they can also generate different
reactive oxygen species such as hydroxyl radical, superoxide, 1O2,
etc. These reactive oxygen
species are well known to further catalyze the lipid oxidation (Schaich, 2005). Furthermore,
the decomposition of hydroperoxides by metals to generate alkoxy and peroxy radicals is

12
considered as one of the major initiation mechanisms of lipid oxidation (Schaich, 2005;
Frankel, 2005; Choe & Min, 2006).
1.3.2.5.3 Phospholipids
Phospholipids such as phosphatidylethanolamine, phosphatidylcholine, phosphatidylinositol,
phosphatidylserine, phosphatidic acid etc. are generally removed from crude oil during
degumming. Phospholipids are known to play an antioxidant activity by sequestering metals,
transferring hydrogen from amino group to tocopheroxyl radical to regenerate tocopherol and
by improving the affinity of antioxidants toward the lipid by emulsification (Frankel, 2005).
1.3.2.5.4 Antioxidants
Antioxidants are the compounds that can extend the induction period of oxidation or slow
down the oxidation rate. Free radical scavenging antioxidants donate hydrogen atom to free
radicals. Standard one-electron reduction potentials of alkoxy, peroxy and alkyl radicals of
unsaturated fatty acids are 1600, 1000 and 600 mV respectively; while that of antioxidants
are generally below 500 mV (Buettner, 1993). Therefore, antioxidants can easily react with
these radicals, and form antioxidant radicals, which are stabilized by their resonance
structures. Phosphoric acid, citric acid, ascorbic acid, EDTA (ethylenediaminetetraacetic
acid) etc. show antioxidant activity by inactivating the transition metals via chelation.
Carotenoids can reduce oxidation rate by filtering the light, quenching the 1O2, inactivating
the photo-sensitizer, and scavenging the free radicals (Choe & Min, 2006). Maillard
browning reaction products act as antioxidants mainly by their reducing and metal
complexing properties, and free radical scavenging capacity (Frankel, 2005).
Oils naturally contain different antioxidants such as tocopherol (Figure 1-6), tocotrienols
(Figure 1-6), carotenoids, phenolic compounds (Figure 1-7), sterols etc. One tocopherol
molecule can protect around 103 to 10
8 fatty acid molecules at a low peroxide value (Kamal-
Eldin & Appelqvist, 1996). Among different isomers, δ-tocopherol has the highest free
radical scavenging activity followed by γ-, β-, and α- tocopherol. The optimum concentration
for maximal antioxidant activity of α-, γ- and δ- tocopherol are 100, 250 and 500 ppm
respectively (Choe & Min, 2006).

13
Rapeseed oil is known to contain α-, γ-, δ- tocopherol and plastochromanol-8 (Przybylski et
al., 2005). Plastochromanol-8 is a γ-tocotrienol homologue with a longer side chain of eight
isoprenoid units (Figure 1-6). The tocopherols content of some selected vegetable oils is
shown in Table 1-1. In addition, Brassica species are also rich in phenolic compounds such
as sinapic, caffeic, cinnamic, p-coumaric, ferulic, gentisic, p-hydroxybenzoic, protocatechuic,
salicylic and syringic acids (Figure 1-7). These phenolic acids contain hydroxycinnamic and
hydroxybenzoic structures (SzydlOwska-Czerniak, 2013).
Table 1-1. Tocopherols content in selected vegetable oils (mg/kg)
Oil α β γ δ P-8 reference
Mustard oil 76 318 16 Vaidya and Choe, 2011
Mustard oil 145 432 25 Vaidya and Choe, 2010
HEAR 268 426 - 97 Przybylski et al., 2005
Canola 272 423 - 75 Przybylski et al., 2005
LLCanola 150 314 7 47 Przybylski et al., 2005
HOCanola 226 202 3 42 Przybylski et al., 2005
HOLLCanola 286 607 8 83 Przybylski et al., 2005
Soybean 116 34 737 275 - Przybylski et al., 2005
Sunflower 613 17 19 - - Przybylski et al., 2005
Corn 134 18 412 39 - Przybylski et al., 2005
LLFlax 26 - 213 9 130 Przybylski et al., 2005
Abbreviations: HEAR - high erucic acid rapeseed; LLCanola - Canola oil with low content of linolenic acid;
HOCanola - Canola oil with high content of oleic acid; LLFlax - Flax oil with low content of linolenic acid; P-8
- Plastochromanol-8

14
OH
OH
R3
R2
R13
Tocopherol (Toc)
3
Tocotrienol (Tt)
OH
OH
R3
R2
R1
OH
OH
R3
R2
R1
8
Plastochromanol-8 (PC-8)
Compound R1 R2 R3
α-Toc/Tt CH3 CH3 CH3
β-Toc/Tt CH3 H CH3
γ-Toc/Tt CH3 CH3 H
δ-Toc/Tt CH3 H H
PC-8 CH3 CH3 H
Figure 1-6. Structural formulas of tocochromanols
O
H
R7
R6
R5
R4
OH
Hydroxybenzoic structure
O
H
R7
R6
R5
R4
OH
Hydroxycinnamic structure
Phenolic acid R4 R5 R6 R7
Hydroxycinnamic structure
Caffeic acid H OH OH H
Cinnamic acid H H H H
p-Coumaric acid H H OH H
Ferulic acid H OCH3 OH H
Sinapic acid H OCH3 OH OCH3
Hydroxybenzoic structure
Gentisic acid OH H H OH
p-Hydroxybenzoic acid H H OH H
Protocatechuic acid H OH OH H
Salicylic acid OH H H H
Syringic acid H OCH3 OH OCH3
Figure 1-7. Structural formulas of phenolic acids
Among different phenolic acids present in rapeseed, sinapic acid is the most predominant
phenolic compound. It accounts for over 73% of the free phenolic acids and about 80-99% of
the esterified phenolic acid derivatives. The most common sinapic acid derivative is sinapine,
the choline ester of sinapic acid (Figure 1-8). Glucopyranosyl sinapate (a glucosidic ester,
Figure 1-8) is also known to be present in rapeseed (SzydlOwska-Czerniak, 2013). These
various phenolic compounds are known to be partially extracted in rapeseed oil.

15
O OH
MeO OMe
OH
Sinapic acid
O O
MeO OMe
OH
N+(Me)3
Sinapine
Glucopyranosyl sinapate
O
MeO OMe
OH
O
O
HH
H
OH
OH
H OH
H
OH
Glucopyranosyl sinapateGlucopyranosyl sinapate
Figure 1-8. Structural formulas of sinapic acid and its derivatives
In addition to these phenolic compounds, rapeseed and canola products are also known to
contain soluble and insoluble condensed tannins (proanthocyanidins), which are polymeric
phenolics based on flavonoids (Figure 1-9).
O
O
O
OH
OH
OH
OH
OH
OH
OH
OH
OH
OH
OH
OH
OH
OH
OH
n
Figure 1-9. Structural formula of condensed tannins
The condensed tannins are mainly located in the rapeseed/canola hulls ranging between 14
and 6213 mg/100 g of oil-free hulls (SzydlOwska-Czerniak, 2013). However, they are not
known to be extracted in rapeseed oil.

16
1.4 EFFECT OF SEED ROASTING ON OIL OXIDATIVE STABILITY
Seed roasting has been known to increase the oil oxidative stability of different seeds, such as
mustard (Vaidya & Choe, 2011a), sesame (Lee et al., 2010), Pistacia terebinthus (Durmaz &
Gokmen, 2011), pine nut (Cai, Cao, Aisikaer, & Ying, 2013), cashew (Chandrasekara &
Shahidi, 2011), perilla (Zhao, Hong, Lee, Lee, & Kim, 2012), apricot (Durmaz, Karabulut,
Topcu, Asilturk, & Kutlu, 2010), pumpkin (Nederal et al., 2012; Vujasinovic, Djilas, Dimic,
Basic, & Radocaj, 2012), walnut (Vaidya & Eun, 2013), rapeseed (RS) (Wijesundera,
Ceccato, Fagan, & Shen, 2008) etc. However, there are considerable differences in the
manner roasting improves the oil oxidative stability of these seeds. For instance, production
of different radical scavengers, such as sesamol in sesame seed (Lee et al., 2010) and canolol
in RS during seed roasting are considered to play an important role (Wijesundera et al., 2008;
Koski, Pekkarinen, Hopia, Wähälä, & Heinonen, 2003; Matthaus, 2012). In some cases,
increased phospholipid extraction after seed roasting has also been suggested as a supporting
cause (Zhao et al., 2012; Vujasinovic et al., 2012). In most of the cases however, Maillard
browning reactions between amino acids and reducing sugars have been proposed as an
important contributing factor (Cai et al., 2013; Vaidya & Choe, 2011a; Durmaz & Gokmen,
2011; Chandrasekara & Shahidi, 2011; Vaidya & Eun, 2013; Wijesundera et al., 2008;
Nederal et al., 2012). These results suggest that roasting can have different effects in different
types of seeds. Hence, it is important to understand the roasting effects and the manner in
which it improves the oil oxidative stability on each type of seed, separately.
Mustard seeds are generally roasted before oil extraction, and the crude oil extracted using a
screw expeller is consumed without refining in different South Asian countries such as India
and Nepal (Vaidya & Choe, 2011a; Vaidya & Choe, 2011b). Scientific studies on roasted
mustard seed oil are very rare. A recent study has shown that roasting of mustard seed before
oil extraction could significantly improve the oxidative stability of oil together with the
stability of tocopherol and lutein during storage (Vaidya & Choe, 2011a; Vaidya & Choe,
2011b). The increased stability was attributed to the formation of antioxidative compounds
during roasting via Maillard reactions. These authors also reported a small increase in the
tocopherol content (around 40 μg/g of oil) during roasting. Because the reported increase in
the tocopherol content was very low and the suggested contributions of Maillard reactions
were not clearly demonstrated, it remains unclear which factors or compounds are actually

17
responsible for the increase in the oxidative stability of mustard seed oil upon roasting
(Vaidya & Choe, 2011a).
Non-enzymatic browning reactions are mainly the consequences of amino-carbonyl reactions.
There could be different sources of amino groups such as amino acids, proteins, amino
phospholipids etc., while the carbonyl groups may come from reducing sugars, lipid and
protein oxidation products etc.
Maillard reactions between amino acids and reducing sugars are one of the most well-known
reactions in the heat treated food products. In addition to the formation of aroma, taste and
color, these reactions are also known to form natural antioxidants (Manzocco, Calligaris,
Mastrocola, Nicoli, & Lerici, 2000). Such antioxidant properties of Maillard reaction
products are mainly linked with the formation of reductone structures. Such structures have
reducing and metal complexing properties. They can also destroy peroxides by reducing lipid
hydroperoxides into alcohols (Frankel, 2005).
Phospholipids containing amino group (e.g. phosphatidylethanolamine (PE)) are also known
to take part in Maillard type browning reactions. Such reaction products are known to be
lipophilic in contrast to the hydrophilic nature of the Maillard reaction products between
amino acids and carbohydrates (Zamora, León, & Hidalgo, 2011). Therefore, they could
more likely be extracted in the roasted seed oil and could play an important role in the
oxidative stability. The Maillard type reactions between PE and hexoses have been reported
to form phospholipid-linked pyrrolecarbaldehyde in the initial stages, which could react with
an additional PE molecule to form 2,3-dihydro-1H-imidazo[1,2-a]pyridine-4-ylium
derivatives with a maximum UV absorption at 350 nm (Lederer & Baumann, 2000; Hayashi
et al., 2007). The reaction products are prone to repeated aldol-type condensation and pyrrole
polymerization reactions giving rise to brown and fluorescent polymeric compounds with an
antioxidant activity (Zamora & Hidalgo, 2003; Zamora, Olmo, Navarro, & Hidalgo, 2004;
Zamora & Hidalgo, 2005; Zamora et al., 2011). Although such reactions are inevitable during
seed roasting, the possibilities of occurrence of such reactions and their impact on the
oxidative stability of roasted seed oil have been given little attention.


19
CHAPTER
2
MONTE CARLO SIMULATION BASED PREDICTION OF
BLENDED OIL COMPOSITION CONTAINING MUSTARD,
RAPESEED AND SOBYEAN OILS

20
Relevant publications:
Shrestha, K., Jacxsens, L., De Meulenaer, B. (2013). Monte Carlo simulation based
prediction of blended oil composition containing mustard, rapeseed and soybean oil.
Accepted for publication in Food Research International, Special issue: authenticity,
typicality, traceability and intrinsic quality of food products, In press.
Shrestha, K., De Meulenaer, B. (2011). Computational estimation of soybean oil adulteration
in Nepalese mustard seed oil based on fatty acid composition. Communications in
Agricultural and Applied Biological Sciences, 76 (1), 211-214

21
ABSTRACT
High erucic acid rapeseed and mustard seed (HEARM) oils are popular cooking oils in
various South Asian countries (e.g. Nepal, India, Bangladesh) due to the preference of the
local consumer for its strong pungency. Low erucic acid rapeseed (LEAR) oil having lower
pungency is frequently mixed with the pungent HEARM oil to increase its sensory appeal to
the local consumer. Moreover, these oils are also prone to be adulterated with the cheaper oil
available in the local market like soybean oil for economical reasons. In order to detect this
fraud in a quick and easy manner, a Monte Carlo simulation based approach was developed
for the estimation of blend composition using only the fatty acid composition of the sample.
The limits of detection (LOD) of soybean oil in HEARM oil and LEAR oil were 14% and
13%, respectively. The LODs of LEAR oil in HEARM oil and soybean oil were 11 and 9%,
respectively. Similarly, the LODs of HEARM oil in LEAR oil and soybean oil were 9% and
3%, respectively. The prediction from the developed method was evaluated both in real oil
blends (prepared in the laboratory) and in theoretically simulated blends. The method was
applied on forty-nine samples (labeled as mustard/rapeseed oil) collected from the Nepalese
market. Among them, twenty-seven samples were found to be adulterated with soybean oil.
The predicted adulteration was further supported by their δ-tocopherol content and trans fatty
acid content, as an indicator for the adulteration with refined oil. The developed Monte Carlo
simulation method is based on a single analytical run for the fatty acid composition of the
suspected oil blend and thus useful for a quick segregation of samples in routine analysis.
Keywords: mustard seed oil, rapeseed oil, soybean oil, adulteration, blend composition, fatty
acid composition, Monte Carlo simulation

22
2.1 INTRODUCTION
In many South Asian countries (e.g. Nepal, India, and Bangladesh), high erucic acid rapeseed
and mustard seed (HEARM) oils are commonly used as cooking oils. The popularity of these
oils is linked with the preference of the local consumer for its strong pungency, which is
attributed by the formation of volatile isothiocyantes (e.g. allyl isothiocyante) from the
glucosinolates (e.g. sinigrin glucoside) by the action of myrosinase enzyme. Because of the
presence of the lower amount of glucosinolates (< 30 µmol/g) in the low erucic acid rapeseed
(LEAR) varieties, the oils from LEAR varieties (e.g. European rapeseed, Canola) are
considerably less pungent compared to the oils from HEARM varieties. Therefore, local
consumers in Nepal have shown less preference to LEAR oil. This has led to an increasing
tendency to mix LEAR oil with HEARM oil by the manufacturers without properly
mentioning the product as blended oil. Such practice could be considered as a fraudulent
activity. In addition, adulteration with cheaper and widely available oils such as soybean oil
has also been a frequent problem in the Nepalese market. Such problems of oil
blending/adulteration are discussed in Chapter 1. In addition, chemometric approaches used
previously to authenticate different oils, and to estimate oil adulteration is also presented in
Chapter 1.
The objective of this research was to develop a method for the estimation of composition of
oil blends containing HEARM, LEAR and soybean oils. Such method was developed by
applying a Monte Carlo simulation approach using the fatty acid composition data.
Afterwards, the developed method was applied to the samples collected from the Nepalese
market to evaluate the current adulteration status.
2.2 MATERIALS AND METHODS
2.2.1 Samples and chemicals
Forty nine oil samples of different brands (fresh oil samples (not older than two months)
labeled as mustard/rapeseed) were collected from the Nepalese market. The samples were
stored under freezing conditions below -18 oC until analysis. The seeds of five HEARM
varieties and one LEAR variety were also collected from the Nepalese market.

23
Fatty acid standard (GLC 68D) was obtained from Nu-Check Prep. Inc. (USA). The E/Z-
isomers of linoleic acid methyl esters were obtained from Sigma Aldrich (Steinheim,
Germany). Nonadecanoic acid (99.5+ %) was purchased from Fluka (Switzerland). Iso-
octane (99.5+ %), methanol (99.8+ %), sodium sulphate (99+ %), sodium hydroxide (99+ %)
and sodium chloride (99+ %) were obtained from Chem-lab (Belgium). Boron trifluoride in
methanol reagent and isopropanol (99.9%) were supplied by Merck (Germany). Tocopherol
standard was obtained from DSM (New Jersey, USA). HPLC grade hexane was purchased
from Fischer Scientific (Belgium). Other chemicals and reagents were of analytical grade
obtained from reliable commercial sources.
2.2.2 Analytical methods
2.2.2.1 Fatty acid analysis
The grounded seed powder (5 g) was homogenized with 40 mL chloroform/methanol (2/1,
v/v) (containing 100 mg of internal standard (nonadecanoic acid) and 3 mg of butylated
hydroxytoluene) using an ultra turrax. After overnight standing in the dark, the mixture was
filtered and washed with 20 mL of same solvent mixture. Afterwards, the filtrate was
homogenized with 15 mL of acidified water (pH 2), and the resulting homogenate was
centrifuged. The lower layer was evaporated to obtain the lipid fraction.
The boron trifluoride method was used for the preparation of fatty acid methyl esters
(FAMEs) (AOCS, 1990). FAMEs were analyzed on an Agilent 6890N gas chromatography
(USA) using a CP-SIL88 column (60 m × 0.25 mm × 0.20 µm, Varian) after cool-on-column
injection (0.1 µL), and detection was carried out using a flame ionization detector set at 300
oC. The oven temperature was held at 50
oC for 4 min, then programmed to 120
oC at 10
oC/min, then programmed to 188
oC at 5
oC/min, held for 20 min, and then programmed to
225 oC at 5
oC/min which was held for 15 min. Helium was used both as a carrier gas (1
mL/min) and make up gas (20 mL/min). Hydrogen and air flow rates were 40 mL/min and
400 mL/min, respectively. The fatty acid composition was expressed as g/100 g oil using
nonadecanoic acid (C19:0) as an internal standard. The mean value of the duplicate analysis
was reported. The relative standard deviation (RSD) values based on 10 duplicate
observations were found to be 1.03, 0.82 and 0.85% for fatty acid data below 5%, 5-20% and
above 20% respectively.

24
2.2.2.2 Tocopherol analysis
Tocopherol content of the oil was analyzed on an Agilent 1100 series high pressure liquid
chromatography (HPLC) equipped with a degasser, four solvent delivery modules, an
autosampler, a column oven, and a fluorescence detector. A mobile phase containing 0.9%
isopropanol in hexane (v/v) was used in isocratic conditions at a flow rate of 1 mL/min.
Separation was carried out on a LiChroCART 250-4,6 Purospher STAR Si (5 μm) column
(Merck, Darmstadt, Germany) with a precolumn containing the same phase. The temperature
of the column was maintained at 35 °C, and the chromatogram was obtained with a
fluorescence detector (excitation at 285 nm and emission at 325 nm). Analysis of each
sample was carried out in triplicate.
2.2.2.3 Peroxide value
The peroxide value (PV) was determined using an iron based spectrophotometric method
(Shantha & Decker, 1994). Calibration curve was constructed using a standard iron (III)
chloride solution as described in the same method. Calibration was done using six
concentrations in duplicate in the range of 5 to 30 µg of iron (III). The multiple R-squared
value was more than 0.99 for the calibration. Such calibration curve was constructed just
before the measurement of peroxide value of sample.
2.2.3 Monte Carlo simulation and statistical analysis
The canonical discriminant analysis (CDA) and Pearson‟s correlation were calculated using
Spotfire S+ 8.1 software (TIBCO Software Inc.). Normality of the data was accessed using
quantile-quantile plot and Kolmogorov-Smirnov test using the same software. Monte Carlo
simulation was carried out using @Risk for Excel software (version 5.7.1, Palisade
Corporation). The simulation settings were as follows: 100,000 iterations using Latin
hypercube sampling type with mersenne twister generator applying random initial sampling
speed. The simulated fatty acid compositions were used as @Risk inputs and calculations
were based on mass balance equations. The details of such simulations have been shown in
Figure 2-1 and the stepwise development of such simulation has been described below.

25
Step 1. Fatty acid composition (%) dataset from literature, lab analysis of seed samples from Nepal and three point data
(mean, minimum and maximum) obtained from an oil processing company in Belgium (Table 8-1)
Step 2. Calculating the correlations among different fatty acids (Table 2-1) using Tibco Spotfire S+ 8.1 software
Step 3. Defining the best fit distribution for different fatty acids of HEARM oil (Table 2-1) and applying PERT
distribution as a „three point estimation of frequency distribution‟ for LEAR and soybean oil (Table 2-1)
Step 4. Simulation of 100 fatty acid composition (based on the distribution (step 3) and correlations among fatty acids (Table 2-1– step 2)) for each oil type using @Risk for Excel software and conversion of simulated fatty acid
composition to g/100 g TAG
Step 5. Canonical discriminant analysis (CDA) (Figure 2-2 and Table 2-2) for three types of oil (HEARM, LEAR and soybean oil) based on 100 simulated fatty acid composition (g/100 g TAG) using Tibco Spotfire S+ 8.1 software
Step 6. Monte Carlo simulation method for the prediction of blend composition using @Risk for Excel software
@Risk Input:
1. Simulation of fatty acid composition for three
oils (HEARM, LEAR, and S) based on
distribution and correlation coefficient (Table
2-1), conversion of fatty acid composition into g/100 g TAG, then transformation into CDA
dimensions
HEARM oil: d1h and d2h
LEAR oil: d1l and d2l Soybean oil: d1s and d2s
2. Fatty acid composition of an oil sample (from
GC analysis) converted to g/100 g TAG, then transformed into CDA dimensions: d1o and d2o
Simulation settings:
Iterations: 100,000, sampling type: Latin
hypercube, generator: mersenne twister, initial
speed: choose randomly
@Risk output:
H, L and S
Predicted
frequency distribution:
H output
L output
S output
Calculations:
Mass balance equations
H*d1h + L*d1l + S*d1s = 100*d1o ……….(1) H*d2h + L*d2l + S*d2s = 100*d2o ……….(2)
H + L + S = 100 ………(3)
Where, H, L and S are percentage of TAG from
HEARM, LEAR and S cluster in the blend, respectively. Solving these three equations by
matrix method in excel sheet to obtain H, L and S.
Step 7. Proof of concept of mass balance equations on the real blend of soybean and mustard seed oil (Table 2-3 and
Figure 2-3)
Step 8. Prediction of real blend of soybean and mustard seed oil using the developed Monte Carlo simulation method
(step 6) and comparison with known composition (Table 2-3)
Step 9. Evaluation of the developed Monte Carlo method (step 6) on simulated blends with different oil blending ratios (H:L:S) : accuracy, precision and calculation of limit of detection (LOD)
@Risk input:
1. Simulation of fatty acid composition of HEARM,
LEAR and S oils, conversion to g/100 g TAG of and
transformation into CDA dimensions (similar to step 6) HEARM oil: d1h and d2h
LEAR oil: d1l and d2l
Soybean oil: d1s and d2s
2. Second independent simulation of fatty acid
composition of HEARM, LEAR and S oils, converted
to g/100 g TAG, then calculation of fatty acid composition of simulated blend oil in a desired H:L:S
ratio by mass balance of each fatty acid and then,
transformation into CDA dimensions: d1o and d2o
Simulation
settings, calculations
and @Risk
output as
described in step 6
LOD determination:
Simulations were repeated for different H:L:S
ratio in the blend (each time with 1%
increment of adulterant)
Detection of an oil accepted when the predicted lower 99.7% confidence interval
was more than zero
The concentration of an adulterant at which it
can be detected with 99.7% confidence was accepted as its LOD
Accuracy and precision:
Simulations were repeated for different H:L:S
ratio in the blend (each time 20% increment)
(Table 2-4)
Step 10. Application of the developed Monte Carlo simulation method (step 6) for the blend prediction of oil samples
collected from Nepalese market (Figure 2-4 and Table 2-5)
Figure 2-1. Schematic representation of a Monte Carlo simulation based method for the
prediction of oil blend composition containing HEARM, LEAR and soybean oil (S), and
its application in the samples collected from Nepalese market

26
2.3 RESULTS AND DISCUSSION
2.3.1 Development of a Monte Carlo simulation based method for the prediction of
blend composition
The schematic representation of the different steps followed during the development of a
Monte Carlo simulation based method for the prediction of blend composition has been
shown in Figure 2-1. The method development part (step 1 to 6) will be discussed in this
section.
At first, fatty acid composition databases were prepared (step 1 of Figure 2-1). Table 8-1 (in
Appendix) demonstrates the sixty-four sources of information collected to set-up the fatty
acid composition database. The fatty acid composition of HEARM varieties (B. juncea and B.
campestris) obtained from neighboring countries like India and Bangladesh were collected
from literature data, as no data from Nepal could be obtained from literature. Seed samples
collected from the Nepalese market were additionally analyzed for their fatty acid
composition and added to the database (Table 8-1). The fatty acid composition data of LEAR
varieties (B. napus) and soybean oil were also collected from the literature (Table 8-1). The
fatty acid composition of low erucic acid rapeseed collected from the Nepalese market and
the soybean oil available on the Belgian market were analyzed and also added to the database.
In addition, the maximum, minimum and mean value of fatty acid data of LEAR oil and
soybean oil (based on more than 10,000 observations) were obtained from an oil processing
company, Cargill in Belgium (Table 8-1).
Afterwards, the Pearson‟s correlation coefficient among different fatty acid within a group
(HEARM & LEAR varieties of oil and soybean oil) was calculated (Table 2-1) (step 2 of
Figure 2-1).

27
Table 2-1. The distribution function of different fatty acids of HEARM oil, LEAR oil and soybean oil for @Risk software and the
correlation coefficients among them
A. HEARM oil
Fatty
acids Best fit distribution function of different fatty acids of HEARM oil for @Risk software
Correlation coefficient between different fatty acids
16:0 16:1 18:0 18:1 18:2 18:3 20:0 20:1 22:0 22:1 24:0
16:0 RiskBetaGeneral(4.1098,1.9555,0.22376,3.4797) 1.00
16:1 RiskMakeInput(IF(RAND()<0.77,0,RiskInvgauss(0.033456,0.043442,RiskShift(0.177685)))) -0.08 1.00
18:0 RiskNormal(1.05307,0.24556,RiskTruncate(0,)) -0.66 -0.05 1.00
18:1 RiskInvgauss(59.105,35893.897,RiskTruncate(0,),RiskShift(-46.552)) 0.01 -0.33 0.25 1.00
18:2 RiskWeibull(1.3546,4.3943,RiskShift(11.6896)) 0.83 -0.36 -0.61 0.08 1.00
18:3 RiskNormal(9.8088,2.0191,RiskTruncate(0,)) 0.59 0.51 -0.77 -0.48 0.39 1.00
20:0 RiskMakeInput(IF(RAND()<0.42,0,RiskTriang(0.67113,0.87197,1.48038))) -0.75 0.17 0.67 -0.27 -0.79 -0.53 1.00
20:1 RiskNormal(6.7799,1.725,RiskTruncate(0,)) 0.59 -0.33 -0.38 0.53 0.57 0.18 -0.77 1.00
22:0 RiskMakeInput(IF(RAND()<0.42,0,RiskExtvalue(1.06799,0.19936,RiskTruncate(0,)))) -0.66 0.19 0.53 -0.46 -0.72 -0.38 0.95 -0.85 1.00
22:1 RiskTriang(36.346,46.849,52.664) -0.88 0.27 0.61 -0.25 -0.88 -0.43 0.81 -0.71 0.75 1.00
24:0 RiskMakeInput(IF(RAND()<0.45,0,RiskUniform(0.20158,0.85638,))) -0.58 -0.06 0.44 -0.42 -0.54 -0.43 0.83 -0.78 0.86 0.62 1.00
other RiskLognorm(7.9089,1.961,RiskTruncate(0,),RiskShift(-3.0079)) -0.42 0.08 0.23 -0.61 -0.45 -0.14 0.65 -0.76 0.78 0.42 0.76

28
B. LEAR oil
Fatty
acids
PERT distribution function
of fatty acids of LEAR oil for
@Risk software
Correlation coefficient between different fatty acids
16:0 16:1 18:0 18:1 18:2 18:3 20:0 20:1 22:0 22:1 24:0
16:0 RiskPert(3.40,4.58,5.90) 1.00
16:1 RiskPert(0.00,0.23,0.6) -0.16 1.00
18:0 RiskPert(0.80,1.58,3.10) -0.07 -0.50 1.00
18:1 RiskPert(57.20,62.02,66.25) -0.10 0.26 -0.11 1.00
18:2 RiskPert(16.15,18.43,25.40) 0.28 -0.11 -0.27 -0.80 1.00
18:3 RiskPert(7.00,9.52,12.28) -0.36 -0.33 0.31 -0.68 0.39 1.00
20:0 RiskPert(0.00,0.37,2.00) 0.22 0.30 -0.37 -0.43 0.57 0.03 1.00
20:1 RiskPert(0.00,1.06,3.10) 0.38 0.29 -0.57 -0.41 0.67 -0.15 0.67 1.00
22:0 RiskPert(0.00,0.11,1.50) -0.44 0.68 -0.32 -0.14 0.12 0.39 0.45 0.14 1.00
22:1 RiskPert(0.00,0.04,1.90) -0.25 0.27 0.01 0.04 -0.08 -0.10 -0.38 -0.03 0.01 1.00
24:0 RiskPert(0.00,0.00,0.75) -0.07 0.57 -0.42 0.05 0.23 -0.04 0.19 0.24 0.45 0.25 1.00
other RiskPert(0.00,0.00,3.90) -0.34 -0.01 0.28 0.40 -0.76 -0.31 -0.50 -0.58 -0.28 0.19 -0.22
C. Soybean oil
Fatty
acids
PERT distribution function
of fatty acids of soybean oil
for @Risk software
Correlation coefficient between different fatty acids
16:0 16:1 18:0 18:1 18:2 18:3 20:0 20:1 22:0 22:1 24:0
16:0 RiskPert(9.70,10.88,12.68) 1.00
16:1 RiskPert(0.00,0.09,0.20) 0.09 1.00
18:0 RiskPert(2.73,2.87,4.39) -0.58 -0.24 1.00
18:1 RiskPert(20.16,25.69,27.50) -0.10 -0.11 -0.06 1.00
18:2 RiskPert(49.35,53.26,55.21) -0.22 -0.08 -0.03 -0.65 1.00
18:3 RiskPert(4.54,5.75,7.80) -0.01 0.04 0.55 -0.60 -0.05 1.00
20:0 RiskPert(0.05,0.31,0.70) -0.11 0.02 -0.15 0.18 -0.38 -0.07 1.00
20:1 RiskPert(0.05,0.09,0.90) 0.16 -0.01 -0.30 0.59 -0.76 -0.21 0.65 1.00
22:0 RiskPert(0.00,0.46,0.62) 0.02 0.54 -0.03 0.09 -0.16 -0.07 -0.04 0.03 1.00
22:1 RiskPert(0.00,0.02,0.30) 0.29 0.36 -0.46 -0.06 0.11 -0.22 0.01 0.13 -0.14 1.00
24:0 RiskPert(0.00,0.14,0.30) 0.15 0.93 -0.23 -0.29 -0.04 0.24 0.01 -0.07 0.33 0.25 1.00
other RiskPert(0.00,0.90,1.10) -0.40 -0.10 -0.11 0.25 -0.15 -0.29 0.24 0.15 -0.03 -0.29 -0.07
The best fit distribution for each fatty acid of HEARM oil was obtained by using the @Risk
software (Table 2-1) (step 3 of Figure 2-1). The distribution was selected based on chi
square goodness of fit test. The best fit distribution was not significantly different from the
observed distribution of each fatty acid (p value ranging from 0.35 to 0.99). The fitting of
distribution was also confirmed by graphical analysis (probability-probability plot and
quantile-quantile plot). The best fit distributions together with the calculated correlations

29
among different fatty acids (Table 2-1) were used for the simulation of fatty acid
composition during Monte Carlo simulation (will be discussed later).
For LEAR and soybean oil, the maximum, minimum and mean values of each fatty acids
based on more than 10,000 observations were available, and hence were chosen as the best
reference for the estimation of frequency distribution. PERT distribution was selected as a
three point estimation using maximum, minimum and most likely values. The most likely
value was calculated from maximum, minimum and mean values based on the assumption of
PERT distribution [mean = (maximum + 4 * most likely + minimum) / 6]. PERT distribution
together with the correlation coefficients among different fatty acids (Table 2-1) was selected
for the simulation of fatty acid composition of LEAR and soybean oil (step 3 of Figure 2-1).
This PERT distribution will be used in Monte Carlo simulation, and will be discussed later.
Using the information given in Table 2-1, one hundred fatty acid composition for each group
of oil (HEARM & LEAR varieties of oil and soybean oil) was simulated using @Risk for
Excel software (step 4 of Figure 2-1). The simulated fatty acid composition was converted
into g fatty acid (FA)/100 g triacylglycerides (TAG), based on the fact that TAG is formed
when three moles of fatty acids and one mole of glycerol are esterified with the loss of three
moles of water. Afterwards, canonical discriminant analysis (CDA) was carried out on that
simulated data of three groups of oil (HEARM oil, LEAR oil and soybean oil) (step 5 of
Figure 2-1) and the plot against two dimensions has been shown in Figure 2-2. Both plug-in
and cross validation classification table showed that the model was able to correctly classify
all the samples. The canonical coefficients for two dimensions obtained from this analysis are
given in Table 2-2. These coefficients can be used to calculate the two CDA dimensions of
an oil by multiplying its‟ fatty acid composition (g FA/100 g TAG) by corresponding
coefficients and then taking the sum.

30
Figure 2-2. The plot of two dimensions obtained after canonical discriminant analysis of
HEARM, LEAR and soybean oil based on fatty acid composition (g/100 g TAG) (blue,
red and green dots represent HEARM oil, LEAR oil and soybean oil respectively)
Table 2-2. Canonical coefficients of two dimensions for different fatty acids based on
canonical discriminant analysis
Fatty acid dimension 1 dimension 2
16.0 0.4719 1.1741
18.0 0.3792 1.4094
18.1 0.3786 -0.1433
18.2 0.2299 0.4942
18.3 0.0488 -0.1962
20.1 -1.1516 0.0463
22.1 -0.3129 0.2882
Based on all this information, a Monte Carlo simulation based method for the blend
prediction was developed in @Risk software (step 6 of Figure 2-1). The distribution of each
fatty acid taking into account the correlation coefficient (Table 2-1) for all the groups of oil
was designated as @Risk input. The simulated fatty acid composition was converted into g
FA/100 g TAG, and then transformed into two CDA dimensions using the canonical
coefficients given in Table 2-2, as described earlier. The fatty acid composition of the oil
-10
0
10
20
30
10 20 30 40
dim2
dim
1
HEARM oil LEAR oil soybean oil
LEAR oil
HEARM oil
soybean oil

31
sample (obtained from GC analysis) was also converted into g FA/100 g TAG and then
transformed into two CDA dimensions.
The two mass balance equations for each CDA dimension have been given in equation 1 and
2 in step 6 of Figure 2-1. The proof of the concept for these mass balance equations will be
discussed later in step 7 of Figure 2-1. Those two equations (1 and 2) together with the third
equation to have sum of percentage as 100 (equation 3), were solved by the matrix method in
the Excel sheet (step 6 of Figure 2-1). In the matrix method, the equations are expressed in
matrix form A* x = b, where A is matrix of coefficients, x is matrix of variables and b is
matrix of constants. The solution to this system is given by x = A-1
* b. In this way, the
variables H, L and S in the equations (1, 2 and 3) (Figure 2-1) were solved for each iteration
during the simulation of the fatty acid composition of HEARM (H), LEAR (L) and soybean
oil (S) respectively.
The predicted percentages of TAG from HEARM, LEAR and soybean oil (H, L and S
obtained after solving three equations) were designated as @Risk output (step 6 of Figure
2-1). In this way, when the Monte Carlo simulation was carried out in the @Risk software,
the predicted values of H, L and S were obtained with detailed frequency distribution as
@Risk output. The software would provide all the statistical parameters (e.g. mean, standard
deviation, confidence interval etc) for the parameters chosen as @Risk output. By carrying
out simulations at increasing iteration numbers, it was observed that both the input and the
output of the simulations became stable at 100,000 iterations and hence, was chosen for rest
of the calculations (based on three runs with 100,000 iterations). Other simulation settings are
also given in Figure 2-1 (step 6).
In the condition when one of the oils could not be detected with 99.7% confidence (below the
limit of detection (LOD)), the blend composition was recalculated based on the remaining
two types of oils. For such calculation, only two mass balance equations would be needed to
be solved, as there would be only two unknowns. From the Figure 2-2, it can be observed
that dimension 1 separates HEARM oil from LEAR and soybean oil, while dimension 2
mainly separates the LEAR and soybean oil. Hence, when LEAR oil was below the LOD,
solving the equation 1 and 3 (without the LEAR oil) was used to recalculate the blend
composition considering only the HEARM and soybean oil. Similarly, when soybean oil was
below the LOD, solving the equation 1 and 3 (without the soybean oil) was used to

32
recalculate the blend composition considering only the HEARM and LEAR oil. And, when
HEARM oil was below the LOD, solving the equation 2 and 3 (without the HEARM oil) was
used to recalculate the blend composition considering only the LEAR and soybean oil. The
advantage of such recalculations is that the removal of undetected oil (< LOD) from the
calculation generally increases the precision during the prediction of other oils.
The developed method was evaluated both in real oil blends and in simulated oil blends and
will be discussed below.
2.3.2 Evaluation of the developed Monte Carlo simulation method in the real mixture
of soybean oil and HEARM oil (step 7 and 8 of Figure 2-1)
Soybean oil was blended with HEARM oil ranging from 5 to 100% (7 blends in duplicate) in
the laboratory. The fatty acid composition of these real oil blends was analyzed by gas
chromatography (GC) (Table 2-3) and was converted into g FA/100 g TAG. Afterwards, it
was transformed into two CDA dimensions (d1o and d2o) for each oil blend.
2.3.2.1 Proof of the concept of the mass balance equation 1 and 2 (step 7 of Figure 2-1)
Mass balance is a universal principle and each fatty acid does follow this principle during
blending, independent to any other fatty acids. The objective of this section is to evaluate the
mass balance equation for two CDA dimensions (used for the calculation in step 6 in Figure
2-1) by applying it in the real blend of known composition. Since only HEARM oil and
soybean oil were present in those real blends, the equations 1, 2 and 3 (step 6 in Figure 2-1)
can be written as,
H*d1h + S*d1s = 100*d1o , H*d2h + S*d2s = 100*d2o and H + S = 100
These equations can be re-written as,
d1o = d1h + (d1s - d1h)* S/100 ………………….. (Equation 4)
d2o = d2h + (d2s – d2h)* S/100 ………………….. (Equation 5)

33
Table 2-3. Analyzed fatty acid composition of real blend of high erucic mustard and soybean oil in different proportions and predicted
composition, based on the proposed Monte Carlo simulations method (all the percentages are in weight basis)
Mustard and
soybean oil
blend oil
Actual % of
soybean oil in
the blend
Lab analyzed fatty acid composition (g/100 g total fatty acid) predicted % composition (mean ± SDa)
16:0 16:1 18:0 18:1 18:2 18:3 20:0 20:1 22:0 22:1 24:0 others HEARM oilb LEAR oilb Soybean oilb
Blend 1 4.9 2.5 0.1 1.2 13.2 15.5 11.7 0.8 5.1 0.9 45.9 0.5 2.6 94.87 ± 3.58 < LOD < LOD
Blend 2 4.9 2.6 0.2 1.3 13.1 15.5 11.8 1.0 5.2 1.1 45.4 0.4 2.5 94.46 ± 3.57 < LOD < LOD
Blend 3 10.2 3.0 0.2 1.4 14.0 17.6 11.4 0.9 4.9 0.9 43.0 0.3 2.4 89.17 ± 3.38 < LOD < LOD
Blend 4 9.7 3.1 0.1 1.4 13.8 17.5 11.5 0.9 4.7 1.1 43.5 0.0 2.4 89.15 ± 3.37 < LOD < LOD
Blend 5 19.3 3.8 0.1 1.6 15.2 21.1 11.1 0.9 4.2 0.9 38.5 0.0 2.5 79.28 ± 3.00 < LOD 20.72 ± 3.00
Blend 6 19.3 3.8 0.2 1.7 15.4 21.4 10.8 0.7 4.2 0.9 38.6 0.0 2.1 78.93 ± 2.98 < LOD 21.07 ± 2.98
Blend 7 40.2 5.4 0.1 2.3 18.7 29.5 9.4 0.7 3.1 0.7 28.0 0.4 1.6 57.24 ± 2.16 < LOD 42.76 ± 2.16
Blend 8 39.9 5.3 0.1 2.3 18.4 28.9 9.8 0.6 3.0 0.8 28.6 0.3 1.8 58.03 ± 2.20 < LOD 41.97 ± 2.20
Blend 9 59.4 6.8 0.1 2.9 21.6 36.2 8.4 0.7 2.0 0.7 19.2 0.2 1.2 38.27 ± 1.49 < LOD 61.73 ± 1.49
Blend 10 59.3 7.0 0.1 2.9 21.4 37.0 8.6 0.6 2.1 0.6 18.7 0.2 0.8 37.36 ± 1.47 < LOD 62.64 ± 1.47
Blend 11 79.8 8.5 0.1 3.5 24.5 44.5 7.0 0.4 1.0 0.5 9.4 0.0 0.5 17.30 ± 0.84 < LOD 82.70 ± 0.84
Blend 12 79.9 8.5 0.1 3.5 24.4 44.6 7.1 0.4 1.0 0.7 9.3 0.0 0.5 17.28 ± 0.84 < LOD 82.72 ± 0.84
Soybean oil 100.0 10.0 0.1 4.1 27.4 51.6 5.4 0.3 0.3 0.4 0.0 0.0 0.4 < LOD < LOD 100.94 ±0.65
Soybean oil 100.0 10.1 0.1 4.1 27.3 51.8 5.4 0.3 0.2 0.3 0.0 0.0 0.4 < LOD < LOD 101.39 ±0.65
a SD, standard deviation
b LOD, limit of detection (based on 99.7% confidence interval)

34
All the blends were prepared from the same HEARM oil and soybean oil in different
blending ratios. Therefore, the CDA dimensions of HEARM oil (d1h and d2h) and soybean oil
(d1s and d2s) are constant in the equation 4 and 5. These equations predict that the plot of
CDA dimensions of the blend oil (d1o and d2o) should have a linear relation with the
percentage of soybean oil (S) in the blend. The plot based on the real mixture of soybean oil
and HEARM oil has been shown in Figure 2-3. Both of these dimensions followed a linear
relationship as a proof of the concept used for the calculation during Monte Carlo simulation
(step 6 in Figure 2-1).
Figure 2-3. Proof of concept of the linear mass balance equations for two CDA
dimensions (step 6 of Figure 2-1) by evaluating in the real mixtures of HEARM oil and
soybean oil (equations and R² coefficients)
2.3.2.2 Prediction of real soybean oil and HEARM blend oil (step 8 of Figure 2-1)
The fatty acid composition of the real blends (Table 2-3) was used to predict the blend
composition using the developed Monte Carlo simulation method as described in the step 6 of
Figure 2-1. The predicted mean values with standard deviation have been given in Table 2-3.
The blend oil containing less than 10% of soybean oil was not detected with 99.7%
confidence, and hence was quoted as below the LOD. The linearity between the actual and
y = 0.3837x - 10.622R² = 0.9994
y = 0.1651x + 20.042R² = 0.9991
20
25
30
35
40
-15
-10
-5
0
5
10
15
20
25
30
0 20 40 60 80 100
dim
ensi
on
2
dim
en
sio
n 1
% soybean oil added to mustard oil
dimension 1 of blend dimension 2 of blend

35
the predicted percentage of soybean oil was very good (slope = 1.00 (p < 0.001), R2
= 0.999).
The actual values were always within the 99.7% prediction interval supporting the prediction
of the method. Similarly, the linearity between the actual and the predicted percentage of
HEARM oil was also very good (slope = 1.04 (p < 0.001), R2 = 0.999).
The evaluation of the method in those fourteen different oil blends is definitely not sufficient.
The complete evaluation of the method would require oil samples from each cluster having
all the possible variation in the fatty acid composition together with innumerable number of
combinations in the blend. To give an example, if each blend is prepared in a 20% interval (0,
20, 40, 60, 80 and 100% for each cluster), there will be twenty-one oil blends (can be
observed in Table 2-4). Now, if ten fatty acid composition data for each group of oil are
considered, there will be 1,000 possible combinations of three oils for one blend composition.
Hence, there will be 21,000 numbers of possible blends, under the assumed circumstances. It
was not practically feasible to have such an exhaustive evaluation. Even if it would have been
done, the information based on those 21,000 blends prepared from a limited number of oil
samples (e.g. ten of each group of oil) cannot be accepted as a full evaluation of the proposed
method, as those ten samples cannot completely represent the variability of the fatty acid
composition as observed in Table 2-1. To overcome such problem, it was decided to evaluate
the method in the simulated blend, which could be prepared incorporating all the possible
known variations in the fatty acid composition. This exhaustive evaluation of the method
based on thousands of simulated blends was done to evaluate the accuracy, precision and the
limit of detection of the method and will be discussed below.
2.3.3 Evaluation of the developed Monte Carlo method by simulation study and
calculation of limit of detection (LOD) (step 9 of Figure 2-1)
The developed method was evaluated on the simulated blend of three clusters in different
blending ratios (step 9 of Figure 2-1). The objective of this evaluation was to compare the
prediction of the method with the known blend composition, and to calculate the limit of
detection (LOD). To carry out such an evaluation, the developed Monte Carlo simulation
method (step 6 of Figure 2-1) was slightly modified. In place of the fatty acid composition of
an oil sample, the fatty acid composition of the simulated blended oil in a desired blending
ratio was used (step 9 of Figure 2-1). To do so, another set of simulations of fatty acid
composition of three oils in the same Excel sheet was carried out, and was converted to g

36
FA/100 g TAG. Afterwards, the fatty acid composition of a simulated blend in a desired
blending ratio was calculated by the mass balance of each fatty acid. The fatty acid
composition of that simulated blend was transformed into two CDA dimensions (step 9 in
Figure 2-1) and the rest of the calculations and simulations were done similar to the one
described in the developed method (step 6 in Figure 2-1).
To calculate the limit of detection (LOD), the predictions were made for each 1% increase in
the quantity of adulterant oil. The detection of adulterant oil was only accepted when 99.7%
of the predicted amount was more than zero. Based on these criteria, the LODs of LEAR oil
and soybean oil in the HEARM oil were 11% and 14%, respectively. Similarly, the LODs of
HEARM oil and soybean oil in LEAR oil were 9% and 13%, respectively. Moreover, the
LODs of HEARM oil and LEAR oil in soybean oil were 3% and 9%, respectively. The lower
LOD for HEARM oil was due to the presence of a unique fatty acid (erucic acid) in that type
of oil.
To further evaluate the accuracy and precision of the prediction, simulations were run for the
different blending ratios of the three clusters for each group of oil ranging from 0% to 100%,
with 20% interval. The output of prediction as mean and standard deviation for each
simulated blend is given in Table 2-4. These observations confirmed the accuracy of the
prediction of all the oils. The slope of the regression equation between predicted and actual
percentage of each group of oil in the simulated blend was always one.
The precision of the prediction was not constant for all different simulated blends. It varied as
a function of the blending ratio of the different oils in the simulated blend. Therefore, the
precision of the prediction could not be generalized for all the blending ratios. However, the
developed method has strength of providing the precision of the prediction for each analysis
as it provides the frequency distribution for each prediction as @Risk output as shown in step
6 (Figure 2-1). Based on this output, all the statistical parameters of the prediction (mean,
median, mode, confidence interval etc) can be calculated as per requirement for each
simulation.

37
Table 2-4. Evaluation of the precision and accuracy of the Monte Carlo simulation
method in the prediction of simulated blend of different composition
S.N.
Simulated blend composition Predicted blend composition (mean ± SD)
HEARM oil
%
LEAR oil
%
Soybean oil
% HEARM oil % LEAR oil % Soybean oil %
1. 100 0 0 100.13 ± 5.12 < LOD < LOD
2. 80 20 0 80.09 ± 4.15 19.91 ± 4.15 < LOD
3. 80 0 20 80.11 ± 4.25 < LOD 19.89 ± 4.25
4. 60 40 0 60.05 ± 3.36 39.95 ± 3.36 < LOD
5. 60 20 20 60.07 ± 3.24 20.01 ± 2.89 19.92 ± 3.68
6. 60 0 40 60.08 ± 3.20 < LOD 39.92 ± 3.20
7. 40 60 0 40.02 ± 2.94 59.98 ± 2.94 < LOD
8. 40 40 20 40.03 ± 2.54 40.06 ± 3.09 19.92 ± 3.14
9. 40 20 40 40.04 ± 2.25 20.00 ± 2.50 39.96 ± 2.91
10. 40 0 60 40.05 ± 2.19 < LOD 59.95 ± 2.19
11. 20 80 0 19.98 ± 3.00 80.02 ± 3.00 < LOD
12. 20 60 20 19.99 ± 2.38 60.10 ± 3.91 19.91 ± 3.28
13. 20 40 40 20.00 ± 1.81 40.05 ± 2.99 39.95 ± 2.72
14. 20 20 60 20.01 ± 1.38 20.00 ± 2.57 59.99 ± 2.66
15. 20 0 80 20.03 ± 1.29 < LOD 79.97 ± 1.29
16. 0 100 0 < LOD 100.06 ± 3.54 < LOD
17. 0 80 20 < LOD 80.10 ± 4.32 19.90 ± 4.32
18. 0 60 40 < LOD 60.06 ± 3.49 39.94 ± 3.49
19. 0 40 60 < LOD 40.02 ± 3.00 59.98 ± 3.00
20. 0 20 80 < LOD 19.98 ± 3.03 80.02 ± 3.03
21. 0 0 100 < LOD < LOD 100.06 ± 3.54
2.3.4 Application of the Monte Carlo simulation method in the Nepalese samples (step
10 of Figure 2-1)
The fatty acid composition of the forty-nine oil samples collected from the Nepalese market
is given in Table 2-5. These data were obtained by laboratory analysis and applied in the
developed Monte Carlo simulation method (step 6 of Figure 2-1) for the prediction of blend
composition. One example of the @Risk output (for Nepalese sample NS6) is shown in
Figure 2-4 as an illustration. The predicted percentage for each type of oil is shown with its
distribution (Figure 2-4A). The scatter plot between predicted percentage of HEARM oil and
LEAR oil shows the elliptical prediction region for that sample (Figure 2-4B).

38
Table 2-5. Analyzed fatty acid composition and tocopherol content of samples collected from the Nepalese market with predicted blend
composition based on the proposed Monte Carlo simulations method
Samples
fatty acid composition (g/100 g total fatty acid) tocopherol content (µg/g oil)a % predicted blend composition (99.7%
confidence interval)
16:0 16:1 18:0 18:1 18:2 18:3 20:0 20:1 22:0 22:1 24:0 other α-
tocopherol
γ-
tocopherol
δ-
tocopherol HEARM oilb LEAR oilb Soybean oilb
NS1 8.4 0.1 3.6 37.5 40.2 6.4 0.5 1.0 0.4 1.0 0.0 0.8 168.1 ± 1.8 514.5 ± 1.7 141.3 ± 0.4 < LOD 26.2-37.9 62.1-73.9
NS2 4.1 0.2 1.8 46.0 18.4 8.0 0.7 2.4 0.5 16.1 0.2 1.7 216.1 ± 0.8 331.3 ± 1.7 20.7 ± 0.8 24.8 - 36.7 64.1-74.5 < LOD
NS3 4.3 0.2 1.8 59.3 18.2 7.8 0.6 2.0 0.4 5.0 0.0 0.5 193.5 ± 0.9 370.9 ± 1.0 15.0 ± 0.7 1.6 - 14.1 86.4 - 97.6 < LOD
NS4 4.4 0.2 2.0 43.0 19.8 8.1 0.7 2.9 0.5 16.5 0.2 1.7 188.3 ± 1.4 331.2 ± 2.6 32.2 ± 0.4 28.1 - 39.4 50.1 - 65.4 1.8-16.1
NS5 9.4 0.1 4.3 28.4 44.8 6.3 0.5 1.2 0.4 2.2 0.0 2.5 141.8 ± 1.0 535.0 ± 2.7 188.4 ± 1.6 5.2 - 9.0 4.0 - 15.3 77.5 - 89.8
NS6 7.3 0.2 3.3 34.5 35.4 7.9 0.6 1.3 0.4 8.2 0.0 0.9 179.0 ± 1.7 495.6 ± 10.1 118.4 ± 2.4 12.7 - 18.7 24.2 - 35.2 49.6 - 60.3
NS7 8.7 0.1 3.7 29.9 41.9 8.0 0.5 1.0 0.4 5.0 0.0 0.8 140.3 ± 0.4 543.7 ± 1.1 182.8 ± 1.1 8.53-12.9 11.48-22.2 67.3 - 78.6
NS8 2.3 0.2 1.1 12.3 13.6 10.5 0.9 6.8 1.0 47.3 0.2 3.9 173.8 ± 0.8 354.3 ± 1.3 12.5 ± 0.6 >94.7 < LOD < LOD
NS9 3.4 0.2 1.5 41.4 15.9 9.1 0.8 3.0 0.6 21.9 0.2 2.0 189.1 ± 0.2 320.1 ± 0.9 13.6 ± 0.1 37.5 - 50.1 49.9 - 62.5 < LOD
NS10 5.1 0.2 2.2 52.9 21.9 7.3 0.6 2.7 0.3 6.4 0.0 0.3 225.5 ± 1.1 408.4 ± 2.8 39.6 ± 0.4 8.2 - 18.9 65.7 - 83.8 4.2 - 19.5
NS11 9.5 0.1 4.1 28.5 41.8 5.7 0.5 1.3 0.3 2.5 0.0 5.8 103.4 ± 1.0 439.7 ± 2.4 141.35 ± 1.1 7.5 - 11.6 7.7 - 18.6 72.0 - 83.7
NS12 7.9 0.1 3.4 25.7 38.2 7.4 0.5 2.4 0.5 11.9 0.0 2.1 128.1 ± 1.2 455.9 ± 5.3 131.73 ± 1.8 24.3 - 31.1 4.0 – 14.1 58.0 – 69.7
NS13 10.2 0.1 4.4 25.3 49.1 6.3 0.4 1.0 0.4 1.4 0.0 1.5 112.5 ± 0.7 500.3 ± 1.9 191.7 ± 0.8 3.1 - 6.8 < LOD 93.2 – 97.0
NS14 2.4 0.2 1.3 12.5 14.4 10.1 1.0 6.3 1.0 46.4 0.3 4.1 129.8 ± 5.2 308.8 ± 10.2 9.9 ± 0.9 > 91.7 < LOD < LOD
NS15 5.0 0.2 2.2 38.9 23.2 7.1 0.7 2.7 0.5 17.0 0.0 2.6 196.2 ± 0.5 377.9 ± 1.3 44.6 ± 0.1 29.2 - 39.5 39.3 - 52.4 13.6 – 26.8
NS16 3.7 0.2 1.6 46.7 16.8 7.8 0.7 2.9 0.5 17.7 0.0 1.4 223.3 ± 3.2 359.7 ± 5.5 13.8 ± 0.4 28.1 - 40.4 59.6 - 71.9 < LOD
NS17 2.4 0.2 1.3 12.9 14.6 9.9 1.0 6.5 1.0 46.0 0.3 4.0 142.9 ± 1.0 295.8 ± 2.4 10.1 ± 0.6 > 91.5 < LOD < LOD
NS18 10.3 0.0 4.6 24.2 50.8 7.5 0.4 0.5 0.4 1.2 0.0 0.2 83.8 ± 1.9 485.7 ± 5.2 223.0 ± 1.9 0.9 - 4.6 < LOD 95.4 – 99.1
NS19 9.3 0.1 3.8 34.4 44.1 7.4 0.4 0.4 0.0 0.0 0.0 0.1 113.5 ± 1.6 510.6 ± 1.7 181.5 ± 0.7 < LOD 16.3 - 28.0 72.0 – 83.7
NS20 10.4 0.1 4.8 24.6 50.8 6.9 0.4 0.5 0.4 0.6 0.0 0.5 123.7 ± 1.6 547.0 ± 6.0 198.3 ± 2.4 < LOD < LOD > 96.5
NS21 2.2 0.1 1.1 16.3 13.9 10.6 0.9 5.1 0.9 44.3 0.4 4.3 129.4 ± 0.8 360.9 ± 6.0 15.8 ± 0.4 > 84.5 < LOD < LOD
NS22 3.2 0.2 1.4 37.8 15.9 8.0 0.7 3.1 0.6 27.5 0.0 1.6 193.5 ± 0.4 304.7 ± 1.1 15.6 ± 0.3 45.8 - 59.2 40.8 - 54.2 < LOD

39
NS23 1.8 0.1 1.2 15.1 13.1 9.0 1.0 4.6 0.9 49.2 0.3 3.8 132.7 ± 0.4 226.2 ± 1.1 16.4 ± 0.1 > 88.9 < LOD < LOD
NS24 4.5 0.2 2.0 37.6 21.6 7.6 0.7 3.3 0.5 19.7 0.0 2.3 196.2 ± 0.1 370.2 ± 0.7 29.4 ± 0.2 35.6 - 47.1 37.7 - 50.8 7.8 - 21.6
NS25 3.1 0.2 1.5 35.7 15.8 8.8 0.8 3.7 0.7 28.4 0.0 1.3 120.9 ± 0.9 291.4 ± 0.2 16.2 ± 0.1 50.0 - 64.1 35.9 - 50.0 < LOD
NS26 2.8 0.2 1.3 27.9 15.4 9.5 0.9 4.4 0.7 35.0 0.0 2.0 158.3 ± 1.1 307.4 ± 1.5 14.2 ± 0.2 64.1 - 80.3 19.7 - 35.9 < LOD
NS27 3.1 0.2 1.5 35.3 16.1 8.4 0.8 3.1 0.6 29.4 0.0 1.5 189.7 ± 2.7 298.7 ± 1.2 17.3 ± 1.0 49.21 - 63.2 36.77 - 50.8 < LOD
NS28 4.2 0.2 1.9 62.1 18.7 8.6 0.6 1.3 0.3 2.2 0.0 0.0 178.8 ± 1.3 400.1 ± 3.5 13.1 ± 1.2 < LOD > 92.8 < LOD
NS29 3.8 0.2 1.6 45.9 17.2 8.0 0.7 3.0 0.5 18.1 0.0 1.0 254.4 ± 1.5 347.0 ± 3.3 16.8 ± 2.9 29.4 - 41.6 58.4 - 70.7 < LOD
NS30 4.7 0.2 1.8 61.1 19.3 7.3 0.6 1.9 0.3 2.9 0.0 0.0 265.1 ± 1.7 403.1 ± 2.0 14.7 ± 0.5 < LOD > 90.6 < LOD
NS31 7.8 0.2 3.3 38.1 36.9 7.5 0.5 1.5 0.3 4.1 0.0 0.0 190.7 ± 1.6 570.4 ± 5.0 145.2 ± 1.2 5.4 - 11.0 28.9 - 40.6 51.8 - 63.0
NS32 9.7 0.1 4.0 30.9 43.6 5.4 0.4 1.4 0.4 1.0 0.0 3.1 27.8 ± 0.1 311.2 ± 1.8 168.3 ± 4.8 3.4 - 7.3 8.7 - 19.9 74.9 - 86.9
NS33 3.3 0.2 1.6 38.6 16.1 8.5 0.8 3.3 0.6 25.9 0.0 1.2 221.2 ± 2.0 312.1 ± 2.9 22.2 ± 0.3 43.91 - 57.3 42.7 - 56.1 < LOD
NS34 9.4 0.1 4.3 24.6 45.2 5.9 0.4 1.6 0.3 6.1 0.0 1.9 139.8 ± 1.5 500.1 ± 1.6 161.1 ± 0.7 12.3 - 16.9 < LOD 83.1 - 87.8
NS35 8.9 0.1 3.8 21.6 43.5 7.0 0.5 1.6 0.5 10.0 0.2 2.2 90.1 ± 0.8 516.0 ± 5.3 157.5 ± 0.4 19.8 - 25.8 < LOD 74.2 - 80.2
NS36 6.3 0.2 2.6 41.4 27.1 7.0 0.6 2.1 0.4 9.0 0.0 3.4 180.9 ± 0.2 391.7 ± 4.2 75.7 ± 1.7 15.2 - 23.5 42.8 - 56.0 25.7 - 37.5
NS37 3.7 0.2 1.6 45.2 17.4 9.0 0.7 2.6 0.5 17.4 0.1 1.7 201.5 ± 1.0 397.3 ± 3.7 11.6 ± 0.3 28.2 - 40.2 59.8 - 71.8 < LOD
NS38 1.9 0.1 1.0 9.6 14.1 13.2 0.8 4.8 1.1 48.1 0.4 4.9 40.0 ± 0.5 436.2 ± 4.2 12.5 ± 5.0 > 92.4 < LOD < LOD
NS39 7.2 0.2 3.1 34.9 34.9 8.6 0.5 1.4 0.4 6.6 0.0 2.3 115.8 ± 1.0 446.5 ± 3.7 97.3 ± 1.0 12.0 - 18.3 28.7 - 40.1 45.4 - 56.3
NS40 5.9 0.2 2.6 47.3 26.2 6.6 0.6 1.8 0.3 6.2 0.0 2.2 230.5 ± 0.6 364.2 ± 0.9 40.3 ± 0.2 7.6 - 16.4 53.5 - 68.7 20.4 - 33.6
NS41 9.3 0.1 4.3 26.0 49.9 6.1 0.4 0.6 0.4 1.3 0.0 1.7 176.7 ± 2.2 446.7 ± 4.9 167.8 ± 2.5 1.7 - 5.3 < LOD 94.7 - 98.3
NS42 6.2 0.1 2.8 17.4 31.5 8.6 0.6 3.5 0.6 26.6 0.0 2.0 92.2 ± 0.2 386.6 ± 4.4 103.2 ± 1.8 50.6 - 63.5 < LOD 36.5 - 49.4
NS43 2.0 0.2 1.2 17.9 13.4 9.0 0.9 4.5 0.8 47.1 0.2 2.8 167.3 ± 7.1 249.3 ± 5.8 27.4 ± 2.3 > 84.3 < LOD < LOD
NS44 2.2 0.2 1.3 21.1 13.8 8.9 0.9 4.2 0.9 44.1 0.2 2.3 174.7 ± 4.4 246.0 ± 0.7 17.0 ± 1.8 77.5 - 96.5 3.5 - 22.5 < LOD
NS45 9.4 0.1 4.3 30.5 40.5 3.7 0.5 1.7 0.3 2.0 0.0 6.9 136.4 ± 1.4 444.9 ± 3.1 115.3 ± 1.2 7.5 - 11.7 8.8 - 19.7 70.9 - 82.5
NS46 9.7 0.1 4.2 30.1 46.6 6.7 0.4 0.5 0.3 0.0 0.0 1.3 126.2 ± 2.1 544.0 ± 12.7 202.3 ± 4.8 < LOD 6.8 - 19.0 81.0 - 93.3
NS47 6.1 0.2 2.9 34.2 29.5 7.5 0.6 2.0 0.5 14.7 0.1 1.8 183.5 ± 1.2 419.1 ± 1.8 95.7 ± 5.3 24.8 - 33.1 26.6 - 37.6 33.8 - 45.3
NS48 3.0 0.2 1.4 36.4 15.5 8.8 0.8 3.1 0.6 28.3 0.1 1.7 198.2 ± 0.2 296.1 ± 0.6 28.5 ± 1.1 47.8 - 61.7 38.3 - 52.1 < LOD
NS49 10.7 0.1 4.5 23.3 48.0 4.8 0.4 1.4 0.4 1.7 0.0 4.6 22.6 ± 0.4 255.4 ± 0.6 148.9 ± 0.6 6.5 - 10.5 < LOD 89.5 - 93.5
a ± 95% confidence interval of mean,
b LOD, limit of detection (with 99.7% confidence)

40
Figure 2-4. Predicted probability density distribution of HEARM, LEAR and soybean oil (in percentage) (A) and scatter plot between
predicted percentage of LEAR oil and predicted percentage of HEARM oil (B) for Nepalese sample NS6 using @Risk software (based
on 100,000 simulations)
Pro
bab
ilit
y
A B
Predicted % of HEARM, LEAR and soybean oil
Percentage of data
falling in this region
Mean of predicted LEAR oil %
Mea
n o
f pre
dic
ted H
EA
RM
oil
%

41
The blend predictions (with 99.7% interval) for all the samples are given in Table 2-5. Out of
forty-nine samples, only seven samples (NS8, NS14, NS17, NS21, NS23, NS38 and NS43)
were found to be pure HEARM oil and two samples (NS28 and NS30) were found to be pure
LEAR oil. Furthermore, thirteen samples (NS2, NS3, NS9, NS16, NS22, NS25, NS26, NS27,
NS29, NS33, NS37, NS44 and NS48) were blends of HEARM and LEAR oil, seven samples
(NS13, NS18, NS34, NS35, NS41, NS42 and NS49) were blends of HEARM and soybean oil,
three samples (NS1, NS19 and NS46) were blends of LEAR and soybean oil and the sixteen
samples (NS4, NS5, NS6, NS7, NS10, NS11, NS12, NS15, NS24, NS31, NS32, NS36, NS39,
NS40, NS45 and NS47) were blends of HEARM, LEAR and soybean oil in the different
proportions (Table 2-5). Moreover, one oil sample (NS20) was in fact pure soybean oil being
sold in the market as mustard seed oil.
These results clearly demonstrated that blending of HEARM oil to LEAR oil is becoming a
very common practice in Nepal. There were 60% of the oil samples containing both of these
oils in different proportions. The undeodorized HEARM oil is very pungent and is favored
for its taste by local consumers. The pure LEAR oil is far less pungent and hence could not
compete in the local market. Therefore, manufacturers seemed to add some HEARM oil in
the LEAR oil to increase its sensorial properties. None of those samples however, had
mentioned in the label that they were in fact blended oils. Although, both HEARM oil and
LEAR oil have a similar market price in Nepal, hiding the information about oil blending and
positioning the product as either of any oil is clearly a misbranding. Such blended oil should
be allowed only after clear indication of being blended oil in a given particular ratio.
Moreover, government must control the quality of such blended product once it reaches to the
market. The developed method could find a very important application in that perspective.
On the other hand, adulteration with cheap soybean oil is clearly an intentional fraudulent
activity for financial reasons. The soybean oil, being one of the cheapest oil in the local
market, has become a common adulterant. There were 55% of the oil samples containing
soybean oil in different proportions. To further confirm the prediction of adulteration with
soybean oil, the tocopherol content of all samples were also evaluated (Table 2-5). The α and
γ-tocopherol are comparable in all the three groups of oil, while the δ-tocopherol content of
soybean oil (275 µg/g) is around 15 to 30 times higher than the HEARM (around 16 µg/g)
(Vaidya and Choe, 2011) and LEAR oil (around 8 µg/g) (Przybylski et al., 2005). The δ-

42
tocopherol ratio on total tocopherol content in soybean oil is around 0.24, while that in the
HEARM and LEAR is around 0.02 (Hammond, Johnson, Su, Wang, & White, 2005;
Przybylski et al., 2005). Therefore, the adulteration of soybean oil in HEARM and LEAR oil
should increase both the δ-tocopherol content and its ratio on total tocopherol content.
Since the predicted distribution of the soybean oil was not always symmetric, the median
value was selected rather than the mean value as a measure of central tendency. The δ-
tocopherol content had a linear relationship with the median value of the predicted percentage
of soybean oil in the different samples (R2 = 0.9598) (Figure 2-5). The δ-tocopherol content
of all the oil samples were within the range that could be expected by blending the soybean
oil (containing δ-tocopherol in the range of 150 to 250 µg/g oil) with mustard/rapeseed oil
(containing δ-tocopherol in the range of 0 to 20 µg/g oil). Similarly, the δ-tocopherol ratio on
total tocopherol content also had linear relationship with the median value of predicted % of
soybean oil in the different samples (R2 = 0.913). Three samples showed even higher δ-
tocopherol ratio on total tocopherol than in the pure soybean oil (0.25). Those samples were
NS18 (0.28), NS32 (0.33) and NS49 (0.35). The analysis of peroxide value (PV) of these
samples revealed that they were oxidized samples (PV of 48.56, 29.73 and 87.71 meq
oxygen/kg fat for NS18, NS32 and NS49, respectively). α-Tocopherol is more sensitive to
oxidation compared to δ-tocopherol (Choe & Min, 2006), thus it degrades faster than δ-
tocopherol during storage. The higher loss of α-tocopherol compared to δ-tocopherol during
oil oxidation could explain the relatively higher percentage of δ-tocopherol in those samples.
The trans fatty acid content can also be an indicator for the adulteration of the crude HEARM
of LEAR oil with refined oil. The oil from HEARM and LEAR varieties are obtained by cold
screw pressing either from roasted or unroasted seed. The crude oil is consumed without
refining. Hence, the trans fatty acid content in pure HEARM and LEAR seed oil and their
blends would be very low. However, the E/Z isomerization occurs during refining of
vegetable oil (Tasan & Demirci, 2003). Therefore, adulteration with refined soybean oil can
contaminate the crude HEARM and LEAR oil with trans fatty acids. Two E/Z isomers of
linoleic acid (Z,E)-9,12-octadecadienoic acid and (E,Z)-9,12-octadecadienoic acid) were
investigated in the Nepalese samples. In the samples predicted not to have soybean oil
adulteration, the amount of each of those isomers was below 0.1%. On the other hand, a wide
variability was observed in soybean oil adulterated samples. Some samples (NS10, NS18,

43
NS19 and NS31) contained low amount of each of those isomers (below 0.1%), while the rest
of the samples contained 0.2 to 2.1% of each of them. Therefore, the absence of trans isomers
could not guarantee the absence of adulteration, however, the presence of trans isomers could
be an additional qualitative indicator for the adulteration of crude HEARM and LEAR oil
with refined oil and therefore supports further the suitability of the developed method.
Figure 2-5. The δ-tocopherol content (μg/g oil) of different Nepalese samples is plotted
against the median value of predicted percentage of soybean oil (error bar represents
99.7% prediction interval). The dotted lines represents the expected range of the δ-
tocopherol content of the blended oil by the addition of soybean oil containing δ-
tocopherol in the range of 150 to 250 μg/g oil.
y = 1.8524x + 14.539R² = 0.9598
0
50
100
150
200
250
0 20 40 60 80 100
δ-t
oco
ph
ero
l co
nte
nt
(µg/
g o
il)
predicted percentage of soybean oil in different samples

44
2.4 CONCLUSIONS
This study highlighted the widespread existence of intentional blending of HEARM oil,
LEAR oil and soybean oil in the Nepalese market. Out of all the mustard/rapeseed labeled
samples studied, 14% were pure HEARM oil, 4% were pure LEAR oil, 27% were blends of
HEARM and LEAR oil, 14% were blends of HEARM and soybean oil, 6% were blends of
LEAR and soybean oil and 33% were blends of HEARM, LEAR and soybean oil. Among
them, seventeen samples contained more than 40% soybean oil and some samples contained
even more than 90% of soybean oil. The limits of detections (LODs) of soybean oil in
HEARM oil and LEAR oil were 14% and 13%, respectively. The LODs of LEAR oil in
HEARM oil and soybean oil were 11 and 9%, respectively. Similarly, the LODs of HEARM
oil in LEAR oil and soybean oil were 9% and 3%, respectively. This observation clearly
justified the requirement of an appropriate method for the control of such a fraudulent activity.
The developed Monte Carlo simulation method is simple and based on a single set of analysis
of fatty acid composition of the suspected blended oil sample, which is the main advantage of
this method. This method has been developed based on the universal mass balance principle.
Therefore, the concept is not limited to the blend of HEARM, LEAR and soybean oil, but can
be extended further in different kinds of compositional analysis.

45
CHAPTER
3
ISOLATION AND IDENTIFICATION OF A POTENT RADICAL
SCAVENGER (CANOLOL) FROM ROASTED MUSTARD SEED
OIL FROM NEPAL AND ITS FORMATION DURING ROASTING

46
Relevant publications:
Shrestha, K., Stevens, C. V., & De Meulenaer, B. (2012). Isolation and identification of a
potent radical scavenger (canolol) from roasted high erucic mustard seed oil from Nepal and
its formation during roasting. Journal of Agricultural and Food Chemistry, 60, 7506-7512.
Oral presentations:
10th Euro Fed Lipid Congress on Fats, Oils and Lipids: from Science and Technology to
Health, 23-26 September 2012, Cracow, Poland
246th ACS National Meeting & Exposition, September 8-12, 2013, Indianapolis, Indiana,
USA

47
ABSTRACT
Roasting of mustard seed has been reported to give a typical flavor and increase of the
oxidative stability of the extracted oil. A potent radical scavenging compound was
successfully isolated from roasted mustard seed oil in a single-step chromatographic
separation using an amino solid-phase extraction column. Nuclear magnetic resonance and
mass spectrometry spectra revealed the compound as 2,6-dimethoxy-4-vinylphenol (generally
known as canolol), and its identity was fully confirmed by chemical synthesis. The formation
of canolol during roasting was compared among mustard varieties (Brassica juncea, B.
juncea var. oriental, Brassica nigra, and Sinapis alba) together with a low erucic rapeseed
variety. Mustard varieties were shown to produce less than one-third of canolol compared to
rapeseed at similar roasting conditions. This observation was linked to a lower free sinapic
acid content together with a lower loss of sinapic acid derivatives in the mustard varieties
compared to rapeseed. Around 50% of the canolol formed in the roasted seed was found to be
extracted in the oil. Roasting of mustard seed before oil extraction was observed to be a
beneficial step to obtain canolol-enriched oil, which could improve the oxidative stability.
Keywords: 2,6-dimethoxy-4-vinylphenol (canolol), Brassica juncea, Brassica juncea var.
oriental, Brassica nigra, Sinapis alba, mustard seed, rapeseed, antioxidant, roasting, sinapic
acid

48
3.1 INTRODUCTION
Mustard seeds are generally roasted before oil extraction for its typical flavor (Vaidya &
Choe, 2011a). Recent studies have demonstrated an increase in the oxidative stability of oil
upon seed roasting. The stability of tocopherol and lutein was also higher in the roasted seed
oil during storage (Vaidya & Choe, 2011b; Vaidya & Choe, 2011a). These authors
hypothesized the formation of antioxidative compounds during roasting via Maillard
reactions. A small increase in tocopherol content (around 40 µg/g oil) upon seed roasting was
also reported in that experiment. Since the increase in tocopherol content was small and the
suggested Maillard reactions were not clearly demonstrated, the compounds responsible for
the increase in oxidative stability of mustard seed oil still remain unclear (Vaidya & Choe,
2011a). Similar roasting conditions are reported to have no effect on the tocopherol content
during rapeseed roasting (Wakamatsu et al., 2005). Roasting has multiple consequences and
the increased oil stability can be due to their overall effect. Additionally, several studies have
shown a positive effect of seed roasting on oil stability by the formation of different radical
scavengers. Roasting of sesame seed results in the production of sesamols, which leads to the
increased oil stability (Kumazawa, Koike, Usui, Nakayama, & Fukuda, 2003). Canolol (2,6-
dimethoxy-4-vinylphenol) is formed by the decarboxylation of sinapic acid during rapeseed
roasting (Wakamatsu et al., 2005; Spielmeyer, Wagner, & Jahreis, 2009; Koski et al., 2003).
Canolol formation has been shown to improve the oxidative stability of roasted rapeseed oil
(Koski et al., 2003).
The possible formation of such radical scavengers in roasted mustard seed oil remains to be
investigated. Therefore, the objective of the current study was to isolate and identify a major
radical scavenging compound from roasted mustard seed oil (apart from those occurring in
unroasted seed oil) and to compare its formation during roasting among different mustard and
rapeseed varieties.
3.2 MATERIALS AND METHODS
3.2.1 Materials
Roasted mustard seed oil samples were collected from the Nepalese market. The samples
were stored under refrigerated conditions (below −18 °C) until analysis. Mustard varieties (B.
juncea, B. juncea var. oriental, Brassica nigra, and Sinapis alba) and low erucic rapeseed

49
were collected from the local market in Belgium. Thin-layer chromatography (TLC) plates
(Silicagel 60) were obtained from Merck (Darmstadt, Germany). The tocopherol standard
was obtained from DSM (Parsippany, NJ). The aminopropyl solid-phase extraction (SPE)
column (Extract Clean, 500 mg, 4 mL) was purchased from Grace (Lokeren, Belgium).
Syringaldehyde and sinapic acid were purchased from Sigma Aldrich (Steinheim, Germany).
Other reagents and solvents were of analytical grade and obtained from reliable commercial
sources.
3.2.2 TLC analysis
The oil sample was dissolved in hexane and applied on a TLC plate (Silica gel 60, Merck,
Germany). A mixed tocopherol standard solution (containing α-, β-, γ-, and δ-tocopherol) was
also spotted. The plate was developed with hexane/diethyl ether/acetic acid (80:30:1, v/v/v).
Afterward, it was sprayed uniformly with 0.1 mM 2,2-diphenyl-1-picrylhydrazyl (DPPH)
solution in hexane to give a slightly pink background and held for 5 min. The radical
scavengers appeared as white spots on the pink background.
3.2.3 Isolation and purification of the compound of interest
Roasted mustard seed oil (1 g) was dissolved in 2 mL of hexane and extracted 3 times with 2
mL of methanol. On the basis of TLC analysis, the compound of interest (Rf = 0.15) was
found to be in the methanol fraction. Therefore, the methanol fraction was dried under
reduced pressure, and the residue was dissolved in 5 mL of 0.9% isopropanol in hexane (v/v).
This solution (0.5 mL) was brought on an aminopropyl SPE column (preconditioned with the
same solvent mixture). The SPE column was eluted with the same solvent mixture, and the
first 6 mL was discarded. Afterward, 12 fractions of each of 4 mL were collected. Finally, the
column was eluted with 5% isopropanol in hexane (v/v), and three more fractions (each of 4
mL) were also collected (fractions 13−15). The compound of interest was observed in the
fractions 1−5, via TLC analysis. These fractions were combined and dried under nitrogen.
The procedure was repeated to obtain around 5 mg of white dry compound. The purity of this
compound was confirmed by TLC and high-performance liquid chromatography (HPLC)
analysis.

50
3.2.4 Identification of the isolated compound by spectroscopic measurements
The identification of the isolated compound was carried out on the basis of nuclear magnetic
resonance (NMR), mass spectrometry (MS), and ultraviolet−visible (UV−vis) spectroscopic
measurements.
3.2.4.1 NMR spectroscopy
The purified compound was dissolved in deuterated chloroform. The proton (1H) and carbon
(13
C) NMR spectra were taken using a Jeol EX300 Eclipse NMR (300 MHz)
spectrophotometer (Japan).
3.2.4.2 Liquid chromatography−mass spectrometry (LC−MS)
The LC−MS analysis was carried out using UltiMate 3000 ultrahigh-pressure liquid
chromatography (UHPLC, Dionex) equipped with a degasser, four solvent delivery modules,
an autosampler, a column oven, and an UV detector coupled with a MicroTOF MS
instrument (Bruker). The purified compound was dissolved in an isopropanol/water/acetic
acid (90:10:0.1, v/v/v) mixture (10 μg/mL) and then injected on a C8 Zorbax 300 SB column
(Agilent, Santa Clara, CA). Mobile phase A was a water/acetonitrile/acetic acid mixture
(90:10:0.1, v/v/v), and mobile phase B was an acetonitrile/water/ acetic acid mixture
(90:10:0.1, v/v/v). The method was run with 10% mobile phase B for 1 min, then a gradient
was applied to reach 100% of mobile phase B in 11 min, which was held for 5 min.
Afterward, the initial conditions were reached in 0.5 min, and the column was allowed to
equilibrate for 4.5 min before a subsequent analytical run. The solvent flow rate was 0.2
mL/min. Electrospray ionization (ESI) in positive-ion mode was used, and m/z values were
scanned from 50 to 1000. The capillary voltage was set at 4500 V, and the end plate offset
was at −500 V. The nebulizer pressure was 0.5 bar and was heated to 190 °C with dry
nitrogen at a flow rate of 4 mL/min.
3.2.4.3 UV−Vis spectroscopy
The UV and visible absorption spectra were taken in hexane using a Cary 50 UV−vis
spectrophotometer (Varian) in a quartz cuvette.

51
3.2.5 Synthesis of 2,6-dimethoxy-4-vinylphenol (canolol)
The method described for the synthesis of 4-vinylphenols from 4-hydroxysubstituted
benzaldehydes under microwave irradiation was followed (Sinha, Sharma, & Joshi, 2007).
Syringaldehyde was chosen as an appropriate benzaldehyde for the synthesis of 2,6-
dimethoxy-4-vinylphenol. Briefly, 8.4 mmol of syringaldehyde, 32.8 mmol of malonic acid,
32.8 mmol of piperidine and 5 ml of acetic acid was taken in a reaction vessel. The reaction
mixture was heated at 130 oC for 7 min in a CEM Discover microwave system. The vent
valve was left open to allow the release of carbon dioxide formed during the reaction. After
cooling, the reaction mixture was added to 10 ml ice-cold water and extracted three times
with 10 ml ethyl acetate. The organic layer was washed with saturated sodium chloride and
then dried over sodium sulfate. The solvent was evaporated under reduced pressure and the
viscous liquid obtained was separated on a silica gel column using the procedure described in
the same method (Sinha et al., 2007). Crystallization was applied as an additional step to
increase the purity. A saturated solution of the synthesized compound in hexane was prepared
at ambient temperature, and crystallization was induced by storing it inside the freezer
(−28 °C). Crystals (white) were separated from the mother liquor and dried under nitrogen.
The purity of the compound was confirmed by NMR spectroscopy.
3.2.6 HPLC analysis of tocopherol and canolol in oil
Tocopherol and canolol contents of the oil were analyzed on Agilent 1100 series HPLC
equipped with a degasser, four solvent delivery modules, an autosampler, a column oven, and
a fluorescence detector. A mobile phase containing 0.9% isopropanol in hexane (v/v) was
used in isocratic conditions at a flow rate of 1 mL/min. Separation was carried out on a
LiChroCART 250-4,6 Purospher STAR Si (5 μm) column (Merck, Darmstadt, Germany)
with a precolumn containing the same phase. The temperature of the column was maintained
at 35 °C, and the chromatogram was obtained with a fluorescence detector (excitation at 285
nm and emission at 325 nm). The fluorescence emission spectra (310−400 nm) were also
obtained at a 285 nm excitation wavelength. Analysis of each sample was carried out in
triplicate. Because the reference canolol compound was not commercially available, the
synthesized canolol was used as the standard for quantification.

52
3.2.7 Roasting of seed and powder samples of mustard and rapeseed and oil extraction
A seed sample (80 g) was added to a heated beaker (250 mL) placed on the oil bath
maintained at 180 °C. Both the heating oil and seed sample were continuously mixed with
electric mechanical stirrers. The temperatures of the heating oil and seed sample were
continuously monitored using Testo thermostat probes. The oil temperature was maintained
at 180 °C, and roasting was carried out for 10 min. The seed temperature reached 162 ±
3.5 °C in 10 min. The seed temperature profile with time followed the equation T = 32.796
ln(t) + 89.422 (R2 = 0.99), where T is the seed temperature (°C) and t is the time (min). The
same setup could not be used for homogeneous mixing of seed powder. Therefore, 4 g of
seed powder was taken in a test tube and roasted in an oil bath maintained at 180 °C. The
thermostat probe was kept in the center of the test tube containing the seed powder, and the
temperature was monitored. After heating for 6 min (holding the oil bath temperature
constant at 180 °C), the seed powder temperature reached 160 °C with the temperature profile
represented by equation T = 36.578 ln(t) + 96.097 (R2 = 0.99), where T is the seed powder
temperature in the center (°C) and t is the time (min). During 6−10 min of heating time, the
oil bath temperature was gradually lowered to 172 °C and the seed powder temperature
profile followed the equation T = 15.569 ln(t) + 134 (R2 = 0.97). Roasting of both seed and
powder were carried out in three batches for each variety, and further analyses were
performed independently on each batch.
The oil was extracted 3 times from 30 g of ground sample using 80 mL of petroleum ether.
The sample−solvent mixture was kept in a shaker for 15 min and then centrifuged at 9000g
for 10 min. The supernatant was filtered through a filter paper and evaporated under reduced
pressure at 35 °C. The oil sample was dried overnight under nitrogen and stored in the freezer
(−28 °C) until further analysis.
3.2.8 Analysis of the free sinapic acid (FSA) content
Seed samples were finely ground using a coffee grinder. The seed powder (4 g) was mixed
with 25 mL of methanol/water/acetic acid (70:30:0.2, v/v/v) using an ultra turrax at 10,000
rpm for 2 min. The ultra turrax probe was washed with 20 mL of the same solvent, which was
added to the mixture, and the volume was topped up to 50 mL. After centrifugation at 2800g
for 10 min, the supernatant was filtered through a Millex- LCR filter [0.45 μm

53
polytetrafluoroethylene (PTFE) membrane, Millipore, Ireland]. The filtrate was diluted 4
times with 0.2% acetic acid in water (v/v) before injecting on an UHPLC system.
3.2.9 Analysis of the total sinapic acid content after basic hydrolysis (TSAH)
Alkaline hydrolysis of the esterified phenolic compounds was carried out using a previously
described method, with slight modifications (Engels, Schieber, & Gänzle, 2012). The
supernatant phenolic extract (3 mL) was mixed with 3 mL of distilled water and 1.5 mL of 10
M NaOH. The sample was flushed with nitrogen, covered with aluminum foil, and kept on a
shaker for 4 h at room temperature. Afterward, the pH of the solution was adjusted to 2 using
8 M HCl, and the phenolic compounds were extracted 3 times each with 3 mL of ethyl
acetate. The extracts were combined and dried under nitrogen. The residue was redissolved in
5 mL of methanol, and the volume was topped up to 15 mL with 0.2% acetic acid in water.
The solution was diluted 5 times with methanol/water/acetic acid (20:80:0.2, v/v/v) solvent
mixture before injecting on an UHPLC system.
3.2.10 UHPLC−diode array detector (DAD) analysis for the quantification of sinapic
acid and canolol
The analysis was carried out using UltiMate 3000 UHPLC (Dionex), equipped with a
degasser, four solvent delivery modules, an autosampler, a column oven, and a DAD. The
separation was carried out using a 2.1 × 150 mm, 1.8 μm, Zorbax Eclipse Plus C18 column
(Agilent, Santa Clara, CA) maintained at 30 °C. The injection volume was 10 μL, and the
compounds were eluted with 0.2% acetic acid in water (v/v) (mobile phase A) and 100%
methanol (mobile phase B) at a flow rate of 0.3 mL/min. The gradient program was as
follows: 20−40% B (5 min), 40% B (1 min), 40−50% B (1 min), 50% B (1 min), 50−60% B
(5 min), 60−70% B (2 min), 70% B (1 min), 70−20% B (1 min), and 20% B (5 min). The
chromatograms were recorded at 330 and 280 nm wavelengths. The sinapic acid and canolol
contents were quantified on the basis of the calibration curves using a chromatogram at 330
and 280 nm, respectively. All of the analyses were carried out in triplicates.
3.2.11 Statistical analysis
All data are presented as mean values ± 95% confidence interval of the mean based on three
independent experiments. Data were transformed into a logarithmic scale before statistical

54
analyses to have homoscedasticity. Analysis of variance (ANOVA) and post-hoc Tukey test
were performed using TIBCO Spotfire S+ 8.1 software. The significance level is p < 0.05,
unless otherwise indicated.
3.3 RESULTS AND DISCUSSION
3.3.1 Isolation and identification of a potent radical scavenger from roasted mustard
seed oil obtained from the Nepalese market
The qualitative identification of the different tocopherols present in roasted mustard seed oil
was carried out using normal-phase HPLC analysis (α-, β-, γ- and δ-tocopherols are eluted
sequentially in such chromatography). The α-, γ-, and δ-tocopherols were identified in
roasted mustard seed oil comparing the retention time and fluorescence spectra of the
tocopherol standard. One small peak eluting before β-tocopherol position and another peak
eluting after δ-tocopherol were additionally observed in the chromatogram (Figure 3-1).
Figure 3-1. Normal-phase HPLC chromatogram of (A) roasted mustard seed oil, (B)
flax seed oil, and (C) isolated compound of interest, using a fluorescence detector
(excitation at 285 nm and emission at 325 nm). The time axis is in minutes.
Both peaks showed similar fluorescence spectra as tocopherol. However, both of them were
found not to be any tocotrienols based on known standards. These peaks were observed in a
number of mustard seed oil samples analyzed on HPLC. After the injection of linseed oil,
which contains plastochromanol-8 (Przybylski et al., 2005), the small peak observed before
α-tocopherol
plastochromanol-8
γ-tocopherol
δ-tocopherol
compound
of interest
C
B
A

55
the β-tocopherol position was identified to be plastochromanol-8. The major peak was more
polar than all of the tocopherols and also showed a slight tailing (Figure 3-1).
The oil sample was subjected to a separation on silica using TLC. Radical scavenging
compounds were detected simply by spraying a DPPH solution on the TLC plate after
development. Tocopherols were eluted at the Rf value of 0.3−0.5. Another radical scavenging
spot was observed at an Rf value of 0.15, which was isolated from the TLC plate and injected
on HPLC. It was proven that the isolated compound had the same elution behavior as that of
the unknown compound eluting at 14 min, as shown in Figure 3-1.
Using an aminopropyl SPE column, the compound of interest was purified by washing the
column with 6 mL of 0.9% isopropanol in hexane (v/v) and then eluting the compound with
20 mL of the same solvent mixture. The UV absorption spectra of the isolated compound
showed peaks at 222 and 272 nm in hexane.
The mass spectrum of the compound of interest showed the positive ions with m/z values
(relative intensity) of 181.08 (100), 149.06 (32), 203.06 (15), 121.06 (11), 166.06 (3), and
103.05 (2) (Figure 3-2, Figure 3-3). The NMR chemical shifts of the compound of interest
are given in Table 3-1 (NMR spectra are given in Appendix Figure 8-1). The compound of
interest was identified as 2,6-dimethoxy-4-vinylphenol (canolol), and the fragmentation
pattern completely supported the proposed structure (Figure 3-4).
Figure 3-2. LC-TOF Mass spectrum of canolol in the positive mode.
121.0618
149.0564
166.0589
181.0829
203.0643
C10H13O3
+MS, 7.5-7.7min #(450-461), -Spectral Bkgrnd
0
25
50
75
100
125
Intens.
[%]
80 100 120 140 160 180 200 m/z

56
Figure 3-3. Isotopic mass distribution of the molecular ion of canolol compared with the
theoretical isotopic mass distribution of compound with molecular formula C10H13O3.
Table 3-1. NMR chemical shifts of the isolated compound of interest
Position 1H δ (ppm)
13C δ (ppm) molecular structure
1 - 129.28
OO
HH
H
OH
12
3
4
5
6
7
8a
8b
2,6 6.65 (2H, s) 103.08
3,5 - 136.92
4 5.54 (1H, s) 134.87
7 6.62 (1H, dd)
J7, 8b = 17.1 Hz
J7, 8a = 11.0 Hz
147.15
8a 5.15 (1H, dd)
J7, 8a = 11.0 Hz
J8b, 8a = 1.1 Hz
8b 5.61 (1H, dd)
J7, 8b = 17.1 Hz
J8b, 8a = 1.1 Hz
111.95
OCH3 3.91 (6H, s) 56.35
181.0829
182.0857
C10H13O3 +MS, 7.5-7.7min #(450-461), -Spectral Bkgrnd
181.0859
182.0893
C 10 H 13 O 3 ,181.09
0
25
50
75
100
Intens.
[%]
0
20
40
60
80
100
[%]
181.0 181.5 182.0 182.5 183.0 183.5 m/z

57
OH
O
O
OH2
+
O
O
OH2
+
O
O
C
OH
O
OH2
+C
OH
O
O
Na+
m/z 203.06
m/z 181.08
m/z 166.06
m/z 149.06
m/z 121.06 m/z 103.05
+ Na+
+ H+
- 2(CH2O)
- CH3O-
- CH3OH
- H2O
CH3 OH- -
+
+
Figure 3-4. Possible fragmentation pattern and formation of positive ions from canolol
as detected in the MS spectra.
The final confirmation of the identity of the isolated compound of interest was performed by
synthesizing 2,6- dimethoxy-4-vinylphenol from syringaldehyde using Knoevenagel-
Doebner-Sinha protocol proposed by Sinha et al. 2007 (Figure 3-5). The condensation
reaction between syringaldehyde and malonic acid was carried out in the presence of
piperidine and acetic acid. Under microwave heating condition, a simultaneous condensation
and two step decarboxylation is known to occur resulting into the formation of 2,6-
dimethoxy-4-vinylphenol. The synthesized compound was purified via preparative
chromatography on silicagel. The isolated and synthesized compound had similar MS, NMR,
UV, and fluorescence spectra, along with the same retention time in HPLC, and was also in
line with the existing literature data (Harbaum-Piayda et al., 2010; Wakamatsu et al., 2005;
Spielmeyer et al., 2009; Koski et al., 2003). These observations fully confirmed the
identification of the isolated compound.

58
O
CH3
OCH3
OH
O
H
+OH
O
CH3
OCH3
OH
OOH
O
OHO
OH
O
OH
OH
O
CH3
OCH3
OH2
+
OOH
O
OH
O
CH3
OH+
OCH3
OOH
O
OH
O
O
OCH3
CH3
OOH
O
OH
acetic acid / piperidine
Syringaldehyde Malonic acid
Microwave
OH
OH
O
O
CH3
OCH3
O
OH
O
O
CH3
OCH3
CH2
OH
O
CH3
OCH3
Microwave supports polar intermediates
Canolol
- H++ H+
H+
-H2O
- CO2-CO2
Figure 3-5. Synthesis of canolol from syringaldehyde (adapted from (Sinha et al., 2007))
Canolol was previously isolated from roasted rapeseed oil using different techniques. Most of
these methods were long and tedious. The first method consisted of the fractionation of
roasted rapeseed oil on a silica SPE column by eluting with heptane/diethyl ether (90:10, v/v),
followed by separation on a C18 SPE column by eluting with methanol (Koski et al., 2003).
The second isolation method consisted of the extraction with methanol by liquid−liquid
partition, followed by fractionation with silica gel chromatography by sequential elution with
hexane/diethyl ether (9:1, v/v), chloroform, acetone, and methanol. The chloroform fraction
was then separated by preparative TLC, and purification was carried out by HPLC
(Wakamatsu et al., 2005). Another method comprised the extraction of roasted rapeseed with
methanol and separation on an aminopropyl SPE column by sequential elution with
hexane/isopropanol (98.8:1.2, v/v), followed by a mixture in a 95:5 (v/v) ratio. Afterward, the
canolol-rich fraction was collected with isopropanol (Wijesundera et al., 2008). This fraction
contained other polar compounds together with canolol. In a more recent isolation method,
roasted ground rapeseed was extracted with 70% methanol after washing with petroleum
ether to remove the oil. The extract was concentrated and extracted with hexane/isopropanol
(4:1, v/v). Afterward, it was further extracted with a 0.1 M hydrochloric acid solution, and
separation was carried out using SPE (Chromabond HR-P) by eluting with methanol. The
methanol fraction was concentrated and further extracted with hexane. Finally, canolol was
purified using TLC by developing with a hexane/ethyl acetate (7:3, v/v) mixture (Spielmeyer

59
et al., 2009). In comparison to all of these previous isolation procedures, the method
developed in our laboratory could be considered as one of the simplest method currently
available. The developed method was close to the one previously described (Wijesundera et
al., 2008), with the additional benefit of obtaining canolol without eluting other polar
compounds together in the same fraction. Furthermore, this method was also applicable for
the isolation of canolol from roasted rapeseed oil.
3.3.2 Comparison of canolol formation among different varieties of mustard and
rapeseed during roasting
Roasting is generally practiced on either the seed form or the flaked form. To study the effect
of the physical integrity of the seed, canolol formation was studied during both seed roasting
and seed powder roasting. The formation of canolol after roasting could be observed in
Figure 3-6.
Figure 3-6. Reverse-phase UHPLC chromatogram of the 70% methanol extract of the B.
juncea var. oriental variety: (A) unroasted seed measured at 330 nm, (B) after basic
hydrolysis measured at 330 nm, (C) 10 min roasted seed measured at 280 nm, and (D)
unroasted seed measured at 280 nm. The time axis is in minutes.
The amount of canolol formed during roasting of different varieties of mustard seed and seed
powder is shown in Table 3-2. The data on the rapeseed are also presented together for
comparison. Canolol formation was observed in all varieties, during both seed and seed
powder roasting; however, canolol formation was far lower in all of the mustard varieties
A
B
Sinapic acid
C
D
Canolol

60
compared to that in rapeseed. The highest canolol formation during seed roasting among
mustard varieties was observed in B. juncea, followed by B. nigra, B. juncea var. oriental,
and S. alba.
Table 3-2. Changes in FSA, TSAH, and Canolol Contents during Roasting of B. juncea
(BJ), B. juncea var. oriental (BJO), B. nigra (BN), S. alba (SA), and Rapeseed (RS)
Variety
Roasting condition FSA (µg/g DM)
TSAH (mg/g DM)
Canolol (µg/g DM)
BJ unroasted 26.55 ± 1.86ab 8.41 ± 0.58g 10.83 ± 0.11a
BJ seed roasted 56.90 ± 1.52f 6.30 ± 0.13ef 212.28 ± 5.14i
BJ seed powder roasted 58.52 ± 0.92f 7.49 ± 0.11f 159.15 ± 2.00h
BJO unroasted 46.92 ± 2.17e 6.72 ± 0.09f n.d.
BJO seed roasted 39.68 ± 1.23cd 5.38 ± 0.06bc 135.56 ± 2.07g
BJO seed powder roasted 42.41 ± 0.45d 5.55 ± 0.13cd 118.97 ± 2.83f
BN unroasted 77.18 ± 4.11g 5.63 ± 0.12cd n.d.
BN seed roasted 26.50 ± 0.72ab 4.22 ± 0.21a 143.00 ± 2.14g
BN seed powder roasted 35.97 ± 1.25c 4.94 ± 0.27b 95.50 ± 5.86e
SA unroasted 64.97 ± 1.74f 7.15 ± 0.52f n.d.
SA seed roasted 29.58 ± 1.46b 6.04 ± 0.08def 75.96 ± 2.19d
SA seed powder roasted 23.10 ± 0.64a 6.87 ± 0.29f 56.67 ± 0.97c
RS unroasted 294.95 ± 4.06j 8.48 ± 0.12g 24.74 ± 0.45b
RS seed roasted 124.55 ± 15.71i 5.61 ± 0.23cd 707.69 ± 50.68j
RS seed powder roasted 106.91 ± 11.69h 5.88 ± 0.31cde 790.41 ± 50.78k
Values with different superscript in a same column are significantly different (p < 0.05).
n.d. = not detected
Canolol formation has been proposed to be formed as a result of decarboxylation of sinapic
acid during roasting (Wakamatsu et al., 2005; Spielmeyer et al., 2009; Koski et al., 2003;
Wijesundera et al., 2008). It is well-known that the major quantity of sinapic acid in both
mustard and rapeseed is present in the form of different derivatives (sinapine, sinapoyl-
hexoside, disinopoyl-dihexoside, disinopoyl-hexoside, trisinapoyl-dihexoside, etc) (Koski et
al., 2003; Engels et al., 2012; Khattab, Eskin, Aliani, & Thiyam, 2010; Thiyam, Claudia, Jan,
& Alfred, 2009). Therefore, both the FSA and TSAH contents were quantified. The phenolic
compound extraction was carried out with 70% methanol, because a better extractability with
this solvent mixture was reported previously (Khattab et al., 2010). After basic hydrolysis,

61
the majority of the peaks were lost, giving a single major peak of sinapic acid, indicating that
most of the peaks observed before hydrolysis were sinapic acid derivatives (Figure 3-6). The
FSA and TSAH contents of all of the varieties during the different roasting conditions are
presented in Table 3-2. The FSA content in different mustard varieties varied from 26.55 to
77.18 μg/g of dry matter (DM), while the rapeseed contained a higher quantity of FSA
(294.95 μg/g of DM). The TSAH content varied between 5.63 and 8.41 mg/g of DM in all
mustard varieties. Rapeseed contained 8.48 mg of TSAH/g of DM (13.95 mg/g of fat-free
mass), which was similar to the previously reported value of 11.00−15.33 mg of total sinapic
acid equiv/g of defatted meal (Khattab et al., 2010). The FSA content in the different mustard
varieties and rapeseed was 0.32−1.37 and 3.48% TSAH, respectively. The FSA content was
reported earlier to be 0.86−3.76% of the total phenolics in defatted canola (Khattab et al.,
2010). After roasting, the loss of the TSAH content of all of the varieties was observed. This
loss was significant (p < 0.05) for all of the varieties, except for S. alba. The FSA content
also decreased significantly (p < 0.05) after roasting, except for B. juncea. However, the loss
of FSA was far below the amount of sinapic acid converted into canolol (the molecular
weight ratio of sinapic acid/canolol is 1.24). Therefore, esterified sinapic acid derivatives
must have provided FSA by hydrolysis during roasting. The significant increase of FSA in B.
juncea during roasting also supported this fact (p < 0.05). The possible contribution of sinapic
acid derivatives on canolol formation during roasting was also stated previously (Spielmeyer
et al., 2009; Wijesundera et al., 2008). The presence of a higher quantity of FSA together
with a higher loss of sinapic acid derivatives in rapeseed during roasting supported the
formation of a higher quantity of canolol compared to other mustard varieties.
Canolol formation was highly correlated with the initial FSA content (0.94), the residual FSA
content after roasting (0.98), and also the loss of TSAH (0.93) during seed roasting. Similarly,
canolol formation was highly correlated (0.96) with all three of these parameters during seed
powder roasting. Hence, hydrolysis of sinapic acid derivatives into FSA favors canolol
formation during roasting. Canolol was shown to be thermally unstable, and fast degradation
during longer roasting was previously reported (Spielmeyer et al., 2009). The degradation of
canolol was proposed to be due to its involvement in possible side reactions with lipid
peroxyl radicals formed during heat treatments, pyrolysis, etc (Spielmeyer et al., 2009).
Furthermore, it has been shown recently that hydroxycinnamic acids (including sinapic acid)
could inhibit the Maillard reaction and color development by a radical scavenging mechanism

62
and reacting with intermediates of the Maillard reaction (Jiang & Peterson, 2010). The major
reaction pathway with intermediates of the Maillard reaction was the formation of
vinylphenol by decarboxylation (e.g., canolol from sinapic acid), which reacts with Maillard
intermediates (such as 3-deoxy-2- hexosulose) to generate phenolic Maillard adducts (Jiang
& Peterson, 2010). The possibilities of these various reactions during roasting support the
lower yield of canolol compared to the loss of TSAH. The maximum yield (molar basis) of
canolol compared to the TSAH loss was observed for rapeseed (30.69%), while the yield was
below 12.62% for the different mustard varieties during seed roasting. Seed powder roasting
generally produced less canolol than seed roasting of the same variety, except for rapeseed.
However, the yield (molar basis) of canolol compared to the TSAH loss was slightly higher
during seed powder roasting than during seed roasting of the same variety. The highest yield
was again for rapeseed (37.84%), while the yield varied from 12.71 to 25.42% in different
mustard varieties during seed powder roasting. The higher conversion rate of sinapic acid to
canolol during seed powder roasting could be due to the easier loss of carbon dioxide from
the matrix in the powder form compared to the intact seed, favoring the decarboxylation step.
The canolol content was analyzed in oil samples extracted from roasted seeds of all of the
varieties (Table 3-3).
Table 3-3. Canolol content (μg/g of oil) in the extracted oil from unroasted and 10 min
roasted seeds of B. juncea (BJ), B. juncea var. oriental (BJO), B. nigra (BN), S. alba (SA),
and rapeseed (RS)
Variety Canolol content (µg/g oil) in the extracted oil from
unroasted seed roasted seed
BJ 5.41 ± 0.01c 297.76 ± 6.26g
BJO 5.06 ± 0.15c 171.64 ± 3.20e
SA 0.48 ± 0.03a 117.29 ± 5.68d
BN 1.25 ± 0.01b 266.21 ± 4.81f
RS 5.19 ± 0.09c 808.48 ± 24.67h
Values with different superscript are significantly different (p < 0.05)
The highest canolol content was observed for roasted rapeseed oil, while all roasted mustard
seed oils contained significantly less canolol (p < 0.05). Significant differences in the canolol

63
content were also observed between the mustard varieties (p < 0.05). The differences in the
ratio of canolol formed in the seed and that observed in the oil between different varieties
were linked to the differences in the oil content of the different seeds. The fat contents of
rapeseed, B. juncea var. oriental, B. juncea, S. alba, and B. nigra were 45, 40, 37, 32, and
30% DM basis, respectively. The extracted canolol was observed to be more concentrated in
the samples with lower oil content than in the samples with higher oil content. Moreover,
only 49−56% of the canolol formed during seed roasting was observed to be extracted in oil
of all the varieties.
3.4 CONCLUSIONS
Canolol was confirmed to be formed in mustard varieties during seed roasting. The formation
of canolol during roasting and its extraction in oil supports the increased oxidative stability of
roasted mustard seed oil (Vaidya & Choe, 2011a). Canolol has been accepted to have very
good antioxidative activity (Galano, Francisco-Ma´rquez, & lvarez-Idaboy, 2011; Kuwahara
et al., 2004). The proposed simple procedure could be useful for the isolation of canolol from
both roasted mustard and rapeseed oils. The role of sinapic acid derivatives in canolol
formation was further illustrated. Mustard varieties were found to produce a far lower amount
of canolol compared to rapeseed, and the observed difference was found to be due to
differences in the amount of the FSA content and a different degree of hydrolysis of sinapic
acid derivatives. Roasting is a beneficial step for increasing the canolol content in the
extracted mustard seed oil and, hence, could increase oxidative stability.
In the next chapter, the possible role of canolol in the oxidative stability of roasted mustard
seed oils was further evaluated.


65
CHAPTER
4
A NOVEL INSIGHT IN THE HIGH OXIDATIVE STABILITY OF
ROASTED MUSTARD SEED OIL IN RELATION TO
PHOSPHOLIPID, MAILLARD TYPE REACTION PRODUCTS,
TOCOPHEROL AND CANOLOL CONTENT

66
Relevant publications:
Shrestha, K., Gemechu, F. G., & De Meulenaer, B. (2013). A novel insight on the high
oxidative stability of roasted mustard seed oil in relation to phospholipid, Maillard type
reaction products, tocopherol and canolol content. Food Research International, 54, 587-594.
Oral presentation:
246th ACS National Meeting & Exposition, September 8-12, 2013, Indianapolis, Indiana,
USA

67
ABSTRACT
The oxidative stability of the roasted and unroasted crude mustard seed oil samples collected
from the Nepalese market was evaluated by monitoring the peroxide value (PV) and
conjugated dienes (CD) during storage in the dark at 50 oC. These samples showed a wide
variability in the oxidative stability as measured by PV ranging from 5.22 to 42.11 meq
oxygen/kg oil after 69 days of storage. The PV after 40 days of storage (PV40), as an index of
oxidative stability of the different samples, was not significantly correlated (p > 0.05) both
with the total radical scavenger concentration (sum of tocopherol, plastochromanol-8 and
canolol) and the total radical scavenging capacity of the oil using the di(phenyl)-(2,4,6-
trinitrophenyl)iminoazanium (DPPH) assay. Hence, those antioxidants were not solely
responsible for the differences in the oxidative stability among the oil samples. On the other
hand, the PV40 showed significant negative correlation with the canolol content (p < 0.01),
the phospholipids content (p < 0.001) and the different browning reaction markers such as
absorbance at 350 nm (p < 0.001), fluorescence (excitation at 350 nm and emission at 440
nm) (p < 0.001), and the pyrrolized phospholipids content (p < 0.01). Moreover, all the
browning reaction markers and phospholipids content were also highly positively correlated
(p < 0.001) with each other. The phospholipids and their Maillard type browning reaction
products together with canolol formed during seed roasting were primarily responsible for the
high oxidative stability of the roasted mustard seed oil samples.
Keywords: canolol, mustard seed oil, lipid oxidation, antioxidant, roasting, phospholipids
browning

68
4.1 INTRODUCTION
Mustard seeds are generally roasted before oil extraction to give a characteristic flavor.
Afterwards, it is pressed using a screw expeller to obtain the crude oil, which is very popular
in India and Nepal (Vaidya & Choe, 2011a; Vaidya & Choe, 2011b). In Chapter 3, we
confirmed the formation of a potent radical scavenger canolol (2,6-dimethoxy-4-vinylphenol)
during mustard and rapeseed roasting, via the decarboxylation of sinapic acid. The major
amounts of sinapic acid required for canolol formation was contributed by the partial
hydrolysis of different esterified sinapic acid derivatives during roasting. Canolol is reported
to have good radical scavenging capacity and its reactivity with the peroxide radical is mainly
attributed to the hydrogen atom transfer from the phenolic moiety (Galano et al., 2011). The
increased oxidative stability of the roasted rapeseed oil is mainly attributed to canolol
formation (Koski et al., 2003; Wijesundera et al., 2008). Roasting has also been reported to
increase the thermo-oxidative stability of high erucic mustard seed oil and the stability of
tocopherol and lutein during oil storage (Vaidya & Choe, 2011a; Vaidya & Choe, 2011b).
Unfortunately, authors completely ignored the possible formation of canolol during seed
roasting, which could also have an effect on the oxidative stability. The increased oxidative
stability was linked with the Maillard reactions (Vaidya & Choe, 2011a; Vaidya & Choe,
2011b). However, the mechanisms behind the browning reactions and their possible role in
the oxidative stability were not completely evaluated. Therefore, the chemistry behind the
increased oxidative stability of the roasted mustard seed oil still remains ambiguous.
In an attempt to elucidate the oxidative stability, a correlation study between the different
radical scavenger‟s concentrations and the markers of Maillard type reaction products with
the oxidative stability of the roasted mustard seed oil was carried out in this study.
4.2 MATERIALS AND METHODS
4.2.1 Samples
Among the oil samples collected from the Nepalese market (Chapter 2), those with no
detectable soybean oil adulteration and also having low initial peroxide value (< 5 meq
oxygen/kg oil) were selected for this study. The selected samples were NS2, NS8, NS9, NS14,
NS16, NS17, NS21, NS22, NS23, NS26, NS27, NS28, NS33, NS37, NS43 and NS44. These
samples were coded from A to P sequentially, for this chapter.

69
4.2.2 Reagents and chemicals
Thin layer chromatography (TLC) plates with Silica gel 60 mesh particle size were obtained
from Merck (Darmstadt, Germany). Tocopherol standard was obtained from DSM (New
Jersey, USA). Syringaldehyde, di(phenyl)-(2,4,6-trinitrophenyl)iminoazanium (DPPH)
radical and 1,2-dioleoyl-sn-glycero-3-phosphoethanolamine were purchased from Sigma
Aldrich (Steinheim, Germany). HPLC grade hexane was bought from VWR International
(Leuven, Belgium). Other reagents and solvents were of analytical grade and were obtained
from reliable commercial sources.
4.2.3 Synthesis of canolol
Canolol was synthesized from syringaldehyde by a condensation reaction with malonic acid
and then double decarboxylation under microwave condition as described in Chapter 3
(section 3.2.5).
4.2.4 Analytical methods
4.2.4.1 Analysis of fatty acid methyl esters
The boron trifluoride method was used for the preparation of fatty acid methyl esters
(FAMEs) and analysis was carried out in a gas chromatography as described in Chapter 2
(section 2.2.2.1).
4.2.4.2 HPLC analysis of tocopherol, plastochromanol-8 and canolol
Tocopherols, plastochromanol-8 and canolol contents of the oil samples were analyzed on an
Agilent 1100 series HPLC (USA) using a fluorescence detector as described in Chapter 3
(section 3.2.6).
4.2.4.3 Peroxide value and conjugated dienes
The peroxide value (PV) was determined by an iron based spectrophotometric method
(Shantha & Decker, 1994). In addition, the oil sample was dissolved in iso-octane and the
absorbance at 233 nm was taken in a quartz cuvette using a Cary 50 UV-Vis
spectrophotometer (Varian, Australia). The conjugated dienes (CD) content was calculated
based on molecular extinction coefficient of 29,000 M-1cm-1 (Frankel, 2005).

70
4.2.4.4 Radical scavenging capacity
The total radical scavenging capacity of the oil sample was analyzed using the DPPH radical-
scavenging assay with some modifications of the previously described method (Zamora et al.,
2011). The oil sample (50 mg) was mixed with 3 mL of a 0.1 mM DPPH solution in iso-
octane. The DPPH solution without oil sample was used as a control and the oil sample
solution in iso-octane (50 mg in 3 mL) was used as a sample blank. After a 10 min reaction
time, the absorbance of these solutions was measured at 517 nm against iso-octane as blank.
Radical scavenging capacity was calculated as follows:
Radical scavenging capacity (%) = 100 * [Acontrol – (Aoil+DPPH –Aoil)]/ Acontrol
Where Acontrol, Aoil+DPPH and Aoil are the absorbance values after 10 min of reaction time of
the DPPH solution, the oil added DPPH solution and the oil solution in iso-octane,
respectively.
4.2.4.5 Phospholipids analysis
The phospholipids phosphorus content was measured spectrophotometrically by the
formation of a phospholipids phosphorus-molybdate complex using a previously described
method with a slight modification (Totani, Pretorius, & Plessis, 1982). Ascorbic acid was
used as a reducing agent instead of tin chloride. The calibration was carried out with 1,2-
dioleoyl-sn-glycero-3-phosphoethanolamine in the range of 0 to 10 µg phosphorus.
4.2.4.6 Pyrrolized phospholipid analysis
The pyrrolized phospholipid content of the oil samples was analyzed using a previously
described procedure (Zamora et al., 2004). The reported value of extinction coefficient of
Ehrlich adducts (15,300 M-1
cm-1
) was used in the calculation. The value was obtained using
1-[1-(2-hydroxyethyl)-1H-pyrrol-2-yl]propan-1-ol as a standard (Zamora et al., 2004).
4.2.4.7 Absorbance and fluorescence measurement
The absorbance spectra of the oil in iso-octane solution (2 mg/mL) in the wavelength range
of 200 to 500 nm were measured using a Cary 50 UV/Vis spectrophotometer (Varian,
Australia) in a quartz cuvette. In addition, 300 µL of the oil in iso-octane solution (25

71
mg/mL) was kept in a 96 well plate and the fluorescence (excitation at 350 nm and emission
at 440 nm) was measured using a Spectramax Gemini XS microplate fluorometer (Molecular
devices, USA). The value was expressed as the percentage of fluorescence of a quinine
sulphate solution (1 µM in 0.1 M H2SO4). The procedure was based on the previously
described method (Zamora et al., 2011).
4.2.5 Oxidative stability of different mustard seed oil samples
The oil samples (15 mL) were kept in the 20 mL amber glass headspace-vial (75.5 mm × 22.5
mm) in triplicates and were stored in the dark at 50 oC. The oil oxidation was monitored by
analyzing the PV and the CD at weekly intervals for 2 months.
4.2.6 Fractionation of oil on a silica gel column and the study of the oxidative stability
of different fractions
The mustard seed oil (2.5 mL) was dissolved in 50 mL of hexane and loaded on a 25 g
activated silica gel packed column. The column was subsequently eluted with 750 mL of 1%
isopropanol in hexane, 250 mL of ethyl acetate and 250 mL of methanol (containing 0.1%
trifluoroacetic acid (TFA)) sequentially to obtain HI (hexane with 1% isopropanol) fraction,
EA (ethyl acetate) fraction and MeOH (methanol with 0.1% TFA) fraction, respectively. All
the fractions were concentrated under rotary evaporator at 35 oC
and their volume was made
up to 250 mL. The absorbance spectra (wavelength range of 250 to 500 nm) of all these
fractions were measured in a quartz cuvette using a UV/Vis spectrophotometer (Varian,
Australia). The same fractionation was repeated in another column to obtain similar fractions.
In this case, the HI fraction and the EA fraction were then mixed to obtain HI-EA fraction.
Both the HI fraction and HI-EA fraction were evaporated under reduced pressure and dried
under nitrogen. The oil sample, HI fraction oil and HI-EA fraction oil were analyzed for the
tocopherol and canolol contents. Afterwards, the tocopherol and canolol contents in all of
these oils were adjusted to 700 µg/g and 200 µg/g, respectively, by the addition of pure
canolol and tocopherol mixtures (containing α, β, γ and δ-tocopherol 7.64, 1.07, 57.11and
24.52%, respectively). A volume of 500 µL of each oil sample was taken into a 1.5 mL
HPLC glass vial and stored at 104 oC. The oil oxidation was monitored by analyzing PV after
every 24 h. Both fractionation and oxidation studies were carried out in duplicate.
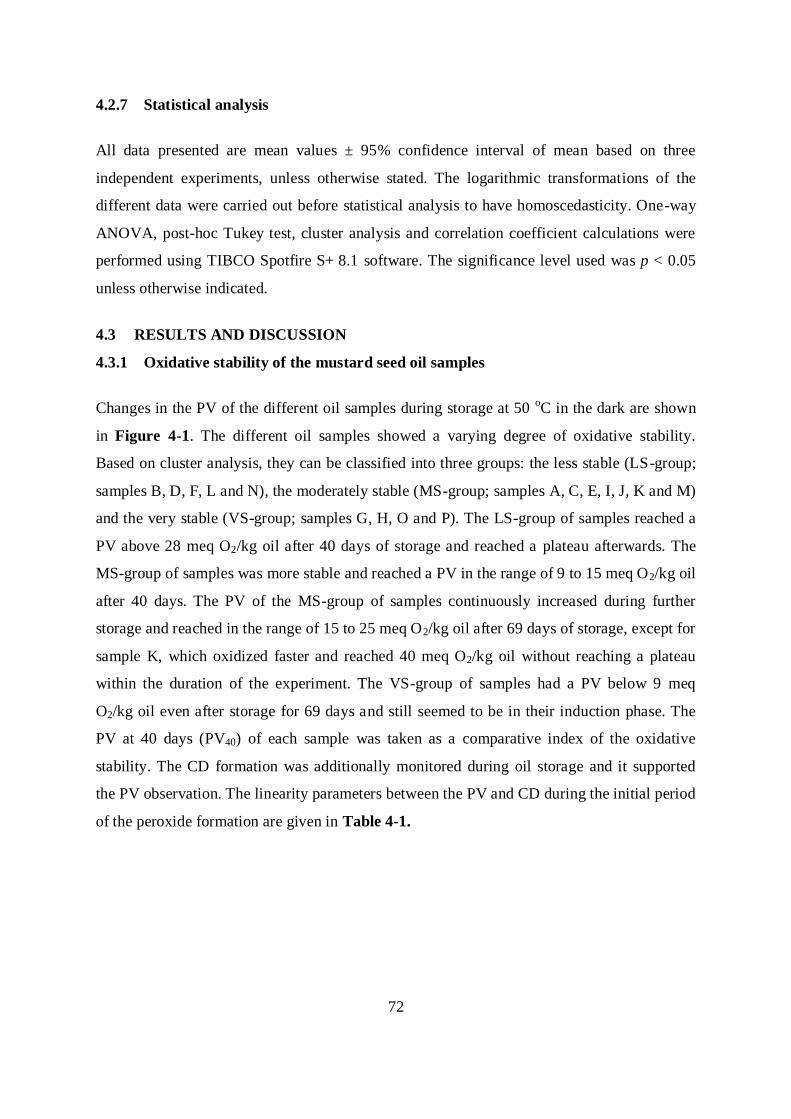
72
4.2.7 Statistical analysis
All data presented are mean values ± 95% confidence interval of mean based on three
independent experiments, unless otherwise stated. The logarithmic transformations of the
different data were carried out before statistical analysis to have homoscedasticity. One-way
ANOVA, post-hoc Tukey test, cluster analysis and correlation coefficient calculations were
performed using TIBCO Spotfire S+ 8.1 software. The significance level used was p < 0.05
unless otherwise indicated.
4.3 RESULTS AND DISCUSSION
4.3.1 Oxidative stability of the mustard seed oil samples
Changes in the PV of the different oil samples during storage at 50 oC in the dark are shown
in Figure 4-1. The different oil samples showed a varying degree of oxidative stability.
Based on cluster analysis, they can be classified into three groups: the less stable (LS-group;
samples B, D, F, L and N), the moderately stable (MS-group; samples A, C, E, I, J, K and M)
and the very stable (VS-group; samples G, H, O and P). The LS-group of samples reached a
PV above 28 meq O2/kg oil after 40 days of storage and reached a plateau afterwards. The
MS-group of samples was more stable and reached a PV in the range of 9 to 15 meq O2/kg oil
after 40 days. The PV of the MS-group of samples continuously increased during further
storage and reached in the range of 15 to 25 meq O2/kg oil after 69 days of storage, except for
sample K, which oxidized faster and reached 40 meq O2/kg oil without reaching a plateau
within the duration of the experiment. The VS-group of samples had a PV below 9 meq
O2/kg oil even after storage for 69 days and still seemed to be in their induction phase. The
PV at 40 days (PV40) of each sample was taken as a comparative index of the oxidative
stability. The CD formation was additionally monitored during oil storage and it supported
the PV observation. The linearity parameters between the PV and CD during the initial period
of the peroxide formation are given in Table 4-1.

73
Figure 4-1. Changes in the peroxide value (PV) of the different mustard seed oil samples
during storage at 50 oC [less stable group ( B, D, F, L,
N), moderately stable group ( A, C, E, I, J,
K, M) and very stable group ( G, H, O, P)]
The fatty acid composition of all the oil samples is given in Table 4-2. The major differences
in the fatty acid composition among the different samples were in the erucic acid and oleic
acid contents. However, all the samples were comparable in the degree of unsaturation.
Therefore, the differences in the oxidative stability of the different samples were not
correlated with the differences in the fatty acid composition.
Radical scavenging compounds are well known antioxidants. These chain-breaking
antioxidants inhibit the lipid oxidation either at the initiation phase or during the propagation
stage by donating hydrogen atoms to lipid radicals (Frankel, 2005). The major radical
scavenging compounds identified in the oil samples were α-tocopherol, γ-tocopherol, δ-
tocopherol, plastochromanol-8 and canolol (Table 4-3).
0
5
10
15
20
25
30
35
40
45
50
0 10 20 30 40 50 60 70
pe
roxi
de
val
ue
in (
me
q o
xyge
n/k
g o
il)
days of storage
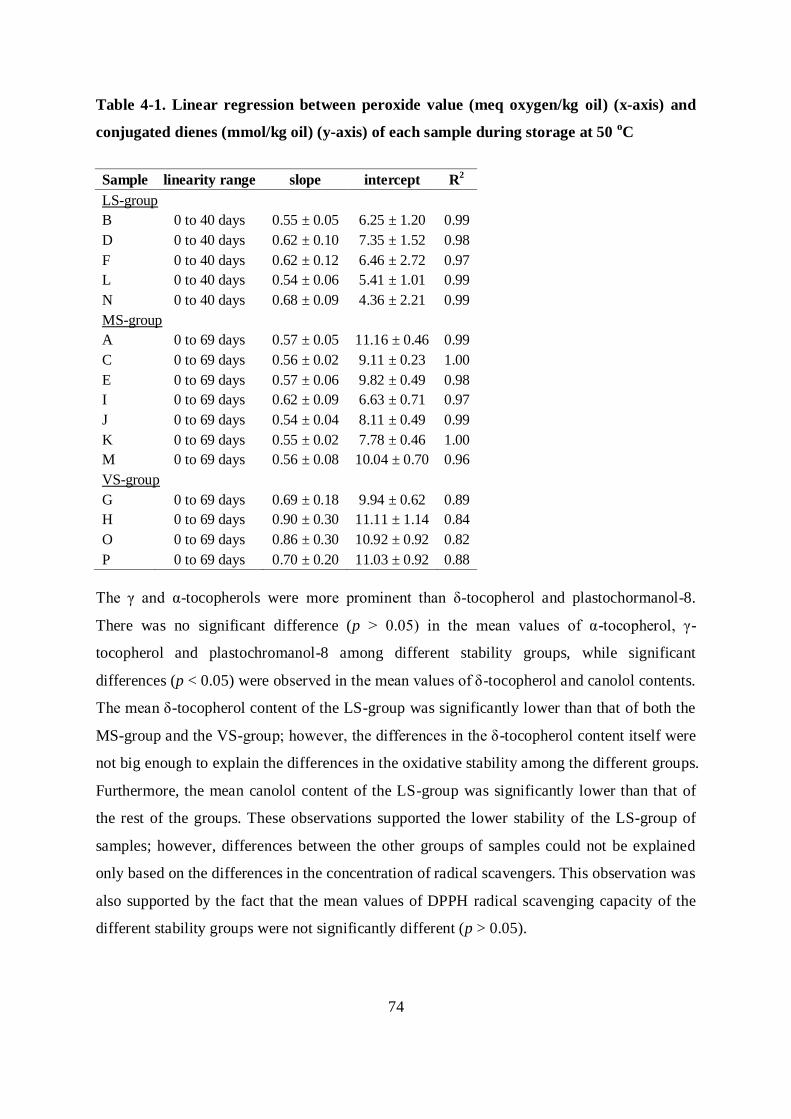
74
Table 4-1. Linear regression between peroxide value (meq oxygen/kg oil) (x-axis) and
conjugated dienes (mmol/kg oil) (y-axis) of each sample during storage at 50 oC
Sample linearity range slope intercept R2
LS-group
B 0 to 40 days 0.55 ± 0.05 6.25 ± 1.20 0.99
D 0 to 40 days 0.62 ± 0.10 7.35 ± 1.52 0.98
F 0 to 40 days 0.62 ± 0.12 6.46 ± 2.72 0.97
L 0 to 40 days 0.54 ± 0.06 5.41 ± 1.01 0.99
N 0 to 40 days 0.68 ± 0.09 4.36 ± 2.21 0.99
MS-group
A 0 to 69 days 0.57 ± 0.05 11.16 ± 0.46 0.99
C 0 to 69 days 0.56 ± 0.02 9.11 ± 0.23 1.00
E 0 to 69 days 0.57 ± 0.06 9.82 ± 0.49 0.98
I 0 to 69 days 0.62 ± 0.09 6.63 ± 0.71 0.97
J 0 to 69 days 0.54 ± 0.04 8.11 ± 0.49 0.99
K 0 to 69 days 0.55 ± 0.02 7.78 ± 0.46 1.00
M 0 to 69 days 0.56 ± 0.08 10.04 ± 0.70 0.96
VS-group
G 0 to 69 days 0.69 ± 0.18 9.94 ± 0.62 0.89
H 0 to 69 days 0.90 ± 0.30 11.11 ± 1.14 0.84
O 0 to 69 days 0.86 ± 0.30 10.92 ± 0.92 0.82
P 0 to 69 days 0.70 ± 0.20 11.03 ± 0.92 0.88
The γ and α-tocopherols were more prominent than δ-tocopherol and plastochormanol-8.
There was no significant difference (p > 0.05) in the mean values of α-tocopherol, γ-
tocopherol and plastochromanol-8 among different stability groups, while significant
differences (p < 0.05) were observed in the mean values of δ-tocopherol and canolol contents.
The mean δ-tocopherol content of the LS-group was significantly lower than that of both the
MS-group and the VS-group; however, the differences in the δ-tocopherol content itself were
not big enough to explain the differences in the oxidative stability among the different groups.
Furthermore, the mean canolol content of the LS-group was significantly lower than that of
the rest of the groups. These observations supported the lower stability of the LS-group of
samples; however, differences between the other groups of samples could not be explained
only based on the differences in the concentration of radical scavengers. This observation was
also supported by the fact that the mean values of DPPH radical scavenging capacity of the
different stability groups were not significantly different (p > 0.05).

75
Table 4-2. The fatty acid composition (g fatty acid/100 g oil) of different samples
Sample fatty acid composition (g fatty acid/100 g oil)
16:0 16:1 18:0 18:1 18:2 20:0 20:1 18:3 20:2 22:0 22:1 24:0 24:1
LS-group
B 2.12 0.16 1.01 11.60 12.75 0.84 6.43 9.90 0.53 0.91 44.43 0.19 1.40
D 2.13 0.19 1.18 11.41 13.18 0.88 5.66 9.29 0.59 0.86 41.88 0.16 1.25
F 2.15 0.18 1.21 11.82 13.51 0.90 5.88 9.25 0.56 0.86 41.52 0.21 1.12
L 3.84 0.20 1.72 56.39 16.98 0.54 1.22 7.83 n.d. 0.24 2.02 n.d. n.d.
N 3.32 0.19 1.41 41.01 15.77 0.64 2.37 8.20 0.29 0.46 15.76 0.09 0.62
MS-group
A 3.65 0.20 1.59 41.55 16.73 0.64 2.04 7.33 0.20 0.42 14.86 0.08 0.23
C 3.15 0.20 1.41 38.45 14.80 0.72 2.81 8.41 0.21 0.56 20.32 0.15 0.69
E 3.37 0.16 1.50 43.04 15.44 0.66 2.68 7.19 0.20 0.45 16.27 n.d. 0.53
I 1.64 0.13 1.07 13.78 11.95 0.87 4.23 8.27 0.33 0.81 44.96 0.27 1.27
J 2.56 0.17 1.23 25.40 14.02 0.80 4.00 8.65 0.32 0.67 31.88 n.d. 0.94
K 2.80 0.16 1.35 32.45 14.80 0.71 2.86 7.71 0.20 0.56 27.02 n.d. 0.77
M 2.98 0.19 1.42 35.06 14.61 0.69 3.00 7.73 0.23 0.50 23.53 n.d. 0.51
VS-group
G 2.00 0.13 1.04 14.89 12.66 0.78 4.62 9.65 0.48 0.84 40.43 0.34 1.52
H 2.87 0.16 1.30 34.26 14.45 0.67 2.83 7.27 0.22 0.52 24.94 n.d. 0.76
O 1.79 0.15 1.13 16.19 12.12 0.85 4.06 8.16 0.34 0.75 42.67 0.15 1.09
P 1.98 0.15 1.18 19.35 12.67 0.84 3.86 8.16 0.29 0.79 40.34 0.16 0.96
n.d. = not detected
It was remarkable that the color of the oil was visually different among the different samples.
In general, the darker samples were more stable than the lighter ones. The samples in LS-
group were pale yellow and clear, while that of VS-group were very dark brown. The MS-
group of samples had varying degrees of brown color. This was an indication that the color of
the oil can be correlated with the stability of the oil. Therefore, the absorbance spectra of all
the oil samples (2 mg/mL in iso-octane) were taken over the range of 200 to 500 nm
wavelengths. Both PV40 and absorbance values were transformed into logarithmic scale and
the correlation coefficients between them were calculated at different wavelengths. The
correlation was negative over the whole range of wavelengths and it varied as a function of
wavelengths (Figure 4-2).

76
Table 4-3. Tocopherol and canolol content (µg/g), DPPH radical scavenging capacity (%), fluorescence (excitation 350 nm, emission 440
nm) of sample in iso-octane (25 mg/mL) (expressed as % of fluorescence of 1 µM quinine sulphate in 0.1 M H2SO4) and pyrrolized
phospholipids content (nmol pyrrole/g) of the different mustard seed oil samples (values with different superscript letters in a column
are significantly different (p < 0.05))
Sample tocopherol (µg/g)
canolol (µg/g)
% DPPH
scavenging
capacity
fluorescence
(ex 350 nm,
em 440 nm)
pyrrole (nmol/g
oil) α-tocopherol γ-tocopherol δ-tocopherol
plastochromanol
-8
LS-group
B 173.75 ± 0.79cd 354.25 ± 1.28g 12.48 ± 0.57cd
75.91 ± 0.11h 64.61 ± 0.26d
81.90 ± 0.53c 41.55 ± 0.31d 45.31 ± 4.14c
D 129.81 ± 5.17a 308.75 ± 10.18d 9.90 ± 0.89a
74.42 ± 3.65gh 6.69 ± 0.34a 75.24 ± 0.73b
19.25 ± 0.50c 83.91 ± 4.08e
F 142.88 ± 1.00b 295.76 ± 2.37c 10.09 ± 0.56ab
70.82 ± 0.41fg 8.53 ± 0.48b
76.89 ± 1.53b 16.42 ± 0.41b 23.56 ± 1.61b
L 178.78 ± 1.30de 400.15 ± 3.49h 13.09 ± 1.16cd 55.65 ± 0.36cd
94.30 ± 0.18ef 86.31 ± 1.31de 8.21 ± 0.09a 0.67 ± 0.04a
N 201.54 ± 0.97g 397.33 ± 3.72h 11.58 ± 0.35bc 57.15 ± 1.29cd
40.80 ± 0.05c 82.55 ± 0.59cd 8.87 ± 0.31a 1.11 ± 1.07a
MS-group
A 216.13 ± 0.78h 331.30 ± 1.66f 20.71 ± 0.82h 54.89 ± 0.58c 244.76 ± 1.43k 94.52 ± 1.57f 75.14 ± 2.47g 85.87 ± 3.70e
C 189.13 ± 0.22ef 320.12 ± 0.85ef 13.63 ± 0.15de 69.93 ± 0.06ef 369.90 ± 1.42m
93.64 ± 1.60f 75.43 ± 8.88g 86.55 ± 0.48e
E 223.26 ± 3.15h 359.68 ± 5.46g 13.80 ± 0.44de 91.83 ± 1.73i 345.35 ± 4.10l 93.45 ± 2.05f 108.10 ± 4.71i 152.14 ± 10.84i
I 132.67 ± 0.43a 226.23 ± 1.06a 16.41 ± 0.07g 49.74 ± 0.32b
92.00 ± 0.24e 68.22 ± 0.83a 50.35 ± 0.67e 64.58 ± 7.02d
J 158.27 ± 1.10b 307.38 ± 1.50d
14.23 ± 0.17def 41.30 ± 0.28a 127.45 ± 0.80h 83.69 ± 0.53cd 58.73 ± 1.71f 97.10 ± 5.72ef
K 189.71 ± 2.68ef 298.67 ± 1.23c 17.36 ± 1.01g 50.74 ± 1.82b
133.18 ± 0.16h 84.46 ± 0.67cde 60.25 ± 1.29f 66.21 ± 5.42d
M 221.22 ± 2.04h 312.08 ± 2.91de 22.24 ± 0.27h 58.67 ± 0.58d
179.04 ± 0.43i 91.91 ± 0.73f 121.63 ± 3.54j 135.44 ± 3.29hi
VS-group
G 129.45 ± 0.76a 360.92 ± 6.05g 15.81 ± 0.42fg 68.91 ± 0.83ef 220.20 ± 1.29j 92.19 ± 1.18f 88.69 ± 4.63h 103.12 ± 5.85fg
H 193.54 ± 0.40fg 304.69 ± 1.06cd
15.57 ± 0.28efg 66.00 ± 1.53e 417.06 ± 0.55n 94.92 ± 1.28f 94.47 ± 3.30h 116.87 ± 10.82gh
O 167.32 ± 7.05c 249.34 ± 5.80b 27.38 ± 2.34i 125.38 ± 2.22j 113.80 ± 1.15g 83.29 ± 0.41cd
117.99 ± 3.45ij 98.33 ± 5.75efg
P 174.74 ± 4.41cd 245.99 ± 0.70b
17.01 ± 1.80g 54.52 ± 1.45c 97.75 ± 1.77f 88.20 ± 0.92e 137.16 ± 6.85k 216.22 ± 8.27j

77
Figure 4-2. Correlation coefficient between PV40 and absorbance of oil both after
logarithmic transformation plotted as a function of wavelength ( ) (the r values of -0.5
(p < 0.05), -0.62 (p < 0.01) and -0.74 (p < 0.001)). The absorbance spectra of canolol
( ), tocopherol ( ), lutein ( ) and sinapic acid ( ) are shown in the
secondary axis
The negative correlation indicated that the samples with higher absorbance were more stable
compared to those with low absorbance. The correlation coefficients were highly significant
(p < 0.001) in the wavelength range between 218 and 230 nm and again between 247 and 423
nm. There were two distinct high correlation regions between 247 and 423 nm, the first
wavelength range was between 247 and 330 nm and the second wavelength range was
between 330 and 423 nm. The wavelength range of 247 to 330 nm is the absorbance region
for different antioxidants like tocopherol (peak at 290 to 300 nm), canolol (peak at 272 nm),
different phenolics (peak at 280 nm), lutein (peak at 270 nm within the UV region, a
carotenoid present in mustard oil (Vaidya & Choe, 2011b) and sinapic acid (peak at 330 nm)
as shown in Figure 4-2. There was a high correlation at 220 nm and even higher at the 260
nm wavelength while a sharp decrease in the correlation was observed between these
wavelengths with minimum at around 237 nm. This was in line with the absorbance spectra
0.00
0.20
0.40
0.60-1.0
-0.9
-0.8
-0.7
-0.6
-0.5
200 300 400 500
Ab
sorb
ance
Co
rre
lati
on
co
eff
icie
nt
Wave length (nm)

78
of both the canolol and tocopherol. The tocopherol and canolol do not have significant
absorbance above 320 nm. Sinapic acid has a maximum absorbance at 330 nm and then
decreases at higher wavelength. The stability of the oil could not be linked with the lutein
content since there was no significant correlation (p > 0.05) at around 445 nm, where lutein
has a high absorbance. The second region between 330 and 423 nm having high correlation
with the oxidative stability was in line with the visual observation that the brown samples
were more stable. Therefore, not only tocopherol, canolol and other possible phenolic
compounds absorbing below 330 nm, but also brown compounds with the broad absorbance
spectrum reaching till the visual range of around 430 nm were additionally responsible for the
differences in the oxidative stability of the different oils.
Browning reactions are mainly the consequence of the reactions between the amino group
and the carbonyl group with a series of multiple steps producing small molecules to large
brown molecules by condensation and polymerization mechanisms (Zamora & Hidalgo,
2005). The Maillard reaction is well known in producing antioxidative compounds and was
also thought to play a role in the oxidative stability of roasted rapeseed oil and low erucic
mustard seed oil together with the canolol formation (Wijesundera et al., 2008). The
oxidative stability of the high erucic mustard seed oil was also proposed to be partly due to
Maillard reaction products (Vaidya & Choe, 2011a; Vaidya & Choe, 2011b). However, a
clear evaluation of the Maillard reaction was not carried out. Moreover, the amino group of
phospholipids could also take part in the similar browning reactions (Frankel, 2005). During
seed roasting, all kinds of browning reactions with different sources of amino and carbonyl
groups could be expected to happen simultaneously, however, their extraction in the oil phase
could likely be affected by their polarity differences. In a previous study, it was shown that
the amino group of PE was even more reactive with ribose than that of lysine (Zamora,
Nogales, & Hidalgo, 2005). These authors reported that, when the aqueous reaction mixture
of PE, ribose and lysine was extracted with chloroform/methanol (2:1) to have phase
separation, the brown compounds due to PE/ribose and lysine/ribose got separated into
organic and aqueous phases respectively. Moreover, the PE/ribose system was reported to
produce much more browning and fluorescence compared to the lysine/ribose system
(Zamora et al., 2005). These observations showed that the lysine/ribose Maillard reaction
products are more hydrophilic, while the PE/ribose reaction system could produce lipophilic
Maillard type reaction products. The same extraction method was used in the VS-group of
79
samples to characterize the brown compounds. It was observed that the major brown
compounds of the very stable sample remained in the organic phase. This was an indication
that the major brown compounds were apolar and could be mainly due to phospholipids
browning than due to the Maillard reactions between reducing sugars amino acids.
The pyrrolization of amino phospholipids has been frequently reported to occur at the initial
stage of Maillard type reactions (Zamora & Hidalgo, 2003; Zamora et al., 2004; Hayashi et
al., 2007). Afterwards, aldol condensation and pyrrole polymerization mechanisms have been
proposed in the formation of melanoidin type brown polymers (Zamora & Hidalgo, 2005).
These browning reactions have been characterized by the increased radical scavenging
capacity and a marked increase in the fluorescence (excitation 350 nm and emission at 440
nm) (Zamora et al., 2011). Even the PE alone without ribose showed a significant increase in
all those characteristics during heat treatments (Zamora et al., 2011). On the other hand,
phospholipids have been described to possess antioxidant activity (Frankel, 2005). Therefore,
both the phospholipids content and its browning reactions were taken into consideration in
relation to the observed oil oxidative stability.
The phospholipids content of the different samples as a function of PV40 showed that the
samples with higher phospholipids content were more stable (Figure 4-3). The mean
phospholipids content of the VS-group of samples was significantly higher (p < 0.05) than
that of the MS-group of samples. Similarly, the mean phospholipids content of the MS-group
of samples was also significantly higher (p < 0.05) than that of the LS-group of samples. The
oxidative stability of the heat treated canola press oil and pumpkin seed oil was also shown to
be highly correlated with the phospholipids content (Prior, Vadke, & Sosulski, 1991;
Vujasinovic et al., 2012). These authors reported a marked increase in the oxidative stability
of the oil with increasing the phospholipids content in the range of 0 to 200 ppm (Prior et al.,
1991; Vujasinovic et al., 2012).
The fluorescence emission at 440 nm (after excitation at 350 nm) was measured for the
different oil samples (in iso-octane) (Table 4-3). The mean fluorescence of the VS-group of
samples and the MS-group of samples were not significantly different (p > 0.05) from each
other, whereas, both of them were significantly higher (p < 0.05) than that of the LS-group of
samples. Similarly, the mean pyrrole content of the MS- and VS- group was not significantly
different from each other (p > 0.05), whereas both of them were significantly higher (p < 0.05)

80
than that of the LS-group of samples (Table 4-3). Samples L and N showed very low pyrrole
content together with low fluorescence, suggesting that they were unroasted seed oil samples.
Both samples were light yellow without the sign of browning reactions.
Figure 4-3. Peroxide value after 40 days of storage (PV40) of the different mustard seed
oil samples plotted against the phospholipids phosphorus content (ppm)
4.3.2 Correlations between different parameters
The correlation coefficients between the different parameters were calculated and are given in
Table 4-4.
y = 547.37x-1.013
R² = 0.7945
0
10
20
30
40
50
60
0 50 100 150 200
PV
aft
er
40
day
s (m
eq
oxy
gen
/kg
oil)
Phospholipid phosphorus (ppm)

81
Table 4-4. The correlation coefficients between the different parameters (after logarithmic transformation).
Parameters canolol total
tocopherol
tocopherol +
canolol
content
DPPH
assay
phospholipids
content
fluorescence
(ex. 350 nm, em.
440 nm)
absorbance
at 350 nm
pyrrole
content
PV40 -0.69** 0.17 -0.38 -0.44 -0.89*** -0.89*** -0.94*** -0.70**
Canolol
0.31 0.81*** 0.70** 0.59* 0.66** 0.62* 0.32
Total tocopherol
0.71** 0.64** -0.25 -0.13 -0.12 -0.35
Tocopherol + canolol content
0.87*** 0.30 0.38 0.38 0.11
DPPH assay
0.35 0.44 0.47 0.18
Phospholipids content
0.89*** 0.92*** 0.79***
Fluorescence (ex. 350 nm, em. 440 nm)
0.97*** 0.88***
Absorbance at 350 nm
0.84***
* p < 0.05, **p < 0.01, *** p < 0.001

82
The DPPH radical scavenging capacity of oil positively correlated both with the total
tocopherol content and the canolol content, however, no significant correlation was observed
with the rest of the parameters. The correlation was even higher with the combined
tocopherol and canolol contents. Both the tocopherol and canolol are well known radical
scavengers and their total quantity explained most of the radical scavenging capacity of the
oil observed. These chain breaking antioxidants are known to inhibit the lipid oxidation both
at the radical initiation and chain propagation stages. However, the index of oxidative
stability (PV40) was not significantly correlated with both DPPH radical scavenging capacity
and the sum of tocopherol and canolol contents of the oil. It was also not significantly
correlated with tocopherol content. However, significant negative correlation was observed
with canolol alone. Canolol is known to be formed by decarboxylation of sinapic acid during
roasting (Wakamatsu et al., 2005; Spielmeyer et al., 2009; Shrestha, Stevens, & De
Meulenaer, 2012). These observations indicated that oxidative stability was not primarily
related to the radical scavenging capacity. Its‟ correlation with canolol content was an
indication that other roasting effects together with canolol formation were responsible for the
high oxidative stability.
The highest negative correlation of PV40 value was observed with the absorbance at 350 nm
and then with the fluorescence, phospholipids content and pyrrole content in a decreasing
order. In addition, all these parameters were also positively correlated (p < 0.001) with each
other. It has been reported that amino group containing phospholipids could undergo amino-
carbonyl reactions to produce pyrroles which could further polymerize to form brown and
fluorescent compounds (Zamora & Hidalgo, 2003; Zamora et al., 2004). When such
mechanism would be expected to contribute in the nonenzymatic browning reactions, a high
correlation among color, fluorescence and pyrrolization measurements would be expected
(Zamora, Alaiz, & Hidalgo, 2000). Therefore, such mechanism of browning could be present
in the roasted mustard seed oil samples and could be playing a major role in increasing the
oxidative stability of these oils.
The browning reaction is well known to produce strong reducing agents due to the presence
of reductone structures (Belitz et al., 2009). Moreover, phospholipids and their browning
reaction products could show antioxidant activity by multiple mechanisms like chelating
agent, emulsifier, hydrogen transfer, reducing agent, free radical scavenger, peroxide

83
breakdown, etc. (Frankel, 2005; Zamora et al., 2011). In the LS-group of samples, oil
oxidation started with a very short induction period and this indicated that initiators for the
radical generation like metal ions were very active to start the oxidative chain reactions. The
MS-group of samples showed longer induction periods before starting oil oxidation and
hence it could be argued that the radical initiators were partially protected to a varying degree.
On the other hand, the VS-group of samples showed very long induction periods, indicating
that the radical initiators were highly protected from generating the radicals. Based on
quantum mechanics, the triplet state oxygen cannot directly react with a singlet state double
bond. Either the double bond must be excited to a triplet state requiring a large amount of
energy (Ea = 146-272 kJ/mol) or oxygen must be brought to the singlet state using light in the
presence of a photosensitizer. Therefore, direct reaction between lipids and oxygen does not
occur at 50 oC in the dark without any initiators or catalysts. Radical scavengers are only
playing a “catch up” role after free radicals are formed, and hence could not guarantee a very
long induction period if the radical formation from the initiation step is very efficient
(Schaich, 2005). Such a high oxidative stability observed in the VS-group of samples, even
with the same or lower quantity of the radical scavengers (e.g. sample P) than other LS-group
of samples, could only be explained either by the elimination or inhibition of the initial
radical generating step. Moreover, this argument was also supported by the fact that oxidative
stability was not correlated both with the total concentration of radical scavengers and the
DPPH radical scavenging capacity of the oil samples.
4.3.3 Effect of fractionation of mustard seed oil on the oxidative stability
Two samples of different oxidative stabilities (very stable roasted sample O and less stable
unroasted sample L) were fractionated to obtain the HI, EA and MeOH fraction. The
absorbance spectra of these fractions from the two samples are shown in Figure 4-4. The
stable sample O had a high absorbance in the UV region compared to the less stable sample L
(Figure 4-4A). TLC and HPLC analyses of the HI fraction showed the presence of apolar
compounds like triglycerides and tocopherol among others. The HI fraction of sample O
showed slightly higher absorbance over the whole range of wavelength compared to that
from sample L (Figure 4-4B). The spectra of the EA fraction of both samples showed
presence of carotenoids as depicted by the characteristic three peaks in the visible regions
(Figure 4-4C). This fraction also eluted canolol (detected on HPLC) from the silica column.

84
The EA fraction from the stable sample O was slightly darker than that from the less stable
sample L, and showed higher absorbance in the UV region. After elution with ethyl acetate, a
significant amount of dark compounds from sample O still remained in the silica column,
while such dark compounds could not visually be observed for sample L. The remaining
compounds in the silica column were eluted with methanol (0.1% TFA) and the absorbance
spectra of these MeOH fractions are shown in Figure 4-4D. The MeOH fraction of sample O
was brown and showed absorbance in the UV regions starting from the visible range, while
the MeOH fraction of sample L was almost colorless and did not show much absorbance over
the whole range.
Figure 4-4. Absorbance spectra of the oil samples (A), HI fractions (B), EA fractions (C)
and MEOH fractions (D) for samples O and L at 9 mg oil/mL; smooth lines are for
sample O and dotted lines are for sample L
0.0
0.1
0.2
0.3
0.4
260 310 360 410 460
abso
rban
ce
wavelength (nm)
0.0
0.1
0.2
0.3
0.4
260 310 360 410 460
abso
rban
ce
wavelength (nm)
0.0
0.1
0.2
0.3
0.4
260 310 360 410 460
abso
rban
ce
wavelength (nm)
0.0
0.1
0.2
0.3
0.4
260 310 360 410 460
abso
rban
ce
wavelength (nm)
A B
C D

85
After adjustment of total tocopherol and canolol contents to 700 µg/g and 200 µg/g oil, the
oxidative stability of the original oils, the HI fraction oil and the HI-EA fraction oil were
evaluated by storing at 104 oC. The changes in the PV of these oils during storage are shown
in Figure 4-5. The oxidative stability of oil sample L, its HI fraction and its HI-EA fractions
were comparable to each other. The oxidative stability of the HI fraction oil of sample O was
also comparable to them. The HI-EA fraction oil of sample O was slightly more stable.
Finally, the sample O was the most stable sample among all of them. Since the tocopherol
and canolol contents of all the samples were similar, the differences in the oxidative stability
among samples could not be linked with them. The differences in the oxidative stability of
sample O with its own HI-EA fraction could be attributed to the brown compounds, which
were not eluted with ethyl acetate and only eluted later in the MeOH fraction. On the other
hand, such compounds were limited in the sample L and hence its oxidative stability was
similar to its own HI-EA fraction. This observation supported the previous conclusion that
the brown reaction products were primarily responsible for the high oxidative stability of the
VS-group of mustard seed oil samples.
Figure 4-5. Changes in the PV of sample O ( ), it’s HI ( ) and HI-EA fraction
( ); sample L ( ), it’s HI ( ) and HI-EA fraction ( ) during storage
at 104 oC
0
5
10
15
20
25
30
0 10 20 30 40 50 60
PV
(meq
oxy
gen
/kg
oil)
Storage time (hr)

86
4.4 CONCLUSIONS
This study has highlighted the importance of phospholipids and Maillard type reaction
products on the oxidative stability of roasted crude mustard seed oil, in addition to the canolol
formed during seed roasting. Most of the previous studies in this field have mainly focused
only on the production of radical scavengers (e.g. canolol) during roasting. In contrast, when
sufficient amounts of radical scavengers are present, phospholipids and Maillard type
reaction products can effectively control oxidation at the radical initiation step to have a very
long induction period. This observation could have a wide range of possible applications in
the control of oil oxidation, which is one of the most important mechanisms for the chemical
deterioration of different foods.
In the next chapter, the effect of seed roasting on the oxidative stability of mustard and
rapeseed oil was explored further.

87
CHAPTER
5
SEED ROASTING INCREASES THE OXIDATIVE STABILITY OF
MUSTARD AND RAPESEED OILS IN A DIFFERENT MANNER -
AN EXPLORATORY STUDY

88
Relevant publication:
Shrestha, K., De Meulenaer, B. (2013). Effect of seed roasting in different Brassica species
(B. juncea, B. juncea var. oriental and B. napus). In preparation.

89
ABSTRACT
This study was carried out to evaluate the effect of seed roasting on the oil oxidative stability
of mustard (Brassica juncea and B. juncea var. oriental) and rapeseed (B. napus) varieties.
Rapeseed contained higher quantities of α-tocopherol and also generated around 3 to 5 times
more canolol after seed roasting compared to that in the mustard varieties, however, roasted
mustard seed oils were far more stable compared to roasted rapeseed oil. To evaluate the role
of canolol, the oxidative stability of roasted seed oil and unroasted seed oil added with
synthesized canolol (equivalent to the amounts formed during roasting) were compared with
each others. It was found that canolol formation during rapeseed roasting was an important
factor for increasing its oxidative stability. On the contrary, canolol could play only a limited
role in increasing the oxidative stability of the roasted mustard seed oils. Higher oxidative
stability of roasted mustard seed oils was mainly related to the presence of higher amounts of
lipophilic browning reaction products compared to that in roasted rapeseed oil. More
specifically, both the color development and the loss of reducing sugars indicated that
browning reactions were much more prominent in mustard varieties compared to that in
rapeseed. These observations showed that seed roasting increases the oxidative stability of
mustard and rapeseed oil in a different manner.
Keywords: 2,6-dimethoxy-4-vinylphenol (canolol), mustard, rapeseed, lipid oxidation, seed
roasting, phospholipids browning, Maillard type reactions

90
5.1 INTRODUCTION
Although a number of seed roasting experiments have been reported for RS (Koski et al.,
2003; Wijesundera et al., 2008) and mustard varieties (Vaidya & Choe, 2011a; Wijesundera
et al., 2008), a clear insight and in-depth understanding of how roasting improves oxidative
stability of these varieties are still lacking. For instance, all these studies consider Maillard
reactions to be partially responsible for increasing the oxidative stability of roasted seed oil;
however, none of them clearly demonstrates the occurrence of such reactions by evaluating
the loss of reducing sugars and amino acids, and by analyzing the browning reaction markers
in the roasted seed oil. Moreover, the formation of canolol and its contribution on the
oxidative stability has been completely ignored in roasting experiments carried out on high
erucic mustard seed oil (Vaidya & Choe, 2011a). Recently however, canolol formation
during roasting has also been confirmed in those varieties (Shrestha et al., 2012) as discussed
in Chapter 3. A correlation study considering the effect of all these different factors on the
oxidative stability of roasted mustard seed oil has been published recently (Shrestha,
Gemechu, & De Meulenaer, 2013) and has been discussed in Chapter 4. It has provided a
novel insight that the presence of radical scavengers (such as canolol and tocopherol) could
not solely explain the very high oxidative stability of roasted mustard seed oil. Such
observation was shown to be primarily linked with the phospholipid content and the presence
of lipophilic Maillard type browning reaction products, in addition to canolol that is formed
during roasting (Shrestha et al., 2013). However, that study was carried out on the oils
collected from the Nepalese market; and hence, it did not clearly demonstrate how such
antioxidative compounds were generated during seed roasting.
Therefore, the current study was carried out to evaluate the effect of seed roasting on the
oxidative stability of oil from two mustard varieties and one low erucic European rapeseed
(RS). Afterwards, the possible links of increased oxidative stability with other roasting effects
(such as Maillard reactions in the seed, changes in tocopherol, canolol and phospholipids
content and the development of browning reaction markers in the oil) were explored.

91
5.2 MATERIALS AND METHODS
5.2.1 Materials and Reagents
The seeds of two high erucic acid mustard varieties (Brassica juncea (BJ) and Brassica
juncea var. oriental (BJO)) and a low erucic RS variety (B. napus) were collected from the
local market of Ghent, Belgium. Tocopherol standard was obtained from DSM (New Jersey,
USA). Syringaldehyde and 1,2-dioleoyl-sn-glycero-3-phosphoethanolamine were purchased
from Sigma Aldrich (Steinheim, Germany). Nonadecanoic acid was purchased from Fluka
(Switzerland). The HPLC grade hexane was bought from VWR International (Leuven,
Belgium). Rapeseed lecithin was kindly provided by the laboratory of food technology and
engineering, Ghent University. Other reagents and solvents were of analytical grade and
obtained from reliable commercial sources.
5.2.2 Synthesis of canolol
Canolol was synthesized from syringaldehyde by condensation with malonic acid and then
double decarboxylation under microwave condition as described previously in Chapter 3
(section 3.2.5). The synthesized canolol was used as a standard for quantification.
5.2.3 Analytical methods
Fatty acid methyl esters were prepared using the boron trifluoride method (American Oil
Chemists Society, 1990) and were analyzed on a gas chromatograph using the method
described previously in Chapter 2 (section 2.2.2.1).
The analysis of the total amino acid profile of seed sample was carried out using the
previously described procedure (Kerkaert et al., 2012) and included a full hydrolysis of the
sample in acidic conditions and a liquid chromatographic analysis using fluorescence
detection after derivatization. Thus tryptophan and cysteine were lost and glutamine and
asparagine were converted to respectively glutamic and aspartic acid. Tryptophan was
separately analyzed after basic hydrolysis followed by similar chromatographic conditions.
The analysis of the free amino acid content was carried out after their extraction from the
ground seeds with 15% trichloroacetic acid followed by chromatographic analysis, without
acid hydrolysis.

92
Analysis of sugar content in the seed sample was carried out gas chromatographically after
aqueous extraction of the sugar and derivatization via oximation and silylation using the
previously described procedure (De Wilde et al., 2005).
Tocopherol and canolol content of the oils were analyzed in a high pressure liquid
chromatography using a fluorescence detector, after separation in a silica column as
described previously in Chapter 3 (section 3.2.6).
Peroxide value (PV) of oil was determined by using an iron based spectrophotometric method
(Shantha & Decker, 1994).
Phospholipids phosphorus content of oil was analyzed spectrophotometrically after the
formation of a phospholipids phosphorus-molybdate complex as described before in Chapter
4 (section 4.2.4.5).
Absorbance of the oil solution in iso-octane (25 mg/mL) was measured at 350 nm using a
Cary 50 UV/Vis spectrophotometer (Varian) in a quartz cuvette. Fluorescence (excitation at
350 nm and emission at 440 nm) of the oil solution was additionally measured using a
Spectramax Gemini XS fluorescence spectrophotometer as described previously in Chapter
4 (section 4.2.4.7).
5.2.4 Experimental setup
Mustard and rapeseed were roasted in a beaker, which was dipped inside an oil bath
maintained at 180 oC as reported earlier (Shrestha et al., 2012). Afterwards, the seeds were
ground, and the oil was extracted using petroleum ether (Shrestha et al., 2012). The extracted
oil (750 µL) was kept in a 1.5 mL HPLC glass vial and stored at 104 oC in order to facilitate
the autoxidation process. Oil oxidation was monitored by analyzing PV at different time
intervals. Both roasting and oxidation studies were carried out in independent triplicate
experiments.
5.2.5 Statistical analysis
All data are presented as mean values ± 95% confidence interval of mean based on three
independent experiments, unless otherwise stated. The logarithmic transformations of the

93
different data was done, whenever necessary, to have homoscedasticity before carrying out
the statistical analysis. ANOVA and post-hoc Tukey test were performed using TIBCO
Spotfire S+ 8.1 software. The significance level is p < 0.05, unless otherwise indicated.
5.3 RESULTS AND DISCUSSION
5.3.1 Oxidative stability of roasted seed oil of different varieties
The oxidative stability of unroasted seed oil and roasted seed oil was evaluated by monitoring
the changes in the PV (Figure 5-1). The oxidative stability of unroasted seed oils of all the
varieties was quite comparable. Roasting for 10 min significantly improved the oxidative
stability of all the varieties, while longer roasting time had a smaller additional effect.
Roasted seed oil from mustard varieties (BJ and BJO) showed stronger oxidative stability
compared to that from RS.
The fatty acid compositions of all the oils are given in Table 5-1. Both mustard varieties
were rich in erucic acid, while the RS was rich in oleic acid. However, total saturated,
monounsaturated and polyunsaturated fatty acids content were comparable in all the varieties.
Thus, it is unlikely that the minor differences in the degree of unsaturation can be responsible
for the large differences in oxidative stability among different varieties.
Table 5-1. Fatty acids composition of oil (g/100 g oil) from different mustard and
rapeseed varieties
Fatty acid BJ BJO RS
16:0 2.6 2.5 4.4
16:1 0.1 0.1 0.2
18:0 1.1 1.3 1.1
18:1 17.8 18.8 53.9
18:2 18.1 19.0 19.8
20:0 1.1 1.2 1.1
20:1 8.4 8.2 0.3
18:3 15.4 13.9 9.7
20:2 1.0 0.9 n. d.
22:0 0.2 0.3 n. d.
22:1 20.6 21.3 n. d.
24:1 1.2 1.2 n. d.
n. d. = not detected

94
Figure 5-1. Changes in the PV of unroasted seed oil, roasted seed oil and canolol added unroasted seed oil of different varieties stored at
104 oC ( 0 h, 9 h, 32 h and 98 h)
0
5
10
15
20
25
30
35
40
45
50
BJ_
un
roas
ted
BJ_
un
roas
ted
+ c
ano
lol 3
00
µg/
g
BJ_
roas
ted
10
min
BJ_
roas
ted
20
min
BJ_
roas
ted
30
min
BJ_
roas
ted
45
min
BJ_
roas
ted
60
min
BJ_
roas
ted
90
min
BJO
_un
roas
ted
BJO
_un
roas
ted
+ c
ano
lol 1
70 µ
g/g
BJO
_ro
aste
d 1
0 m
in
BJO
_ro
aste
d 2
0 m
in
BJO
_ro
aste
d 3
0 m
in
BJO
_ro
aste
d 4
5 m
in
BJO
_ro
aste
d 6
0 m
in
BJO
_ro
aste
d 9
0 m
in
RS_
un
roas
ted
RS_
un
roas
ted
+ c
ano
lol 3
00
µg/
g
RS_
un
roas
ted
+ c
ano
lol 8
00
µg/
g
RS_
roas
ted
10
min
RS_
roas
ted
20
min
RS_
roas
ted
30
min
RS_
roas
ted
45
min
RS_
roas
ted
60
min
RS_
roas
ted
90
min
Per
oxi
de
valu
e (m
eq o
xyge
n/k
g o
il)

95
Roasting of seeds before oil extraction increased the canolol content of oil in all the varieties
(Table 5-2). The maximum canolol content of oil was reached during 10 to 20 min of seed
roasting. Oil from 20 min roasted RS contained the highest amount of canolol, which was 2.8
times higher compared to BJ seed oil and 4.9 times higher compared to BJO seed oil, roasted
for same time. Higher canolol formation in roasted RS compared to different mustard seed
varieties was also reported previously (Shrestha et al., 2012). Roasting for more than 20 min
gradually reduced the canolol content in all the varieties.
Addition of canolol to the unroasted seed oil (equivalent to the amount found in the oil after
10 min of roasting) increased the induction period in all the varieties (Figure 5-1). However,
canolol added unroasted seed oil got oxidized considerably faster than the corresponding 10
min roasted seed oils. Unroasted RS oil, to which 300 µg canolol/g oil was added (equivalent
to the amounts of canolol in 10 min roasted seed oil of BJ) was less stable than RS oil, to
which 800 µg canolol/g oil was added (equivalent to the amounts of canolol in RS roasted for
10 min). These observations indicated that canolol formation alone could not sufficiently
explain the increased oxidative stability of the roasted seed oil. Moreover, it raised the
question, why roasted mustard seed oil (BJ and BJO) became more stable compared to
roasted RS oil, even producing far lower amounts of canolol. These observations suggested
that seed roasting could increase the oxidative stability of mustard and RS oil in a different
manner. Those differences were further explored in this study and have been discussed below
sequentially.
The tocopherol content of the unroasted and roasted seed oil of different varieties is given in
Table 5-2. The α-tocopherol content in the unroasted RS oil was more than double the
amount present in both unroasted mustard seed oils. It remained stable during RS roasting,
while a significant gradual degradation was observed for both BJ and BJO mustard varieties.
The γ-tocopherol content in all the three varieties was quite comparable. Its degradation was
observed in all the varieties during 10 min of roasting. Afterwards, it remained constant in RS,
while slight degradation was observed during BJO roasting. The BJ seed oil showed a
gradual and the largest degradation in γ-tocopherol during longer roasting. These changes in
the tocopherol content after seed roasting could not explain the increased oxidative stability
of the roasted seed oil. The plastochromanol-8 content remained relatively stable in the BJ
seed oil during roasting. On the other hand, a significant increment was observed in the BJO

96
and RS oil during the first 10 min of roasting. The disruption of matrix during roasting could
be responsible for the increased extractability. Longer roasting time had little effect in all the
varieties studied.
The phospholipids phosphorus content of the unroasted seed oils, extracted using petroleum
ether, was in the range of 8 to 30 ppm (Table 5-2). On the other hand, when the same
unroasted seed powder was extracted with a chloroform/methanol solvent mixture (2:1, v/v);
the extracted oil contained 500 to 600 ppm of phospholipids phosphorus. Therefore, the
lower phospholipids content of unroasted seed oil was due to the poor extractability with
petroleum ether from the unroasted seed matrix. Roasting for 10 min significantly increased
the oil phospholipids content for all the varieties. This observation was similar to the
increased extractability of plastochromanol-8 after seed roasting. Roasting longer than 10 min
showed a gradual decrease in the phospholipids phosphorus content in the oil of all the
varieties. The decrease in extractability could indicate its chemical modifications, for instance,
they could be covalently bound to matrix compounds.
To evaluate the possible role of increased phospholipids extraction and canolol formation in
increasing the oxidative stability during seed roasting, an experiment was carried out using
the unroasted RS oil. Canolol was added equivalent to 10 min roasted RS (800 µg/g oil) in all
the treatments except the control. In addition, RS lecithin (containing 20.36 mg phospholipids
phosphorus/g lecithin) was added at 0.12, 0.6, 1.2, and 6% to the canolol enriched unroasted
RS oil (800 µg/g oil). The oxidative stability of those oils was monitored together with the 10
min roasted BJ seed oil for comparison. Canolol addition to unroasted RS oil significantly
improved its oxidative stability (Figure 5-2A); however, it was far less stable compared to
the 10 min roasted BJ seed oil. The oxidative stability of the unroasted RS oil increased with
the sequential addition of lecithin (Figure 5-2A and B). Applying an exponential relation
between PV after 67.5 h and the phospholipids content (Figure 5-2B), it was estimated that
687 ppm of phospholipids phosphorus would be necessary to have a stability similar to 10
min roasted BJ seed oil. The 10 min roasted BJ seed oil only contained 298 ppm of canolol,
387 ppm tocopherol (together with plastochromanol-8) and 454 ppm of phospholipids
phosphorus. On the other hand, 687 ppm of phospholipids phosphorus in addition to 800 ppm
of canolol and 491 ppm of tocopherol (together with plastochromanol-8) seemed to be
necessary in the unroasted RS oil to have a similar oxidative stability. Therefore, neither the

97
canolol content nor phospholipids extraction could completely explain the high oxidative
stability of 10 min roasted BJ seed oil. The observed discrepancy could be due to the
additional role of antioxidative activity of browning reaction products formed during seed
roasting.
5.3.2 Role of browning reactions on the oxidative stability
Maillard reaction is one of the most well known nonenzymatic browning reactions in heat
treated food products. The possibility for such reactions during seed roasting was studied by
evaluating the changes in the amino acid and reducing sugar content. Among the free amino
acids, RS contained a significantly higher quantity of glutamate, histidine, alanine, valine,
isoleucine and lysine compared to both BJ and BJO mustard varieties (Table 5-3). On the
other hand, both BJ and BJO mustard varieties contained significantly higher quantity of free
arginine compared to RS. After 10 min of roasting, more than 85% of free amino acids were
lost, confirming the occurrence of Maillard reaction in all the varieties. The loss of individual
amino acid was quite comparable in all the varieties. Therefore, the formation of low
molecular weight antioxidative compounds from such reactions could also be comparable
among those varieties. On the other hand, the total amino acids content (in fat free dry matter
(FFDM) basis) was higher in mustard varieties compared to that in RS (Table 5-4). The
mustard varieties contained 30 to 40% higher arginine and 14 to 16% higher lysine compared
to that in RS. Because of the presence of free amino group, these amino acids are particularly
responsible for the Maillard reactions involving proteins. The formation of high molecular
weight antioxidative compounds from such reactions could be much more pronounced in
mustard varieties compared to that in RS.

98
Table 5-2. Effect of seed roasting on different compositional parameters and browning reaction markers of extracted oil
variety roasting
time (min)
canolol
(µg/g oil)
α-tocopherol
(µg/g oil)
γ-tocopherol
(µg/g oil)
plastochromanol-
8 (µg/g oil)
phospholipids
phosphorus (ppm)
absorbance
(350 nm) fluorescence1
BJ unroasted 5.41 ± 0.01a 89.56 ± 2.39def 290.34 ± 2.36hi 39.59 ± 1.43hij 8.66 ± 1.81a 0.03 ± 0.01a 3.65 ± 0.19a
BJ 10 297.76 ± 6.26e 80.57 ± 0.99cde 266.84 ± 2.16efg 39.15 ± 0.81hi 453.62 ± 51.65k 0.56 ± 0.03ghi 64.43 ± 1.34efg
BJ 20 301.19 ± 5.31e 76.92 ± 2.02cd 244.61 ± 17.93d 38.16 ± 4.20hi 319.23 ± 46.62ijk 0.91 ± 0.13k 56.71 ± 3.54de
BJ 30 255.31 ± 5.93d 71.58 ± 1.89bc 224.28 ± 3.79c 36.63 ± 0.22gh 175.54 ± 49.39efgh 0.63 ± 0.02hij 57.76 ± 3.19de
BJ 45 234.56 ± 9.14d 61.41 ± 5.57b 221.74 ± 1.44c 36.77 ± 0.69hi 133.52 ± 35.91def 0.63 ± 0.10hij 64.57 ± 2.72efg
BJ 60 181.82 ± 0.63c 22.49 ± 1.81a 200.09 ± 1.19b 36.89 ± 0.60hi 110.72 ± 30.13de 0.70 ± 0.03ij 71.34 ± 0.72fghi
BJ 90 146.84 ± 12.39b 12.96 ± 5.08a 177.95 ± 11.47a 32.99 ± 1.93fg 117.74 ± 5.62def 0.69 ± 0.01ij 78.00 ± 2.73ij
BJO unroasted 5.06 ± 0.15a 97.99 ± 0.82f 358.49 ± 4.97j 9.26 ± 0.25b 15.66 ± 3.72b 0.03 ± 0.01a 3.51 ± 0.09a
BJO 10 171.64 ± 3.20bc 89.72 ± 4.69ef 295.40 ± 10.29i 26.71 ± 0.88c 342.57 ± 31.71jk 0.26 ± 0.03bc 42.72 ± 3.02c
BJO 20 174.32 ± 4.02bc 87.30 ± 1.19def 293.50 ± 1.57i 27.61 ± 0.31cd 271.75 ± 21.58hijk 0.39 ± 0.02cdef 43.62 ± 1.61c
BJO 30 163.20 ± 1.25bc 86.86 ± 0.58def 291.26 ± 4.59hi 29.50 ± 1.30cdef 198.72 ± 21.46fghi 0.52 ± 0.01fgh 55.31 ± 1.87d
BJO 45 154.23 ± 1.79bc 85.65 ± 1.42def 288.36 ± 4.23hi 29.10 ± 1.13cde 167.58 ± 46.28efgh 0.65 ± 0.00hij 67.41 ± 0.68fgh
BJO 60 157.98 ± 2.82bc 85.42 ± 0.81de 288.22 ± 2.06hi 31.10 ± 0.14def 128.29 ± 5.95def 0.67 ± 0.00ij 75.07 ± 2.51hi
BJO 90 146.70 ± 0.49b 76.61 ± 3.22cd 283.36 ± 2.45ghi 31.70 ± 0.80ef 137.81 ± 41.53defg 0.77 ± 0.09jk 85.32 ± 1.73j
RS unroasted 5.19 ± 0.09a 214.89 ± 4.33g 274.15 ± 3.81fgh 1.80 ± 0.09a 30.45 ± 9.38c 0.04 ± 0.01a 12.71 ± 0.28b
RS 10 808.48 ± 24.67i 218.93 ± 14.31gh 255.05 ± 14.61de 40.29 ± 2.42ij 224.15 ± 11.16ghij 0.23 ± 0.09b 68.90 ± 5.18fgh
RS 20 847.13 ± 22.30j 222.79 ± 5.62gh 258.10 ± 5.30def 43.73 ± 0.77jk 164.66 ± 19.28efgh 0.27 ± 0.02bcd 71.03 ± 1.17fghi
RS 30 809.06 ± 4.22i 224.49 ± 2.47gh 260.62 ± 2.85def 46.26 ± 0.98kl 188.26 ± 47.47fgh 0.45 ± 0.08efg 68.96 ± 1.74fgh
RS 45 760.45 ± 31.19h 229.81 ± 3.20h 261.48 ± 2.61def 48.01 ± 1.02l 151.87 ± 12.68efg 0.41 ± 0.02defg 67.97 ± 0.71fgh
RS 60 708.26 ± 15.97g 225.77 ± 4.96gh 257.19 ± 4.42de 46.37 ± 0.58kl 147.60 ± 39.54defg 0.32 ± 0.11bcde 63.54 ± 9.07def
RS 90 650.17 ± 13.83f 227.06 ± 4.60gh 257.06 ± 5.65de 47.06 ± 1.14kl 88.12 ± 4.96d 0.36 ± 0.08bcde 72.17 ± 3.00ghi
1 expressed as % of fluorescence of quinine sulphate solution (1 μM in 0.1 M H2SO4)
Values with different superscripts in a same column are significantly different (p < 0.05)

99
Figure 5-2. (A) Changes in the PV of different oil samples during storage at 104 oC [unroasted RS oil ( ), canolol (800 µg/g) + lecithin
( 0.0%, 0.12%, 0.6%, 1.2% and 6%) added unroasted RS oils and 10 min roasted BJ seed oil ( )]; (B) Semi-
logarithmic plot between PV (after 67.5 h storage) and phospholipids phosphorus content (ppm) of canolol and lecithin added unroasted
RS oils
0
5
10
15
20
25
30
35
40
45
0 10 20 30 40 50 60 70 80
PV
(meq
oxy
gen
/kg
oil)
storage time (h)
y = 26.296e-0.002x
R² = 0.9991
1
10
100
0 200 400 600 800 1000 1200 1400
PV
aft
er 6
7.5
h
phospholipid phosphorus content (ppm)
A B

100
Table 5-3. Free amino acids content (mg/100 g FFDM) of seeds before and after 10 min of roasting of different varieties
Amino acids BJ
(unroasted)
BJO
(unroasted)
RS
(unroasted)
BJ
(roasted 10 min)
BJO
(roasted 10 min)
RS
(roasted 10 min)
Aspartate 51.72 ± 1.12d 92.18 ± 0.32
f 85.81 ± 1.74
e 10.23 ± 1.95
a 17.91 ± 0.93
b 25.96 ± 3.06
c
Glutamate 269.00 ± 3.35b 259.75 ± 4.49
b 304.92 ± 8.12
c 15.11 ± 2.81
a 13.93 ± 0.64
a 23.19 ± 3.82
a
Asparagine 175.12 ± 1.93e 100.69 ± 0.56
c 145.21 ± 4.04
d 17.76 ± 3.26
b 10.11 ± 0.68
a 21.64 ± 3.09
b
Serine 19.75 ± 1.34c 42.58 ± 3.55
d 15.34 ± 2.95
c 4.46 ± 0.88
ab 8.88 ± 0.09
b 2.96 ± 0.32
a
Glutamine 6.99 ± 0.16b 1.92 ± 3.75
a 7.54 ± 0.78
b 0.43 ± 0.07
a 0.36 ± 0.00
a 0.48 ± 0.15
a
Histidine 8.20 ± 0.25b 9.52 ± 0.64
c 12.13 ± 0.47
d 1.59 ± 0.39
a 1.56 ± 0.14
a 1.58 ± 0.07
a
Glycine 6.35 ± 1.56bc
12.23 ± 2.50d 10.17 ± 2.56
cd 1.90 ± 0.37
a 2.99 ± 0.02
ab 3.04 ± 0.18
ab
Threonine 5.68 ± 0.15b 8.90 ± 0.46
d 6.80 ± 0.32
c 0.91 ± 0.16
a 1.25 ± 0.05
a 1.34 ± 0.19
a
Arginine 28.11 ± 0.18d 26.46 ± 0.16
c 22.34 ± 0.65
b 5.43 ± 1.03
a 4.14 ± 0.30
a 5.14 ± 0.65
a
Alanine 7.08 ± 0.41b 15.82 ± 1.10
c 25.16 ± 0.63
d 2.74 ± 0.50
a 4.28 ± 0.29
a 8.65 ± 0.79
b
Tyrosine 4.33 ± 0.08a 5.61 ± 0.32
b 5.84 ± 0.45
b n. d. n. d. n. d.
Valine 7.82 ± 0.22b 9.01 ± 0.54
c 11.73 ±0.61
d 0.57 ± 0.11
a 0.84 ± 0.05
a 1.39 ± 0.30
a
Methionine 1.62 ± 1.59a 1.61 ± 1.57
a 0.64 ± 1.26
a 0.93 ± 0.11
a 1.17 ± 0.06
a 0.90 ± 0.00
a
Tryptophan 8.38 ± 0.23b 15.71 ± 0.39
c 7.73 ± 0.57
b 0.65 ± 0.16
a 1.08 ± 0.14
a 1.08 ± 0.14
a
Phenylalanine 8.71 ± 0.06c 15.46 ± 0.37
d 8.49 ± 0.43
c 1.83 ± 0.23
a 2.58 ± 0.14
b 2.26 ± 0.04
ab
Isoleucine 3.08 ± 0.09c 4.14 ± 0.23
d 4.84 ± 0.22
e 0.14 ± 0.14
a 0.24 ± 0.02
ab 0.58 ± 0.10
b
Leucine 2.66 ± 0.19b 5.00 ± 0.35
d 3.48 ± 0.53
c 0.08 ± 0.15
a 0.51 ± 0.04
a 0.45 ± 0.07
a
Lysine 6.99 ± 0.32c 8.96 ± 0.35
d 11.51 ± 1.10
e 1.38 ± 0.21
a 1.24 ± 0.09
a 3.42 ± 0.58
b
Proline 3.47 ± 1.67a 8.13 ± 0.21
b 8.46 ± 0.32
b 2.40 ± 0.27
a 2.83 ± 0.40
a 2.22 ± 0.36
a
Total 625.07 ± 8.77c 643.66 ± 10.26
c 698.14±15.31
d 68.55 ± 12.03
a 75.90 ± 2.54
a 106.28 ± 13.13
b
n. d. = not detected
Values with different superscripts in a same row are significantly different (p < 0.05)

101
Table 5-4. Total amino acids content (g/100 g FFDM) of unroasted seeds of different
varieties
Amino acids BJ BJO RS
Aspartate 2.21 ± 0.04c
2.07 ± 0.03b
1.98 ± 0.03a
Glutamate 6.39 ± 0.10c
5.96 ± 0.05b
4.73 ± 0.06a
Serine 1.61 ± 0.05c
1.51 ± 0.04b
1.30 ± 0.02a
Histidine 1.19 ± 0.02c
1.09 ± 0.02b
0.86 ± 0.02a
Glycine 2.06 ± 0.04c
1.94 ± 0.03b
1.66 ± 0.03a
Threonine 1.68 ± 0.02c
1.59 ± 0.02b
1.45 ± 0.02a
Arginine 2.77 ± 0.04c
2.59 ± 0.04b
1.94 ± 0.03a
Alanine 1.67 ± 0.03c
1.57 ± 0.01b
1.38 ± 0.02a
Tyrosine 1.17 ± 0.03c
1.08 ± 0.02b
1.00 ± 0.02a
Valine 1.84 ± 0.03b
1.86 ± 0.02b
1.61 ± 0.03a
Methionine 0.55 ± 0.02b
0.57 ± 0.05b
0.46 ± 0.01a
Tryptophan 0.43 ± 0.03ab
0.45 ± 0.03b
0.37 ± 0.04a
Phenylalanine 1.68 ± 0.04b
1.61 ± 0.04b
1.32 ± 0.04a
Isoleucine 1.69 ± 0.03c
1.60 ± 0.02b
1.37 ± 0.03a
Leucine 2.71 ± 0.05c
2.58 ± 0.05b
2.18 ± 0.04a
Lysine 2.25 ± 0.08b
2.21 ± 0.07b
1.94 ± 0.06a
Proline 2.72 ± 0.03c
2.57 ± 0.04b
2.05 ± 0.03a
Total 34.62 ± 0.59c
32.85 ± 0.49b
27.60 ± 0.47a
Values with different superscripts in a same row are significantly different (p < 0.05)
The effect of seed roasting on the sugar content was additionally evaluated in all varieties
(Table 5-5). Both mustard varieties contained significantly higher quantity of glucose and
lower quantity of sucrose compared to RS before roasting. The fructose content of BJ
mustard seed was also higher compared to both BJO seed and RS. After 10 min of roasting,
the glucose content decreased significantly in all the varieties compared to the amount
present in the unroasted seed. The loss of glucose was around 4 times higher in both mustard
varieties compared to that in rapeseed. Moreover, the sucrose content of both mustard
varieties also decreased significantly, likely due to its hydrolysis into glucose and fructose.
The increase in sucrose content in rapeseed after seed roasting could possibly be due to
hydrolysis of stachyose and raffinose present in the matrix (Shahidi, 1990).

102
Table 5-5. Changes in the sugar composition (mg/g FFDM) in the seed after 10 min of
roasting of different varieties
Varieties roasting time (min) fructose glucose sucrose
BJ unroasted 6.70 ± 0.29d 46.60 ± 1.92
c 51.70 ± 1.62
b
BJO unroasted 3.80 ± 0.18b 48.56 ± 2.58
c 62.77 ± 1.37
c
RS unroasted 3.94 ± 0.27b 12.43 ± 0.94
b 70.42 ± 2.27
d
BJ 10 5.99 ± 0.22cd
3.51 ± 0.12a 33.37 ± 2.85
a
BJO 10 5.16 ± 0.84c 4.49 ± 0.48
a 48.95 ± 3.04
b
RS 10 1.07 ± 0.03a 1.44 ± 0.25
a 84.74 ± 5.15
e
Values with different superscripts in a same column are significantly different (p < 0.05)
The ground seed meal of different varieties before and after 20 min roasting has been shown
in Figure 5-3. This picture illustrates that browning reactions during roasting were much
more pronounced in mustard varieties compared to that in RS. This could be linked with the
presence of higher quantities of both reducing sugars and reactive amino acids (e.g. lysine,
arginine) in mustard varieties compared to that in RS.
Figure 5-3. Mustard (BJ and BJO) and rapeseed meal before and after 20 min of
roasting
B. juncea meal B. juncea var. oriental meal Rapeseed meal
unroasted unroasted unroasted
20 min roasted 20 min roasted 20 min roasted

103
In addition to amino acids, the amino group containing phospholipids (e.g. PE) are also
known to take part in the Maillard type browning reactions with reducing sugars (Zamora et
al., 2011). Both types of browning reactions could be expected to happen simultaneously in
the seed however, their extraction in the oil could be affected by their polarity differences. In
a previous study, it was shown that the amino group of PE was even more reactive with
ribose than that of lysine (Zamora et al., 2005). These authors reported that, when the
aqueous reaction mixture of PE, ribose and lysine was extracted with chloroform/methanol
(2:1, v/v) to have phase separation, the brown compounds due to PE/ribose and lysine/ribose
got separated into the organic and aqueous phase, respectively (Zamora et al., 2005). These
observations showed that the lysine/ribose Maillard reaction products are more hydrophilic,
while the PE/ribose reaction system could produce lipophilic Maillard type reaction products.
The same extraction method was used to characterize the brown compounds in the roasted
seed oil. It was observed that the major brown compounds remained in the organic phase
indicating that these brown compounds could be mainly due to phospholipids browning
compared to the reducing sugar amino acid Maillard reactions. The possibility of such
phospholipids browning reaction products was also reported previously based on the high
correlation observed between the phospholipids content, absorbance, fluorescence and the
pyrrolized phospholipids content in roasted mustard seed oil (Shrestha et al., 2013).
The changes in the browning reaction markers in the oil after seed roasting of different
varieties were further evaluated (Table 5-2). The absorbance of oil at 350 nm gradually
increased during roasting in all the varieties. The choice of this marker is based on the recent
report that oxidative stability of the roasted mustard seed oil is highly correlated at this
wavelength (Shrestha et al., 2013). The BJ seed oil showed the highest increment in the
absorbance and reached a maximum after 20 min of roasting, which was more than 3 times
compared to that of RS oil and more than 2 times compared to BJO seed oil, roasted for the
same time. After 45 min of roasting, the absorbance values of all the varieties remained
almost constant. The absorbance value after 45 min was comparable between BJ and BJO
seed oil, and was around double the amount compared to that of RS oil. The roasted BJ and
BJO seed oil were also much browner compared to the roasted RS oil. In addition, roasting
increased the oil fluorescence (excitation 350 nm and emission 440 nm) in all the varieties
(Table 5-2). However, fluorescence development was comparable in all the varieties and
could not differentiate the extent of browning observed with the absorbance at 350 nm.

104
5.4 CONCLUSIONS
In this way, roasting of both mustard and RS varieties improved the oxidative stability,
increased the canolol and phospholipids content, induced different Maillard type browning
reactions in the seed matrix and resulted into the extraction of lipophilic browning reactions
products in the oil. However, a clear difference was observed in the manner seed roasting
increased the oxidative stability between mustard and RS varieties. RS can produce 3 to 5
times higher canolol content in the seed matrix during roasting compared to BJ and BJO seed
(Shrestha et al., 2012) resulting into a higher canolol content in the roasted seed oil. Addition
of canolol in the unroasted RS oil equivalent to that observed in 10 min roasted RS oil
significantly improved its‟ oxidative stability comparable to that of roasted RS oil. This
confirms the important role of canolol in increasing the oxidative stability of roasted RS oil
as reported earlier (Wijesundera et al., 2008; Wakamatsu et al., 2005; Koski et al., 2003). The
small difference in stability observed between roasted RS oil and canolol added unroasted RS
oil could be attributed to the additional effect of roasting on phospholipids extraction and
browning reactions. As discussed earlier, browning reactions were less prominent during RS
roasting compared to that in mustard varieties and hence its effect in improving the oxidative
stability of RS oil was relatively small. On the other hand, even though canolol formation
was much lower in mustard varieties, roasting improved its oxidative stability far better than
that in RS oil. Moreover, addition of canolol to unroasted mustard seed oil equivalent to the
amount formed during roasting could not increase its oxidative stability closer to that of
roasted mustard seed oil. This demonstrates the relatively small role of canolol in protecting
the roasted mustard seed oil from oxidation. In particular, phospholipids and lipophilic
browning reactions products were primarily responsible for the high oxidative stability of
roasted mustard seed oil, which is also supported by recently published results (Shrestha et al.,
2013). In this way, we can conclude that seed roasting improves the oxidative stability of RS
and high erucic mustard varieties in a quite different manner.
In the next chapter, antioxidant potential of the Maillard type reaction products of
phosphatidylethanolamine was studied. The chemistry of such reactions was also investigated.

105
CHAPTER
6
ANTIOXIDANT ACTIVITY OF MAILLARD TYPE REACTION
PRODUCTS BETWEEN PHOSPHATIDYLETHANOLAMINE AND
GLUCOSE

106
Relevant publication:
Shrestha, K., De Meulenaer, B. (2013). Antioxidant activity of Maillard type reaction
products between phosphatidylethanolamine and glucose. Submitted for publication.

107
ABSTRACT
Phosphatidylethanolamine and glucose were added to the degummed mustard seed oil (at the
concentration of 20.16 µmol/g oil) to make four types of oil mixtures: blank oil (O), glucose
added oil (OG), phosphatidylethanolamine added oil (OP), and both
phosphatidylethanolamine and glucose added oil (OPG). These oils were heated at 160 oC for
10 min. The heated OPG oil showed Maillard type reactions characterized by increase in the
absorbance (maximum at 280 and 350 nm) and fluorescence (excitation 350 nm, emission
440 nm). The heated OP oil also showed marked increase in the fluorescence due to Maillard
type reactions with carbonyl compounds present in the oil. During oil incubation (both at 40
oC and 104
oC), the heated OP and OPG oils showed the highest oxidative stability. In
addition, the degradation of tocols in these oils was only 16-17% (72 h at 104 oC) and 7-20%
(53 days at 40 oC), while that in other oil mixtures (O and OG) were 56-65% (within 24 h at
104 oC) and 20-57% (within 19 days at 40
oC). This showed that Maillard type reaction
products of phosphatidylethanolamine could possess potent antioxidant activity. Furthermore,
some of the reaction products such as Amadori product, phosphatidylethanolamine-linked
pyrrolecarbaldehyde and 2,3-dihydro-1H-imidazo[1,2-α]pyridine-4-ylium derivatives were
identified using LC-TOF MS analysis.
Keywords: lipid oxidation, phospholipids browning, Maillard type reactions, antioxidant,
2,3-dihydro-1H-imidazo[1,2-α]pyridine-4-ylium derivatives, LC-TOF MS

108
6.1 INTRODUCTION
Maillard reactions between amino acids and reducing sugars are one of the most well known
reactions in heat treated food products. In addition to the formation of aroma, taste and color,
these reactions are also known to form natural antioxidants (Manzocco et al., 2000). Maillard
reactions have been frequently linked to the increased oxidative stability of different roasted
seed oils (Wijesundera et al., 2008; Cai et al., 2013; Chandrasekara & Shahidi, 2011). Apart
from amino acids and proteins, amino group containing phospholipids (such as
phosphatidylethanolamine) are also known to take part in the Maillard type browning
reactions (Figure 6-1) (Lederer & Baumann, 2000; Zamora et al., 2005; Zamora et al., 2011).
The amino group of phosphatidylethanolamine 1 can react with glucose to form
glycosylamine 2, which can undergo an Amadori rearrangement via the aminoenol 3, into the
aminoketose 4. These reactions proceed further to form reactive dicarbonyl compounds (such
as 3-deoxyglucosone 5) as the key intermediates. The phospholipid-linked
pyrrolecarbaldehyde 6 is formed from 5 after enolization, dehydration and subsequent
addition of an amine on the 5th
carbon of the carbohydrate chain (Lederer & Baumann, 2000).
These compounds are some of the known intermediates of the vast array of reaction products
which are prone to repeated aldol-type condensation and pyrrole polymerization reactions
giving rise to brown, fluorescent polymeric compounds similar to the Maillard reaction
products from amino acids and reducing sugars (Zamora & Hidalgo, 2005; Zamora et al.,
2004; Zamora & Hidalgo, 2003; Zamora et al., 2011). It has been shown that the reaction
products between phosphatidylethanolamine and reducing sugars are lipophilic and have free
radical scavenging activity (Zamora et al., 2011). Although phospholipids are commonly
present in different foods, the possibility of occurrence of such reactions and their impact on
the sensorial, nutritional and functional properties of food have been given little attention.
Previously, we carried out different experiments to elucidate the oxidative stability of roasted
mustard seed oil. A potent radical scavenger canolol (2,6-dimethoxy-4-vinyl phenol) was
isolated from the roasted mustard seed oil as discussed in Chapter 3 (Shrestha et al., 2012).
However, its role in the oxidative stability of roasted mustard seed oil was found to be very
limited, based on the observations done in Chapter 4 (Shrestha et al., 2013) and Chapter 5.
More specifically, the addition of the synthesized canolol in the unroasted mustard seed oil
(equivalent to the amounts present in roasted seed oil) did not improve the oxidative stability

109
similar to that of roasted seed oil (Chapter 5). On the other hand, the oxidative stability of
roasted mustard seed oil decreased dramatically after removing the browning reaction
products from the oil, even while maintaining the same levels of canolol (Chapter 4)
(Shrestha et al., 2013). In fact, the oxidative stability of roasted mustard seed oil was found to
be highly correlated with phospholipids and browning reaction markers (Chapter 4)
(Shrestha et al., 2013). Such lipophilic browning reactions products have been suggested to
be formed during Maillard type reactions involving phosphatidylethanolamine (Zamora et al.,
2011). However, the chemistry behind such reactions and their antioxidative potential to
protect roasted seed oil from oxidation is not clearly understood.
1
R NH2
R N
O
OH
HOH
-H2O
+ RNH2 -H
2O
R N
O
OH
H
-H2O
OPO
R'OO
OH
R''O
CH2
R =
R' and R'' are fatty acid moieties
O
OH
HH
H
OH
OH
H OH
H
OH
O
NH
HH
H
OH
OH
H OH
H
OH
R+
-H2O
2
5
6
-H2O +H
2O -RNH
2
3
4
For phosphatidyl ethanolamine 1
N
OH
OH
OH
OH
OH
R
NH
OH
OH
OH
OH
OH
R
NH
OH
O
OH
OH
OH
R
NH
OH
OH
OH
OH
OH
RN
OH
OH
OH
OH
R
NH
OH
OH
OH
OH
OH
R
OH
OH
OH
OH
O
H
OH
O
OH
OH
O
H
OH
O
OH
O
H
OH
OH
OH
O
H
OH
OH
OH
OH
NHR OH
OH
O
NH
R
H
OH
O
O
NH
R
H
Figure 6-1. The reaction pathway for the formation of 1-alkyl-5-(hydroxymethyl)-1H-
pyrrole-2-carbaldehyde (6) from the reaction of D-glucose with primary amine 1 via

110
glycosylamine 2, aminoenol 3, 1-amino-1-deoxy-2-ketose 4 (Amadori product), and 3-
deoxyglucosone 5 (adapted from Lederer and Baumann, 2000)
The current study was carried out to evaluate the antioxidative potential of the Maillard type
reaction products between phosphatidylethanolamine and glucose. In addition, the
identification of some of the reaction products was carried out using a liquid
chromatography-time-of-flight mass spectrometry (LC-TOF MS) to better understand the
chemistry of the reaction.
6.2 MATERIALS AND METHODS
6.2.1 Materials and Reagents
The mustard seeds (B. juncea (BJ)) were collected from the local market in Ghent, Belgium.
Tocopherol standard was obtained from DSM (New Jersey, USA). Syringaldehyde and 1,2-
dioleoyl-sn-glycero-3-phosphoethanolamine (PE) were purchased from Sigma Aldrich
(Steinheim, Germany). HPLC grade hexane was bought from VWR International (Leuven,
Belgium). Other reagents and solvents were of analytical grade and obtained from reliable
commercial sources.
6.2.2 Analytical methods
6.2.2.1 Analysis of tocopherol and plastochromanol-8
The tocopherol and plastochromanol-8 content of the oil samples were analyzed on an
Agilent 1100 series high pressure liquid chromatography (USA) using a fluorescence detector,
after separation in a normal phase column as described in Chapter 3 (section 3.2.6). The
relative standard deviations (RSD) of all these analyses were below 7%.
6.2.2.2 Peroxide value
The peroxide value (PV) was determined using an iron based spectrophotometric method as
described previously (Shantha & Decker, 1994). The calibration was done using a standard
ferric chloride solution as described in the procedure.

111
6.2.2.3 Absorbance and fluorescence measurement
The absorbance spectra (in the wavelength range of 200 to 500 nm) of the oil sample in iso-
octane (2.5 mg/mL) were measured using a Cary 50 UV/Vis spectrophotometer (Varian,
Australia) in a quartz cuvette. In addition, 300 µL of the same solution was kept in a 96 well
plate and the fluorescence (excitation at 350 nm and emission at 440 nm) was measured using
a Spectramax Gemini XS microplate fluorometer (Molecular devices, USA). The value was
expressed as the percentage of fluorescence of a quinine sulphate solution (0.1 µM in 0.1 M
H2SO4) (Shrestha et al., 2013).
6.2.2.4 Liquid chromatography-time of flight mass spectrometry (LC-TOF MS)
The LC-TOF MS analysis was carried out using an UltiMate 3000 UHPLC (Dionex)
equipped with a degasser, four solvent delivery modules, an autosampler, a column oven and
a UV detector coupled with MicroTOF MS instrument (Bruker). The separation of the
compounds was carried out using a Zorbax hilic plus 2.1 × 100 mm, 1.8 µ column (Agilent,
USA). Mobile phase A was pure acetonitrile and mobile phase B was 0.02 M ammonium
acetate in water (pH 6.2). The method was run with 8% mobile phase B for 1 min, then a
gradient was applied to reach 30% of mobile phase B in 9 min. Afterwards, the initial
conditions were reached in 5 min and the column was allowed to equilibrate for 2 min before
a subsequent analytical run. The solvent flow rate was 0.5 mL/min. Samples were run in
positive ion and negative ion mode separately after electron spray ionization (ESI). In both
cases, the ions with m/z value of 50 to 2000 were scanned. The capillary voltage was set at
4500 V and end plate offset at -500 V. The nebulizer pressure was 2.0 bar with dry nitrogen
at a flow rate of 8 mL/min and was heated to 250 oC. The mass spectra (MS) were recorded
keeping the capillary exit and skimmer 1 voltage of 150 V and 50 V, respectively. The in
source collision induced dissociation mass spectra (ISCID MS) were recorded by increasing
the capillary exit and skimmer 1 voltage to 300 V and 100 V, respectively. The negative ion
mode MS and ISCID MS were recorded by keeping the same capillary exit and skimmer 1
voltage in negative units.

112
6.2.3 Experimental setup
6.2.3.1 Effect of PE-glucose browning reaction products on the oil oxidative stability
Mustard seed oil was extracted from unroasted Brassica juncea seeds (Shrestha et al., 2012)
and the oil was degummed using a previously described method with some slight
modifications (Shahidi, 1990). The extracted oil was heated at 55 oC and an aqueous citric
acid solution (0.40 g/mL) was added drop by drop with vigorous mixing to reach a final
concentration of 2500 ppm. Mixing was continued for 10 min followed by the addition of
2.5% water. The oil was continuously mixed for additional 30 min. Afterwards, the aqueous
phospholipids phase was removed by centrifugation to obtain degummed mustard seed oil.
The degummed oil was used to prepare the following 4 oil mixtures; oil (O), oil added with
glucose (OG), oil added with PE (OP) and oil added with PE and glucose (OPG). The amount
of PE added was 1.5% of the oil (20.16 µmol PE/g oil). Since the maximum browning
reactions between phosphatidylethanolamine and glucose occurs at equal molar concentration
(Zamora et al., 2011), glucose was also added at the same molar concentration. Glucose was
first dissolved in water (0.8 g/ml). The solution was mixed with phosphatidylethanolamine
and then mixed with oil by vortexing and sonicating.
These four oil mixtures (O, OG, OP and OPG) were heated in an oil bath maintained at 160
oC for 10 min, and were coded as O_10, OG_10, OP_10 and OPG_10. The unheated oils
were coded as O_0, OG_0, OP_0 and OPG_0.
To evaluate the oxidative stability of those oil mixtures, oil (500 µL) was kept in a 1.5 mL
glass vial, and four such vials of each oil mixture were incubated in an oven maintained at
104 oC to accelerate the oxidation. After every 24 h, one vial of each oil was taken out for the
measurement of peroxide value (PV), absorbance spectra, fluorescence and tocopherol
content.
After evaluating the results from the above experiment, an accelerated oxidation experiment
was repeated by incubating five vials (each containing 500 µL of oil) at 40 oC. One vial of
each oil was taken in different time intervals to monitor the changes in PV and tocopherol
content.

113
6.2.3.2 Identification of some of the Maillard type reaction products between PE and
glucose
The browning reactions between PE and glucose were carried out by refluxing in an octane
solution (boiling point 126 oC) as described previously (Hayashi et al., 2007). At first, 120
mg of PE was dissolved in 25 mL octane. Glucose (30 mg) dissolved in a small amount of
aqueous methanol (1:1) solution was added to the octane solution. The aqueous phase was
removed by heating. The resulting octane solution was then refluxed continuously for 9 h.
Samples of 1 mL of the reaction mixture were taken after refluxing for 0.5 and 9 h. An
aliquot of 30 µL of that reaction mixture was evaporated under nitrogen and the residue was
dissolved in 1 mL of chloroform: acetonitrile (1:1, v/v). The resulting solution was then
injected in an LC-TOF MS for the identification of reaction products.
6.3 RESULTS AND DISCUSSION
6.3.1 Changes in the absorbance spectra of the different oils during heat treatment
The O, OG and OP oils showed an increase in the UV absorbance at 270 nm during 10 min
heating at 160 oC (Figure 6-2). On the other hand, OPG oil turned brown within 10 min of
heating, resulting in an increase in the absorbance from UV to visible range (240 to 500 nm)
with the maximum absorbance at 280 nm and 350 nm (Figure 6-2). These observations
showed that, PE and glucose can undergo browning reactions in the lipophilic medium.
Similar browning reactions in oil during heating were also reported previously (Zamora et al.,
2011).
6.3.2 Evaluation of the oxidative stability of the different samples
The oxidative stability of the different oil samples was evaluated by monitoring the peroxide
value (PV) during incubation of the oil samples at 104 oC. The O_0, O_10, OG_0 and OG_10
oils were very unstable and reached PV above 30 meq oxygen/kg oil after 24 h of incubation.
On the contrary, OP_0, OP_10, OPG_0 and OPG_10 oils showed high oxidative stability
with PV below 5 meq oxygen/kg oil, even after 72 h of incubation.
Oil oxidation was also monitored by evaluating the increase in the UV absorbance at 233 nm
(conjugated dienes formation) (Figure 6-3). The O_0, O_10, OG_0 and OG_10 showed a
dramatic increase in the UV absorbance at 233 nm during incubation, suggesting the

114
formation of conjugated dienes. Such oxidative changes also involved an increase in the UV
absorbance at 268 nm (conjugated trienes formation).
Figure 6-2. The changes in the absorbance spectra of the different oils during heat
treatment at 160 oC (grey and black lines are spectra of unheated and 10 min heated oil
samples, both at the concentration of 2.5 mg/mL in iso-octane)
The OP_10 and OPG_10 oils showed the highest oxidative stability with only a little increase
in the absorbance at 233 nm, during 72 h of incubation (Figure 6-3). The gradual increase in
the absorbance spectra at 280 and 350 nm of OPG_10 showed that the browning reactions
continued during incubation. This argument was supported by the visual browning of OPG_0
sample within 24 h of incubation, together with an increase in the absorbance from UV to
visible range (from 240 to 500 nm) (Figure 6-3). The OP_0 and OPG_0 oils also showed a
considerably smaller increase in absorbance at 233 nm compared to that in O_0, O_10, OG_0
and OG_10 oils.
0.0
0.1
0.2
0.3
0.4
230 280 330 380 430 480
absr
ob
ance
wavelength (nm)
0.0
0.1
0.2
0.3
0.4
230 280 330 380 430 480
abso
rban
ce
wavelength (nm)
0.0
0.1
0.2
0.3
0.4
230 280 330 380 430 480
ab
sro
ba
nce
wavelength (nm)
0.0
0.1
0.2
0.3
0.4
230 280 330 380 430 480
ab
sorb
an
ce
wavelength (nm)
Degummed oil with PE
and glucose (OPG)
Degummed oil with PE
(OP)
Degummed oil with
glucose (OG)
Degummed oil (O)
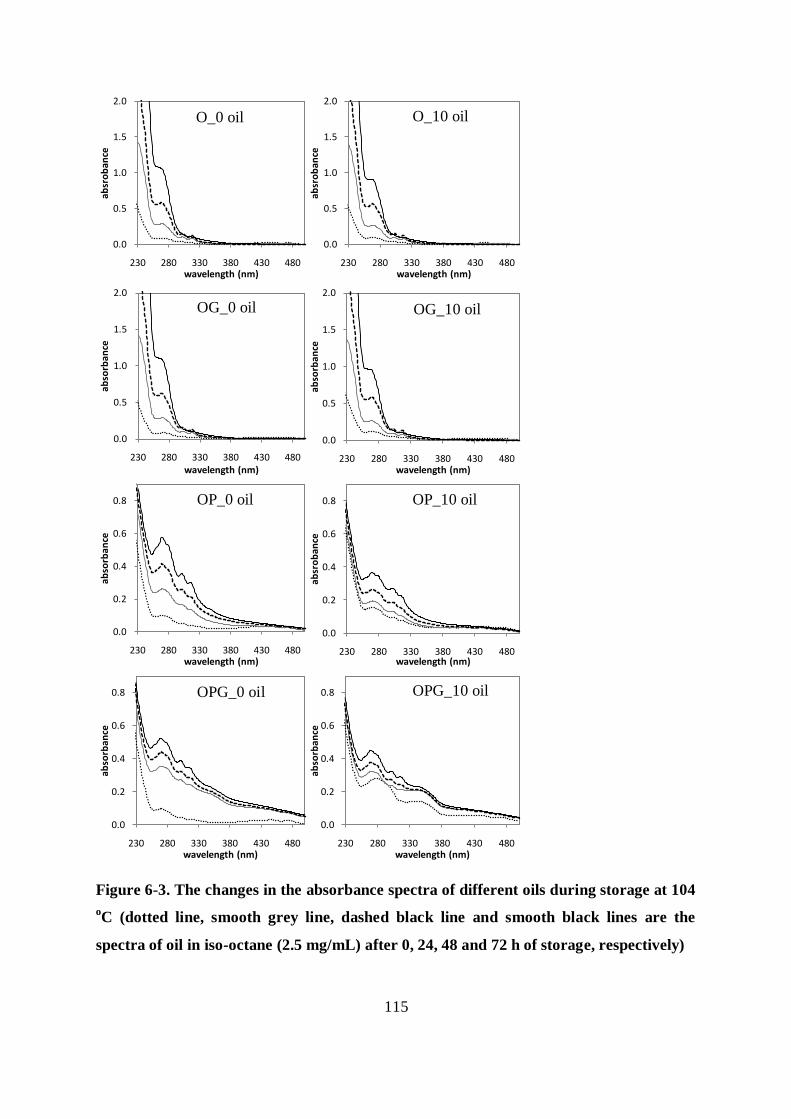
115
Figure 6-3. The changes in the absorbance spectra of different oils during storage at 104
oC (dotted line, smooth grey line, dashed black line and smooth black lines are the
spectra of oil in iso-octane (2.5 mg/mL) after 0, 24, 48 and 72 h of storage, respectively)
0.0
0.5
1.0
1.5
2.0
230 280 330 380 430 480
absr
ob
ance
wavelength (nm)
0.0
0.5
1.0
1.5
2.0
230 280 330 380 430 480
absr
ob
ance
wavelength (nm)
0.0
0.5
1.0
1.5
2.0
230 280 330 380 430 480
abso
rban
ce
wavelength (nm)
0.0
0.5
1.0
1.5
2.0
230 280 330 380 430 480
abso
rban
ce
wavelength (nm)
0.0
0.2
0.4
0.6
0.8
230 280 330 380 430 480
abso
rban
ce
wavelength (nm)
0.0
0.2
0.4
0.6
0.8
230 280 330 380 430 480
absr
ob
ance
wavelength (nm)
0.0
0.2
0.4
0.6
0.8
230 280 330 380 430 480
abso
rban
ce
wavelength (nm)
0.0
0.2
0.4
0.6
0.8
230 280 330 380 430 480
abso
rban
ce
wavelength (nm)
O_0 oil
OPG_10 oil OPG_0 oil
OP_10 oil OP_0 oil
OG_10 oil OG_0 oil
O_10 oil
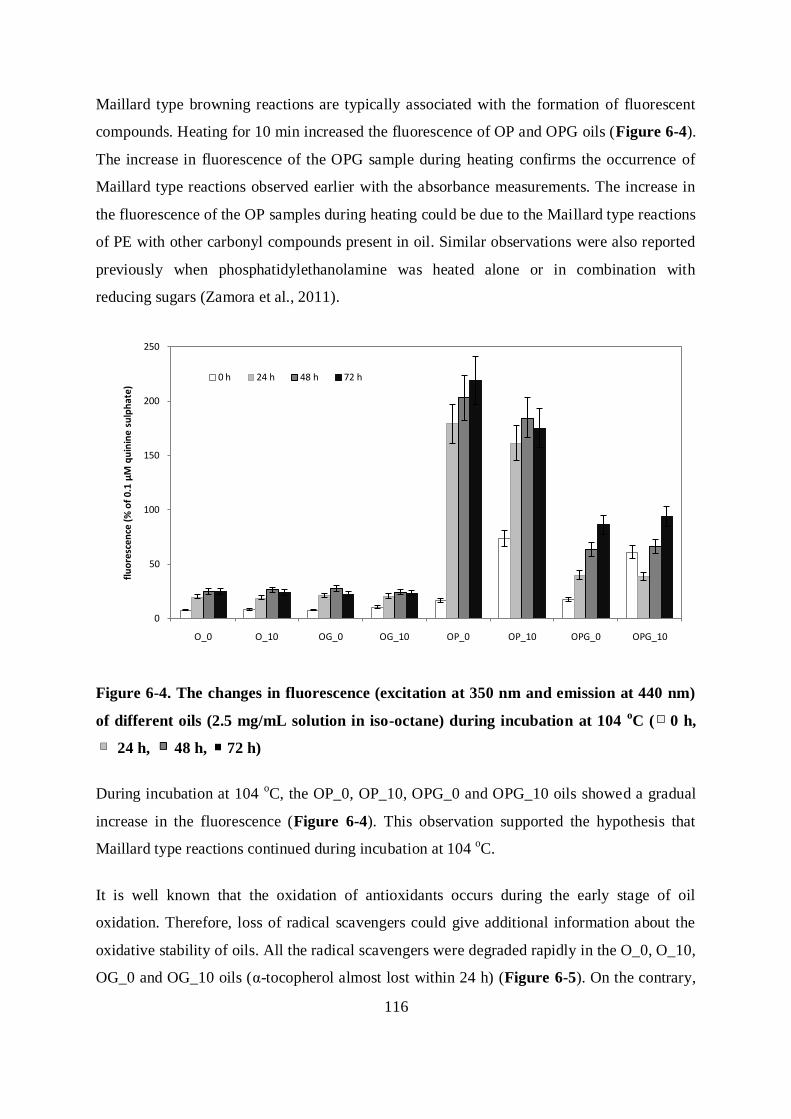
116
Maillard type browning reactions are typically associated with the formation of fluorescent
compounds. Heating for 10 min increased the fluorescence of OP and OPG oils (Figure 6-4).
The increase in fluorescence of the OPG sample during heating confirms the occurrence of
Maillard type reactions observed earlier with the absorbance measurements. The increase in
the fluorescence of the OP samples during heating could be due to the Maillard type reactions
of PE with other carbonyl compounds present in oil. Similar observations were also reported
previously when phosphatidylethanolamine was heated alone or in combination with
reducing sugars (Zamora et al., 2011).
Figure 6-4. The changes in fluorescence (excitation at 350 nm and emission at 440 nm)
of different oils (2.5 mg/mL solution in iso-octane) during incubation at 104 oC ( 0 h,
24 h, 48 h, 72 h)
During incubation at 104 oC, the OP_0, OP_10, OPG_0 and OPG_10 oils showed a gradual
increase in the fluorescence (Figure 6-4). This observation supported the hypothesis that
Maillard type reactions continued during incubation at 104 oC.
It is well known that the oxidation of antioxidants occurs during the early stage of oil
oxidation. Therefore, loss of radical scavengers could give additional information about the
oxidative stability of oils. All the radical scavengers were degraded rapidly in the O_0, O_10,
OG_0 and OG_10 oils (α-tocopherol almost lost within 24 h) (Figure 6-5). On the contrary,
0
50
100
150
200
250
O_0 O_10 OG_0 OG_10 OP_0 OP_10 OPG_0 OPG_10
flu
ore
scen
ce (
% o
f 0.
1 µ
M q
uin
ine
su
lph
ate
)
0 h 24 h 48 h 72 h

117
tocopherol and plastochromanol-8 were highly stable in OP_0, OP_10, OPG_0 and OPG_10
oils during incubation at 104 oC.
Figure 6-5. The degradation of tocopherols and plastochromanol-8 in different oils
during incubation at 104 oC and, (triangle, diamond, square and circle represent O, OG,
OP and OPG oils respectively; empty symbols with dashed lines represent unheated oils
and filled symbols with smooth lines represent 10 min heated oils) (error bars represent
95% confidence interval of mean)
In this way, all these observations clearly supported the fact that PE alone or in combination
with glucose can exert a very strong antioxidative activity in the presence of radical
scavengers (e.g. tocopherol and plastochromanol-8) in the bulk oil. Since browning reactions
were evident to occur during the incubation at 104 oC, this experimental setup could not
exclude the possibility that a significant part of the antioxidants could have been produced
during the actual incubation rather than during the preceding heat treatment. Therefore, the
0
20
40
60
80
100
0 20 40 60 80
α-t
oco
ph
ero
l (µ
g/g
oil)
incubation time (h) at 104 oC
O_0 O_10
OG_0 OG_10
OP_0 OP_10
OPG_0 OPG_10
0
50
100
150
200
250
300
0 20 40 60 80
γ-to
cop
he
rol (
µg/
g o
il)
incubation time (h) at 104 oC
0
10
20
30
40
50
60
70
0 20 40 60 80
pla
sto
chro
man
ol-
8 (µ
g/g
oil)
incubation time (h) at 104 oC
0
2
4
6
8
10
12
0 20 40 60 80
δ-t
oco
ph
ero
l (µ
g/g
oil)
incubation time (h) at 104 oC

118
incubation experiment was repeated at a lower temperature (40 oC) to re-evaluate the
oxidative stability.
During incubation at 40 oC, the OG_0 oil showed a slightly pro-oxidative effect, while the
OP_0 and OPG_0 oils showed a strong synergistic antioxidative effect compared to O_0 oil
(Figure 6-6). The OPG_10 oil showed the highest oxidative stability with no significant
increase in the PV within the experimental time frame of 53 days. Similarly, the OP_10 oil
also showed a high oxidative stability suggesting that reaction products of PE with other
carbonyl compounds in the oil could also produce antioxidative compounds.
Figure 6-6. The changes in peroxide value (meq oxygen/kg oil) of different oils during
incubation at 40 oC ( day 0, day 11, day 19, day 32, day 53)
During incubation at 40 oC, the α- and γ-tocopherol as well as plastochromanol-8
degradation occurred considerably faster in the O_0, O_10, OG_0 and OG_10 oils (Figure
6-7). The OG_0 oil showed a slightly faster degradation of those radical scavengers
compared to O_0 oil supporting the PV observation of a slight pro-oxidative effect of glucose
addition.
0
10
20
30
40
50
60
70
80
O_0 O_10 OG_0 OG_10 OP_0 OP_10 OPG_0 OPG_10
Per
oxi
de
valu
e (m
eq o
xyge
n/
kg o
il)

119
Figure 6-7. The degradation of tocopherols and plastochromanol-8 in different oils
during incubation at 40 oC, (triangle, diamond, square and circle represent O, OG, OP
and OPG oils respectively; empty symbols with dashed lines represent unheated oils
and filled symbols with smooth lines represent 10 min heated oils) (error bars represent
95% confidence interval of mean)
The OP and OPG oils showed considerably higher stability of all the constituent radical
scavengers compared to the OG and O samples. The stability of these antioxidants in both the
unheated and heated samples of OP and OPG oils were similar. This could indicate that some
of antioxidative Maillard type reactions intermediate such as those having reductone
structures (Figure 6-1) could still be formed during incubation at 40 oC. Such a hypothesis is
also supported by a better oxidative stability of OPG_0 compared to OP_0 during incubation
(Figure 6-6).
0
10
20
30
40
50
60
70
80
90
100
0 10 20 30 40 50 60
α-t
oco
ph
ero
l (µ
g/g
oil)
days of incubation at 40 oC
0
50
100
150
200
250
300
0 10 20 30 40 50 60
γ-to
cop
he
rol (
µg/
g o
il)
days of incubation at 40 oC
0
10
20
30
40
50
60
70
0 10 20 30 40 50 60
pla
sto
chro
ma
no
l-8
(µ
g/g
oil)
days of incubation at 40 oC
0
2
4
6
8
10
12
0 10 20 30 40 50 60
δ-t
oco
ph
ero
l (µ
g/g
oil)
days of incubation at 40 oC
O_0 O_10
OG_0 OG_10
OP_0 OP_10
OPG_0 OPG_10

120
Based on the results of incubation experiments both at 40 oC and 104
oC, we could conclude
that Maillard type reaction products of PE with glucose or with other carbonyl compounds
present in the oil could produce some potent natural antioxidative compounds. To better
understand the chemistry of such Maillard type reactions, the identification of some of the
reaction mixtures was carried out using LC-TOF MS, and will be discussed below.
6.3.3 LC-TOF MS identification of some of the reaction products between PE and
glucose
Maillard type reaction products formed during refluxing of 1,2-dioleoyl-sn-glycero-3-
phosphoethanolamine (PE, C41H79NO8P+ m/z 744.5573) and glucose in octane solution
(boiling point 126 oC) were studied by LC-TOF MS analysis (spectra of identified
compounds have been provided in Appendix from Figure 8-2 to Figure 8-30). The
chromatogram of reaction mixture before refluxing, after 0.5 h refluxing and 9 h refluxing are
shown in Figure 6-8A. Before refluxing, a single unmodified PE peak 1 was detected. The
Amadori product 4 (C47H89NO13P+ m/z 906.6049) was formed within 0.5 h of refluxing.
After refluxing for 9 h, a number of reaction products were observed in the chromatogram
(Figure 6-8A). PE-linked pyrrolecarbaldehyde 6 (C47H83NO10P+, m/z 852.5706) was formed
through the reaction pathways shown in Figure 6-1, as described previously (Lederer &
Baumann, 2000). The peak area of this compound 6 was relatively small compared to the
peaks of other compounds in the chromatogram, suggesting that it is an intermediate reaction
product. The compound 6 could further react with another molecule of PE (Figure 6-8B) to
form 1-[2‟-(2”, 3”-dioleoyl-sn-glycerol-1”-phosphoethyl)]-6-hydroxymethyl-2,3-dihydro-1H-
imidazo[1,2-a]pyridine-4-ylium (compound 7). The structural characterization of this
compound based on NMR spectroscopy has been carried out previously (Hayashi et al., 2007;
Hamaguchi et al., 2006; Hayashi et al., 2008). The identification of this compound was based
on the positive and negative ions formed during in-source fragmentation (C10H16N2O5P+ m/z
275.0768, C31H52N2O7P+ m/z 595.3545 and C31H54N2O8P
+ m/z 613.3654, C49H86N2O9P
+ m/z
877.6082 [M+H]+, C49H84N2O9P
- m/z 875.6044 [M-H]
- and C18H33O2
- m/z 281.2542). The
C10H16N2O5P+
ion is a characteristic ion formed after fragmentation between oxygen
(connected to phosphorus) and carbon (of the glycerol moiety). The loss of an oleic fragment
(C18H33O2-) results in the formation of C31H53N2O7P
2+ ion, which can either loose a proton to
form C31H52N2O7P+ ion or reacts with OH- ion to form C31H54N2O8P+ ion. The formation of

121
this compound was described previously and is known to have maximum absorbance at 350
nm (Hayashi et al., 2007).
N+NO
PO
RO O
OHRO
OH
OH
PO
RO
O
OH
ROO
PO
RO
O
OH
RO
N
O
OH
H
N+NO
PO
RO O
OHRO
OCH3
N+N
OPO
RO O
OHRO
CH3
+ PE+
+ CH3OH
-HCHO
67 8
9
10
Here, R = C18
H33
O
-H2O
1
2 3
5
6
78
9
10
1'
2'
2'
1'
1
2 3
5
6 10
78
9
reduction
Figure 6-8. (A) LC-TOF MS chromatograms of the PE-glucose reaction mixture before
and after refluxing in octane (the selected [M+H]+ ion chromatograms for compounds 1,
4, 6, 7, 8, 9 and 10, (shown in different colors) are overlaid with the base peak
Before refluxing
After 0.5 h refluxing
After 9 h refluxing
1
1
4
10 7
6 8 9
A
B
1

122
chromatogram (shown in blue)) and, (B) the reaction pathways for the formation of
compounds 7, 8, 9 and 10
Another compound detected in the chromatogram was dioleoyl-sn-glycerol phosphatidic acid
(compound 8). The identification of this compound was also based on the positive and
negative ions formed during in-source fragmentation (C39H77NO8P+ m/z 718.5367 [M+NH4]
+,
C39H74O8P+
m/z 701.5124 [M+H]+, C39H71O4
+ m/z 603.5335, C18H33O2
- m/z 281.254,
C39H72O8P- m/z 699.5183 [M-H]
-, C21H38O6P
- m/z 417.2435, C21H40O7P
- m/z 435.2644). The
C39H71O4+ is formed after loss of phosphoric acid group (H2PO4
-) from the parent molecule
C39H73O8P. The loss of an oleic fragment (C18H33O2-) from the molecular ion (C39H72O8P
-)
forms the neutral C21H39O6P fragment, which can either loose a proton to form the
C21H38O6P- ion or form adducts with OH
- ion to form the C21H40O7P
- ion. The compound 8
could have been formed together with compound 7 as a result of reaction between PE and
compound 6 (Figure 6-8B).
In addition, a small peak of compound 9 was also detected in the chromatogram which was
identified as 1-[2‟-(2”, 3”-dioleoyl-sn-glycerol-1”-phosphoethyl)]-6-methoxymethyl-2,3-
dihydro-1H-imidazo[1,2-a]pyridine-4-ylium. It had molecular ions C50H88N2O9P+ m/z
891.6224 [M+H]+ and C50H86N2O9P
- m/z 889.6361 [M-H]
- with a characteristic fragment of
C11H18N2O5P+ m/z 289.0921 formed after degradation of the bond between oxygen
(connected to phosphorus) and carbon (of the glycerol moiety). The compound 9 could have
been formed by the dehydration reaction of compound 7 with methanol which was present in
the reaction mixture, as glucose was added as an aqueous methanol solution.
Another major peak detected in the chromatogram was that of 1-[2‟-(2”, 3”-dioleoyl-sn-
glycerol-1”-phosphoethyl)]-6-methyl-2,3-dihydro-1H-imidazo[1,2-a]pyridine-4-ylium
(compound 10). The structure of the compound was confirmed previously based on NMR
spectroscopy (Hamaguchi et al., 2006; Hayashi et al., 2007; Hayashi et al., 2008). The
identification of this compound was based on the positive and negative ions formed during
in-source fragmentation (C49H86N2O8P+ m/z 861.6136 [M+H]
+, C31H54N2O7P
+ m/z 597.3658,
C31H52N2O6P+ m/z 579.3548, C10H16N2O4P
+ m/z 259.0825, C49H84N2O8P
- m/z 859.609 [M-
H]-, C18H33O2
- m/z 281.2536, C31H50N2O6P
- m/z 577.3478). The C10H16N2O4P
+ ion is a
characteristic ion formed after degradation of the bond between oxygen (connected to
phosphorus) and carbon (of the glycerol moiety). The loss of an oleic fragment (C18H33O2-)

123
from the parent molecule results in the formation of C31H53N2O6P2+
ion, which can either
loose a proton to form the C31H52N2O6P+ ion or react with OH
- ion to form the C31H54N2O7P
+
ion. The loss of an oleic fragment from C49H84N2O8P- would result into the formation of the
neutral fragment C31H51N2O6P, which after loss of an H+ ion forms the C31H50N2O6P
- ion
fragment. This compound 10 could have been formed from compound 9 after the breakdown
of methoxy group as a formaldehyde molecule, or could have been formed directly from
compound 7 via the reduction. The formation of a similar compound was described
previously and is known to have maximum absorbance at 350 nm (Hayashi et al., 2007).
Based on the reaction of PE with 13
C-labeled-sugars in different positions, it was shown
previously that carbons of 1- and 2- positions in a sugar is always introduced into the 5- and
9- positions on the pyridinium derivatives, respectively. The carbons of 3-, 4-, and 5-
positions in a sugar are introduced into the 8-, 7- and 6- positions on the pyridinium
derivatives. Furthermore, the carbon of 6-position in a sugar is always introduced into the
carbon of 10-position in those compounds. Therefore, the cleavage of bond between the
carbon of 1- and 2-positions in sugar must happen together with the rearrangement reactions
during the formation of these pyridinium derivatives (Hayashi et al., 2007). Moreover, it has
also been confirmed that compound 6 is an intermediate in the formation of pyridinium
derivatives, however, a clear reaction pathways for the formation of these compounds have
not been clarified yet (Hayashi et al., 2008).
The chemical structures of the identified compounds clearly support the existence of Maillard
type reactions between PE and glucose. In addition to those identified peaks, different other
unidentified peaks were also observed in the base peak chromatogram of 9 h reflux mixture
(Figure 6-8A). Those unidentified compounds could be different reaction products formed
during such Maillard type reactions. Antioxidant activity observed during the experiment
could be due to some of the specific reaction products, or could also be due to the synergistic
effect of several of these reaction products. Further studies are necessary to isolate and
identify different reaction products and evaluate their antioxidant potential, separately.
6.4 CONCLUSIONS
To conclude, PE can take part in the Maillard type reactions with carbonyl compounds such
as glucose in an apolar medium. Such Maillard type reaction products show strong

124
antioxidative activity and could even prevent the degradation of radical scavengers in the oil.
Therefore, they could find a wide range of applications in food as a natural antioxidant to
control the lipid oxidation, which is one of the most important chemical deterioration
mechanisms in different foods.

125
CHAPTER
7
GENERAL CONCLUSIONS AND FUTURE PERSPECTIVES


127
GENERAL CONCLUSIONS AND FUTURE PERSPECTIVES
A novel method for the estimation of oil blend composition by using Monte Carlo simulation
approach has been developed in the first part of this PhD research (Chapter 2). The
development of the method is based on the universal mass balance principle. Therefore, such
an approach can also be applied for other kinds of blends. For the application of such
technique, it is important to have some analytical parameters that differ largely among them.
Furthermore, it is also necessary to have a sufficiently consistent and large dataset of those
parameters to make a reliable estimation of their frequency distributions.
Secondly, this research has confirmed the formation of canolol during seed roasting of both
mustard and rapeseed varieties (Chapter 3). It was isolated for the first time from roasted
high erucic acid mustard seed oil. Previously, it was only known to be formed during
rapeseed roasting. Canolol is a potent antioxidant and anti-mutagenic agent (Kuwahara et al.,
2004). Moreover, it has also gained attention very recently for its suppression of pathogenesis
and its anti-carcinogenic activity (Fang et al., 2013). Therefore, it can have wide applications
in foods, pharmaceuticals and cosmetics industries. Furthermore, because of its structural
similarity to styrene, it is prone to polymerization to produce polyvinylsyringol (PVS). PVS
has been recently described as a potential biodegradable polymer (Morley, Grosse, Leisch, &
Lau, 2013). Further research is necessary to evaluate its application as a bio-plastic packaging
material.
Finally, based on Chapters 3, 4 and 5, we concluded that canolol is formed during roasting
of both rapeseed and mustard varieties; however, it has a limited role in the oxidative stability
of mustard seed oil. On the other hand, it plays a significant role in the oxidative stability of
roasted rapeseed oil. The oxidative stability of roasted mustard seed oil was mainly linked
with phospholipids and Maillard type reaction products. Although roasted rapeseed oil
contains high amounts of canolol, it is less stable compared to roasted mustard seed oil,
because of the fact that rapeseed undergoes less browning reactions during roasting compared
to mustard varieties. Because of the lipophilic nature of the browning reaction products and
their high correlation with phospholipid content, it was hypothesized that such browning
reactions could be due to the Maillard type reactions of amino group containing
phospholipids (such as phosphatidylethanolamine) with reducing sugars or other carbonyl

128
compounds. The potent antioxidant activity of such reaction products was demonstrated in
Chapter 6. Such reaction products could find wide applications as natural antioxidants.
Further studies are necessary to understand the formation of such compounds during food
preparation and their role in the sensorial, nutritional and functional properties of foods.

129
CHAPTER
8
APPENDIX


131
Table 8-1. Fatty acid composition database obtained from different literatures, from own laboratory analysis (*) of seed and oil samples
and obtained from Cargill (**)
S.N. Sample Fatty acid composition (g/100 g total fatty acid)
Source 16:0 16:1 18:0 18:1 18:2 18:3 20:0 20:1 22:0 22:1 24:0 others
1 B. juncea seed 2.4 0.2 1.2 11.2 14.3 10.7 0.9 5.8 1.0 47.7 0.3 4.4 Nepalese market*
2 B. juncea seed 2.7 0.3 0.8 10.0 13.5 14.2 0.7 4.7 1.1 45.0 0.6 6.4 Nepalese market*
3 B. campestris L. var. yellow sarson seed 1.9 0.2 1.1 12.2 13.2 9.4 0.9 4.5 1.0 51.0 0.3 4.3 Nepalese market*
4 B. juncea seed 2.4 0.2 1.1 13.2 13.5 10.6 0.9 6.5 0.8 46.8 0.2 3.9 Nepalese market*
5 B. juncea seed 2.3 0.2 1.1 11.9 13.7 10.8 0.9 6.5 0.9 47.1 0.3 4.2 Nepalese market*
6 B. juncea (wild mustard) 2.6 0.2 0.9 7.8 14.2 13.0 0.8 5.3 1.5 45.7 0.0 8.0 (Jham et al., 2009)
7 mustard India 2.1 0.2 1.0 11.5 14.5 12.3 0.0 7.2 0.0 46.7 0.0 4.5 (Kaushik & Agnihotri, 1997)
8 B. campestris L. var. toria cv. tori-7 2.4 0.0 1.5 14.1 13.9 6.9 1.1 7.0 1.1 45.8 0.5 5.7 (Mortuza et al., 2006)
9 B. campestris L. var. yellow sarson cv. binasarisha-6
1.8 0.0 1.5 13.1 13.0 6.3 1.3 5.4 1.5 50.0 0.6 5.5 (Mortuza et al., 2006)
10 B. juncea L. cv. MM001/98 2.6 0.0 1.0 9.3 16.9 9.8 0.9 5.6 1.0 43.7 0.8 8.5 (Mortuza et al., 2006)
11 B. juncea L. cv. jata 2.2 0.0 1.0 9.6 15.1 9.7 0.9 5.2 1.3 46.8 0.8 7.3 (Mortuza et al., 2006)
12 B. campestris L. var. yellow sarson cv. agrani 1.8 0.0 1.6 14.2 12.5 6.3 1.4 5.6 1.6 49.6 0.7 4.9 (Mortuza et al., 2006)
13 B. campestris L. var. yellow sarson cv. safal 1.6 0.0 1.2 13.1 12.3 7.1 1.0 4.7 1.2 51.6 0.6 5.6 (Mortuza et al., 2006)
14 B. juncea L. cv. rai-5 2.6 0.0 1.1 10.0 16.4 9.2 0.9 5.3 1.4 44.7 0.8 7.8 (Mortuza et al., 2006)
15 B. campestris L. var. yellow sarson cv. barisarisha-6
1.0 0.0 1.5 14.6 11.8 6.3 1.2 5.8 1.2 50.3 0.6 5.8 (Mortuza et al., 2006)
16 B. campestris L. cv. barisarisha-9 2.0 0.0 1.3 15.2 12.1 7.3 1.0 7.5 1.0 47.0 0.4 5.1 (Mortuza et al., 2006)
17 B. juncea L. cv. barisarisha-10 2.3 0.0 1.1 8.0 15.3 10.5 0.9 4.1 1.5 47.4 0.7 8.2 (Mortuza et al., 2006)
18 B. juncea L. cv. barisarisha-11 2.1 0.0 0.9 9.6 15.8 9.6 0.8 4.6 1.3 46.9 0.8 7.7 (Mortuza et al., 2006)
19 B. campestris L. cv. barisarisha-12 1.2 0.0 1.1 13.8 12.6 8.0 0.9 6.6 0.9 48.6 0.4 6.0 (Mortuza et al., 2006)
20 B. juncea AC 00790 2.8 0.0 1.3 13.2 20.9 9.3 0.0 7.3 0.0 41.2 0.0 4.0 (Iqbal, Weerakoon, & Peiris,
2006)
21 B. juncea AC 01098 2.8 0.0 1.0 17.0 19.0 10.3 0.0 7.8 0.0 39.9 0.0 2.2 (Iqbal et al., 2006)

132
22 B. juncea AC 01244 3.1 0.0 0.8 13.1 19.7 10.9 0.0 7.9 0.0 41.6 0.0 2.9 (Iqbal et al., 2006)
23 B. juncea AC 01440 3.4 0.0 0.8 13.9 20.4 9.8 0.0 7.8 0.0 41.1 0.0 2.8 (Iqbal et al., 2006)
24 B. juncea AC 01774 3.2 0.0 0.8 12.9 18.2 10.3 0.0 9.7 0.0 41.5 0.0 3.4 (Iqbal et al., 2006)
25 B. juncea AC 01847 3.2 0.0 0.7 14.5 22.2 10.5 0.0 8.8 0.0 37.9 0.0 2.2 (Iqbal et al., 2006)
26 B. juncea AC 02246 2.7 0.0 1.2 18.8 14.9 7.9 0.0 8.1 0.0 41.3 0.0 5.1 (Iqbal et al., 2006)
27 B. juncea AC 02310 3.1 0.0 0.7 11.6 19.6 12.3 0.0 7.9 0.0 39.6 0.0 5.2 (Iqbal et al., 2006)
28 B. juncea AC 05041 2.7 0.0 0.8 13.3 16.3 11.3 0.0 10.1 0.0 43.5 0.0 2.0 (Iqbal et al., 2006)
29 B. juncea AC 05088 3.0 0.0 0.9 14.2 18.2 10.5 0.0 10.6 0.0 39.4 0.0 3.2 (Iqbal et al., 2006)
30 B. juncea AC 05181 2.8 0.0 0.7 12.8 16.9 11.8 0.0 8.1 0.0 44.6 0.0 2.3 (Iqbal et al., 2006)
31 B. juncea AC 05184 2.7 0.0 1.1 11.4 17.1 11.1 0.0 8.3 0.0 45.6 0.0 2.7 (Iqbal et al., 2006)
32 B. napus (low erucic) seed 4.8 0.3 1.9 63.4 19.2 8.0 0.6 1.2 0.3 0.2 0.0 0.2 Nepalese market*
33 B. napus 5.1 0.2 1.7 60.1 21.5 9.9 0.6 1.4 0.3 0.4 0.2 0.0 (Dubois, Breton, Linder, Fanni, &
Parmentier, 2007)
34 B. napus AV-OPAL 4.2 0.0 2.1 58.6 21.8 11.7 0.6 0.9 0.2 0.0 0.0 0.0 (Wijesundera et al., 2008)
35 B. napus AV-JADE 4.3 0.0 2.1 58.6 21.7 11.9 0.4 0.8 0.2 0.0 0.0 0.0 (Wijesundera et al., 2008)
36 B. napus RT057 4.3 0.0 2.0 59.6 21.2 11.3 0.5 1.0 0.2 0.0 0.0 0.0 (Wijesundera et al., 2008)
37 B. napus RT058 3.9 0.0 1.8 60.7 20.3 11.2 0.7 1.1 0.3 0.0 0.0 0.0 (Wijesundera et al., 2008)
38 B. napus RT 076 4.3 0.0 2.1 58.6 21.7 11.7 0.5 0.9 0.2 0.0 0.0 0.0 (Wijesundera et al., 2008)
39 Canola 3.5 0.2 1.5 60.1 20.1 9.6 0.6 1.4 0.3 0.2 0.0 2.5 (Przybylski, 2011)
40 Brassica juncea (canola quality) 3.9 0.0 2.6 62.7 17.2 9.5 0.0 0.0 0.0 0.2 0.0 3.9 (Potts, Rakow, & Males, 1999)
41 Rapeseed (canola variant) 4.0 0.0 2.0 60.0 21.0 10.0 0.0 1.0 0.0 1.0 0.0 1.0 (Wittkop, Snowdon, & Friedt,
2009)
42 Canola oil 3.6 0.2 1.5 61.6 21.7 9.6 0.6 1.4 0.3 0.2 0.2 0.0 (Przybylski et al., 2005)
43 Rapeseed (low erucic) 4.8 0.0 1.8 62.6 20.0 9.5 0.1 1.4 0.0 0.0 0.0 0.0 (Brodnjak-Voncina et al., 2005)
44 Rapeseed (low erucic) 5.5 0.0 1.7 59.0 21.3 9.3 0.6 1.5 0.0 0.0 0.0 1.1 (Brodnjak-Voncina et al., 2005)
45 Rapeseed (low erucic) 5.1 0.0 1.9 59.2 22.3 9.3 0.7 1.6 0.0 0.0 0.0 0.0 (Brodnjak-Voncina et al., 2005)
46 Rapeseed (low erucic) 4.8 0.0 1.9 61.6 20.9 8.0 0.8 1.5 0.0 0.0 0.0 0.5 (Brodnjak-Voncina et al., 2005)
47 Rapeseed (low erucic) 5.1 0.0 1.9 59.2 22.4 9.3 0.6 1.5 0.0 0.0 0.0 0.0 (Brodnjak-Voncina et al., 2005)
48 Rapeseed (low erucic) 4.5 0.0 1.7 64.9 18.6 8.3 0.1 0.1 0.0 0.0 0.0 1.9 (Brodnjak-Voncina et al., 2005)
133
49 Soybean oil 10.1 0.1 4.1 27.4 51.7 5.4 0.3 0.3 0.3 0.0 0.0 0.4 Belgium market*
50 Soybean oil 11.7 0.0 3.8 23.4 52.6 7.7 0.2 0.2 0.2 0.0 0.0 0.2 (Jham et al., 2009)
51 Soybean oil 10.8 0.2 3.9 23.9 52.1 7.8 0.3 0.1 0.2 0.0 0.3 0.4 (Dubois et al., 2007)
52 Soybean oil 11.3 0.1 3.6 24.9 53.0 6.1 0.3 0.3 0.0 0.3 0.1 0.0 (Ramos, Fernandez, Casas,
Rodriguez, & Perez, 2009)
53 Soybean oil 10.9 0.0 3.6 26.0 52.6 5.5 0.4 0.2 0.0 0.0 0.0 0.8 (Brodnjak-Voncina et al., 2005)
54 Soybean oil 10.5 0.0 4.2 25.5 52.0 7.8 0.1 0.1 0.0 0.0 0.0 0.0 (Brodnjak-Voncina et al., 2005)
55 Soybean oil 10.0 0.0 4.2 24.9 53.2 6.9 0.4 0.1 0.0 0.0 0.0 0.3 (Brodnjak-Voncina et al., 2005)
56 Soybean oil 10.4 0.0 4.2 25.9 50.8 7.5 0.4 0.4 0.0 0.0 0.0 0.4 (Brodnjak-Voncina et al., 2005)
57 Soybean oil 10.5 0.0 4.2 24.4 52.1 7.5 0.4 0.1 0.0 0.0 0.0 0.9 (Brodnjak-Voncina et al., 2005)
58 Soybean oil 10.5 0.0 4.3 24.6 53.1 7.6 0.1 0.1 0.0 0.0 0.0 0.0 (Brodnjak-Voncina et al., 2005)
59 Soybean oil 10.2 0.0 4.0 23.1 55.1 7.1 0.5 0.1 0.0 0.0 0.0 0.0 (Brodnjak-Voncina et al., 2005)
60 Soybean oil 10.9 0.0 3.8 27.2 49.5 6.4 0.7 0.9 0.0 0.0 0.0 0.6 (Brodnjak-Voncina et al., 2005)
61 Soybean oil 11.9 0.0 3.8 25.7 52.7 5.8 0.1 0.1 0.0 0.0 0.0 0.0 (Brodnjak-Voncina et al., 2005)
62 Soybean oil 9.7 0.0 3.9 25.1 54.2 5.9 0.1 0.1 0.0 0.0 0.0 1.1 (Brodnjak-Voncina et al., 2005)
63 Low erucic acid rapeseed Data obtained from an oil
processing company Cargill in
Belgium (based on more than
10,000 observations)**
(average value) 4.60 0.25 1.70 61.92 19.21 9.56 0.58 1.22 0.32 0.34 0.04
(minimum value) 3.40 0.00 0.80 57.20 16.15 7.00 0.00 0.00 0.00 0.00 0.00
(maximum value) 5.90 0.60 3.10 66.25 25.40 12.28 2.00 3.10 1.50 1.90 0.75
64 Soybean oil Data obtained from an oil
processing company Cargill in
Belgium (based on more than 10,000 observations)**
(average value) 10.98 0.09 3.10 25.07 52.93 5.89 0.33 0.22 0.41 0.06 0.14
(minimum value) 10.50 0.05 2.73 20.16 49.35 4.54 0.20 0.18 0.30 0.00 0.08
(maximum value) 12.68 0.14 4.39 27.50 55.21 7.77 0.60 0.26 0.62 0.13 0.26

134
Figure 8-1. Proton (1H) NMR spectrum (A) and carbon (
13C) NMR spectrum (B) of canolol isolated from roasted mustard seed oil (x-
axis is chemical shift in parts per million; solvent: CDCl3)
A B

135
LC-TOF MS SPECTRA (Oleic fatty acid moiety of all the compounds has been represented by alkyl group “R” in the structures)
LC- TOF MS spectra of compound 1 (1,2-dioleoyl-sn-glycero-3-phosphoethanolamine)
Figure 8-2. LC-TOF MS spectra of 1,2-dioleoyl-sn-glycero-3-phosphoethanolamine (compound 1) in positive ion mode
Meas. m/z Formula m/z err [mDa] err [ppm] mSigma rdb e¯ Conf N-Rule
603.5347 C 39 H 71 O 4 603.5347 -0.0 -0.1 17.7 4.5 even ok
744.5573 C 41 H 79 N O 8 P 744.5538 -3.5 -4.7 9.6 3.5 even ok
766.5374 C 41 H 78 N Na O 8 P 766.5357 -1.7 -2.2 16.0 3.5 even ok
Figure 8-3. Comparison of isotopic mass distribution of an ion fragment compared with the theoretical isotopic mass distribution
603.5347
744.5573
766.5374
+MS, 4.0-4.1min #(238-242), Background Subtracted
0.00
0.25
0.50
0.75
1.00
1.25
1.50
6x10
Intens.
600 620 640 660 680 700 720 740 760 780 m/z
744.5573
745.5603
746.5619
+MS, 4.0-4.1min #(238-242), Background Subtracted
744.5538
745.5571
746.5605
C41H79NO8P, ,744.550.0
0.5
1.0
6x10
Intens.
0
500
1000
1500
2000
744.0 744.5 745.0 745.5 746.0 746.5 747.0 747.5 748.0 748.5 m/z
NH2O
PO
RO O
OHRO

136
Figure 8-4. LC-TOF MS spectra of 1,2-dioleoyl-sn-glycero-3-phosphoethanolamine (compound 1) in negative ion mode
Meas. m/z Formula m/z err [mDa] err [ppm] mSigma rdb e¯ Conf N-Rule
281.2533 C 18 H 33 O 2 281.2486 -4.7 -16.8 17.8 2.5 even ok
742.5400 C 41 H 77 N O 8 P 742.5392 -0.8 -1.0 n.a. 4.5 even ok
LC- TOF MS spectra of compound 4
Figure 8-5. LC-TOF MS spectra of compound 2 in positive ion mode
281.2533
1-
325.2080 460.2987
742.5472
1-
-isCID MS, 4.1-4.2min #(225-229), Background Subtracted
0
500
1000
1500
Intens.
200 300 400 500 600 700 m/z
906.6049
+MS, 4.2-4.4min #(253-260), Background Subtracted
0.0
0.5
1.0
1.5
2.0
5x10
Intens.
600 700 800 900 1000 1100 m/z
NH
OH
O
OH
OH
OH
R

137
Meas. m/z Formula m/z err [mDa] err [ppm] mSigma rdb e¯ Conf N-Rule
906.6049 C 47 H 89 N O 13 P 906.6066 1.7 1.9 21.8 4.5 even ok
928.5855 C 47 H 88 N Na O 13 P 928.5885 3.0 3.3 21.6 4.5 even ok
Figure 8-6. Comparison of isotopic mass distribution of an ion fragment compared with the theoretical isotopic mass distribution
LC- TOF MS spectra of compound 6
Figure 8-7. LC-TOF MS spectra of compound 6 in positive ion mode
906.6049
907.6075
908.6095909.6110
+MS, 4.2-4.4min #(253-260), Background Subtracted
906.6066
907.6100
908.6133909.6167
C47H89NO13P, ,906.610.0
0.5
1.0
1.5
2.0
5x10
Intens.
0
500
1000
1500
2000
2500
906.0 906.5 907.0 907.5 908.0 908.5 909.0 909.5 910.0 m/z
347.7689 376.1796 436.6849465.3725 497.0998 538.3119 603.5350
684.5400721.0411 777.5242
834.9260
852.5744
874.5696
+MS, 5.5-5.5min #(329-331), Background Subtracted
0.0
0.5
1.0
1.5
2.04x10
Intens.
300 400 500 600 700 800 m/z
O
PO
RO
O
OH
RO
N
O
OH
H

138
Meas. m/z Formula m/z err [mDa] err [ppm] mSigma rdb e¯ Conf N-Rule
852.5744 C 47 H 83 N O 10 P 852.5749 0.5 0.6 16.4 7.5 even ok
Figure 8-8. Comparison of isotopic mass distribution of an ion fragment compared with the theoretical isotopic mass distribution
Figure 8-9. In source collision induced fragmentation MS spectra of compound 6 in positive ion mode
Meas. m/z Formula m/z err [mDa] err [ppm] mSigma rdb e¯ Conf N-Rule
852.5706 C 47 H 83 N O 10 P 852.5749 4.3 5.0 32.2 7.5 even ok
852.5751
853.5804
854.5850855.6020
+MS, 5.5-5.5min #(329-331)
852.5749
853.5783
854.5816855.5850
C47H83NO10P, M ,852.580.0
0.5
1.0
1.5
2.0
4x10
Intens.
0
500
1000
1500
2000
2500
852.0 852.5 853.0 853.5 854.0 854.5 855.0 855.5 856.0 m/z
389.2624 429.2749 531.2325
557.4642
589.8352
690.5186 753.5132
801.7581
852.5706
+isCID MS, 5.5min #(330), Background Subtracted
0
1000
2000
3000
4000
5000
6000
Intens.
100 200 300 400 500 600 700 800 m/z

139
Figure 8-10. In source collision induced fragmentation MS spectra of compound 6 in negative ion mode
Meas. m/z Formula m/z err [mDa] err [ppm] mSigma rdb e¯ Conf N-Rule
850.5719 C 47 H 81 N O 10 P 850.5604 -11.5 -13.5 37.1 8.5 even ok
LC- TOF MS spectra of compound 7
Figure 8-11. LC-TOF MS spectra of compound 7 in positive ion mode
249.5165
281.2550
383.3456
417.2530
1-
565.6351
699.5157
1-
850.5719
1-
-isCID MS, 5.5min #(309), Background Subtracted
0
500
1000
1500
2000
Intens.
100 200 300 400 500 600 700 800 m/z
700.7627
877.6082
1+
+MS, 4.8min #(287), Background Subtracted
0.0
0.5
1.0
1.5
2.0
2.5
5x10
Intens.
100 200 300 400 500 600 700 800 900 1000 m/z
N+NO
PO
RO O
OHRO
OH

140
Meas. m/z Formula m/z err [mDa] err [ppm] mSigma rdb e¯ Conf N-Rule
877.6082 C 49 H 86 N 2 O 9 P 877.6065 -1.6 -1.8 8.4 8.5 even ok
Figure 8-12. Comparison of isotopic mass distribution of an ion fragment compared with the theoretical isotopic mass distribution
Figure 8-13. In source collision induced fragmentation MS spectra of compound 7 in positive ion mode
877.6082
1+
878.6105
1+
879.6130
1+
880.6179
1+
+MS, 4.8min #(287), Background Subtracted
877.6065
878.6099
879.6132880.6166
C49H86N2O9P, M ,877.610.0
0.5
1.0
1.5
2.0
5x10
Intens.
0
500
1000
1500
2000
2500
877.5 878.0 878.5 879.0 879.5 880.0 880.5 881.0 m/z
275.0768
1+
396.1584 613.3654
1+
763.3273 823.8591
16+
877.6077
1+
899.5905
1+
+isCID MS, 4.8min #(288), Background Subtracted
0
2
4
6
4x10
Intens.
200 300 400 500 600 700 800 m/z

141
Meas. m/z Formula Score m/z err [mDa] err [ppm] mSigma rdb e¯ Conf N-Rule
275.0768 C 10 H 16 N 2 O 5 P 34.31 275.0791 2.3 8.3 28.8 4.5 even ok
613.3654 C 31 H 54 N 2 O 8 P 5.91 613.3612 -4.2 -6.8 14.9 6.5 even ok
877.6077 C 49 H 86 N 2 O 9 P 100.00 877.6065 -1.2 -1.3 9.3 8.5 even ok
275.0768
1+
276.0816
1+
+isCID MS, 4.8min #(288), Background Subtracted
275.0791
276.0825
C10H16N2O5P, M ,275.080
1000
2000
3000
Intens.
0
500
1000
1500
2000
2500
274.75 275.00 275.25 275.50 275.75 276.00 276.25 276.50 276.75 277.00 m/z
613.3654
1+
613.7938
614.3690
1+
615.3375
1+
615.5782
+isCID MS, 4.8min #(288), Background Subtracted
613.3612
614.3646
615.3679
C31H54N2O8P, M ,613.360
1000
2000
3000
Intens.
0
500
1000
1500
2000
2500
613.0 613.5 614.0 614.5 615.0 615.5 m/z
}\
/I\

142
Figure 8-14. Comparison of isotopic mass distribution of an ion fragment compared with the theoretical isotopic mass distribution
Figure 8-15. In source collision induced fragmentation MS spectra of compound 7 in negative ion mode
Meas. m/z Formula m/z err [mDa] err [ppm] mSigma rdb e¯ Conf N-Rule
281.2542 C 18 H 33 O 2 281.2486 -5.6 -19.9 16.0 2.5 even ok
875.6044 C 49 H 84 N 2 O 9 P 875.5920 -12.4 -14.2 79.6 9.5 even ok
595.1442
595.3545
1+
596.3542
1+
597.7152
+isCID MS, 4.8min #(288), Background Subtracted
595.3507
596.3540
597.3573
C31H52N2O7P, M ,595.350
500
1000
1500
Intens.
0
500
1000
1500
2000
2500
595.0 595.5 596.0 596.5 597.0 597.5 598.0 m/z
281.2542
1-
315.2473 417.2488
1-
456.7976611.3562 699.4883
1-
777.6096
875.6044
1-
-isCID MS, 4.8min #(267), Background Subtracted
0
500
1000
1500
Intens.
100 200 300 400 500 600 700 800 900 m/z

143
Figure 8-16. Comparison of isotopic mass distribution of an ion fragment compared with the theoretical isotopic mass distribution
875.6044
1-
876.6077
1-
877.6105
1-
-isCID MS, 4.8min #(267), Background Subtracted
875.5920
876.5953
877.5987878.6020
C49H83N2O9P, M+nH ,875.590
500
1000
1500
Intens.
0
500
1000
1500
2000
2500
875.5 876.0 876.5 877.0 877.5 878.0 878.5 879.0 879.5 m/z
281.2542
1-
282.2638
1-
-isCID MS, 4.8min #(267), Background Subtracted
281.2486
282.2520
C18H32O2, M+nH ,281.250
500
1000
Intens.
0
500
1000
1500
2000
281.00 281.25 281.50 281.75 282.00 282.25 282.50 282.75 283.00 283.25 m/z

144
LC- TOF MS spectra of compound 8
Figure 8-17. LC-TOF MS spectra of compound 8 in positive ion mode
Meas. m/z Formula m/z err [mDa] err [ppm] mSigma rdb e¯ Conf N-Rule
603.5328 C 39 H 71 O 4 603.5347 1.9 3.1 13.8 4.5 even ok
718.5367 C 39 H 77 N O 8 P 718.5381 1.4 1.9 8.4 2.5 even ok [Ammonium adduct]
339.2865 436.5912 536.4182
603.5328
1+
686.7771
701.5124
1+
718.5367
1+
+MS, 5.9-6.0min #(351-355), Background Subtracted
0.0
0.5
1.0
1.5
2.0
2.5
4x10
Intens.
300 400 500 600 700 800 m/z
701.5124
1+
702.5128
1+
703.5168
1+
704.5347
1+
+MS, 5.9-6.0min #(351-355), Background Subtracted
701.5116
702.5150
703.5183
C39H73O8P, M+nH ,701.510
1000
2000
3000
Intens.
0
500
1000
1500
2000
701.0 701.5 702.0 702.5 703.0 703.5 704.0 704.5 705.0 m/z
OH
PO
RO
O
OH
RO

145
Figure 8-18. Comparison of isotopic mass distribution of an ion fragment compared with the theoretical isotopic mass distribution
603.5328
1+
604.5365
1+
605.5381
1+
+MS, 5.9-6.0min #(351-355), Background Subtracted
603.5347
604.5381
605.5414
C39H70O4, M+nH ,603.540
1
2
4x10
Intens.
0
500
1000
1500
2000
2500
603.0 603.5 604.0 604.5 605.0 605.5 606.0 606.5 607.0 m/z
718.5367
1+
719.5391
1+
720.5418
1+
+MS, 5.9-6.0min #(351-355), Background Subtracted
718.5381
719.5415
720.5448
C39H76NO8P, M+nH ,718.540
1
2
4x10
Intens.
0
500
1000
1500
2000
718.5 719.0 719.5 720.0 720.5 721.0 m/z

146
Figure 8-19. In source collision induced fragmentation MS spectra of compound 8 in positive ion mode
Meas. m/z Formula m/z err [mDa] err [ppm] mSigma rdb e¯ Conf N-Rule
603.5335 C 39 H 71 O 4 603.5347 1.2 2.0 9.8 4.5 even ok
Figure 8-20. In source collision induced fragmentation MS spectra of compound 8 in negative ion mode
Meas. m/z Formula m/z err [mDa] err [ppm] mSigma rdb e¯ Conf N-Rule
281.2540 C 18 H 33 O 2 281.2486 -5.4 -19.2 21.0 2.5 even ok
435.2644 C 21 H 40 O 7 P 435.2517 -12.7 -29.1 135.8 2.5 even ok
699.5183 C 39 H 72 O 8 P 699.4970 -21.3 -30.4 85.6 4.5 even ok
463.2170
1+
603.5335
1+
628.0668
1+
700.6937
+isCID MS, 5.8-5.9min #(344-354), Background Subtracted
0.0
0.2
0.4
0.6
0.8
1.0
4x10
Intens.
300 350 400 450 500 550 600 650 700 m/z
281.2540
1-
417.2435
1-
435.2644
699.5183
1-
-isCID MS, 5.8-5.9min #(325-335), Background Subtracted
0
200
400
600
800
Intens.
300 400 500 600 700 800 m/z

147
LC- TOF MS spectra of compound 9
Figure 8-21. LC-TOF MS spectra of compound 9 in positive ion mode
Meas. m/z Formula m/z err [mDa] err [ppm] mSigma rdb e¯ Conf N-Rule 891.6220 C 50 H 88 N 2 O 9 P 891.6222 0.2 0.2 30.7 8.5 even ok
Figure 8-22. In source collision induced dissociation (ISCID) MS spectra of compound 9 in positive ion mode
Meas. m/z Formula m/z err [mDa] err [ppm] mSigma rdb e¯ Conf N-Rule
289.0921 C 11 H 18 N 2 O 5 P 289.0948 2.6 9.1 4.3 4.5 even ok
891.6224 C 50 H 88 N 2 O 9 P 891.6222 -0.2 -0.2 18.4 8.5 even ok
316.3195
436.5812538.3069
744.5561
891.6220
1024.7499 1265.4250 1618.8365
+MS, 4.5min #(267)
0
2
4
6
4x10
Intens.
200 400 600 800 1000 1200 1400 1600 m/z
289.0921
1+
891.6224
1+
+isCID MS, 4.5min #(268), Background Subtracted
0.0
0.2
0.4
0.6
0.8
1.0
5x10
Intens.
300 400 500 600 700 800 900 m/z
N+NO
PO
RO O
OHRO
OCH3

148
Figure 8-23. Comparison of isotopic mass distribution of an ion fragment compared with the theoretical isotopic mass distribution
289.0921
1+
290.1010
1+
291.1167
1+
+isCID MS, 4.5min #(268), Background Subtracted
289.0948
290.0981
C11H18N2O5P, M ,289.100
1000
2000
3000
4000
Intens.
0
500
1000
1500
289.00 289.25 289.50 289.75 290.00 290.25 290.50 290.75 291.00 m/z
891.6220
892.6264
893.6366
894.6393 895.6552
+MS, 4.5min #(267)
891.6222
892.6255
893.6289
894.6322
C50H88N2O9P, M ,891.620
2
4
4x10
Intens.
0
500
1000
1500
2000
891.5 892.0 892.5 893.0 893.5 894.0 894.5 895.0 895.5 m/z
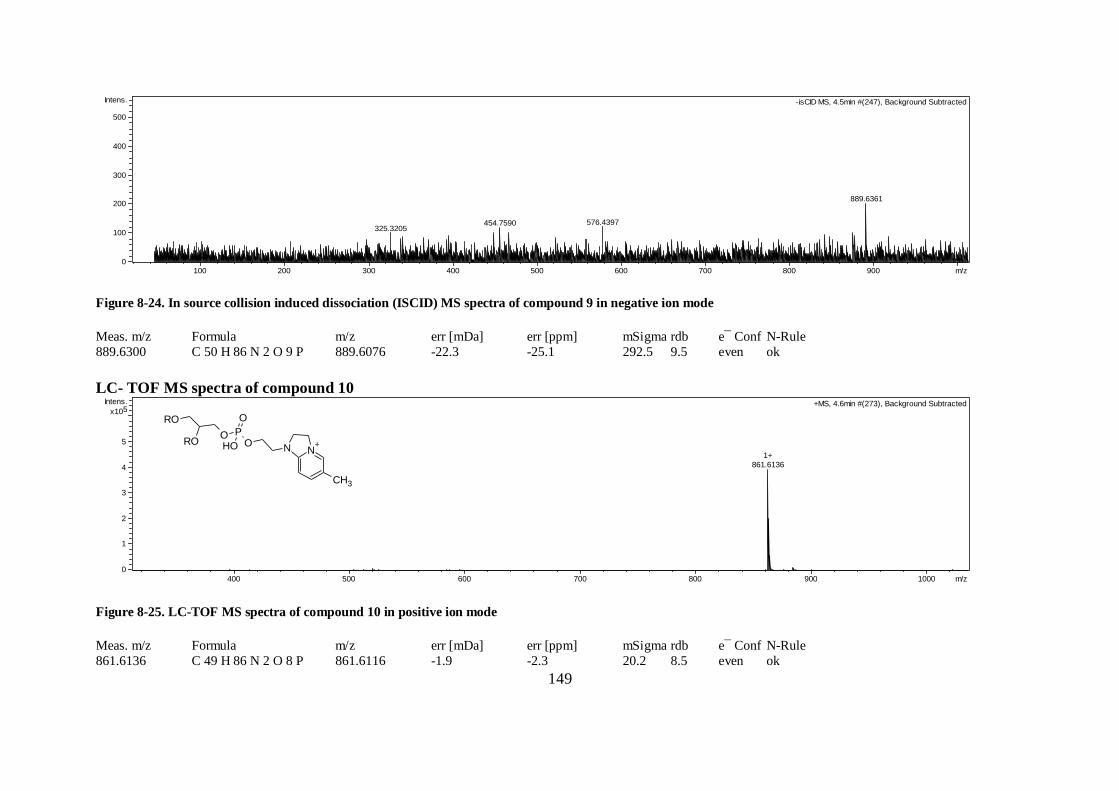
149
Figure 8-24. In source collision induced dissociation (ISCID) MS spectra of compound 9 in negative ion mode
Meas. m/z Formula m/z err [mDa] err [ppm] mSigma rdb e¯ Conf N-Rule
889.6300 C 50 H 86 N 2 O 9 P 889.6076 -22.3 -25.1 292.5 9.5 even ok
LC- TOF MS spectra of compound 10
Figure 8-25. LC-TOF MS spectra of compound 10 in positive ion mode
Meas. m/z Formula m/z err [mDa] err [ppm] mSigma rdb e¯ Conf N-Rule
861.6136 C 49 H 86 N 2 O 8 P 861.6116 -1.9 -2.3 20.2 8.5 even ok
325.3205454.7590 576.4397
889.6361
-isCID MS, 4.5min #(247), Background Subtracted
0
100
200
300
400
500
Intens.
100 200 300 400 500 600 700 800 900 m/z
861.6136
1+
+MS, 4.6min #(273), Background Subtracted
0
1
2
3
4
5
5x10
Intens.
400 500 600 700 800 900 1000 m/z
N+N
OPO
RO O
OHRO
CH3

150
Figure 8-26. In source collision induced dissociation (ISCID) MS spectra of compound 10 in positive ion mode
Figure 8-27. Zoom in version of the Figure 8-26
Meas. m/z Formula m/z err [mDa] err [ppm] mSigma rdb e¯ Conf N-Rule
259.0825 C 10 H 16 N 2 O 4 P 259.0842 1.7 6.5 33.1 4.5 even ok
579.3548 C 31 H 52 N 2 O 6 P 579.3558 1.0 1.6 44.2 7.5 even ok
597.3658 C 31 H 54 N 2 O 7 P 597.3663 0.5 0.9 21.3 6.5 even ok
861.6139 C 49 H 86 N 2 O 8 P 861.6116 -2.3 -2.7 3.7 8.5 even ok
597.3644
1+
861.6141
1+
1064.8902
1+
+isCID MS, 4.6min #(272), Background Subtracted, Background Subtracted
0.0
0.2
0.4
0.6
0.8
1.0
5x10
Intens.
200 300 400 500 600 700 800 900 1000 1100 m/z
259.0825
1+
327.4268 419.1233579.3537
1+ 597.3644
1+
628.9939700.8158 797.3946
863.6172
1+
883.5939
1+
+isCID MS, 4.6min #(272), Background Subtracted, Background Subtracted
0.0
0.5
1.0
1.5
2.0
2.5
4x10
Intens.
300 400 500 600 700 800 m/z

151
861.6136
1+
862.6166
1+
863.6184
1+
864.6198
1+
+MS, 4.6min #(273), Background Subtracted
861.6116
862.6150
863.6183
864.6217
C49H86N2O8P, M ,861.610
1
2
3
4
5x10
Intens.
0
500
1000
1500
2000
861.5 862.0 862.5 863.0 863.5 864.0 864.5 865.0 m/z
259.0825
1+
260.1004
1+
+isCID MS, 4.6min #(272), Background Subtracted
259.0842
260.0875
C10H16N2O4P, M ,259.080
1000
2000
Intens.
0
500
1000
1500
2000
2500
259.0 259.5 260.0 260.5 261.0 261.5 262.0 m/z
) I_

152
Figure 8-28. Comparison of isotopic mass distribution of an ion fragment compared with the theoretical isotopic mass distribution
579.3548
1+
579.9031
580.3626
1+
580.9582
+isCID MS, 4.6min #(272), Background Subtracted
579.3558
580.3591
581.3624
C31H52N2O6P, M ,579.360
1000
2000
3000
4000
Intens.
0
1000
2000
3000
578.5 579.0 579.5 580.0 580.5 581.0 581.5 m/z
597.3658
1+
598.3698
1+
599.1911 599.3608
1+
599.5320
+isCID MS, 4.6min #(272), Background Subtracted
597.3663
598.3697
599.3730
C31H54N2O7P, M ,597.370
2000
4000
6000
Intens.
0
500
1000
1500
2000
2500
597.5 598.0 598.5 599.0 599.5 m/z
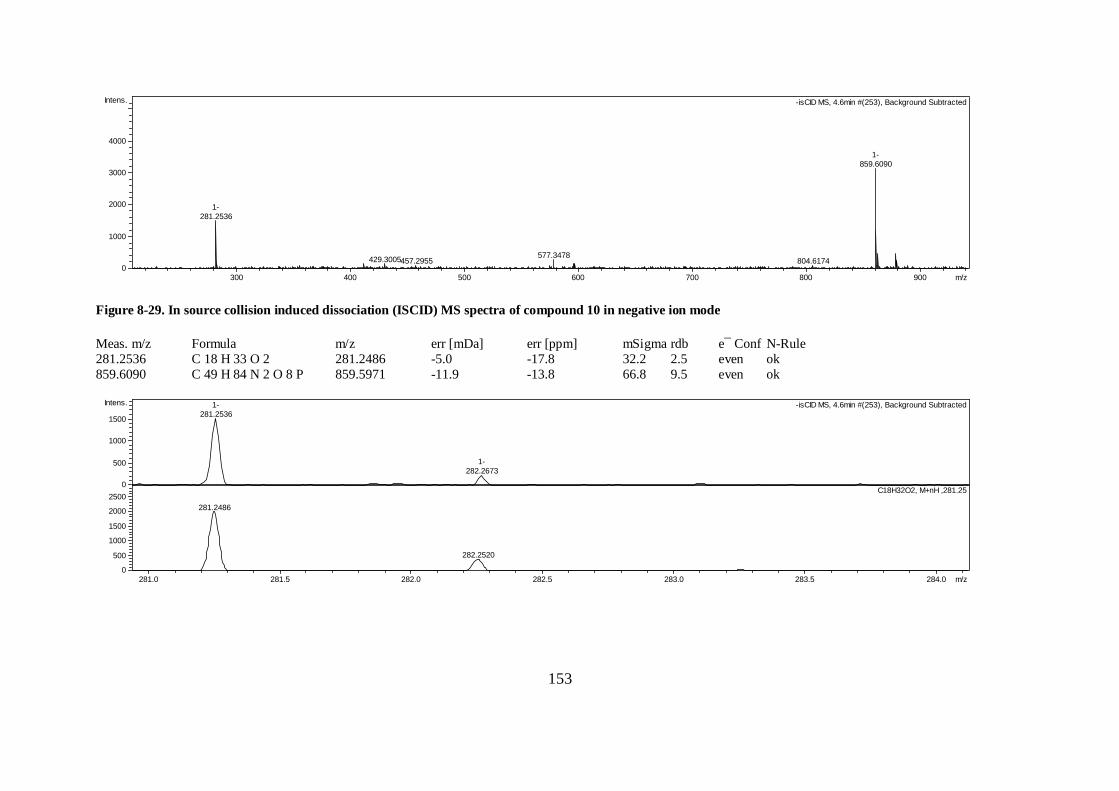
153
Figure 8-29. In source collision induced dissociation (ISCID) MS spectra of compound 10 in negative ion mode
Meas. m/z Formula m/z err [mDa] err [ppm] mSigma rdb e¯ Conf N-Rule
281.2536 C 18 H 33 O 2 281.2486 -5.0 -17.8 32.2 2.5 even ok
859.6090 C 49 H 84 N 2 O 8 P 859.5971 -11.9 -13.8 66.8 9.5 even ok
281.2536
1-
429.3005457.2955577.3478
804.6174
859.6090
1-
-isCID MS, 4.6min #(253), Background Subtracted
0
1000
2000
3000
4000
Intens.
300 400 500 600 700 800 900 m/z
281.2536
1-
282.2673
1-
-isCID MS, 4.6min #(253), Background Subtracted
281.2486
282.2520
C18H32O2, M+nH ,281.250
500
1000
1500
Intens.
0
500
1000
1500
2000
2500
281.0 281.5 282.0 282.5 283.0 283.5 284.0 m/z

154
Figure 8-30. Comparison of isotopic mass distribution of an ion fragment compared with the theoretical isotopic mass distribution
859.6090
1-
860.6072
1-
861.6210
1-
-isCID MS, 4.6min #(253), Background Subtracted
859.5971
860.6004
861.6038
C49H83N2O8P, M+nH ,859.600
2000
4000
Intens.
0
500
1000
1500
2000
2500
859.25 859.50 859.75 860.00 860.25 860.50 860.75 861.00 861.25 861.50 m/z

155
REFERENCES
Ackman, R. G. (1990). Canola fatty acids- an ideal mixture for health, nutrition, and food use. In F.Shahidi (Ed.), Canola and Rapeseed: production, chemistry, nutrition, and processing technology (pp. 81-98). New York: Van Nostrand Reinhold.
AOCS. (1990). The American Oil Chemists' Society Official Method Ce 1b-89 for marine oils.
Belitz, H. D., Grosch, W., & Schieberle, P. (2009). Food Chemistry. (4 ed.) Springer.
Brodnjak-Voncina, D., Kodba, Z. C., & Novic, M. (2005). Multivariate data analysis in classification of vegetable oils characterized by the content of fatty acids. Chemometrics and Intelligent Laboratory Systems, 75, 31-43.
Buettner, G. R. (1993). The pecking order of free radicals and antioxidants: lipid peroxidation, alpha-tocopherol, and ascorbate. Archives of Biochemistry and Biophysics, 300, 535-543.
Cai, L., Cao, A., Aisikaer, G., & Ying, T. (2013). Influence of kernel roasting on bioactive components and oxidative stability of pine nut oil. European Journal of Lipid Science and Technology, 115, 556-563.
Chandrasekara, N. & Shahidi, F. (2011). Oxidative stability of cashew oils from raw and roasted nuts. Journal of the American Oil Chemists' Society, 88, 1197-1202.
Choe, E. & Min, D. B. (2006). Mechanisms and factors for edible oil oxidation. Comprehensive
Reviews in Food Science and Food Safety, 5, 169-186.
De Wilde, T., De Meulenaer, B., Mestdagh, F., Govaert, Y., Vandeburie, S., Ooghe, W. et al. (2005). Influence of storage practices on acrylamide formation during potato frying. Journal of Agricultural and Food Chemistry, 53, 6550-6557.
Dubois, V., Breton, S., Linder, M., Fanni, J., & Parmentier, M. (2007). Fatty acid profiles of 80 vegetable oils with regard to their nutritional potential. European Journal of Lipid Science and Technology, 109, 710-732.
Durmaz, G. & Gokmen, V. (2011). Changes in oxidative stability, antioxidant capacity and phytochemical composition of Pistacia terebinthus oil with roasting. Food Chemistry, 128,
410-414.
Durmaz, G., Karabulut, I., Topcu, A., Asilturk, M., & Kutlu, T. (2010). Roasting-related changes in oxidative stability and antioxidant capacity of apricot kernel oil. Journal of the American Oil Chemists' Society, 87, 401-409.
Engels, C., Schieber, A., & Gänzle, M. (2012). Sinapic acid derivatives in defatted Oriental mustard (Brassica juncea L.) seed meal extracts using UHPLC-DAD-ESI-MSn and identification of compounds with antibacterial activity. European Food Research and Technology, 234, 535-542.
Fang, J., Seki, T., Tsukamoto, T., Qin, H., Yin, H., Liao, L. et al. Protection from inflammatory bowel disease and colitis-associated carcinogenesis with 4-vinyl-2,6-dimethoxyphenol (canolol)
involves suppression of oxidative stress and inflammatory cytokines. Carcinogenesis, (in press).

156
FAO (2011). Retrieved 2-27-0013, from http://faostat.fao.org/site/339/default.aspx
Frankel, E. N. (2005). Lipid oxidation. (2 ed.) England, UK: The Oily Press.
Galano, A., Francisco-Ma´rquez, M., & lvarez-Idaboy, J. R. (2011). Canolol: a promising chemical agent against oxidative stress. The Journal of Physical Chemistry B, 115, 8590-8596.
Hai, Z. & Wang, J. (2006). Detection of adulteration in camellia seed oil and sesame oil using an electronic nose. European Journal of Lipid Science and Technology, 108, 116-124.
Hamaguchi, N., Yokoyama, Y., Kasahara, Y., Hayashi, A., Sono, R., Tebayashi, S. i. et al. (2006).
Heat deterioration of phospholipids. IV. Thermally deteriorated products from phosphatidylethanolamine and several sugars. Journal of Oleo Science, 55, 607-613.
Hammond, E. G., Johnson, L. A., Su, C., Wang, T., & White, P. J. (2005). Soybean oil. In F.Shahidi (Ed.), Bailey's industrial oil and fat products (6 ed., pp. 577-653). New Jersey: Wiley Interscience, A John Wiley & Sons, Inc., Publication.
Harbaum-Piayda, B., Oehlke, K., Sönnichsen, F. D., Zacchi, P., Eggers, R., & Schwarz, K. (2010). New polyphenolic compounds in commercial deodistillate and rapeseed oils. Food Chemistry, 123, 607-615.
Hayashi, A., Yokoyama, Y., Hamaguchi, N., Tsuji, T., Tebayashi, S. i., Kim, C. S. et al. (2008). Heat deterioration of phospholipids. VI. Clarification of mechanism for the new pseudo Maillard
rearrangement reaction by using 2-aminoethyl dihydrogenphosphate. Journal of Oleo Science, 57, 93-97.
Hayashi, A., Yokoyama, Y., Kasahara, Y., Hamaguchi, N., Tsuji, T., Tebayashi, S. i. et al. (2007). Heat deterioration of phospholipids. V. a new rearrangement reaction of sugars and phosphatidylethanolamine. Journal of Oleo Science, 56, 277-281.
Himalayan News service (8-26-2011). On spot food quality test from next month. Retrieved 2-27-2013, from http://www.thehimalayantimes.com/fullTodays.php?headline=On+spot+food+quality+test+from+next+month+&NewsID=300698
Iqbal, M. C. M., Weerakoon, S. R., & Peiris, P. K. D. (2006). Variability of fatty acid composition in
interspecific hybrids of mustard Brassica juncea and Brassica napus. Ceylon Journal of Science (Biological Sciences), 35, 17-23.
Jham, G., Moser, B., Shah, S., Holser, R., Dhingra, O., Vaughn, S. et al. (2009). Wild Brazilian mustard (Brassica juncea L.) seed oil methyl esters as biodiesel fuel. Journal of the American Oil Chemists' Society, 86, 917-926.
Jiang, D. & Peterson, D. (2010). Role of hydroxycinnamic acids in food flavor: a brief overview. Phytochemistry Reviews, 9, 187-193.
Jung, M. Y., Yoon, S. H., & Min, D. B. (1989). Effects of processing steps on the contents of minor compounds and oxidation of soybean oil. Journal of the American Oil Chemists' Society, 66, 118-120.

157
Kamal-Eldin, A. & Appelqvist, L. (1996). The chemistry and antioxidant properties of tocopherols and tocotrienols. Lipids, 31, 671-701.
Kaushik, N. & Agnihotri, A. (1997). Evaluation of improved method for determination of rapeseed-mustard FAMEs by GC. Chromatographia, 44, 97-99.
Kerkaert, B., Mestdagh, F., Cucu, T., Shrestha, K., Van Camp, J., & De Meulenaer, B. (2012). The impact of photo-induced molecular changes of dairy proteins on their ACE-inhibitory
peptides and activity. Amino Acids, 43, 951-962.
Khattab, R., Eskin, M., Aliani, M., & Thiyam, U. (2010). Determination of sinapic acid derivatives in canola extracts using high-performance liquid chromatography. Journal of the American Oil Chemists' Society, 87, 147-155.
Koski, A., Pekkarinen, S., Hopia, A., Wähälä, K., & Heinonen, M. (2003). Processing of rapeseed oil: effects on sinapic acid derivative content and oxidative stability. European Food Research and Technology, 217, 110-114.
Kumazawa, S., Koike, M., Usui, Y., Nakayama, T., & Fukuda, Y. (2003). Isolation of sesaminols as antioxidative components from roasted sesame seed oil. Journal of Oleo Science, 52, 303-307.
Kuwahara, H., Kanazawa, A., Wakamatu, D., Morimura, S., Kida, K., Akaike, T. et al. (2004).
Antioxidative and antimutagenic activities of 4-vinyl-2,6-dimethoxyphenol (canolol) isolated from canola oil. Journal of Agricultural and Food Chemistry, 52, 4380-4387.
Lederer, M. O. & Baumann, M. (2000). Formation of a phospholipid-linked pyrrolecarbaldehyde from model reactions of d-glucose and 3-deoxyglucosone with phosphatidyl ethanolamine. Bioorganic and Medicinal Chemistry, 8, 115-121.
Lee, S. W., Jeung, M. K., Park, M. H., Lee, S. Y., & Lee, J. (2010). Effects of roasting conditions of sesame seeds on the oxidative stability of pressed oil during thermal oxidation. Food Chemistry, 118, 681-685.
Lizhi, H., Toyoda, K., & Ihara, I. (2010). Discrimination of olive oil adulterated with vegetable oils using dielectric spectroscopy. Journal of Food Engineering, 96, 167-171.
Maggio, R. M., Cerretani, L., Chiavaro, E., Kaufman, T. S., & Bendini, A. (2010). A novel
chemometric strategy for the estimation of extra virgin olive oil adulteration with edible oils. Food Control, 21, 890-895.
Manzocco, L., Calligaris, S., Mastrocola, D., Nicoli, M. C., & Lerici, C. R. (2000). Review of non-enzymatic browning and antioxidant capacity in processed foods. Trends in Food Science & Technology, 11, 340-346.
Marini, F., Balestrieri, F., Bucci, R., Magrì, A. D., Magrì, A. L., & Marini, D. (2004). Supervised pattern recognition to authenticate Italian extra virgin olive oil varieties. Chemometrics and Intelligent Laboratory Systems, 73, 85-93.
Matthaus, B. (2012). Effect of Canolol on Oxidation of Edible Oils. In U.Thiyam, M. Eskin, & B. Mattaus (Eds.), Canola and Rapeseed: Production, Processing, Food Quality, and Nutrition
(pp. 317-328). Boca Raton: CRC Press, Taylor & Francis Group.

158
Monfreda, M., Gobbi, L., & Grippa, A. (2012). Blends of olive oil and sunflower oil: Characterisation and olive oil quantification using fatty acid composition and chemometric tools. Food Chemistry, 134, 2283-2290.
Morley, K. L., Grosse, S., Leisch, H., & Lau, P. C. K. (2013). Antioxidant canolol production from a renewable feed stock via an engineered decarboxylase. Green Chemistry.
Mortuza, M. G., Dutta, P. C., & Das, M. L. (2006). Erucic acid content in some rapeseed/mustard
cultivars developed in Bangladesh. Journal of the Science of Food and Agriculture, 86, 135-139.
Nederal, S., Skevin, D., Kraljic, K., Obranovic, M., Papesa, S., & Bataljaku, A. (2012). Chemical composition and oxidative stability of roasted and cold pressed pumpkin seed oils. Journal of the American Oil Chemists' Society, 89, 1763-1770.
Potts, D. A., Rakow, G. W., & Males, D. R. (1999). Canola quality Brassica juncea, a new oilseed crop for the Canadian prairies. In 10th International Rapeseed Congress Canberra, Australia: The Regional Institute Ltd.
Prior, E., Vadke, V., & Sosulski, F. (1991). Effect of heat treatments on canola press oils. II. oxidative stability. Journal of the American Oil Chemists' Society, 68, 407-411.
Przybylski, R. (2011). Canola oil: physical and chemical properties. Retrieved 2-27-2013, from http://fr.canolacouncil.org/media/515239/canola_oil_physical_chemical_properties_1.pdf
Przybylski, R. & Eskin, N. A. M. (1988). A comparative study on the effectiveness of nitrogen or carbon dioxide flushing in preventing oxidation during the heating of oil. Journal of the American Oil Chemists' Society, 65, 629-633.
Przybylski, R., Mag, T., Eskin, N. A. M., & McDonald, B. E. (2005). Canola oil. In F.Shahidi (Ed.), Bailey's industrial oil and fat products (6 ed., pp. 61-121). New Jersey: Wiley Interscience, A John Wiley & Sons, Inc., Publication.
Ramos, M. J., Fernandez, C. M., Casas, A., Rodriguez, L., & Perez, A. (2009). Influence of fatty acid composition of raw materials on biodiesel properties. Bioresource Technology, 100, 261-268.
Schaich, K. M. (2005). Lipid oxidation: theoretical aspects. In F.Shahidi (Ed.), Bailey's industrial oil
and fat products (6 ed., pp. 269-355). New Jersey: Wiley Interscience, A John Wiley & Sons, Inc., Publication.
Shahidi, F. (1990). Canola and Rapeseed: production, chemistry, nutrition and processing technology. New York: Van Nostrand Reinhold.
Shantha, N. C. & Decker, E. A. (1994). Rapid, sensitive, iron-based spectrophotometric methods for determination of peroxide values of food lipids. Journal of AOAC International, 77, 421-424.
Shrestha, K., Gemechu, F. G., & De Meulenaer, B. (2013). A novel insight on the high oxidative stability of roasted mustard seed oil in relation to phospholipid, Maillard type reaction products, tocopherol and canolol content. Food Research International, 54, 587-594.

159
Shrestha, K., Stevens, C. V., & De Meulenaer, B. (2012). Isolation and identification of a potent radical scavenger (canolol) from roasted high erucic mustard seed oil from Nepal and its formation during roasting. Journal of Agricultural and Food Chemistry, 60, 7506-7512.
Sinha, A. K., Sharma, A., & Joshi, B. P. (2007). One-pot two-step synthesis of 4-vinylphenols from 4-hydroxy substituted benzaldehydes under microwave irradiation: a new perspective on the
classical Knoevenagel-Doebner reaction. Tetrahedron, 63, 960-965.
Spielmeyer, A., Wagner, A., & Jahreis, G. (2009). Influence of thermal treatment of rapeseed on the canolol content. Food Chemistry, 112, 944-948.
SzydlOwska-Czerniak, A. (2013). Rapeseed and its products- sources of bioactive compounds: a review of their characteristics and analysis. Critical Reviews in Food Science and Nutrition, 53, 307-330.
Tan, C. P., Che Man, Y. B., Selamat, J., & Yusoff, M. S. A. (2002). Comparative studies of oxidative stability of edible oils by differential scanning calorimetry and oxidative stability index methods. Food Chemistry, 76, 385-389.
Tasan, M. & Demirci, M. (2003). Trans FA in sunflower oil at different steps of refining. Journal of the American Oil Chemists' Society, 80, 825-828.
Thiyam, U., Claudia, P., Jan, U., & Alfred, B. (2009). De-oiled rapeseed and a protein isolate: characterization of sinapic acid derivatives by HPLC-DAD and LC-MS. European Food Research and Technology, 229, 825-831.
Totani, Y., Pretorius, H., & Plessis, L. (1982). Extraction of phospholipids from plant oils and colorimetric determination of total phosphorus. Journal of the American Oil Chemists' Society, 59, 162-163.
Vaidya, B. & Choe, E. (2011a). Effects of seed roasting on tocopherols, carotenoids, and oxidation in mustard seed oil during heating. Journal of the American Oil Chemists' Society, 88, 83-90.
Vaidya, B. & Choe, E. (2011b). Stability of tocopherols and lutein in oil extracted from roasted or unroasted mustard seeds during the oil oxidation in the dark. Food Science and Biotechnology,
20, 193-199.
Vaidya, B. & Eun, J. B. (2013). Effect of roasting on oxidative and tocopherol stability of walnut oil during storage in the dark. European Journal of Lipid Science and Technology, 115, 348-355.
van Vliet, M., van Kempen, G., Reinders, M., & de Ridder, D. (2005). Computational estimation of the composition of fat/oil mixtures containing interesterifications from gas and liquid chromatography data. Journal of the American Oil Chemists' Society, 82, 707-716.
Vujasinovic, V., Djilas, S., Dimic, E., Basic, Z., & Radocaj, O. (2012). The effect of roasting on the chemical composition and oxidative stability of pumpkin oil. European Journal of Lipid Science and Technology, 114, 568-574.
Wakamatsu, D., Morimura, S., Sawa, T., Kida, K., Nakai, C., & Maeda, H. (2005). Isolation, identification, and structure of potent alkyl-peroxyl radical scavenger in crude canola oil,
canolol. Bioscience, Biotechnology and Biochemistry, 69, 1568-1574.

160
Wijesundera, C., Ceccato, C., Fagan, P., & Shen, Z. (2008). Seed roasting improves the oxidative stability of canola (B. napus) and mustard (B. juncea) seed oils. European Journal of Lipid Science and Technology, 110, 360-367.
Wittkop, B., Snowdon, R., & Friedt, W. (2009). Status and perspectives of breeding for enhanced yield and quality of oilseed crops for Europe. Euphytica, 170, 131-140.
Zamora, R. & Hidalgo, F. J. (2005). Coordinate contribution of lipid oxidation and Maillard reaction
to the nonenzymatic food browning. Critical Reviews in Food Science and Nutrition, 45, 49-59.
Zamora, R., Alaiz, M., & Hidalgo, F. J. (2000). Contribution of pyrrole formation and polymerization to the nonenzymatic browning produced by amino-carbonyl reactions. Journal of Agricultural and Food Chemistry, 48, 3152-3158.
Zamora, R. & Hidalgo, F. J. (2003). Phosphatidylethanolamine modification by oxidative stress product 4,5(E)-epoxy-2(E)-heptenal. Chemical Research in Toxicology, 16, 1632-1641.
Zamora, R., León, M. M., & Hidalgo, F. J. (2011). Free radical-scavenging activity of nonenzymatically-browned phospholipids produced in the reaction between phosphatidylethanolamine and ribose in hydrophobic media. Food Chemistry, 124, 1490-
1495.
Zamora, R., Nogales, F., & Hidalgo, F. J. (2005). Phospholipid oxidation and nonenzymatic browning development in phosphatidylethanolamine/ribose/lysine model systems. European Food Research and Technology, 220, 459-465.
Zamora, R., Olmo, C., Navarro, J. L., & Hidalgo, F. J. (2004). Contribution of phospholipid pyrrolization to the color reversion produced during deodorization of poorly degummed vegetable oils. Journal of Agricultural and Food Chemistry, 52, 4166-4171.
Zhao, T., Hong, S. I., Lee, J., Lee, J. S., & Kim, I. H. (2012). Impact of roasting on the chemical composition and oxidative stability of perilla oil. Journal of Food Science, 77, C1273-C1278.

161
CURRICULUM VITAE
Kshitij Shrestha was born on 31st December, 1981 in Dhankuta, Nepal. In 2003, he
graduated his Bachelor‟s Degree in Food Technology from Tribhuvan University, Nepal. His
thesis entitled “study on the changes in mechanical properties (texture) of biscuit by the
sorption of moisture at different equilibrium relative humidity” was a result of original
research, and the results had been presented in a national conference. After working as a
quality control officer in a biscuit and confectionary industry for a year, he joined
“Department of Food Technology and Quality Control, Government of Nepal” in 2004 as a
food research officer. During this period, he was also involved in giving lectures on “Food
Engineering” to the students of Lalitpur Valley College, affiliated to Tribhuvan University. In
2007, he joined Master of Food Technology in Ghent University with VLIR scholarship, and
graduated in 2009 with the greatest distinction. His master thesis entitled “photo-oxidation of
milk proteins” was carried out in NutriFOODchem Unit, Department of Food Safety and
Food Quality, and the results have been published in a peer-reviewed scientific journal.
Since February 2010, he has been working on his PhD project entitled “Quality and safety of
mustard seed oil, a typical oil used for cold and cooking applications in Nepal” with support
from Special Research Fund (BOF) of Ghent University. The research has been carried out in
the NutriFOODchem laboratory, Department of Food Safety and Food Quality (Faculty of
Bioscience Engineering, Ghent University) under the guidance of Prof. Dr. ir. Bruno De
Meulenaer. The results of this research projects were published in a number of peer-reviewed
scientific journals and presented during several national and international symposia. During
this period, he also supervised seven students for the fulfillment of their Master thesis and has
given lectures on the Food Chemistry exercises to the students of Master of Science in
nutrition and rural development for two years. He was also involved in giving the practical
exercises in Food Chemistry and Analysis to the students of Master of Science in Food
Technology.

162
PUBLICATIONS OF MSc KSHITIJ SHRESTHA
PUBLICATIONS IN A1 JOURNALS
PUBLISHED
Kerkaert, B., Mestdagh, F., Cucu, T., Shrestha, K., Camp, J. V., De Meulenaer, B. (2012).
The impact of photo-induced molecular changes of dairy proteins on their ACE-
inhibitory peptides and activity. Amino Acids, 43, 951-962.
Shrestha, K., Stevens, C. V., De Meulenaer, B. (2012). Isolation and identification of a potent
radical scavenger (canolol) from roasted high erucic mustard seed oil from Nepal and
its formation during roasting. Journal of Agricultural and Food Chemistry, 60, 7506-
7512.
Shrestha, K., Gemechu, F. G., De Meulenaer, B. (2013). A novel insight on the high
oxidative stability of roasted mustard seed oil in relation to phospholipid, Maillard
type reaction products, tocopherol and canolol content. Food Research International,
54, 587-594.
Mubiru, E., Shrestha, K., Papastergiadis A., De Meulenaer, B. (2013). Improved gas
chromatography-flame ionization detector analytical method for the analysis of epoxy
fatty acids. Journal of Chromatography A, 1318, 217-225.
Shrestha, K., Jacxsens, L., De Meulenaer, B. (2013). Monte Carlo simulation based
prediction of blended oil composition containing mustard, rapeseed and soybean oils.
Accepted for publication in Food Research International, Special issue: authenticity,
typicality, traceability and intrinsic quality of food products, In press.
SUBMITTED FOR PUBLICATION
Shrestha, K., De Meulenaer, B. (2013). Antioxidant activity of Maillard type reaction
products between phosphatidylethanolamine and glucose. Submitted for publication.
Papastergiadis, A., Fatouh, A., Shrestha, K., Van Langenhove, H., De Meulenaer, B. (2013).
Investigation of the formation of 2-butenal in oils and foods during frying. Submitted
for publication.
IN PREPARATION
Shrestha, K., De Meulenaer, B. (2013). Effect of seed roasting in different Brassica species
(B. juncea, B. juncea var. oriental and B. napus). In preparation.
Mubiru, E., Shrestha, K., Papastergiadis, A., De Meulenaer, B. (2013). Development and
validation of a gas chromatography-flame ionization detector method for
determination of epoxy fatty acids in food matrices. In preparation.

163
Papastergiadis, A., Fatouh, A., Shrestha, K., Van Langenhove, H., De Meulenaer, B. (2013).
Formation of malondialdehyde, 4-hydroxy-2-nonenal, 4-hydroxy-2-hexenal and 2-
butenal in oil-in-water emulsions with different fatty acid composition by auto- and
photo-oxidation in the presence of riboflavin. In preparation.
Papastergiadis, A., Fatouh, A., Jacxsens, L., Lachat, C., Shrestha, K., Daelman, J., Kolsteren,
P., Van Langenhove, H., De Meulenaer, B. (2013) Exposure assessment of
malondialdehyde, 4-hydroxy-2-nonenal and 4-hydroxy-2-hexenal through specific
foods available in Belgium. In preparation.
PUBLICATIONS IN A2 JOURNALS
Shrestha, K., Shrestha, B. P., Bhattarai, U. K., (2006). Preparation of lapsi (Choerospondias
axillaries roxb.) pulp using intermediate moisture food (IMF) technology and study
on storage stability. Journal of Food Science and Technology Nepal, 2, 98-101.
Shrestha, R., Lama, J. P., Shrestha, K. (2010). Total polyphenols content and antioxidant
activity of different tea commercially produced in Nepal. Journal of Food Science
and Technology Nepal, 6, 73-79.
EXTENDED ABSTRACTS FOR SYMPOSIA
Shrestha, K., De Meulenaer, B. (2011). Computational estimation of soybean oil adulteration
in Nepalese mustard seed oil based on fatty acid composition. Communications in
Agricultural and Applied Biological Sciences, 76, 211-214.
ORAL PRESENTATIONS
Shrestha, K., Stevens, C. V., De Meulenaer, B. (2012). Isolation and identification of a potent
radical scavenger (canolol) from roasted high erucic mustard seed oil from Nepal and
its formation during roasting. Abstract of Scientific Papers of the 246th
ACS National
Meeting, Indianapolis, IN, USA.
Shrestha, K., Gemechu, F. G., De Meulenaer, B. (2013). A novel insight on the high
oxidative stability of roasted mustard seed oil in relation to phospholipid, Maillard
type reaction products, tocopherol and canolol content. Abstract of Scientific Papers
of the 246th
ACS National Meeting, Indianapolis, IN, USA.
Shrestha, K., Gemechu, F. G., De Meulenaer, B. (2012). Oxidative stability of roasted
mustard seed (high erucic variety) oil. Abstract of Scientific Papers of the 10th Euro
Fed Lipid Congress: Fats, Oils and Lipids: From Science and Technology to Health,
Cracow, Poland.
Shrestha, K., Subba, D. (2004). Study of sorption behavior of biscuit. Abstract of Scientific
Papers of the 4th
National Conference of Science and Technology, Kathmandu, Nepal.

164
PARTICIPATION AT SYMPOSIA AND WORKSHOPS
23 - 26th
March, 2004: 4th
National Conference of Science and Technology,
Kathmandu, Nepal.
20th December, 2010: The 16
th Symposium on Applied Biological Sciences Ghent,
Belgium.
23 - 26th September, 2012: 10
th Euro Fed Lipid Congress: Fats, Oils and Lipids: From
Science and Technology to Health, Cracow, Poland.
8 - 12th
September, 2013: 246th ACS National Meeting, Indianapolis, IN, USA.
DISSERTATION/THESIS WRITING
Shrestha, K. (2003). Study on the changes in mechanical properties (texture) of biscuit by the
sorption of moisture at different equilibrium relative humidity. Bachelor’s
dissertation. Tribhuvan University, Nepal.
Shrestha, K. (2009). Photo-oxidation of milk proteins. Master’s dissertation, Ghent
University, Belgium.
Shrestha, K. (2013). Mustard and rapeseed oils: authenticity, seed roasting and oxidative
stability. PhD dissertation, Ghent University, Belgium. (In preparation)
Supervised dissertations as tutor/co-tutor
Shrestha, R. (2010). Total polyphenols content and antioxidant activity of different tea
commercially produced in Nepal. Bachelor’s dissertation. Tribhuvan University,
Nepal.
Gemechu, F. G. (2011). Thermal oxidative stability of mustard seed oil. Master’s dissertation,
Ghent University, Belgium.
Salazar, N. A. (2011). Effect of roasting on the stabilization of Colombian rice bran. Master’s
dissertation, Ghent University, Belgium.
Rojas, D. M. (2011). Characterization of Colombian rice bran. Master’s dissertation, Ghent
University, Belgium.
Delm, K. V. (2012). Role of vitamin E in the interaction between sugarcane and the brown
rust fungus Puccinia melanocephala. Master’s dissertation, Ghent University,
Belgium.
Casteys, M. C. (2013). Rapeseed lecithin-glucose heated browning reaction products in
protection of oil against transition metal. Internship exchange dissertation, Ghent
University, Belgium.
Rubel, N. H. M. (2013). Quantitative determination of epoxy fatty acids in oils and foods by
gas-liquid chromatography. Ongoing Master’s dissertation, Ghent University,
Belgium.

165
Buyle, Z. (2013). Formation of epoxy fatty acids in oil-in-water emulsions prepared with
different oxidation levels of oils. Ongoing Master’s dissertation, Ghent University,
Belgium.
AWARDS/SCHOLARSHIPS/GRANTS
“Food Technology Scholarship” by Salt Trading Corporation (STC) (1999-2003)
“Excellent Student Award (Gold Medal)” in 2005 by Nepal Food Scientists &
Technologist‟s Association (NEFOSTA)
“Mahendra Bidyabhusan Medal (Gold Medal)” in 2005 from former King Gyanendra
of Nepal
VLIR-UOS Scholarship (2007- 2009)
“Excellent Student Award (Gold Medal)” in 2009 by Nepal Food Scientists &
Technologist‟s Association (NEFOSTA)
Special Research Fund (BOF)- Doctoral Scholarship (2010-2014)
FWO International Mobility Grant (2012)
PROFESSIONAL MEMBERSHIPS
American Chemical Society
Nepal Food Scientists & Technologist‟s Association