deconvolution of intermixed redox processes in ni-based
TRANSCRIPT

doi.org/10.26434/chemrxiv.13118642.v1
Deconvolution of Intermixed Redox Processes in Ni-basedCation-Disordered Li-Excess CathodesTzu-Yang Huang, Matthew Crafton, Yuan Yue, Wei Tong, Bryan D. McCloskey
Submitted date: 20/10/2020 • Posted date: 21/10/2020Licence: CC BY-NC-ND 4.0Citation information: Huang, Tzu-Yang; Crafton, Matthew; Yue, Yuan; Tong, Wei; McCloskey, Bryan D.(2020): Deconvolution of Intermixed Redox Processes in Ni-based Cation-Disordered Li-Excess Cathodes.ChemRxiv. Preprint. https://doi.org/10.26434/chemrxiv.13118642.v1
Cation-disordered rock-salt transition-metal oxides or oxyfluorides (DRX) have emerged as promising cathodematerials for Li-ion batteries due to their potential to reach high energy densities and accommodate diverse,lower cost transition-metal chemistries compared to conventional layered oxide materials. However, theintricate local coordination environment in DRX also results in complex electrochemical electron transferinvolving parallel mechanisms of transition-metal (TM) redox and oxygen (anionic) redox. Without decoupledand quantitative information of these intermixed redox processes, the origin of irreversibility, voltagehysteresis, and capacity fading is obscured, which impedes the development of strategies to address theseissues. Here we deconvolute the mixed redox processes in a Ni-based DRX,Li1.15Ni0.45Ti0.3Mo0.1O1.85F0.15, by combining 18O isotopic enrichment, differential electrochemical massspectrometry (DEMS), and ex-situ acid titration. The summation of TM-redox and oxygen-redox capacitiesmeasured through our approach agrees with the net electron transfer measured by the potentiostat. This studyreveals much less Ni oxidation efficiency (59.5%) than its initially designed efficiency (100%) due tocompetition of oxygen redox, which can occur at potentials as low as 4.1 V (vs. Li/Li+). We propose that thechemical approach presented in this work and its future extension can resolve and quantify various mixedredox processes in different DRX, which allows clear correlations among material design, deconvoluted redoxcapacities, and battery performance.
File list (2)
download fileview on ChemRxivpreprint_manuscript_TYH.pdf (1.16 MiB)
download fileview on ChemRxivSI_preprint_manuscript_TYH.pdf (1.38 MiB)

1
Deconvolution of Intermixed Redox Processes in
Ni-based Cation-Disordered Li-Excess Cathodes Tzu-Yang Huang1, 2, Matthew J. Crafton1, 2, Yuan Yue2, Wei Tong2, and Bryan D. McCloskey1, 2, 1Department of Chemical and Biomolecular Engineering, University of California–Berkeley, Berkeley, California 94720, United States 2Energy Storage and Distributed Resources Division, Lawrence Berkeley National Laboratory, Berkeley, California 94720, United States Correspondence: [email protected]
Summary Cation-disordered rock-salt transition-metal oxides or oxyfluorides (DRX) have emerged as
promising cathode materials for Li-ion batteries due to their potential to reach high energy densities and accommodate diverse, lower cost transition-metal chemistries compared to conventional layered oxide materials. However, the intricate local coordination environment in DRX also results in complex electrochemical electron transfer involving parallel mechanisms of transition-metal (TM) redox and oxygen (anionic) redox. Without decoupled and quantitative information of these intermixed redox processes, the origin of irreversibility, voltage hysteresis, and capacity fading is obscured, which impedes the development of strategies to address these issues. Here we deconvolute the mixed redox processes in a Ni-based DRX, Li1.15Ni0.45Ti0.3Mo0.1O1.85F0.15, by combining 18O isotopic enrichment, differential electrochemical mass spectrometry (DEMS), and ex-situ acid titration. The summation of TM-redox and oxygen-redox capacities measured through our approach agrees with the net electron transfer measured by the potentiostat. This study reveals much less Ni oxidation efficiency (59.5%) than its initially designed efficiency (100%) due to competition of oxygen redox, which can occur at potentials as low as 4.1 V (vs. Li/Li+). We propose that the chemical approach presented in this work and its future extension can resolve and quantify various mixed redox processes in different DRX, which allows clear correlations among material design, deconvoluted redox capacities, and battery performance.

2
Keywords Cation-disordered, Li-excess, anionic redox, oxygen redox, Li-ion batteries, water oxidation, water splitting, mass spectrometry, Pourbaix diagram
Introduction Improving the limited energy density and lowering the cost of traditional cathode materials
in Li-ion batteries has become increasingly crucial with the surging demands from portable-electronic and electric-vehicle markets. New cathode chemistries such as cation-disordered rock-salt transition-metal oxides or oxyfluorides (DRX)1–6 have gained considerable attention due to their potential in outperforming conventional layered lithium-intercalation chemistry. Sufficient lithium excess in DRX materials can facilitate lithium-ion diffusion and percolation through lattice tetrahedral holes having low energy barriers.1,2 In certain compositions, over 0.7 Li per unit formula (Li1+xTM1−xO2−yFy, where TM represents transition metal and 0 < x, y < 1) are electrochemically accessible, which leads to exceptionally high capacity that can surpass 300 mAh g−1.3–5 Even though some Li-excess layered oxides have shown comparable capacity, they typically require one of the following constraints: 1) specific transition-metal chemistry (TM = [Mn, Co, Ni] or Ir in Li1+xTM1−xO2);6–9 2) specific Li-excess extent (x = 1/3, 2/3 in Li1+xTM1−xO2 which are equivalent to Li2TMO3, Li5TMO6).10–13 On the other hand, the limitation to form a stable layered structure is relaxed for DRX materials. Accommodating various transition metal ions into the DRX lattice with a variable Li-excess range not only enlarges the domain of design and optimization, but also enhances the feasibility of cobalt-free cathode materials and therefore avoids the consequential cost of using cobalt.6,14 Thus, DRX materials’ capability of reaching a high energy density, increasing design flexibility, and reducing cost makes it a prominent candidate for next-generation cathodes in Li-ion batteries.
However, the diverse metal-oxide (or metal-oxyfluoride) chemistry in the DRX lattice also leads to a complex local coordination environment15–17 and further obscures underlying redox processes. First, the inherent cation-mixing and Li-excess nature of the DRX material has been argued as the major cause of non-bonding O 2p orbitals at a higher energy level than analogous bonding TM−O bands.13,18 Second, various extents of frontier-orbital interelectronic repulsion (Mott-Hubbard splitting)13,19 and octahedral distortion (Jahn-Teller effect)20,21 were suggested to level down a portion of split anti-bonding TM−O bands with predominant TM character. Arising from the two prerequisites described above, overlapping of the lowered TM-dominated band and the elevated O-dominated band results in parallel mechanisms of transition-metal redox and oxygen redox,6,13,18,19 which is atypical in Li-stoichiometric layered materials (x = 0 in Li1+xTM1−xO2). While X-ray22–29 and magnetic-resonance10 spectroscopic research has elucidated TM redox and

3
oxygen redox in structurally ordered oxides, few studies can successfully resolve and quantify each redox process’s contribution to capacity individually. Most cathode materials lacking a proper standard reference spectrum require data-driven principal component analysis30 or simplified coordination models23 to best-fit the ratio of oxidized TM, but materials with varying indistinct local coordination, such as that induced by severe cation migration,25 could obscure the exact TM formal valences of the selected spectral components. Similarly, numerical fitting with the aid of capacity (regressand, the dependent variable in regression analysis) in the voltage profile is typically required to obtain parameters that translate spectroscopic shape30 or intensity28 (regressor, the independent variable in regression analysis) into oxygen redox capacity. Non-arbitrary assignment of spectrum peak ranges and positions that represent the oxidized oxygen could be challenging due to strong adjacent peaks and background signals. As a result, direct counting of electrochemical electron transfer from spectroscopic information remains hard to achieve, especially for DRX materials with extremely intricate short-range structure.
In light of these challenges, this work combines isotopic enrichment, ex-situ acid titrations, and mass spectrometry (TiMS) to deconvolute the interwoven transition-metal and oxygen redox processes in a DRX cathode. This combination allows accurate quantification of various gas molecules released from distinguishable reactions when the charged (delithiated) DRX material is etched and dissolved by strong acid. The well-defined stoichiometry of H+-participating outgassing reactions facilitates unambiguous backcalculation of the electrochemical capacity contributed from solid-state TM redox and oxygen redox, respectively. Moreover, in-situ differential electrochemical mass spectrometry (DEMS) monitors and quantifies oxygen redox involving irreversible gaseous O2 loss that is usually not captured by other approaches. Adding each component capacity of the various redox processes measured using our analytical techniques matches the net electron transfer measured by the potentiostat, with a difference of less than 10 mAh g−1 at any given potential. From these measurements, we reveal that oxygen redox in DRX can occur in parallel with TM redox above the potential as low as 4.1 V (vs. Li/Li+). The competition of intermixed redox processes leads to much lower TM oxidation efficiency (∼60%) than its hypothetical value (100%), with which the DRX was initially designed. As new DRX material designs are considered, we anticipate these techniques and results to be valuable to probe the various intermixed redox processes described above to optimize charge compensation reversibility.
Results Isotopic Enrichment
In this study, we will be monitoring gas evolution from DRX materials in operational batteries and during their immersion in aqueous acid solutions. Because the same gas species could

4
originate from either the DRX active material or its surrounding liquid environment (e.g., electrolyte degradation and oxidation of surface carbonate impurities both contribute to CO2 evolution in batteries), distinguishing among mixed gas evolution sources and reactions is clearly important. To decouple these various contributions, we first implemented 18O isotopic enrichment on a model Ni-based DRX material, Li1.15Ni0.45Ti0.3Mo0.1O1.85F0.15 (NTMF). NTMF powder was placed in a sealed tube with a known quantity of 18O-containing (97 at%) O2 in the headspace and was heated to facilitate oxygen isotopic exchange (see the Experimental Procedure and Figure S1 for details). Previous studies have shown both surface native carbonate, which invariably remains after synthesis and handling of oxide cathode materials, and the transition-metal oxide lattice oxygen can be partially enriched with 18O through the as-described method, where isotopic compositions and enrichment level of carbonate were measured by strong acid titration afterwards.31 Titrating 18O-enriched surface residual carbonate specified that it had a 39.9 mol% 18O enrichment ( 18O/(16O + 18O) ) with an almost uniform binomial distribution, indicating uniform enrichment of the carbonate throughout the NTMF material (Table S1). By analyzing the tube headspace composition after the labelling procedure with mass spectrometry, the bulk mean 18O enrichment within the NTMF lattice is estimated to be 11.7 mol%, excluding surface carbonate. Detailed enrichment processes and calculations are described in the Supplemental Information (SI) Note S1. Of note, the overall 18O enrichment level in the NTMF is higher than that in Ni-Mn-Co layered oxides (3%–7%) following similar procedures,32 which implies faster oxygen exchange kinetics for NTMF than the conventional layered oxides. We further performed X-ray powder diffraction (XRD) and electrochemical tests to verify if the heating process impacts the nature of NTMF. As shown in Figure 1a, no substantial difference in XRD patterns was observed, which means that the extended rock-salt phase persists after isotopic enrichment. In addition, nearly identical first-cycle voltage profiles (Figure 1b) between the enriched and as-received NTMF suggest no significant alterations in dominant redox mechanisms. The structural and electrochemical invariance thus justifies that the NTMF bulk redox chemistry is very likely unaffected by the 18O-enrichment procedure.

5
Figure 1. Characterization of Li1.15Ni0.45Ti0.3Mo0.1O1.85F0.15 (NTMF) before and after isotopic enrichment. (a) X-ray diffraction patterns of NTMF before (blue dotted line) and after (black line) 18O-enrichment. Green vertical bars denote Bragg diffraction peak positions calculated by using the Fm3�m space group, lattice parameter a = 4.14146 Å,33 and Cu Kα radiation. (b) First-cycle voltage profiles of pristine (blue dotted line) and 18O-enriched (black line) NTMF at a rate of 0.1 Li+ h−1 without holding at the 4.8 V switching voltage, showing no substantial change in bulk redox chemistry after isotopic enrichment.
In-situ Monitoring of Outgassing Reactions Gas release during electrochemical operation is a crucial indicator of both irreversible oxygen
evolution and deleterious cathode-electrolyte interactions. To quantitatively analyze outgassing, we performed DEMS with 18O-enriched NTMF as the cathode material. Figure 2a shows a representative result obtained from DEMS analysis of 18O-enriched NTMF, which provides the charging profile of a NTMF cathode along with O2 evolution rates during a constant-rate (0.1 Li+ h−1, 29.5 mA g−1) charge followed by a voltage hold at 4.8 V vs. Li/Li+. We observe that the O2 evolution onset potential is around 4.5 V, in accord with our previous study.33 DEMS further discloses the distribution among 16,16O2, 16,18O2, and 18,18O2 evolution. The onset potential of the three isotopic O2 species is identical (Figure S2a) and suggests no kinetic isotope effect as well as similar electrochemical origins for each of the O2 isotopes, which is lattice oxygen redox that results in irreversible gaseous O2 loss. Table 1 compares the cumulative isotopic O2 compositions evolved from three distinct electrodes charged to various cut-off voltages as well as the solid-state bulk mean 18O enrichment calculated from the post-enrichment tube headspace oxygen balance. The overall amount of O2 evolved is useful to backcalculate quantitative capacity

6
contributions (reasonably assuming 4 electrons per O2 loss), which will be addressed in the last part of the discussion.
As shown in Table 1, the distribution among isotopic O2 species remains similar at cut-off voltages from 4.6 V to 4.8 V, while net 18O enrichment in O2 loss decreases slightly and approaches the lattice bulk mean value as the cut-off voltage increases. This result implies that near the onset potential, O2 loss begins from the NTMF crystal surface where solid-state 18O enrichment is expected to be higher than the core.32 The higher enrichment extent near the surface of the NTMF particle likely arises from the nature of our isotopic enrichment process, during which exposure time, temperature, and lattice-oxygen-exchange kinetics should result in a surface enrichment gradient. Converting differential isotopic O2 evolution rates into 18O enrichment along the voltage profile (Figure S2b) further shows a higher 18O enrichment level near the gaseous O2 onset than at higher states of charge (≈ lattice bulk mean value). Nevertheless, the initial deviation of 18O enrichment in evolved O2 compared to the solid-state bulk mean 18O enrichment value is particularly small (Table 1). Notice that cumulative O2 loss is < 3% of total lattice oxygen even at the high cut-off voltage (4.8 V) hold. Given these results, it is clear that the bulk mean 18O enrichment calculated from the oxygen balance accurately describes the overall solid-state enrichment level within the NTMF crystal even though a near surface radial gradient exists.
Table 1. Isotopic Distribution of in-situ O2 Loss and its 18O Enrichment
Cut-off Voltages (V)
Distribution (%) Enrichment 18O (%)
O2 loss a
(mmol mol−1) 16,16O2 16,18O2 18,18O2
4.6 77.7 19.4 2.9 12.6 5.9 4.7 78.0 19.2 2.8 12.4 14.0 4.8 78.3 18.9 2.8 12.2 26.0
Bulk b 11.7
a Amount normalized to the net mole of active material, NTMF; b Lattice bulk mean value obtained from the enrichment process.
CO2 outgassing monitored in-situ by DEMS provides additional and integral information to track surface reactivity. Because the NTMF surface native carbonate (NACN) is 18O-enriched, we can utilize the quantitative distribution among gaseous C16,16O2, C16,18O2, and C18,18O2 to decouple different contributions during electrochemical operation. Previous studies have ruled out conductive carbon in TM-oxide composite cathodes as the carbon source for CO2 evolution34 and accordingly have reasoned that double-tagged C18,18O2 predominantly evolves from NACN decomposition.31,35 Therefore, combining C18,18O2 outgassing DEMS data with the known solid-

7
state isotopic distribution in NACN allows quantification of CO2 originating directly from NACN oxidation,36 while the rest of the CO2 is evolved from electrolyte degradation (Table S2). The bar graph in Figure 2b depicts cumulative CO2 arising from NACN oxidation (NACN-CO2) and electrolyte degradation (Elyte-CO2), respectively, from NTMF-cathodes charged to various cut-off voltages. With a cut-off voltage of 3.9 V, no significant CO2 evolution was observed. The amount of Elyte-CO2 gradually increases as the cut-off voltage is increased from 4.0 V to 4.6 V, while NACN-CO2 evolution begins at a relatively higher voltage (4.4 V). When the cathode’s potential surpasses 4.6 V, cumulative Elyte-CO2 rises dramatically, more than twofold, which signals the onset of pronounced electrolyte degradation.
In addition, we observe 18O integrated into CO2 that evolves from electrolyte degradation (Figure 2b), indicating that reactive oxygen species originating from either NACN or NTMF lattice oxidation can contribute to electrolyte degradation. The line graph in Figure 2b further displays the 18O enrichment in Elyte-CO2 as a measure to evaluate the extent of cathode (NACN or lattice oxidation)-induced electrolyte degradation. By increasing the cut-off voltage from 4.0 V to 4.5 V, the 18O content in Elyte-CO2 increases from 0% to 14%, which suggests escalating parasitic reactions between the electrolyte and species originating from NACN or oxide oxidation. Below 4.5 V, we expect that the origin for this 18O integration is predominantly from reactive oxygen species emanating from NACN given the following explanation. It is highly likely that one of the oxygen atoms in Elyte-CO2 originated from the electrolyte solvent molecules31,35 (which contains essentially no 18O), so we expect at most ∼ 6% 18O content in Elyte-CO2 if we assumed that all 18O originates from the NTMF lattice. In fact, we observed 14% 18O in Elyte-CO2 at 4.5 V, more than double the 18O possible if it originated from the NTMF lattice. Given these results, it is clear that reactive oxygen species released from the direct oxidation of NACN,36 with 39.9% 18O enrichment, has to contribute significantly to electrolyte degradation and subsequent Elyte-CO2 outgassing at voltages ≤ 4.5 V. A considerable drop of the 18O enrichment in Elyte-CO2 occurs with a cut-off voltage ≥ 4.6 V and is likely due to the competition of disparate electrolyte degradation processes. With the probable mechanism described previously for electrolyte solvent degradation, the 6%–7% 18O content in Elyte-CO2 above 4.6 V implies that reactive oxidized oxygen species released from NTMF lattice (e.g., reactive superoxo, peroxo, or singlet oxygen) reacts with the electrolyte solvent, and is therefore likely to be the predominant source of 18O in Elyte-CO2 at cut-off voltages ≥ 4.6 V.

8
Figure 2. In-situ gas evolution (DEMS) and ex-situ acid titration (TiMS) of NTMF. (a) Voltage profile (black line) and isotopic O2-loss rates (solid circles) for 18O-enriched NTMF charged at 0.1 Li+ h−1 (29.5 mA g−1) to 4.8 V (vs. Li/Li+), subsequently held at 4.8 V until the current rate dropped to 0.01 Li+ h−1 (2.95 mA g−1) and allowed to rest at open circuit after the voltage hold. (b) Cumulative CO2 evolution from native-carbonate decomposition (NACN-CO2, plum bars) and electrolyte degradation (Elyte-CO2, blue bars), obtained from DEMS. Blue hollow markers indicate 18O content in Elyte-CO2, suggesting surface reactivity of NTMF. (c) Isotopic O2-release rates for the extracted 4.5 V-cathode titrated by 10 M H2SO4. Zoomed inset displays 16,18O2 and 18,18O2 release at a lower order of magnitude than untagged O2. (d) Amount of native carbonate (NACN, plum bars) and carbonate-like solid deposits from electrolyte degradation (Elyte-deposit, blue bars), quantified by TiMS. Uncharged cathode is shown at the average open circuit voltage, 3.0 V, during the rest period before charge. Blue hollow markers indicate 18O content in the Elyte-deposit. All quantities of gases and surface deposits are normalized to the net mole of active material, NTMF.

9
Ex-situ Titration Mass Spectrometry Surface Carbonates
Surface carbonates are mixtures of residual NACN (carbonates that inevitably remain after material synthesis and transfer in air) and parasitic reaction products formed during electrochemical operation. Ex-situ acid titration (denoted as TiMS) decomposes carbonate-like species to release CO2.31,32,35 By adopting isotopic analysis similar to that of in-situ CO2 outgassing, TiMS can decouple NACN and electrolyte-originating carbonate deposits (denoted as Elyte-deposit) quantitatively. As shown in the bar graph of Figure 2d, the amount of NACN decreases moderately as the cut-off voltage increases, which is complementary to the gradual increase of in-situ NACN-CO2 outgassing measured during battery charge (Figure 2b). Adding up the quantity of residual NACN and NACN-CO2 at each cut-off voltage corresponds to the initial quantity of solid-state NACN (at open-circuit voltage, OCV ≈ 3.0 V), which implies that in-situ degradation of NACN leads to CO2 outgassing directly in a stoichiometric amount. On the other hand, the Elyte-deposit grows much more drastically than the NACN diminishes. The growing Elyte-deposit is likely to cover both NACN and NTMF lattice surface, which can be one carbon source for Elyte-CO2 outgassing (Figure 2b). The line graph of Figure 2d displays low 18O content < 5% in Elyte-deposit and exhibits no substantial variation across the voltage window, which suggests electrolyte solvent as the predominant oxygen source of carbonate-like Elyte-deposits.
Lattice Oxidized Species To identify various oxidized species that form during charge, we exploit their instability and
subsequent characteristic gas emission in an acidic environment. As will be shown, analyzing the mixture of gases evolved from a charged NTMF-electrode immersed in strong acid with mass spectrometry facilitates quantification of oxidized components, both the transition metal and lattice oxygen oxidation, within the NTMF bulk. Previous studies have elucidated that lattice oxidized oxygen in layered oxides can disproportionate in acid and produce O2.31,37 In this work, we further extend the technique and discover that water splitting by oxidized Ni ions (Ni3+ or Ni4+) that are dissolved from the NTMF lattice also leads to gaseous O2 release during the acid titration. Figure 2c presents one representative TiMS result with isotopic O2 emission from a 4.5 V-cathode etched by 10 M H2SO4, which reveals that the amount of untagged O2 (16,16O2) and tagged O2 (16,18O2 + 18,18O2) differs by over an order of magnitude. TiMS of the extracted cathode at a cut-off voltage as low as 3.9 V even displays prevailing 16,16O2 release with almost no detectable 18O-tagged O2 species (Table S3). No O2 emission is observed from an uncharged cathode immersed in acid. The significant deviation of TiMS results from the isotopic distribution of O2 loss monitored in-situ by DEMS (Figure 2a and Table 1) clearly indicates that at least two oxygen sources, including NTMF lattice oxidized oxygen, can contribute O2 release during the acid titration. We verified H2O as the additional source of oxygen by a control experiment, which

10
swapped the initial 18O-labelling conditions: titrating an untagged NTMF cathode with H218O-containing H2SO4 solution. We ascribe this additional O2 emission to water oxidation by oxidized nickel (Ni3+ or Ni4+).
Known bulk mean 18O enrichment within the solid-sate NTMF allows deconvolution of two different oxygen sources, depicted schematically in Figure 3. Figure 3 shows the NTMF particle surface immersed in acidic aqueous solution, where the dissolution and subsequent O2-release reactions discussed below take place. Specifically, we assign all 18O-tagged O2 release to disproportionation of dissolved lattice oxidized oxygen species whose net amount, including a portion of untagged 16,16O2, can then be calculated given the total 18O enrichment in the lattice. The remainder of the 16,16O2 evolved accordingly determines the quantity of water splitting. See SI Note S3 for calculation details. Table S3 compares TiMS results of electrodes extracted at various cut-off voltages. Charged NTMF-cathodes exhibit O2 emission from water splitting universally at all cut-off voltages above the initial OCV, while the disproportionation of NTMF-originating oxidized oxygen occurs significantly with cathodes charged above 4.1 V. TiMS of an uncharged NTMF cathode at OCV yields no detectable O2 release, which indicates that TM species at their initial oxidation states, namely Ni2+, Ti4+, and Mo6+, do not participate in water oxidation. Thus, we can exclude Ti4+ and Mo6+ from the water-splitting stoichiometry. It is noted that two factors could affect the accuracy of our isotopic analysis and deconvolution: 1) tagged H2O produced from either NTMF lattice oxide dissolution or the disproportionation reaction; 2) natural abundance of 18O in H2O. However, H2O molecules from the above two sources are present in much smaller quantities than untagged water in the acid solution. NTMF-originating H218O is at most, by assuming all lattice oxygen atoms form water molecules, 0.04% of H2O in the acid solution (∼8 mg NTMF in 2.5 mL 10 M H2SO4, density ≈ 1.55 g mL−1). Natural abundance of 18O is as low as 0.2%, which is two-orders-of-magnitude smaller than the bulk mean 18O enrichment of the NTMF lattice. The impact of these two factors is clearly subtle and most likely insignificant, as implied by the particularly small amount of tagged O2 release from cathodes extracted below 4.1 V (Table S3). Therefore, the as-described decoupling method can properly facilitate the following stoichiometric analysis with negligible interference.
Here we posit that during the acid titration, the dissolved oxidized oxygen species from NTMF lattice preferentially dimerize due to a close frontier-orbital energy and symmetry match, followed by disproportionation reaction, where star symbols denote partial 18O enrichment:
Meanwhile, oxidized Ni ions dissolved from NTMF lattice induce the water-splitting reaction, where n = 3 or 4:
2 [ O ∗ ⋅⋅⋅⋅⋅ O ∗ ]2− + 4 H+ �⎯⎯� O ∗ 2 ↑ + 2 H2 O ∗ (1)
4 Ni𝑛𝑛+ + 2(𝑛𝑛 − 2) H2O �⎯⎯� 4 Ni𝑛𝑛+ + (𝑛𝑛 − 2) O2 ↑ + 4(𝑛𝑛 − 2) H+ (2)
11
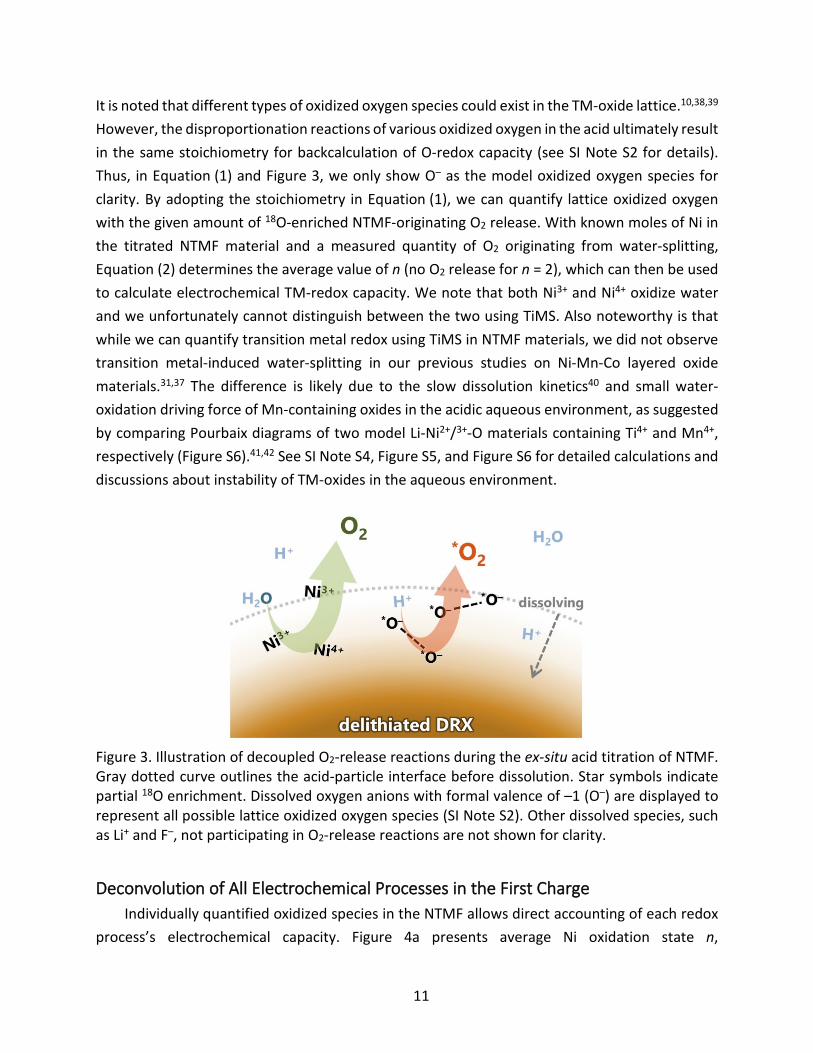
It is noted that different types of oxidized oxygen species could exist in the TM-oxide lattice.10,38,39 However, the disproportionation reactions of various oxidized oxygen in the acid ultimately result in the same stoichiometry for backcalculation of O-redox capacity (see SI Note S2 for details). Thus, in Equation (1) and Figure 3, we only show O– as the model oxidized oxygen species for clarity. By adopting the stoichiometry in Equation (1), we can quantify lattice oxidized oxygen with the given amount of 18O-enriched NTMF-originating O2 release. With known moles of Ni in the titrated NTMF material and a measured quantity of O2 originating from water-splitting, Equation (2) determines the average value of n (no O2 release for n = 2), which can then be used to calculate electrochemical TM-redox capacity. We note that both Ni3+ and Ni4+ oxidize water and we unfortunately cannot distinguish between the two using TiMS. Also noteworthy is that while we can quantify transition metal redox using TiMS in NTMF materials, we did not observe transition metal-induced water-splitting in our previous studies on Ni-Mn-Co layered oxide materials.31,37 The difference is likely due to the slow dissolution kinetics40 and small water-oxidation driving force of Mn-containing oxides in the acidic aqueous environment, as suggested by comparing Pourbaix diagrams of two model Li-Ni2+/3+-O materials containing Ti4+ and Mn4+, respectively (Figure S6).41,42 See SI Note S4, Figure S5, and Figure S6 for detailed calculations and discussions about instability of TM-oxides in the aqueous environment.
Figure 3. Illustration of decoupled O2-release reactions during the ex-situ acid titration of NTMF. Gray dotted curve outlines the acid-particle interface before dissolution. Star symbols indicate partial 18O enrichment. Dissolved oxygen anions with formal valence of –1 (O–) are displayed to represent all possible lattice oxidized oxygen species (SI Note S2). Other dissolved species, such as Li+ and F–, not participating in O2-release reactions are not shown for clarity.
Deconvolution of All Electrochemical Processes in the First Charge Individually quantified oxidized species in the NTMF allows direct accounting of each redox
process’s electrochemical capacity. Figure 4a presents average Ni oxidation state n,

12
experimentally determined from TiMS analysis and Equation (2), as a function of extent of delithiation. At low states of charge (below 4.1 V), the experimental values closely follow a hypothetical diagonal line that assumes neither oxygen redox nor parasitic reactions, which suggests predominant Ni redox at low states of charge. The diminishing, but non-zero, slope implies competition of parallel redox processes at cut-off voltages surpassing 4.1 V. Average Ni oxidation states n > 3 suggest existence of Ni4+ in the NTMF during charge, which corresponds to the predictions from ab initio calculations.17 Furthermore, the maximum n (∼ 3.2) is far from 4, indicating limited utilization of Ni oxidation capability, namely a low Ni oxidation efficiency from Ni2+ ( (n − 2)/(4 − 2) ≈ 60% ). The highest average Ni oxidation state, particularly close to 3, agrees well with the estimation from X-ray absorption spectroscopy on the same NTMF and other similar series of DRX materials.33,43 Above all, Ni redox capacities at various cut-off voltages can now be acquired through multiplying (n − 2) by the total moles of Ni in NTMF, as shown in Figure 4b.
Oxygen redox arises as the second predominant redox mechanism in parallel with Ni redox at voltages above 4.1 V, as suggested by Figure 4b that summarizes oxygen redox capacities involving either lattice oxidized oxygen species (Equation (1)) or gaseous O2 loss. The onset of lattice oxygen redox (4.1 V–4.5 V) concurs with escalating 18O-enrichment level in Elyte-CO2 outgassing (Figure 2b), which implies that the participation of surface NTMF lattice-originating reactive oxidized oxygen species in electrolyte degradation cannot be ruled out. Overall, summation of each redox capacity lines up closely with the electrochemical capacity measured by the potentiostat (stacked line chart in Figure 4c), which validates our analytical approach. We note small discrepancies, particularly in the 3.9 V–4.1 V range, between analytically and electrochemically measured capacities that may stem from interface parasitic reactions whose exact stoichiometry is challenging to define because of their intricate (electro)chemistry. With individual redox capacities at various cut-off voltages shown in Figure 4b and c, we can re-construct a differential capacity (dQ dV−1) plot based on each deconvoluted redox component, as shown in Figure 4d. In a conventional differential capacity plot (Figure S3), the asymmetry and overlapping of redox peaks make it challenging to numerically deconvolute the predominant electrochemical processes. Here our differential capacity plot is useful to visualize and quantify the scale of each redox capacity contribution at any narrow voltage range within the cell’s potential window. For example, 39.5% of the charge capacity is supplied by oxidizing oxygen between 4.1 V and 4.5 V. The formation and further oxidation of dimerized lattice oxygen atoms results in irreversible O2 evolution, which accounts for 77.7% of net oxygen redox capacity (lattice oxidized oxygen + O2 loss) at the high voltage ranging from 4.5 V to 4.7 V. Thus, even though data points of this current work are discretized, the ∆Q ∆V−1 plot in Figure 4d displays the potential of characterizing obscure DRX bulk redox processes in a clear and quantitative fashion using the analytical tools developed here.

13
Figure 4. Deconvolution of intermixed redox processes in NTMF. (a) Average Ni oxidation states in NTMF at various states of charge in Li units, x in Li1.15–xNi0.45Ti0.3Mo0.1O1.85F0.15. The black dotted line represents the expected Ni oxidation state if only Ni redox, and no oxygen redox or parasitic side reactions, were to occur. (b) Cumulative charge capacity contributed by each individual redox process at different cut-off voltages. Black hollow markers denote electrochemical electron transfer to the current collector. (c) Stacked capacity of decoupled redox components, compared to the potentiostat values. (d) Differential capacity plot (∆Q ∆V−1) constructed from each individual redox capacity at various cut-off voltage. Gray line indicates summation of Ni-redox, lattice-O-redox, and O2-loss contributions, compared to the differential capacity measured by the potentiostat.

14
Discussion Based on the deconvoluted charge capacity results, we propose that mixed discharge redox
processes may also be resolved by applying the same analytical approach, which is currently under investigation and validation. With a clear distribution of various redox processes across the full-cycle voltage window, the first-cycle irreversibility and voltage hysteresis of DRX materials are better understood from each specific redox origin, which complements other techniques characterizing either short-range or long-range structural influence. For example, fluorination has been shown to not only impact the Li-percolating network, but also improve the cyclability of DRX materials.44 As the authors reasoned that fluorine incorporation potentially increases the TM redox capacity by accommodating more low-valent TM, future studies are still needed to address how fluorination influences the TM oxidation efficiency, which could also significantly alter the TM redox capacity as we have shown in this work. On the path towards cathodes with earth-abundant TM redox chemistry, namely Mn,4–6,20,44 our analytical method requires further modifications because high-valent Mn (Mn3+ or Mn4+) is inert in oxidizing water. Introducing another technique, such as iodometric titration,45 may be suitable to quantify oxidized Mn species, but the slow reaction (or dissolution) kinetics of Mn3+/4+-containing oxides in the aqueous solution may still need to be resolved in the future for achieving similar data throughput of this study.
In summary, this study presents a new route to characterize the intermixed redox mechanisms in Ni-based DRX materials. With 18O-enrichment of the DRX lattice, high-valent Ni and oxidized oxygen species can be quantified separately by exploiting their instability that results in O2-release in extreme acidic aqueous environments. The unambiguous and non-arbitrary stoichiometry allows accurate backcalculation of electrochemical capacity. Monitoring CO2 outgassing and surface carbonate-like deposits reveals participation of reactive oxidized oxygen in the surface parasitic reactions, which accounts for a slight mismatch of capacity summation. Re-constructing the distribution of various redox processes as a function of cell voltage further discloses the overlapping nature of the DRX electronic band structure in a quantitative way. The proposed approach here can be useful to understand not only what factors affect TM oxidation efficiency/capacity but also which redox process dominates the irreversibility, voltage hysteresis and capacity loss over cycles/high rates in the context of designing and optimizing DRX materials for practical applications.

15
Experimental Procedures Material Synthesis and Characterization The Ni-based DRX material, Li1.15Ni0.45Ti0.3Mo0.1O1.85F0.15 (NTMF), was synthesized by following a conventional solid-state annealing method similar to that in a previous study.33 Precursors of Li2CO3, NiCO3, TiO2, MoO2 and LiF were mixed stoichiometrically through high energy milling for 3 h. Mixed precursors were then annealed at 700 °C for 10 h in air. Powder X-ray diffraction was performed on a Bruker D2-Phaser with Cu Kα radiation.
Isotopic Enrichment NTMF powders were enriched with 18O by adopting and modifying the method developed in our previous studies.31,32,35 Briefly, an as-prepared NTMF sample is heated to 600 °C under a 97 at% 18O2 in N2 environment for 6 h. A full description of procedures and oxygen balance analysis can be found in the SI Note S1 and Figure S1.
Electrochemical Cell Assembly Modified Swagelok-type cells as described in previous work46,47 were used for electrochemical measurements and in-situ outgassing monitoring. Cathodes were made under Ar atmosphere by casting slurry comprising 70 wt% active material, 20 wt% conductive carbon (Super P, TIMCAL), 10 wt% polyvinylidene fluoride (Solef 6010/1001, SOLVAY), and N-Methyl-2-pyrrolidone solvent (anhydrous, 99.5%, Sigma Aldrich) onto stainless-steel meshes of 12 mm diameter. The cathodes were dried overnight under static vacuum at 120 °C in a heated antechamber attached to the glove box. The loading density of active materials ranged from 7 to 10 mg cm−2. Lithium disks of 11 mm diameter cut from Li foil (FMC) were used as anodes. For each cell, a polypropylene separator (Celgard 2500) facing the cathode and a QM-A quartz microfiber filter (Whatman) facing the anode, each 12 mm diameter, were used as separators with 80 µL of 1 M LiPF6 (Gotion) in EC/DEC (BASF, 1:1 v/v) as the electrolyte. All cells were assembled in the glove box.
Differential electrochemical mass spectrometry The differential electrochemical mass spectrometry (DEMS) instrument was custom-built and operated as described in our previous publications.46,47 The setup is calibrated for O2 (reserch grade, PRAXAIR) and CO2 (> 99.9%, PRAXAIR) in N2 carrier gas (ultra high purity, PRAXAIR). The headspace of all DEMS cells was purged and replaced by N2 before electrochemical measurements. To allow each NTMF particle in the porous electrode to achieve similar state of charge, each DEMS cell was charged at a constant current rate of 0.1 Li+ h−1 (29.5 mA g−1) to a

16
certain cut-off voltage and subsequently held at the cut-off voltage, unless otherwise noted, until the current rate dropped to 0.01 Li+ h−1 (2.95 mA g−1), which was controlled by a Bio-Logic VSP-series potentiostat. Accumulated gas in each cell was purged intermittently using 500 µL pulses of N2 every 10 minutes at recorded gas pressures and room temperatures. Swept-out gas was subsequently sent to a holding chamber, where it was leaked to a mass-spectrometry chamber for analysis.
Titration mass spectrometry Each titration glass vessel was custom-made from two tubular reservoirs connected through both an O-ring-sealed (H2SO4-resistant Viton fluoroelastomer) polytetrafluoroethylene stop- cock and a gas channel, so that the solid sample and liquid titrant were stored separately with shared headspace before mixing (titration), as depicted in Figure S4. Charged cathodes were extracted from DEMS cells in the glove box, rinsed with 1 mL diethyl carbonate (DEC, BASF) for three times, and dried at room temperature under vacuum for > 3 h to remove residual electrolyte. For each titration experiment, either weighed NTMF powder or an extracted cathode was sealed into the titration glass vessel in the glove box. Titration mass spectrometry (TiMS) was operated using a similar setup as DEMS, but with a titration vessel in place of a modified Swagelok cell.45 The headspace of the glass vessel was purged and replaced with N2 carrier gas (ultra-high purity, PRAXAIR) after injection of N2-sparged 10 M H2SO4 (Sigma Aldrich). The gas composition inside the glass vessel was monitored by the mass spectrometer to ensure that residual air, especially any O2 potentially introduced during the injection, was thoroughly removed before opening the stopcock to mix the sample with H2SO4 (aq). Gas released from H+-participating reactions in each titration vessel was purged by 2 mL of pulsed N2 every 2 minutes at recorded gas pressures and room temperatures. Swept-out gas was subsequently analyzed by the mass spectrometer.
Supplemental Information Supplemental Information includes isotopic enrichment procedures, generalized chemical equations to quantify O-redox capacity, equations to decouple O2-release reactions during titration, analysis procedures (Pourbaix diagrams) to estimate water-oxidation driving force, 3 tables and 6 figures.
Acknowledgements This research was supported by the Assistant Secretary for Energy Efficiency and Renewable Energy, Office of Vehicle Technologies of the U.S. Department of Energy under Contract No. DE-

17
AC02-05CH11231. T.-Y.H. gratefully acknowledges support collectively from both Ministry of Education in Taiwan and UC Berkeley College of Chemistry through Taiwan Fellowship Program. The authors thank Jim Breen and Tom Adams for designing the titration glass vessels, and thank Jessel Clintton for making custom fittings used in the titration mass spectrometry (TiMS) measurements.
Author Contributions Conceptualization, T.-Y.H., M.J.C., and B.D.M.; Methodology, T.-Y.H., M.J.C., and B.D.M.; Investigation, T.-Y.H., M.J.C., and Y.Y.; Resources, Y.Y. and W.T.; Writing – Original Draft, T.Y.H.; Writing – Review & Editing, T.-Y.H., M.J.C., Y.Y., W.T., and B.D.M.; Funding Acquisition, W.T. and B.D.M.; Supervision, W.T. and B.D.M.
Declaration of Interests The authors declare no competing interests.
References 1. Lee, J., Urban, A., Li, X., Su, D., Hautier, G., and Ceder, G. (2014). Unlocking the Potential
of Cation-Disordered Oxides for Rechargeable Lithium Batteries. Science 343, 519–522.
2. Urban, A., Lee, J., and Ceder, G. (2014). The configurational space of rocksalt-type oxides for high-capacity lithium battery electrodes. Advanced Energy Materials 4, 1–9.
3. Chen, R., Ren, S., Knapp, M., Wang, D., Witter, R., Fichtner, M., and Hahn, H. (2015). Disordered lithium-rich oxyfluoride as a stable host for enhanced Li+ intercalation storage. Advanced Energy Materials 5, 1–7.
4. Yabuuchi, N., Takeuchi, M., Nakayama, M., Shiiba, H., Ogawa, M., Nakayama, K., Ohta, T., Endo, D., Ozaki, T., Inamasu, T., et al. (2015). High-capacity electrode materials for rechargeable lithium batteries: Li3NbO4-based system with cation-disordered rocksalt structure. Proceedings of the National Academy of Sciences of the United States of America 112, 7650–5.
5. Lee, J., Kitchaev, D.A., Kwon, D.-H., Lee, C.-W., Papp, J.K., Liu, Y.-S., Lun, Z., Clément, R.J., Shi, T., McCloskey, B.D., et al. (2018). Reversible Mn2+/Mn4+ double redox in lithium-excess cathode materials. Nature 556, 185–190.
6. Clément, R.J., Lun, Z., and Ceder, G. (2020). Cation-disordered rocksalt transition metal oxides and oxyfluorides for high energy lithium-ion cathodes. Energy & Environmental Science 13, 345–373.

18
7. Hy, S., Liu, H., Zhang, M., Qian, D., Hwang, B.J., and Meng, Y.S. (2016). Performance and design considerations for lithium excess layered oxide positive electrode materials for lithium ion batteries. Energy and Environmental Science 9, 1931–1954.
8. Nayak, P.K., Erickson, E.M., Schipper, F., Penki, T.R., Munichandraiah, N., Adelhelm, P., Sclar, H., Amalraj, F., Markovsky, B., and Aurbach, D. (2018). Review on Challenges and Recent Advances in the Electrochemical Performance of High Capacity Li- and Mn-Rich Cathode Materials for Li-Ion Batteries. Advanced Energy Materials 8, 1–16.
9. Perez, A.J., Jacquet, Q., Batuk, D., Iadecola, A., Saubanère, M., Rousse, G., Larcher, D., Vezin, H., Doublet, M.L., and Tarascon, J.M. (2017). Approaching the limits of cationic and anionic electrochemical activity with the Li-rich layered rocksalt Li3IrO4. Nature Energy 2, 954–962.
10. Sathiya, M., Leriche, J.B., Salager, E., Gourier, D., Tarascon, J.M., and Vezin, H. (2015). Electron paramagnetic resonance imaging for real-time monitoring of Li-ion batteries. Nature Communications 6, 1–7.
11. Sathiya, M., Rousse, G., Ramesha, K., Laisa, C.P., Vezin, H., Sougrati, M.T., Doublet, M.L., Foix, D., Gonbeau, D., Walker, W., et al. (2013). Reversible anionic redox chemistry in high-capacity layered-oxide electrodes. Nature Materials 12, 827–835.
12. van Tendeloo, G., Berg, E.J., Tarascon, J.-M., Abakumov, A.M., Foix, D., Novak, P., Rousse, G., Dominko, R., Gonbeau, D., Doublet, M.-L., et al. (2015). Visualization of O-O peroxo-like dimers in high-capacity layered oxides for Li-ion batteries. Science 350, 1516–1521.
13. ben Yahia, M., Vergnet, J., Saubanère, M., and Doublet, M.L. (2019). Unified picture of anionic redox in Li/Na-ion batteries. Nature Materials 18, 496–502.
14. Olivetti, E.A., Ceder, G., Gaustad, G.G., and Fu, X. (2017). Lithium-Ion Battery Supply Chain Considerations: Analysis of Potential Bottlenecks in Critical Metals. Joule 1, 229–243.
15. Abdellahi, A., Urban, A., Dacek, S., and Ceder, G. (2016). Understanding the Effect of Cation Disorder on the Voltage Profile of Lithium Transition-Metal Oxides. Chemistry of Materials 28, 5373–5383.
16. Ji, H., Kitchaev, D.A., Lun, Z., Kim, H., Foley, E., Kwon, D.H., Tian, Y., Balasubramanian, M., Bianchini, M., Cai, Z., et al. (2019). Computational Investigation and Experimental Realization of Disordered High-Capacity Li-Ion Cathodes Based on Ni Redox. Chemistry of Materials 31, 2431–2442.
17. Clément, R.J., Kitchaev, D., Lee, J., and Gerbrand Ceder (2018). Short-Range Order and Unusual Modes of Nickel Redox in a Fluorine-Substituted Disordered Rocksalt Oxide Lithium-Ion Cathode. Chemistry of Materials 30, 6945–6956.

19
18. Seo, D.H., Lee, J., Urban, A., Malik, R., Kang, S., and Ceder, G. (2016). The structural and chemical origin of the oxygen redox activity in layered and cation-disordered Li-excess cathode materials. Nature Chemistry 8, 692–697.
19. Assat, G., and Tarascon, J.M. (2018). Fundamental understanding and practical challenges of anionic redox activity in Li-ion batteries. Nature Energy 3, 373–386.
20. Lun, Z., Ouyang, B., Kitchaev, D.A., Clément, R.J., Papp, J.K., Balasubramanian, M., Tian, Y., Lei, T., Shi, T., McCloskey, B.D., et al. (2018). Improved Cycling Performance of Li-Excess Cation-Disordered Cathode Materials upon Fluorine Substitution. Advanced Energy Materials 0, 1802959.
21. Jacquet, Q., Iadecola, A., Saubanère, M., Li, H., Berg, E.J., Rousse, G., Cabana, J., Doublet, M.L., and Tarascon, J.M. (2019). Charge Transfer Band Gap as an Indicator of Hysteresis in Li-Disordered Rock Salt Cathodes for Li-Ion Batteries. Journal of the American Chemical Society 141, 11452–11464.
22. Xu, J., Sun, M., Qiao, R., Renfrew, S.E., Ma, L., Wu, T., Hwang, S., Nordlund, D., Su, D., Amine, K., et al. (2018). Elucidating anionic oxygen activity in lithium-rich layered oxides. Nature Communications 9, 947.
23. Qiao, R., Wray, L.A., Kim, J.H., Pieczonka, N.P.W., Harris, S.J., and Yang, W. (2015). Direct Experimental Probe of the Ni(II)/Ni(III)/Ni(IV) Redox Evolution in LiNi0.5Mn1.5O4 Electrodes. Journal of Physical Chemistry C 119, 27228–27233.
24. Luo, K., Roberts, M.R., Hao, R., Guerrini, N., Pickup, D.M., Liu, Y.S., Edström, K., Guo, J., Chadwick, A. v., Duda, L.C., et al. (2016). Charge-compensation in 3d-transition-metal-oxide intercalation cathodes through the generation of localized electron holes on oxygen. Nature Chemistry 8, 684–691.
25. Gent, W.E., Lim, K., Liang, Y., Li, Q., Barnes, T., Ahn, S.J., Stone, K.H., McIntire, M., Hong, J., Song, J.H., et al. (2017). Coupling between oxygen redox and cation migration explains unusual electrochemistry in lithium-rich layered oxides. Nature Communications 8, 2091.
26. Zhuo, Z., Pemmaraju, C. das, Vinson, J., Jia, C., Moritz, B., Lee, I., Sallies, S., Li, Q., Wu, J., Dai, K., et al. (2018). Spectroscopic Signature of Oxidized Oxygen States in Peroxides. Journal of Physical Chemistry Letters 9, 6378–6384.
27. Maitra, U., House, R.A., Somerville, J.W., Tapia-Ruiz, N., Lozano, J.G., Guerrini, N., Hao, R., Luo, K., Jin, L., Pérez-Osorio, M.A., et al. (2018). Oxygen redox chemistry without excess alkali-metal ions in Na 2/3 [Mg 0.28 Mn 0.72 ]O 2. Nature Chemistry 10, 288–295.
28. Dai, K., Wu, J., Zhuo, Z., Li, Q., Sallis, S., Mao, J., Ai, G., Sun, C., Li, Z., Gent, W.E., et al. (2019). High Reversibility of Lattice Oxygen Redox Quantified by Direct Bulk Probes of Both Anionic and Cationic Redox Reactions. Joule 3, 518–541.

20
29. Assat, G., Foix, D., Delacourt, C., Iadecola, A., Dedryvère, R., and Tarascon, J.M. (2017). Fundamental interplay between anionic/cationic redox governing the kinetics and thermodynamics of lithium-rich cathodes. Nature Communications 8.
30. Assat, G., Iadecola, A., Delacourt, C., Dedryvère, R., and Tarascon, J.M. (2017). Decoupling Cationic-Anionic Redox Processes in a Model Li-Rich Cathode via Operando X-ray Absorption Spectroscopy. Chemistry of Materials 29, 9714–9724.
31. Renfrew, S.E., and McCloskey, B.D. (2019). Quantification of Surface Oxygen Depletion and Solid Carbonate Evolution on the First Cycle of LiNi 0.6 Mn 0.2 Co 0.2 O 2 Electrodes. ACS Applied Energy Materials 2, 3762–3772.
32. Renfrew, S.E., and McCloskey, B.D. (2017). Residual Lithium Carbonate Predominantly Accounts for First Cycle CO2 and CO Outgassing of Li-Stoichiometric and Li-Rich Layered Transition-Metal Oxides. Journal of the American Chemical Society 139, 17853–17860.
33. Lee, J., Papp, J.K., Clément, R.J., Sallis, S., Kwon, D.-H., Shi, T., Yang, W., McCloskey, B.D., and Ceder, G. (2017). Mitigating oxygen loss to improve the cycling performance of high capacity cation-disordered cathode materials. Nature Communications 8, 981.
34. Jung, R., Metzger, M., Maglia, F., Stinner, C., and Gasteiger, H.A. (2017). Oxygen Release and Its Effect on the Cycling Stability of LiNi x Mn y Co z O 2 (NMC) Cathode Materials for Li-Ion Batteries . Journal of The Electrochemical Society 164, A1361–A1377.
35. Renfrew, S.E., and McCloskey, B.D. (2019). The Role of Electrolyte in the First-Cycle Transformations of LiNi 0.6 Mn 0.2 Co 0.2 O 2 . Journal of The Electrochemical Society 166, A2762–A2768.
36. Mahne, N., Renfrew, S.E., McCloskey, B.D., and Freunberger, S.A. (2018). Electrochemical Oxidation of Lithium Carbonate Generates Singlet Oxygen. Angewandte Chemie - International Edition 57, 5529–5533.
37. Ramakrishnan, S., Park, B., Wu, J., Yang, W., and McCloskey, B.D. (2020). Extended Interfacial Stability through Simple Acid Rinsing in a Li-Rich Oxide Cathode Material. Journal of the American Chemical Society.
38. Hong, J., Gent, W.E., Xiao, P., Lim, K., Seo, D.-H., Wu, J., Csernica, P.M., Takacs, C.J., Nordlund, D., Sun, C.-J., et al. (2019). Metal–oxygen decoordination stabilizes anion redox in Li-rich oxides. Nature Materials 18, 256–265.
39. Gent, W.E., Abate, I.I., Yang, W., Nazar, L.F., and Chueh, W.C. (2020). Design Rules for High-Valent Redox in Intercalation Electrodes. Joule 4, 1369–1397.
40. Billy, E., Joulié, M., Laucournet, R., Boulineau, A., de Vito, E., and Meyer, D. (2018). Dissolution Mechanisms of LiNi1/3Mn1/3Co1/3O2 Positive Electrode Material from

21
Lithium-Ion Batteries in Acid Solution. ACS Applied Materials and Interfaces 10, 16424–16435.
41. Persson, K.A., Waldwick, B., Lazic, P., and Ceder, G. (2012). Prediction of solid-aqueous equilibria: Scheme to combine first-principles calculations of solids with experimental aqueous states. Physical Review B - Condensed Matter and Materials Physics 85, 235438.
42. Singh, A.K., Zhou, L., Shinde, A., Suram, S.K., Montoya, J.H., Winston, D., Gregoire, J.M., and Persson, K.A. (2017). Electrochemical Stability of Metastable Materials. Chemistry of Materials 29, 10159–10167.
43. Lee, J., Seo, D.H., Balasubramanian, M., Twu, N., Li, X., and Ceder, G. (2015). A new class of high capacity cation-disordered oxides for rechargeable lithium batteries: Li-Ni-Ti-Mo oxides. Energy and Environmental Science 8, 3255–3265.
44. Lun, Z., Ouyang, B., Cai, Z., Clément, R.J., Kwon, D.-H., Huang, J., Papp, J.K., Balasubramanian, M., Tian, Y., McCloskey, B.D., et al. (2019). Design Principles for High-Capacity Mn-Based Cation-Disordered Rocksalt Cathodes. Chem, 1–16.
45. Mccloskey, B.D., Valery, A., Luntz, A.C., Gowda, S.R., Wallraff, G.M., Garcia, J.M., Mori, T., and Krupp, L.E. (2013). Combining accurate O2 and Li2O2 assays to separate discharge and charge stability limitations in nonaqueous Li-O 2 Batteries. Journal of Physical Chemistry Letters 4, 2989–2993.
46. McCloskey, B.D., Bethune, D.S., Shelby, R.M., Girishkumar, G., and Luntz, A.C. (2011). Solvents critical role in nonaqueous Lithium-Oxygen battery electrochemistry. Journal of Physical Chemistry Letters 2, 1161–1166.
47. McCloskey, B.D., Scheffler, R., Speidel, A., Girishkumar, G., and Luntz, A.C. (2012). On the mechanism of nonaqueous Li-O2 electrochemistry on C and its kinetic overpotentials: Some implications for Li-air batteries. Journal of Physical Chemistry C 116, 23897–23905.
Figure Legends Figure 1. Characterization of Li1.15Ni0.45Ti0.3Mo0.1O1.85F0.15 (NTMF) before and after isotopic enrichment. (a) X-ray diffraction patterns of NTMF before (blue dotted line) and after (black line) 18O-enrichment. Green vertical bars denote Bragg diffraction peak positions calculated by using the Fm3�m space group, lattice parameter a = 4.14146 Å,33 and Cu Kα radiation. (b) First-cycle voltage profiles of pristine (blue dotted line) and 18O-enriched (black line) NTMF at a rate of 0.1 Li+ h−1 without holding at the 4.8 V switching voltage, showing no substantial change in bulk redox chemistry after isotopic enrichment.

22
Figure 2. In-situ gas evolution (DEMS) and ex-situ acid titration (TiMS) of NTMF. (a) Voltage profile (black line) and isotopic O2-loss rates (solid circles) for 18O-enriched NTMF charged at 0.1 Li+ h−1 (29.5 mA g−1) to 4.8 V (vs. Li/Li+), subsequently held at 4.8 V until the current rate dropped to 0.01 Li+ h−1 (2.95 mA g−1) and allowed to rest at open circuit after the voltage hold. (b) Cumulative CO2 evolution from native-carbonate decomposition (NACN-CO2, plum bars) and electrolyte degradation (Elyte-CO2, blue bars), obtained from DEMS. Blue hollow markers indicate 18O content in Elyte-CO2, suggesting surface reactivity of NTMF. (c) Isotopic O2-release rates for the extracted 4.5 V-cathode titrated by 10 M H2SO4. Zoomed inset displays 16,18O2 and 18,18O2 release at a lower order of magnitude than untagged O2. (d) Amount of native carbonate (NACN, plum bars) and carbonate-like solid deposits from electrolyte degradation (Elyte-deposit, blue bars), quantified by TiMS. Uncharged cathode is shown at the average open circuit voltage, 3.0 V, during the rest period before charge. Blue hollow markers indicate 18O content in the Elyte-deposit. All quantities of gases and surface deposits are normalized to the net mole of active material, NTMF.
Figure 3. Illustration of decoupled O2-release reactions during the ex-situ acid titration of NTMF. Gray dotted curve outlines the acid-particle interface before dissolution. Star symbols indicate partial 18O enrichment. Dissolved oxygen anions with formal valence of –1 (O–) are displayed to represent all possible lattice oxidized oxygen species (SI Note S2). Other dissolved species, such as Li+ and F–, not participating in O2-release reactions are not shown for clarity.Figure 3. Illustration of decoupled O2-release reactions during the ex-situ acid titration of NTMF. Gray dotted curve outlines the acid-particle interface before dissolution. Star symbols indicate partial 18O enrichment. Dissolved oxygen anions with formal valence of –1 (O–) are displayed to represent all possible lattice oxidized oxygen species (SI Note S2). Other dissolved species, such as Li+ and F–, not participating in O2-release reactions are not shown for clarity.
Figure 4. Deconvolution of intermixed redox processes in NTMF. (a) Average Ni oxidation states in NTMF at various states of charge in Li units, x in Li1.15–xNi0.45Ti0.3Mo0.1O1.85F0.15. The black dotted line represents the expected Ni oxidation state if only Ni redox, and no oxygen redox or parasitic side reactions, were to occur. (b) Cumulative charge capacity contributed by each individual redox process at different cut-off voltages. Black hollow markers denote electrochemical electron transfer to the current collector. (c) Stacked capacity of decoupled redox components, compared to the potentiostat values. (d) Differential capacity plot (∆Q ∆V−1) constructed from each individual redox capacity at various cut-off voltage. Gray line indicates summation of Ni-redox, lattice-O-redox, and O2-loss contributions, compared to the differential capacity measured by the potentiostat.

23
Table
Table 1. Isotopic Distribution of in-situ O2 Loss and its 18O Enrichment
Cut-off Voltages (V)
Distribution (%) Enrichment 18O (%)
O2 loss a
(mmol mol−1) 16,16O2 16,18O2 18,18O2
4.6 77.7 19.4 2.9 12.6 5.9 4.7 78.0 19.2 2.8 12.4 14.0 4.8 78.3 18.9 2.8 12.2 26.0
Bulk b 11.7
a Amount normalized to the net mole of active material, NTMF; b Lattice bulk mean value obtained from the enrichment process.

download fileview on ChemRxivpreprint_manuscript_TYH.pdf (1.16 MiB)

Supporting Information:
Deconvolution of Intermixed Redox Processes in
Ni-based Cation-Disordered Li-Excess Cathodes Tzu-Yang Huang1, 2, Matthew J. Crafton1, 2, Yuan Yue2, Wei Tong2, and Bryan D. McCloskey1, 2, 1Department of Chemical and Biomolecular Engineering, University of California–Berkeley, Berkeley, California 94720, United States 2Energy Storage and Distributed Resources Division, Lawrence Berkeley National Laboratory, Berkeley, California 94720, United States Correspondence: [email protected]
Note S1. Isotopic Enrichment
A known amount of Li1.15Ni0.45Ti0.3Mo0.1O1.85F0.15 (NTMF) powder was weighed (243.2 mg) on a 2 mL combustion boat (VWR) and placed in a Lindberg Blue Mini Mite Tube Furnace (Thermo Scientific). The tube (Alumina, 20” length, 1” OD, Coorstek) was sealed using Swagelok Ultra-Torr fittings that allow connection to 20 cm stainless-steel capillaries (1/16” OD, VICI). The capillaries allow the tube to be connected to various attachments: 1) an expandable membrane (airtight heat-sealable aluminum pouch) that allows heated gas volume expansion; 2) a closed 18O2 gas tank (97 at%, Sigma Aldrich) that controls the dosage of 18O2. In addition, a cleaned, N2-purged, and emptied 1 mL gas sample loop (1/16” OD stainless-steel capillary, VICI) under static vacuum was attached to the furnace through a closed valve, which could be toggled on and off to extract headspace gas at the end of the enrichment process. The tube furnace with all fittings was leak-tested and purged with N2 for ≥ 3 hours. A known volume (15 mL, 1 atm, room temperature) of 18O2 was introduced into the furnace while the closed system was allowed to equilibrate at the recorded ambient temperature and pressure (1 atm). The enclosed samples were heated to 600 °C for 6 hours to induce isotopic exchange. After cooling and headspace gas sampling, the 18O-enriched powder was transferred to an Ar-filled glove box with minimized exposure to the ambient (< 5 min) to avoid substantial change in surface native carbonate (NACN) content. To acquire isotopic enrichment level in the NTMF lattice, an oxygen balance on 18O was performed by comparing the closed system before (denoted by prime symbol, natural abundance of 18O is 0.2%) and after isotopic exchange, where ni and ρi represents the molar amount and 18O isotopic fraction of species i, respectively:
With the assumption that the net amount of headspace O2 remains constant before and after isotopic exchange (𝑛𝑛O2
′ = 𝑛𝑛O2), mass-spectrometry analysis on the sampled headspace gas allows quantification of 𝜌𝜌O2 , 𝜌𝜌CO2 , and 𝑛𝑛CO2/𝑛𝑛O2 . The 18O-enriched powder was titrated by 10 M H2SO4 to measure 𝑛𝑛NACN and 𝜌𝜌NACN, as shown in Table S1. Notice that 𝑛𝑛NACN′ ≈ 𝑛𝑛CO2 + 𝑛𝑛NACN and 𝜌𝜌CO2 ≈ 𝜌𝜌NACN, which suggests that solid NACN and headspace CO2 almost reach equilibrium between thermal decomposition and re-deposition during the isotopic exchange process. On the whole, substituting all measurable variables in
2 × 𝑛𝑛O2′ × 97% + 1.85 × 𝑛𝑛NTMF′ × 0.2% + 3 × 𝑛𝑛NACN′ × 0.2%= 2 × 𝑛𝑛O2 × 𝜌𝜌O2 + 2 × 𝑛𝑛CO2 × 𝜌𝜌CO2 + 1.85 × 𝑛𝑛NTMF × 𝜌𝜌NTMF + 3 × 𝑛𝑛NACN × 𝜌𝜌NACN
(S.1)

Equation (S.1) for known quantities determines 𝜌𝜌NTMF, namely the bulk mean 18O enrichment in NTMF lattice.
Table S1. Isotopic Distribution of Native Carbonate (NACN)
Titration a: C O ∗ 32− + H+
�⎯⎯� C O ∗ 2 ↑ + H2 O ∗
Carbonate b (μmol g–1)
Distribution (%) Enrichment 18O (%) C16,16O2 C16,18O2 C18,18O2
34.6 37.8 44.6 17.6 39.9
a Star symbols denote partial 18O enrichment; b Amount normalized to the net weight of NTMF powder.
Figure S1. Illustration of isotopic enrichment process. The isotopic exchange is induced by heating active-material powder enclosed with known amount of 18O2 in N2. Both DRX (denoted as Li-TM-O-F) lattice and surface native carbonate (NACN, denoted as M-CO3) are labelled with 18O at the end of the process. Star symbols indicate partial 18O enrichment.

Table S2. Isotopic Distribution of in-situ CO2 Outgassing
Cut-off Voltage (V)
CO2 source
Amount a (mmol mol–1)
Distribution (%) Enrichment 18O (%) C16,16O2 C16,18O2 C18,18O2
3.0 b NACN < 0.1 n/a n/a n/a n/a
Elyte < 0.1 n/a n/a n/a n/a
3.9 NACN < 0.1 n/a n/a n/a n/a
Elyte < 0.1 n/a n/a n/a n/a
4.0 NACN < 0.1 n/a n/a n/a n/a
Elyte 0.3 100.0 < 0.1 0.0 < 0.1
4.1 NACN < 0.1 n/a n/a n/a n/a
Elyte 0.4 90.7 9.3 0.0 4.7
4.4 NACN 0.2 37.8 44.6 17.6 39.9
Elyte 1.0 77.9 22.1 0.0 11.0
4.5 NACN 0.5 37.8 44.6 17.6 39.9
Elyte 1.4 71.9 28.1 0.0 14.0
4.6 NACN 0.5 37.8 44.6 17.6 39.9
Elyte 1.7 84.9 15.1 0.0 7.5
4.7 NACN 0.6 37.8 44.6 17.6 39.9
Elyte 4.9 86.9 13.1 0.0 6.5
4.8 NACN 1.0 37.8 44.6 17.6 39.9
Elyte 7.1 86.6 13.4 0.0 6.7
a Amount normalized to the net mole of active material, NTMF; b Uncharged cathode is displayed at the average OCV.

Figure S2. In-situ O2 loss (DEMS) for NTMF charged to 4.8 V (vs. Li/Li+). (a) Onset of O2 evolution along the voltage profile (black line), indicating almost identical onset potential and electrochemical origin for the three isotopic O2 species. (b) 18O enrichment of O2 (red solid markers) in the sampled headspace gas at each instant after O2 onset. Gray horizontal dotted line denotes the lattice bulk mean value. Initial higher gaseous 18O enrichment than the solid-state bulk mean value implies that O2 loss begins from the NTMF crystal surface, where gradient 18O enrichment is expected.
Figure S3. First-charge differential capacity analysis (dQ dV−1) for NTMF tested at the constant current rate of 0.1 Li+ h−1 without voltage hold. The enclosed area of the gray-shaded region equals the net electron transfer measured by the potentiostat at the voltage range between 4.1 V and 4.5 V.

Note S2. Disproportionation of Various Lattice Oxidized Oxygen Species While we display O– as the lattice oxidized oxygen in Equation (1) and Figure 3, the possible existence
of other oxidized oxygen species, such as superoxide (O2−), cannot be ruled out. Here we simplify the charge
compensation, during the electrochemical operation, fulfilled by lattice oxygen as the following equation, where 0 ≤ 𝜔𝜔 < 2 and 2 (2 − 𝜔𝜔) electrons in the lattice are ultimately delivered to the external circuit due to lattice-delithiation (remove Li+ from the lattice) coupled with lattice-electroneutrality:
In the strong acid environment, namely 10 M H2SO4 titration, we posit that the dissolved oxidized oxygen species from NTMF lattice preferentially dimerize and undergo the disproportionation reaction:
With each gaseous O2 arising from disproportionation reactions, measured by TiMS, we can backcalate O-redox capacity of 4 e– by adopting the stoichiometric coefficients in both Equation (S.2) and Equation (S.3) ( 2 (2 −𝜔𝜔)/(2−𝜔𝜔
2) = 4 ), which is independent of formal oxidation state of lattice oxidized oxygen species.
This analysis suggests that the acid titration technique developed in this work is generalizable to quantify O-redox capacity contributed by a wide variety of lattice oxidized oxygen species.
Figure S4. Titration glass vessel schematic. The upper ends of perfluoroalkoxy (PFA) tubes are fastened by Valco column end fittings that allow connection to either a carrier gas supply system or the mass-spectrometer gas sample transfer line. The entire setup was leak-tested before each titration experiment.
[O2− + O2−]lattice �⎯⎯� [O𝜔𝜔− + O𝜔𝜔−]lattice + 2 (2 − 𝜔𝜔) e− (S.2)
[O ⋅⋅⋅⋅⋅ O]2𝜔𝜔− (aq) + 2𝜔𝜔 H+ �⎯⎯�
2 − 𝜔𝜔2
O2 ↑ + 𝜔𝜔 H2O (S.3)

Note S3. Decoupling mixed O2 release by TiMS A mixture of 18O tagged and untagged O2 evolves when an extracted charged cathode is titrated with
10 M H2SO4. The molar amount of O2 released from the disproportionation reaction (Equation (1)) is denoted by m1 and can be calculated from the following equation, where ni and ρi represents the molar amount and 18O isotopic fraction of species i, respectively:
Water oxidation (Equation (2)) emitting m2 of O2 can be quantified accordingly:
The values of m1 and m2 for titrated cathodes at various cut-off voltages are summarized in Table S3 for comparison.
Table S3. Decoupled O2 Release During Acid Titration
Cut-off Voltages a(V)
Net O2
(mmol mol–1) b Distribution (%) O2 c
m2 O2 d m1 16,16O2 16,18O2 18,18O2
3.0 e < 0.1 n/a n/a n/a < 0.1 < 0.1 3.9 17.4 98.6 0.7 0.7 15.9 1.5 4.0 36.9 98.7 1.0 0.3 34.3 2.7 4.1 61.8 98.8 1.0 0.2 58.3 3.5 4.5 166.9 94.6 4.4 1.0 121.7 45.2 4.7 183.0 94.5 4.8 0.7 133.9 49.2
a Cut-off voltage of each extracted cathode; b Amount normalized to the net mole of active material, NTMF; c Equation (2) and Equation (S.5); d Equation (1) and Equation (S.4); e Uncharged cathode is displayed at the average OCV.
Note S4. Pourbaix Diagrams
To understand the instability of NTMF immersed in acidic aqueous solutions, we analyze the solid-aqueous equilibria1 of selected model metal-oxide materials that have transition-metal ions (TM) with: 1) similar oxidation states as TM in delithiated NTMF; 2) octahedral coordination in rocksalt-like lattices. All Pourbaix diagrams were generated through open-source Python Materials Genomics (pymatgen)2 packages, which adopt a formalism3 combining ab initio calculated solid-state energies (acquired by accessing the Materials Project4 database) with experimentally tabulated aqueous-state free energies to predict solid-aqueous equilibria. Notice that the Materials Project database is actively updated so the converged energy values and the Pourbaix diagrams presented in this work may be subject to slight variation.
𝑚𝑚1 =𝑛𝑛 O2 16,18 + 2 𝑛𝑛 O2
18,18
2 𝜌𝜌NTMF (S.4)
𝑚𝑚2 = 𝑛𝑛 O2 16,16 − (𝑚𝑚1 − 𝑛𝑛 O2
16,18 − 𝑛𝑛 O2 18,18 ) (S.5)

Figure S5. Stability of Ni3+ and Mo6+ in aqueous environment. Pourbaix Diagrams of (a) LiNiO2 (Material ID: mp-25411) and (b) Li4MoO5 (Material ID: mp-19117). Solid-aqueous equilibria and instability maps are calculated and plotted through Python Materials Genomics (pymatgen) packages.2–5 Each aqueous ion concentration is 10−6 M. Instability of the initial solid material is measured by ∆Gpbx,5 normalized to the formula unit (LiNiO2 and Li4MoO5, respectively). Gray dashed lines denote the O2/H2O equilibrium potential with trace O2 approximated as 0.01 bar. Hollow gray diamonds indicate the pH and external potential (vs. SHE) exerted near the LiNiO2 or Li4MoO5 solid surface during the acid titration (10 M H2SO4 with trace O2).
Figure S5 presents Pourbaix diagrams of LiNiO2 and Li4MoO5 (Material IDs: mp-25411and mp-19117, respectively),4 which are examined first to measure the instability of Ni3+ and Mo6+ in aqueous solutions. In a conventional Pourbaix diagram, each non-vertical line represents an electron-transfer-involving equilibrium potential (vs. SHE) between two groups of species neighboring the line, while each enclosed domain suggests thermodynamically the most stable states at given pH values and voltages applied externally. For example, solid LiNiO2 is prone to form Li+ (aq) and Ni2+ (aq) when immersed in our acid titrant: 10 M H2SO4 with trace O2 (approximated as 0.01 bar), which corresponds to pH ≈ −1 and U ≈ 1.26 V (vs. SHE) of O2/H2O equilibrium potential exerted near the LiNiO2 surface, as labelled by the dark grey hollow diamond in Figure S5a. The driving force for thermodynamically metastable LiNiO2 to decompose into corresponding stable species can be measured by a relative free energy, ∆Gpbx 5 as a function of pH and applied U, introduced recently in the corrosion community to complement the conventional Pourbaix diagram. The colormap in Figure S5a displays the quantities of ∆Gpbx(pH, U) that are defined as the free energy (taking H+, H2O, and electrons into account) of the initial metastable material

(i.e., LiNiO2) minus its decomposition products’ free energy. Accordingly, the free energy change of the following reaction is −∆Gpbx by definition (∆G(S.6) = −∆Gpbx):
A redox couple, most probably O2/H2O in the acid titration environment, must exist to provide the electron for Equation (S.6). Here we posit that trace O2 reaches thermodynamic equilibrium (quasi-equilibrium) with H2O (∆G(S.7) ≃ 0):
The net decomposition reaction, which must satisfy electroneutrality, combines Equation (S.6) with Equation (S.7) and the net thermodynamic driving force can be therefore determined (∆G(S.8) = −4 ∆Gpbx + ∆G(S.7)):
As the decomposition of LiNiO2 (Equation (S.8)) during the acid titration involves electron transfer, the driving force can also be interpreted as potential Uj through the following correlation, where 𝜈𝜈𝑗𝑗 is the number of electrons transferred in reaction j and F is Faraday’s constant:
As a multi-electron-transfer reaction is usually kinetically sluggish, a decomposition reaction (e.g., Equation (S.8)) requires adequate potential difference to proceed forward. With known ∆Gpbx in Figure S5a and 𝜈𝜈(S.8) for Equation (S.8), the driving force of water oxidation by LiNiO2 (Ni3+) can be measured by U(S.8) = 1.38 V, which is considered large enough to drive the reaction because we have experimentally observed O2 release when titrating pristine LiNiO2 powder.
On the other hand, Li+ (aq) and MoO3 are the predicted products when Li4MoO5 is titrated by 10 M H2SO4 (Figure S5b), which suggests that the decomposition of Mo6+-containing oxide does not favor electron transfer and therefore does not warrant water oxidation (no necessity for Equation (S.7) to supply electrons). Despite limited solubility of solid MoO3, we expect Mo6+-containing species from NTMF decomposition in strong acid is totally dissolved, as we observed that the final solution after titrating pristine NTMF powder is entirely transparent without any precipitate. MoO3 has also been shown to be more soluble as the acid concentration increases6 and its molar solubility (∼ 0.04 M) is reasonably higher than the Mo concentration (∼ 0.003 M) at the end of titration. As a result, analysis on solid-aqueous equilibria of the first two model metal-oxide materials predicts that during the acid titration, Ni3+ is prone to oxidize water and induce O2 release while Mo6+ is likely to dissolve without electron transfer, which agrees well with TiMS results (Table S3).
Even though high-valent Ni exists in both delithiated NTMF (DRX in this work) and delithiated Ni-Mn-Co layered oxides (NMC in our previous works7–9), no detectable water- oxidation O2 releases when titrating charged NMC electrodes. To compare their thermodynamic instability during the acid titration, we analyze the solid-aqueous equilibria of two model TM-oxides deriving from LiNiO2 (with 25% of Ni replaced by Ti4+ or Mn4+): 1) LiNi0.75Ti0.25O2 (Battery ID: mp-763760_Li; Material ID: mp-756601); 2) LiNi0.75Mn0.25O2 (Battery ID: mp-1177345_Li; Material ID: mp-1177345).4,10 These two model oxides are selected in approximate analogy to different local lattice environments of Ni3+ in NTMF and NMC. Figure S6 shows Pourbaix diagrams and ∆Gpbx maps of LiNi0.75Ti0.25O2 and LiNi0.75Mn0.25O2, respectively. Through the same analysis procedures applied on LiNiO2, the net thermodynamic driving force of decomposing oxides in conjunction with oxidizing water can be determined:
LiNiO2 + 4 H+ + e− �⎯⎯� Li+ (aq) + Ni2+ (aq) + 2 H2O (S.6)
2 H2O �⎯⎯� O2 + 4 H+ (aq) + 4 e− (S.7)
4 LiNiO2 + 12 H+ �⎯⎯� 4 Li+ (aq) + 4 Ni2+ (aq) + O2 ↑ +6 H2O (S.8)
Δ𝐺𝐺𝑗𝑗 = −𝜈𝜈𝑗𝑗𝐹𝐹𝑈𝑈𝑗𝑗 (S.9)

As the Equation S.11 involves more electrons transferred than Equation (S.10) (𝜈𝜈(S.11) > 𝜈𝜈(S.10) ), the resulting decomposition driving force of Equation (S.11) in potential (U(S.11) = 1.17 V) is significantly smaller than U of Equation (S.10) (U(S.10) = 2.36 V). The difference may explain why water-oxidation O2 release does not take place at an observable rate for Ni3+-Mn4+-O materials (e.g., delithiated NMC), while Ni3+-Ti4+-O materials (e.g., delithiated NTMF) can efficiently oxidize water. The decomposition product TiO2 from NTMF is believed to form soluble titanyl sulfate (TiOSO4 (aq))11,12 in the concentrated H2SO4, because the final solution after titrating pristine NTMF powder is entirely transparent without any precipitate. The small decomposition driving force coupled with low solubility of Mn4+-oxides may also be the cause of low leaching efficiency of each TM species (any of Ni, Mn, or Co) from NMC lattice into sulfuric acid solution (< 40% of each TM is dissolved after several days).13
LiNi0.75Ti0.25O2 +52
H+ �⎯⎯� Li+ (aq) +
34
Ni2+ (aq) +14
TiO2 +18
O2 ↑ +54
H2O (S.10)
LiNi0.75Mn0.25O2 + 3 H+ �⎯⎯� Li+ (aq) +
34
Ni2+ (aq) +14
Mn2+ +14
O2 ↑ +32
H2O (S.11)

Figure S6. Water-oxidation driving force for Li-Ni2+/3+-O materials with different lattice transition-metal chemistries. Pourbaix Diagrams of (a) LiNi0.75Ti0.25O2 (Material ID: mp-756601) and (b) LiNi0.75Mn0.25O2 (Material ID: mp-1177345). Solid-aqueous equilibria and instability maps are calculated and plotted through Python Materials Genomics (pymatgen) packages.2–5 Each aqueous ion concentration is 10−6 M. Instability of the initial solid material is measured by ∆Gpbx,5 normalized to the formula unit (LiNi0.75Ti0.25O2 and LiNi0.75Mn0.25O2, respectively). Gray dashed lines denote the O2/H2O equilibrium potential with trace O2 approximated as 0.01 bar. Hollow gray diamonds indicate the pH and external potential (vs. SHE) exerted near the LiNi0.75Ti0.25O2 or LiNi0.75Mn0.25O2 solid surface during the acid titration (10 M H2SO4 with trace O2).

Supplemental References 1. Pourbaix, M. Atlas of electrochemical equilibria in aqueous solutions. 2d English. (National
Association of Corrosion Engineers). 2. Ong, S.P., Richards, W.D., Jain, A., Hautier, G., Kocher, M., Cholia, S., Gunter, D., Chevrier, V.L.,
Persson, K.A., and Ceder, G. (2013). Python Materials Genomics (pymatgen): A robust, open-source python library for materials analysis. Computational Materials Science 68, 314–319.
3. Persson, K.A., Waldwick, B., Lazic, P., and Ceder, G. (2012). Prediction of solid-aqueous equilibria: Scheme to combine first-principles calculations of solids with experimental aqueous states. Physical Review B - Condensed Matter and Materials Physics 85, 235438.
4. Jain, A., Ong, S.P., Hautier, G., Chen, W., Richards, W.D., Dacek, S., Cholia, S., Gunter, D., Skinner, D., Ceder, G., et al. (2013). Commentary: The materials project: A materials genome approach to accelerating materials innovation. APL Materials 1.
5. Singh, A.K., Zhou, L., Shinde, A., Suram, S.K., Montoya, J.H., Winston, D., Gregoire, J.M., and Persson, K.A. (2017). Electrochemical Stability of Metastable Materials. Chemistry of Materials 29, 10159–10167.
6. Ferris, L.M. (1961). Solubility of Molybdic Oxide and Its Hydrates in Nitric Acid, Nitric Acid-Ferric Nitrate, and Nitric Acid-Uranyl Nitrate Solutions. Journal of Chemical & Engineering Data 6, 600–603.
7. Renfrew, S.E., and McCloskey, B.D. (2019). Quantification of Surface Oxygen Depletion and Solid Carbonate Evolution on the First Cycle of LiNi 0.6 Mn 0.2 Co 0.2 O 2 Electrodes. ACS Applied Energy Materials 2, 3762–3772.
8. Renfrew, S.E., and McCloskey, B.D. (2019). The Role of Electrolyte in the First-Cycle Transformations of LiNi 0.6 Mn 0.2 Co 0.2 O 2 . Journal of The Electrochemical Society 166, A2762–A2768.
9. Ramakrishnan, S., Park, B., Wu, J., Yang, W., and McCloskey, B.D. (2020). Extended Interfacial Stability through Simple Acid Rinsing in a Li-Rich Oxide Cathode Material. Journal of the American Chemical Society.
10. Zhou, F., Cococcioni, M., Marianetti, C.A., Morgan, D., and Ceder, G. (2004). First-principles prediction of redox potentials in transition-metal compounds with LDA + U. Physical Review B - Condensed Matter and Materials Physics 70, 1–8.
11. Sibum, H., Güther, V., Roidl, O., Habashi, F., Uwe Wolf, H., and Siemers, C. (2017). Titanium, Titanium Alloys, and Titanium Compounds. Ullmann’s Encyclopedia of Industrial Chemistry, 1–35.
12. Szilágyi, I., Königsberger, E., and May, P.M. (2009). Characterization of chemical speciation of titanyl sulfate solutions for production of titanium dioxide precipitates. Inorganic Chemistry 48, 2200–2204.
13. Billy, E., Joulié, M., Laucournet, R., Boulineau, A., de Vito, E., and Meyer, D. (2018). Dissolution Mechanisms of LiNi1/3Mn1/3Co1/3O2 Positive Electrode Material from Lithium-Ion Batteries in Acid Solution. ACS Applied Materials and Interfaces 10, 16424–16435.

download fileview on ChemRxivSI_preprint_manuscript_TYH.pdf (1.38 MiB)