decomposition of country-specific corporate bond spreads€¦ · and calculate the equity risk...
TRANSCRIPT

Discussion PaperDeutsche BundesbankNo 37/2014
Decomposition of country-specificcorporate bond spreads
Niko Dötz
Discussion Papers represent the authors‘ personal opinions and do notnecessarily reflect the views of the Deutsche Bundesbank or its staff.

Editorial Board: Daniel Foos Thomas Kick Jochen Mankart Christoph Memmel Panagiota Tzamourani
Deutsche Bundesbank, Wilhelm-Epstein-Straße 14, 60431 Frankfurt am Main, Postfach 10 06 02, 60006 Frankfurt am Main Tel +49 69 9566-0 Please address all orders in writing to: Deutsche Bundesbank, Press and Public Relations Division, at the above address or via fax +49 69 9566-3077
Internet http://www.bundesbank.de
Reproduction permitted only if source is stated.
ISBN 978–3–95729–092–2 (Printversion)ISBN 978–3–95729–093–9 (Internetversion)
Non-technical summary Research Question In the financial crisis corporate bond spreads widened strongly especially for firms from euro-area periphery countries. A decomposition of the spreads into the expected loss, bond risk premium and liquidity premium can provide information that is relevant for assessing financing conditions from a monetary policy and financial stability view. Contribution This paper presents a new approach, based on the Merton model, to decomposing corporate bond spreads. We show how the bond risk premium can be represented in the Merton model depending on the hedge ratio (the sensitivity of debt to equity) and the equity risk premium. In the empirical section, we estimate the hedge ratios in a time-varying way via the volatilities on the equity and bond market and calculate the equity risk premiums. We focus on country-specific financing conditions of German, French, Spanish and Italian firms and also analyse its determinants. Results The results show that the bond risk premium accounts for a much larger share of the spreads than ei-ther the expected loss component or the liquidity premium. While the expected loss component made the greatest contribution to the strong widening of the spreads in the crisis period around the turn of 2008/09 (indicating that investors were distinctly worried about unfavourable fundamentals at the time), the spreads were then heavily dominated by the bond risk premium and investors received rela-tively low or, at times, no compensation for expected losses. This points to a relatively high valuation on the corporate bond markets. The results on the magnitude of the individual spread components also reveal a certain degree of heterogeneity between the countries considered. For instance, the bond risk premium for France and the liquidity premium for Spain account for a particularly large share of the spreads. The heterogeneity between the countries considered is also due to differences in sovereign CDS premiums which, together with the safe interest rate, are key determinants for the expected loss component and the bond risk premium.
Nichttechnische Zusammenfassung Fragestellung In der Finanzkrise haben sich die Renditeaufschläge auf EWU-Unternehmensanleihen vor allem in den Peripherieländern deutlich ausgeweitet. Eine Zerlegung der Renditeaufschläge in die Bestandteile erwartete Kreditausfallverluste, Bondrisikoprämie und Liquiditätsprämie kann Informationen liefern, die für die Beurteilung der Finanzierungskonditionen aus geldpolitischer und finanzstabilitätspoliti-scher Sicht wichtig sind. Beitrag Das Papier stellt einen neuen, auf dem Merton-Modell basierenden Ansatz zur Zerlegung von Rendi-teaufschlägen auf Unternehmensanleihen vor. Wir zeigen, wie sich die Bondrisikoprämie in Abhän-gigkeit von der Hedge Ratio – der Sensitivität des Fremdkapitalwerts gegenüber dem Eigenkapitalwert – und der Aktienrisikoprämie darstellen lässt. Im empirischen Teil ermitteln wir zeitvariable Hedge Ratios über die Volatilitäten am Aktien- und Bondmarkt und berechnen die Aktienrisikoprämien. Die Untersuchung bezieht sich auf landesspezifische Finanzierungskonditionen deutscher, französischer, spanischer und italienischer Unternehmen und analysiert auch wichtige Determinanten. Ergebnisse Die Ergebnisse zeigen, dass die Bondrisikoprämie einen merklich größeren Anteil der Spreads erklärt als die Expected-loss-Komponente oder die Liquiditätsprämie. Die Expected-loss-Komponente hat zwar zur kräftigen Ausweitung der Spreads in der Krisenphase um den Jahreswechsel 2008/2009 den größten Beitrag geleistet, was auf damals ausgeprägte Sorgen der Anleger vor ungünstigen Fundamen-taldaten hindeutet. Anschließend wurden die Spreads aber stark von der Bondrisikoprämie dominiert, und die Anleger erhielten für erwartete Verluste eine relativ geringe oder sogar überhaupt keine Kom-pensation. Dies deutet auf eine relativ hohe Bewertung an den Corporate Bond-Märkten hin. Die Er-gebnisse zu den Erklärungsbeiträgen der einzelnen Komponenten weisen außerdem auf eine gewisse Heterogenität zwischen den Ländern hin. Beispielsweise leistet die Bondrisikoprämie für Frankreich und die Liquiditätsprämie für Spanien einen besonders hohen Beitrag zu den Spreads. Zu der Hetero-genität zwischen den Ländern haben auch unterschiedliche staatliche CDS-Prämien beigetragen, die zusammen mit dem sicheren Zins wichtige Bestimmungsgrößen der Expected-loss-Komponente und der Bondrisikoprämie sind.

BUNDESBANK DISKUSSION PAPER NO 37/2014
Decomposition of country-specific corporate bond spreads1
Niko Dötz
Abstract This paper presents a new approach, based on the Merton model, to decomposing corporate bond spreads into the expected loss, bond risk premium and liquidity premium components. The ap-proach focuses on establishing the bond risk premium using the equity risk premium and the hedge ratio, which are estimated using a dividend discount model and a BEKK-GARCH model. The analysis focuses on non-financial European BBB-rated corporate bonds and distinguishes explicitly between German, French, Spanish and Italian firms. The results show that the bond risk premium is the largest component. While the expected loss component made the greatest contri-bution to the strong widening of the spreads around the turn of 2008/09, the spreads were then heavily dominated by the bond risk premium and investors received relatively low or, at times, no compensation for expected losses. The safe interest rate and the sovereign CDS premiums are key determinants of the expected loss component and the bond risk premium. Keywords: Structural models, credit spreads, risk premiums JEL classification: G12, G15
1 Author’s contact address: Niko Dötz: Department of Economics, Deutsche Bundesbank. Phone: +49-69-95668074,
email: [email protected]. I would like to thank Ulrich Grosch, Mathias Hoffmann, Jochen Mankart and an anonymous referee for valuable comments and helpful discussion. Discussion papers represent the authors‘ personal opinions and do not necessarily reflect the views of the Deutsche Bundesbank or its staff.

1. Introduction
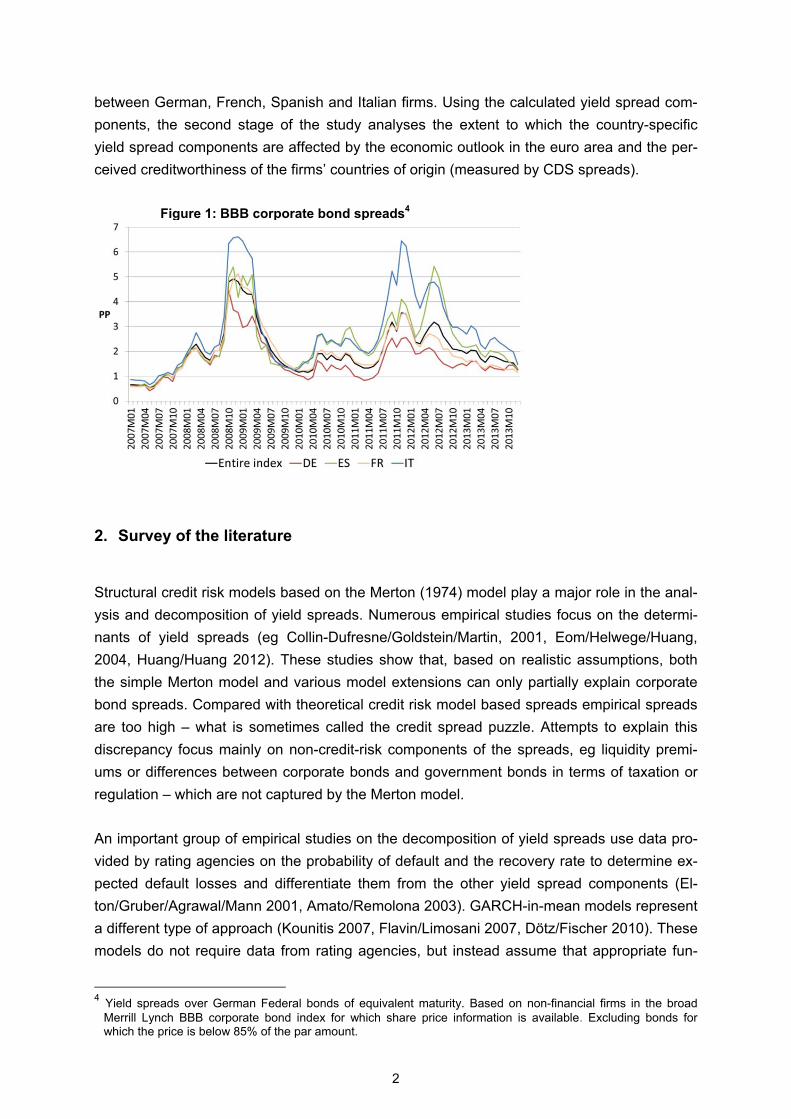
Bond spreads for firms from euro-area periphery countries, which had been broadly similar to
those for German companies before the financial crisis, widened strongly around the turn of
2008/09 and between autumn 2011 and the middle of 2012. As the financial markets grew
calmer, however, yield spreads tightened again noticeably and the differences between
countries also narrowed once more (see Figure 1). Nonetheless, the at times significant het-
erogeneity of corporate financing conditions has fuelled the debate on how far the monetary
policy transmission process in the euro area and especially in the periphery countries has
been impaired. The low levels of yield spreads at the end of 2013 increasingly raised the
question of how indicators of setback potential can be identified in this market.
Against this background, a (country-specific) decomposition of the spreads can provide im-
portant information. To assess the effectiveness of monetary policy transmission, it is im-
portant to discover, for example, whether broader spreads mainly reflect higher expected
default losses as a result of a gloomy economic outlook or rather heightened uncertainty, a
reduced appetite for risk or an increased preference for liquidity by market participants. A
breakdown of this kind helps to establish how far changes in the yield spreads are based on
the real economy or how far they are attributable to changes in volatilities or market partici-
pants’ preferences. First, this is important for assessing monetary policy reactions aimed at
improving corporate financing conditions. Second, decomposing spreads gives a more accu-
rate idea of how permanent the observed changes in financing costs are and what impact
they have on financial market stability, firms’ investment activity and aggregate demand.2
This study presents a new approach to decomposing corporate bond spreads into the ex-
pected loss, bond risk premium and liquidity premium components. The approach focuses on
establishing the bond risk premium using the equity risk premium and the hedge ratio, which
is derived from the Merton model.3 In comparison to existing studies on structural credit risk
models, the methodology is relatively simple and the advantage is that there is no need to
use variables which are difficult to quantify, such as the value of the firm’s assets. Most exist-
ing studies on structural credit risk models do not include the equity risk premium
(Huang/Huang 2012) even though the dividend discount models provide an established
method for calculating this premium. The inclusion of the equity risk premium is also sup-
ported by empirical evidence that the stock markets incorporate new information quickly and
efficiently. Unlike earlier studies, which concentrate mainly on US firms, this analysis focuses
on non-financial European corporate bonds (BBB rated) and makes an explicit distinction 2 For example, Gilchrist/Zakrajšek (2012) emphasise that the bond risk premium can provide important infor-
mation about economic activity. 3 The hedge ratio is the sensitivity of debt to equity. It indicates how many shares need to be purchased for a
replicating portfolio in order to replicate a corporate bond.
1
between German, French, Spanish and Italian firms. Using the calculated yield spread com-
ponents, the second stage of the study analyses the extent to which the country-specific
yield spread components are affected by the economic outlook in the euro area and the per-
ceived creditworthiness of the firms’ countries of origin (measured by CDS spreads).
Figure 1: BBB corporate bond spreads4
2. Survey of the literature
Structural credit risk models based on the Merton (1974) model play a major role in the anal-
ysis and decomposition of yield spreads. Numerous empirical studies focus on the determi-
nants of yield spreads (eg Collin-Dufresne/Goldstein/Martin, 2001, Eom/Helwege/Huang,
2004, Huang/Huang 2012). These studies show that, based on realistic assumptions, both
the simple Merton model and various model extensions can only partially explain corporate
bond spreads. Compared with theoretical credit risk model based spreads empirical spreads
are too high – what is sometimes called the credit spread puzzle. Attempts to explain this
discrepancy focus mainly on non-credit-risk components of the spreads, eg liquidity premi-
ums or differences between corporate bonds and government bonds in terms of taxation or
regulation – which are not captured by the Merton model.
An important group of empirical studies on the decomposition of yield spreads use data pro-
vided by rating agencies on the probability of default and the recovery rate to determine ex-
pected default losses and differentiate them from the other yield spread components (El-
ton/Gruber/Agrawal/Mann 2001, Amato/Remolona 2003). GARCH-in-mean models represent
a different type of approach (Kounitis 2007, Flavin/Limosani 2007, Dötz/Fischer 2010). These
models do not require data from rating agencies, but instead assume that appropriate fun-
4 Yield spreads over German Federal bonds of equivalent maturity. Based on non-financial firms in the broad
Merrill Lynch BBB corporate bond index for which share price information is available. Excluding bonds for which the price is below 85% of the par amount.
2

damental determinants can be specified for the expected default losses and that the risk
premium can be adequately explained using the estimated conditional variance of the resid-
uals.
Non-credit-risk components are not the only factor to be taken into account when decompos-
ing yield spreads. A further challenge is to break down the credit risk components into the
element that represents compensation for expected losses (the expected loss component)
and into the bond risk premium, which reflects the uncertainty associated with the expected
loss component and also depends on investors’ risk aversion. Although the Merton model
can be resolved into the yield spread (see Annex 7.1), because the model is based on the
no-arbitrage principle and is independent of risk preferences, the model-based theoretical
yield spread reflects the total compensation for the credit risk, ie the sum of the expected
loss component and the bond risk premium. Additional information about the market partici-
pants’ risk preferences is therefore needed in order to determine the individual components.
The present approach uses the equity risk premium for this purpose as it reflects market par-
ticipants’ risk preferences. The equity risk premium, together with the hedge ratio derived
from the simple Merton model, forms the basis for calculating the bond risk premium.
In a similar paper, Churm/Panigirtzoglou (2005) use an extension of the Merton model by
Leland and Toft (1996) to decompose US and UK corporate bond spreads during the obser-
vation period from 1997 to 2003. To determine the growth path of the value of the firm, they
use the equity risk premium derived from a dividend discount model, meaning that the infor-
mation on market participants’ risk preferences contained in the equity risk premium is indi-
rectly taken into account.5 They also use the implied equity volatility to calculate the volatility
of total assets. On this basis, they isolate the bond risk premium from the expected loss
component by comparing the risk-neutral and “real-world” probability density functions. In line
with the present approach, Churm/Panigirtzoglou arrive at the conclusion that the expected
loss component is closely correlated with the spread and that both variables rise considera-
bly during times of crisis. As in the present approach, they also find that the bond risk premi-
um is mostly higher than the expected loss component. However, in a departure from the
present approach, they always calculate the expected loss component to be positive and
their results reveal that the non-credit risk factors play a more significant role.
One key reason as to why the non-credit risk components account for a relatively high share
of the spreads in Churm/Panigirtzoglou’s approach is likely to lie in their calculation as a re-
sidual. Churm/Panigirtzoglou underline that these components contain not only a liquidity
premium but also tax effects or differences in regulation between corporate and government
bonds. The way in which the expected loss component is calculated in the two approaches
also differs considerably. In Churm/Panigirtzoglou’s approach, the expected loss component
is the compensation required by risk-neutral investors for credit risk and is thus always posi-
5 In the model used by Leland/Toft (1996), the growth path of the assets is dependent on the firm’s capital costs.
The capital costs consist of the default-free interest rate and the asset risk premium, which, in turn, is a weighted (with the leverage ratio) average of the yield spread and the equity risk premium.
3
tive. Its value depends chiefly on the implied equity volatility. In the present approach, the
expected loss component is calculated as a residual by removing the bond and liquidity pre-
miums from the spread. The consequence of such an approach is, first, that it is more straight-forward to calculate and that no data on implied equity volatility are required. Second, the
expected loss component can take on a negative value when bond risk and liquidity premi-
ums are relatively high. Negative values imply that investors receive practically no compen-
sation for expected losses.
Two related papers (Chen/Guo/Zhang 2006, Campello/Chen/Zhang 2008) also focus on the
link between the risk premium, the bond risk premium and the hedge ratio, but with the op-
posite objective: to calculate the equity risk premium from the bond risk premium. These
studies are also similar to the rating-based approaches to decomposing the yield spreads
because they base their calculations of the bond risk premium on probabilities of default pro-
vided by Moody’s. Finally, our investigation is motivated by the results of a study by
Schaefer/Strebulaev (2008), in particular, which concludes that even the hedge ratio derived
from the simple Merton model largely corresponds to the empirical hedge ratio. This evi-
dence provides an important argument in favour of using the hedge ratio derived from the
classic Merton model to measuring the credit risk of corporate bonds.6 The use of the hedge
ratio implies that the Merton model is not used to calculate the absolute value of equity or
debt but to estimate how a one percent increase in the firm’s value is reflected by percentage
changes in the equity or debt value. As Schaefer/Strebulaev demonstrate, in this case, the
“noise” created by the non-credit risk components plays a minor role although, as the credit
puzzle shows, non-credit risk factors may reflect a significant portion of the yield spread.
While Chen/Guo/Zhang (2006), Campello/Chen/Zhang (2008) and Schaefer/Strebulaev
(2008) calculate the empirical hedge ratios using a regression analysis of equity returns and
bond yields, Bao/Pan (2012) base their calculations on the volatility of both markets. They
interpret their evidence that the observed volatility on the credit market (ie on the bond and
CDS market) is higher than the theoretical values derived from the Merton model (‘excess
volatility’) primarily as the reflection of time-varying liquidity premiums on the credit markets.
Their results, which are largely consistent with those of Schaefer/Strebulaev, provide an ad-
ditional motivation for this analysis. First, they suggest that the hedge ratio derived from the
Merton model may provide valuable insights into the relationship between equity and bond
market prices. Second, they imply that the model-based volatilities can provide important
information about this relationship if time-varying liquidity premiums are taken into account.
Section 3 of this paper shows how the bond risk premium is dependent on the hedge ratio
and the equity risk premium in the Merton model. In order to calculate the empirical bond risk
premiums, section 4 explains how the equity and bond volatilities and the equity risk premi-
um are calculated for the observed firms and presents the underlying data. Section 5 anal-
6 Che/Kapadia (2012) demonstrate that the theoretical and empirical hedge ratios for equities and credit default
swaps also largely correspond to one another, but emphasise the limited effectiveness of this type of hedging.
4

yses the relationship of the individual yield spread components with macro variables and
sovereign CDS spreads, and section 6 concludes.
3. The Merton model
3.1. Basic idea of the model7
The basic idea of the Merton model is that investment in a corporate bond can be replicated
by investment in a riskless bond and the sale of a put option (short put) on the firm with the
nominal value of the corporate bond as the strike price. The short put position reflects the
firm’s credit risk, because if the value of the firm is lower than the nominal value of the corpo-
rate bond when the corporate bond matures (insolvency), the put option is exercised. In this
case, the distressed firm is transferred to the seller of the put for the price of the nominal lia-
bilities. As a result his losses, like a bondholder, amount to the difference between the nomi-
nal bond value and the recoverable amount. According to the model, the yield spread on a
corporate bond therefore reflects the value of the put option and is determined by the same
factors (see Annex 7.1). As the following sections show, the bond risk premium can also be
determined from this model.
3.2. Calculating the bond risk premium
In Merton’s credit risk model, the growth in the value of the firm (V) follows a geometric
Brownian movement with drift:
1) VdV dt dWV
=μ + σ ,
where µ is trend growth (drift), Vσ is the volatility of the corporate asset returns and W is a
standard Wiener process. The value of the firm (V) consists of equity (E) and debt in the form
of a zero-coupon bond (D):
2) V E D= +
Both equity and debt are only affected by changes in the value of the firm:
3) 1E DV V
∂ ∂+ =∂ ∂
7 Annex 7.1 presents the Merton model in more detail and shows how the equation for the yield spread is derived.
5

The value of equity and debt are assumed to be a function of firm value and time. Ito’s Lem-
ma produces the following representation of the volatility of equity and debt returns (σ , σ ):8 4 ) E V
V EaE V
∂σ = σ∂
and 4 ) D VV DbD V
∂σ = σ∂
It follows from this that the relationship between σD and σE is equal to the sensitivity of debt
to equity. Following Schaefer/Strebulaev (2008), this sensitivity is defined as hedge ratio δ
below:
The hedge ratio is based on the concept that a corporate bond can be modelled using a rep-
licating portfolio consisting of riskless bonds and equities. It indicates how many stocks need
to be purchased in order to replicate a corporate bond. Campello/Chen/Zhang (2008) show
that, based on the assumptions of the simple Merton model, the equity risk premium (ERP) is
a linear function of the bond risk premium (BRP), with the inverse of the hedge ratio as the
scaling factor:
The underlying intuition is that both equities and corporate bonds are contingent claims writ-
ten on the corporate assets and therefore depend on a common systematic risk factor. The
relationship between the risk premiums corresponds to the hedge ratio. For the BRP, follow-
ing from 5) and 6),
.
3.3. Implications for decomposing the corporate bond spread
When decomposing the spread, it must be considered that the Merton model is based on
highly simplified assumptions. The yield spread is assumed to reflect only the credit risk, with
non-credit risk factors being omitted. Furthermore, the modelling of equity and debt is very
simple as it assumes that they are dependent on solely one factor: firm value.9 There is no
doubt that these simplifications impair the suitability of the Merton model for determining eq-
8 According to Ito’s Lemma, the change in the function of an underlying and of time (ie in the price of a derivative)
also follows an Ito process if the price of the underlying follows an Ito process. Under the assumptions of the Merton model, this means that the processes of the equity and debt value have different drift terms and Wiener process parameters to the process of the assets, but depend on the same random variable dW.
9 Extensions of the simple model include, for example, stochastic interest rates, an endogenously derived default, a dynamic capital structure or a jump in the firm value process; see, for example, Huang/Huang (2012).
7) D
E
BRP ERP σ=σ
/5)/
D
E
D V E D EE V D E D
σ ∂ ∂ ∂= = = δσ ∂ ∂ ∂
6) E DERP BRPD E
∂=∂
6

uity and debt. However, as demonstrated by Schaefer/Strebulaev (2008), such restrictions
are not as severe for determining the sensitivity of equity to debt. Thus, a crucial factor for
the empirical meaningfulness of the theoretical hedge ratio is likely to be the extent to which
participants in the equity and bond markets value risk in the same way – which the model
assumes they do. If the two markets were fully integrated, this would always be the case.
However, as market integration is more likely to be incomplete and to vary over time,10 the
following empirical results should be interpreted with more caution. In particular, equation 7
should be assumed to be true on average over a longer period of time – in line with
Schaefer/Strebulaev (2008) – rather than at any given time. Notwithstanding this caveat, the
decomposition of spreads can aid in evaluating the valuation level of bond markets.
Calculating the empirical bond risk premium using the simple relationship in equation 7 has a
number of benefits. The calculations do not require any information about determinants of
the put options (which are partly difficult to measure), about historical default rates or about
(intransparent) valuations by rating agencies.11 The volatilities of the equity and debt returns,
σE and σD, can be determined at any given time on the basis of market prices. Including equi-
ty markets in the calculation also acknowledges empirical evidence that the stock markets
incorporate new information relatively quickly and efficiently (Forte/Peña 2009). Lastly, divi-
dend discount models, which are based on regular updates of analysts’ estimates of corpo-
rate earnings, are a widely established approach to establishing the equity risk premium.12
4. Decomposition of yield spreads
4.1. Methodology
Overview
The first step in decomposing yield spreads is to identify the bond risk premium. Then, in a
second step, a simple linear regression is used to calculate the liquidity premium and finally,
as a residual, the expected loss component.
Enterprises in the entire bond index
To establish the bond risk premium for the enterprises included in the entire index, the volatil-
ities σD and σE must first be calculated. Following Schaefer/Strebulaev (2008), to do this we
calculate the aggregate excess return on the bonds, weighted according to their nominal val- 10 For instance, the degree of market integration is likely to depend chiefly on the extent to which investors and
firms are restricted by regulations: those governing investment decisions of the former and financing decisions of the latter; see Titman (2002).
11 The value and the volatility of a firm’s assets or the value of a firm’s liabilities are deemed to be difficult to measure if neither the assets nor the liabilities are traded on the markets.
12 The analysts’ estimates used here are I/B/E/S estimates (Institutional Brokers Estimate System).
7

ue.13 The excess returns on the corresponding shares are also weighted according to the
nominal value of the bonds. The excess returns on the bonds and shares are the logarithmic
price differentials minus the yield on three-month Bubills (the latter converted into monthly
values).14 Then, the volatilities of the aggregate share and bond excess returns are estimated
using a diagonal bivariate BEKK-GARCH model.15 The application of a BEKK model implies
that, as well as the time-varying variances, the time-varying covariance between the bond
and share excess returns is also estimated.
The corresponding equity risk premium is calculated in two steps. First, the equity risk premi-
um for the broad Euro Stoxx index is established using a three-stage dividend discount mod-
el.16 Then, a simple CAPM is estimated for the shares covered by the bond index. To do this,
the aggregate excess returns on the shares are regressed on a constant and the excess re-
turns for the Euro Stoxx. The equity risk premium for the enterprises in the bond index is then
equal to the product of the beta factor and the Euro Stoxx equity risk premium.
To take account of the empirical indications of a “credit spread puzzle”, the present analysis
factors in investors’ liquidity preferences. We use the bid/ask spreads on the bonds to meas-
ure liquidity risk below; the Annex (7.4) sets out an alternative measure in the form of the
yield spread on bonds issued by the government-guaranteed Kreditanstalt für Wiederaufbau
(KfW). To calculate the aggregate liquidity premium at index level, the aggregate yield
spreads are first regressed on a constant and the aggregate bid/ask spreads for the bonds.17
The liquidity premium is then calculated as the product of the corresponding regression coef-
ficients and the bid/ask spreads. Finally, the aggregate expected loss component is estab-
lished, as a residual, as the discrepancy between the yield spread and the bond and liquidity
premium.
Country-specific sub-indices
For the country-specific analysis, bond sub-indices weighted according to the nominal value
of the corporate bonds are created for the individual countries under consideration (DE, ES,
FR, IT). Apart from the calculation of the bond and equity volatilities σD and σE the country-
13 Following Brooks (2008), the excess returns for the selected bonds and shares are established against three-
month Bubill returns. In calculating the excess returns, and thus the bond volatility σD, the fact that the bond prices also include liquidity premiums is initially abstracted out. The Annex (7.3) investigates how the use of li-quidity-adjusted bond prices affects the estimated bond volatility σD and the bond risk premium. On average, the bond risk premium for the country-specific sub-indices calculated using the liquidity-adjusted bond prices is 25 bps above the unadjusted bond risk premium.
14 The share prices used include dividend payments (total return prices). 15 In the literature, multivariate GARCH models such as the BEKK model play an important role in calculating the
optimal hedge ratio between spot paper and futures; see Brooks (2008). In the general BEKK model, the vari-ance-covariance matrix
tH is 1 1 1[ ' ]t t t tH C A A BH B− − −′ ′= + ε ε + . In a diagonal BEKK model, the elements of
the coefficient matrices A and B not lying on the diagonal are equal to zero. For a detailed explanation of the BEKK model, see Engle/Kroner (1995).
16 For details of the three-stage dividend discount model, see Deutsche Bundesbank, Monthly Report, March 2003, p 35.
17 To account for autocorrelation, we include two lags of the spread. Since there are no bid/ask spreads available for a small number of bonds, the weighting of the individual bonds is adjusted accordingly when calculating the aggregate bid/ask spreads.
8

specific bond risk premiums, liquidity premiums and expected loss components are identified
in the same way as for the entire bond index. For the country-specific bond and equity volatil-
ities, two market-specific diagonal BEKK models are estimated, ie a four-country model each
for the bond and equity market. This approach is based on the consideration that the individ-
ual variances can best be estimated not on a country-specific basis but in combination with
the market-specific covariances between the individual countries.
4.2. Data sources
The central data source on which the present analysis is based is the Merrill Lynch corporate
bond index for euro-denominated, BBB-rated bonds issued by non-financial corporations.
The sample covers all bonds of enterprises for which share price data are available. To pre-
vent extreme price movements that are attributable to impending insolvency or restructuring
from distorting the sample, the sample includes only bonds for which the price is at least 85%
of the par amount. Overall, in the period under observation – January 2006 to December
2013 (monthly data) – this involves 724 bonds issued by 163 enterprises from 14 countries
with an average effective duration of around 4½ years. Germany accounts for 146 bonds (43
enterprises), Spain 92 bonds (16 enterprises), France 291 bonds (59 enterprises) and Italy
110 bonds (23 enterprises). The data on nominal value, price, yield and effective duration are
supplied by Merrill Lynch; the bid/ask spreads for the bonds and the share prices are ob-
tained from Bloomberg. The bond yield spreads are calculated against the five-year yield on
German government bonds.
4.3. Results
Enterprises in the entire bond index
The estimated hedge ratio for enterprises in the entire bond index is between 0.22 and 0.33
in the period under observation.18 The corresponding equity risk premium is between 2.8%
and 9.8% (Tables 1, 2 and Figure 1A in the Annex, section 7.2). The estimation of the liquidi-
ty premium reveals, that the bid/ask spreads have a significant positive influence on the yield
spreads, as expected. Decomposing the spreads shows that the bond risk premium as a
whole accounts for a much larger share of the spreads than the expected loss component or
the liquidity premium. While the expected loss component made the greatest contribution to
the strong widening of the spreads in the crisis period around the turn of 2008/09 (indicating
that investors were distinctly worried about unfavourable fundamentals at the time), the
spreads were then heavily dominated by the bond risk premium, and the expected loss com-
ponent was, at times, negative due to the fact that it is calculated as a residual. Such values
18 The BEKK model is also used to estimate the time-varying conditional covariance between the monthly excess
returns on bonds and equity. It is between -1.4 BP and 2.5 BP.
9
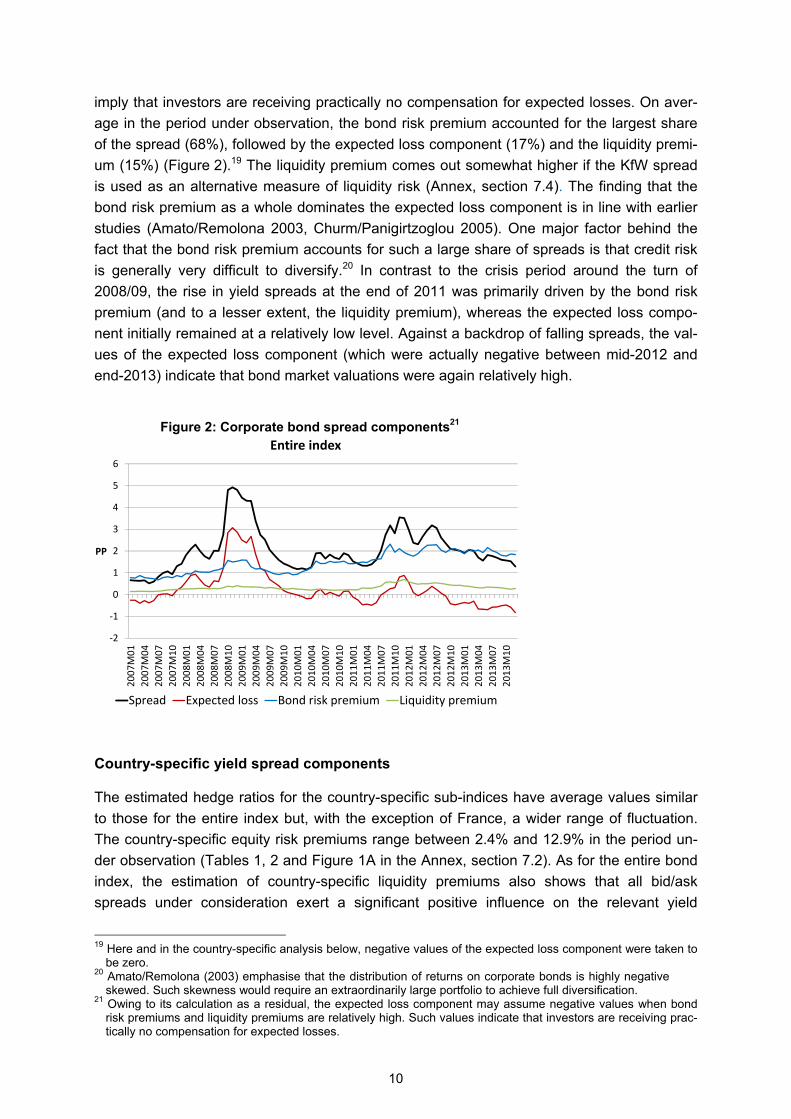
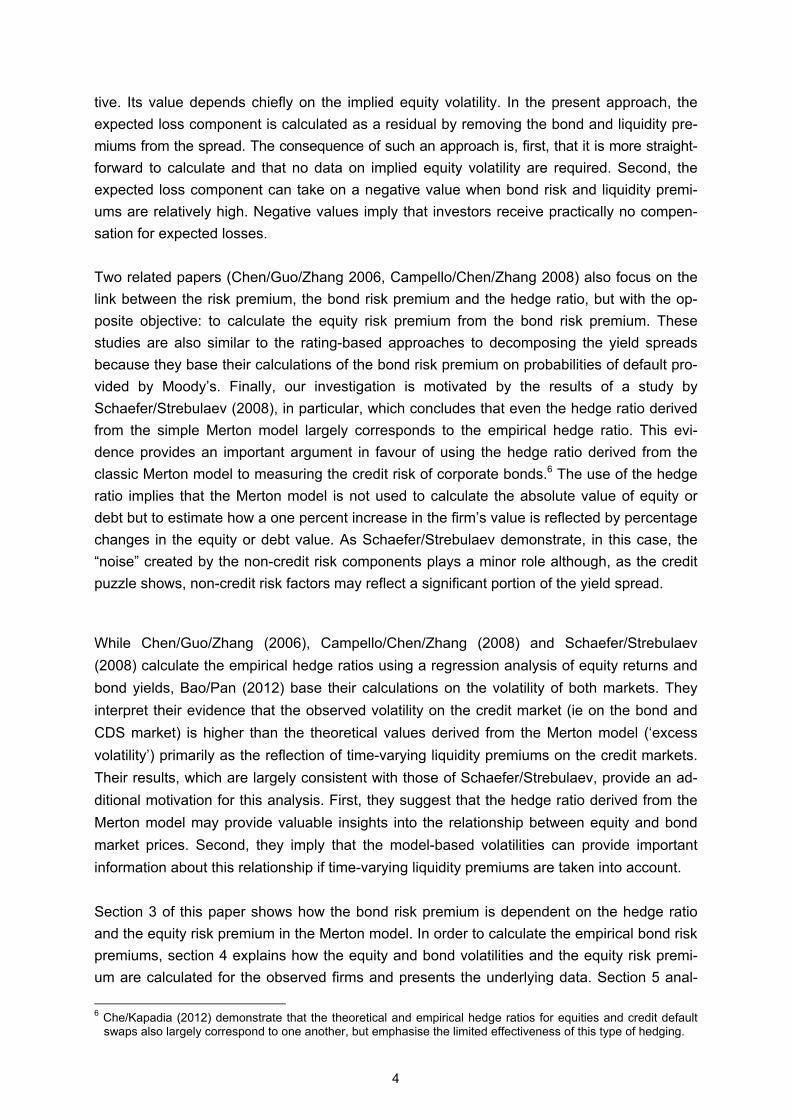
imply that investors are receiving practically no compensation for expected losses. On aver-
age in the period under observation, the bond risk premium accounted for the largest share
of the spread (68%), followed by the expected loss component (17%) and the liquidity premi-
um (15%) (Figure 2).19 The liquidity premium comes out somewhat higher if the KfW spread
is used as an alternative measure of liquidity risk (Annex, section 7.4). The finding that the
bond risk premium as a whole dominates the expected loss component is in line with earlier
studies (Amato/Remolona 2003, Churm/Panigirtzoglou 2005). One major factor behind the
fact that the bond risk premium accounts for such a large share of spreads is that credit risk
is generally very difficult to diversify.20 In contrast to the crisis period around the turn of
2008/09, the rise in yield spreads at the end of 2011 was primarily driven by the bond risk
premium (and to a lesser extent, the liquidity premium), whereas the expected loss compo-
nent initially remained at a relatively low level. Against a backdrop of falling spreads, the val-
ues of the expected loss component (which were actually negative between mid-2012 and
end-2013) indicate that bond market valuations were again relatively high.
Figure 2: Corporate bond spread components21
Country-specific yield spread components
The estimated hedge ratios for the country-specific sub-indices have average values similar
to those for the entire index but, with the exception of France, a wider range of fluctuation.
The country-specific equity risk premiums range between 2.4% and 12.9% in the period un-
der observation (Tables 1, 2 and Figure 1A in the Annex, section 7.2). As for the entire bond
index, the estimation of country-specific liquidity premiums also shows that all bid/ask
spreads under consideration exert a significant positive influence on the relevant yield
19 Here and in the country-specific analysis below, negative values of the expected loss component were taken to
be zero. 20 Amato/Remolona (2003) emphasise that the distribution of returns on corporate bonds is highly negative
skewed. Such skewness would require an extraordinarily large portfolio to achieve full diversification. 21 Owing to its calculation as a residual, the expected loss component may assume negative values when bond
risk premiums and liquidity premiums are relatively high. Such values indicate that investors are receiving prac-tically no compensation for expected losses.
-2
-1
0
1
2
3
4
5
6
2007
M01
2007
M04
2007
M07
2007
M10
2008
M01
2008
M04
2008
M07
2008
M10
2009
M01
2009
M04
2009
M07
2009
M10
2010
M01
2010
M04
2010
M07
2010
M10
2011
M01
2011
M04
2011
M07
2011
M10
2012
M01
2012
M04
2012
M07
2012
M10
2013
M01
2013
M04
2013
M07
2013
M10
PP
Entire index
Spread Expected loss Bond risk premium Liquidity premium
10
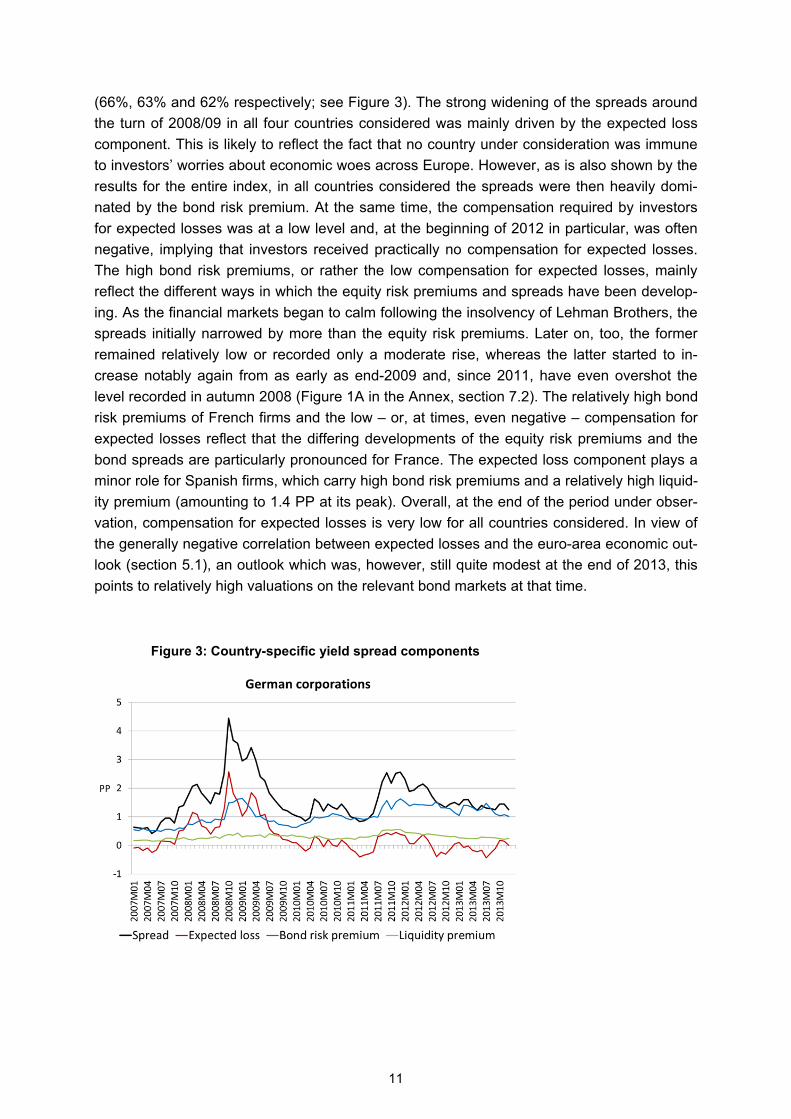
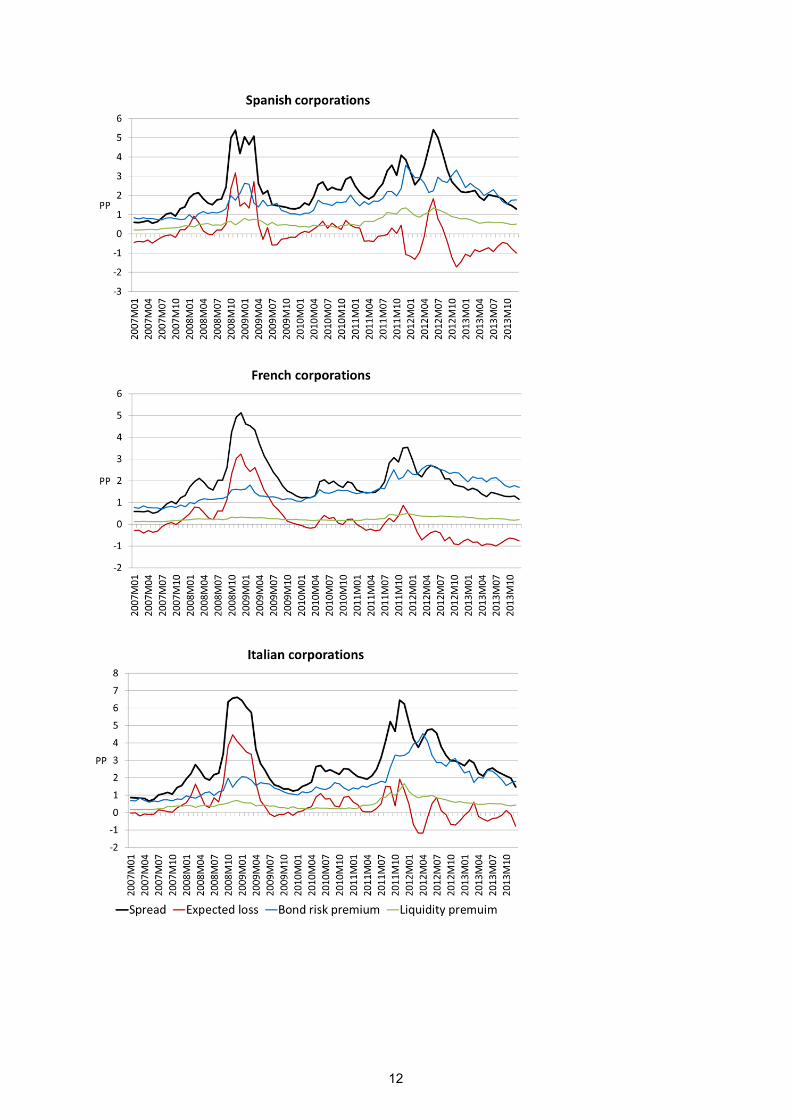
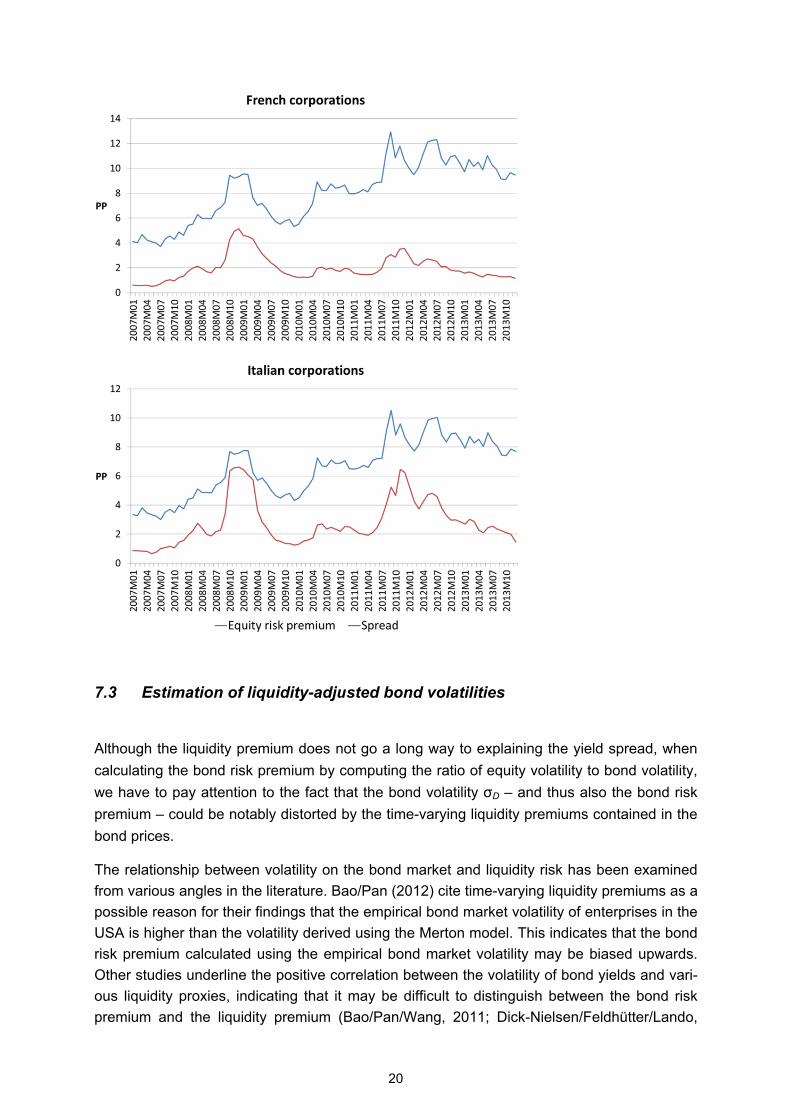
(66%, 63% and 62% respectively; see Figure 3). The strong widening of the spreads around the turn of 2008/09 in all four countries considered was mainly driven by the expected loss component. This is likely to reflect the fact that no country under consideration was immune to investors’ worries about economic woes across Europe. However, as is also shown by the results for the entire index, in all countries considered the spreads were then heavily domi-nated by the bond risk premium. At the same time, the compensation required by investors for expected losses was at a low level and, at the beginning of 2012 in particular, was often negative, implying that investors received practically no compensation for expected losses. The high bond risk premiums, or rather the low compensation for expected losses, mainly reflect the different ways in which the equity risk premiums and spreads have been develop-ing. As the financial markets began to calm following the insolvency of Lehman Brothers, the spreads initially narrowed by more than the equity risk premiums. Later on, too, the former remained relatively low or recorded only a moderate rise, whereas the latter started to in-crease notably again from as early as end-2009 and, since 2011, have even overshot the level recorded in autumn 2008 (Figure 1A in the Annex, section 7.2). The relatively high bond risk premiums of French firms and the low – or, at times, even negative – compensation for expected losses reflect that the differing developments of the equity risk premiums and the bond spreads are particularly pronounced for France. The expected loss component plays a minor role for Spanish firms, which carry high bond risk premiums and a relatively high liquid-ity premium (amounting to 1.4 PP at its peak). Overall, at the end of the period under obser-vation, compensation for expected losses is very low for all countries considered. In view of the generally negative correlation between expected losses and the euro-area economic out-look (section 5.1), an outlook which was, however, still quite modest at the end of 2013, this points to relatively high valuations on the relevant bond markets at that time.
Figure 3: Country-specific yield spread components
11
12

5. Relationship between the yield spread components and macro variables as
well as sovereign CDS premiums
Clearly, a suitable evaluation of financing conditions on the corporate bond markets needs to
include an assessment of the specific yield spread components in relation to the macroeco-
nomic environment. To measure the market participants’ expectations for the economy we
use the euro-area purchasing managers’ index (PMI) for the manufacturing sector, a widely
used leading indicator of economic activity. The yield on ten-year Bunds is used as a meas-
ure of the safe interest rate. The analysis also includes sovereign CDS premiums (duration: 5
years; source: Markit). This considers recent literature which shows that a worsening in gov-
ernment financing conditions has a negative impact on domestic enterprises, through rating
downgrades (Almeida/Cunha/Ferreira/Restrepo 2014) or through higher CDS spreads
(Bedendo/Colla 2013).
This section shows the relationship between these variables and the expected loss compo-
nent as well as the bond risk premium using a simple vector autoregressive model (VAR).22
Granger causality tests based on the VAR models indicate that yields on Bunds have a major
impact on the expected default losses, whereas the sovereign CDS premiums appear to in-
fluence the bond risk premiums (Tables 3 and 4 in the Annex, section 7.5). The Granger
causality tests do not provide robust results for the PMI.
Impulse response sequences can be used to demonstrate the dynamics of the impact of the
variables considered on the expected loss component and the bond risk premium (Figure
4).23 As expected, the economic expectations (measured by the PMI) and sovereign CDS
premiums both have a significant impact on the expected loss component. Both effects are
more pronounced for Spain and Italy than for Germany and France. This suggests that Span-
ish and Italian firms’ earnings and probability of insolvency are more dependent on the euro-
area economy than is the case for German and French firms. Furthermore, the fact that
Spanish and Italian firms are particularly sensitive to sovereign CDS premiums could reflect
market participants’ expectations, for instance, that a sovereign downgrade will have a detri-
mental effect on firms in the future. Examples of such a detrimental effect are higher taxes,
increased government consolidation efforts and a weakened economy. Overall, the results
indicate that the perceived improvement in government creditworthiness, as demonstrated by
lower sovereign CDS premiums, played a major role in the decline in the expected default
losses since mid-2012.
Furthermore, a fall in the safe interest rate (measured by the yield on Bunds) initially results
in higher expected default losses. This negative effect is significant for Germany, France and
Italy. The negative effect is in line with the Merton model, where a lower safe interest rate
implies a flatter growth path for corporate assets and thus a higher probability of default.
However, as shown in Figure 4, this effect is only short-lived. This may indicate that lower in-
22 Following the information criteria of Schwarz and Hannan-Quinn, the VAR models are estimated with one lag. 23 We use generalised impulse responses as described by Pesaran/Shin (1998).
13
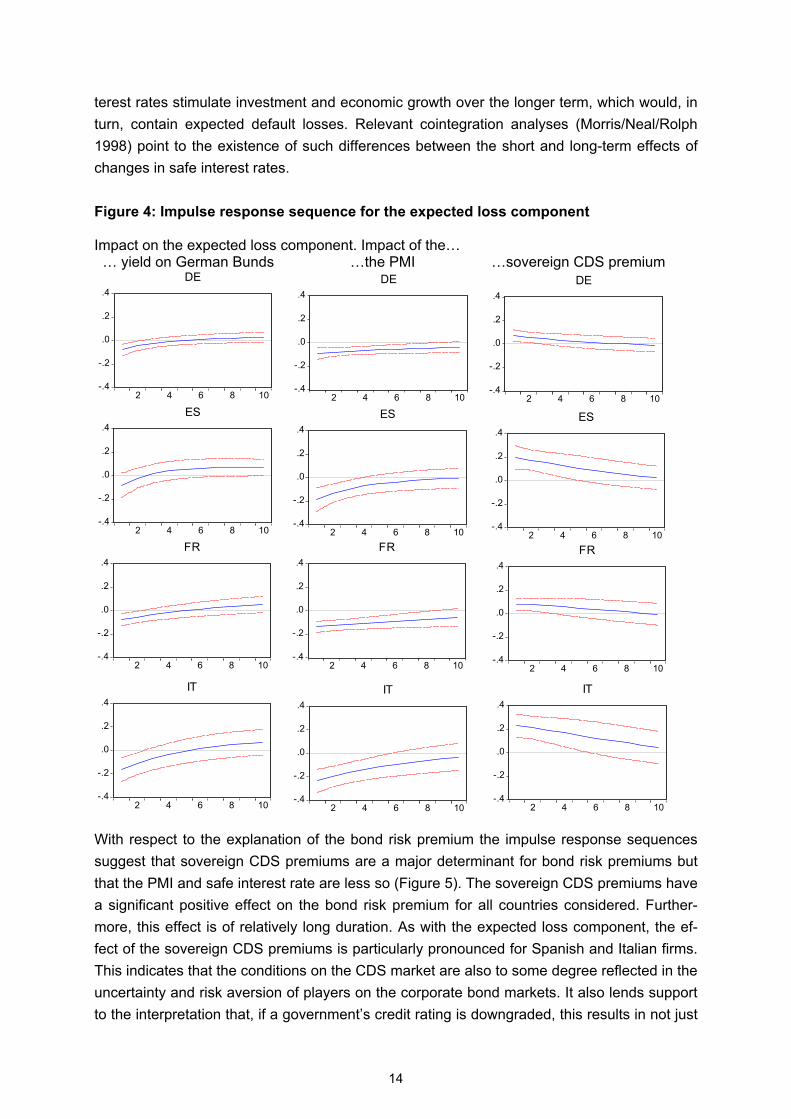
terest rates stimulate investment and economic growth over the longer term, which would, in
turn, contain expected default losses. Relevant cointegration analyses (Morris/Neal/Rolph
1998) point to the existence of such differences between the short and long-term effects of
changes in safe interest rates.
Figure 4: Impulse response sequence for the expected loss component Impact on the expected loss component. Impact of the… … yield on German Bunds …the PMI …sovereign CDS premium
-.4
-.2
.0
.2
.4
2 4 6 8 10
DE
-.4
-.2
.0
.2
.4
2 4 6 8 10
DE
-.4
-.2
.0
.2
.4
2 4 6 8 10
DE
-.4
-.2
.0
.2
.4
2 4 6 8 10
ES
-.4
-.2
.0
.2
.4
2 4 6 8 10
ES
-.4
-.2
.0
.2
.4
2 4 6 8 10
ES
-.4
-.2
.0
.2
.4
2 4 6 8 10
FR
-.4
-.2
.0
.2
.4
2 4 6 8 10
FR
-.4
-.2
.0
.2
.4
2 4 6 8 10
FR
-.4
-.2
.0
.2
.4
2 4 6 8 10
IT
-.4
-.2
.0
.2
.4
2 4 6 8 10
IT
-.4
-.2
.0
.2
.4
2 4 6 8 10
IT
With respect to the explanation of the bond risk premium the impulse response sequences
suggest that sovereign CDS premiums are a major determinant for bond risk premiums but
that the PMI and safe interest rate are less so (Figure 5). The sovereign CDS premiums have
a significant positive effect on the bond risk premium for all countries considered. Further-
more, this effect is of relatively long duration. As with the expected loss component, the ef-
fect of the sovereign CDS premiums is particularly pronounced for Spanish and Italian firms.
This indicates that the conditions on the CDS market are also to some degree reflected in the
uncertainty and risk aversion of players on the corporate bond markets. It also lends support
to the interpretation that, if a government’s credit rating is downgraded, this results in not just
14
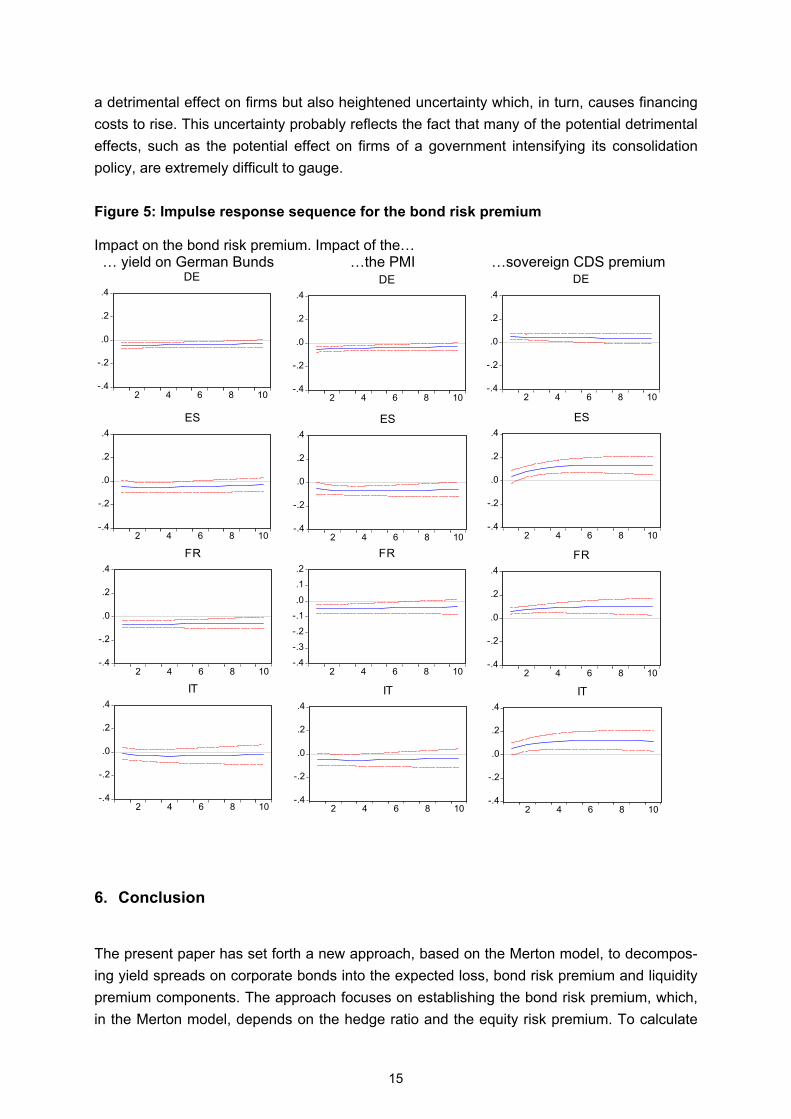
a detrimental effect on firms but also heightened uncertainty which, in turn, causes financing
costs to rise. This uncertainty probably reflects the fact that many of the potential detrimental
effects, such as the potential effect on firms of a government intensifying its consolidation
policy, are extremely difficult to gauge.
Figure 5: Impulse response sequence for the bond risk premium Impact on the bond risk premium. Impact of the… … yield on German Bunds …the PMI …sovereign CDS premium
-.4
-.2
.0
.2
.4
2 4 6 8 10
DE
-.4
-.2
.0
.2
.4
2 4 6 8 10
DE
-.4
-.2
.0
.2
.4
2 4 6 8 10
DE
-.4
-.2
.0
.2
.4
2 4 6 8 10
ES
-.4
-.2
.0
.2
.4
2 4 6 8 10
ES
-.4
-.2
.0
.2
.4
2 4 6 8 10
ES
-.4
-.2
.0
.2
.4
2 4 6 8 10
FR
-.4
-.3
-.2
-.1
.0
.1
.2
2 4 6 8 10
FR
-.4
-.2
.0
.2
.4
2 4 6 8 10
FR
-.4
-.2
.0
.2
.4
2 4 6 8 10
IT
-.4
-.2
.0
.2
.4
2 4 6 8 10
IT
-.4
-.2
.0
.2
.4
2 4 6 8 10
IT
6. Conclusion
The present paper has set forth a new approach, based on the Merton model, to decompos-
ing yield spreads on corporate bonds into the expected loss, bond risk premium and liquidity
premium components. The approach focuses on establishing the bond risk premium, which,
in the Merton model, depends on the hedge ratio and the equity risk premium. To calculate
15
the empirical bond risk premiums, the hedge ratios are estimated in a time-varying way via
the volatilities on the equity and bond markets using BEKK-GARCH models, while the equity
risk premiums are calculated through a three-stage dividend discount model. The empirical
bond risk premiums then form the basis for decomposing yield spreads. Using the broad
Merrill Lynch BBB corporate bond index as the central source of data, we focus on non-
financial European corporations, with the analysis distinguishing explicitly between enterpris-
es based in Germany, France, Spain and Italy. We also investigate how the expected loss
component and the bond risk premium are affected by the economic outlook in the euro ar-
ea, the safe interest rate and sovereign CDS-markets.
The results show that the bond risk premium accounts for a markedly larger share of the
spreads than either the expected loss component or the liquidity premium. While the ex-
pected loss component made the greatest contribution to the strong widening of the spreads
in the crisis period around the turn of 2008/09 (indicating that investors were distinctly wor-
ried about unfavourable fundamentals at the time), the spreads were then heavily dominated
by the bond risk premium and investors received relatively low or, at times, no compensation
for expected losses. This points to relatively high valuations on the corporate bond markets.
The results on the magnitude of the individual spread components also reveal a certain de-
gree of heterogeneity between the countries considered. For instance, the bond risk premium
for France and the liquidity premium for Spain account for a particular large share of the
spreads. The heterogeneity between the countries considered is also due to differences in
sovereign CDS premiums which, together with the safe interest rate, are important determi-
nants of the expected loss component and the bond risk premium.
16

7. Annex
7.1. Yield spread in the Merton model
In Merton’s credit risk model, an enterprise is considered to be in default if its market value
(V) falls below the nominal value of the liabilities (L) at the time that the bond matures (time
T). Its assets are then transferred to the creditors. Upon maturity, the value of the zero-
coupon bond (DT) is thus
2) = min( , ).
This cash flow corresponds to the difference between the payment of a safe bond and a Eu-
ropean put option on the enterprise with the nominal value of the liabilities (L) as the strike
price. The corporate bond can thus be interpreted as a bundle comprising a safe bond and
the sale of a put option (short put position).
The price of the zero-coupon bond at the time of issue (D) is
3) = = − ,
where y is the yield, r the safe interest rate and P the value of the put option.
The yield spread s is calculated as
4) = − = − ln( / ) − .
The value of the put option P is determined using the Black-Scholes formula
5) = (− ) − (− )
with
= ln( / ) + ( + 0,5 )√
and
= − √ ,
17

where N(.) is the cumulative density of the standard normal distribution and is the volatility
of corporate asset returns. By substituting equation 5) in equation 3) and then in equation 4),
the yield spread can be determined as follows 6) = − 1 ln( ( ) + (− )) − .
Equation 6) shows that the yield spread depends on the maturity date of the bond (T), the
safe interest rate (r), the volatility of corporate asset returns ( ) and the leverage ratio
(L / V).
7.2 Hedge ratios, equity risk premiums and corporate bond spreads
Table 1: Descriptive statistics for the estimated hedge ratio (δ)
The hedge ratio is the estimated volatility of the excess return on debt capital divided by the estimated volatility of the excess return on equity capital: Hedge ratio for the … entire index country-specific sub-index
DE ES FR IT Mean 0.243 0.204 0.296 0.193 0.250 Maximum 0.333 0.272 0.485 0.253 0.509 Minimum 0.215 0.167 0.205 0.167 0.162 Standard deviation 0.021 0.024 0.056 0.018 0.071 The estimated volatilities are based on diagonal BEKK models with the variance-covariance matrix 1 1 1[ ' ]t t t tH C A A BH B− − −′ ′= + ε ε + . The elements of the coefficient matrices A and B that
are not on the diagonal are equal to zero. Table 2: Descriptive statistics for the estimated equity risk premium
Equity risk premium for the... entire index country-specific sub-index
DE ES FR IT Mean 0.058 0.049 0.053 0.077 0.062 Maximum 0.098 0.082 0.090 0.129 0.105 Minimum 0.028 0.024 0.026 0.037 0.030 Standard deviation 0.019 0.016 0.017 0.025 0.020 The estimated equity risk premiums are based on the three-stage dividend discount model for Euro Stoxx and CAPM models for each index.
/D Eδ = σ σ
18

Figure 1A: Equity premium and corporate bond spread
19
7.3 Estimation of liquidity-adjusted bond volatilities
Although the liquidity premium does not go a long way to explaining the yield spread, when
calculating the bond risk premium by computing the ratio of equity volatility to bond volatility,
we have to pay attention to the fact that the bond volatility σD – and thus also the bond risk
premium – could be notably distorted by the time-varying liquidity premiums contained in the
bond prices.
The relationship between volatility on the bond market and liquidity risk has been examined
from various angles in the literature. Bao/Pan (2012) cite time-varying liquidity premiums as a
possible reason for their findings that the empirical bond market volatility of enterprises in the
USA is higher than the volatility derived using the Merton model. This indicates that the bond
risk premium calculated using the empirical bond market volatility may be biased upwards.
Other studies underline the positive correlation between the volatility of bond yields and vari-
ous liquidity proxies, indicating that it may be difficult to distinguish between the bond risk
premium and the liquidity premium (Bao/Pan/Wang, 2011; Dick-Nielsen/Feldhütter/Lando,
20
2012; Friewald/Jankowitsch/Subrahmanyam, 2012). There are also indications that the li-
quidity proxies used may – at least partially – capture credit risk (Grass/Ward, 2012).
To evaluate the potential effect of time-varying liquidity premiums on the estimated bond vol-
atility σD and the bond risk premium, the bond volatilities are then additionally estimated on
the basis of liquidity-adjusted excess returns. The returns are adjusted as follows. The ex-
cess returns on bonds are first regressed on the corresponding bid-ask spread (measured in
differences). The bid-ask spread is then multiplied by its coefficients and deducted from the
excess returns on bonds. On average, the bond risk premium for the country-specific sub-
indices calculated using the liquidity-adjusted bond prices is 25 bps above the unadjusted
bond risk premium. Due to the residual calculation of the expected loss component, this
component falls by the same amount.
7.4 KfW spread as an alternative proxy for liquidity risk
In addition to the bond-specific bid-ask spread and based on earlier studies, the yield differ-
ential between ten-year bonds issued by the government-guaranteed Kreditanstalt für Wied-
eraufbau (KfW) and long-term German Federal bonds (KfW spread) is used as a general
proxy for market participants’ liquidity preferences (see Longstaff (2004) for a study for the
USA). As with calculations of the liquidity premium based on the bid-ask spread, the country-
specific aggregated yield spreads are initially regressed on a constant and the KfW spread.
The liquidity premium is then calculated as the product of the corresponding regression coef-
ficient and the KfW spread.
As expected, the KfW spread has a significant positive effect for all country-specific yield
spreads. The country-specific liquidity premiums predominantly demonstrate a similar pattern
to the liquidity premiums calculated on the basis of the bid-ask spread, but were generally at
a somewhat higher level. On average, they were around 5 bps higher for the four countries
analysed and over the entire period of observation. Due to the residual calculation of the ex-
pected loss component, this component falls by the same amount.
21

7.5 Granger causality tests
Table 3: Impact on the expected loss component
Yield on Bunds PMI Sovereign CDS
Country
DE *** ** -
ES ** - -
FR ** - -
IT * - -
The Granger causality tests are based on the following equation of the one-lag VAR model:
1 2 3, 1 , 1 , 1 1 , 1country t country t DE t t country t tELOSS c ELOSS YIELD PMI CDS− − − −= + β + δ + δ + δ + ε
where ELOSS, YIELDDE, PMI and CDS stand for the expected loss component, the yield on ten-year German Bunds, the PMI and the sovereign CDS premium. ***, ** and * represent a rejection of H0 at a significance level of 1%, 5% and 10%, respectively.
Table 4: Impact on the bond risk premium
Yield on Bunds PMI Sovereign CDS
Country
DE - - -
ES - ** ***
FR - - *
IT - - **
The Granger causality tests are based on the following equation of the one-lag VAR model:
1 2 3, 1 , 1 , 1 1 , 1country t country t DE t t country t tELOSS c ELOSS YIELD PMI CDS− − − −= + β + δ + δ + δ + ε
where ELOSS, YIELDDE, PMI and CDS stand for the expected loss component, the yield on ten-year German Bunds, the PMI and the sovereign CDS premium. ***, ** and * represent a rejection of H0 at a significance level of 1%, 5% and 10%, respectively.
20 : 0H δ = 3
0 : 0H δ =10 : 0H δ =
20 : 0H δ = 3
0 : 0H δ =10 : 0H δ =
22
8. References
Almeida, H, I Cunha, M A Ferreira, F Restrepo, 2014, The Real Effects of Credit Ratings:
The Sovereign Ceiling Channel, Working Paper, available at SSRN:
http://papers.ssrn.com/sol3/papers.cfm?abstract_id=2349051.
Amato, J D, E M Remolona, 2003, The Credit Spread Puzzle, BIS Quarterly Review, De-
cember 2003.
Bao, J, J Pan, J Wang, 2011, The Illiquidity of Corporate Bonds, Journal of Finance, 66, 911-
946.
Bao, J, J Pan, 2012, Relating Equity and Credit Markets through Structural Models: Evidence
from Volatilities, Working Paper, available at: http://www.mit.edu/~junpan/bond_vol.pdf.
Bedendo, M, P Colla, 2013, Sovereign and Corporate Credit Risk: Evidence from the Euro-
zone 2013, paper presented at the EABCN-CEPR “Global Spillovers and Economic Cycles”
conference, Paris.
Brooks, C, 2008, Introductory Econometrics for Finance, Cambridge University Press.
Campello, M, L Chen, L Zhang, 2008, Expected Returns, Yield Spreads, and Asset Pricing
Tests, The Review of Financial Studies, 21, 1297-1338.
Che, X, N Kapadia, 2012, Can Credit Risk be Hedged in Equity Markets?, Working Paper,
University of Massachusetts available at:
http://www1.villanova.edu/content/dam/villanova/VSB/assets/marc/marc2012/Can%20Credi
t%20Risk%20be%20Hedged%20in%20Equity%20Markets.pdf.
Chen, L, H Guo, L Zhang, 2006, Equity Market Volatility and Expected Risk Premium, Fed-
eral Reserve Bank of St Louis, Working Paper 2006-007A.
Churm, R, N Panigirtzoglou, 2005, Decomposing Credit Spreads, Bank of England, Working
Paper No 253.
Collin-Dufresne, P, R Goldstein, J S Martin, 2001, The Determinants of Credit Spread
Changes, Journal of Finance, 56, 2177-2207.
Deutsche Bundesbank, 2003, Macroeconomic aspects of share price development, Monthly
Report, March 2003, 27-40.
Dick-Nielsen, J, P Feldhütter, D Lando, 2012, Corporate bond liquidity before and after the
onset of the subprime crisis, Journal of Financial Economics, 103, 471-492.
Dötz, N, C Fischer, 2010, What can EMU countries’ sovereign bond spreads tell us about
market perceptions of default probabilities during the recent financial crisis?, Deutsche
Bundesbank Discussion Paper, Series 1, 11/2010.
Elton, E J, M J Gruber, D Agrawal, C Mann, 2001, Explaining the Rate Spread on Corporate
Bonds, Journal of Finance, 56, 247–77.
Engle, R, K Kroner, 1995, Multivariate Simultaneous Generalized ARCH, Econometric Theo-
ry, 11, 122–150.
Eom, Y H, J Helwege, J Huang, 2004, Structural Models of Corporate Bond Pricing: An Em-
pirical Analysis, Review of Financial Studies 17, 499-544.
Flavin, T J, M G Limosani, 2007, Fiscal, monetary policy and the conditional risk premium in
short-term interest rate differentials: an application of Tobin’s portfolio theory, International
Review of Economics and Finance, 16, 101–112.
23

Forte, S, J I Peña, 2009, Credit spreads: An empirical analysis on the informational content
of stocks, bonds, and CDS, Journal of Banking & Finance, 33, 2013–2025.
Friewald, N, R, Jankowitsch, M G Subrahmanyam, 2012, Illiquidity or credit deterioration: A
study of liquidity in the US corporate bond market during financial crises, Journal of Finan-
cial Economics, 105, 18-36.
Gilchrist, S, E Zakrajšek, 2012, Credit Spreads and Business Cycle Fluctuations, American
Economic Review, 102, 1692-1720.
Grass, G, C Ward, 2012, Do Corporate Bond Spreads Really Contain Illiquidity Premia?,
Paper presented at the 4th Annual CIRPEE Financial Time Series Workshop, Montreal
2013.
Huang, J, M Huang, 2012, How Much of the Corporate-Treasury Yield Spread Is Due to
Credit Risk?, Review of Asset Pricing Studies, 2, 153-202.
Kounitis, T I, 2007, Credit Spread Changes and Volatility Spillover Effects, World Academy of
Science, Engineering and Technology, 30, 73-78.
Leland, H, K Toft, 1996, Optimal Capital Structure, Endogenous Bankruptcy, and the Term
Structure of Credit Spreads, Journal of Finance, 51, 987-1019.
Longstaff, F A, 2004, The Flight-to-Liquidity Premium in U.S. Treasury Bond Prices, Journal
of Business, 77, 511-526.
Merton, R, 1974, On the Pricing of Corporate Debt: The Risk Structure of Interest Rates,
Journal of Finance, 29, 449-470.
Morris, C, R Neal, D Rolph, 1998, Credit Spreads and Interest Rates: A Cointegration Ap-
proach, Working paper, Federal Reserve Bank of Kansas City, available at:
http://www.kansascityfed.org/publicat/reswkpap/pdf/RWP98-08.pdf
Pesaran, H H, Y Shin, 1998, Generalized Impulse Response Analysis in Linear Multivariate
Models, Economics Letters, 58, 17-29.
Schaefer, S M, I A Strebulaev, 2008, Structural Models of Credit Risk are Useful: Evidence
from Hedge Ratios on Corporate Bonds, Journal of Financial Economics, 90, 1-19.
Titman, S, 2002, The Modigliani and Miller Theorem and the Integration of Financial Markets,
Financial Management, 31, 101-115.
Winker, P, 2002, Vektorautoregressive Modelle, 213-262, in Schröder, M (ed), 2002, Fi-
nanzmarktökonometrie, Schäffer-Poeschel Verlag, Stuttgart.
24