decoding eeg alpha when anticipating faces, scenes, and tools
TRANSCRIPT

Copyright © 2020 the authors
Research Report: Regular Manuscript
Decoding EEG Alpha when Anticipating Faces,Scenes, and Tools
https://doi.org/10.1523/JNEUROSCI.2685-19.2020
Cite as: J. Neurosci 2020; 10.1523/JNEUROSCI.2685-19.2020
Received: 12 November 2019Revised: 1 May 2020Accepted: 5 May 2020
This Early Release article has been peer-reviewed and accepted, but has not been throughthe composition and copyediting processes. The final version may differ slightly in style orformatting and will contain links to any extended data.
Alerts: Sign up at www.jneurosci.org/alerts to receive customized email alerts when the fullyformatted version of this article is published.

1
1
Neural Mechanisms of Attentional Control for Objects: 1
Decoding EEG Alpha when Anticipating Faces, Scenes, and Tools 2
(Abbreviated Title: Decoding Object Attention) 3
Sean Noaha,b, Travis Powellb, Natalia Khodayarib, Diana Olivanb, 4
Mingzhou Dingc, and George R. Manguna,b,d 5
a Department of Psychology, University of California, Davis, Davis, CA 6
bCenter for Mind and Brain, University of California, Davis, 7
267 Cousteau Place, Davis, CA 95618 8
c J. Crayton Pruitt Family Department of Biomedical Engineering, University of Florida, 9
1275 Center Drive, Biomedical Science Bldg. J285, Gainesville, FL 32611 10
d Department of Neurology, University of California, Davis, Davis, CA 11
12
Corresponding Author: George R. Mangun ([email protected]) 13
Pages: 45; Figures: 9; Abstract: 250 words; Introduction: 550 words; Discussion: 1500 words 14
Conflict of Interest: The authors declare no competing financial interests. 15
Acknowledgements: This work was supported by MH117991 to GRM and MD; SN was 16 supported by T32EY015387. We are grateful to Steven J. Luck and Gi-Yeul Bae for their advice 17 on analyses using decoding methods, and to Atish Kumar and Tamim Hassan for their assistance 18 with data collection. Face stimulus images courtesy of Michael J. Tarr, Center for the Neural 19 Basis of Cognition and Department of Psychology, Carnegie Mellon 20 University, http://www.tarrlab.org/, with funding provided by NSF award 0339122. 21 22

2
2
ABSTRACT 23
Attentional selection mechanisms in visual cortex involve changes in oscillatory activity 24
in the EEG alpha band (8 to 12 Hz) – decreased alpha indicating focal cortical enhancement and 25
increased alpha indicating suppression. This has been observed for spatial selective attention and 26
attention to stimulus features such as color versus motion. We investigated whether attention to 27
objects involves similar alpha-mediated changes in focal cortical excitability. In Experiment 1, 28
twenty volunteers (8 males; 12 females) were cued (80% predictive) on a trial-by-trial basis to 29
different objects (faces, scenes or tools). Support vector machine decoding of alpha power 30
patterns revealed that late (>500 msec latency) in the cue-to-target foreperiod, only EEG alpha 31
differed with the to-be-attended object category. In Experiment 2, to eliminate the possibility that 32
decoding of the physical features of the cues led to our results, twenty-five participants (9 males; 33
16 females) performed a similar task where cues were non-predictive of the object category. 34
Alpha decoding was now only significant in the early (<200 msec) foreperiod. In Experiment 3, 35
to eliminate the possibility that task set differences between the different object categories led to 36
our Experiment 1 results, twelve participants (5 males; 7 females) performed a predictive cuing 37
task where the discrimination task for different objects was identical across object categories. 38
The results replicated Experiment 1. Together, these findings support the hypothesis that the 39
neural mechanisms of visual selective attention involve focal cortical changes in alpha power for 40
not only simple spatial and feature attention, but also high-level object attention in humans. 41
42
3
3
SIGNIFICANCE STATEMENT 43
Attention is the cognitive function that enables relevant information to be selected from 44
sensory inputs so it can be processed in the support of goal-directed behavior. Visual attention is 45
widely studied, yet the neural mechanisms underlying the selection of visual information remain 46
unclear. Oscillatory EEG activity in the alpha range (8-12 Hz) of neural populations receptive to 47
target visual stimuli may be part of the mechanism, because alpha is thought to reflect focal 48
neural excitability. Here, we show that alpha band activity, as measured by scalp EEG from 49
human participants, varies with the specific category of object selected by attention. This finding 50
supports the hypothesis that alpha band activity is a fundamental component of the neural 51
mechanisms of attention. 52
53

4
4
INTRODUCTION 54
Selective attention is a fundamental cognitive ability that facilitates the processing of 55
task-relevant perceptual information and suppresses distracting signals. The influence of 56
attention on perception has been demonstrated in improvements in behavioral performance 57
(Posner, 1980) and changes in psychophysical tuning curves (Carrasco and Barbot, 2019). In 58
humans, these perceptual benefits for attended stimuli co-occur with enhanced sensory evoked 59
potentials (Van Voorhis and Hillyard, 1977; Eason, 1981; Mangun and Hillyard, 1991; Eimer, 60
1996; Luck et al., 2000) and increased hemodynamic responses (Corbetta et al., 1990; Heinze et 61
al., 1994; Mangun et al., 1998; Tootell et al., 1998; Martínez et al., 1999; Hopfinger et al., 2000; 62
Giesbrecht et al., 2003). In animals, electrophysiological recordings indicate that sensory 63
neurons responsive to attended stimuli have higher firing rates than those of unattended stimuli 64
(Moran and Desimone, 1985; Luck et al., 1997), improved signal-to-noise in information 65
transmission (Mitchell et al., 2009; Briggs et al., 2013), and increased oscillatory responses 66
(Fries et al., 2001) that support higher interareal functional connectivity (Bosman et al., 2012). 67
Most models of selective attention posit that top-down attentional control signals arising 68
in higher level cortical networks bias processing in sensory systems (Nobre et al., 1997; Kastner 69
et al., 1999; Corbetta et al., 2000; Hopfinger et al., 2000; Corbetta and Shulman, 2002; Petersen 70
and Posner, 2012). However, precisely how top-down signals influence sensory processing 71
within sensory cortex remains unclear. One possible mechanism involves the modulation of EEG 72
alpha oscillations (8 – 12 Hz). When covert attention is directed to one side of the visual field, 73
alpha is more strongly suppressed over the contralateral hemisphere (Worden et al., 2000; 74
Sauseng et al., 2005; Thut et al., 2006; Rajagovindan and Ding, 2011). This lateralized alpha 75
reduction is thought to reflect an increase in cortical excitability in task-relevant sensory neurons 76

5
5
in order to facilitate the processing of upcoming stimuli (Romei et al., 2008; Jensen and 77
Mazaheri, 2010; Klimesch, 2012). A link between top-down activity in the frontal-parietal 78
attentional control system and alpha in sensory cortex has been suggested by studies using 79
transcranial magnetic stimulation to control regions (Capotosto et al., 2009, 2017), simultaneous 80
EEG-fMRI studies (Zumer et al., 2014; Liu et al., 2016) and magnetoencephalography (Popov et 81
al., 2017). 82
Although the majority of studies of the role of alpha in selective visual attention have 83
focused on spatial attention, alpha mechanisms may be more general (Jensen and Mazaheri, 84
2010). Selective attention to low level visual features – motion versus color – has also been 85
shown to modulate alpha that was localized to areas MT and V4 using EEG modeling in humans 86
(Snyder and Foxe, 2010). Therefore, it appears that attention-related alpha modulation can occur 87
at multiple early sensory processing levels in the visual system, with the locus of alpha 88
modulation functionally corresponding to the type of visual information being targeted by 89
attention. It is unknown whether the alpha mechanism is also involved in attentional control over 90
higher levels of cortical visual processing, such as attention to objects. In the present study, we 91
tested the hypothesis that alpha modulation is a mechanism for selective attention to objects by 92
recording EEG from participants performing an anticipatory object attention task using three 93
categories of objects: faces, scenes, and tools. Using EEG decoding methods we provide support 94
for this hypothesis by revealing object-specific modulations of alpha during anticipatory 95
attention to different object categories. 96
97
MATERIALS & METHODS 98
Overview 99
6
6
The present study consisted of three experiments. Experiment 1 is the main experiment in 100
which we tested whether EEG alpha band topographies could be differentiated between object-101
based attention conditions. Analysis of EEG data included topographic power difference map 102
construction and support vector machine (SVM) decoding of alpha band power to quantitatively 103
assess whether the EEG alpha band contained information about the object category being 104
attended. In Experiments 2 and 3, we tested two alternative interpretations of our results from 105
Experiment 1. In particular, in Experiment 2, we tested whether decoding accuracy in the 106
preparatory period between the cue onset and the target onset found in Experiment 1 might have 107
been based on differences in the sensory processes evoked in the visual system by the different 108
cue stimuli, because the physical stimulus properties of the cues for the three different object 109
attention conditions differed from one another (triangle vs. square vs. circle). In Experiment 3, 110
we investigated whether differences in alpha topography across object attention conditions in 111
Experiment 1 may have been the result of different task sets across the three object attention 112
conditions, rather than reflecting object-based attention mechanisms in visual cortex. 113
114
Participants 115
All participants were healthy undergraduate volunteers from the University of California, 116
Davis, had normal or corrected-to-normal vision, gave informed consent, and received course 117
credit or monetary compensation for their time. In Experiment 1, EEG data were recorded from 118
22 volunteers (8 males and 14 females). Two volunteers opted to discontinue their participation 119
midway through the experiment; data from the remaining 20 participants (8 males, 12 females) 120
were used for all analyses. In Experiment 2, EEG data were recorded from 29 undergraduates; 121
datasets from four participants were rejected on the basis of irreconcilable noise in the data or 122
7
7
subject non-compliance, yielding a final dataset from 25 participants (9 males and 16 females) 123
that was used for further decoding analysis. In Experiment 3, EEG data were recorded from 12 124
healthy undergraduate volunteers (5 males and 7 females). Datasets from two participants were 125
rejected on the basis of irreconcilable noise in the EEG data, yielding a final dataset of EEG data 126
from 10 participants (5 males and 5 females) that was used for further decoding analysis. 127
128
Experimental Design 129
The study used a within-subjects design. In Experiments 1 and 3, we investigated the 130
distributions of EEG alpha power at the scalp, as a function of attended object category, in an 131
anticipatory cued attention task with three categories of objects (faces, scenes and tools). In 132
Experiment 2, we investigated the distributions of EEG alpha power at the scalp during the post-133
cue period when the three object categories were not attended in advance. Details of the cued 134
object-based attention task, the non-cued task, and the statistical analyses are presented in the 135
following. 136
137
Statistical Analysis 138
Behavioral response data were analyzed with a gamma-distributed generalized linear 139
mixed model (Lo and Andrews, 2015) with random effect of subject and fixed effects of object 140
category and cue validity to quantitatively assess the effect of cue validity on RT. 141
Differences in EEG alpha power scalp topographies as a function of cue condition were 142
statistically analyzed using a SVM decoding approach and a non-parametric cluster-based 143
permutation test and Monte Carlo simulation. A cluster-based statistical test was used in order to 144
control for multiple comparisons issues that arise when t-tests are performed at all time points 145

8
8
over the epoch (Bae and Luck, 2018). The details of the statistical test for EEG alpha power are 146
described in the following. 147
148
Experiment 1 149
Apparatus and Stimuli: Participants were comfortably seated in an electrically-shielded, 150
sound-attenuating room (ETS-Lindgren, USA). Stimuli were presented on a VIEWPixx/EEG 151
LED monitor, model VPX-VPX-2006A (VPixx Technologies Inc., Quebec Canada), at a 152
viewing distance of 85 cm, vertically centered at eye level. The display measured 23.6 inches 153
diagonally, with a native resolution of 1920 by 1080 pixels and a refresh rate of 120Hz. The 154
recording room and objects in the room were painted black to avoid reflected light, and it was 155
dimly illuminated using DC lights. 156
Each trial began with the pseudorandomly selected presentation of one of three possible 157
cue types for 200 msec (1° x 1° triangle, square, or circle, using PsychToolbox; Brainard, 1997; 158
Figure 1A). Valid cues informed participants which target object category (face, scene, or tool, 159
respectively) was likely to subsequently appear (80% probability). Cues were presented 1° above 160
the central fixation point. Following pseudorandomly selected SOAs (1000 – 2500 msec) from 161
cue onset, target stimuli (5° x 5° square image) were presented at fixation for 100 msec. On a 162
random 20% of trials, the cues were invalid, incorrectly informing participants about the 163
upcoming target object category. For these invalid trials, the target image was drawn with equal 164
probability from either of the two non-cued object categories. All stimuli were presented against 165
a gray background. A white fixation dot was continuously present in the center of the display. 166
Target images (Figure 1B) were selected from 60 possible images for each object 167
category. All target images were gathered from the Internet. Face images were front-face, 168

9
9
neutral-expression, white-ethnicity faces, cropped and placed against a white background (Righi 169
et al., 2012). Full-frame scene images were drawn from the University of Texas at Austin’s 170
natural scene collection (Geisler and Perry, 2011) and campus scene collection (Burge and 171
Geisler, 2011). Tool images, cropped, and placed against a white background, were drawn from 172
the Bank of Standardized Stimuli (Brodeur, Mathieu B.; Guerard, Katherine; Bouras, 2014). A 173
pseudorandomly distributed inter-trial-interval (ITI; 1500 – 2500 msec) separated target offset 174
from the cue onset of the next trial. Each set of 60 object images comprised 30 images of two 175
different subcategories: male/female faces, urban/natural scenes, and powered/non-powered 176
tools. 177
EEG Recording: Raw EEG data were acquired with a 64-channel Brain Products actiCAP 178
active electrode system (Brain Products GmbH), and digitized using a Neuroscan SynAmps2 179
input board and amplifier (Compumedics USA, Inc.). Signals were recorded with Scan 4.5 180
acquisition software (Compumedics USA, Inc.) at a sampling rate of 1000 Hz and a DC to 200 181
Hz online band pass. Sixty-four Ag/AgCl active electrodes were placed in fitted elastic caps 182
using the following montage, in accordance with the international 10-10 system (Jurcak et al., 183
2007): FP1, FP2, AF7, AF3, AFz, AF4, AF8, F7, F5, F3, F1, Fz, F2, F4, F6, F8, FT9, FT7, FC5, 184
FC3, FC1, FCz, FC2, FC4, FC6, FT8, FT10, T7, C5, C3, C1, Cz, C2, C4, C6, T8, TP9, TP7, 185
CP5, CP3, CP1, CPz, CP2, CP4, CP6, TP8, TP10, P7, P5, P3, P1, Pz, P2, P4, P6, P8, PO7, PO3, 186
POz, PO4, PO8, PO9, O1, Oz, O2, PO10; with channels AFz and FCz assigned as ground and 187
online reference respectively. Additionally, electrodes at sites TP9 and TP10 were placed 188
directly on the left and right mastoids. The Cz electrode was oriented to the vertex of each 189
participant’s head by measuring anterior to posterior from nasion to inion, and right to left 190
between preauricular points. High viscosity electrolyte gel was administered at each electrode 191
10
10
site to facilitate conduction between electrode and scalp, and impedance values were kept below 192
25 kΩ. Continuous data were saved in individual files corresponding to each trial block of the 193
stimulus paradigm. 194
EEG Preprocessing: All data preprocessing procedures were completed with the 195
EEGLAB Matlab toolbox (Delorme and Makeig, 2004). For each participant, all EEG data files 196
were merged into a single dataset before data processing. Each dataset was visually inspected for 197
the presence of bad channels, but no such channels were observed. The data were Hamming 198
window sinc FIR filtered (1 – 83 Hz), and then down sampled to 250 Hz. Data were 199
algebraically re-referenced to the average of all electrodes, and then further low-pass filtered to 200
40 Hz. Data were epoched from 500 msec before cue onset to 1000 msec after cue onset, so that 201
anticipatory data from all trials could be examined together. Data were visually inspected to flag 202
and reject trials with blinks and eye movements that occurred during cue presentation. 203
Independent component analysis (ICA) decomposition was then used to remove artifacts 204
associated with blinks and eye movements. 205
EEG Analysis: We used a power spectral density procedure, with the Matlab 206
periodogram() function (window length 500 msec, step length 40 msec), to extract alpha band 207
power for each electrode, for each participant and cue condition. Alpha band power was 208
calculated as an average of power from 8 – 12 Hz. Within each participant and cue condition, 209
power spectral density results were computed on individual trials and then averaged across trials. 210
Averaged power spectral density results were used to visually examine alpha band power 211
topographies across cue conditions. 212
We implemented a decoding analysis to quantitatively assess whether object attention 213
was systematically associated with changes in phase-independent alpha band power topography 214

11
11
across conditions. This analysis routine was adapted from a routine to decode working memory 215
representations from scalp EEG (Bae and Luck, 2018). 216
Decoding was performed independently at each time point within the epochs. We 217
implemented our decoding model with the Matlab fitecoc() function to use the combination of a 218
support vector machine (SVM) and error-correcting output coding (ECOC) algorithms. A 219
separate binary classifier was trained for each cue condition, using a one-versus-one approach, 220
with classifier performance combined under the ECOC approach. Thus, decoding was 221
considered correct when the classifier correctly determined the cue condition from among the 222
three possible cue conditions, and chance performance was set at 33.33% (one-third). 223
The decoding for each time point followed a six-fold cross-validation procedure. Data 224
from five-sixths of the trials, randomly selected, were used to train the classifier with the correct 225
labeling. The remaining one-sixth of the trials were used to test the classifier, using the Matlab 226
predict() function. This entire training and testing procedure was iterated 10 times, with new 227
training and testing data assigned randomly in each iteration. For each cue condition, each 228
participant, and each time point, decoding accuracy was calculated by summing the number of 229
correct labelings across trials and iterations, and dividing by the total number of labelings. 230
We averaged together the decoding results for all 10 iterations to examine decoding 231
accuracy across participants, at every time point in the epoch. At any given time point, above-232
chance decoding accuracy suggests that alpha topography contains information about the 233
attended object category. However, a comparison of decoding accuracy to chance, by itself, is 234
not sufficient for assessing whether an inference made on the basis of decoding accuracy is 235
reliable. Although a one-way t-test of decoding accuracies across subjects against chance would 236
provide a t-value and a statistical significance result for the time point in question, conducting 237
12
12
the same test at each of the 375 time points included in our epoch would require a correction for 238
multiple corrections that would result in overly conservative statistical tests. Therefore, 239
following Bae and Luck (2018), we utilized a Monte Carlo simulation-based significance 240
assessment to reveal statistically significant clusters of decoding accuracies. 241
By the Monte Carlo statistical method, decoding accuracy was assessed against a 242
randomly chosen integer (1, 2, or 3), representing an experimental condition, for each time point. 243
A t-test of classification accuracy across participants against chance was performed at each time 244
point for the shuffled data. Clusters of consecutive time points with decoding accuracies 245
determined to be statistically significant by t-test were identified, and a cluster t-mass was 246
calculated for each cluster by summing the t-values given by each constituent t-test. Each cluster 247
t-mass was saved. This procedure was iterated 1000 times, to generate a distribution of t masses 248
to represent the null hypothesis that a given cluster of t-masses from our decoding analysis was 249
likely to have been found by random chance. The 95% cutoff t-mass value was determined from 250
the permutation-based null distribution and used as the cutoff against which cluster t-masses 251
calculated from our original decoding data could be compared. Clusters of consecutive time 252
points in the original decoding results with t-masses exceeding the permutation-based threshold 253
were deemed statistically significant. 254
We performed the same decoding routine on phase-independent EEG oscillatory activity 255
in the theta range (4 – 7 Hz), beta range (16 – 31 Hz), and the gamma range (32 – 40 Hz) to test 256
the hypothesis that object attention-based modulations of EEG activity are specific to the alpha 257
range. For filtering EEG data to the beta and gamma band, we set the minimum filter order to be 258
three times the number of samples in the experimental epoch. For filtering to the theta band, we 259
13
13
set the minimum filter order to be two times the number of samples, because the duration of the 260
epoch was not long enough to allow a filter order three times the number of samples. 261
Procedure: Participants were instructed to maintain fixation on the center of the screen 262
during each trial, and to anticipate the cued object category until the target image appeared. They 263
were further instructed to indicate the target image object subcategory (e.g., male/female) with a 264
button press as quickly and accurately as possible upon target presentation, using the index 265
finger button for male (face), nature (scene), and powered (tool), and to press the middle finger 266
button for female (face), urban (scene), and non-powered (tool). Responses were only recorded 267
during the ITI between target onset and the next trial. Trials were classified as correct when the 268
recorded response matched the target image subcategory, and incorrect when the response did 269
not match, or when there was no recorded response. Each experiment block included 42 trials, 270
lasting approximately 3 mins. Each participant completed 10 blocks of the experiment. 271
272
Experiment 2 273
The recording and analysis protocols were identical to those of Experiment 1. Given that 274
the purpose of this experiment was to test whether decoding accuracy in the preparatory period 275
between the cue onset and the target onset might have been based on differences in the sensory 276
processes evoked in the visual system by the different cue stimuli, we modified Experiment 1 by 277
making the cues non-predictive of the upcoming target category. In keeping with this 278
modification, we instructed participants that the cue shape was not informative, and the cue 279
presentation was simply to alert them that the target stimulus would soon appear. Participants 280
were not explicitly instructed to ignore the cue shape. While the time course of differences in 281
sensory responses in scalp EEG filtered to alpha band frequencies is difficult to gauge, on the 282

14
14
basis of the previous literature (Bae and Luck, 2018), we predicted that even for alpha, any 283
differentiable stimulus-evoked sensory activity would be restricted to a window of time within 284
200 msec after the cue onset. Each participant completed 10 blocks of the experiment, with each 285
block comprising 42 trials. 286
287
Experiment 3 288
The recording and analysis protocols were identical to those of Experiment 1. The 289
purpose of this experiment was to investigate whether differences in alpha topography across 290
object attention conditions in Experiment 1 may have been the result of different task sets across 291
the three object attention conditions, rather than reflecting object-based attention mechanisms in 292
visual cortex. Specifically, in the attend-face condition of Experiment 1, participants were 293
instructed to discriminate whether the presented face was male or female, and indicate their 294
choice using a button box with two buttons under the index finger and middle finger. In the 295
attend-scene condition, the task was to discriminate urban from natural scenes using the same 296
two buttons, and in the attend-tool condition, the task was to discriminate powered from non-297
powered tools using the same two buttons. Because the categories being discriminated were 298
different across the different cue conditions (male/female, urban/natural, power tool/hand tool), it 299
is possible that participants were preparing different task sets across the different cue conditions 300
during the preparatory period. After being presented with a triangle cue, for example, a 301
participant would need to cognitively map their index finger response to the identification of a 302
male face and their middle finger response to the identification of a female face, whereas this 303
mapping would be different if the participant were presented with a square cue. These different 304

15
15
task sets and mappings from visual cortex to motor response preparation could possibly have 305
been driving the different alpha scalp topographies over the preparatory period. 306
This explanation is not mutually exclusive of our interpretation that alpha scalp 307
topographies reflect differential preparatory attentional biasing in object category-selective 308
visual areas, but given the design of Experiment 1, there is no way to know whether one, the 309
other or both are reflected in the differing alpha patterns. Therefore, we conducted an experiment 310
that equated the task across all object attention conditions, in order to eliminate any task set 311
differences that were present in the original experiment. Based our model that alpha is a 312
mechanism for selective attention to objects in visual cortex, in this new design we should still 313
observe different patterns of alpha for preparatory attention to object categories, which should be 314
revealed in successful decoding late in the cue-to-target period. 315
Apparatus and Stimuli: The general structure of the paradigm for Experiment 3 followed 316
the paradigm of the Experiment 1. On each trial, a cue shape appeared, indicating the object 317
category to attend. Cue shapes were identical to those in Experiment 1. As before, a preparatory 318
period followed the cue, and then a stimulus image appeared. An ITI separated the stimulus 319
image and the onset of the next trial. Behavioral responses were collected during this ITI. SOA 320
and ITI ranges were kept the same as in Experiment 1. 321
The behavioral task for this experiment was to determine, on each trial, whether the 322
briefly presented target image belonging to the cued object category (faces, scenes, or tools) was 323
in-focus or blurry. Unlike Experiments 1 and 2, the stimuli to be discriminated were composites 324
of an image belonging to the target category superimposed with an image belonging to a non-325
cued, distractor category. Crucially, both the target image and the distractor image in the blend 326
could be in-focus or blurry independently of each other, therefore, the task could not be 327

16
16
performed solely on the basis of attending to and responding to the presence or absence of blur 328
(Figure 7). 329
Twenty percent of trials were invalidly cued, allowing us to assess the effect of cue 330
validity on behavioral performance. For the invalid trials, the stimulus image was a composite of 331
an image from a randomly chosen non-cued object category, superimposed with a black and 332
white checkerboard. The checkerboard could also be blurry or in-focus independently of the 333
object image. Participants were instructed that whenever they encountered a trial where the 334
blended stimulus didn’t include an image belonging to the cued object category, but instead 335
contained only one object image and a checkerboard overlay, then they had to indicate whether 336
the non-cued object image in the stimulus was blurry or in-focus. We predicted that participants 337
would be slower to respond on invalidly cued trials, analogously to the behavioral effect of 338
validity observed in cued spatial attention paradigms. 339
The stimulus images spanned a square 5° x 5° of visual angle. To create blurred images, 340
Gaussian blur with a standard deviation of 2 was applied to the images. 341
All three object categories included 40 different individual images. On each trial, random 342
images were drawn to produce the composite stimulus image. Scene and tool images were drawn 343
from the same image sets as those for the original experiment. However, face images were drawn 344
from a different image set (Ma et al., 2015) because the face images used in the original 345
experiment were not high enough resolution to yield reliably noticeable differences in blurred vs. 346
non-blurred conditions. All face images were cropped to ovals centered on the face and placed 347
against a white background. 348
Unlike scene images, which contained visual details spanning the entire 5° x 5° square, 349
face and tool images were set against white backgrounds and so did not contain visual 350

17
17
information up to all the image boundaries. Therefore, to eliminate the possibility that 351
participants could use cue information to focus spatial attention instead of object-based attention 352
to perform the blurry/in-focus discrimination, on any trial where a face or tool image was 353
included in the composite stimulus, the position of that face or tool image was randomly jittered 354
from the center. 355
Procedure: Participants were instructed to respond as quickly as they could to the target 356
stimulus, making it vital that the participants engaged preparatory attention toward the cued 357
object category during the preparatory period. All participants were trained with at least 126 358
trials of the task, and were able to achieve at least 60% response accuracy before performing it 359
under EEG data collection; to achieve this, stimulus duration was adjusted on an individual 360
participant basis during the initial training phase. Experiment 3 was conducted in the same 361
laboratory environment as the original experiment, and environmental setup variables were 362
equated to those of the original experiment. 363
Each participant completed 15 blocks of the experiment, with each block comprising 42 364
trials, which represented, on average, 210 more trials per subject than Experiment 1. 365
366
RESULTS 367
Experiment 1 368
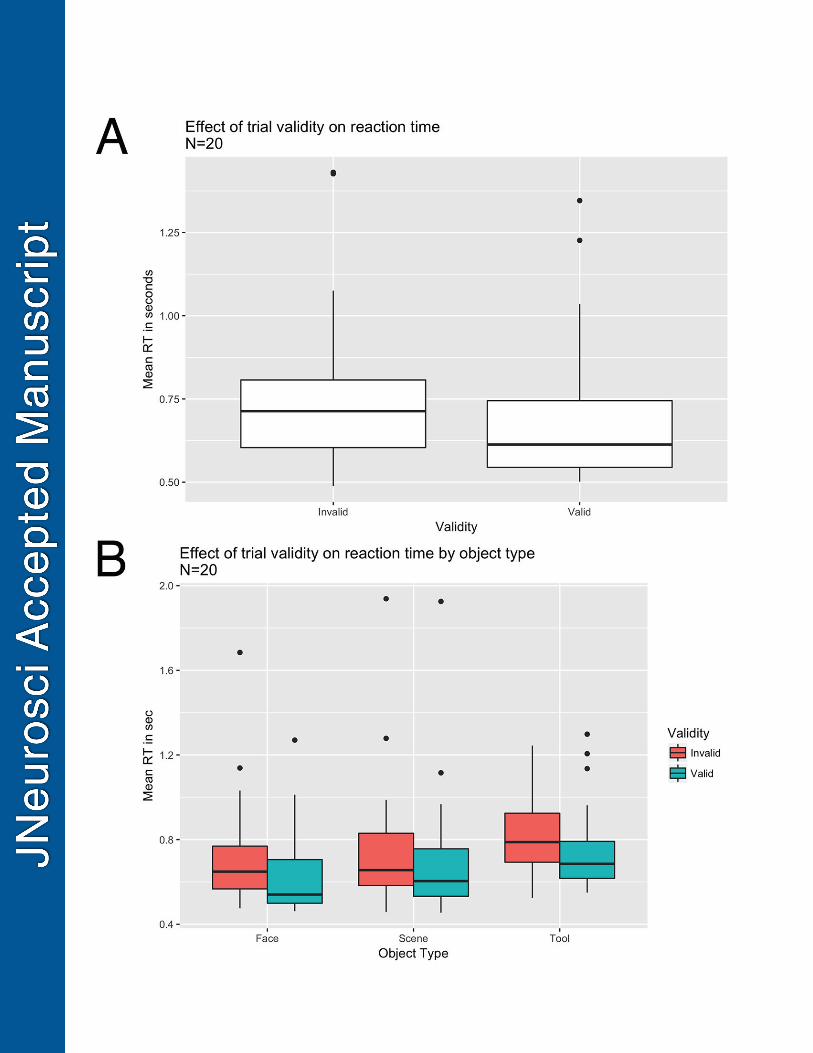
Behavioral Results: Observed response accuracies were high and uniform across all 369
object conditions and validity conditions (Invalid Face 96.6%, Invalid Scene 97.1%, Valid Face 370
96.8%, Valid Scene 96.7%, Valid Tool 93.1%) with the exception of the invalid attend-tool 371
condition (87.5%), which we address below. 372
18
18
To determine whether our task elicited a behavioral attention effect, we compared 373
reaction time (RT) for target discriminations between validly and invalidly cued trials. We 374
observed faster mean RTs for valid trials than for invalid trials, averaging across conditions 375
(Figure 2A) and for each condition separately (Figure 2B). 376
To quantitatively assess the effect of cue validity on RT, we fit a gamma-distributed 377
generalized linear mixed model to the RT data (Lo and Andrews, 2015). We found a significant 378
effect of validity (valid vs. invalid; p < 0.001). The model also revealed a significant main effect 379
of object category (p < 0.001), due to the slower overall reaction times in the tool category. Thus, 380
subjects were less accurate and slower in their responses to the tool category. Despite these slight 381
performance decrements for the tool category, there was nonetheless a significant behavioral 382
attention effect for the tool category, providing evidence that the subjects utilized all three cues 383
types to prepare to discriminate and respond to the upcoming objects. 384
Alpha Topography Results: To qualitatively assess whether the pattern of alpha power 385
across electrodes was different for anticipatory attention to the three cued categories of objects, 386
we inspected topographic plots of alpha power for each object condition at different time periods 387
following the cues, but prior to the onset of the target stimuli. In order to highlight differences 388
between the alpha topographies between conditions, and to control for non-specific effects of 389
behavioral arousal, we created pairwise alpha topography difference maps of one object attention 390
condition subtracted from another object attention condition. 391
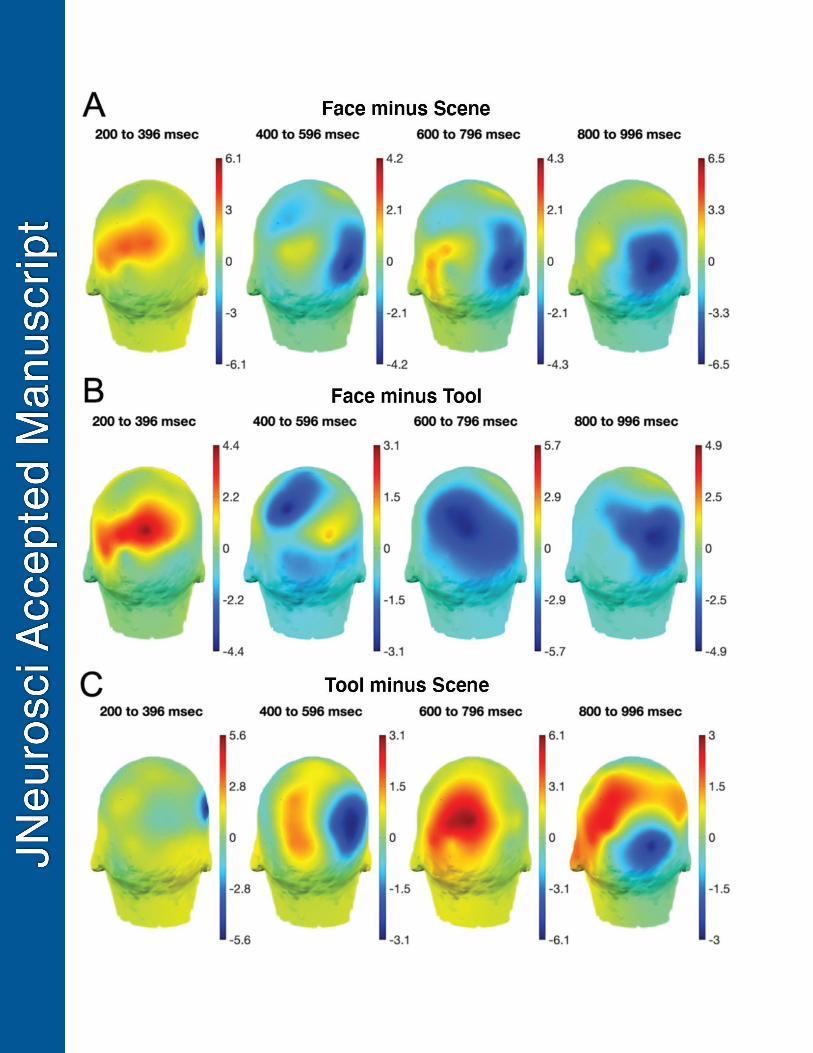
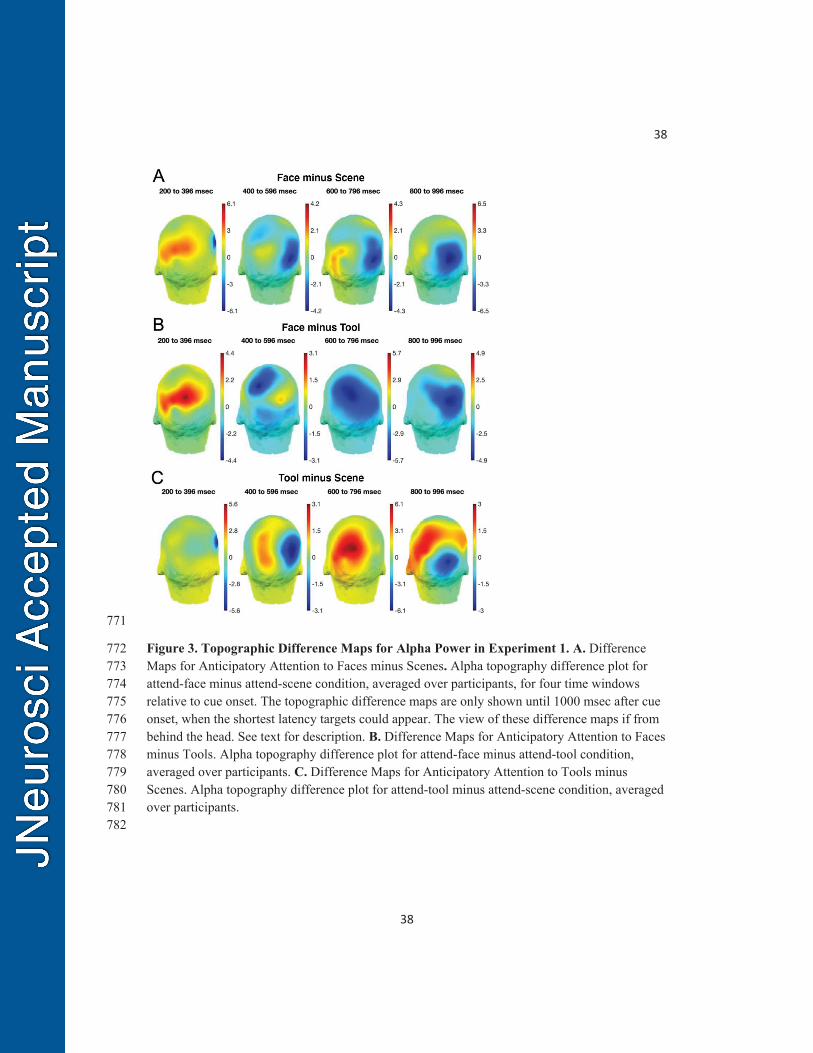
We observed that differences in alpha topography between object conditions emerged 392
and evolved over the anticipatory (cue-to-target) period (Figure 3). In the attend-face minus 393
attend-scene topographies (Figure 3A), we observed increased alpha power over the left 394
posterior scalp, and decreased over the right posterior scalp during the course of the anticipatory 395

19
19
period, with the lateralization becoming most prominent at longer post-cue latencies. In the 396
attend-face minus attend-tool topographies (Figure 3B), the pattern was similar at the longest 397
latencies, but more variable in intermediate periods of time. In the attend-tool minus attend-scene 398
topographies (Figure 3C), the pattern of alpha differences was distinctive from those involving 399
attend-face conditions; at the longest post-cue latencies the pattern of alpha power over the scalp 400
was reversed from that in the other difference maps, with alpha power being higher over the left 401
than the right posterior scalp. Overall, the presence of these difference among conditions is 402
consistent with variations in the underlying patterns of cortical alpha power during anticipatory 403
attention to faces, scenes, and tools. However, given the variability across subjects, and the 404
inherent difficulty in quantifying difference maps between subjects across attention conditions, 405
we turned to the method of EEG decoding to quantify the differences in alpha power across the 406
conditions that are qualitatively described in the foregoing. 407
SVM Decoding Results: SVM decoding results (Figure 4) revealed statistically significant 408
decoding accuracies in two clusters of time points around the range of 500 – 800 msec post-cue 409
and pre-target (turquoise dots in Figure 4). Decoding accuracies in the range of -100 to +200 410
msec around the onset of the cue did not reach the threshold for statistical significance. 411
SVM decoding results for theta, beta, and gamma band oscillatory EEG activity revealed 412
no statistically significant decoding in the anticipatory period (Figure 5). 413
414
Experiment 2 415
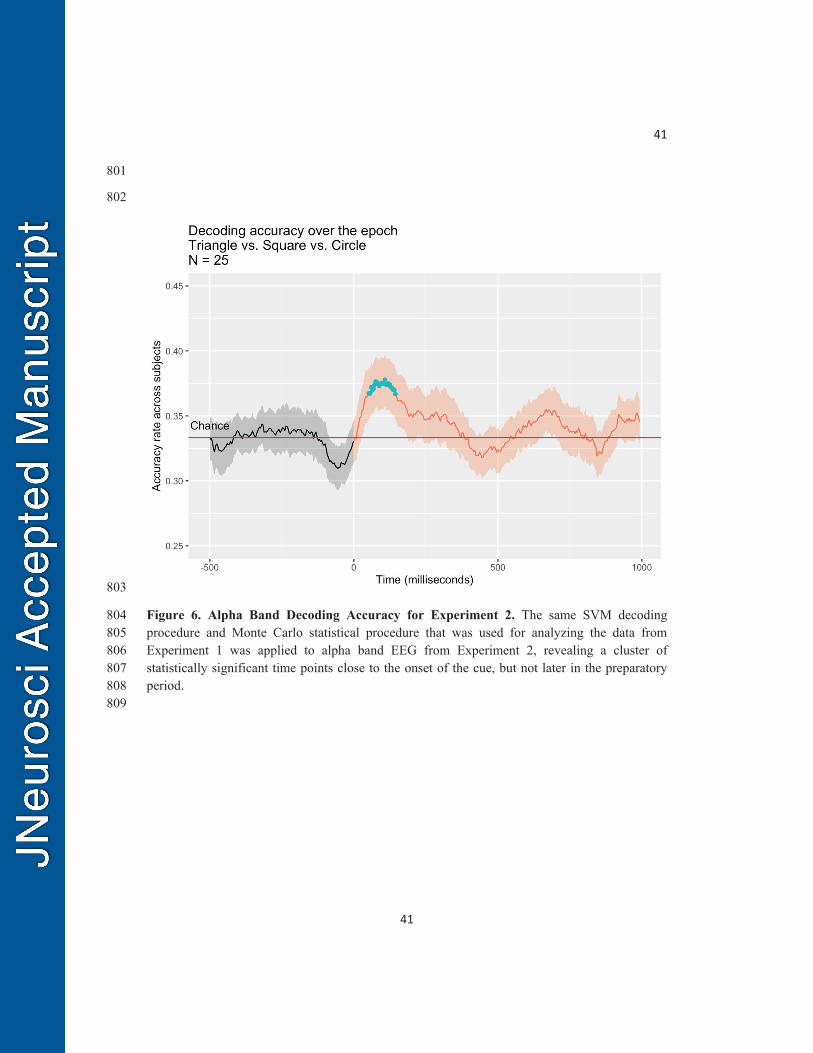
SVM Decoding Results: We observed a statistically significant cluster of above-chance 416
decoding accuracy timepoints in the cue presentation window only. No further clusters of 417
significantly above-chance decoding occurred anywhere from 200 msec to 1000 msec (Figure 6). 418

20
20
The results of this control experiment argue against the possibility that the late-period 419
alpha band decoding we observed in our original experiment was simply a result of differential 420
bottom-up sensory processes across the three cue conditions. Because the paradigm for 421
Experiment 2 was identical to the paradigm of Experiment 1 in every respect other than the cue 422
validity, and because we ran the same SVM decoding pipeline on the alpha band EEG data from 423
Experiment 2 as we did in Experiment 1, we could directly assess whether the pattern of 424
decoding results we obtained from the original experiment was attributable to bottom-up sensory 425
processes. 426
We collected data from more participants for Experiment 2 than we did for our original 427
experiment so that we could have more power in assessing the magnitude and the temporal 428
extent of the decoding that could be achieved purely on the basis of stimulus-evoked activity. 429
Our results support the idea that the long-latency above-chance decoding in Experiment 1 is not 430
attributable to purely sensory activity driven by physical stimulus differences, because we found 431
that in Experiment 2, statistically significant above-chance decoding occurred only in a cluster of 432
time points at short post-cue latency (< 200 msec after cue onset; Figure 6). 433
434
Experiment 3 435
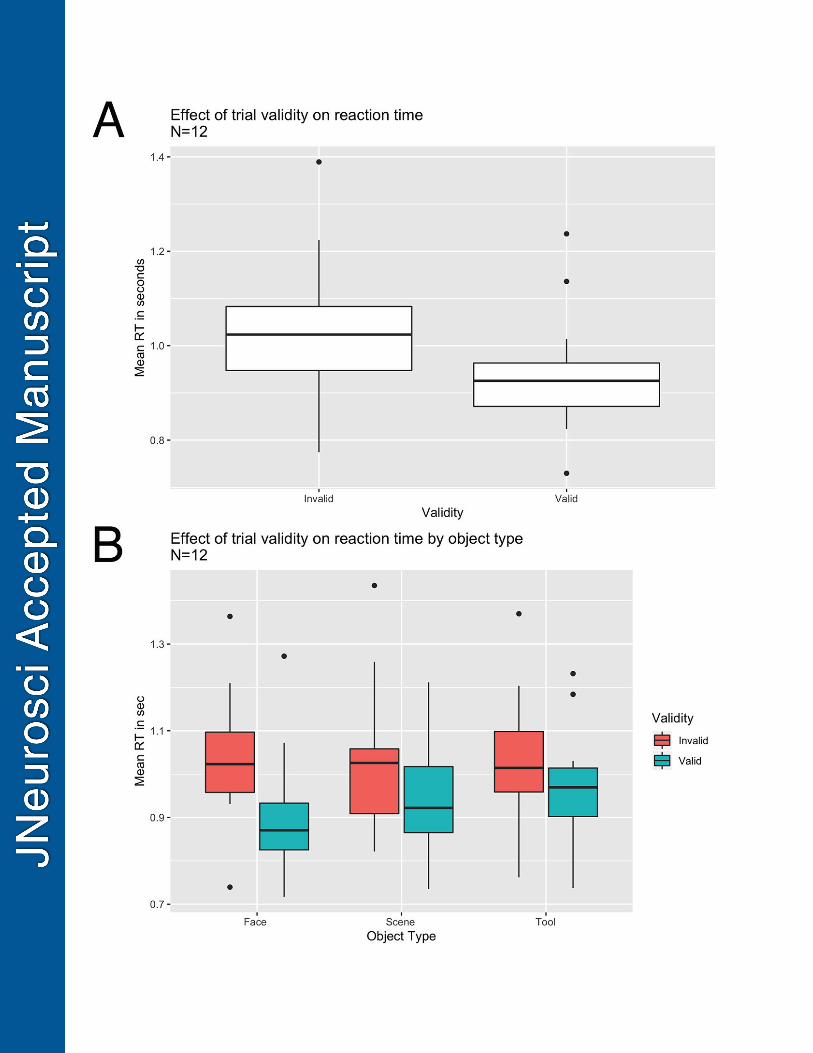
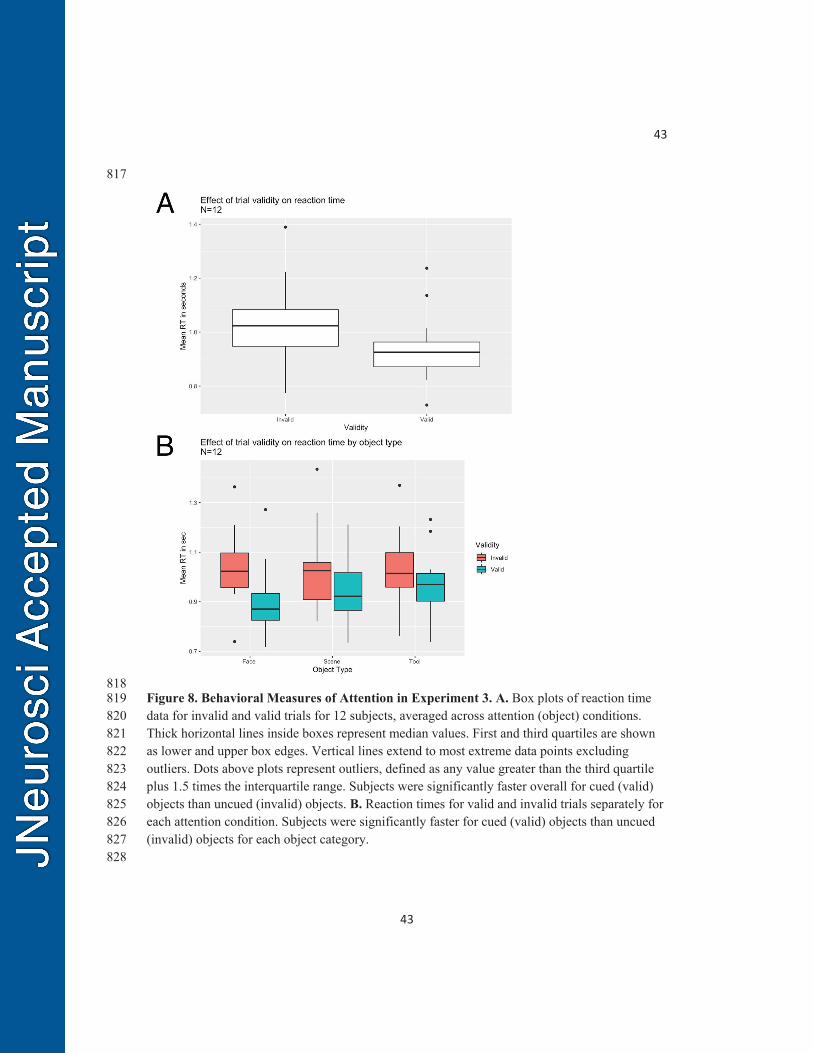
Behavioral Results: We observed differences in RT between valid and invalid trials, for 436
all object categories, such that validly cued trials elicited faster responses than invalidly cued 437
trials (Figure 8). In fitting a gamma-distributed generalized linear mixed model to the RT data, 438
we found a significant effect of validity (p < 0.001). 439
SVM Decoding Results: Using the same EEG analysis and SVM decoding pipeline as for 440
Experiment 1, we found statistically significant clusters of timepoints exhibiting above-chance 441

21
21
decoding accuracy (Figure 9). Just as in Experiment 1, these statistically significant clusters were 442
observed in the second half of the preparatory period, more than 500 msec after the cue onset. 443
Notably, there also appears to be a group of above-chance time points in the cue presentation 444
window of 0 – 200 msec, in the same period where we observed statistically significant decoding 445
in Experiment 2 that was attributable to the cue-evoked sensory activity. However, in the results 446
of Experiment 3, like Experiment 1, decoding in this cue presentation time period (< 200 msec 447
latency) did not reach the level of statistical significance (whereas with the higher number of 448
participants in Experiment 2, it could be revealed). 449
The behavioral results of Experiment 3 suggest that participants were engaging object-450
based attention during the preparatory period. Participants were faster to discriminate object 451
images as blurry or in-focus when their category was cued. Analogously to cued spatial attention 452
paradigms, on invalidly cued trials, participants were attending to one object category during the 453
preparatory period, but then upon stimulus presentation, reoriented their attention to be able to 454
discriminate whether an image from an uncued object category was blurry or in-focus. 455
With the behavioral effect between valid and invalid trials in line with that from our 456
original experiment, we are confident that the experimental design in Experiment 3 was 457
engendering the same form of top-down object-based attention as was captured by Experiment 1. 458
Therefore, in observing statistically significant above-chance decoding in the same general 459
window of time after cue onset for Experiments 1 and 3, we interpret this finding as evidence 460
that object-based attention, and not task set or motor response preparation differences, is driving 461
the longer-latency decoding result prior to onset of the targets. 462
463
464
22
22
DISCUSSION 465
Object-based attention is a fundamental component of natural vision. People navigate the 466
world principally on the basis of interactions with objects, which abound in typical environments 467
(O’Craven et al., 1999; Scholl, 2001). The primacy of objects means that adaptive interaction 468
with the world requires high-level object representations that are distinct from low-level visual 469
features in the same region of space. Therefore, an effect of attention directly on object 470
representations is a critical aspect of perception (Woodman et al., 2009). Attention has been 471
shown to operate on object representations (Tipper and Behrmann, 1996; Behrmann et al., 1998), 472
so identifying the neural mechanisms by which attention influences object representations is a 473
key goal in cognitive neuroscience. 474
Physiological studies show that attention’s performance benefits correlate with neural 475
activity changes in perceptual systems. Cortical structures coding attended information show 476
increased signal amplitude, synchrony and/or functional connectivity (Moore and Zirnsak, 2017). 477
How the nervous system mechanistically controls this cortical excitability and processing 478
efficiency remains incompletely understood, but most models suggest top-down control signals 479
from higher-order networks in frontal and parietal cortex alter processing in sensory/perceptual 480
cortical regions coding attended and unattended information (Petersen and Posner, 2012). One 481
hypothesized neural signature of top-down control at the level of sensory/perceptual cortex is 482
focal alpha power (Jensen and Mazaheri, 2010). Changes in alpha power occur during spatial 483
attention (Worden et al., 2000), and feature attention (Snyder and Foxe, 2010). Here we 484
investigated alpha-based mechanisms mediating selective attention to objects by cuing attention 485
to different objects and measuring changes in scalp-recorded EEG alpha power. We combined 486
23
23
behavior with EEG topographic mapping and decoding to test the hypothesis that object attention 487
involves selective alpha power modulations in object-specific cortex. 488
We chose faces, scenes, and tools as attentional targets because these objects have been 489
shown to activate circumscribed areas in the visual cortex. The fusiform face area (FFA) is 490
selectively responsive to images of upright faces (Allison et al., 1994; Kanwisher and Yovel, 491
2006): Faces can be considered objects because, for example, evidence from patients with 492
prosopagnosia suggests that the similar mechanisms underlie face recognition and object 493
recognition (Gauthler et al., 1999). The parahippocampal place area (PPA) is responsive to 494
scenes (Epstein et al., 1999), and specifically to scene category (Henriksson et al., 2019). Areas 495
responsive to tools have been identified in the ventral and dorsal visual pathways (Kersey et al., 496
2016). In line with the prediction that object-based attention modulates alpha in visual areas 497
specialized for processing the attended object category, attention to faces should selectively 498
decrease alpha band activity in face-selective visual areas like FFA, attention to scenes should 499
decrease alpha band activity in place-selective areas like PPA, and attention to tools should 500
decrease alpha band activity over tool-selective regions of the ventral and dorsal visual 501
pathways. EEG is not a strong method for localizing the neural sources of brain activity, but 502
given that the FFA, PPA, and postulated tool-specialized areas are located in different cortical 503
regions, the patterns of alpha modulations with attention in these areas would be expected to 504
produce differential EEG alpha patterns on the scalp. Given that such patterns might be expected 505
to be only subtly different, and in ways difficult to predict, one avenue for assessing different 506
patterns of alpha for attention to different objects is to incorporate machine learning to decode 507
scalp EEG alpha patterns. Such differences should only be expected if focal modulation of alpha 508
is also involved in selective object attention. 509

24
24
Our reaction time results showed that participants engaged object-based attention to cued 510
object categories, being faster to identify cued objects. Theoretically, when cued to anticipate a 511
particular object category, participants would bias neural activity within the cortical area(s) 512
specialized for that object type, and perhaps also bias activity within cortical areas processing all 513
the lower-level visual features associated with that object (Cohen and Tong, 2015). When the 514
target appears, its visual properties would thus be integrated, facilitating the required perceptual 515
discrimination. When the object appearing is from an unanticipated (uncued) category, activity in 516
object selective areas and associated visual feature areas for the uncued objects would be 517
relatively suppressed, delaying the integration and semantic parsing of uncued target images, and 518
slowing reaction times. 519
Topographic alpha difference maps varied with the object category that was attended. 520
Differing alpha topographies were consistent with scalp EEG patterns that would be expected if 521
the alpha modulations were occurring in different underlying cortical generators (cortical patches 522
or areas) for the three object categories. The wealth of evidence about underlying 523
neuroanatomical substrates of face, scene, and tool processing from imaging studies allows some 524
predictions about our data with respect to the hypothesized nature of the focal cortical activity 525
contributing to our topographic and decoding findings. The right hemisphere-emphasized FFA 526
(Kanwisher et al., 1997), and the equally bilaterally distributed PPA (Epstein and Kanwisher, 527
1998), would, in principle, predict a differential scalp alpha distribution, and perhaps lower alpha 528
power broadly over the right occipital when attending faces. Our attend-face minus attend-scene 529
alpha topography was generally consistent with this prediction (Figure 3A), and this pattern was 530
different from that in the attend-face minus attend-tool difference plot (Figure 3B). We hope to 531
make exceptionally clear, however, that we are not proposing that we can localize the underlying 532

25
25
cortical generators of scalp-recorded activity using the methods we employed here; hence we 533
turned to decoding. 534
Our decoding analyses provide strong support for the claim that attention modulates 535
alpha topographies in an object category-specific manner, and is in line with the time courses of 536
the differences in alpha patterns observed in the scalp topographic difference plots. In our 537
decoding analyses, statistically significant above-chance decoding accuracy provides 538
straightforward evidence that alpha topography contains information about the selected object 539
category, and therefore, that top-down object-based attention modulates alpha topography 540
according to the cued (attended) object category. We observed that statistically significant 541
decoding occurred in the 500 – 800 msec range post-cue/pre-target, indicating that patterns of 542
alpha topography at the scalp were reliably modulated by our attention manipulation in this time 543
range (Figure 4). Importantly, the 500 – 800 msec range corresponds to the periods in the alpha 544
topographic difference plots where the patterns stabilized. 545
In order to test whether our decoding results were specific for the alpha band, we 546
performed the same SVM decoding routine on theta, beta, and gamma band power and found no 547
significant above-chance decoding in the anticipatory period for those frequency bands (Figure 548
5). This result is consistent with the hypothesis that oscillatory neural activity in the alpha band 549
is mechanistically involved in anticipatory attention, whereas activity in other EEG frequency 550
bands is not modulated in target-relevant visual areas in human EEG. 551
In two follow-up experiments, we directly assessed two alternative interpretations of our 552
decoding results from Experiment 1. First, differences in alpha scalp topography post-cue might 553
reflect purely sensory processing associated with each cue (e.g., triangle vs. circle). This should 554
be applicable only to the above-chance (although not significant by our tests) decoding 555

26
26
observable in the early post-cue period (~ 0 – 200 msec) in Figure 4, and not the significant 556
longer-latency decoding. Indeed, we verified this in Experiment 2, in which participants 557
performed the same task, and saw the same cues and targets as in Experiment 1, but the cue 558
shape did not predict the upcoming object category. We observed statistically significant 559
decoding in the post-cue/pre-target period from 0 – 200 msec attributable to physical cue features 560
(e.g., Bae and Luck, 2018), but no significant decoding later in the cue-to-target interval. 561
A second alternative explanation of our decoding results from Experiment 1 is that they 562
were driven by task set differences across cued object conditions. The task for faces, for 563
example, was to discriminate gender, while for scenes it was to distinguish between urban scenes 564
and natural scenes, leaving open the possibility that our decoding late in the post-cue period 565
reflected task set differences (Hubbard et al., 2019) rather than attentional control over object 566
selection as we propose. We can reject this alternative based on the results of Experiment 3, in 567
which the cues predicted the relevant target object, but the discrimination task was the same for 568
all object categories – discriminate whether the cued object was in focus or blurred. We were 569
thus able to replicate the longer-latency alpha-related preparatory attention effects reported in 570
Experiment 1 while controlling task set factors. 571
Our findings show that EEG alpha modulation is linked to object-based selective 572
attention, extending previous findings that alpha modulation is associated with attention to 573
spatial locations and low-level visual features. Using an SVM decoding approach we identified 574
differences in the topographic patterns of alpha power during selective attention to different 575
object categories. Further, we linked the time range during which statistically significant 576
decoding was achieved to alpha power topographic maps, and observed that alpha modulation 577
was consistent with the time course of preparatory attention observed in prior research. Overall 578

27
27
these findings support the model that alpha band neural activity functions as an attentional 579
modulator of sensory processing for both low level visual features and high-order neural 580
representations such as those for objects. 581
582

28
28
REFERENCES 583
Allison T, Mccarthy G, Nobre A, Puce A, Belger A (1994) Human extrastriate visual cortex and 584
the perception of faces, words, numbers, and colors. Cereb Cortex 4:544–554. 585
Bae GY, Luck SJ (2018) Dissociable Decoding of Spatial Attention and Working Memory from 586
EEG Oscillations and Sustained Potentials. J Neurosci 38:409–422 Available at: 587
https://www.ncbi.nlm.nih.gov/pubmed/29167407. 588
Behrmann M, Zemel RS, Mozer MC (1998) Object-Based Attention and Occlusion: Evidence 589
from Normal Participants and a Computational Model. J Exp Psychol Hum Percept Perform 590
24:1011–1036. 591
Bosman CA, Schoffelen JM, Brunet N, Oostenveld R, Bastos AM, Womelsdorf T, Rubehn B, 592
Stieglitz T, De Weerd P, Fries P (2012) Attentional Stimulus Selection through Selective 593
Synchronization between Monkey Visual Areas. Neuron 75:875–888 Available at: 594
http://dx.doi.org/10.1016/j.neuron.2012.06.037. 595
Briggs F, Mangun GR, Usrey WM (2013) Attention enhances synaptic efficacy and the signal-596
to-noise ratio in neural circuits. Nature 499:476–480 Available at: 597
http://www.nature.com/doifinder/10.1038/nature12276. 598
Brodeur, Mathieu B.; Guerard, Katherine; Bouras M (2014) Bank of Standardized Stimuli 599
(BOSS) Phase II : 930 New Normative Photos. PLOS 9. 600
Burge J, Geisler WS (2011) Optimal defocus estimation in individual natural images. Proc Natl 601
Acad Sci U S A 108:16849–16854 Available at: 602
https://www.ncbi.nlm.nih.gov/pubmed/21930897. 603
Capotosto P, Babiloni C, Romani GL, Corbetta M, San C, Cassino R (2009) Frontoparietal 604
Cortex Controls Spatial Attention through Modulation of Anticipatory Alpha Rhythms. J 605

29
29
Neurosci 29:5863–5872. 606
Capotosto P, Baldassarre A, Sestieri C, Spadone S, Romani GL, Corbetta M (2017) Task and 607
Regions Specific Top-Down Modulation of Alpha Rhythms in Parietal Cortex. Cereb 608
Cortex 27:4815–4822. 609
Carrasco M, Barbot A (2019) Spatial attention alters visual appearance. Curr Opin Psychol 610
29:56–64 Available at: https://doi.org/10.1016/j.copsyc.2018.10.010. 611
Cohen EH, Tong F (2015) Neural Mechanisms of Object-Based Attention. Cereb Cortex:1080–612
1092. 613
Corbetta M, Kincade JM, Ollinger JM, McAvoy MP, Shulman GL (2000) Voluntary orienting is 614
dissociated from target detection in human posterior parietal cortex. Nat Neurosci 3:292–615
297. 616
Corbetta M, Miezin F, Dobmeyer S, Shulman G, Petersen S (1990) Attentional modulation of 617
neural processing of shape, color, and velocity in humans. Science (80- ) 248:1556–1559. 618
Corbetta M, Shulman GL (2002) Control of goal-directed and stimulus-driven attention in the 619
brain. Nat Rev Neurosci 3:201–215 Available at: 620
https://www.ncbi.nlm.nih.gov/pubmed/11994752. 621
Delorme A, Makeig S (2004) EEGLAB: an open source toolbox for analysis of single-trial EEG 622
dynamics including independent component analysis. J Neurosci Methods 134:9–21 623
Available at: https://www.ncbi.nlm.nih.gov/pubmed/15102499. 624
Eason RG (1981) Visual evoked potential correlates of early neural filtering during selective 625
attention. Bull Psychon Soc 18:203–206. 626
Eimer M (1996) ERP modulations indicate the selective processing of visual stimuli as a result 627
of transient and sustained spatial attention. Psychophyiology 33:13–21. 628
30
30
Epstein R, Harris A, Stanley D, Kanwisher N (1999) The Parahippocampal Place Area: 629
Recognition, Navigation, or Encoding? Neuron 23:115–125. 630
Epstein R, Kanwisher N (1998) A cortical representation of the local visual environment. Nature 631
392:6–9. 632
Fries P, Reynolds JH, Rorie AE, Desimone R (2001) Modulation of Oscillatory Neuronal 633
Synchronization by Selective Visual Attention. Science (80- ) 291:1560–1564. 634
Gauthler I, Behrmann M, Tarr MJ (1999) Can face recognition really be dissociated from object 635
recognition? J Cogn Neurosci 11:349–370. 636
Geisler WS, Perry JS (2011) Statistics for optimal point prediction in natural images. J Vis 11:14 637
Available at: https://www.ncbi.nlm.nih.gov/pubmed/22011382. 638
Giesbrecht B, Woldorff MG, Song AW, Mangun GR (2003) Neural mechanisms of top-down 639
control during spatial and feature attention. Neuroimage 19:496–512 Available at: 640
https://www.ncbi.nlm.nih.gov/pubmed/12880783. 641
Heinze HJ, Mangun GR, Burchert W, Hinrichs H, Scholz M, Muente TF, Goes A, Scherg, M, 642
Johannes S, Hundeshagen H, Gazzaniga MS, Hillyard SA (1994) Combined spatial and 643
temporal imaging of brain activity during visual selective attention in humans. Nature 644
372:543–546. 645
Henriksson L, Mur M, Kriegeskorte N (2019) Rapid Invariant Encoding of Scene Layout in 646
Human OPA. Neuron 103:1–11 Available at: https://doi.org/10.1016/j.neuron.2019.04.014. 647
Hopfinger JB, Buonocore MH, Mangun GR (2000) The neural mechanisms of top-down 648
attentional control. Nat Neurosci 3:284–291 Available at: 649
https://www.ncbi.nlm.nih.gov/pubmed/10700262. 650
Hubbard J, Kikumoto A, Mayr, U (2019) EEG Decoding Reveals the Strength and Temporal 651
31
31
Dynamics of Goal-Relevant Representations. Sci Rep 9(1), 9051. doi: 10.1038/s41598-019-652
45333-6 653
Jensen O, Mazaheri A (2010) Shaping functional architecture by oscillatory alpha activity: 654
gating by inhibition. Front Hum Neurosci 4:186 Available at: 655
https://www.ncbi.nlm.nih.gov/pubmed/21119777. 656
Jurcak V, Tsuzuki D, Dan I (2007) 10/20, 10/10, and 10/5 systems revisited: Their validity as 657
relative head-surface-based positioning systems. Neuroimage 34:1600–1611. 658
Kanwisher N, Mcdermott J, Chun MM (1997) The Fusiform Face Area : A Module in Human 659
Extrastriate Cortex Specialized for Face Perception. J Neurosci 17:4302–4311. 660
Kanwisher N, Yovel G (2006) The fusiform face area: a cortical region specialized for the 661
perception of faces. Philos Trans R Soc B Biol Sci 361:2109–2128. 662
Kastner S, Pinsk MA, De Weerd P, Desimone R, Ungerleider LG (1999) Increased activity in 663
human visual cortex during directed attention in the absence of visual stimulation. Neuron 664
22:751–761. 665
Kersey AJ, Clark TS, Lussier CA, Mahon BZ, Cantlon JF (2016) Development of Tool 666
Representations in the Dorsal and Ventral Visual Object Processing Pathways. Cereb 667
Cortex 26:3135–3145 Available at: https://www.ncbi.nlm.nih.gov/pubmed/26108614. 668
Klimesch W (2012) Alpha-based oscillations, attention, and controlled access to stored 669
information. Trends Cogn Sci 16:606–617 Available at: 670
http://dx.doi.org/10.1016/j.tics.2012.10.007. 671
Liu Y, Bengson J, Huang H, Mangun GR, Ding M (2016) Top-down Modulation of Neural 672
Activity in Anticipatory Visual Attention: Control Mechanisms Revealed by Simultaneous 673
EEG-fMRI. Cereb Cortex 26:517–529. 674

32
32
Luck SJ, Chelazzi L, Hillyard SA, Desimone R, Diego S, Jolla L, Steven J, Chelazzi L, Hillyard 675
SA (1997) Neural Mechanisms of Spatial Selective Attention in Areas V1 , V2 , and V4 of 676
Macaque Visual Cortex. J Neurophysiol 77:24–42. 677
Luck SJ, Woodman GF, Vogel EK (2000) Event-related potential studies of attention. Trends 678
Cogn Sci 4:432–440. 679
Ma DS, Correll J, Wittenbrink B (2015) The Chicago face database: A free stimulus set of faces 680
and norming data. Behav Res Methods. 681
Mangun GR, Buonocore MH, Girelli M, Jha AP (1998) ERP and fMRI Measures of Visual 682
Spatial Selective Attention. Hum Brain Mapp 6:383–389. 683
Mangun GR, Hillyard SA (1991) Modulations of Sensory-Evoked Brain Potentials Indicate 684
Changes in Perceptual Processing During Visual-Spatial Priming. J Exp Psychol Hum 685
Percept Perform 17:1057–1074. 686
Martínez A, Anllo-Vento L, Sereno MI, Frank LR, Buxton RB, Dubowitz DJ, Wong EC, 687
Hinrichs H, Heinze HJ, Hillyard SA (1999) Involvement of striate and extrastriate visual 688
cortical areas in spatial attention. Nat Neurosci 2:364–369. 689
Mitchell JF, Sundberg KA, Reynolds JH (2009) Article Spatial Attention Decorrelates Intrinsic 690
Activity Fluctuations in Macaque Area V4 SHUFFLE. Neuron 63:879–888 Available at: 691
http://dx.doi.org/10.1016/j.neuron.2009.09.013. 692
Moore T, Zirnsak M (2017) Neural Mechanisms of Selective Visual Attention. Annu Rev 693
Psychol 68:47–72. 694
Moran J, Desimone R (1985) Selective Attention Gates Visual Processing in the Extrastriate 695
Cortex. Science (80- ) 229:782–784. 696
Nobre AC, Sebestyen GN, Gitelman DR, Mesulam MM, Frackowiak RSJ, Frith CD (1997) 697

33
33
Functional localization of the system for visuospatial attention using positron emission 698
tomography. Brain 120:515–533. 699
Noah SLM, Powell T, Khodayari N, Olivan D, Ding M, Mangun GR (2020) Neural Mechanisms 700
of Attention to Objects. Cognitive Neuroscience Society Abstracts, 2020 Virtual Meeting. 701
O’Craven KM, Downing PE, Kanwisher N (1999) fMRI evidence for objects as the units of 702
attentional selection. Nature 401:584–587 Available at: 703
https://www.ncbi.nlm.nih.gov/pubmed/10524624. 704
Petersen SE, Posner MI (2012) The Attention System of the Human Brain : 20 Years After. 705
Annu Rev Psychol 35:73–89. 706
Popov T, Kastner S, Jensen O (2017) FEF-controlled alpha delay activity precedes stimulus-707
induced gamma-band activity in visual cortex. J Neurosci 37:4117–4127. 708
Posner MI (1980) Orienting of attention. Q J Exp Psychol 32:3–25 Available at: 709
https://www.ncbi.nlm.nih.gov/pubmed/7367577. 710
Rajagovindan R, Ding M (2011) From Prestimulus Alpha Oscillation to Visual-evoked 711
Response: An Inverted-U Function and Its Attentional Modulation Rajasimhan 712
Rajagovindan. J Cogn Neurosci 23:1379–1394. 713
Righi G, Peissig JJ, Tarr MJ, Righi G, Peissig JJ, Tarr MJ, Righi G, Peissig JJ, Tarr MJ (2012) 714
Recognizing disguised faces. Vis cogn 20. 715
Romei V, Brodbeck V, Michel C, Amedi A, Pascual-Leone A, Thut G (2008) Spontaneous 716
fluctuations in posterior alpha-band EEG activity reflect variability in excitability of human 717
visual areas. Cereb Cortex 18:2010–2018 Available at: 718
https://www.ncbi.nlm.nih.gov/pubmed/18093905. 719
Sauseng P, Klimesch W, Stadler W, Schabus M, Doppelmayr M, Hanslmayr S, Gruber WR, 720
34
34
Birbaumer N (2005) A shift of visual spatial attention is selectively associated with human 721
EEG alpha activity. Eur J Neurosci 22:2917–2926. 722
Scholl BJ (2001) Objects and attention: the state of the art. Cognition 80:1–46 Available at: 723
https://www.ncbi.nlm.nih.gov/pubmed/11245838. 724
Snyder AC, Foxe JJ (2010) Anticipatory Attentional Suppression of Visual Features Indexed by 725
Oscillatory Alpha-Band Power Increases:A High-Density Electrical Mapping Study. J 726
Neurosci 30:4024–4032 Available at: 727
http://www.jneurosci.org/cgi/doi/10.1523/JNEUROSCI.5684-09.2010. 728
Thut G, Nietzel A, Brandt SA, Pascual-leone A (2006) Alpha-Band Electroencephalographic 729
Activity over Occipital Cortex Indexes Visuospatial Attention Bias and Predicts Visual 730
Target Detection. J Neurosci 26:9494–9502. 731
Tipper SP, Behrmann M (1996) Object-Centered Not Scene-Based Visual Neglect. J Exp 732
Psychol Hum Percept Perform 22:1261–1278. 733
Tootell RBH, Hadjikhani N, Hall EK, Marrett S, Vanduffel W, Vaughan JT, Dale AM (1998) 734
The Retinotopy of Visual Spatial Attention. Neuron 21:1409–1422. 735
Van Voorhis S, Hillyard SA (1977) Visual evoked potentials and selective attention to points in 736
space. Percept Psychophys 22:54–62. 737
Woodman GF, Arita JT, Luck SJ (2009) A cuing study of the N2pc component: An index of 738
attentional deployment to objects rather than spatial locations. Brain Res 1297:101–111 739
Available at: http://dx.doi.org/10.1016/j.brainres.2009.08.011. 740
Worden MS, Foxe JJ, Wang N, Simpson G V (2000) Anticipatory biasing of visuospatial 741
attention indexed by retinotopically specific alpha-band electroencephalography increases 742
over occipital cortex. J Neurosci 20:RC63 Available at: 743

35
35
https://www.ncbi.nlm.nih.gov/pubmed/10704517. 744
Zumer JM, Scheeringa R, Schoffelen JM, Norris DG, Jensen O (2014) Occipital Alpha Activity 745
during Stimulus Processing Gates the Information Flow to Object-Selective Cortex. PLoS 746
Biol 12. 747
748
749

36
36
750
Figure 1. A. Example trial sequence for the attention task. Each trial began with the 751 presentation of a symbolic cue that the subjects were taught predicted (80%) a specific object 752 category. Following an anticipation period (cue-to-target) varying from 1.0 to 2.5 s, a picture of 753 an object (face, scene or tool) was presented. On 20% of the trials one of the two uncued targets 754 pictures were presented. Subjects were required to make a rapid-accurate discrimination of 755 aspects of the pictures in both the expected and unexpected conditions (see text for details). B. 756 Examples of target images presented in the attention task. Face, scene and tool pictures were 757 selected from online databases. 758 759

37
37
760
Figure 2. Behavioral Measures of Attention in Experiment 1. A. Box plots of reaction time 761 data for invalid and valid trials for 20 subjects, averaged across attention (object) conditions. 762 Thick horizontal lines inside boxes represent median values. First and third quartiles are shown 763 as lower and upper box edges. Vertical lines extend to most extreme data points excluding 764 outliers. Dots above plots represent outliers, defined as any value greater than the third quartile 765 plus 1.5 times the interquartile range. Subjects were significantly faster overall for cued (valid) 766 objects than uncued (invalid) objects. B. Reaction times for valid and invalid trials separately for 767 each attention condition. Subjects were significantly faster for cued (valid) objects than uncued 768 (invalid) objects for each object category. 769 770
38
38
771
Figure 3. Topographic Difference Maps for Alpha Power in Experiment 1. A. Difference 772 Maps for Anticipatory Attention to Faces minus Scenes. Alpha topography difference plot for 773 attend-face minus attend-scene condition, averaged over participants, for four time windows 774 relative to cue onset. The topographic difference maps are only shown until 1000 msec after cue 775 onset, when the shortest latency targets could appear. The view of these difference maps if from 776 behind the head. See text for description. B. Difference Maps for Anticipatory Attention to Faces 777 minus Tools. Alpha topography difference plot for attend-face minus attend-tool condition, 778 averaged over participants. C. Difference Maps for Anticipatory Attention to Tools minus 779 Scenes. Alpha topography difference plot for attend-tool minus attend-scene condition, averaged 780 over participants. 781
782

39
39
783
Figure 4. Alpha Band Decoding Accuracy in Experiment 1. Decoding accuracy of alpha band 784 activity over the epoch, across participants. The horizontal red line represents chance decoding 785 accuracy. The solid time-varying line is the across-subject mean decoding accuracy at each time 786 point, and the shaded area around this line is the standard error of the mean. The grey shading 787 denotes the pre-cue period, and the orange shaded segment represents the anticipatory period 788 between cue onset (0 msec) and the earliest target onset (1000 msec). The turquoise dots denote 789 time points that belong to statistically significant clusters of decoding accuracy, as determined by 790 Monte Carlo assessment. 791
792

40
40
793 Figure 5. Decoding for Different EEG Frequency Bands in Experiment 1. A. The same SVM 794 decoding procedure and Monte Carlo statistical procedure that was used for analyzing the alpha 795 band data was applied to the theta band (4 – 7 Hz). B. The same decoding pipeline was applied 796 to the beta band (16 – 31 Hz), revealing no statistically significant clusters of above-chance 797 decoding accuracy in the preparatory period. C. The same decoding pipeline was also applied to 798 the gamma band (32 – 40 Hz), and similarly revealed no statistically significant clusters of 799 above-chance decoding accuracy in the preparatory period. 800
41
41
801
802
803
Figure 6. Alpha Band Decoding Accuracy for Experiment 2. The same SVM decoding 804 procedure and Monte Carlo statistical procedure that was used for analyzing the data from 805 Experiment 1 was applied to alpha band EEG from Experiment 2, revealing a cluster of 806 statistically significant time points close to the onset of the cue, but not later in the preparatory 807 period. 808 809
42
42
810
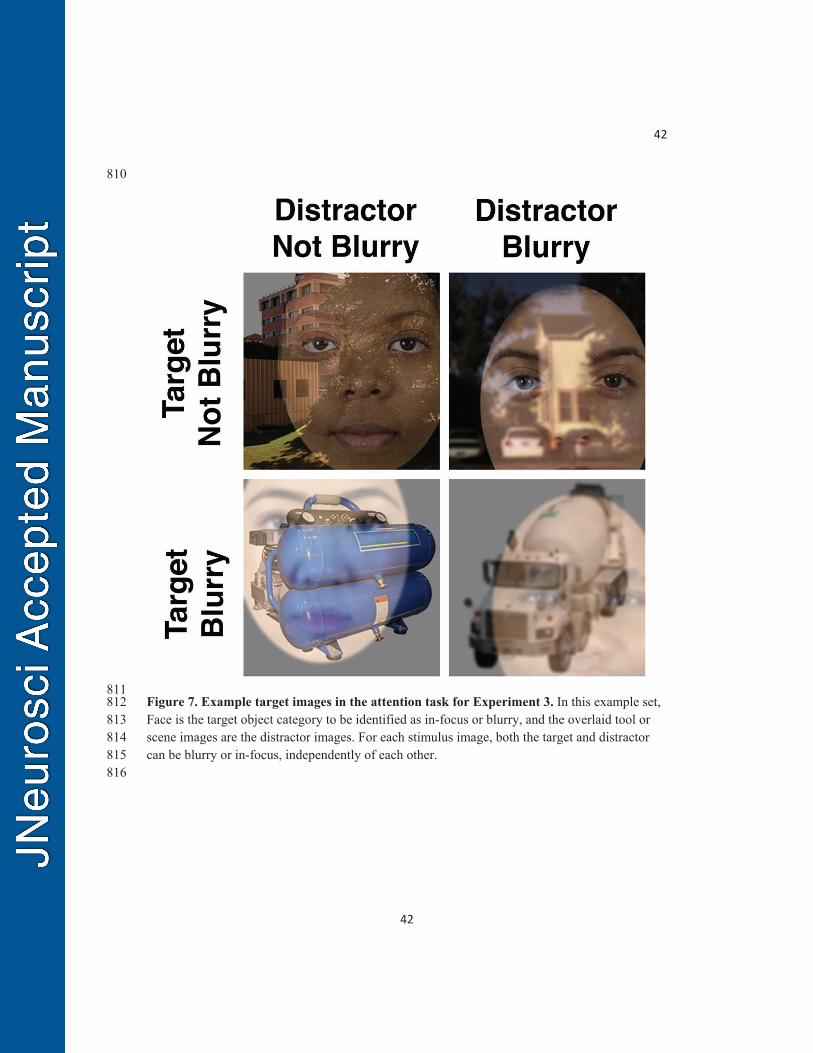
811 Figure 7. Example target images in the attention task for Experiment 3. In this example set, 812 Face is the target object category to be identified as in-focus or blurry, and the overlaid tool or 813 scene images are the distractor images. For each stimulus image, both the target and distractor 814 can be blurry or in-focus, independently of each other. 815 816
43
43
817
818 Figure 8. Behavioral Measures of Attention in Experiment 3. A. Box plots of reaction time 819 data for invalid and valid trials for 12 subjects, averaged across attention (object) conditions. 820 Thick horizontal lines inside boxes represent median values. First and third quartiles are shown 821 as lower and upper box edges. Vertical lines extend to most extreme data points excluding 822 outliers. Dots above plots represent outliers, defined as any value greater than the third quartile 823 plus 1.5 times the interquartile range. Subjects were significantly faster overall for cued (valid) 824 objects than uncued (invalid) objects. B. Reaction times for valid and invalid trials separately for 825 each attention condition. Subjects were significantly faster for cued (valid) objects than uncued 826 (invalid) objects for each object category. 827 828

44
44
829 Figure 9. Alpha Band Decoding Accuracy for Experiment 3. The same SVM decoding 830 procedure and Monte Carlo statistical procedure that was used for analyzing the data from the 831 Experiment 1 was applied to alpha band EEG from Experiment 3, revealing a cluster of 832 statistically significant time points in the second half of the preparatory period. 833