decision support system for predicting the number of no
TRANSCRIPT
Tehnički vjesnik 28, 1(2021), 123-134 123
ISSN 1330-3651 (Print), ISSN 1848-6339 (Online) https://doi.org/10.17559/TV-20191215144655 Original scientific paper
Decision Support System for Predicting the Number of No-Show Passengers in Airline Industry
Nikola VOJTEK*, Bratislav PETROVIĆ, Pavle MILOŠEVIĆ
Abstract: Airline decision about how many seats to allow to be overbooked is based on the expectation of the number of passengers who will not show up on a specific flight. This paper proposes a decision support system for predicting the number of no show passengers that combines the case-based reasoning (CBR) approach with Interpolative Boolean Algebra (IBA) and considers recommendations from both expert and algorithm. More precisely, recently proposed IBA similarity measure along with suitable aggregation operator is used for comparing alternatives in CBR algorithms. The proposed system was tested on the real-life data of the Belgrade-Amsterdam route. The obtained results show the necessity to include expert knowledge in the prediction process. Furthermore, the results are indicating that IBA-based models perform significantly better comparing to traditional distance-based models. The proposed expert system should contribute to an airline utilizing its inventory, which will further result in profit increase. Keywords: airline industry; case-based reasoning; decision support systems; interpolative Boolean algebra; no show passengers
1 INTRODUCTION
Today's market is already oversaturated with many airline companies. According to The World Bank air transport statistics [1], the number of passengers carried in the airline industry is significantly increasing every year. In this situation, airlines are constantly searching for new ways to embrace the opportunity and increase their revenue. Since the majority of costs in the airline industry are fixed and very hard to minimize, airlines are focused on maximizing the existing aircraft capacities. This can be achieved by ensuring the optimal number of passengers is carried from origin to destination, in order to fulfill the flight capacity with the optimal combination of different fare classes. Based on the influence of many external factors, some passengers that have reserved seats are prevented from utilizing their reservations (e.g. they come too late, don't show up at all, or are denied boarding). In these situations, seats that are reserved remain free and represent a lost opportunity for airlines. In order to maximize the revenues, companies open the inventory and overbook the flight by selling a certain number of seats above aircraft capacity limits based on the assumption that certain passengers will not show up on a flight.
Therefore, the problem of no show prediction and the possibility of overbooking the plane is particularly interesting from the aspect of revenue management. The decision of an airline to allow overbooking to a certain extent is usually based on the amount of possible revenue and the number of no show passengers in the past. This problem is particularly important for airlines that have many frequent routes that are fully booked. The decisions regarding overbooking are usually made by experts in the field with great experience. However, there is a need to support their decisions by independent automatic procedure, to reduce bias and procedure's dependence on an individual. The accurate predictions with a clear-cut meaning could lead to maximizing airline's revenues.
Thus, the no show prediction is considered as a hot topic to both practitioners and researchers [2, 3]. To recognize and predict capacity, demand, prices and number of no show passengers, airlines are using different revenue management models. The majority of them are based on
statistical tools [4]. However, in recent years intelligent/soft computing techniques are emerging as dominant for solving this kind of problem. These techniques are able to comprehend imprecision, uncertainty, and a concept of partial truth. That is particularly suitable when dealing with problems in the airline business, since they are characterized by: severe competition, large operational scale and scope, tightly coupled resources, dynamic environment, sophisticated customer behavior, complicated company policies, tight regulatory control and strict business rules, complex operational plans, schedules and routes, and real-time decisions [5]. Fuzzy logic is mostly applied for measuring quality of services offered by airlines. For instance, Chou, Liu, Huang, Yih & Han [6] proposed fuzzy weighted SERVQUAL method. Furthermore, neural networks are applied in various forecasting purposes. Weatherford, Gentry & Wilamowski [7] applied neural networks for forecasting airline passenger traffic. The authors compared neural networks with the more traditional forecasting techniques (moving averages, exponential smoothing, regression, etc.) and pointed out that neural networks achieved better results in terms of accuracy. In addition, both fuzzy logic and neural networks could be applied in wider transportation related areas for forecasting passengers demand (e.g. see [8, 9]).
In this paper, we deal with the problem of predicting the number of no show passengers in airline industry using case-based reasoning (CBR). Further, we explore the possibility to improve prediction results using soft computing techniques, i.e. interpolative Boolean algebra (IBA) [10], and experts' recommendation.
The aim of this research is to propose a novel decision support system (DSS) for predicting the number of no show passengers on flights. The proposed system is using the combination of the soft computing techniques based algorithm and expert opinion. The proposed algorithm is based on the CBR approach and IBA. CBR is a conventional technique that simulates human reasoning by learning-by-example mechanism on available data. Thus, it may be seen as an appropriate tool for dealing with the no show passengers prediction problem when a considerable amount of data is available. On the other

Nikola VOJTEK et al.: Decision Support System for Predicting the Number of No-Show Passengers in Airline Industry
124 Technical Gazette 28, 1(2021), 123-134
hand, IBA is used as a real-valued logic-based framework for similarity calculations and data aggregation to complement traditional techniques, in order to capture and explain existing nonlinear dependencies in data. The proposed system provides an airline with a comprehensive way to combine expert opinion with the algorithm recommendations in the prediction process, and enables an airline to use a logical approach when predicting the number of no show passengers. The inference process itself is interpretative, easy to understand and utilize within an airline's operation. The proposed system is tested on the single leg flight (Belgrade-Amsterdam) during a one-year period. Finally, we give our best to study the performance, interpretability and applicability of the proposed DSS by comparing it to existing machine learning based models.
This paper is organized as follows. The next section gives the overview of existing solutions applied to various problems in the airline industry such as seat inventory utilization, capacity optimization, overbooking, passenger demand and no show forecasting. In Section 3, the definition of CBR approach is given and the basic steps and prerequisites are described. Section 4 provides the overview of interpolative Boolean algebra, IBA similarity measure and logical aggregation. In Section 5, the problem formulation and the proposed DSS are described in detail. In Section 6, the model is evaluated on a practical problem: a single leg one flight problem no show prediction. The last section summarizes obtained results and concluding remarks.
2 LITERATURE REVIEW
Models and processes for flight capacity and seat
inventory utilization, overbooking, passenger demand forecasting and optimization of fares dynamically evolved to the point where they are shaping the whole airline industry. By combining conventional and soft computing techniques, they are providing airlines with effective and efficient tools to achieve much needed profit.
In the previous decades, the focal point of airline companies was the seat capacity utilization and optimization of revenue management model. According to Yu, Chang & Chen [11], the focus of airline companies should be on improving their capacity utilization, especially when it comes to the low-cost airlines. For the seat inventory control and capacity utilization problem, Belobaba [12] proposed expected marginal seat revenue (EMSR) model. EMSR is a probabilistic decision model implemented as a part of an automated booking limit system at Western Airlines. It is advised to apply the proposed model in case of flights with a high demand or high load factor. Since those flights are generating most of airline's total revenue, they require a lot of attention when it comes to the seat inventory utilization. Robinson [13] enhanced the EMSR model by using the optimal policy approach instead of heuristics. Furthermore, the author introduced an additional element in the seat inventory utilization problem. Ryzin & McGill [14] suggested a simple adaptive approach to optimize seat protection levels. The proposed model is based on adaptive algorithm that uses only historical observations, while stochastic approximation theory is used to prove the convergence of the algorithm to the optimal protection levels. The model
is compared with the traditional EMSR model, showing that the model with adaptive algorithm has mixed performance.
As it is stated by Boyd & Bilegan [15], the inventory control mechanism is arguably the most important element of revenue management. By emphasizing the fundamental role of central reservation and revenue management systems, the authors reviewed methods that are available for airlines to control seat inventory, pointing out their importance in sales and commercial areas. Chen, Günther & Johnson [16] applied a new statistical learning-based Yield Management policy on a real problem of 20-city, 31-leg hub-and-spoke flight network, with the aim of maximizing revenue by utilizing the seat inventory capacity. Lan, Ball, Karaesmen, Zhang & Liu [17] proposed new static and dynamic booking control policies for the single-leg, multi-fare problem when only upper/lower bounds on demand are available. Their models are built on the assumption that demand information is limited. In order to maximize the revenue under capacities and demand constraints, Mou & Wang [18] proposed a chance-constrained programming model based on the uncertainty theory. The authors used both fares and demands as uncertain variables. For the multi-leg dynamic seat control problem, Fan & Wang [19] combined discount thinking and virtual bucket using the Markov decision process. They simulated the passengers' arrival using the non-homogeneous Poisson distribution. The simulation analysis shows that the model can balance the expected revenue and revenue variation.
Recently, more attention has been given to the overbooking problems and airlines are embracing this approach for all high demand routes. Overbooking represents an effective way for airlines to improve passenger seat use rate and thus increase flight revenue [20]. As stated by Nambisan [21], the benefit of overbooking can be estimated as the difference of the loss of revenue (caused by no show or late cancellations) in closed flights when overbooking is allowed and when overbooking is not allowed. By allowing overbooking, an airline accepts the number of reservations greater than capacity to compensate for cancellations and no shows. Thompson [22] was among the first few in the literature who analysed the overbooking problem with multiple fare classes. Rothstein [2] also analysed the overbooking problem and models applied by airlines to overcome that issue. Huang et al. [4] observed a dynamic overbooking problem for parallel substitutable flights with different departure times, multiple fare classes, and reservations are allowed to be cancelled with costs. They formulated the problem as a series of stochastic inventory control models and obtained an optimal booking control policy using the marginal seat revenue principle. Zhang, Guo & Yi [23] considered an airline overbooking problem and due to the absence of historical data of no-shows, they proposed that domain experts need to be included in the process of determining the overbooking limits by providing belief degree of no-shows and estimating its distribution.
The information about no show or passengers who will cancel their reservation very closely (3 days or less) before the departure date is of great importance to an airline, since it implies how to define the overbooking level. In some of the earlier researches, Smith, Leimkuhler & Darrow [24]
Nikola VOJTEK et al.: Decision Support System for Predicting the Number of No-Show Passengers in Airline Industry
Tehnički vjesnik 28, 1(2021), 123-134 125
reported that for closed (sold-out) flights, no show numbers can be on roughly 15%, which can lead to a significant number of empty seats on the actual flight. Faraway and Chatfield [25] used neural networks, in a period when this soft computing technique was vigorously promoted in computer science literature, and applied to airline data with a lot of seasonality variance to forecast the number of passengers so that number of no show passengers can be estimated. Kunnumkal, Talluri & Topaloglu [26] proposed a randomized linear programming method for solving the network revenue management problem that considers no shows and/or cancellations. As indicated by Fildes et al., [27] through their comprehensive research about forecasting models' applications, airlines need to apply forecasting models on a daily basis. Also, they need to choose a proper forecasting system that can process multiple large data sets at once, i.e. in the case with the data sets that are used for no show forecasting.
The importance of predicting the number of no show passengers is highlighted in more than a few research papers. One of the earliest researches in which the importance of this topic was stressed out was conducted by Lawrence et al. [28]. Their research highlights that the accurate forecast of no show passengers for each flight could increase revenue of an airline by reducing the numbers of empty seats that could have been sold, as well as the number of involuntary denied boarding. Another similar research was done by Garrow & Koppelman [29] one year later. Authors pointed out that obtained predictions, of how many passengers will not show up on a flight, could support a broad range of managerial decisions.
Application of CBR in airline and travel domain has already been proposed and confirmed through some researches in the past. One of the researches was conducted by Chang et al. [30], with the focus on proposing CBR seat allocation system in the combination with the dynamic probability method. The proposed solution provided better results comparing to the conventional methods, thus it managed to enhance the performance of the seat inventory management system. As pointed out, there were several advantages of the proposed system introduced by using the case-based reasoning approach. The proposed solution was very intuitive, transparent and through acquiring new cases, the system was able to learn and adopt. Another application of CBR in the airline domain could be found in [31]. Authors proposed the usage of CBR for aircraft maintenance in the combination with the genetic algorithms (GA). The proposed model effectively retrieves similar aircraft maintenance cases to aid electronic ballast fault diagnosis of Boeing 747-400 airplanes. The obtained experimental results indicate that the CBR model with GA dynamic weighting and non-similarity functions is able to achieve superior learning performance as compared with the models with equal weights and linear similarities. This learning dimension was supported equally from both used approaches (CBR and GA). When it comes to the IBA approach, it could be said that situation is different. So far, there were no attempts to apply some of the IBA concepts in the airline domain. Thus, it could be said that this part of the decision support system which is proposed in this paper, represents a novelty of the research itself.
3 CASE-BASED REASONING
Case-based reasoning is a notable method that combines the knowledge-based support with a simulation of human reasoning [32]. CBR is making one to solve a new problem by searching for similar situations which happened in the past and by adapting their known solutions instead of working out a solution from the beginning. Depending on the problem, there are two major types of CBR - interpretive (or classification) and problem solving [33]. The main goal of interpretive CBR is to classify whether or not a new situation should be treated like previous ones based on their similarities and differences. The goal of problem solving CBR is to construct the solution to the new case by adapting solutions of the past cases. As Kolodner [33] indicated, this division is useful for the theoretical presentation, but since it is not always clear in practice and many problems have components of both types, the most effective CBR models will use a combination of both methods. CBR is a cyclic process that consists of "the 4 R's" - Retrieve, Reuse, Revise and Retain [34]. The process begins with Retrieving the most similar previously experienced case(s), then Reuse the information and knowledge in the case(s) that are retrieved to solve the new problem, Revise the solution and Retain the parts of this experience that could be useful in the future by incorporating it into the case library. The goal of the matching is to return a set of retained cases that are sufficiently similar to the new case [34]. Therefore, there are many similarity measures that can be applied, and not all are suitable for the same type of problems.
CBR procedure is usually formalized in the following manner. Features are denoted with xi,j, i = 1, …, n, j = 1, …, m, where m represents the number of use cases and n is the number of features. Labels are denoted with yj, j = 1, …, m where m represents the number of use cases in the dataset. Use cases consisting of features and label are forming the database.
There are four main groups of factors that are affecting the reliability of the solution recommended by CBR: (1) Attribute selection-oriented, (2) Case-oriented, (3) Algorithm oriented, and (4) Human-oriented factors [33]. Since each case is represented by many attributes, their selection is very important in the construction of the CBR model. Therefore, cases form a library that is the main source of knowledge in CBR and the performance of the whole model strongly relies on the quality of the case library. According to Xu et al. [35], two main algorithms -oriented factors are similarity measures and strategy for suggesting a solution. Finally, CBR is applied as a decision support model, since it cannot perform independently without the decision maker and factors concerning human beings. When it comes to the similarity calculation, Deza & Deza [36] gave an extensive overview of measures that can be applied for calculating the proximity of two objects. Many of the proposed measures could be successfully utilized with CBR algorithm e.g. [30, 31]. 4 INTERPOLATIVE BOOLEAN ALGEBRA Interpolative Boolean algebra (IBA) represents the [0, 1] realization of Boolean algebra [10, 37]. It is developed as an answer to the Boolean consistency problem in a
Nikola VOJTEK et al.: Decision Support System for Predicting the Number of No-Show Passengers in Airline Industry
126 Technical Gazette 28, 1(2021), 123-134
conventional fuzzy logic and the most of many-valued logic. In the IBA framework, all Boolean laws, including the laws of excluded middle and contradiction, are satisfied in [0, 1] case. Formally, IBA consists of two levels - symbolic and valued [10].
Due to the principle of structural functionality, all laws of Boolean algebra are value indifferent and treated independently of its realization on the symbolic level. The structural functionality principle, as opposed to the conventional truth functional principle, is valued indifferent. This principle is indicating that the structure of any IBA element can be calculated based on the structure of its components. Furthermore, it states that the value of a certain property is not sufficient for thorough understanding and analysis.
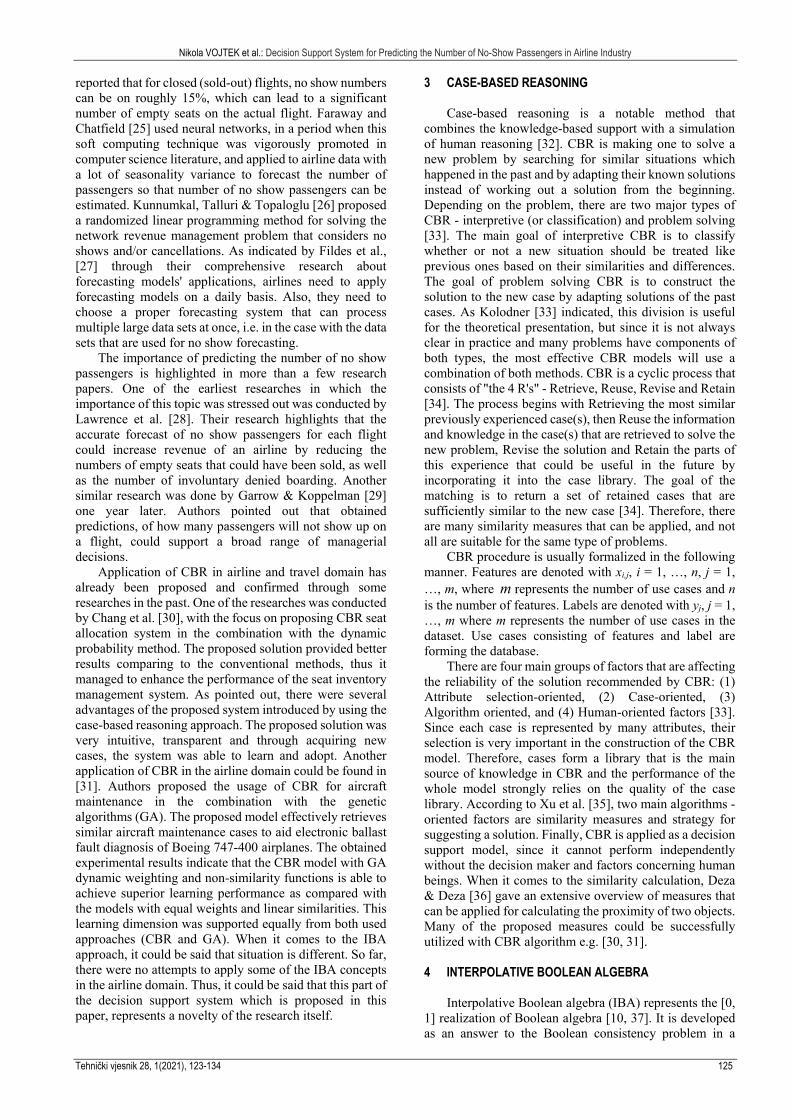
Example 1. The importance of the structural functionality principle in the context of the airline industry is explained in the following example. As given in Fig. 1, airplanes A and B are of the same size, and in both cases 50% of the seat capacities are booked. In addition, it is assumed that in both cases airplane is operating on the same route (same origin and destination) in the same time. Although one could say that airplanes A and B are equal, these two cases could be completely different if we observed the structural (symbolic) level. This is because empty seats (elements) do not have the same characteristics (attributes), e.g. different cabin (economy and business), different class within the cabin, possibilities for passenger to get free and/or to purchase additional services (ancillaries) and have different fare basis, etc. Therefore, in order to determine the values of the presented airplanes, it is necessary first to observe and analyse seats, i.e. attributes on the structural level. In other words, IBA is useful for solving the problems in which values seem to be equal, but the structures of the observed elements are different.
Figure 1 IBA structural functionality principle – a simple example in airline
industry The structural functionality principle is formalized by
the transformation procedure of logical functions to generalized Boolean polynomials (GBPs). The transformation procedure is explained and automated in [38]. It states that any Boolean function should be transformed into the corresponding GBP [10] first, while the values are introduced afterwards.
IBA is technically based on generalized Boolean polynomials (GBP). Three operators can be applied in GBP - standard plus, standard minus and generalized product (GP). GP is any function t-norm :[0,1] [0,1] [0,1] i.e.,
function that satisfies all four conditions of commutativity,
associativity, monotonicity and boundary condition, and the additional non-negativity condition [10]. On the symbolic level, the most important attribute of GP is idempotency, i.e. x x x [38]. After the transformation procedure is conducted and the simplest form of GBP is obtained, the valued level is introduced.
The final expression obtained as a result of the procedure is actually the form used to define the IBA similarity measure that will be discussed later in the text. On the value level, a suitable operator for GP is selected based on the nature and/or statistical dependencies of observed attributes. First, for highly correlated variables with the same or at least similar nature, min operator is used, i.e., min ( , )x p x p . If the nature of attributes is
the same/similar but attributes are not correlated, then Lukasiewicz t-norm operator is used, i.e.,
max ( 1,0)x p x p . If observed attributes are of a
different nature and highly statistically independent, standard product is used as operator, i.e., x p x p .
More details about different realizations of GP and detailed application guidelines can be found in [39] and [40].
4.1 Logical Aaggregation
Logical aggregation (LA), introduced in [41] and
further investigated in [10, 40], is an aggregation procedure within the IBA framework. LA is a consistent and transparent logic-based procedure for aggregating attributes in a single representative value that consists of two steps: (1) Normalization of attributes' values to the unit interval, (2) Aggregation of normalized values into the resulting value using the logical/pseudo-logical function. The LA procedure starts with the definition of an aggregation model in a form of a logical expression [42]. Further, values of attributes' are normalized to unit [0, 1] interval using a chosen normalization function
: 0,1 . Once normalization is done, values are
aggregated into resulting value using logical/pseudo-logical function as an operator.
Logical aggregation depends on the chosen measure of aggregation (the logical/pseudological function transformed into GBP) and operator of GP. As is stated in the beginning of this section, the GP operator depends on the nature and statistical dependencies between variables. In general, LA is not a monotone function, providing the wide range of possibilities to model various interactions of attributes [40]. In some special cases LA are monotone (such as GP as a subclass of t-norms) and satisfy all the conditions for being an aggregation operator. 4.2 IBA Equivalence as a Similarity Measure
In IBA framework, the relation of logical equivalence
(i.e. IBA equivalence) is utilized to measure similarity between attribute/objects [43]. The equivalence relation is generally defined as bi-implication of attributes in the following manner:
x p x p p x (1)
Nikola VOJTEK et al.: Decision Support System for Predicting the Number of No-Show Passengers in Airline Industry
Tehnički vjesnik 28, 1(2021), 123-134 127
As it is stated earlier, the first step for dealing with logical function in IBA framework is to transform the logical relation to GBP. The transformation procedure of the equivalence relation to GBP is performed and the following GPB is obtained.
IBA , 1 2S x p x p p x x p (2)
On the value level, a suitable operator for GP in IBA
similarity is min operator since the comparison is meaningful only by the same attribute. The mathematical properties and application perspectives of IBA similarity are elaborated in details [44], showing that it is suitable to be a similarity measure. Furthermore, this measure is used in different domains and in combination with other approaches as proposed in [45].
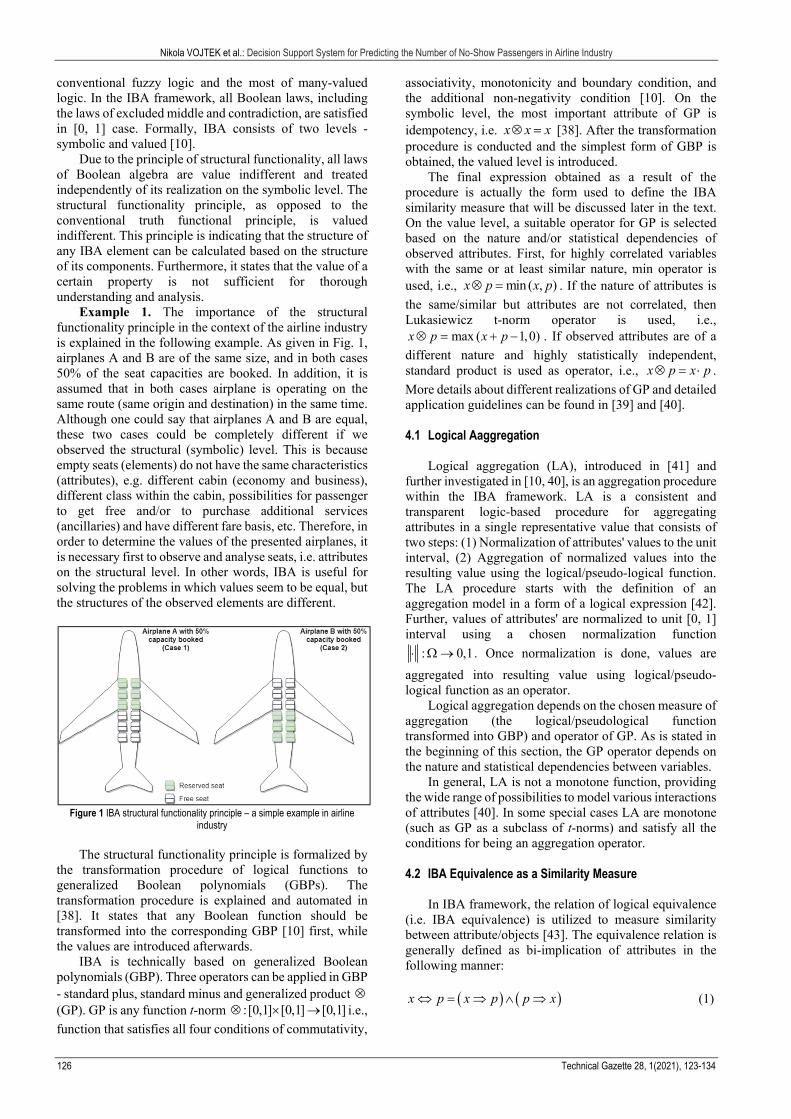
When determining similarity between objectives, IBA similarity measure considers if the two objects either have or not have certain attributes [43]. Therefore, it is shown that the measure may be also interpreted in the following manner:
IBA ,
1 2
S x p x p x p x p
p x x p
(3)
Since min operator is used as GP, the graphical
interpretation of IBA similarity measure is given in Fig. 2.
Figure 2 IBA as similarity measure
Compared to more traditional distance-based
approaches and statistical measures based on correlation, IBA similarity offers a different perspective in modeling object's proximity. It is recognized as particularly suitable to treat the intensity of the properties [43]. Furthermore, easy-to-understand interpretation is an essential feature of IBA similarity. From the practical aspect, IBA similarity outperforms several well-known similarity measures based on fuzzy bi-implications in terms of consensus modelling [43]. Finally, one of the most important advantages of IBA similarity is the possibility to combine it with different LA operators in order to capture dependencies in the data. In [44], it is shown that the usage of IBA similarity and LA operators within k-NN algorithm significantly improves classification accuracy as compared to k-NN with Euclidean distance.
5 FORECASTING NO SHOW PASSENGERS
In this section, we closely examine the no show and overbooking problems and propose a solution.
First, we discuss a hypothetical case in order to point out the importance of the observed problem. Further, the
main aspects of the observed problem are considered. Finally, the proposed decision support system is elaborated along with a detailed description of its components.
5.1 Problem Formulation
Predicting a number of no show passengers is usually
based on historical data for the specific flight. The most common indicators (attributes) for the prediction may be grouped in three categories: 1) time, 2) capacity utilization, and 3) reservations. The most common attributes within the first time group are departure time, departure month, seasonality indicators, a weekend indicator. Departure date, exact time and month of the flight are clear indicators of the time when the use case is considered. A weekend indicator is useful and important since there could be a significant difference in the number of no show passengers during weekends and working days. Further, it is highly recommended that the analysed dataset covers at least a one-year period to comprise seasonal trends in the prediction process, e.g., the percentage of no show passengers during on and off season may vary significantly. The number of instances in the dataset may also affect prediction results significantly. Therefore, the results in terms of precision often differ for daily and monthly flights. The second group consists of at least one attribute describing the capacity utilization for the flight on that date, i.e., the flown percentage. The flown percentage is the ratio between booked and total number of seats available on a flight, showing that. e.g., 90% of the seats are reserved. The last group includes features that are indicating the number of tickets sold or passengers booked via different channels, such as global distribution systems (GDS). For instance, attributes from this group may include a number of tickets sold by the most frequent domestic GDS, a number of tickets sold by the most frequent international GDS, and various similar indicators.
5.2 Decision Support System
The proposed decision support system for forecasting
a number of no show passengers on a specific flight consists of three main components: 1) Model selection 2) System application 3) Database update.
The model selection component is used to determine the best prediction model in terms of accuracy from the model pool. In essence, it is based on CBR algorithm. Therefore, the component consists of two main elements - a database of use cases and a similarity algorithm. In general, a similarity algorithm consists of several steps: data scaling, similarity measuring and aggregating attributes on lower (individual cases) and higher (consolidated cases) levels. These steps are realized differently for each model from the model pool. All models are evaluated in terms of chosen error measures and the model that generates the most accurate results is selected for the application.
The models elaborated in this paper consist of only several basic data scaling techniques, similarity measures and aggregation operators. However, the proposed DSS may be seen as a generic framework, since additional

Nikola VOJTEK et al.: Decision Support System for Predicting the Number of No-Show Passengers in Airline Industry
128 Technical Gazette 28, 1(2021), 123-134
modules are easy to imbed. For instance, the support for dealing with intuitionistic fuzzy (IF) data could be provided by implementing I-fuzzification procedure and appropriate IF similarity measures and aggregation operators. This, or building support for even more general approach, i.e. neutrosophic sets, may be seen as a potential direction of future work.
The system application component simulates the decision making process. In other words, the previously selected model recommends the outcome for the new case. That outcome should be analysed by the decision-maker to resolve if the overbooking will be allowed.
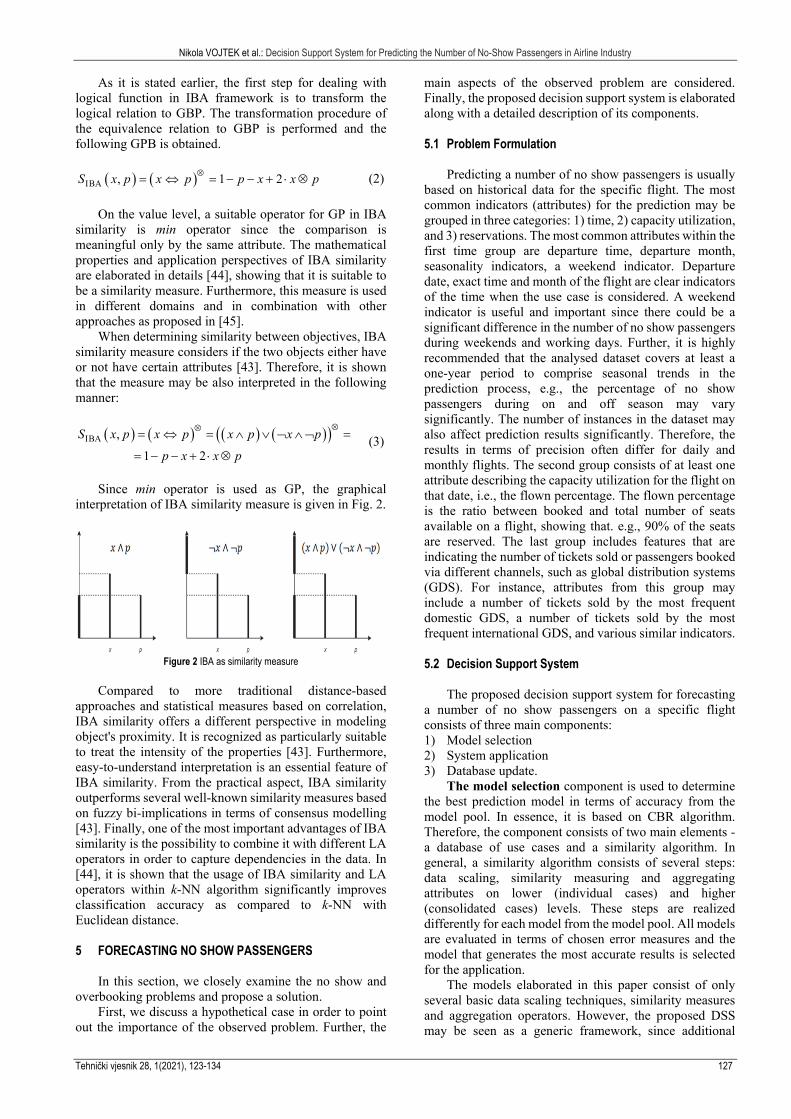
In the database update process, an actual outcome of the case is obtained and stored in the database together with the case features. The structure of the proposed system is given in Fig. 3. It is important to notice that the system may be enhanced to work dynamically, i.e., the model selection component is activated each time when a new case is stored in the use case database.
The application of the proposed expert system consists of the following steps:
1. Database reduction. The database needs to be created for a single flight. It is required that the dataset contains records for at least one entire year before the application. The dataset is filtered in the following manner. Records with no show equal to or smaller than zero are removed from the set. Further, records with the low value of flown percentage, e.g., below 90%, are removed as well. This value of the flown percentage is suggested by authors and will be considered as a hyper parameter that should be calibrated based on the company specifics and other factors. This is arbitrary value and further analysis and collection of data should be conducted in order to find the optimal value that could vary from case to case. These records are of no interest for the proposed analysis, since either no show or overbooking problem did not occur on these flights.
2. Outlier detection. Winsorizing approach is used to replace the outliers with the nearest "non suspect" data. This approach seems to be more appropriate than standard trimming algorithm in our case, since the exclusion of outliers would cause the omitting of many cases causing that CBR knowledge component to weaken.
3. Data scaling. Since the values of features that will be used in the algorithm are out of scale due to their nature, the step of rescaling the data is necessary. General recommendation on the choice of scaling approach is very difficult to be provided. Thus, for the purpose of finding the best possible algorithm (or the best possible combination of approaches, methods and techniques), both normalization and standardization techniques are used. For the purpose of this paper, the min-max normalization and the conventional standardization are applied. The system may be enhanced by applying other normalization functions in this step.
4. Similarity/distance calculation between features. All cases from the database are used in this step for testing and each case is tested against all others. For the purpose of calculating the similarity between features, the feature of actual no show (use case) will be denoted with x and the feature of no show that needs to be predicted (test or new case) with p. For measuring similarity, next will be used:
a) Euclidean distance (ED)
2ED ,1
,n
i j ii
D pX xP
b) Manhattan distance (MD)
MD ,1
,n
i j ii
D X x pP
c) IBA similarity measure (IBA)
IBA , 1 2S x p p x x p
The first two functions are standard metric distance
functions. On the other hand, the third one determines similarity between objects from the standpoint of logic. It should be noticed that similarity is the negation of dissimilarity/distance, i.e., the IBA distance function is: IBA IBA, 1 S , 2 .D x p x p p x p x
Therefore, these functions may be used analogously.
The application of the IBA similarity measure within CBR algorithm provides a new perspective in the reasoning process [42]. This approach may be found as an alternative to conventional distance-based approaches to CBR. Furthermore, LA of IBA similarities may improve reasoning results by incorporating logical relationships of observed attributes.
5. Calculation of individual and average distances. In this step, first the distances between test case and all other cases need to be calculated. Individual distances are obtained by aggregating distance/similarity values between features obtained in the previous step. This aggregation functions may be traditional or logic-based, i.e. in case of IBA logical aggregation may be used
IBA IBA, Agg ,P S X P S x p . After individual
distances/similarities are obtained, average measures and standard deviation are calculated, since it will be used in the case selection step.
6. Case selection and label aggregation. In this step, acceptable cases are selected. Final distance/similarity
results are denoted with ED MD IBA
j j jD , D ,S where j = 1, …, m
and m is the number of use cases. The acceptance level determination is conducted using both mean ( / )D S and standard deviation σD/S of calculated distances/similarities. Depending on whether similarity or distance measure is used to calculate proximity between use cases, two acceptance levels are considered and shown in Fig. 4.
In case of using distances, if the two objects have the same value their difference is 0. Thus, the case acceptance level for first two functions (DED and DMD) is defined as
MED DD D, D . Thus, all cases with distance equal to or
less than the mean of distances reduced for standard deviation are accepted and will be further processed through the algorithm. On the other hand, if similarity measure is used, the result (similarity of same objects) is maximal, i.e., equal to 1. Therefore, the case acceptance level for IBA similarity is IBAS S .

Nikola VOJTEK et al.: Decision Support System for Predicting the Number of No-Show Passengers in Airline Industry
Tehnički vjesnik 28, 1(2021), 123-134 129
Figure 3 DSS for no show passenger prediction
Figure 4 Case Acceptance Level per used measure
7. Case selection and label aggregation based on
expert's knowledge. This step implies the introduction of an expert's knowledge in the proposed system. In fact, an expert is selecting test cases from the database that are in his/her opinion the most similar to the observed case. He/she should at least select an equal number of test cases as the algorithm did in the previous step. Hence, various aggregation functions could be applied.
8. Aggregation of label recommendations. After recommendations are obtained from both sources (using algorithm and expert), they are aggregated using a chosen operator. Instead of a simple average, it is proposed to use the LA function as aggregation. In this case, LA is realized as a conjunction of recommendations with min as the GP aggregation operator since the observed recommendation scores are with the same/similar nature. To capture possible nonlinear dependencies in the data, the more complex LA functions may be also applied within the proposed model.
9. Calculation of forecast error measures and model selection. In the final step, forecasting performance of each model is determined and evaluated. In order to evaluate the forecasting performance of models, different criteria could be used, e.g., forecast error measurements, the speed of computation, interpretability and others.
Among those criteria, it can be said that forecast error measures are the most important. Thus, two forecast error measures are used for the evaluation - mean absolute percentage error (MAPE) and mean absolute cost regret (MACR). Since the main objective of the model is to calculate the percentage of no show passengers, the percentage error of the forecast is of greater importance to an airline. Thus, MAPE will be mostly used as a basis for application and results discussion. With this, it is also very important to distinguish and treat differently under predict and over predict results, especially in terms of costs. In case of no show forecasting, under predicting could cost airline less than over predicting the expected number of no show passengers. If, for example, 10 passengers are expected not to show up, additional 10 seats are sold, and if only 8 do not show up, airline will have 2 passengers for which it needs to pay extra cost (board them on another flight, pay accommodation, additional compensation etc.). Thus, MACR is introduced to give more weights to the models that have more under predict results. MACR is present in the next form:
1
1 n
ii
MACR crn
(4)
1
2
, for 0
, for 0i i i i
ii i i i
x p w x pcr
x p w x p
After the forecasting error measures are calculated,
models are ranked and the best performing model is selected.
Nikola VOJTEK et al.: Decision Support System for Predicting the Number of No-Show Passengers in Airline Industry
130 Technical Gazette 28, 1(2021), 123-134
6 APPLICATION Information on passengers and their reservations was
retrieved from an airline, for a flight Belgrade-Amsterdam. This flight is scheduled on a daily basis, and each flight represents one record (use case) in a database. One record contains next data: Attributes: seasonality indicator (x1), flight departure month (x2), weekend indicator (x3), flight flown rate (x4) and number of reservations through different channels (a domestic GDS (x5), an international GDS (x6), all others GDS's (x7)). Label: no show
percentage ( )y .
The first three attributes are describing time dimension of a particular flight. The fourth attribute indicates the seat capacity and showing inventory utilization dimension. The last three are representing different booking channels in terms of sales dimension. Since the flight was scheduled on a daily basis, and considering several cancellations during the observed year, 300 records (use cases) are captured for the period October 1, 2015 - September 30, 2016. This data is used for obtaining the prediction model. On the other hand, an additional 10 records from the period October 1, 2016 - November 30th, 2016 are used for model application and validation.
6.1 Model Selection - Data Pre-processing
Data from the initial 300 use cases contain a lot of
noise and some records cannot be used since they either do
not have no show passengers or have too low flight flown rate, which means that those are not high demand flights (an airline does not have interest to allow overbooking on those flights).
Database reduction. All the data that contain flown rates lower than 90% are removed, as well as the records with no show value equal or smaller than zero. This proposed arbitrary value is already explained and discussed in the sub-section 5.2.
After database reduction, a 123 use cases were used for the model selection purposes and results are presented in section 6.2. Two statistical tests are conducted with the aim of ensuring the significance of the best performing models in section 6.3. Finally, best performing models are applied on an additional 10 use cases (flight period Oct16 - Nov16) in the 6.4 System application and validation section. 6.2 Model Selection - Similarity Algorithm
For the model selection and testing purposes, all 123 records from the cleaned database are used in the experiment. Different scaling techniques, distance/similarity measures and aggregations are used to define the model pool that consists of 18 different models. The observed models include both distance-based approach along with standard aggregation and logic-based approach utilizing the IBA framework. Model selection was conducted following the steps described in previous subsection 5.2.
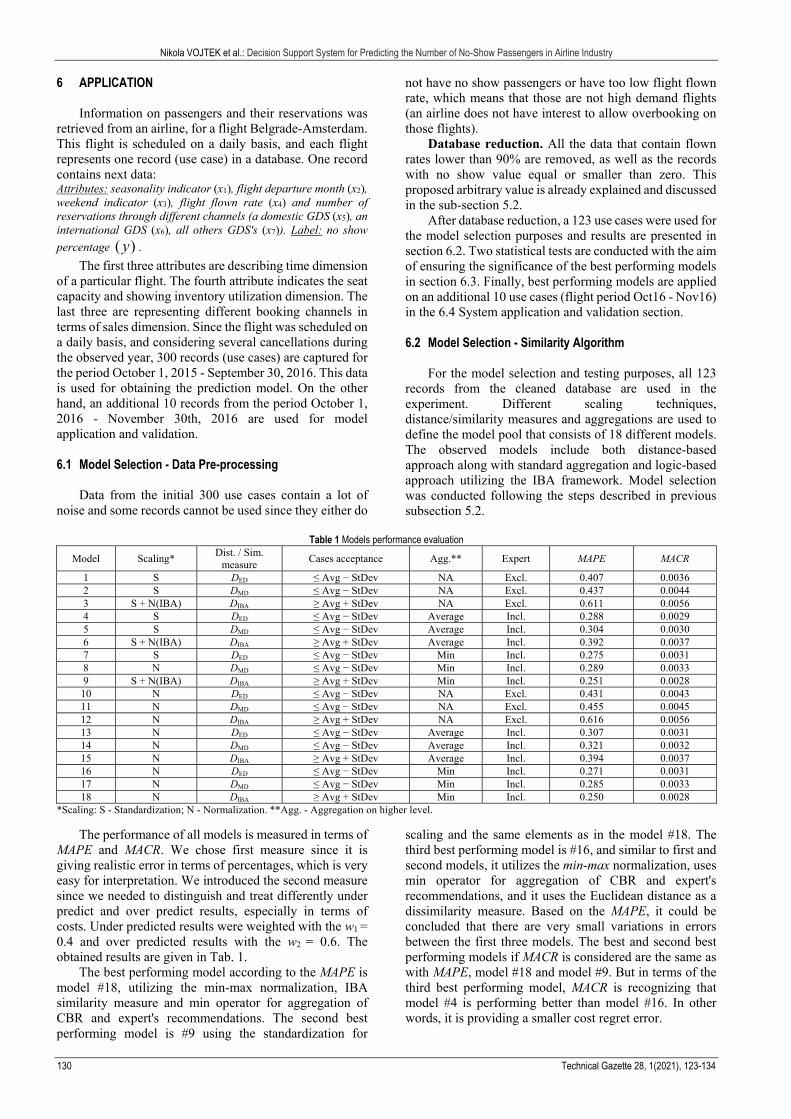
Table 1 Models performance evaluation
Model Scaling* Dist. / Sim.
measure Cases acceptance Agg.** Expert MAPE MACR
1 S DED ≤ Avg − StDev NA Excl. 0.407 0.0036 2 S DMD ≤ Avg − StDev NA Excl. 0.437 0.0044 3 S + N(IBA) DIBA ≥ Avg + StDev NA Excl. 0.611 0.0056 4 S DED ≤ Avg − StDev Average Incl. 0.288 0.0029 5 S DMD ≤ Avg − StDev Average Incl. 0.304 0.0030 6 S + N(IBA) DIBA ≥ Avg + StDev Average Incl. 0.392 0.0037 7 S DED ≤ Avg − StDev Min Incl. 0.275 0.0031 8 N DMD ≤ Avg − StDev Min Incl. 0.289 0.0033 9 S + N(IBA) DIBA ≥ Avg + StDev Min Incl. 0.251 0.0028 10 N DED ≤ Avg − StDev NA Excl. 0.431 0.0043 11 N DMD ≤ Avg − StDev NA Excl. 0.455 0.0045 12 N DIBA ≥ Avg + StDev NA Excl. 0.616 0.0056 13 N DED ≤ Avg − StDev Average Incl. 0.307 0.0031 14 N DMD ≤ Avg − StDev Average Incl. 0.321 0.0032 15 N DIBA ≥ Avg + StDev Average Incl. 0.394 0.0037 16 N DED ≤ Avg − StDev Min Incl. 0.271 0.0031 17 N DMD ≤ Avg − StDev Min Incl. 0.285 0.0033 18 N DIBA ≥ Avg + StDev Min Incl. 0.250 0.0028
*Scaling: S - Standardization; N - Normalization. **Agg. - Aggregation on higher level.
The performance of all models is measured in terms of MAPE and MACR. We chose first measure since it is giving realistic error in terms of percentages, which is very easy for interpretation. We introduced the second measure since we needed to distinguish and treat differently under predict and over predict results, especially in terms of costs. Under predicted results were weighted with the w1 = 0.4 and over predicted results with the w2 = 0.6. The obtained results are given in Tab. 1.
The best performing model according to the MAPE is model #18, utilizing the min-max normalization, IBA similarity measure and min operator for aggregation of CBR and expert's recommendations. The second best performing model is #9 using the standardization for
scaling and the same elements as in the model #18. The third best performing model is #16, and similar to first and second models, it utilizes the min-max normalization, uses min operator for aggregation of CBR and expert's recommendations, and it uses the Euclidean distance as a dissimilarity measure. Based on the MAPE, it could be concluded that there are very small variations in errors between the first three models. The best and second best performing models if MACR is considered are the same as with MAPE, model #18 and model #9. But in terms of the third best performing model, MACR is recognizing that model #4 is performing better than model #16. In other words, it is providing a smaller cost regret error.
Nikola VOJTEK et al.: Decision Support System for Predicting the Number of No-Show Passengers in Airline Industry
Tehnički vjesnik 28, 1(2021), 123-134 131
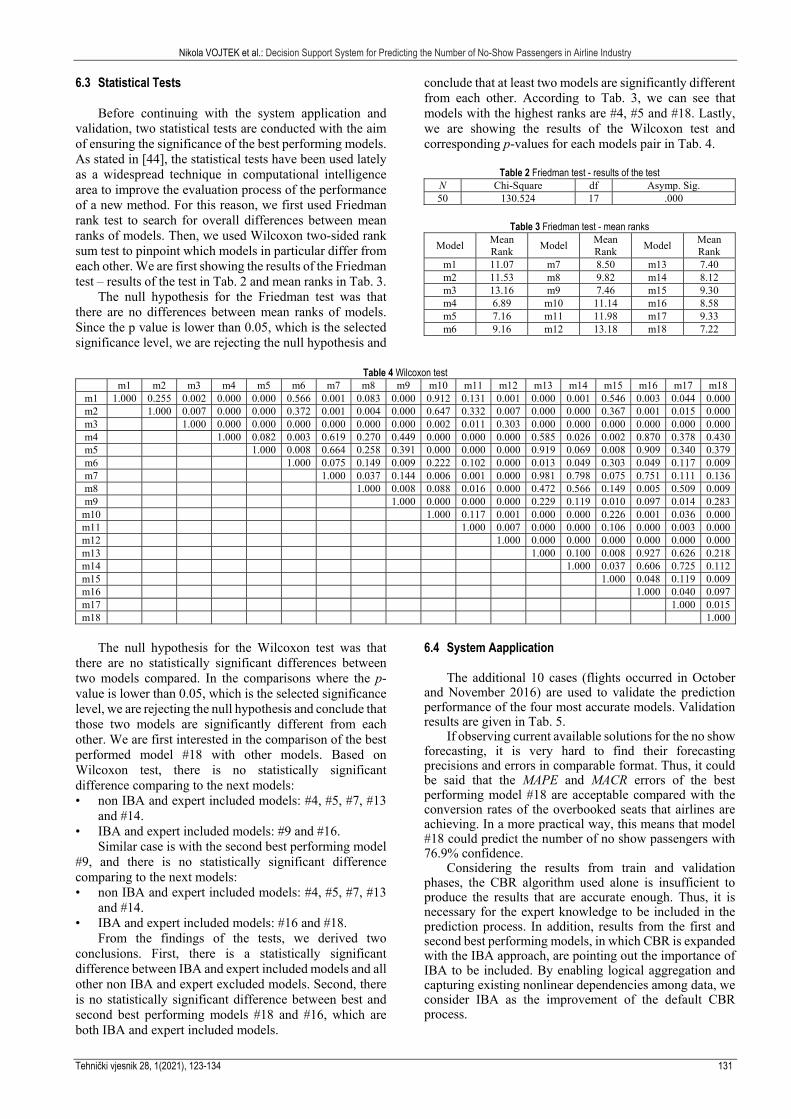
6.3 Statistical Tests Before continuing with the system application and
validation, two statistical tests are conducted with the aim of ensuring the significance of the best performing models. As stated in [44], the statistical tests have been used lately as a widespread technique in computational intelligence area to improve the evaluation process of the performance of a new method. For this reason, we first used Friedman rank test to search for overall differences between mean ranks of models. Then, we used Wilcoxon two-sided rank sum test to pinpoint which models in particular differ from each other. We are first showing the results of the Friedman test – results of the test in Tab. 2 and mean ranks in Tab. 3.
The null hypothesis for the Friedman test was that there are no differences between mean ranks of models. Since the p value is lower than 0.05, which is the selected significance level, we are rejecting the null hypothesis and
conclude that at least two models are significantly different from each other. According to Tab. 3, we can see that models with the highest ranks are #4, #5 and #18. Lastly, we are showing the results of the Wilcoxon test and corresponding p-values for each models pair in Tab. 4.
Table 2 Friedman test - results of the test
N Chi-Square df Asymp. Sig. 50 130.524 17 .000
Table 3 Friedman test - mean ranks
Model Mean Rank
Model Mean Rank
Model Mean Rank
m1 11.07 m7 8.50 m13 7.40 m2 11.53 m8 9.82 m14 8.12 m3 13.16 m9 7.46 m15 9.30 m4 6.89 m10 11.14 m16 8.58 m5 7.16 m11 11.98 m17 9.33 m6 9.16 m12 13.18 m18 7.22
Table 4 Wilcoxon test
m1 m2 m3 m4 m5 m6 m7 m8 m9 m10 m11 m12 m13 m14 m15 m16 m17 m18 m1 1.000 0.255 0.002 0.000 0.000 0.566 0.001 0.083 0.000 0.912 0.131 0.001 0.000 0.001 0.546 0.003 0.044 0.000 m2 1.000 0.007 0.000 0.000 0.372 0.001 0.004 0.000 0.647 0.332 0.007 0.000 0.000 0.367 0.001 0.015 0.000 m3 1.000 0.000 0.000 0.000 0.000 0.000 0.000 0.002 0.011 0.303 0.000 0.000 0.000 0.000 0.000 0.000 m4 1.000 0.082 0.003 0.619 0.270 0.449 0.000 0.000 0.000 0.585 0.026 0.002 0.870 0.378 0.430 m5 1.000 0.008 0.664 0.258 0.391 0.000 0.000 0.000 0.919 0.069 0.008 0.909 0.340 0.379 m6 1.000 0.075 0.149 0.009 0.222 0.102 0.000 0.013 0.049 0.303 0.049 0.117 0.009 m7 1.000 0.037 0.144 0.006 0.001 0.000 0.981 0.798 0.075 0.751 0.111 0.136 m8 1.000 0.008 0.088 0.016 0.000 0.472 0.566 0.149 0.005 0.509 0.009 m9 1.000 0.000 0.000 0.000 0.229 0.119 0.010 0.097 0.014 0.283
m10 1.000 0.117 0.001 0.000 0.000 0.226 0.001 0.036 0.000 m11 1.000 0.007 0.000 0.000 0.106 0.000 0.003 0.000 m12 1.000 0.000 0.000 0.000 0.000 0.000 0.000 m13 1.000 0.100 0.008 0.927 0.626 0.218 m14 1.000 0.037 0.606 0.725 0.112 m15 1.000 0.048 0.119 0.009 m16 1.000 0.040 0.097 m17 1.000 0.015 m18 1.000
The null hypothesis for the Wilcoxon test was that there are no statistically significant differences between two models compared. In the comparisons where the p-value is lower than 0.05, which is the selected significance level, we are rejecting the null hypothesis and conclude that those two models are significantly different from each other. We are first interested in the comparison of the best performed model #18 with other models. Based on Wilcoxon test, there is no statistically significant difference comparing to the next models: • non IBA and expert included models: #4, #5, #7, #13
and #14. • IBA and expert included models: #9 and #16.
Similar case is with the second best performing model #9, and there is no statistically significant difference comparing to the next models: • non IBA and expert included models: #4, #5, #7, #13
and #14. • IBA and expert included models: #16 and #18.
From the findings of the tests, we derived two conclusions. First, there is a statistically significant difference between IBA and expert included models and all other non IBA and expert excluded models. Second, there is no statistically significant difference between best and second best performing models #18 and #16, which are both IBA and expert included models.
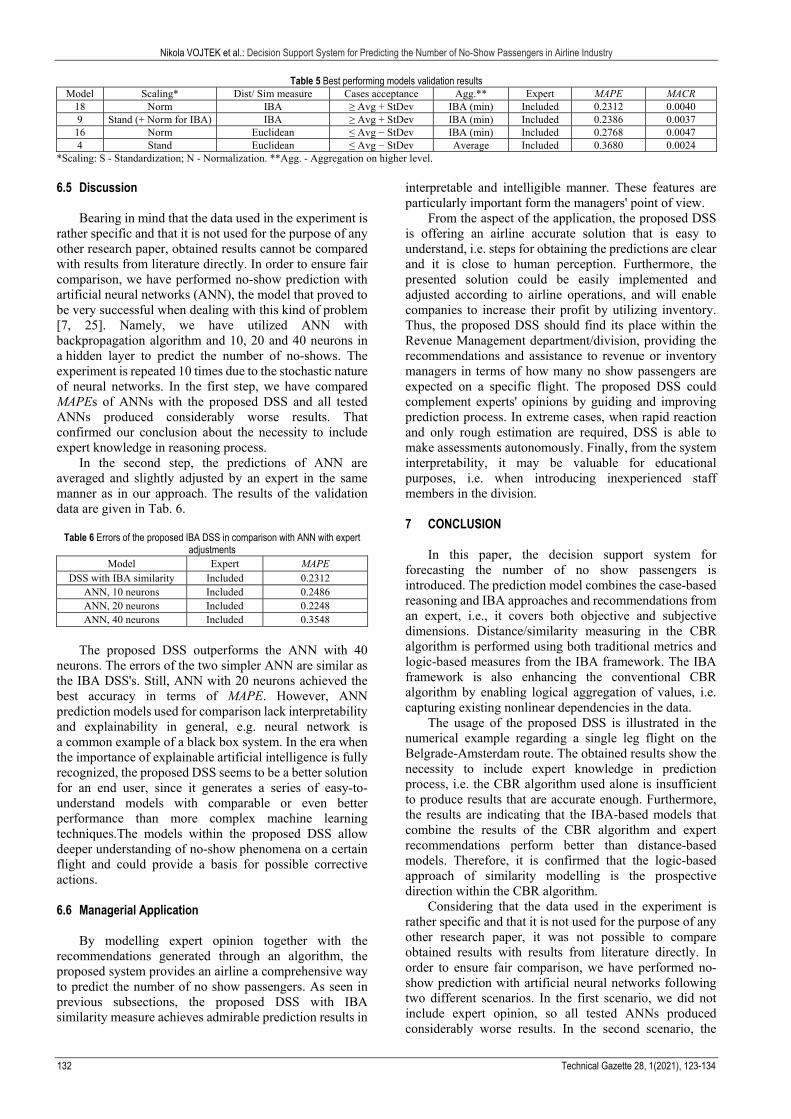
6.4 System Aapplication The additional 10 cases (flights occurred in October
and November 2016) are used to validate the prediction performance of the four most accurate models. Validation results are given in Tab. 5.
If observing current available solutions for the no show forecasting, it is very hard to find their forecasting precisions and errors in comparable format. Thus, it could be said that the MAPE and MACR errors of the best performing model #18 are acceptable compared with the conversion rates of the overbooked seats that airlines are achieving. In a more practical way, this means that model #18 could predict the number of no show passengers with 76.9% confidence.
Considering the results from train and validation phases, the CBR algorithm used alone is insufficient to produce the results that are accurate enough. Thus, it is necessary for the expert knowledge to be included in the prediction process. In addition, results from the first and second best performing models, in which CBR is expanded with the IBA approach, are pointing out the importance of IBA to be included. By enabling logical aggregation and capturing existing nonlinear dependencies among data, we consider IBA as the improvement of the default CBR process.
Nikola VOJTEK et al.: Decision Support System for Predicting the Number of No-Show Passengers in Airline Industry
132 Technical Gazette 28, 1(2021), 123-134
Table 5 Best performing models validation results Model Scaling* Dist/ Sim measure Cases acceptance Agg.** Expert MAPE MACR
18 Norm IBA ≥ Avg + StDev IBA (min) Included 0.2312 0.0040 9 Stand (+ Norm for IBA) IBA ≥ Avg + StDev IBA (min) Included 0.2386 0.0037 16 Norm Euclidean ≤ Avg − StDev IBA (min) Included 0.2768 0.0047 4 Stand Euclidean ≤ Avg − StDev Average Included 0.3680 0.0024
*Scaling: S - Standardization; N - Normalization. **Agg. - Aggregation on higher level.
6.5 Discussion
Bearing in mind that the data used in the experiment is
rather specific and that it is not used for the purpose of any other research paper, obtained results cannot be compared with results from literature directly. In order to ensure fair comparison, we have performed no-show prediction with artificial neural networks (ANN), the model that proved to be very successful when dealing with this kind of problem [7, 25]. Namely, we have utilized ANN with backpropagation algorithm and 10, 20 and 40 neurons in a hidden layer to predict the number of no-shows. The experiment is repeated 10 times due to the stochastic nature of neural networks. In the first step, we have compared MAPEs of ANNs with the proposed DSS and all tested ANNs produced considerably worse results. That confirmed our conclusion about the necessity to include expert knowledge in reasoning process.
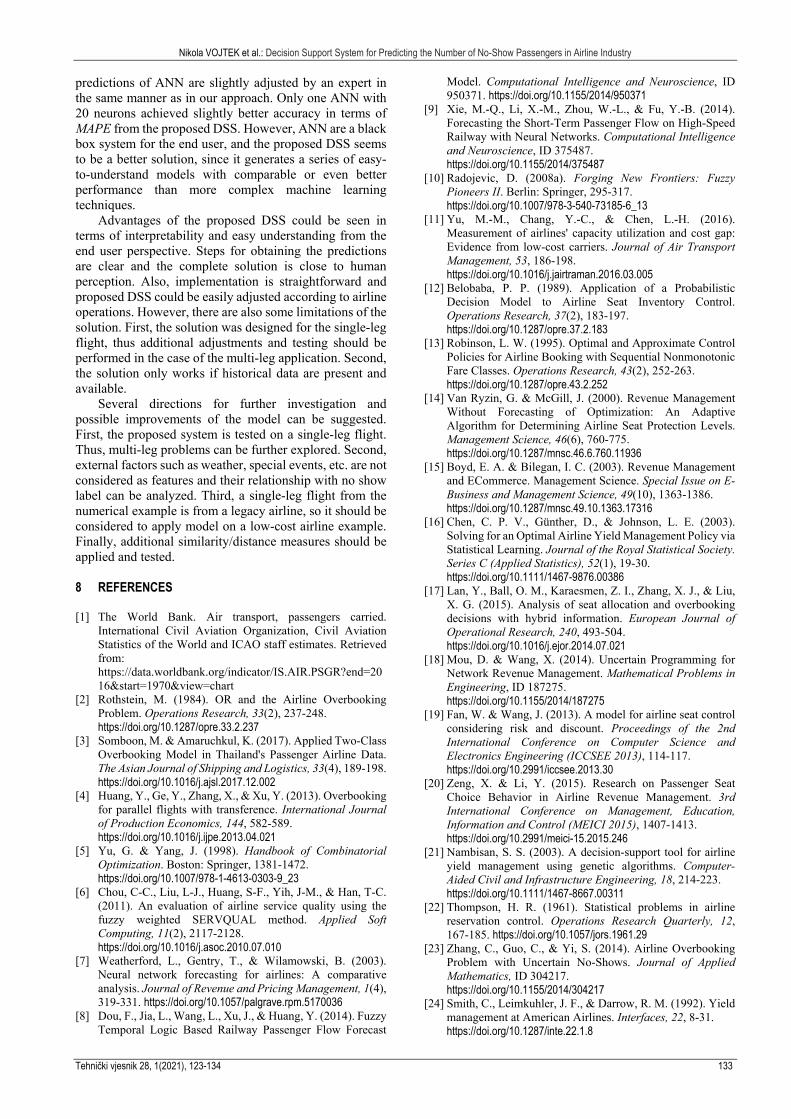
In the second step, the predictions of ANN are averaged and slightly adjusted by an expert in the same manner as in our approach. The results of the validation data are given in Tab. 6.
Table 6 Errors of the proposed IBA DSS in comparison with ANN with expert adjustments
Model Expert MAPE DSS with IBA similarity Included 0.2312
ANN, 10 neurons Included 0.2486 ANN, 20 neurons Included 0.2248 ANN, 40 neurons Included 0.3548
The proposed DSS outperforms the ANN with 40
neurons. The errors of the two simpler ANN are similar as the IBA DSS's. Still, ANN with 20 neurons achieved the best accuracy in terms of MAPE. However, ANN prediction models used for comparison lack interpretability and explainability in general, e.g. neural network is a common example of a black box system. In the era when the importance of explainable artificial intelligence is fully recognized, the proposed DSS seems to be a better solution for an end user, since it generates a series of easy-to-understand models with comparable or even better performance than more complex machine learning techniques.The models within the proposed DSS allow deeper understanding of no-show phenomena on a certain flight and could provide a basis for possible corrective actions.
6.6 Managerial Application
By modelling expert opinion together with the
recommendations generated through an algorithm, the proposed system provides an airline a comprehensive way to predict the number of no show passengers. As seen in previous subsections, the proposed DSS with IBA similarity measure achieves admirable prediction results in
interpretable and intelligible manner. These features are particularly important form the managers' point of view.
From the aspect of the application, the proposed DSS is offering an airline accurate solution that is easy to understand, i.e. steps for obtaining the predictions are clear and it is close to human perception. Furthermore, the presented solution could be easily implemented and adjusted according to airline operations, and will enable companies to increase their profit by utilizing inventory. Thus, the proposed DSS should find its place within the Revenue Management department/division, providing the recommendations and assistance to revenue or inventory managers in terms of how many no show passengers are expected on a specific flight. The proposed DSS could complement experts' opinions by guiding and improving prediction process. In extreme cases, when rapid reaction and only rough estimation are required, DSS is able to make assessments autonomously. Finally, from the system interpretability, it may be valuable for educational purposes, i.e. when introducing inexperienced staff members in the division.
7 CONCLUSION
In this paper, the decision support system for
forecasting the number of no show passengers is introduced. The prediction model combines the case-based reasoning and IBA approaches and recommendations from an expert, i.e., it covers both objective and subjective dimensions. Distance/similarity measuring in the CBR algorithm is performed using both traditional metrics and logic-based measures from the IBA framework. The IBA framework is also enhancing the conventional CBR algorithm by enabling logical aggregation of values, i.e. capturing existing nonlinear dependencies in the data.
The usage of the proposed DSS is illustrated in the numerical example regarding a single leg flight on the Belgrade-Amsterdam route. The obtained results show the necessity to include expert knowledge in prediction process, i.e. the CBR algorithm used alone is insufficient to produce results that are accurate enough. Furthermore, the results are indicating that the IBA-based models that combine the results of the CBR algorithm and expert recommendations perform better than distance-based models. Therefore, it is confirmed that the logic-based approach of similarity modelling is the prospective direction within the CBR algorithm.
Considering that the data used in the experiment is rather specific and that it is not used for the purpose of any other research paper, it was not possible to compare obtained results with results from literature directly. In order to ensure fair comparison, we have performed no-show prediction with artificial neural networks following two different scenarios. In the first scenario, we did not include expert opinion, so all tested ANNs produced considerably worse results. In the second scenario, the
Nikola VOJTEK et al.: Decision Support System for Predicting the Number of No-Show Passengers in Airline Industry
Tehnički vjesnik 28, 1(2021), 123-134 133
predictions of ANN are slightly adjusted by an expert in the same manner as in our approach. Only one ANN with 20 neurons achieved slightly better accuracy in terms of MAPE from the proposed DSS. However, ANN are a black box system for the end user, and the proposed DSS seems to be a better solution, since it generates a series of easy-to-understand models with comparable or even better performance than more complex machine learning techniques.
Advantages of the proposed DSS could be seen in terms of interpretability and easy understanding from the end user perspective. Steps for obtaining the predictions are clear and the complete solution is close to human perception. Also, implementation is straightforward and proposed DSS could be easily adjusted according to airline operations. However, there are also some limitations of the solution. First, the solution was designed for the single-leg flight, thus additional adjustments and testing should be performed in the case of the multi-leg application. Second, the solution only works if historical data are present and available.
Several directions for further investigation and possible improvements of the model can be suggested. First, the proposed system is tested on a single-leg flight. Thus, multi-leg problems can be further explored. Second, external factors such as weather, special events, etc. are not considered as features and their relationship with no show label can be analyzed. Third, a single-leg flight from the numerical example is from a legacy airline, so it should be considered to apply model on a low-cost airline example. Finally, additional similarity/distance measures should be applied and tested.
8 REFERENCES [1] The World Bank. Air transport, passengers carried.
International Civil Aviation Organization, Civil Aviation Statistics of the World and ICAO staff estimates. Retrieved from: https://data.worldbank.org/indicator/IS.AIR.PSGR?end=2016&start=1970&view=chart
[2] Rothstein, M. (1984). OR and the Airline Overbooking Problem. Operations Research, 33(2), 237-248. https://doi.org/10.1287/opre.33.2.237
[3] Somboon, M. & Amaruchkul, K. (2017). Applied Two-Class Overbooking Model in Thailand's Passenger Airline Data. The Asian Journal of Shipping and Logistics, 33(4), 189-198. https://doi.org/10.1016/j.ajsl.2017.12.002
[4] Huang, Y., Ge, Y., Zhang, X., & Xu, Y. (2013). Overbooking for parallel flights with transference. International Journal of Production Economics, 144, 582-589. https://doi.org/10.1016/j.ijpe.2013.04.021
[5] Yu, G. & Yang, J. (1998). Handbook of Combinatorial Optimization. Boston: Springer, 1381-1472. https://doi.org/10.1007/978-1-4613-0303-9_23
[6] Chou, C-C., Liu, L-J., Huang, S-F., Yih, J-M., & Han, T-C. (2011). An evaluation of airline service quality using the fuzzy weighted SERVQUAL method. Applied Soft Computing, 11(2), 2117-2128. https://doi.org/10.1016/j.asoc.2010.07.010
[7] Weatherford, L., Gentry, T., & Wilamowski, B. (2003). Neural network forecasting for airlines: A comparative analysis. Journal of Revenue and Pricing Management, 1(4), 319-331. https://doi.org/10.1057/palgrave.rpm.5170036
[8] Dou, F., Jia, L., Wang, L., Xu, J., & Huang, Y. (2014). Fuzzy Temporal Logic Based Railway Passenger Flow Forecast
Model. Computational Intelligence and Neuroscience, ID 950371. https://doi.org/10.1155/2014/950371
[9] Xie, M.-Q., Li, X.-M., Zhou, W.-L., & Fu, Y.-B. (2014). Forecasting the Short-Term Passenger Flow on High-Speed Railway with Neural Networks. Computational Intelligence and Neuroscience, ID 375487. https://doi.org/10.1155/2014/375487
[10] Radojevic, D. (2008a). Forging New Frontiers: Fuzzy Pioneers II. Berlin: Springer, 295-317. https://doi.org/10.1007/978-3-540-73185-6_13
[11] Yu, M.-M., Chang, Y.-C., & Chen, L.-H. (2016). Measurement of airlines' capacity utilization and cost gap: Evidence from low-cost carriers. Journal of Air Transport Management, 53, 186-198. https://doi.org/10.1016/j.jairtraman.2016.03.005
[12] Belobaba, P. P. (1989). Application of a Probabilistic Decision Model to Airline Seat Inventory Control. Operations Research, 37(2), 183-197. https://doi.org/10.1287/opre.37.2.183
[13] Robinson, L. W. (1995). Optimal and Approximate Control Policies for Airline Booking with Sequential Nonmonotonic Fare Classes. Operations Research, 43(2), 252-263. https://doi.org/10.1287/opre.43.2.252
[14] Van Ryzin, G. & McGill, J. (2000). Revenue Management Without Forecasting of Optimization: An Adaptive Algorithm for Determining Airline Seat Protection Levels. Management Science, 46(6), 760-775. https://doi.org/10.1287/mnsc.46.6.760.11936
[15] Boyd, E. A. & Bilegan, I. C. (2003). Revenue Management and ECommerce. Management Science. Special Issue on E-Business and Management Science, 49(10), 1363-1386. https://doi.org/10.1287/mnsc.49.10.1363.17316
[16] Chen, C. P. V., Günther, D., & Johnson, L. E. (2003). Solving for an Optimal Airline Yield Management Policy via Statistical Learning. Journal of the Royal Statistical Society. Series C (Applied Statistics), 52(1), 19-30. https://doi.org/10.1111/1467-9876.00386
[17] Lan, Y., Ball, O. M., Karaesmen, Z. I., Zhang, X. J., & Liu, X. G. (2015). Analysis of seat allocation and overbooking decisions with hybrid information. European Journal of Operational Research, 240, 493-504. https://doi.org/10.1016/j.ejor.2014.07.021
[18] Mou, D. & Wang, X. (2014). Uncertain Programming for Network Revenue Management. Mathematical Problems in Engineering, ID 187275. https://doi.org/10.1155/2014/187275
[19] Fan, W. & Wang, J. (2013). A model for airline seat control considering risk and discount. Proceedings of the 2nd International Conference on Computer Science and Electronics Engineering (ICCSEE 2013), 114-117. https://doi.org/10.2991/iccsee.2013.30
[20] Zeng, X. & Li, Y. (2015). Research on Passenger Seat Choice Behavior in Airline Revenue Management. 3rd International Conference on Management, Education, Information and Control (MEICI 2015), 1407-1413. https://doi.org/10.2991/meici-15.2015.246
[21] Nambisan, S. S. (2003). A decision-support tool for airline yield management using genetic algorithms. Computer-Aided Civil and Infrastructure Engineering, 18, 214-223. https://doi.org/10.1111/1467-8667.00311
[22] Thompson, H. R. (1961). Statistical problems in airline reservation control. Operations Research Quarterly, 12, 167-185. https://doi.org/10.1057/jors.1961.29
[23] Zhang, C., Guo, C., & Yi, S. (2014). Airline Overbooking Problem with Uncertain No-Shows. Journal of Applied Mathematics, ID 304217. https://doi.org/10.1155/2014/304217
[24] Smith, C., Leimkuhler, J. F., & Darrow, R. M. (1992). Yield management at American Airlines. Interfaces, 22, 8-31. https://doi.org/10.1287/inte.22.1.8
Nikola VOJTEK et al.: Decision Support System for Predicting the Number of No-Show Passengers in Airline Industry
134 Technical Gazette 28, 1(2021), 123-134
[25] Faraway, J. & Chatfield, C. (1998). Time Series Forecasting with Neural Networks: A Comparative Study Using the Airline Data. Journal of the Royal Statistical Society. Series C (Applied Statistics), 47(2), 231-250. https://doi.org/10.1111/1467-9876.00109
[26] Kunnumkal, S., Talluri, K., & Topaloglu, H. (2012). A randomized linear programming method for network revenue management with product-specific no shows. Transportation Science, 46(1), 90-108. https://doi.org/10.1287/trsc.1110.0386
[27] Fildes, R., Nikolopoulos, K., Crone, S. F., & Syntetos, A. A. (2008). Forecasting and Operational Research: A Review. The Journal of the Operational Research Society, 59(9), 1150-1172. https://doi.org/10.1057/palgrave.jors.2602597
[28] Lawrence, R., Hong, S., & Cherrier, J. (2003). Passenger-Based Predictive Modeling of Airline No-show Rates. Proceedings of the ACM SIGKDD International Conference on Knowledge Discovery and Data Mining. https://doi.org/10.1145/956750.956796
[29] Garrow, L. A., & Koppelman, F. S. (2004). Predicting air travelers' no-show and standby behavior using passenger and directional itinerary information. Journal of Air Transport Management, 10(6), 401-411. https://doi.org/10.1016/j.jairtraman.2004.06.007
[30] Chang, P. C., Hsieh, J. C., Yeh, C. H., & Liu, C. H. (2006). A Case-Based Seat Allocation System for Airline Revenue Management. Intelligent Computing ICIC 2006, 1003-1011. https://doi.org/10.1007/11816157_122
[31] Chiu, C., Chiu, N.-H., & Hsu, C.-I. (2004). Intelligent aircraft maintenance support system using genetic algorithms and case-based reasoning. The International Journal of Advanced Manufacturing Technology, 24, 440-446. https://doi.org/10.1007/s00170-003-1707-x
[32] Leake, D. B. (1996). Case-based Reasoning: Experiences, Lessons and Future Directions. Cambridge: MIT Press.
[33] Kolodner, J. (1993). Case-based Reasoning. San Francisco: Morgan-Kauffman. https://doi.org/10.1016/B978-1-55860-237-3.50005-4
[34] Aamodt, A. & Plaza, E. (1994). Case-based reasoning: foundational issues, methodological variations and system approaches. AI Communications, 7(1), 39-59. https://doi.org/10.3233/AIC-1994-7104
[35] Xu, X., Wang, K., Ma, W., & Lin, J. (2010). Improving the Reliability of Case-Based Reasoning Systems. International Journal of Computational Intelligence Systems, 3(3), 256-265. https://doi.org/10.1080/18756891.2010.9727696
[36] Deza, M. M. & Deza, E. (2009). Encyclopedia of distances. Berlin: Springer. https://doi.org/10.1007/978-3-642-00234-2
[37] Radojevic, D. (2000). [0, 1]-valued logic: A natural generalization of Boolean logic. Yugoslav Journal of Operations Research, 10(2), 185-216.
[38] Milosevic, P., Petrovic, B., Radojevic, D., & Kovacevic, D. (2014). A software tool for uncertainty modeling using Interpolative Boolean algebra. Knowledge-Based Systems, 62, 1-10. https://doi.org/10.1016/j.knosys.2014.01.019
[39] Rakićević, A., Simeunović, V., Petrović, B., & Milić, S. (2018). An Automated System for Stock Market Trading Based on Logical Clustering. Technical Gazette, 25(4), 970-978. https://doi.org/10.17559/TV-20160318145514
[40] Dragovic, I., Turajlic, N., Radojevic, D., & Petrovic, B. (2014). Combining Boolean consistent fuzzy logic and AHP illustrated on the web service selection problem. International Journal of Computational Intelligence Systems, 7(sup1), 84-93. https://doi.org/10.1080/18756891.2014.853935
[41] Radojevic, D. & Petrovic, B. (2001). Logical aggregation of [0,1]-valued logic. Proceedings of a Workshop on Computational Intelligence, Theory and Application, 69-80.
[42] Poledica, A., Bogicevic-Arsic, V., & Petrovic, B. (2010) Logical aggregation as similarity measure in case-based
reasoning. Computational Intelligence: Foundations and Applications - Proceedings of the 9th International FLINS Conference, 585-590. https://doi.org/10.1142/9789814324700_0088
[43] Poledica, A., Milosevic, P., Dragovic, I., Petrovic, B., & Radojevic, D. (2015). Modeling consensus using logic-based similarity measures. Soft Computing, 19(11), 3209-3219. https://doi.org/10.1007/s00500-014-1476-5
[44] Milosevic, P., Poledica, A., Rakicevic, A., Dobric, V., Petrovic, B., & Radojevic, D. (2018). IBA-based framework for modeling similarity. International Journal of Computational Intelligence Systems, 11(1), 206 - 218. https://doi.org/10.2991/ijcis.11.1.16
[45] Milosevic, P., Petrovic, B., & Jeremic, V. (2017). IFS-IBA similarity measure in machine learning algorithms. Expert Systems with Applications, 89, 296-305. https://doi.org/10.1016/j.eswa.2017.07.048
[46] Derrac, J., García, S., Molina, D., & Herrera, F. (2011). A practical tutorial on the use of nonparametric statistical tests as a methodology for comparing evolutionary and swarm intelligence algorithms. Swarm and Evolutionary Computation, 1, 3-18. https://doi.org/10.1016/j.swevo.2011.02.002
Contact information: Nikola VOJTEK, PhD student (Corresponding author) University of Belgrade, Faculty of Organizational Sciences, Jove Ilića 154, Belgrade, 11000, Serbia E-mail: [email protected] Bratislav PETROVIĆ, PhD, Full Professor University of Belgrade, Faculty of Organizational Sciences, Jove Ilića 154, Belgrade, 11000, Serbia E-mail: [email protected] Pavle MILOŠEVIĆ, PhD, Assistant Professor University of Belgrade, Faculty of Organizational Sciences, Jove Ilića 154, Belgrade, 11000, Serbia E-mail: [email protected]