decision-making techniques for software … techniques for software architecture design: a...
TRANSCRIPT

Decision-making Techniques for Software Architecture Design: A Comparative Survey
DAVIDE FALESSI, GIOVANNI CANTONE University of Rome, “Tor Vergata”
RICK KAZMAN Software Engineering Institute, Carnegie Mellon University and University of Hawaii
AND
PHILIPPE KRUCHTEN University of British Columbia ________________________________________________________________________
The architecture of a software intensive system can be defined as the set of relevant design decisions that affect the qualities of the overall system functionality; therefore, architectural decisions are eventually crucial to the success of a software project. The software engineering literature describes several techniques to choose among architectural alternatives, but it gives no clear guidance on which technique is more suitable than another, and in which circumstances. As such, there is no systematic way for software engineers to choose among decision-making techniques for resolving tradeoffs in architecture design. In this paper, we provide a comparison of existing decision-making techniques, aimed to guide architects in their selection. Results show that there is no “best” decision-making technique; however, some techniques are more susceptible to specific difficulties. Hence, architects should choose a decision-making technique based on the difficulties that they wish to avoid. This paper represents a first attempt to reason on meta-decision-making, i.e., the issue of deciding how to decide. Categories and Subject Descriptors: D.2.10 [Software Engineering]: Design – Methodologies General Terms: Design Additional Key Words and Phrases: Decision-making, Architecture, Design decisions. _________________________________________________________________________________________
Authors’ addresses: D. Falessi, Department of Informatics, Systems and Production engineering, University of Rome “TorVergata”, Italy; E-mail: [email protected]; G. Cantone, Department of Informatics, Systems and Production engineering, University of Rome “TorVergata”, Italy; E-mail: [email protected]; Rick Kazman, Software Engineering Institute, Carnegie Mellon University and University of Hawaii, USA; E-mail: [email protected]; Philippe Kruchten, Department of Electrical and Computer Engineering at the University of British Columbia, Canada; E-mail: [email protected]; _________________________________________________________________________________________
1 INTRODUCTION
1.1 Aim and vision
Software architecture is designed during the early phases of the development process and it facilitates or constrains the achievement of specific functional requirements, nonfunctional requirements (quality attributes), and business goals; thus, architectural decisions are crucial to the success of a software-intensive project [Falessi et al. 2007a; Hofmeister et al. 2007]. Therefore, software architects need a reliable and rigorous process for selecting architectural alternatives and ensuring that the decisions made
mitigate risks and maximize profit. In our view a good decision-making technique is one that guides the user towards better, perhaps optimal alternatives, and, at the same time, it is easy to use. The adoption of a poor decision-making technique may imply several difficulties which in turn provoke the selection of a worse alternative. For example, in complex projects, several designers may have different interests or concerns and therefore different views of the system. As a result they adopt different vocabularies; for example they might use a single word to define a quality attribute such as “performance” which means something specific to them (e.g., worst-case latency), but something different to another stakeholder (e.g., an administrator might interpret performance as the efficient use of system resources, and an end user might understand it as referring to the time it takes to learn the system). These differences in interpretation tend to cause misunderstandings [Gilb and Brodie 2005; Moore et al. 2003]. Such misunderstandings may provoke the selection of a wrong alternative, which in turn causes client dissatisfaction and eventually a major rework to satisfy the real stakeholders’ needs.
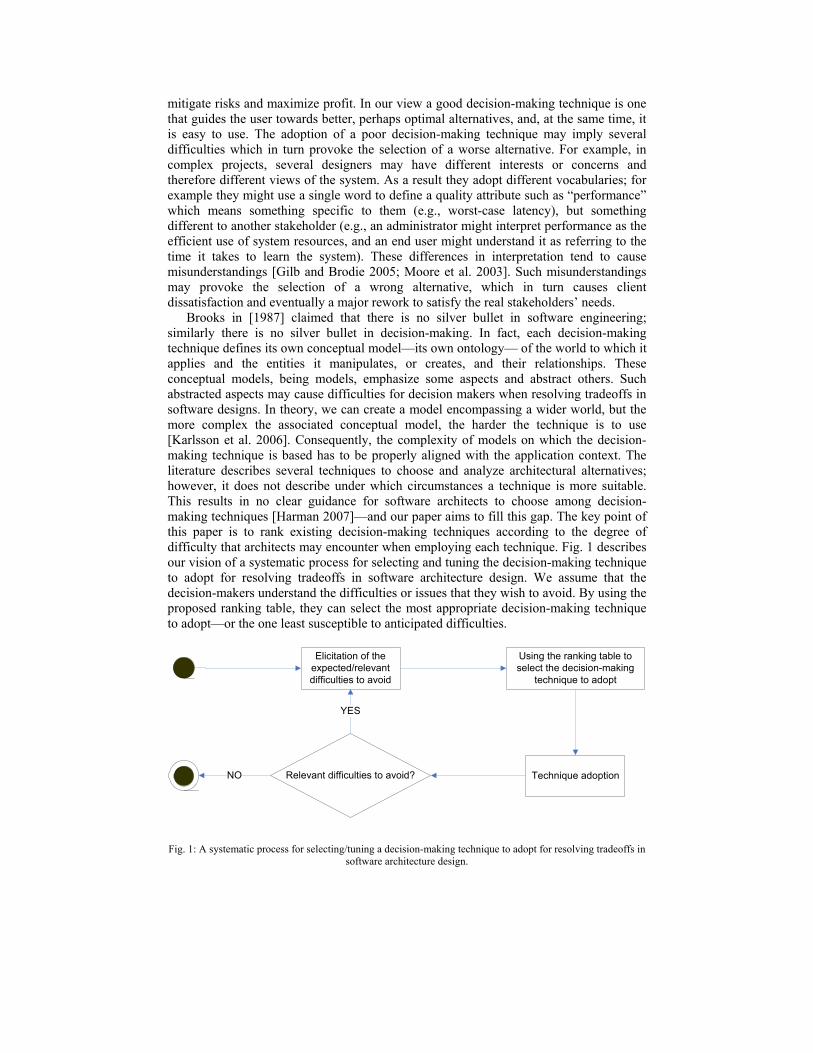
Brooks in [1987] claimed that there is no silver bullet in software engineering; similarly there is no silver bullet in decision-making. In fact, each decision-making technique defines its own conceptual model—its own ontology— of the world to which it applies and the entities it manipulates, or creates, and their relationships. These conceptual models, being models, emphasize some aspects and abstract others. Such abstracted aspects may cause difficulties for decision makers when resolving tradeoffs in software designs. In theory, we can create a model encompassing a wider world, but the more complex the associated conceptual model, the harder the technique is to use [Karlsson et al. 2006]. Consequently, the complexity of models on which the decision-making technique is based has to be properly aligned with the application context. The literature describes several techniques to choose and analyze architectural alternatives; however, it does not describe under which circumstances a technique is more suitable. This results in no clear guidance for software architects to choose among decision-making techniques [Harman 2007]—and our paper aims to fill this gap. The key point of this paper is to rank existing decision-making techniques according to the degree of difficulty that architects may encounter when employing each technique. Fig. 1 describes our vision of a systematic process for selecting and tuning the decision-making technique to adopt for resolving tradeoffs in software architecture design. We assume that the decision-makers understand the difficulties or issues that they wish to avoid. By using the proposed ranking table, they can select the most appropriate decision-making technique to adopt—or the one least susceptible to anticipated difficulties.
Relevant difficulties to avoid?
Elicitation of the expected/relevant difficulties to avoid
YES
Using the ranking table to select the decision-making
technique to adopt
NO Technique adoption
Fig. 1: A systematic process for selecting/tuning a decision-making technique to adopt for resolving tradeoffs in software architecture design.
1.2 Terminology schema
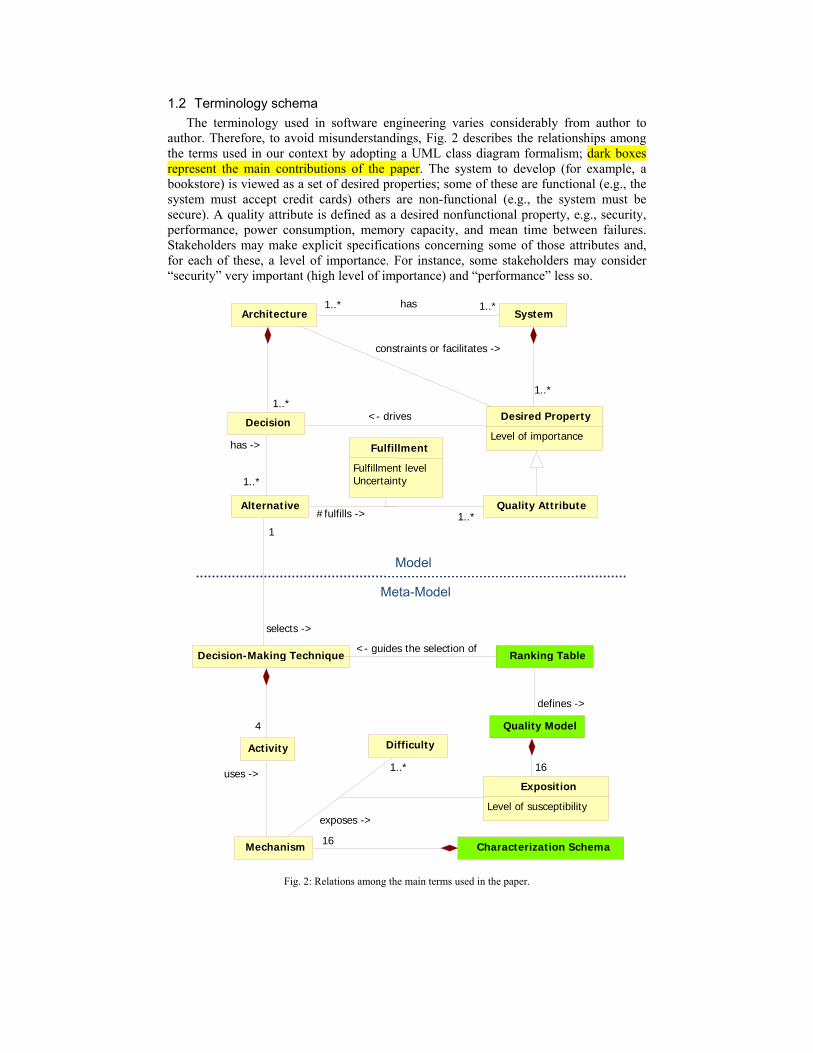
The terminology used in software engineering varies considerably from author to author. Therefore, to avoid misunderstandings, Fig. 2 describes the relationships among the terms used in our context by adopting a UML class diagram formalism; dark boxes represent the main contributions of the paper. The system to develop (for example, a bookstore) is viewed as a set of desired properties; some of these are functional (e.g., the system must accept credit cards) others are non-functional (e.g., the system must be secure). A quality attribute is defined as a desired nonfunctional property, e.g., security, performance, power consumption, memory capacity, and mean time between failures. Stakeholders may make explicit specifications concerning some of those attributes and, for each of these, a level of importance. For instance, some stakeholders may consider “security” very important (high level of importance) and “performance” less so.
Fig. 2: Relations among the main terms used in the paper.
Decision-Making Technique
Activity
Mechanism
Difficulty
exposes ->
1..*
Exposition
Level of susceptibility
Characterization Schema 16
Quality Model
16uses ->
4
System
Desired Property
Level of importance
1..*
Quality Attribute
Architecture
Decision
1..*
Alternative
has ->
1..*
#fulfills -> 1..*
Fulfillment
Fulfillment levelUncertainty
constraints or facilitates ->
<- drives
selects ->
1
has 1..*1..*
Ranking Table
defines ->
<- guides the selection of
Model
Meta-Model

The architecture of a system is a set of decisions; it facilitates or constrains the achievement of the desired system properties. An instance of a decision is, for example, the “type of persistence mechanism” to adopt. An alternative is a choice available for a given decision; for example, the decision “persistence method” could include the alternatives “file system” and “DBMS”. Decisions have different levels of abstraction and there are relations between decisions. An instance of decision that is less abstract than “persistence method” is “type of DBMS”, which then includes the alternatives “RDBMS” and “OODBMS”.
Let us note that, in the current literature, the term decision assumes different meanings; in this paper it represents an issue to solve, rather than an alternative (which is here called alternative). In general, different alternatives are more or less capable of meeting a quality attribute goal; for example, the alternative “DBMS” may be considered more “reliable” and less “cheap” than the alternative “file system”. The level of fulfillment describes the ability of an alternative to meet a specific response level of a desired quality attribute. The uncertainty is defined as the risk of an alternative in providing a specific level of fulfillment. For instance, an innovative middleware may provide higher performance and higher uncertainty than a consolidated technology, where “higher” is a level of fulfillment for the quality attribute “performance” (perhaps defined as number of transactions per second or worst-case latency).
Eventually, for a given system, the architect has a set of quality attributes to take into consideration and to meet as much as possible by making decisions, i.e., selecting the right set of alternatives, see Fig. 5.
Software architecture determines not only how the system should be constructed but also guides its evolution. Therefore, stability and resilience should be taken into consideration while deciding on an architecture [Jazayeri 2002]
A decision-making technique describes a systematic way of choosing an alternative among a finite number of given ones. The decision-making process encompasses several activities; in this paper we focus on four specific activities: quality attribute description, quality attribute importance determination, fulfillment description, and uncertainty description (these will be discussed in detail in Section 3). These activities are enacted in every available (i.e., existent and known) decision-making technique. A mechanism concerns, and eventually prescribes, a specific way for enacting an activity, i.e., it is the how of that activity. Therefore, since decision-making techniques share the same four activities, their differences come from the ways they enact these activities, i.e., from their mechanisms. We call a characterization schema a structure of activities and the related mechanisms, which can differentiate every available decision-making technique. From the point of view of an architect, a decision-making technique is one point in a four-dimensional space, one dimension per activity; from this perspective, a decision-making technique can be seen as a tuple of four mechanisms, one for each activity.
A difficulty (see Section 4) is a problem that an architect may encounter while adopting a decision-making technique. An instance of a difficulty, for example “Insufficient time” discussed in Section 4, is the situation in which the decision-making technique requires too much time to guide the architects in selecting the best alternative, compared with the time allotted for developing the project. All the mechanisms that we have surveyed for a specific architecture design activity are able to perform the activity; they differ in their likelihood to cause specific difficulties. The term level of susceptibility (Section 5) describes the extent to which a mechanism tends to provoke a difficulty. Susceptibility is a (un-)quality attribute of a mechanism; hence, architects should tend to adopt the technique that, as a whole (i.e., as a tuple of four mechanisms), is least susceptible to unwanted difficulties. A quality model (Section 5) describes, for each mechanism, for each difficulty, the level of susceptibility of the mechanism to the difficulty. The application of such a quality model to the available decision-making

techniques provides a ranking table of these techniques (Section 6). The ranking table provides a useful means for selecting and tuning the decision-making technique to adopt, according to unwanted difficulties.
1.3 Approach and structure of the paper
Figure 3 describes the approach we defined to support the selection of a decision-making technique for choosing among architectural alternatives. Activities are depicted in white background rectangles while their outputs are depicted in wavy-bottom rectangles.
Commonalities identification
Does each technique have one mechanism for each activity?
Variabilitity identification
Set of mechanisms and related activities
Characterization Schema
Difficulties identification
YES
Set of difficulties
Relating difficulties to mechanisms
Ranking of mechanisms
Quality model
NO
Ranking of existing techniques
Ranking table
Is each difficulty related to at least one mechnaism?
Applying existing techniques to the schema
YES
Fig. 3: The process enacted to support the selection of a decision-making technique for choosing among architectural alternative. Activities are depicted in white back ground rectangles while their outputs are depicted
in wavy-bottom rectangles.
We began the present work with an analysis of the characteristics of existing decision-
making techniques; in particular, we wanted to identify their commonalities and variability. Hence we defined a set of mechanisms for enacting the activities involved. Then we created a characterization schema by structuring mechanisms and activities with the constraint that each mechanism belongs to one activity. Such a characterization schema is presented in Section 3; it provides a means to differentiate amongst decision-making techniques. Afterwards, we validated the schema by applying to it fifteen existing decision-making techniques (see Section 3.3). We iteratively refined the characterization schema until each of the existing decision-making techniques had exactly one mechanism for each activity. Once the decision-making techniques were clearly differentiated, we determined the criteria to be used to select the most appropriate technique(s). We indentified a set of difficulties that architects may encounter while adopting choosing

among architectural alternative (Section 4). Then, according to our industrial experience and the literature we related the difficulties to the mechanisms of the characterization schema. We iteratively refined the set of difficulties and the characterization schema until each difficulty was related to at least one mechanism and vice versa. Again, according to our industrial experience and the literature (Section 5), we ranked the mechanisms according to their level of susceptibility to a given difficulty. This eventually defined a quality model of decision-making techniques (Section 6). Finally, because each of the existing decision-making technique is a given combination of (already ranked) mechanisms, we automatically ranked each technique according to its level of susceptibility to a given difficulty. This eventually defined a ranking table of decision-making techniques that supports architects in selecting the most suitable decision-making technique for resolving tradeoffs during the software architecture design process (Section 7). To help readers who are unfamiliar with software architecture, Section 2 paves the way by introducing some basic concepts.
2 BACKGROUND
2.1 Introduction to software architecture
Software architecture has emerged as an important field of software engineering for managing the realm of large-system development and maintenance [Bass et al. 2003; Booch 2007; Shaw and Clements 2006; Taylor et al. 2009]. The main intent of software architecture is to provide intellectual control over a sophisticated system of enormous complexity [Kruchten et al. 2006].
There are many definitions of software architecture [SEI 2007]. The Rational Unified Process (RUP) [Kruchten 2003], building upon [Shaw and Garlan 1996], defines a software architecture “as the set of significant decisions about the organization of a software system: selection of the structural elements and their interfaces by which a system is composed, behavior as specified in collaborations among those elements, composition of these structural and behavioral elements into larger subsystem, architectural style that guides this organization. Software architecture also involves usage, functionality, performance, resilience, reuse, comprehensibility, economic and technology constraints and tradeoffs, and aesthetic concerns” (PAGE XXX).
Software architecture is developed during the early phases of the software development process. Therefore, it significantly constrains and facilitates the achievement of requirements and business goals. Hence, reviewing the software architecture represents a valid means to check the system conformance and to reveal any potentially-missed objectives early on [Maranzano et al. 2005].
Every software system has a software architecture; it can be implicit or explicit, i.e., documented and specifically designed to fulfill predefined business goals and quality requirements. When a system needs to be maintained it may be necessary to spend considerable effort in documenting the underlying software architecture even if it has to be recovered (reverse engineered) [Ding and Medvidovic 2001].
2.2 Software architecture design
Software architecture design methods aim to derive the software architecture from the functional and quality requirements. There are three main factors that drive software architecture design [Kruchten 1995]: reuse, method, and intuition, as described below.
Reuse: Architecting is a difficult task that reuse can help simplify. The fact that a system was successful and it used a certain component, rule, or responsibility argues for the reuse of such issues. The source of the reuse can be an earlier version of the system, another system sharing key characteristics, architectural patterns [America et al. 2003], or organization-wide experiences [Basili et al.
1992]. Domain-specific Software Architecture [Li et al. 1999] and Product Line Architecture [Bosch 2000; Clements and Northrop 2002; Jazayeri et al. 2000] are examples of two successful marriages between software architecture and reuse.
Method: There are a number of languages, process models, and methods that prescribe a systematic technique for bridging the considerable gap between software architecture and requirements.
Intuition: Many architects rely on the invention of software architecture elements and their relations purely based on their own experience.
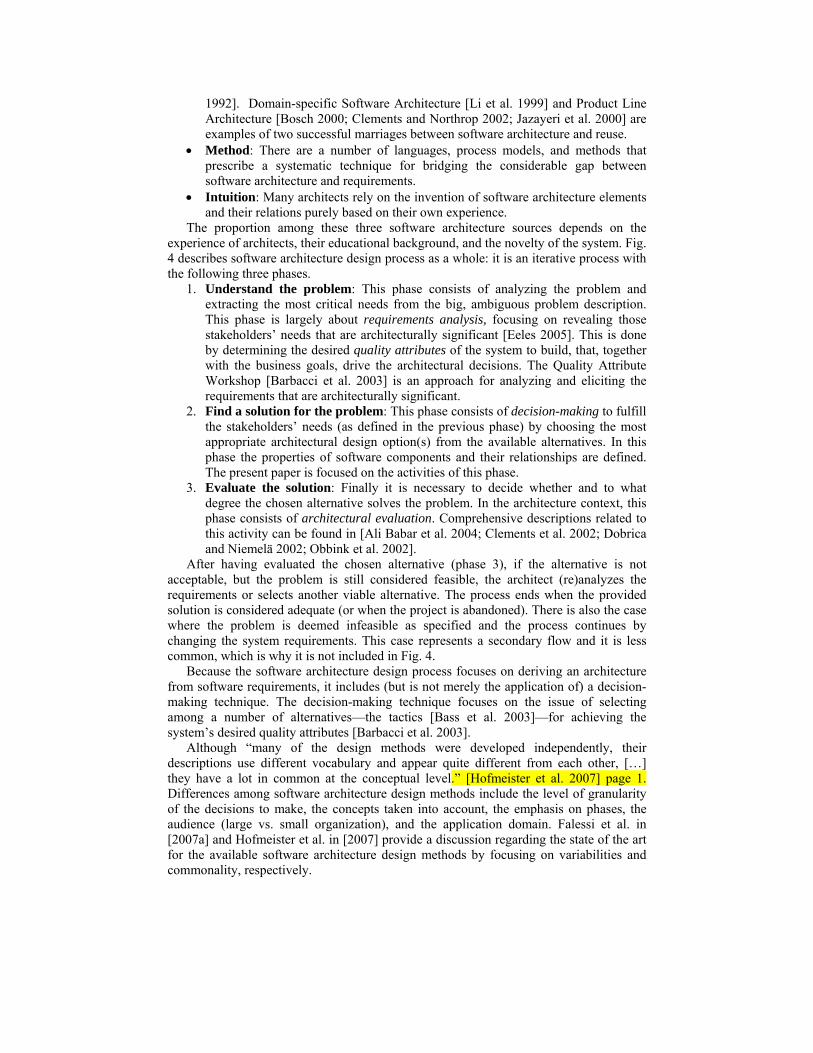
The proportion among these three software architecture sources depends on the experience of architects, their educational background, and the novelty of the system. Fig. 4 describes software architecture design process as a whole: it is an iterative process with the following three phases.
1. Understand the problem: This phase consists of analyzing the problem and extracting the most critical needs from the big, ambiguous problem description. This phase is largely about requirements analysis, focusing on revealing those stakeholders’ needs that are architecturally significant [Eeles 2005]. This is done by determining the desired quality attributes of the system to build, that, together with the business goals, drive the architectural decisions. The Quality Attribute Workshop [Barbacci et al. 2003] is an approach for analyzing and eliciting the requirements that are architecturally significant.
2. Find a solution for the problem: This phase consists of decision-making to fulfill the stakeholders’ needs (as defined in the previous phase) by choosing the most appropriate architectural design option(s) from the available alternatives. In this phase the properties of software components and their relationships are defined. The present paper is focused on the activities of this phase.
3. Evaluate the solution: Finally it is necessary to decide whether and to what degree the chosen alternative solves the problem. In the architecture context, this phase consists of architectural evaluation. Comprehensive descriptions related to this activity can be found in [Ali Babar et al. 2004; Clements et al. 2002; Dobrica and Niemelä 2002; Obbink et al. 2002].
After having evaluated the chosen alternative (phase 3), if the alternative is not acceptable, but the problem is still considered feasible, the architect (re)analyzes the requirements or selects another viable alternative. The process ends when the provided solution is considered adequate (or when the project is abandoned). There is also the case where the problem is deemed infeasible as specified and the process continues by changing the system requirements. This case represents a secondary flow and it is less common, which is why it is not included in Fig. 4.
Because the software architecture design process focuses on deriving an architecture from software requirements, it includes (but is not merely the application of) a decision-making technique. The decision-making technique focuses on the issue of selecting among a number of alternatives—the tactics [Bass et al. 2003]—for achieving the system’s desired quality attributes [Barbacci et al. 2003].
Although “many of the design methods were developed independently, their descriptions use different vocabulary and appear quite different from each other, […] they have a lot in common at the conceptual level.” [Hofmeister et al. 2007] page 1. Differences among software architecture design methods include the level of granularity of the decisions to make, the concepts taken into account, the emphasis on phases, the audience (large vs. small organization), and the application domain. Falessi et al. in [2007a] and Hofmeister et al. in [2007] provide a discussion regarding the state of the art for the available software architecture design methods by focusing on variabilities and commonality, respectively.

System Requirements & Project context
Evaluation description
Architecture acceptable?
Requirements Analysis
Architectural significant aspects
Decision-Making
Candidate SW components and
Inter-relations
YES
Architectural Evaluation
NO
Fig. 4: The software architecture design process.
To define the architecture of a software system, the architects have to balance the many forces influencing the system development, as well as to work with all the stakeholders. The software architect “sits in between” all the stakeholders to reconcile their needs and wants as Fig.5. shows.
Design decisions are the core of software architecture [Bosch 2004; Jansen and Bosch 2005]. The life of a software architect is a long, and sometimes painful, succession of suboptimal decisions made partly in the dark; this is due to the following reasons:
Requirements are frequently captured informally while software architecture is specified in formally [Grünbacher et al. 2004]. Consequently, there is a semantic gap to deal with.
Quality attribute requirements are difficult to specify in an architectural model [Grünbacher et al. 2004].
Software is often developed in an iterative way. Certain types of requirements cannot be well defined in the early development phases [Nuseibeh 2001]. This implies that sometimes architects have to make their decisions based upon vague requirements.
Architectural decisions are hard to change after they are made because subsequent decisions are taken based on them; for example, detailed design and programming.
Stakeholders dealing with software architecture issues view the system from different perspectives; this usually implies conflicting goals and expectations among developers and even differences in terminology. Therefore, architects are requested to find the right tradeoff by balancing the many forces influencing the system development, as well as to work with all the stakeholders.

Software architecture determines not only how the system should be constructed but also guides its evolution. Therefore, stability and resilience should be taken into consideration while deciding on an architecture [Jazayeri 2002]
2.3 Resolving architecture tradeoffs through multi-attribute decision-making techniques
There are three main types of decision-making techniques that are commonly used in software engineering: Keeping the first available alternative: Some of the design decisions taken during
the development process do not include any consideration of, or selection among, alternatives. Designers sometimes take the first alternative that seems to meet the given requirements without searching for better ones [Li et al. 2009]. Such an approach supports the project schedule, but not the optimization of the overall system design. This is known as naturalistic decision-making, where decisions are studied as the product of intuition, mental simulation, metaphor, and storytelling [Klein 1999].
Selecting among a finite number of alternatives: Typically, the architect has a finite set of alternatives to choose from. The so called multi-attribute decision-making techniques address the issue of selecting among a finite number of alternatives. This is the classic and rational approach promoted by any textbook on engineering.
Selecting among an infinite amount of alternatives: Some decisions in software engineering consist of determining the right balance among conflicting objectives. For example, finding the right balance between cohesion and coupling is a typical dilemma when defining classes in an object-oriented application; in this case, the number of available alternatives (i.e., the feasible classes) is practically infinite. The field of multi-objective decision-making techniques (and, more generally, the optimization research field) provides guidelines for selecting among an infinite number of available alternatives based on the definition of goals and constraints.
In the remainder of the paper, we focus on multi-attribute decision-making techniques because these address the issues of selecting among a finite amount of available alternatives, which is the most common case during software architecture design

EndEnd--useruser
CustomerCustomer
DeveloperDeveloper
Sales and fieldSales and fieldsupportsupport
MaintainerMaintainer
DevelopmentDevelopmentmanagermanager
SystemSystemadministratoradministrator
Functionality
ArchitectArchitect
Ease of use
Performance and throughput
Reliability
Ease of customization
Price
Development costs, skills
On time delivery
Stability and maintainability
Ease of integration
Ease of diagnosing problems
Ease of introducing modifications
Testability and traceability
Structure and dependencies between parts
Ease of installation
?
Fig. 5: The architect’s balancing art.
2.4 Related work
Many previous studies helped us to shape the present work. However, to the best of our knowledge, no study has provided systematic guidance on how to select a decision-making technique for choosing among design alternatives.
We have been mainly inspired by the SEI report by Moore et al. [2003]. In this report they discuss how they changed a decision-making technique (i.e., the first version of CBAM from [Kazman et al. 2001]) to avoid specific difficulties. Our work shares similarities with the Moore’s but we take into account a larger spectrum of difficulties and variability in decision-making techniques. Moreover, we judge the second version of CBAM [Moore et al. 2003] as being less susceptible than the first one [Kazman et al. 2001] to the set of difficulties that are common in the SEI practices.
Let us note that the ATAM [Bass et al. 2003] deals with architectural trade-offs, quality attribute utility trees and sensitivity points. The ATAM does a good job of differentiating quality attributes from both a business and technical perspective by assigning priorities to particular attributes. However, because the CBAM includes and extends on the ATAM, in the remainder of the paper we will focus on the former.

3 A CHARACTERIZATION SCHEMA FOR DECISION-MAKING TECHNIQUES
3.1 Introduction
To reveal commonalities and variability among decision-making techniques for software architecture design, this section provides a characterization schema. Fig. 6 describes the proposed characterization schema by using a feature tree model [Gomaa 2004; Jazayeri et al. 2000]. Fig. 3 described a number of phases involved in architecture design; Fig. 6 focuses on the decision-making phase.
To describe the items in Fig. 6, we proceed first by depth, i.e., by reviewing all the mechanisms available for each available activity to be performed. Accordingly, in the remainder of this section, the name of an activity (i.e., one out of four activities) is used as the title of a sub-section; the names of the related mechanisms are printed in bold.
3.2 Elements
3.2.1 Quality attribute description When making a decision, the architect must take into consideration several
stakeholders who usually desire different quality attributes for the system exhibit, such as performance, modifiability, cost, etc. To avoid misinterpretations, it is extremely important that stakeholders have a common and clear understanding of every quality attribute. Following, we show four different mechanisms for describing the desired quality attributes, which we have empirically determined from an examination of existing decision-making techniques.
Just a term. The quality attribute of an issue to solve (or optimize) is described by using a term. For instance, in the technique that Chung et al. proposed in [1999], the term “performance” describes a quality attribute. In general, using just a term requires little effort from, and little interaction among, the stakeholders but as stated in the introduction, the use of this term may cause misunderstandings [Gilb and Brodie 2005; Moore et al. 2003]. Hence, the use of just a term for a quality attribute description is only effective in a context where all the stakeholders have the same understanding of the issue to solve.
Term and use case. The quality attribute of an issue is related to the description of an appropriate use case. For instance, Kontio in [1996] proposed a technique in which both a term (e.g., performance) and a system use case are utilized to describe a quality attribute. Using term and use case for describing attributes should help in avoiding misunderstandings about the meaning of quality attributes [Moore et al. 2003], but it might require stakeholders to spend significant effort (in analyzing the given use case). Large and/or complex projects require designers with specific skills and responsibilities; in such a context, different stakeholders have different views of the system and therefore they would mean different concepts when using a term without the context of a use case.
Term and measure. The quality attribute of the issue to solve (or optimize) is described by using a term and a measure. For instance, in the technique that Kazman et al. proposed in [2001], the term “performance” and the measurement unit “seconds” are utilized to describe a quality attribute. While this type of attribute description requires little effort and limited interactions among stakeholders, it may avoid misunderstandings regarding perceptions behind a term [Gilb and Brodie 2005].
Term, use case, and measure. The quality attribute of the issue is related to a scenario description and a related measure. For instance, Moore at al. in [2003] proposed a technique in which a term (e.g., performance), a specific use case of the system, and a measurement unit (e.g., seconds) are utilized to describe a quality attribute. While this type of attribute description again requires stakeholders to spend significant effort in analyzing the related use case, it helps to avoid misunderstandings with regard to the quality attribute’s meaning and perceptions behind the term [Gilb and Brodie 2005; Moore et al. 2003; Ozkaya et al. 2008].

Fig. 6 A characterization schema of decision-making techniques for resolving tradeoffs in software architecture design.
= A adopts o C
Decision- making technique
Fulfillment description
A
C
B
= A adopts B and A
C
B
Term + Use case
Term
Term + Measure
Term + Measure + Use case
Quality attribute description
Mechanism Activity Phase
Quality attribute importance
Problem space
Solution space
Utility curve
Elicited weight
Direct
No Articulation
Elicited ratio
Direct ratio
Order
On/Off
Uncertainty description
eAs q quality attribute
Related to each QA
Stakeholders’ disagreement
None
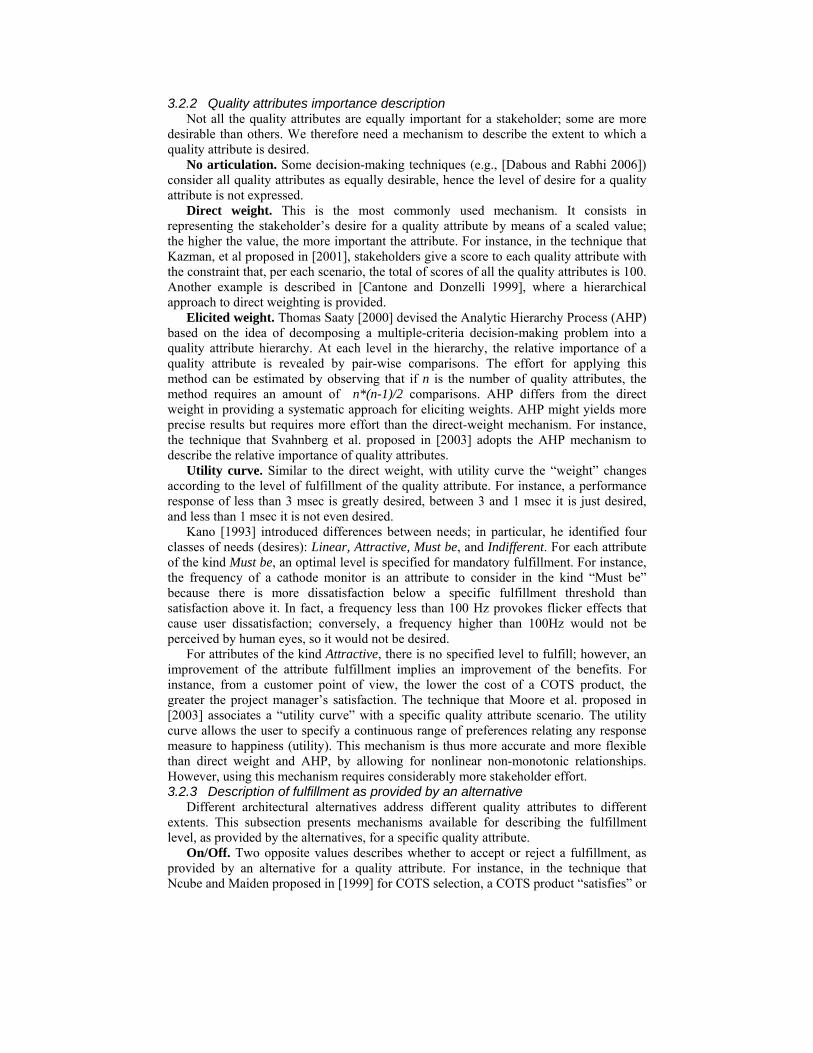
3.2.2 Quality attributes importance description Not all the quality attributes are equally important for a stakeholder; some are more
desirable than others. We therefore need a mechanism to describe the extent to which a quality attribute is desired.
No articulation. Some decision-making techniques (e.g., [Dabous and Rabhi 2006]) consider all quality attributes as equally desirable, hence the level of desire for a quality attribute is not expressed.
Direct weight. This is the most commonly used mechanism. It consists in representing the stakeholder’s desire for a quality attribute by means of a scaled value; the higher the value, the more important the attribute. For instance, in the technique that Kazman, et al proposed in [2001], stakeholders give a score to each quality attribute with the constraint that, per each scenario, the total of scores of all the quality attributes is 100. Another example is described in [Cantone and Donzelli 1999], where a hierarchical approach to direct weighting is provided.
Elicited weight. Thomas Saaty [2000] devised the Analytic Hierarchy Process (AHP) based on the idea of decomposing a multiple-criteria decision-making problem into a quality attribute hierarchy. At each level in the hierarchy, the relative importance of a quality attribute is revealed by pair-wise comparisons. The effort for applying this method can be estimated by observing that if n is the number of quality attributes, the method requires an amount of n*(n-1)/2 comparisons. AHP differs from the direct weight in providing a systematic approach for eliciting weights. AHP might yields more precise results but requires more effort than the direct-weight mechanism. For instance, the technique that Svahnberg et al. proposed in [2003] adopts the AHP mechanism to describe the relative importance of quality attributes.
Utility curve. Similar to the direct weight, with utility curve the “weight” changes according to the level of fulfillment of the quality attribute. For instance, a performance response of less than 3 msec is greatly desired, between 3 and 1 msec it is just desired, and less than 1 msec it is not even desired.
Kano [1993] introduced differences between needs; in particular, he identified four classes of needs (desires): Linear, Attractive, Must be, and Indifferent. For each attribute of the kind Must be, an optimal level is specified for mandatory fulfillment. For instance, the frequency of a cathode monitor is an attribute to consider in the kind “Must be” because there is more dissatisfaction below a specific fulfillment threshold than satisfaction above it. In fact, a frequency less than 100 Hz provokes flicker effects that cause user dissatisfaction; conversely, a frequency higher than 100Hz would not be perceived by human eyes, so it would not be desired.
For attributes of the kind Attractive, there is no specified level to fulfill; however, an improvement of the attribute fulfillment implies an improvement of the benefits. For instance, from a customer point of view, the lower the cost of a COTS product, the greater the project manager’s satisfaction. The technique that Moore et al. proposed in [2003] associates a “utility curve” with a specific quality attribute scenario. The utility curve allows the user to specify a continuous range of preferences relating any response measure to happiness (utility). This mechanism is thus more accurate and more flexible than direct weight and AHP, by allowing for nonlinear non-monotonic relationships. However, using this mechanism requires considerably more stakeholder effort. 3.2.3 Description of fulfillment as provided by an alternative
Different architectural alternatives address different quality attributes to different extents. This subsection presents mechanisms available for describing the fulfillment level, as provided by the alternatives, for a specific quality attribute.
On/Off. Two opposite values describes whether to accept or reject a fulfillment, as provided by an alternative for a quality attribute. For instance, in the technique that Ncube and Maiden proposed in [1999] for COTS selection, a COTS product “satisfies” or

“does not satisfy” a given requirement. Order. Fulfillment is roughly measured by an ordinal scale, by using some terms or
symbols, including digits, in a given order: e.g., terms like {poor, interesting, good, excellent} or symbols like {--, -, +, ++} as in [Chung et al. 1999]). This mechanism is particularly suitable where the alternatives are at a high level of abstraction and it is not yet possible to provide more precise measures for fulfillment. For instance, a higher level alternative like an architectural pattern can be coarsely considered as “good” or “bad” with respect to a quality attribute. This is due to the fact that we cannot relate an architectural pattern to a more precise quality attribute measurement model because lower-level design decisions (e.g., number and type of elements in the style, topology, programming language, algorithm, and other implementation decisions) would affect the level of fulfillment of such a quality attribute [Chung et al. 1999]. The main drawback of this mechanism is to provide excessive coarse-grained descriptions that, in turn, would not differentiate alternatives.
Direct ratio. The level of fulfillment that an alternative provides for a quality attribute is described by using a ratio (or a percentage) which is much more accurate than the ordinal scale. Using a ratio is particularly suitable in cases where the quality attribute to fulfill is not atomic, i.e., it makes sense to decompose it in subparts [Cantone and Donzelli 1999]. For instance, the technique that Andrews et al. proposed in [2005] uses a ratio in the range from 0 to 1 for describing the ability of an alternative to fulfill a given quality attribute.
Elicited ratio. The AHP provides a further mechanism to describe the ability of an alternative to fulfill a quality attribute. As already mentioned, AHP differs from the direct ratio in offering a rigorous approach for the ratio elicitation; consequently, it might yields finer results. However, AHP requires more effort than a direct ratio. For instance, the technique that Kontio proposed in [1996] for COTS selection adopts AHP to determine fulfillment level provided by an alternative. 3.2.4 Uncertainty description
It is important to quantify the uncertainty (i.e. the reliability) of an alternative to provide a specific level of fulfillment. As a matter of fact, different situations lead decision makers to accept different levels of uncertainty. For instance, risky alternatives should be avoided when dealing with safety-critical systems. In general, the uncertainty associated with an alternative may depend on well-understood properties (e.g., the mean time to failure of using a specific LAN) or the level of understanding that decision makers have about that alternative (e.g., it is believed that a new middleware may provide a better response time and less reliability, but, since the middleware is new, this belief has not been rigorously tested). The uncertainty associated with an alternative can be described by adopting one of the following mechanisms:
Uncertainty is not expressed. See for instance Bandor in [2006]. The main drawback of this mechanism is that you may have two alternatives showing the same performance but different levels of uncertainty. In such a situation, without taking into account the uncertainty factor, although they seem to be equivalent alternatives, in reality one is objectively better than the other.
Uncertainty is inferred from disagreement among decision makers. As Svahnberg et al. proposed in [2003], the decision makers can express the level of fulfillment of a specific decision (without expressing the level of confidence in such estimation). Later, the uncertainty related to such a decision is inferred from the level of disagreement among the decision makers.
Uncertainty is related to each quality attribute. As Cavanaugh and Polen proposed in [2002], the amount of uncertainty of an alternative is proportional to the reciprocal of the probability that such an alternative provides a given level of fulfillment for a specific quality attribute. For instance, the solution of adopting a LAN would have a low

uncertainty associated to “high compatibility” while there is a medium uncertainty of achieving “high security”. Note how this mechanism for describing the uncertainty does not change according to the amount of knowledge on the solution performance (i.e., the security of the LAN does not improve while improving the knowledge of decision makers on it).
Uncertainty as a quality attribute. As Gilb and Brodie proposed in [2005], uncertainty can be used as a quality attribute representing the amount of knowledge and the degree of uncontrollable variability of the solution’s performance. For instance, the solution of adopting a LAN would have a low level of uncertainty because such a technology is well understood.
3.3 Validation: characterizing actual decision-making techniques
We have found several techniques for choosing among architecture alternatives [Al-Naeem et al. 2005; Andrews et al. 2005; Chung et al. 1999; Dabous and Rabhi 2006; Gilb and Brodie 2005; Kazman et al. 2001; Moore et al. 2003; Svahnberg et al. 2003] and COTS [Bandor 2006; Cavanaugh and Polen 2002; Kontio 1996; Lozano-Tello and Gómez-Pérez 2002; Ncube and Maiden 1999; Wanyama and Far 2005], respectively.
Techniques for architectural design and COTS selection share the following characteristics:
They involve several stakeholders with different knowledge, views, and responsibilities for the system.
They deal with competing and conflicting objectives. There is a level of uncertainty both in the descriptions of requirements and in
their associated solutions. The decisions taken have strong interdependencies.
Table I shows fifteen actual decision-making techniques (columns) and their mechanisms (rows) according to the provided characterization schema. The aims of such a table are:
Validating the characterization schema for completeness and correctness: Each technique has exactly one mechanism for each activity of the characterization schema i.e., it is one point in the four dimensional space of decision-making.
Validating the characterization schema for lightness: Each mechanism of the proposed characterization schema has been used by at least one existing decision-making technique. Hence the characterization schema is “light” in that it contains just enough mechanisms, and no more.
Validating the characterization schema for the ability to differentiate techniques: There is no technique that has the same set of mechanisms i.e., each technique is represented by a distinct point in the four dimensional space of decision-making. Therefore, the characterization schema provides a means to differentiate among available decision-making techniques.
Revealing feasible techniques: Not all the four-tuples of mechanisms are actually used; in fact, the existent techniques reveal feasible four-tuples of mechanisms.

Table I Part 1: Applying our proposed characterization schema to eight decision-making techniques (part one relative to software design). An x denotes the adoption of a given mechanism (row) by a given technique
(column).
Reference (Andrews et
al., 2005)
(Kazman et al., 2001)
(Moore et al., 2003)
(Dabous and Rabhi,
2006)
(Gilb and Brodie, 2005)
(Al-Naeem et al., 2005)
(Svahnberg et al., 2003)
(Chung et al., 1999)
Name of the decision-making
technique
A Framework for design tradeoffs
CBAM 1 CBAM 2Dabous &
RabhiImpact
EstimationQuality driven
Quality driven
Softgoals
Type Design Design Design Design Design Design Design Design
Just a term x x x xTerm and use-
caseTerm and measure x x
Term, use-case, and measure x x
No articulation x x
Direct weight x x
Elicited weight x x x
Utility curve x
On/Off x
Order x
Direct ratio x x x x
Elicited ratio x x
Not expressed x x x x
Inferred from disagreement x x x
Related to each quality attribute x
Quality attribute
Decision-making techniques
Quality attribute description
Quality attribute importance description
Fulfillment description as provided by an
alternative
Uncertainty description

Table I Part 2: Applying our proposed characterization schema to eight decision-making techniques (part two relative to COTS selection). The x denotes the adoption of a given mechanism (row) by a given technique
(column).
Reference
(Lozano-Tello and Gómez-
Pérez 2002)
(Cavanaugh and Polen, April 2002)
ISO(Wanyama and Far,
2005)
(Kontio, 1996)
(Ncube and Maiden, 1999)
(Bandor, 2006)
Name of the decision-making
technique BAREMO CEP ISO 9126 NeMo-CoSe OTSO PORE
Quantitative methods
TypeCOTS
SelectionCOTS
SelectionCOTS
SelectionCOTS
SelectionCOTS
SelectionCOTS
SelectionCOTS
Selection
Just a term x x x x x
Term and use-case
x
Term and measure
Term, use-case, and measure
x
No articulation x
Direct weight x x x x
Elicited weight x x
Utility curve
On/Off x
Order x x
Direct ratio x x
Elicited ratio x
Not expressed x x x x x
Inferred from disagreement
x
Related to each quality attribute
Quality attribute x
Fulfillment description as provided by an
alternative
Uncertainty description
Decision-making techniques
Quality attribute description
Quality attribute importance description
3.4 Limitations
As with any attempt to characterize a complicated issue, the proposed characterization schema has some limitations in describing the process of decision-making. In particular, it doesn’t take into account the following issues:
How to apply a given mechanism (i.e., how to find the fulfillment level, how to find the amount of risk, etc.).
How to take into account relations among decisions [Falessi et al. 2006; Kruchten 2004; Zimmermann et al. 2009].
How to capture and share software architecture design rationale [Falessi et al. 2006; Falessi et al. 2008; Kruchten et al. 2009; Schuster et al. 2007].
How to optimize the decision process for a given architectural style (e.g. SOA) [Zimmermann et al. 2007].
How to search for alternatives [Kruchten 1995]. How to empirically evaluate the goodness of an alternative [Falessi et al. 2010;
Falessi et al. 2007b]. Social concerns [Klein 1999].
However, the issues we left aside are not central to the purpose of this paper. As shown above, the characterization schema which resulted is correct, complete, “light” and capable to differentiate among techniques.
4 DIFFICULTIES IN SELECTING AMONG SOFTWARE ARCHITECTURE
ALTERNATIVES
Section 3.3 provided a way to differentiate among techniques. The question that naturally arises is then: how to choose among the techniques and, most importantly, based on what criteria? The software engineering literature neglects a comprehensive description of quality attributes for decision-making techniques. In our view a good decision-making technique is one that avoids the selection of a worse alternative and, at the same time, it is easy to use. Therefore, the question is: What might cause the decision makers to select a wrong alternative, and what does it mean for a decision-making technique to be “easy to use”? According to our personal experience in architecting software intensive systems, we will answer these questions by describing practical difficulties, and their related causes, that decision makers may encounter when selecting from alternatives. In particular, each of the following subsections addresses a specific difficulty—named by the subsection title— which is given from the point of view of the decision maker. The causes of the difficulty are highlighted in bold.
4.1 Quality attribute meaning
Large or complex projects require the involvement of several designers, each with different skills, responsibilities, knowledge, and views of the system. Therefore, they often do not share a common understanding of the terms involved. This may be a source of difficulty.
Difficulty: Perception of a term. Because large systems provide different kinds of functionality, it is possible that different stakeholders use the same term to refer to different system issues. Example: Stakeholder A is in charge of the “response time” for system service α, and stakeholder B is in charge of the “energy consumption” for system service β. By using just the term “performance”, stakeholders A and B could mean the “performance” of two different system services, e.g., α and β, respectively.
4.2 Solution properties interpretation
Difficulty: Coarse-grained indication. The grain utilized for describing the satisfaction of the stakeholder for an alternative (level of fulfillment) is so coarse that it neglects relevant details. Example: By adopting a yes/no scale, the costs of two alternatives could be judged both as acceptable, despite the fact that, by a finer scale, one solution might be two times less expensive than the other one. By using a yes/no scale such a difference would not influence the decision-making process, which might select the worst solution.
Difficulty: Value perception. According to Gilb “non-numeric estimates of impact are difficult to analyze and improve upon.” [Gilb and Brodie 2005] page 278. Example: Consider a stakeholder who is interested in the usability of a system. The stakeholder wants the system to be “highly” usable. But, unless this is quantified it is difficult to know whether the goal has or has not been achieved, or whether any given change to the system would make it “more usable”.
Difficulty: Underestimation of the uncertainty. According to Gilb “The uncertainty estimate is at least as important as the main estimate” [Gilb and Brodie 2005] page 278. Example: Assume that a new alternative is available, e.g., a middleware that cuts annual

costs in half. Also assume that stakeholders decide to choose this new alternative, despite its associated risks. In practice, the real cost could double due, for example, to the complexity of use and the programmer’s inexperience in building components on that middleware.
4.3 Solution selection
After applying a decision-making technique, the suggested solutions are described by a palette that makes it difficult to select the most suitable solution.
Difficulty: Too complex a description. The output of a decision-making technique might be too complex to allow the selection of the most suitable solution. Example: The decision is characterized by twenty alternatives and thirty quality attributes; the fulfillment of each attribute is measured on an ordinal scale from 1 to 1000. Hence, to make decision, stakeholders might have to analyze 30 quality attributes each in the range from 1 to 1000 per 20 times, which might result in a task that is too complex to complete.
Difficulty: Too simple a description (Multiple suitable solutions). The output of a decision-making technique might propose too many solutions with the same score. Example: Let three alternatives and three quality attributes (e.g., cost, efficiency, and reliability) characterize the current decision, with yes/no scales used for fulfillments; e.g., let yes be cost less than Euro 1,000.00, transaction, response time less than 1 sec., and mean time to failure less than 8 months, respectively. It is possible that all the three alternatives satisfy all the quality attributes, based on the output of a given decision-making technique.
4.4 Stakeholders disagreement
The suggested alternative does not fulfill the expectations of the stakeholders because the decision-technique improperly models their needs.
Difficulty: Coarse-grained description of needs. The needs are described so coarsely as to make irrelevant differences between relevant attributes. In other words, stakeholders are not allowed to prefer an alternative which does not satisfy (to some limited extent) one or more quality attributes but which does satisfy some other ones to a large extent. Example: There are three quality attributes to describe a decision (e.g., cost, efficiency, and reliability), and yes/no scales are used to describe their fulfillment levels. The technique may not suggest an alternative providing the following fulfillment levels: an efficiency of 1% less than the requested efficiency, but with reliability of 95% or greater, and costs 95% lower than the suggested alternatives.
Difficulty: Linear and monotonic satisfaction. To cope with complexity, the satisfaction of each quality attribute is modeled to grow linearly as its fulfillment grows [Keeney and Raiffa 1976]. Example: Concerning COTS selection, let a decision-making technique assume both reliability and energy consumption as the key quality attributes, with energy consumption being less important than reliability. Consider a certain case where alternative A is characterized by 10 years mean time to failure and 800 nWh energy consumption. If there is no practical need for a mean time to failure higher than 6 years, stakeholders would prefer alternative B that provides 6 years mean time to failure and 700 nWh energy consumption. However, a decision-making technique that models fulfillment as a linear monotonic function will never suggest the selection of alternative B.
Difficulty: Insufficient time. During the development process, a decision might be made when there is limited amount of time to analyze it. Stakeholders might have insufficient time to interact for decision-making. Example: Stakeholders have just a few days before the deadline of an important release, and an algorithm has to be chosen or changed, and then implemented. The time available for stakeholder input is insufficient to allow them to carefully consider all the quality attributes related to the available algorithms.
5 QUALITY MODEL OF DECISION-MAKING TECHNIQUES
Table II gives references from the research literature describing mechanisms and difficulties in decision-making: a cell is a set of references, which describe the susceptibility of a mechanism (row) to a specific difficulty (column). Table III provides a quality model for decision-making techniques (indeed, of mechanisms) by synthesizing on Table II. In fact, Table III shows mechanisms per activity, sorted according to how susceptible they are to a specific difficulty from Table II. Of course, for unreferenced activities, i.e., empty cells in Table II, Table III does not differentiate among the mechanisms. In other words, the value of each cell in Table III describes, using an ordinal scale, the susceptibility of a specific mechanism (row) to a specific difficulty (column) for a given activity. For instance, a cell (r, c) with value “1st” represents that r is a first (i.e., top, best, most suitable) mechanism that is available for avoiding the difficulty c while enacting the indicated activity (i.e., int(r/4)+1). Note that the type of scale adopted in Table III (i.e., the ordinal scale) is not by choice but a result. As a matter of fact, in absence of further empirical evidence, there is no chance to utilize richer scales, than the ordinal one, for descriptive measurements of mechanisms. Table III expresses the (un-)quality (i.e., susceptibility to a difficulty) of any decision-making technique (i.e., of any combination of mechanisms); therefore Table III is a quality model of decision-making techniques. To get a useful quality model, we have refined on difficulties mentioned in the research literature with the aim of achieving the following characteristics:
Each mechanism is associated with one or more difficulties encountered while applying decision-making techniques in a software context.
Each difficulty is associated with one or more mechanisms; hence, it is associated with one or more activities.
To explain how we came up with the content of Table III, we give detailed description of the reasoning we applied for synthesizing the levels of susceptibility to the difficulty insufficient time (column of Table II) with respect to the mechanisms for describing the quality attribute importance (row of Table II). It is obvious that the more time a mechanism requires, the more it is susceptible to the difficulty insufficient time. Therefore, we reason on how much time each of the available mechanisms would require. Consider taking a decision with n quality attributes. It is evident that the fastest way to assign importance to the quality attributes is not doing it (skip the phase); this mechanism requires 0 assignments. The second fastest mechanism is directly assigning a weight to a quality attribute; this mechanism requires n assignments. Eliciting the weight by using AHP, as mentioned above, would require n · (n-1)/2 comparisons. Therefore AHP requires more time than “direct weight” when n · (n-1)/2 >n, i.e., when the number of quality attributes (n) is higher than 3, i.e., the majority of the time. A utility curve is composed of ranges; each range has a level of utility. Let x be the number of ranges used to express the importance of each quality attributes; using utility curve requires x · n assignments. Since x is usually around 4, then using the utility curve requires more time than elicited weight when 4n > n · (n-1)/2 i.e., when the number of quality attributes (n) is lower than 9, i.e., the majority of the time. Based on such a reasoning activity we have ranked the mechanisms No articulation, Direct weight, Elicited weight and Utility curve with respect to the difficulty Insufficient time as first, second, third, and forth respectively. The same kind of reasoning helped us to rank the rest of the mechanisms with respect to the rest of the difficulties, as presented in Table III.

Table II Part 1: References from the literature. Each cell describes references to research discussing the susceptibility of a mechanism (row) to a specific difficulty (column).
Too complex description
Too simple description
Coarse-grain. des. of needs
Insufficient time
Linear and mon. satisfaction
Just a termTerm and use-
caseTerm and measure
Term, use-case, and measure
No articulation
Direct weight
Elicited weight
Utility curve
On/OffOrder
Direct ratioElicited ratio
Not expressedInferred from disagreement
Related to each
Quality attribute
Mechanism Stakeholders disagreementSolution selection
Quality attribute description
Quality attribute importance description
(Andersson, 2000)
(Andersson, 2000)
(Andersson, 2000)
(Andersson, 2000),
(Keeney and Raiffa, 1976)
(Andersson, 2000),
(Keeney and Raiffa, 1976)
(Moore et al., 2003),
(Andersson, 2000), (Keeney
and Raiffa, 1976)
(Andersson, 2000)
Uncertainty description
(Andersson, 2000),
(Keeney and Raiffa, 1976)
Fulfillment description as provided by an
alternative
(Andersson, 2000),
(Keeney and Raiffa, 1976)
(Gilb and Brodie, 2005), (Moore et al.,
2003), (Andersson,
2000)
Difficulties
(Andersson, 2000),
(Keeney and Raiffa, 1976)
(Andersson, 2000),
(Keeney and Raiffa, 1976)

Table II Part 2: References from the literature. Each cell describes references to research discussing the susceptibility of a mechanism (row) to a specific difficulty (column).
Attribute meaning
Perception of a term. Coarse-
grain. ind.Value
perceptionUnderest.
uncertaintyJust a term
Term and use-case
Term and measure
Term, use-case, and measure
No articulation
Direct weight
Elicited weight
Utility curve
On/OffOrder
Direct ratio
Elicited ratio
Not expressedInferred from disagreement
Related to each
Quality attribute
Uncertainty description
Fulfillment description as provided by an
alternative
(Gilb and Brodie, 2005),
(Andersson, 2000)
(Gilb and Brodie, 2005)
(Gilb and Brodie, 2005),
(Andersson, 2000)
(Andersson, 2000), (Keeney
and Raiffa, 1976)
(Gilb and Brodie, 2005), (Moore et al.,
2003)
(Andersson, 2000), (Keeney
and Raiffa, 1976)
Mechanism
Difficulties
Solution properties interpretation
Quality attribute description
Quality attribute importance description
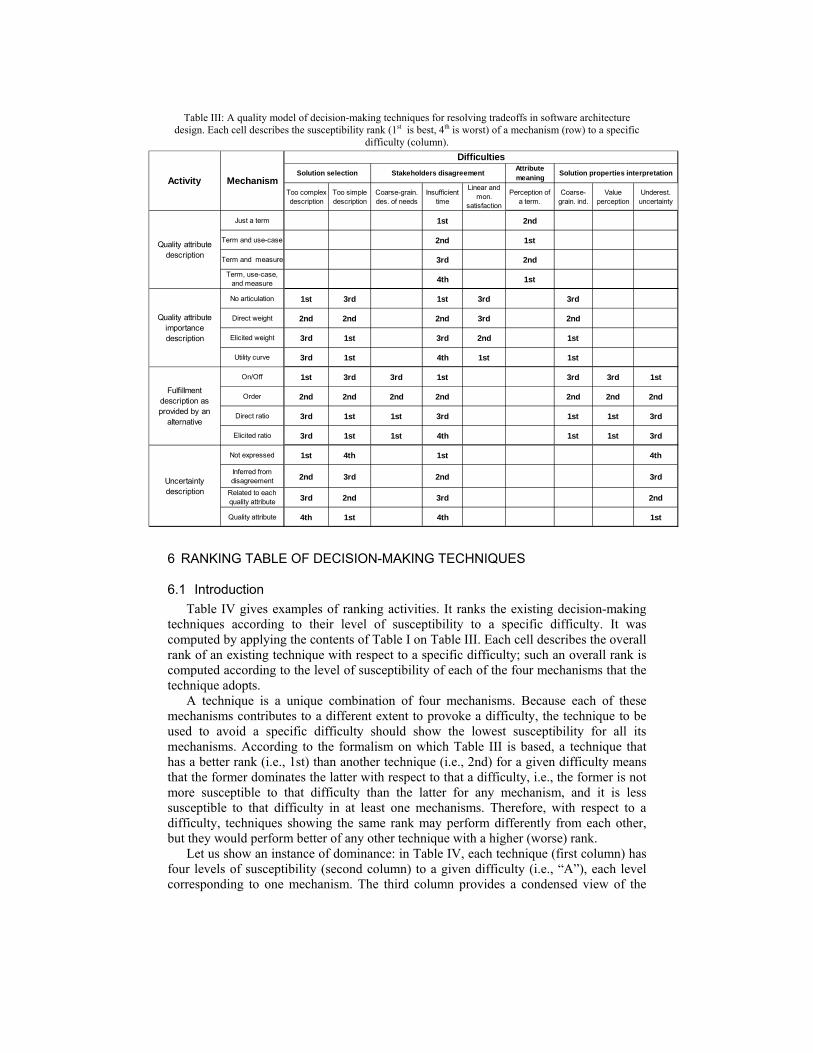
Table III: A quality model of decision-making techniques for resolving tradeoffs in software architecture design. Each cell describes the susceptibility rank (1st is best, 4th is worst) of a mechanism (row) to a specific
difficulty (column).
Attribute meaning
Too complex description
Too simple description
Coarse-grain. des. of needs
Insufficient time
Linear and mon.
satisfaction
Perception of a term.
Coarse-grain. ind.
Value perception
Underest. uncertainty
Just a term 1st 2nd
Term and use-case 2nd 1st
Term and measure 3rd 2nd
Term, use-case, and measure 4th 1st
No articulation 1st 3rd 1st 3rd 3rd
Direct weight 2nd 2nd 2nd 3rd 2nd
Elicited weight 3rd 1st 3rd 2nd 1st
Utility curve 3rd 1st 4th 1st 1st
On/Off 1st 3rd 3rd 1st 3rd 3rd 1st
Order 2nd 2nd 2nd 2nd 2nd 2nd 2nd
Direct ratio 3rd 1st 1st 3rd 1st 1st 3rd
Elicited ratio 3rd 1st 1st 4th 1st 1st 3rd
Not expressed 1st 4th 1st 4th
Inferred from disagreement 2nd 3rd 2nd 3rd
Related to each quality attribute 3rd 2nd 3rd 2nd
Quality attribute 4th 1st 4th 1st
Stakeholders disagreement Solution properties interpretation
Difficulties
Uncertainty description
Solution selection
Quality attribute description
Quality attribute importance description
Fulfillment description as provided by an
alternative
Activity Mechanism
6 RANKING TABLE OF DECISION-MAKING TECHNIQUES
6.1 Introduction
Table IV gives examples of ranking activities. It ranks the existing decision-making techniques according to their level of susceptibility to a specific difficulty. It was computed by applying the contents of Table I on Table III. Each cell describes the overall rank of an existing technique with respect to a specific difficulty; such an overall rank is computed according to the level of susceptibility of each of the four mechanisms that the technique adopts.
A technique is a unique combination of four mechanisms. Because each of these mechanisms contributes to a different extent to provoke a difficulty, the technique to be used to avoid a specific difficulty should show the lowest susceptibility for all its mechanisms. According to the formalism on which Table III is based, a technique that has a better rank (i.e., 1st) than another technique (i.e., 2nd) for a given difficulty means that the former dominates the latter with respect to that a difficulty, i.e., the former is not more susceptible to that difficulty than the latter for any mechanism, and it is less susceptible to that difficulty in at least one mechanisms. Therefore, with respect to a difficulty, techniques showing the same rank may perform differently from each other, but they would perform better of any other technique with a higher (worse) rank.
Let us show an instance of dominance: in Table IV, each technique (first column) has four levels of susceptibility (second column) to a given difficulty (i.e., “A”), each level corresponding to one mechanism. The third column provides a condensed view of the
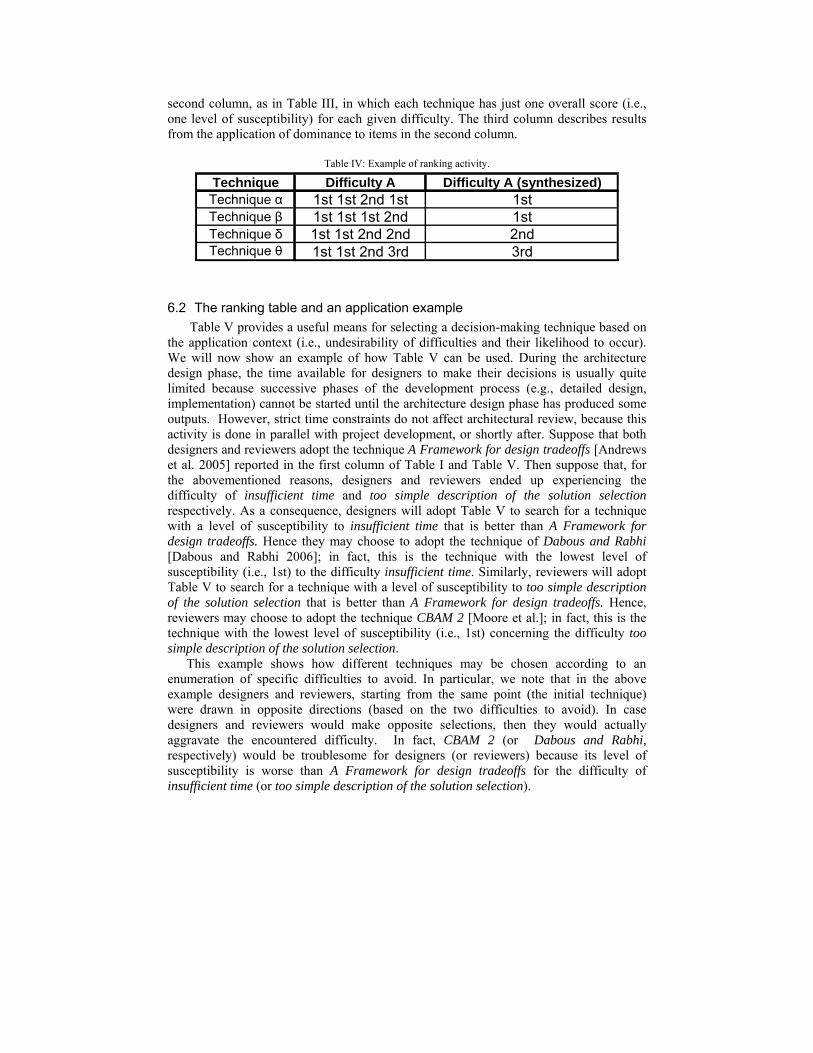
second column, as in Table III, in which each technique has just one overall score (i.e., one level of susceptibility) for each given difficulty. The third column describes results from the application of dominance to items in the second column.
Table IV: Example of ranking activity.
Technique Difficulty A Difficulty A (synthesized)Technique α 1st 1st 2nd 1st 1stTechnique β 1st 1st 1st 2nd 1stTechnique δ 1st 1st 2nd 2nd 2ndTechnique θ 1st 1st 2nd 3rd 3rd
6.2 The ranking table and an application example
Table V provides a useful means for selecting a decision-making technique based on the application context (i.e., undesirability of difficulties and their likelihood to occur). We will now show an example of how Table V can be used. During the architecture design phase, the time available for designers to make their decisions is usually quite limited because successive phases of the development process (e.g., detailed design, implementation) cannot be started until the architecture design phase has produced some outputs. However, strict time constraints do not affect architectural review, because this activity is done in parallel with project development, or shortly after. Suppose that both designers and reviewers adopt the technique A Framework for design tradeoffs [Andrews et al. 2005] reported in the first column of Table I and Table V. Then suppose that, for the abovementioned reasons, designers and reviewers ended up experiencing the difficulty of insufficient time and too simple description of the solution selection respectively. As a consequence, designers will adopt Table V to search for a technique with a level of susceptibility to insufficient time that is better than A Framework for design tradeoffs. Hence they may choose to adopt the technique of Dabous and Rabhi [Dabous and Rabhi 2006]; in fact, this is the technique with the lowest level of susceptibility (i.e., 1st) to the difficulty insufficient time. Similarly, reviewers will adopt Table V to search for a technique with a level of susceptibility to too simple description of the solution selection that is better than A Framework for design tradeoffs. Hence, reviewers may choose to adopt the technique CBAM 2 [Moore et al.]; in fact, this is the technique with the lowest level of susceptibility (i.e., 1st) concerning the difficulty too simple description of the solution selection.
This example shows how different techniques may be chosen according to an enumeration of specific difficulties to avoid. In particular, we note that in the above example designers and reviewers, starting from the same point (the initial technique) were drawn in opposite directions (based on the two difficulties to avoid). In case designers and reviewers would make opposite selections, then they would actually aggravate the encountered difficulty. In fact, CBAM 2 (or Dabous and Rabhi, respectively) would be troublesome for designers (or reviewers) because its level of susceptibility is worse than A Framework for design tradeoffs for the difficulty of insufficient time (or too simple description of the solution selection).

Table V: Ranking table of existing decision-making techniques. Each cell describes the susceptibility rank (1st is best, 5th is worst) of a decision-making technique (row) to a specific difficulty (column).
Attribute meaning
Decision-making
technique
Too complex description
Too simple description
Coarse-grain. des. of needs
Insufficient time
Linear and mon.
satisfaction
Perception of a term.
Coarse-grain. ind.
Value perception
Underest. uncertainty
A Framework for design tradeoffs
5th 3rd 1st 3rd 1st 1st 1st 1st 3rd
BAREMO 4th 3rd 2nd 2nd 1st 2nd 2nd 2nd 2nd
CBAM 1 6th 2nd 1st 2nd 2nd 2nd 2nd 1st 1st
CBAM 2 7th 1st 1st 4th 1st 1st 1st 1st 1st
CEP 8th 2nd 1st 2nd 2nd 2nd 2nd 1st 1st
Dabous & Rabhi
1st 5th 3rd 1st 3rd 2nd 5th 3rd 1st
Impact Estimation
4th 3rd 1st 2nd 2nd 2nd 2nd 1st 1st
ISO 9126 4th 3rd 1st 2nd 2nd 2nd 2nd 1st 3rd
NeMo-CoSe 3rd 3rd 2nd 2nd 2nd 2nd 3rd 2nd 2nd
OTSO 7th 2nd 1st 2nd 1st 1st 1st 1st 1st
PORE 1st 6th 3rd 2nd 3rd 1st 5th 3rd 1st
Quality driven (Al-Naeem)
5th 3rd 1st 2nd 1st 2nd 1st 1st 3rd
Quality driven
(Svahnberg)7th 2nd 1st 2nd 1st 2nd 1st 1st 1st
Quantitative methods
4th 4th 1st 2nd 2nd 2nd 2nd 1st 3rd
Softgoals 2nd 4th 2nd 2nd 3rd 2nd 4th 2nd 2nd
Difficulties
Solution selection Stakeholders Disagreement Solution Property
6.3 Discussion
Table V reveals that no decision-making technique is more (or less) susceptible than any other technique to entire set of difficulties taken into account in this study, i.e., no decision-making technique dominates (is always better than) any other one. In fact, Table V shows that every decision-making technique (e.g., A) that is better (i.e., less susceptible) than another technique (e.g., B) with respect to a specific set of difficulties (e.g., i and j), is also worse than that technique with respect to some other difficulties (e.g., A is more susceptible than B to the difficulty k). Consequently, because the quality of a technique depends on which difficulties, issues, or troubles the architects want to

avoid, there is no “best” decision-making technique for resolving architectural tradeoffs. However, there are techniques that are more susceptible than others to specific difficulties.
Since being more susceptible to a difficulty does not mean that the technique provokes it, then the approach to select a decision-making technique needs to be adaptive. For this reason, the proposed ranking table provides a useful means for selecting and tuning the decision-making technique to adopt.
Note that trying to select the best decision-making technique could lead to a paradox: the selection of a decision-making technique “needs to use the best decision-making method! This decision-making paradox makes any attempt in solving this difficulty to be of limited success” [Triantaphyllou 2004] page XXX. In this survey we have been providing a systematic way to select decision-making techniques for software architecture design; hence, we made a first step towards a new field called meta-decision-making, i.e., the issue of deciding how to decide.
For future work we are currently developing the first meta-decision-making support system for software architecture design. Such a system would assist the user in selecting the most suitable decision-making technique according to the expected difficulties to be avoided.
7 CONCLUSION
In this paper we have proposed: a characterization schema that (1) is able to differentiate among different decision-
making techniques, and that (2) clearly reveals variability and commonalities among them,
a validation for that schema by using it to characterize fifteen existing decision-making techniques,
a set of quality attributes for decision-making techniques that can be used as selection criteria,
a quality model that relates the proposed quality attributes with the elements (i.e., mechanisms) of the aforementioned characterization schema, and
a ranking table of the decision-making techniques that supports their selection by architects.
Most of the content of the paper comes from analyzing the literature on software architecture and decision-making techniques according to standard procedures [Kitchenham 2004] [Biolchini et al. 2007].
We view a good decision-making technique as one that avoids the selection of a worse alternative and, at the same time, is easy to use. Consequently, our key idea was to use the difficulties that an architect may encounter as the organizing principle on which to build a quality model for choosing among decision-making techniques. Therefore, the “level of susceptibility” of a specific technique to specific difficulties, becomes a (un-)quality attribute of the decision-making technique and which acts as criteria for its selection.
Our results reveal that selecting a decision-making technique is difficult because it is not possible to assert that any technique is unambiguously better than any other. In fact, no decision-making technique is more (or less) susceptible than another technique to all the difficulties taken into account in this study. On the contrary, a decision-making technique (e.g., A) that is better (i.e., less susceptible) than another technique (e.g., B) with respect to a specific set of difficulties (e.g., i, and j), it is also worse with respect to some other difficulties (e.g., A is more susceptible than B to difficulty k).
In other words, there is no perfect decision-making technique—no technique that dominates all the others. Consequently, for resolving architectural tradeoffs, because the

quality of a technique depends on which difficulties the decision-makers (the architects) want to avoid, there is no “best” decision-making technique to look for. However, there are techniques that are more susceptible than others to specific difficulties. Therefore, architects should pick a decision-making technique based on the difficulties that they want to avoid. Since there is a lack of empirical evidence in understanding under which circumstances a particular decision-making technique provokes which difficulty, you cannot predict the type of difficulties you will run into. As a consequence, the approach to select a decision-making technique needs to be adaptive. For that reason, the proposed ranking table provides a useful means for selecting and tuning the decision-making technique to adopt.
In conclusion, the present survey and analysis framework provides insight into decision-making techniques that will help architects in: (1) selecting and customizing the decision-making technique that is the most suitable to use based on the characteristics of the issue to solve, the usage context, and the difficulties encountered while deciding, and (2) employing the decision-making technique by making explicit its principles, its differences from the others techniques, and, most importantly, its limitations (i.e., the difficulties that are most likely to be encountered when using it).
In this paper we have described the decision-making techniques as alternatives available to architects for choosing among a finite set of architectural alternatives. Consequently, the provided quality model of decision-making techniques is the first contribution on meta-decision-making, i.e., the issue of deciding how to decide.[Andersson 2000]
8 REFERENCES
AL-NAEEM, T., GORTON, I., ALI BABAR, M., RABHI, F., and BENATALLAH, B. 2005. A quality-driven systematic approach for architecting distributed software applications. Proceedings of the 27th International Conference on Software engineering. St. Louis, MO, USA. ACM Press.
ALI BABAR, M., ZHU, L., and JEFFERY, R. 2004. A framework for classifying and comparing software architecture evaluation methods. Proceedings of the Australian Software Engineering Conference. .
AMERICA, P., OBBINK, H., and ROMMES, E. 2003. Multi-View Variation Modeling for Scenario Analysis. Fifth International Workshop on Product Family Engineering (PFE-5). Siena, Italy. Springer-Verlag.
ANDERSSON, J. 2000. A Survey of Multiobjective Optimization in Engineering Design. LiTH-IKP-R-1097, Linkoping, Sweden: Department of Mechanical Engineering, Linkoping University.
ANDREWS, A., MANCEBO, E., RUNESON, P., and FRANCE, R. 2005. A Framework for Design Tradeoffs Software Quality Journal 13 (4), 28.
BANDOR, M. S. 2006. Quantitative Methods for Software Selection and Evaluation. CMU/SEI-2006-TN-026. BARBACCI, M. R., ELLISON, R., LATTANZE, A. J., STAFFORD, J. A., WEINSTOCK, C. B., and WOOD,
W. G. 2003. Quality Attribute Workshops (QAWs), Third Edition. http://www.sei.cmu.edu/publications/documents/03.reports/03tr016.html
BASILI, V., CALDIERA, G., and CANTONE, G. 1992. A reference architecture for the component factory. ACM Transactions on Software Engineering and Methodology 1 (1), 53-80.
BASS, L., CLEMENTS, P., and KAZMAN, R. 2003. Software Architecture in Practice. 2nd Addison-Wesley. Reading, MA.
BIOLCHINI, J. C. D. A., MIAN, P. G., NATALI, A. C. C., CONTE, T. U., and TRAVASSOS, G. H. 2007. Scientific research ontology to support systematic review in software engineering. Advanced Engineering Informatics 21 (2), 133-151.
BOOCH, G. 2007. The Irrelevance of Architecture. IEEE Software 24 (3), 10-11. BOSCH, J. 2000. Design and Use of Software Architecture: Adopting and Evolving a Product-Line Approach.
Addison-Wesley. Boston. BOSCH, J. 2004. Software Architecture: the Next Step. First European Workshop on Software Architecture
(EWSA 2004). St Andrews, Scotland. Springer-Verlag. BROOKS, F. P. 1987. No silver bullet: essence and accidents of software engineering. IEEE Computer 20 (4),
10-19. CANTONE, G. and DONZELLI, P. 1999. Goal-oriented software measurement models, in. S Publishing,
Sofware Control and Metrics for Software Quality Maastricht CAVANAUGH, C. P. and POLEN, S. M. 2002. Add Decision Analysis to Your COTS Selection Process. The
Journal of Defense Software Engineering.

CHUNG, L., GROSS, D., and YU, E. 1999. Architectural Design to Meet Stakeholder Requirements, in. P Donohue, Software architecture Kluwer Academic San Antonio, Texas, USA
CLEMENTS, P., KAZMAN, R., and KLEIN, M. 2002. Evaluating Software Architecture: Methods and Case Studies. Addison-Wesley. Boston.
CLEMENTS, P. and NORTHROP, L. 2002. Software Product Lines: Practice and Patterns. Addison-Wesley. Boston.
DABOUS, F. T. and RABHI, F. A. 2006. A framework for evaluating alternative architectures and its application to financial business processes. Poceedings of the Australian Software Engineering Conference.
DING, L. and MEDVIDOVIC, N. 2001. Focus: A Light-Weight, Incremental Approach to Software Architecture Recovery and Evolution. Proceedings of the Working IEEE/IFIP Conference on Software Architecture (WICSA'01) - Volume 00. IEEE Computer Society.
DOBRICA, L. and NIEMELÄ, E. 2002. A survey on software architecture analysis methods. IEEE Transactions on Software Engineering 28 (7), 638-653.
EELES, P. 2005. Capturing Architectural Requirements. IBM Rational developer works. Available at:http://www.ibm.com/developerworks/rational/library/4706.html.
FALESSI, D., ALI BABAR, M., CANTONE, G., and KRUCHTEN, P. 2010. Applying Empirical Software Engineering to Software Architecture: Challenges and Lessons Learned. Empirical Software Engineering; An International Journal (in Press) DOI: 10.1007/s10664-009-9121-0.
FALESSI, D., CANTONE, G., and BECKER, M. 2006. Documenting Design Decision Rationale to Improve Individual and Team Design Decision Making: An Experimental Evaluation. Proceedings of the 5th ACM/IEEE International Symposium on Empirical Software Engineering. Rio de Janeiro, Brazil.
FALESSI, D., CANTONE, G., and KRUCHTEN, P. 2007a. Do Architecture Design Methods Meet Architects’ Needs? Proceedings of the 6th Working IEEE/IFIP Conference on Software Architecture. Mumbai, India. IEEE Computer Society.
FALESSI, D., CANTONE, G., and KRUCHTEN, P. 2008. Value-Based Design Decision Rationale Documentation: Principles and Empirical Feasibility Study. Proceeding of the Seventh Working IEEE / IFIP Conference on Software Architecture (WICSA 2008). Vancouver, Canada. IEEE Computer Society.
FALESSI, D., KRUCHTEN, P., and CANTONE, G. 2007b. Issues in Applying Empirical Software Engineering to Software Architecture. First European Conference on Software Architecture. Aranjunez, Spain. Springer.
GILB, T. and BRODIE, L. 2005. Competitive engineering: a handbook for systems engineering, requirements engineering, and software engineering using Planguage. Elsevier Butterworth Heinemann. Oxford.
GOMAA, H. 2004. Designing Software Product Lines with UML: From Use Cases to Pattern-Based Software Architectures. Addison Wesley Longman Publishing Co., Inc.
GRÜNBACHER, P., EGYED, A., and MEDVIDOVIC, N. 2004. Reconciling Software Requirements and Architectures with Intermediate Models. Journal on Software and System Modeling 3 (3).
HARMAN, M. 2007. The Current State and Future of Search Based Software Engineering. International Conference on Software Engineering 2007 Future of Software Engineering IEEE Computer Society.
HOFMEISTER, C., KRUCHTEN, P., NORD, R. L., OBBINK, H., RAN, A., and AMERICA, P. 2007. A general model of software architecture design derived from five industrial approaches. Journal of Systems and Software 80 (1), 106-126.
JANSEN, A. and BOSCH, J. 2005. Software Architecture as a Set of Architectural Design Decisions. 5th Working IEEE/IFIP Conference on Software Architecture (WICSA 5). Pittsburgh. IEEE CS.
JAZAYERI, M. 2002. On Architectural Stability and Evolution. Proceedings of the 7th Ada-Europe International Conference on Reliable Software Technologies. Springer-Verlag.
JAZAYERI, M., RAN, A., and LINDEN, F. V. D. 2000. Software Architecture for Product Families: Principles and Practice. Addison-Wesley. Boston.
KANO. 1993. A special issue on Kano’s methods for understanding customer-defined quality. The Center for Quality Management Journal 2 (4), 3-35.
KARLSSON, L., M.HOST, and REGNELL, B. 2006. Evaluating the practical use of different measurement scales in requirements prioritisation. Proceedings of the 5th ACM/IEEE International Symposium on Empirical Software Engineering. Rio de Janeiro, Brazil. ACM Press.
KAZMAN, R., JAI, A., and KLEIN, M. 2001. Quantifying the costs and benefits of architectural decisions. Proceedings of the 23rd International Conference on Software Engineering.
KEENEY, R. L. and RAIFFA, H. 1976. Decisions with multiple objectives: preferences and value tradeoffs. Wiley. Wiley series in probability and mathematical statistics. New York.
KITCHENHAM, B. 2004. Procedures for Performing Systematic Reviews. Joint Technical Report, Keele University TR/SE-0401 and NICTA 0400011T.1.
KLEIN, G. 1999. Sources of Power: How People Make Decisions The MIT Press. Cambridge, Massachusetts. KONTIO, J. 1996. A case study in applying a systematic method for COTS selection. 18th International
Conference on Software Engineering (ICSE'96) KRUCHTEN, P. 1995. Mommy, Where Do Software Architectures Come From? Proceedings of the 1st
International Workshop on Architectures for Software Systems (IWASS1). Seattle, WA. KRUCHTEN, P. 2003. The Rational Unified Process: An Introduction 3rd Addison-Wesley Professional. KRUCHTEN, P. 2004. An ontology of architectural design decisions in software intensive systems. Proceedings
of the 2nd Groningen Workshop on Software Variability.

KRUCHTEN, P., CAPILLA, R., and DUENAS, J. 2009. The Decision View's Role in Software Architecture Practice. IEEE Softw. 26 (2), 36-42.
KRUCHTEN, P., OBBINK, H., and STAFFORD, J. 2006. The past, present and future for software architecture. IEEE Software 23 (2), 2-10.
LI, B., ZENG, G., and LIN, Z. 1999. A domain specific software architecture style for CSCD system. ACM SIGSOFT Software Engineering Notes 24 (1), 59-64.
LI, J., CONRADI, R., BUNSE, C., TORCHIANO, M., SLYNGSTAD, O. P. N., and MORISIO, M. 2009. Development With Off the Shelf Components: 10 Facts. IEEE Software 26 (2).
LOZANO-TELLO, A. and GÓMEZ-PÉREZ , A. 2002. BAREMO: how to choose the appropriate software component using the analytic hierarchy process. Proceedings of the 14th International Conference on Software Engineering and Knowledge Engineering. Ischia, Italy. ACM Press.
MARANZANO, J. F., ROZSYPAL, S. A., ZIMMERMAN, G. H., WARNKEN, G. W., WIRTH, P. E., and WEISS, D. M. 2005. Architecture Reviews: Practice and Experience. IEEE Software 22 (2), 34-43.
MOORE, M., KAZMAN, R., KLEIN, M., and ASUNDI, J. 2003. Quantifying the value of architecture design decisions: lessons from the field. 25th International Conference on Software Engineering, (ICSE03)
NCUBE, C. and MAIDEN, N. 1999. PORE: Procurement Oriented Requirements Engineering Method for the Component-Based Systems Engineering Development Paradigm. in Proceedings of the 2nd International Workshop on CBSE (in conjunction with ICSE'99). Los Angeles, USA.
NUSEIBEH, B. 2001. Weaving Together Requirements and Architectures. Computer 34 (3), 115-117. OBBINK, H., KRUCHTEN, P., KOZACZYNSKI, W., HILLIARD, R., RAN, A., POSTEMA, H., LUTZ, D.,
KAZMAN, R., TRACZ, W., and KAHANE, E. 2002. Report on Software Architecture Review and Assessment (SARA), Version 1.0. At http://philippe.kruchten.com/architecture/SARAv1.pdf.
OZKAYA, I., BASS, L., SANGWAN, R. S., and NORD, R. L. 2008. Making Practical Use of Quality Attribute Information. IEEE Software 25 (2), 25-33.
SAATY, T. L. 2000. Fundamentals of decision making and priority theory with the analytic hierarchy process. RWS Publications. Pittsburgh, Pa.
SCHUSTER, N., ZIMMERMANN, O., and PAUTASSO, C. 2007. ADkwik: Web 2.0 Collaboration System for Architectural Decision Engineering. Nineteenth International Conference on Software Engineering & Knowledge Engineering (SEKE 2007).
SEI. 2007. Published Software Architecture Definitions. http://www.sei.cmu.edu/architecture/published_definitions.html.
SHAW, M. and CLEMENTS, P. 2006. The Golden Age of Software Architecture. IEEE Software 23 (2), 31-39. SHAW, M. and GARLAN, D. 1996. Software Architecture: Perspectives on an Emerging Discipline. Prentice-
Hall. Upper Saddle River, NJ. SVAHNBERG, M., WOHLIN, C., LUNBERG, L., and MATTSSON, M. 2003. A Quality-Driven Decision
Support Method for Identifying Software Architecture Candidates. International Journal of Software Engineering and Knowledge Engineering 13 (5), 547-575.
TAYLOR, R. N., MEDVIDOVIC, N., and DASHOFY, E. 2009. Software Architecture: Foundations, Theory, and Practice. Wiley Publishing.
TRIANTAPHYLLOU, E. 2004. Multi-Criteria Decision Making Methods: A comparative Study Springer. Applied Optimization. PM Parlos.
WANYAMA, T. and FAR, B. H. 2005. Towards providing decision support for COTS selection. Proceedings of the Canadian Conference on Electrical and Computer Engineering.
ZIMMERMANN, O., GSCHWIND, T., KÜSTER, J., LEYMANN, F., and SCHUSTER, N. 2007. Reusable Architectural Decision Models for Enterprise Application Development. QOSA 2007. Heidelberg. LNCS, Springer.
ZIMMERMANN, O., KOEHLER, J., LEYMANN, F., POLLEY, R., and SCHUSTER, N. 2009. Managing Architectural Decision Models with Dependency Relations, Integrity Constraints, and Production Rules. Accepted for Journal of Software and Services, Special Edition on Architectural Decisions, Elsevier.