decision-making supported by health information: a case study
TRANSCRIPT
DECISION-MAKING SUPPORTED BY HEALTH INFORMATION: A CASE STUDY
Real-life case (fictional… or real…)
Your liaison agent informs you that additional funding will be available for the year in progress.
This funding must be used for prevention projects focused on chronic diseases.
You are interested in presenting a project…
What do you do to respond to such a proposal?

How can you identify the best way to invest this money?
What? Who? How?

1. What
Defining what you mean by “chronic diseases” Long term Classics: cardiovascular, respiratory,
gastrointestinal, musculoskeletal, neurological...
Having an overview of the situation in terms of the chronic diseases that are a priority in your community Criteria: frequency, severity, trends…

Where can the information be found?
Surveillance plan RHS Community reports Data from services Data from FNIHB and AANDC Survey among the population Survey among workers …
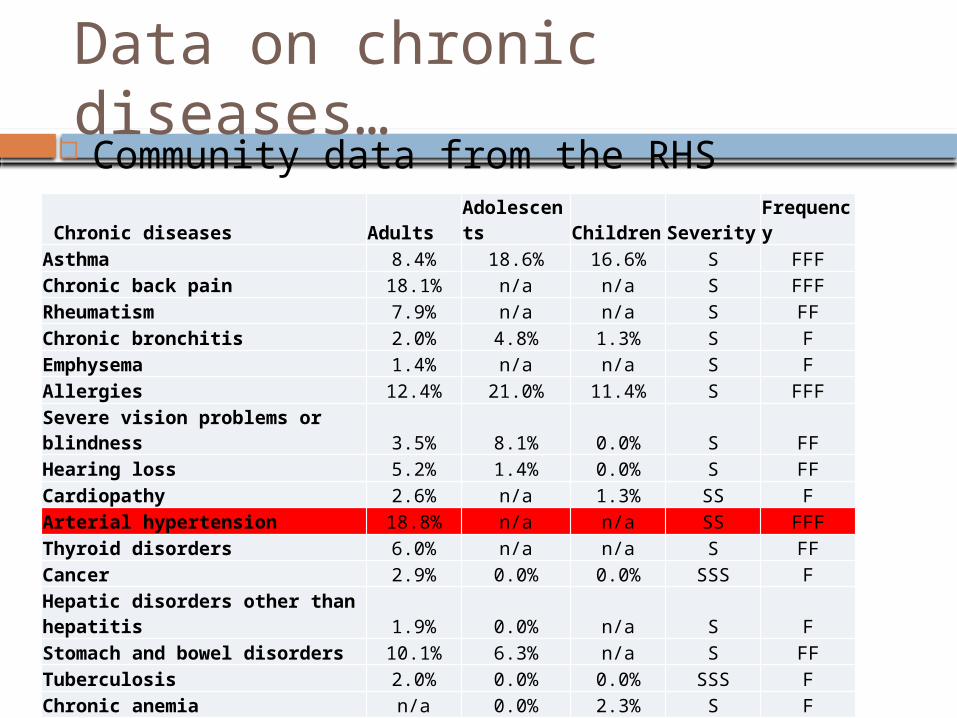
Data on chronic diseases… Community data from the RHS
Chronic diseases AdultsAdolescents Children Severity
Frequency
Asthma 8.4% 18.6% 16.6% S FFFChronic back pain 18.1% n/a n/a S FFFRheumatism 7.9% n/a n/a S FFChronic bronchitis 2.0% 4.8% 1.3% S FEmphysema 1.4% n/a n/a S FAllergies 12.4% 21.0% 11.4% S FFFSevere vision problems or blindness 3.5% 8.1% 0.0% S FFHearing loss 5.2% 1.4% 0.0% S FFCardiopathy 2.6% n/a 1.3% SS FArterial hypertension 18.8% n/a n/a SS FFFThyroid disorders 6.0% n/a n/a S FFCancer 2.9% 0.0% 0.0% SSS FHepatic disorders other than hepatitis 1.9% 0.0% n/a S FStomach and bowel disorders 10.1% 6.3% n/a S FFTuberculosis 2.0% 0.0% 0.0% SSS FChronic anemia n/a 0.0% 2.3% S FChronic ear problems n/a n/a 9.3% S FFDiabetes 27.4% 1.7% 0.0% SS FFF
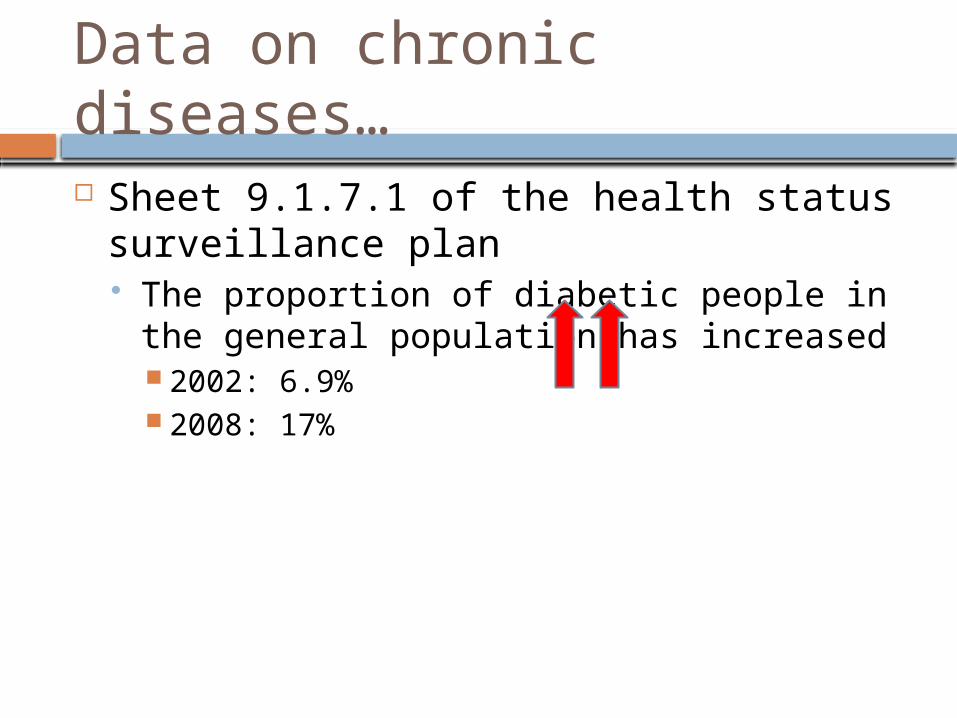
Data on chronic diseases…
Sheet 9.1.7.1 of the health status surveillance plan The proportion of diabetic people in the
general population has increased 2002: 6.9% 2008: 17%
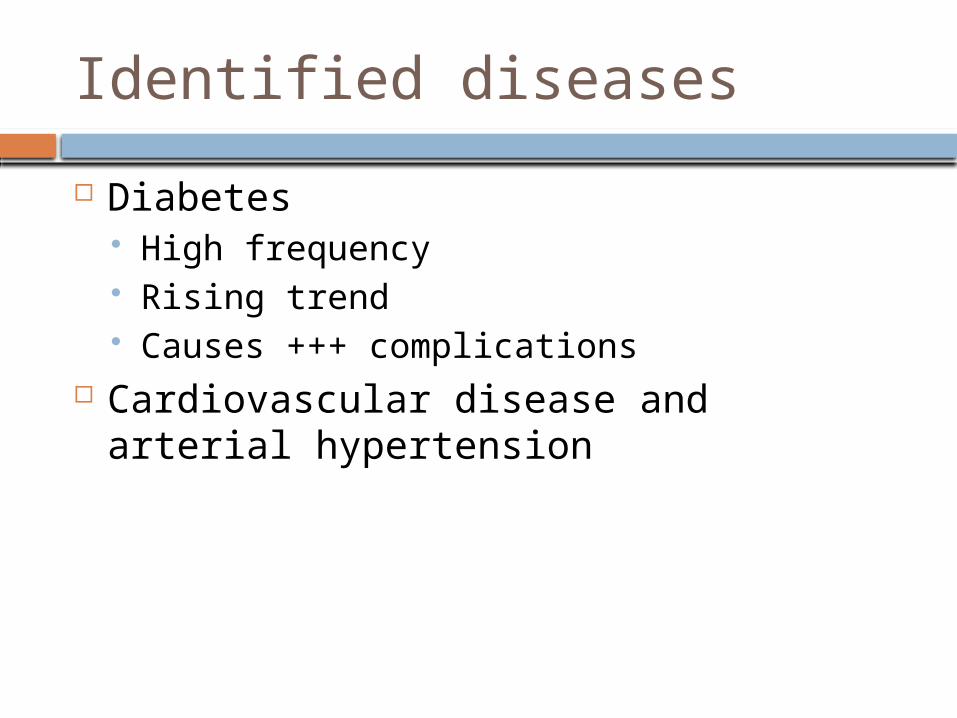
Identified diseases
Diabetes High frequency Rising trend Causes +++ complications
Cardiovascular disease and arterial hypertension
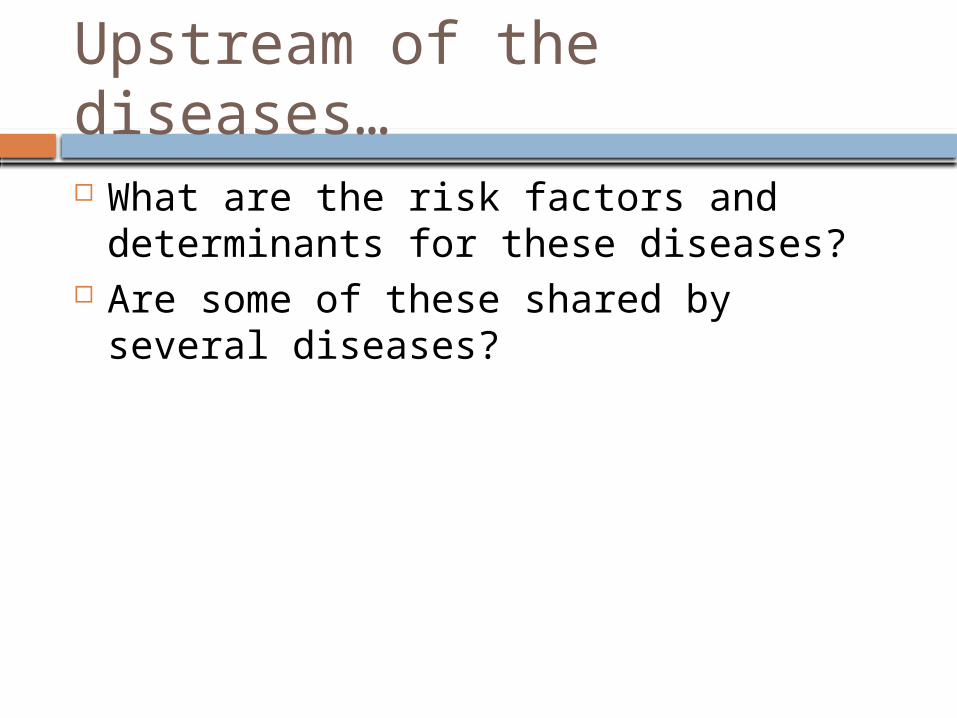
Upstream of the diseases…
What are the risk factors and determinants for these diseases?
Are some of these shared by several diseases?
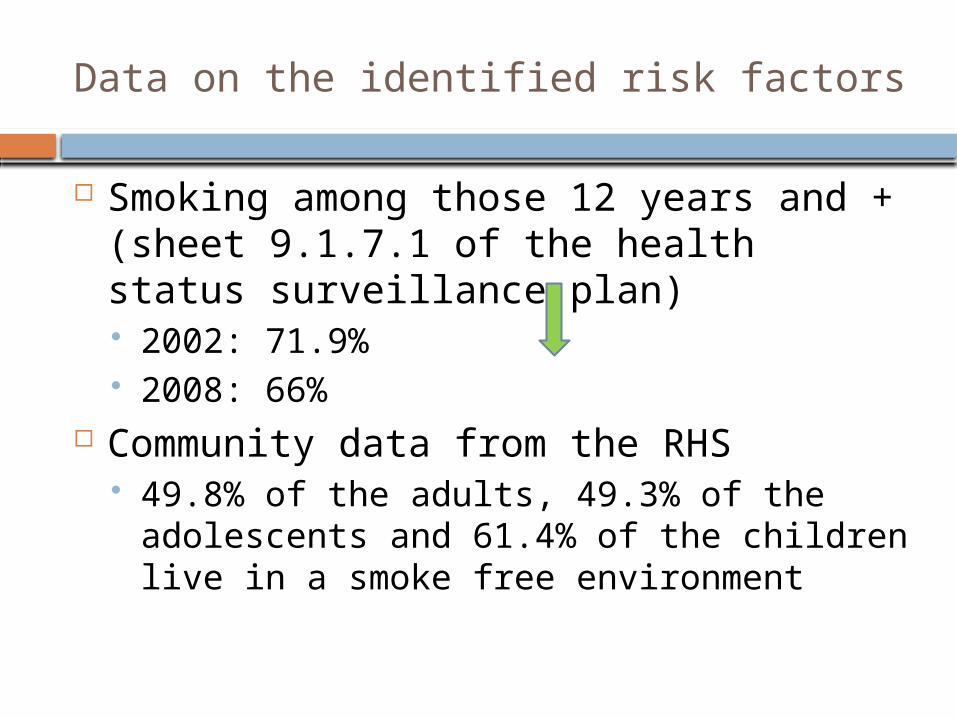
Data on the identified risk factors
Smoking among those 12 years and + (sheet 9.1.7.1 of the health status surveillance plan) 2002: 71.9% 2008: 66%
Community data from the RHS 49.8% of the adults, 49.3% of the
adolescents and 61.4% of the children live in a smoke free environment
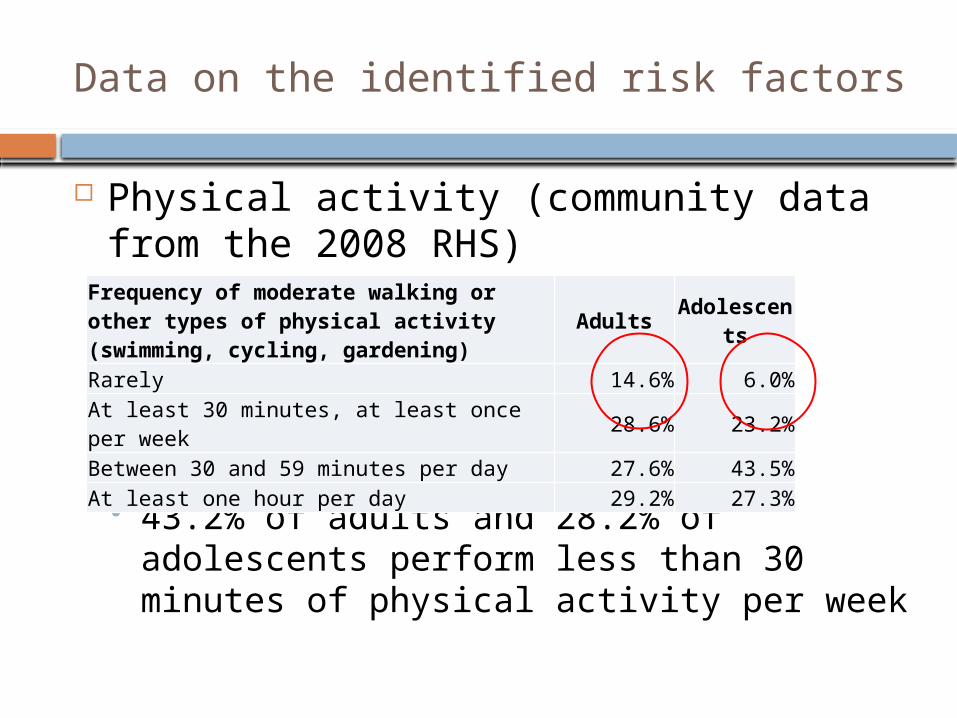
Data on the identified risk factors
Physical activity (community data from the 2008 RHS)
43.2% of adults and 28.2% of adolescents perform less than 30 minutes of physical activity per week
Frequency of moderate walking or other types of physical activity (swimming, cycling, gardening)
Adults Adolescents
Rarely 14.6% 6.0%At least 30 minutes, at least once per week 28.6% 23.2%Between 30 and 59 minutes per day 27.6% 43.5%At least one hour per day 29.2% 27.3%
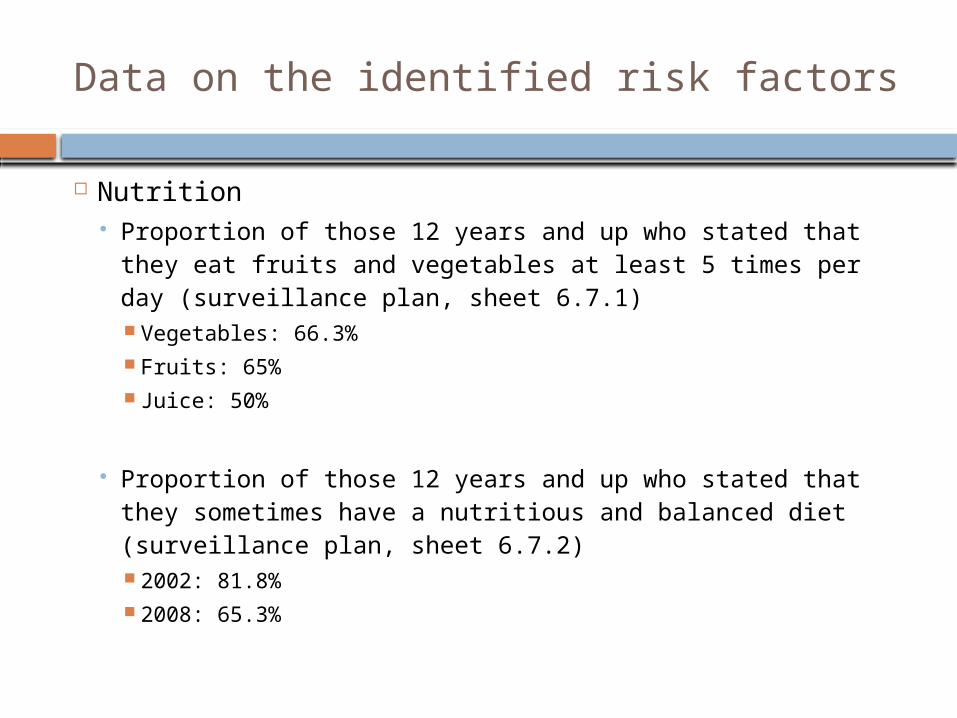
Data on the identified risk factors
Nutrition Proportion of those 12 years and up who stated that
they eat fruits and vegetables at least 5 times per day (surveillance plan, sheet 6.7.1) Vegetables: 66.3% Fruits: 65% Juice: 50%
Proportion of those 12 years and up who stated that they sometimes have a nutritious and balanced diet (surveillance plan, sheet 6.7.2) 2002: 81.8% 2008: 65.3%
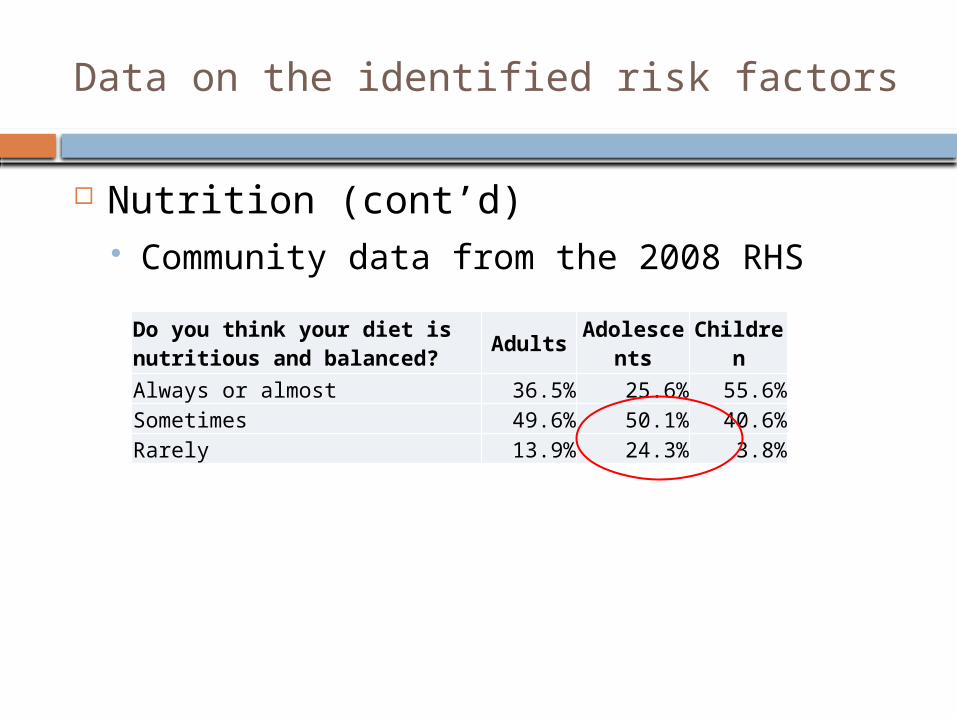
Data on the identified risk factors
Nutrition (cont’d) Community data from the 2008 RHS
Do you think your diet is nutritious and balanced? Adults Adolesce
ntsChildren
Always or almost 36.5% 25.6% 55.6%Sometimes 49.6% 50.1% 40.6%Rarely 13.9% 24.3% 3.8%
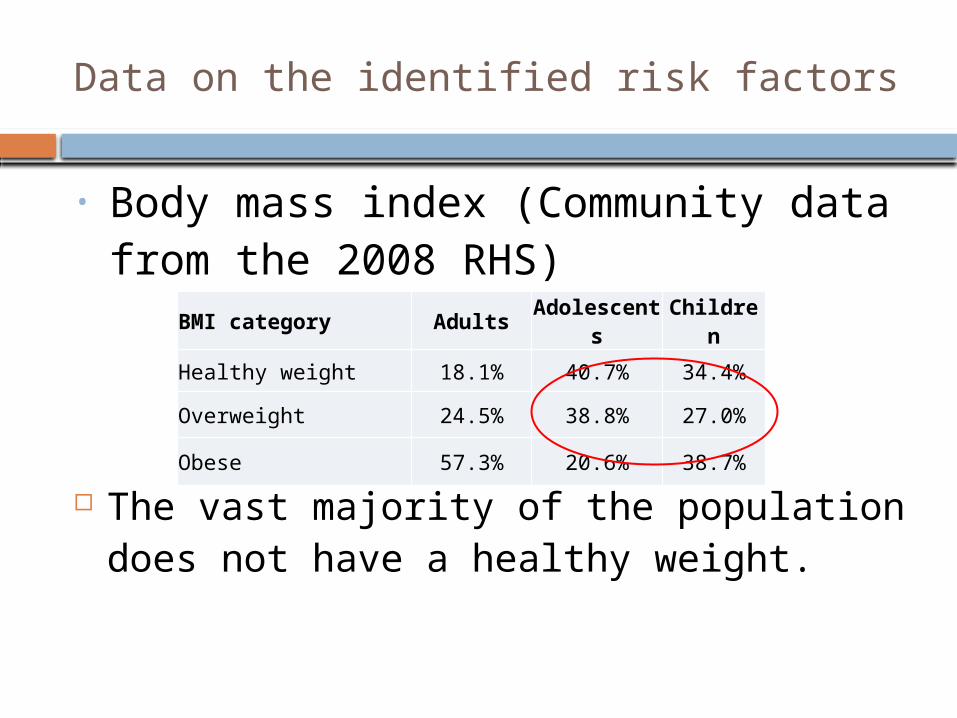
Data on the identified risk factors
• Body mass index (Community data from the 2008 RHS)
The vast majority of the population does not have a healthy weight.
BMI category Adults Adolescents Children
Healthy weight 18.1% 40.7% 34.4%
Overweight 24.5% 38.8% 27.0%
Obese 57.3% 20.6% 38.7%

2. Who
The available amount is limited and you are looking to implement the most efficient interventions.
Who among the people in your community would have the greatest need for these interventions? Age Gender Occupation Socioeconomic status Living environment

Socio-demographic data
Breakdown of the population according to age (surveillance, sheet 1.9.1.1)
1996 2001 2006 20090%
20%
40%
60%
80%
100%
35.6 % 33.6 % 30.1 % 28.3 %
60.4 % 61.5 % 64.4 % 65.3 %
3.9 % 4.9 % 5.5 % 6. 4 %
0-14 ans 15-64 ans 65 ans +0-14 65 +15-64
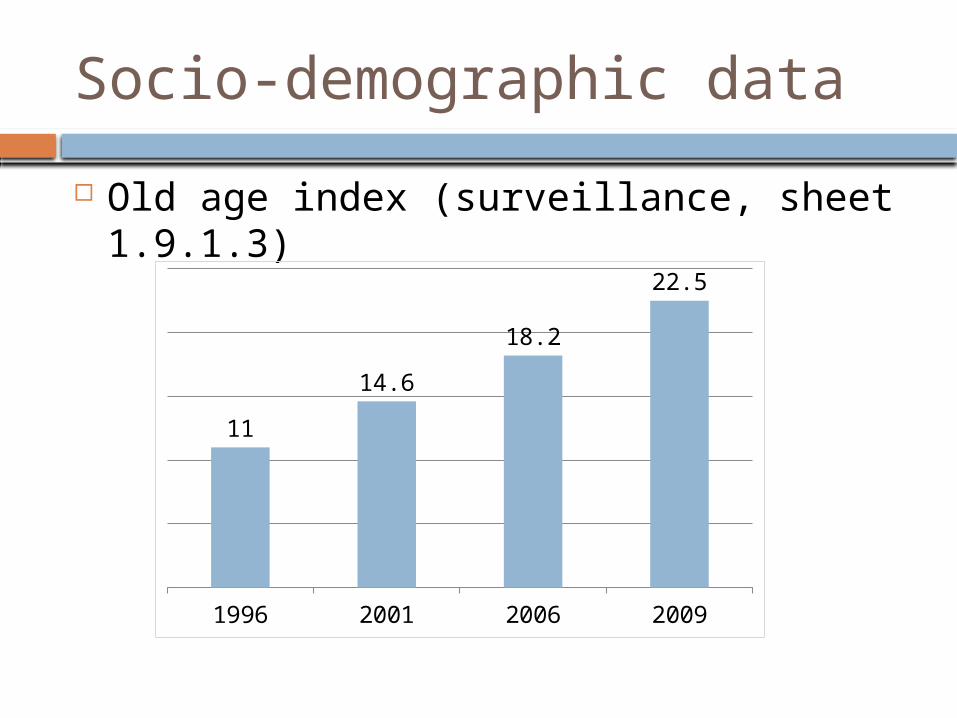
Socio-demographic data
Old age index (surveillance, sheet 1.9.1.3)
1996 2001 2006 2009
11
14.6
18.2
22.5

Socio-demographic data
Education Breakdown of the adults ages 25 years and
up according to education (surveillance, sheet 3.5.1)
Education 2002 2008
High school diploma not obtained 61.2 65.6
High school diploma 21.7 *11.7
College diploma **n.p. *14.0
University graduate **n.p. **n.p.
Missing values 11.9 1.9
Socio-demographic data
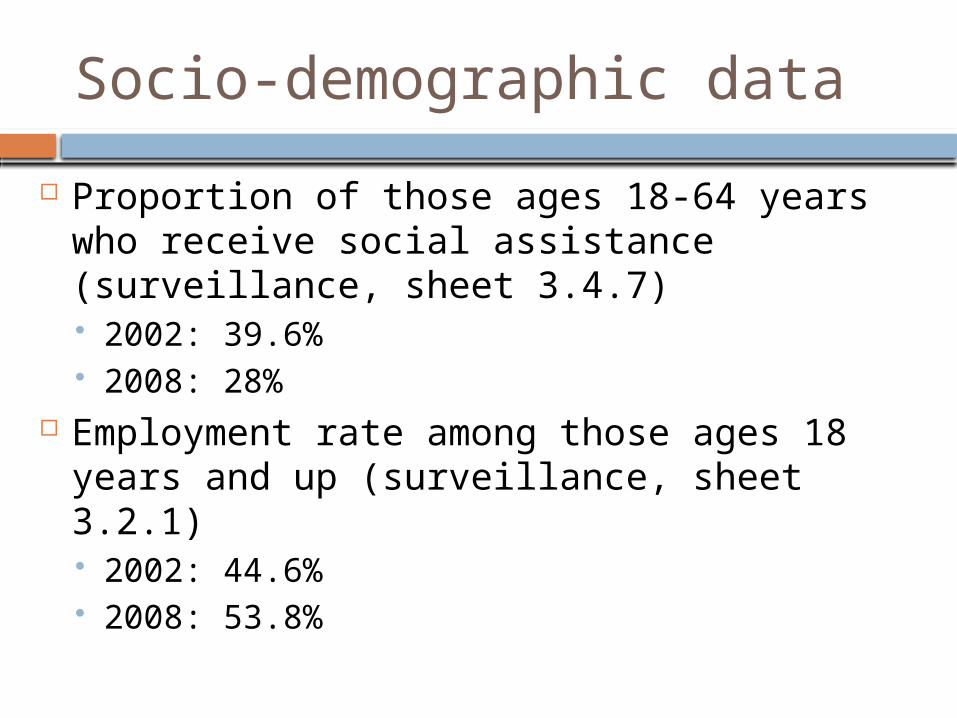
Proportion of those ages 18-64 years who receive social assistance (surveillance, sheet 3.4.7) 2002: 39.6% 2008: 28%
Employment rate among those ages 18 years and up (surveillance, sheet 3.2.1) 2002: 44.6% 2008: 53.8%
Socio-demographic data
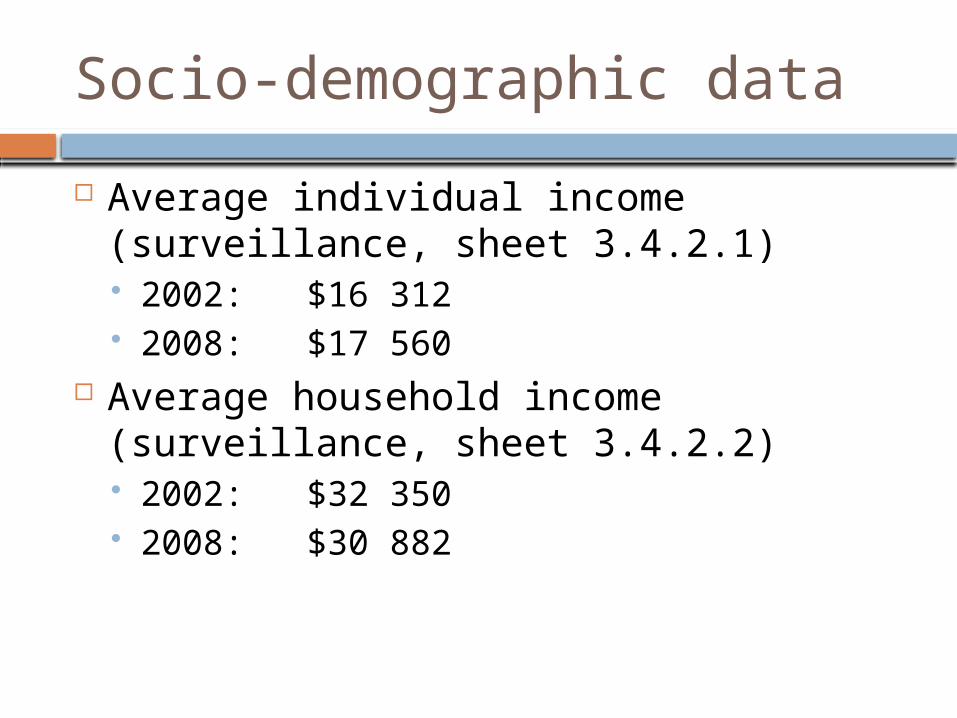
Average individual income (surveillance, sheet 3.4.2.1) 2002: $16 312 2008: $17 560
Average household income (surveillance, sheet 3.4.2.2) 2002: $32 350 2008: $30 882
Target groups
Children and teens: improve their lifestyle (physical activity, eating habits, smoking) Focus on children from disadvantaged
families Parents: provide tools
Ensure that messages are understood (adjust messages according to the level of education)
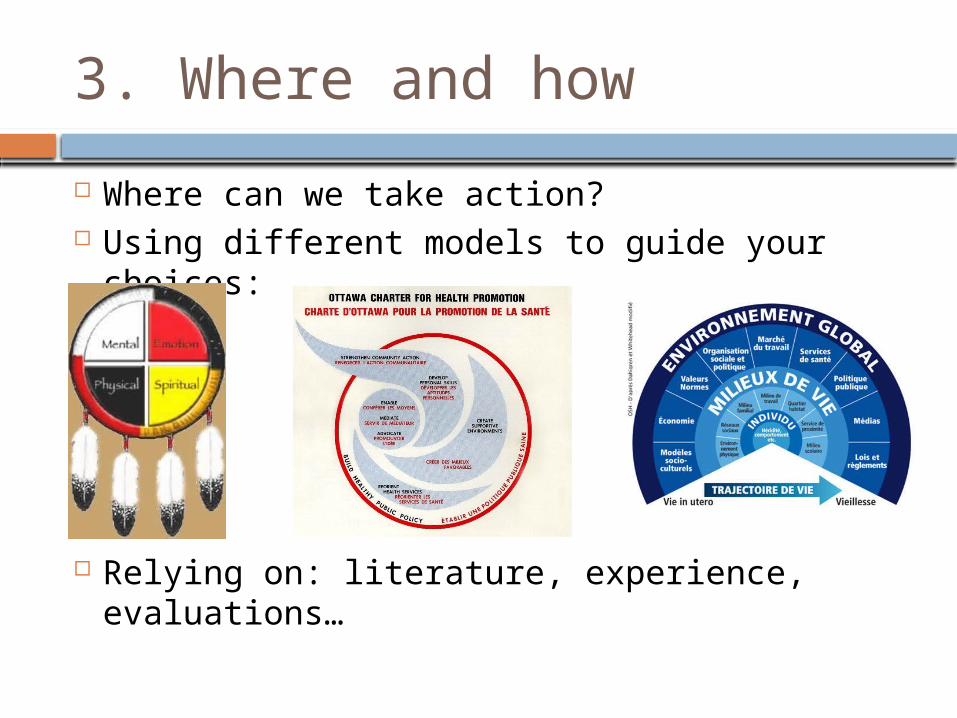
3. Where and how
Where can we take action? Using different models to guide your choices:
Relying on: literature, experience, evaluations…

Logic model? To be refined, include the identified determinants and risk factors
International factors
National/regional factors
Community factors
Individual factors
Population
Prevalence of weight-related problems: obesity and excessive concern for body weight
Occupation
Travelling
Recreation
Sports
Diet
Body image
Genetic
Energy expenditure
Food intake
Public transportaion
Security
Urban planning
Food availability and accessibility
Advertising ans media
Income
Education policies
Transportation policies
Urbanisation policies
Health policies
Food policies
Cultural policies
Family policies
Economic policies
Globalization of the
markets
Industrialisation
Media and marketing
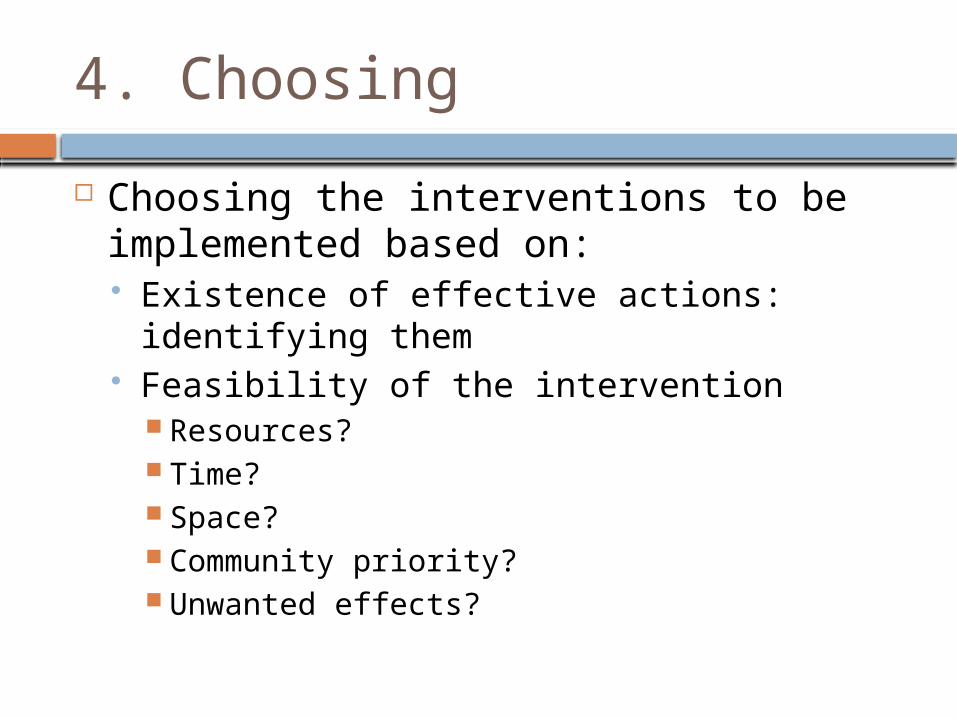
4. Choosing
Choosing the interventions to be implemented based on: Existence of effective actions: identifying
them Feasibility of the intervention
Resources? Time? Space? Community priority? Unwanted effects?

Conclusion
Statistics and litterature are there to support planification
Field knowledge is a major key in planification
Combining statistics, littérature and field knoledge is a winning strategy in planification