deciphering the cell surface proteome of stem cells … the cell surface proteome of stem cells...
TRANSCRIPT

Deciphering the Cell Surface Proteome
of Stem Cells Using Antibody Libraries
Christian Carson, PhD
Associate Director
Research & Development
BD Biosciences
23-14255-00

Outline
• Background
• Tools for cell surface marker antibody screening:
• BD LyoplateTM screening panels
• BD FACSTM CAP
• Applications:
• Identification of surface signatures of neural cell types
• Multiplexing antibody screens with intracellular flow
cytometry
• Increasing throughput with fluorescent cell barcoding
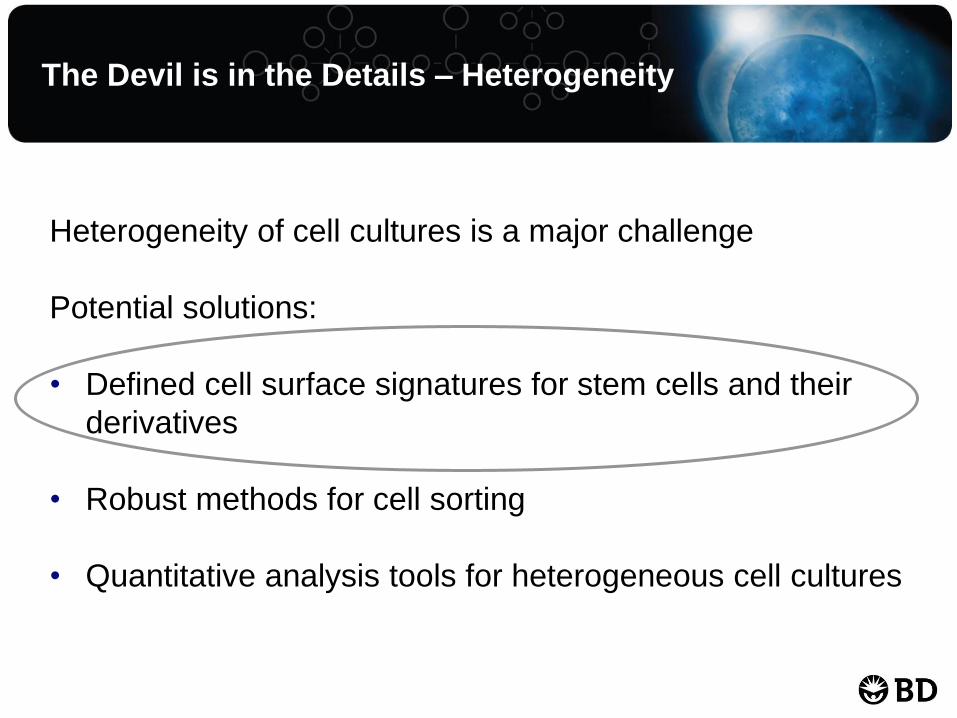
Heterogeneity of cell cultures is a major challenge
Potential solutions:
• Defined cell surface signatures for stem cells and their
derivatives
• Robust methods for cell sorting
• Quantitative analysis tools for heterogeneous cell cultures
The Devil is in the Details – Heterogeneity
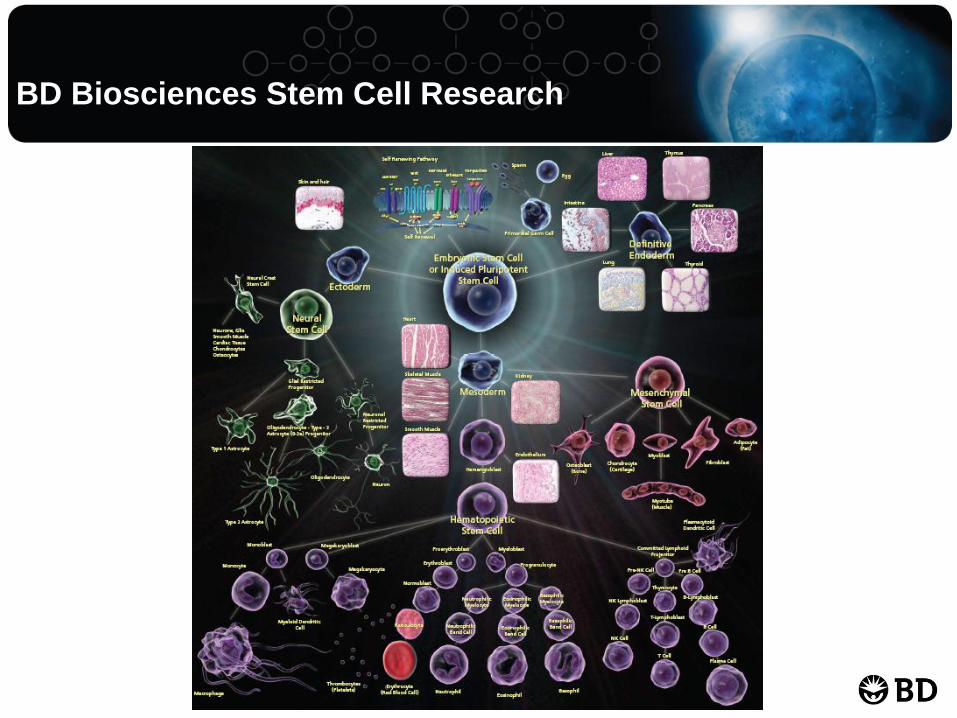
BD Biosciences Stem Cell Research

Outline
• Background
• Tools for cell surface marker antibody screening:
• BD Lyoplate screening panels
• BD FACS CAP
• Applications:
• Identification of surface signatures of neural cell types
• Multiplexing antibody screens with intracellular flow
cytometry
• Increasing throughput with fluorescent cell barcoding

BD Lyoplate Screening Panels
Enabling researchers to immunophenotype cell populations by flow cytometry or
immunofluorescence microscopy using BD’s portfolio of monoclonal antibodies
Product Contents Size
BD Lyoplate Human
Cell Surface Marker Screening Panel
Cat. No. 560747
• 242 CD Markers*
• Isotype Controls
• Alexa Fluor 647 Second Step
5 tests
BD Lyoplate Mouse
Cell Surface Marker Screening Panel
Cat. No. 562208
• 176 CD Markers
• Isotype Controls
• Alexa Fluor 647 Second Step
5 tests
*CD and other cell surface molecules. One marker per well.
• Accelerate discovery of unique cell surface “signatures”
• A unique, cost-effective alternative to screening using
hundreds of single-vial reagents

BD Lyoplate Screening Panels Overview
• The plate-based format is compatible with automation and multichannel pipetting.
• The proprietary lyophilized format allows for room-temperature storage.
• Open wells permit the use of additional markers of choice.
• May be combined with drop-in conjugates.
• Compatible with BFP, CFP, GFP, YFP,
OFP, and RFP-expressing cells.
• All antibodies are available separately in conjugated formats or kits for building post-screen panels using
markers of interest.
• Microsoft® Excel® data analysis templates are available.
Reconstitute plates
Stain cells with 1o antibody in 96-well plates
(adherent or in suspension)
Wash 2X
Stain cells with 2o antibody
Wash 2X
Run cells on flow cytometer or imager

BD Lyoplate Screening Panels Analysis Template
• Microsoft Excel 2007
• Reorganizes data into corresponding 96-well format
• Performs normalization to isotype controls
• Analysis of % positive, median fluorescence intensity (MFI), bimodality, and
normalized values
• Thresholding allows for analysis of specific cell populations
• Templates available for BD FACSDivaTM and FlowJoTM software
• http://www.bdbiosciences.com/support/resources/stemcell/index.jsp#stemtools
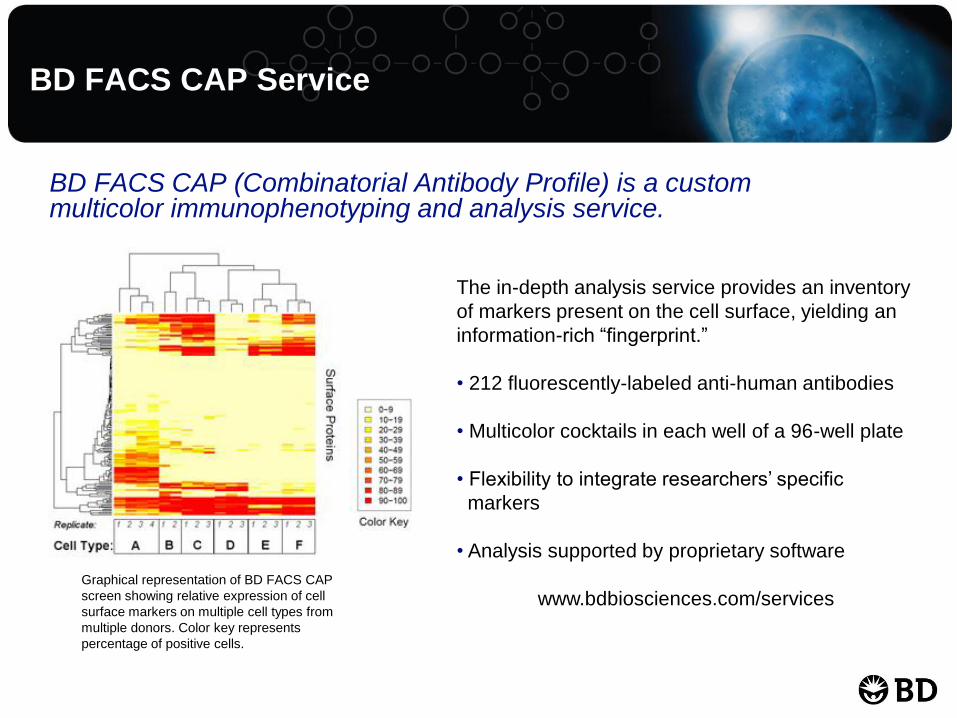
BD FACS CAP Service
BD FACS CAP (Combinatorial Antibody Profile) is a custom multicolor immunophenotyping and analysis service.
The in-depth analysis service provides an inventory
of markers present on the cell surface, yielding an
information-rich “fingerprint.”
• 212 fluorescently-labeled anti-human antibodies
• Multicolor cocktails in each well of a 96-well plate
• Flexibility to integrate researchers’ specific
markers
• Analysis supported by proprietary software
www.bdbiosciences.com/services Graphical representation of BD FACS CAP
screen showing relative expression of cell
surface markers on multiple cell types from
multiple donors. Color key represents
percentage of positive cells.

Outline
• Background
• Tools for cell surface marker antibody screening:
• BD LyoplateTM screening panels
• BD FACSTM CAP
• Applications:
• Identification of surface signatures of neural cell types
• Multiplexing antibody screens with intracellular flow
cytometry
• Increasing throughput with fluorescent cell barcoding

Applications

Cell sorting by flow cytometry using
unique cell signatures of sub-
populations provides:
• Efficient standardized method for
isolating NSCs to eliminate
batch-to-batch variability
• Robust standardized methods for
isolating terminally differentiated
neurons
• Identification of transplantable cell
types that do not cause tumors
Neural Induction of Pluripotent Stem Cells
FACS
FACS

Cell Surface Marker Screen – Fluorescence Activated Cell Sorting (FACS)
CD marker D
hESCs
NSC Contaminant
EB Rosette+
EB Rosette-
NSCs
CD marker C
CD marker B
CD marker A
0 10 2
10 3
10 4
10 5
APC-A
0
20
40
60
80
100
% o
f M
ax
54.9 45.1
0 10 2
10 3
10 4
10 5
APC-A
0
20
40
60
80
100
% o
f M
ax
2.88 97.1
0 10 2
10 3
10 4
10 5
APC-A
0
20
40
60
80
100
% o
f M
ax
1.3 98.7
0 10 2
10 3
10 4
10 5
APC-A
0
20
40
60
80
100
% o
f M
ax
2.1 97.9
10 0
10 1
10 2
10 3
10 4
APC-A
0
20
40
60
80
100
% o
f M
ax
83.3 16.7
10 0
10 1
10 2
10 3
10 4
APC-A
0
20
40
60
80
100
% o
f M
ax
1.27 98.7
10 0
10 1
10 2
10 3
10 4
APC-A
0
20
40
60
80
100
% o
f M
ax
0.7 99.3
10 0
10 1
10 2
10 3
10 4
APC-A
0
20
40
60
80
100
% o
f M
ax
14.8 85.2
0 10 2
10 3
10 4
10 5
APC-A
0
20
40
60
80
100
% o
f M
ax
22.5 77.5
0 10 2
10 3
10 4
10 5
APC-A
0
20
40
60
80
100
% o
f M
ax
4.87 95.1
0 10 2
10 3
10 4
10 5
APC-A
0
20
40
60
80
100 %
of M
ax
18.1 81.9
0 10 2
10 3
10 4
10 5
APC-A
0
20
40
60
80
100
% o
f M
ax
99.8 0.22
0 10 2
10 3
10 4
10 5
APC-A
0
20
40
60
80
100
% o
f M
ax
11.2 88.8
0 10 2
10 3
10 4
10 5
APC-A
0
20
40
60
80
100
% o
f M
ax
1.47 98.5
0 10 2
10 3
10 4
10 5
APC-A
0
20
40
60
80
100
% o
f M
ax
1.71 98.3
0 10 2
10 3
10 4
10 5
APC-A
0
20
40
60
80
100
% o
f M
ax
68.8 31.2
0 10 2
10 3
10 4
10 5
APC-A
0
20
40
60
80
100
% o
f M
ax
99.4 0.57
0 10 2
10 3
10 4
10 5
APC-A
0
20
40
60
80
100
% o
f M
ax
87.2 12.8
0 10 2
10 3
10 4
10 5
APC-A
0
20
40
60
80
100
% o
f M
ax
98.5 1.55
0 10 2
10 3
10 4
10 5
APC-A
0
20
40
60
80
100
% o
f M
ax
65 35

Analysis
% positive Plate 1
% positive Plate 2
MFI Plate 1
MFI Plate 2
http://www.bdbiosciences.com/support/resources/stemcell/index.jsp#stemtools
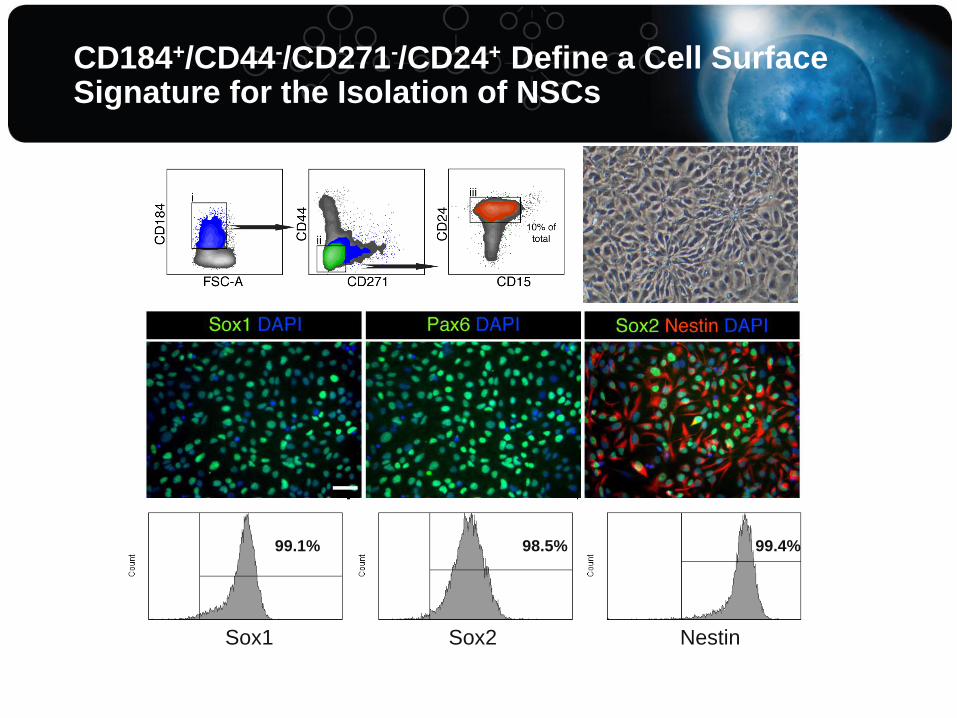
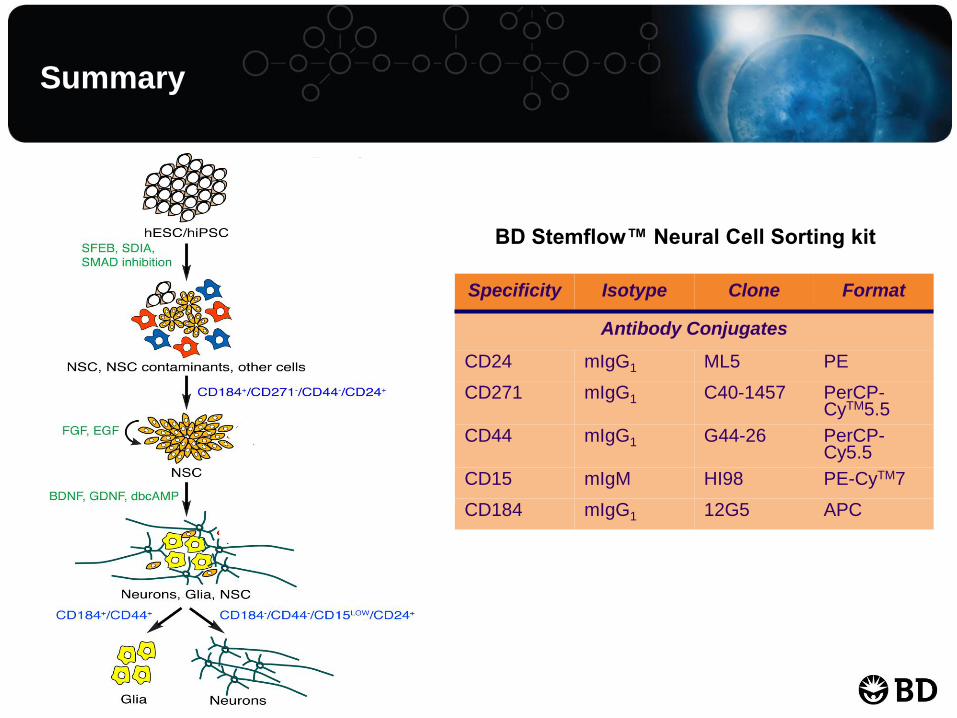
CD184+/CD44-/CD271-/CD24+ Define a Cell Surface Signature for the Isolation of NSCs
Sox2 Sox1 Nestin
99.1% 98.5% 99.4%

Sorted NSCs Differentiate to Mixed Cultures of Neurons and Glia and Differentiate to Neurons in vitro and in vivo
H9 NSCs differentiated for 3 weeks
Images courtesy of Mike Hefferan and Martin
Marsala, University of California, San Diego
HUES-9 NSCs 8 weeks post-
engraftment in rat spinal cord
b-III tubulin = neurons, Nestin = NSCs, GFAP = astrocytes

Summary
CD184+/C271-/CD44-/CD24+
FACS

Cell Surface Marker Screen – Imaging
CD
44
b-I
II t
ub
ulin
Examples from imaging screen
CD
24
b-I
II t
ub
ulin
Fix and perm cells
Stain cells with 1o and 2o antibodies live
Differentiate NSCs in 96-well plates
for 3 weeks
Stain cells with anti-b-III tubulin
Analyze cells on BD PathwayTM 435 bioimager

Isolation of Neurons and Glia by Sorting
CD184+/CD44+
Tu
j1 N
estin
GFA
P D
NA
CD184-/CD44-/CD15LOW/CD24+
Neurons Glia

Sorted Neurons are Viable and Functional
Data courtesy of Yangling Mu and Fred H. Gage, Salk Institute
Summary
Specificity Isotype Clone Format
Antibody Conjugates
CD24 mIgG1 ML5 PE
CD271 mIgG1 C40-1457 PerCP-CyTM5.5
CD44 mIgG1 G44-26 PerCP-Cy5.5
CD15 mIgM HI98 PE-CyTM7
CD184 mIgG1 12G5 APC
BD Stemflow™ Neural Cell Sorting kit


Nature doi:10.1038/nature10821
Alzheimer’s disease biochemical marker comparative analysis

Nature doi:10.1038/nature10821

Outline
• Background
• Tools for cell surface marker antibody screening:
• BD LyoplateTM screening panels
• BD FACSTM CAP
• Applications:
• Identification of surface signatures of neural cell types
• Multiplexing antibody screens with intracellular flow
cytometry
• Increasing throughput with fluorescent cell barcoding

BD Lyoplate Screen with Co-staining 3-week Neural Induction Cultures
HT
S F
low
Cyto
me
ter
Fix
Pe
rm
Dis
as
so
cia
te
cu
ltu
res
Neural induction cultures
Stain with BD Lyoplate™
Human Cell Surface
Marker Screening Panel
Stain with Sox1, Sox2,
Pax6, and DCX
Analyze cell surface
marker expression of
populations defined by
transcription factor
expression
HT
S F
low
Cyto
me
ter
Fix
Pe
rm
Dis
as
so
cia
te
cu
ltu
res
Neural induction cultures
Stain with BD Lyoplate™
Human Cell Surface
Marker Screening Panel
Stain with Sox1, Sox2,
Pax6, and DCX
Analyze cell surface
marker expression of
populations defined by
transcription factor
expression
HT
S F
low
Cyto
me
ter
Fix
Pe
rm
Dis
as
so
cia
te
cu
ltu
res
Neural induction cultures
Stain with BD Lyoplate™
Human Cell Surface
Marker Screening Panel
Stain with Sox1, Sox2,
Pax6, and DCX
Analyze cell surface
marker expression of
populations defined by
transcription factor
expression
Pax6
42.4% 38.8%
12.3% 6.5%
Sox1
SSEA-4
CD166
CD49b
CD146
NSC
NC?
NE

1 2 3 4
Label each
sample with a
different
concentration of
two dyes
Fluorescent Cell Barcoding to
Increase Throughput
Screen 242
mAbs by
sorting and
analyze data
5 6
Combine samples
into one well or tube
2 4 6
Cell Barcoding Dye 500
Cell
Barc
od
ing
Dye
45
0
Analyze multiple samples
from one tube

7-A
AD
387
322
702
3691
4121
U87
Identification of Prospective Cell Surface Signatures of CSCs in Human Gliomas by Immunophenotyping
Cell Barcoding Dye 500 C
ell
Ba
rco
din
g D
ye
45
0
FSC-A
Images courtesy of Justin Lathia and Jeremy Rich, Cleveland Clinic

Identification of Prospective Cell Surface Signatures of CSCs in Human Gliomas by Immunophenotyping
Specimen 3691 4121 4302 322 387 619 702 U87
CD123 47.7 25.3 0.65 6 43 7.96 3.3 25.3
EGF-r 32.4 50.4 12.69 48.3 60.3 2.97 22.2 50.4
CD227 32.1 34.2 19.84 55.7 17.7 4.25 38.4 34.2
CD119 29.7 24.1 28.28 22.6 37.7 3.12 4.3 24.1
CD142 28.5 22.9 16.99 50.9 41.7 8.34 41.9 22.9
CD14 28
0.1 1.26 14.7 49.8 0.68 1.5 0.1
CD201 16.5 20.5 1.33 5.9 26.9 11.65 24.5 20.5
CD29 16.5 9.6 28.27 7.4 71.8 45.02 33.5 9.6
CD140b 15.9 27.4 18.25 6.2 39.2 6.02 4.3 27.4
CD7 15.5 0.8 34.75 6.2 35.5 18.93 2.4 0.8
CD91 14.9 22 2.94 35 16.4 3.64 16.4 22
CD107a 13 37.9 3.98 3 28.7 17.12 8.8 37.9
CD271 11.6 38.6 21.58 13.2 8.4 8.51 11.9 38.6
CD99R 11.3 61.7 2.13 3.4 17.1 17.11 10.5 61.7
CD130 10.1 10.9 10.18 4.8 14.5 8.16 9 10.9
CD51/61 9.1 6.6 33.05 4.5 5.9 35.71 15 6.6
CD61 7.4 4.7 30.21 3.9 5 38.58 11.7 4.7
CD36 7.1 3.3 19.56 4 5.1 23.13 25.4 3.3
SSEA-3 6.3 4.9 2.1 0.4 5.1 1.39 0.3 4.9
CD107b 4.9 6.2 2.24 5.7 10 19.55 14.8 6.2
MIC A/B 3.4 17.1 1.44 59.4 11.8 38.99 59.7 17.1
SSEA-4 3.3 18 1.44 10.6 4.8 83.74 31.5 18
CD279 2.1 1.9 0.85 4.5 2.9 47.93 18.4 1.9
CD109 1.8 40.2 1.2 4.5 62.6 2.36 4.8 40.2
CD274 1.5 13.3 2.86 9.8 2.3 32.89 32.8 13.3
CD321 0.6 14.2 0.35 11.2 1.9 42.24 44.4 14.2
CD140a 0.6 4.1 0.63 62.4 1.7 5.2 50.9 4.1
CD141 0.5 6 2.21 7.6 3.8 51.61 31.5 6
CD34 0.5 0.3 5.79 3.1 0.7 74.5 32 0.3
CD72 0 0 42.73 0.2 0.1 25.06 0.3 0
*
* * * * *
*
*
* * *
* *
*
* * *
*
* * * * *
* *
*
* *
*
*
* * *
*
* *
*
*
*
Data courtesy of Justin Lathia and Jeremy Rich, Cleveland Clinic

Summary
• BD Lyoplate screening panels
can be used to identify cell
surface signatures of diverse
cell populations
• Cell surface marker antibody
screens can be combined
with intracellular flow
cytometry to facilitate
identification of cell
populations
• Fluorescent cell barcoding
can be used to increase
throughput of antibody
screens by flow cytometry

Acknowledgments
BD Cell Analysis
Stem Cell Research: Jeanne Elia
Nil Emre
Xiang-dong Ji
Jody Martin
Erika O’Donnell
Rosanto Paramban
Jurg Rohrer
Jason Vidal
Xiao Wang
Cytometry Lab:
Andrea Nguyen
Dennis Sasaki
UCSD Larry Goldstein
Shauna Yuan
Martin Marsala
Cleveland Clinic Jeremy Rich
Justin Lathia
Salk Fred Gage
Yangling Mu
If you have questions:
Contact your BD Biosciences Reagent Sales Account Manager
or email Applications Support
Visit our BD Stem Cell Research page: bdbiosciences.com/stemcell
For Research Use Only. Not for use in diagnostic or therapeutic procedures. Alexa Fluor® is a registered trademark of Molecular Probes, Inc. Cy™ is a trademark of Amersham Biosciences Corp. Cy™ dyes are subject to proprietary rights of Amersham Biosciences Corp and Carnegie Mellon University and are made and sold under license from Amersham Biosciences Corp only for research and in vitro diagnostic use. Any other use requires a commercial sublicense from Amersham Biosciences Corp, 800 Centennial Avenue, Piscataway, NJ 08855-1327, USA. Microsoft and Excel are registered trademarks of the Microsoft Corporation. BD, BD Logo and all other trademarks are property of Becton, Dickinson and Company. © 2012 BD