decentralizing the provision of public services in …
TRANSCRIPT
1
DECENTRALIZING THE PROVISION OF PUBLIC
SERVICES IN BOLIVIA
Institutions, Political Competition and the Effectiveness of
Local Government
Jean-Paul G. Faguet
London School of Economics and Political Science
Ph.D. in Development Studies
January, 2002
© 2002 Jean-Paul Faguet

2
Abstract
This dissertation comprises a close analysis of decentralization in Bolivia, employing a
methodology that marries qualitative and quantitative techniques. It first examines the
effects of decentralization on public-sector investment and the provision of public
services in Bolivia using a unique database that includes measures of municipalities’
social and institutional characteristics and information on its policy-making processes. I
find that decentralization changed both the sectoral uses of public resources and their
geographic distribution significantly by increasing government sensitivity to local needs
in human capital investment and the provision of basic services. I then investigate the
determinants of central and local government investment respectively in order to
investigate why the shift in regime produced such large changes in investment patterns.
I then turn to a much deeper examination of local government via nine case studies,
selected to broadly represent Bolivia’s national diversity. I begin with an account of the
workings of local government in the best and worst of these, analyzing the character and
interactions of the major societal actors. I locate fundamental causes of good and bad
government in the economic structure of a district as it relates to the political party
system, and the cohesiveness and organizational capacity of its civil society. These ideas
are used to build a conceptual model of the local government process in which the
interactions of political, economic and civic actors reveal information and enforce
accountability. I show how imbalances between them can cripple accountability and
distort the policy-making process. Lastly, the dissertation tests the model by examining
government performance in seven additional municipalities. I show that the framework
can explain the emergence of good or bad government institutions, and thus the quality
of government a district ultimately receives, through the interactions of key players –
notably civic organizations – deep in the local political economy.

3
Acknowledgements
The writing of a dissertation is far too long and complex an enterprise, benefiting
from the help and wisdom of far too many people, to permit comprehensive
acknowledgements. These are thus my thanks to those foremost in my mind at the end
of this process – those who gave me the most, and to whom my debt is greatest. First
among these are my advisers, Tim Besley and Teddy Brett. At the heart of the adviser’s
role is the desire to do good by guiding his student’s intellectual, and ultimately personal,
development. I still do not understand by what stroke of luck I ended up with Tim and
Teddy, but both men exemplified this ideal, challenging my hidden assumptions, forcing
me to re-think explanations and strip arguments down to their barest essentials, and
pushing me to be original and not just clever. Both gave large amounts of time and
effort, criticizing the various iterations of my work, helping me to wrestle with ideas,
providing crucial insights, and providing encouragement at critical junctures. Whatever
is accomplished in these pages is in very large part due to them.
Paying for a PhD is generally a prickly affair. I was very fortunate to have my
research financed by a grant from the World Bank Research Committee, and am grateful
to Shanta Devarajan and Gunnar Eskeland for their roles in securing this, as well as their
numerous insights into key issues of decentralization and public policy which helped to
push me forward at an early stage. An ORS award and additional financial support were
kindly provided by the ESRC. I would not have been able to do this work without either
of these awards, and offer both institutions heartfelt thanks.
I am also grateful to Armando Godínez, my mentor in all things anthropological,
who guided my understanding of the structure of rural village society and taught me a
great deal about conducting interviews and designing qualitative research. Ivette Arias
provided high-quality and timely research assistance in locating public investments in
space and helping to build the database. Alberto Leytón, Javier Reyes and Piter Olmos,
of the Secretariat of Public Investment and External Finance, were instrumental in
providing me with detailed data on municipal receipts and expenditures for a ten-year
span, as well as the wonderful censo municipal, which are at the heart of part 1 of this
dissertation. George Gray-Molina and Gerardo Molina of the Social Policy Analysis
Unit (UDAPSO) were similarly instrumental in providing social and demographic
indicators for all of Bolivia’s municipalities, as well as their own appraisal of how
4
decentralization was progressing. Fernando Medina, of the Secretariat of Popular
Participation, provided a huge amount of additional data on municipal characteristics.
And to this flood of numbers, Javier Jahnsen of the Campesino Development Fund
added the wit and wisdom of his interpretative insight.
I could not have done this work without the support, intellectual and material, of
Eduardo Araujo, David Borda, Marco Camacho, Juan Carlos Franco, Luis González,
Fernando Hernández, Guido Roca, Esteban Urgell, Rolando Vaca, Ginger Yapiz and
their many colleagues at the Social Investment Fund, whose daily routine takes them
throughout the length and breadth of Bolivia. They not only allowed me to rely upon
their knowledge and intuitions, but bundled me into their jeeps, airplanes and dugout
canoes and took me to see the places and people that populate part 2 of this work.
Without their aid and intimate knowledge of the country I would have been lost
I also wish to thank Roli Asthana, Monica Baumgarten, Markus Haacker, Peter
Kenen, François Ortalo-Magné, James Putzel, Chris Scott, Nicholas Stern, Paolo Verme
and seminar participants at the CEP, DESTIN, IDB, World Bank and at the LACEA99
conference for their thoughtful comments and suggestions. Their contributions have
improved this dissertation in many critical ways, remaining errors notwithstanding,
which are my own.
Lastly I must thank my mother and father, artist and scientist, who instilled in me
a love of knowledge and respect for learning from an early age; they read through all that
I produced and never flagged in their moral support. And Lisette, my beloved, who
suffered my efforts for far too long. You placed a well-judged distance – a cool,
beautiful shoulder – between this slowly-developing text and our married life, preventing
my problems from becoming ours. And then one day not too long ago you snatched the
text from my hands, scrutinized it intensely, and returned uncounted suggestions,
modifications, editorial and strategic advice, and above all an avalanche of ideas. No
question was too big or too small. We barely slept for several days in a hyper-alert final
blaze of writing and correction. Staring into darkness we pushed back the night, y tu
belleza alumbró nuestro camino.
Invariably I have forgotten or cannot name countless others – Alberto the FIS
chauffeur, with whom I spent a week in a jeep criss-crossing an area larger than many
European countries, who knew every municipal and civic leader we encountered; the
moto-taxista, his eyes wide with worry, who stopped to check on me after I crashed my
motorcycle on a muddy forest road returning from Cachuela Esperanza; the young man

5
from Atocha who guided me across the frozen highlands of southern Bolivia back to
Potosí; the corregidor of Porongo, who restrained my foolish intent to ford a swollen,
angry river Piraí, and whose wisdom was rewarded with two days and a night without
food in a cramped pickup truck. Please forgive my inadequate memory – I am grateful
to you all.
Perhaps most important of all are the people whose opinions, and indeed whose
lives, are reflected in these pages. Many of them live in conditions that we in the rich
West must stretch to imagine. And yet they gave me their time, information, and
wisdom for no good reason – because I was there and asked. It is not clear that they will
ever gain anything from this. But their generosity made this dissertation possible, and I
am forever grateful.

6
Table of Contents
Part I: Decentralizing Government
1. Introduction 8
2. Does Decentralization Increase Government Responsiveness to Local Needs? 19
3. How do Central and Local Government Differ? Two Extensions 49
Part II: The Local Governance System
4. Introduction to Part II 92
5. Viacha 104
6. Charagua 146
7. Theorizing Local Government 195
8. Testing the Theory: The Micro-Political Foundations of Government 227
in Seven Bolivian Municipalities.
9. Conclusion 287
Appendices
Appendix 1: Chapter 2 Data and Methodology 295
Appendix 2: Chapter 3 Data and Methodology 298
Appendix 3: Abbreviations 304
Appendix 4: Data Key 305
Appendix 5: Interview Questionnaires and Guides 324
Map of Bolivia (9 Municipalities) 91
Interview List 365
Bibliography 378

7
Part I
Decentralizing Government

Introduction
8
1 Introduction
Over the past two decades decentralization has become one of the broadest movements,
and one of the most debated policy issues, in the world of development. It is at the
center of reform efforts throughout Latin America and in many countries of Asia and
Africa. And under the multiple guises of subsidiarity, devolution and federalism it is
also squarely in the foreground of policy discourse in the European Union, United
Kingdom and United States. While Manor recently called it “a quiet fashion of our
time”1, Campbell now refers to “The Quiet Revolution”2, hinting perhaps at the extent to
which momentum and enthusiasm for decentralization have grown over just four years.
It is not only the fact of decentralization in many countries which impresses but, as
Campbell points out, the scope of political authority and economic and human resources
that have been devolved to sub-national governments: “from Guatemala to Argentina,
local governments began spending 10 to 50 percent of central government revenues” 3
effectively reversing decades of control by national governments.
The literature on decentralization is similarly broad, spanning academic
disciplines and literally scores of countries. This dissertation focuses on the economics,
political science, public choice and applied policy literatures. The first three are
examined in detail in Chapters 2, 4 and 7, which adopt the conceptual tools of each. In
general, all three have found cause for enthusiasm about decentralization, for reasons of
heterogeneity in tastes or needs across regions, for example, or based on arguments
about accountability and democratic representation. Although each discipline also
contains important arguments against decentralization, as a broad generalization political
scientists and economists have (recently) found the case in favor more compelling.
What I loosely term the “applied policy literature” comprises a huge body of
work, much of it public-management-oriented, which attempts to draw lessons on the
efficacy of decentralization from particular country or regional experiences, or
1 Lecture, Technical Consultation on Decentralization, Rome, 16 December 1997. 2 The title of Campbell (2001). 3 ibid., p.2.

Introduction
9
increasingly cross-country surveys. It can fairly be said to dominate the literature on
decentralization, if only in terms of volume, and has had considerable influence on the
approach of multilateral organizations and international policy analysts to reform. And
yet its conclusions are far from clear-cut. A number of authors have already produced
extensive surveys of this literature; it is not my intent to add to these, but rather to
quickly summarize the main conclusions, and then focus on the findings that are of
particular relevance to this study.
In their wide-ranging 1983 survey, Rondinelli, Cheema and Nellis note that
decentralization has seldom – if ever – lived up to expectations. Most developing
countries implementing decentralization experienced serious administrative problems.
Although few comprehensive evaluations of the benefits and costs of decentralization
efforts have been conducted, those that were attempted indicate limited success in some
countries but not others. Nonetheless the authors conclude that guarded optimism is
warranted, due to the small number of cases where decentralization had brought about
small but clear improvements. A decade and a half later, surveys by Piriou-Sall (1998),
Manor (1999) and Smoke (2001) also come to cautiously positive conclusions, but also
with caveats about the strength of the evidence in decentralization’s favor. Manor ends
his study with the judgment that “while decentralization …is no panacea, it has many
virtues and is worth pursuing”, after noting that the evidence, though extensive, is still
incomplete. Smoke asks whether there is empirical justification for pursuing
decentralization and finds that the evidence is mixed and anecdotal.
Why has our understanding not advanced? The tentative nature of these
conclusions contrasts with the sheer size of the literature: hundreds of studies written
over five decades, ranging from close examinations of individual communities to
international comparisons. Why, after so much time and given the vast scale of what is
effectively an international social experiment, is empirical evidence on decentralization’s
effects so mixed? Part of the difficulty in any assessment of decentralization is that the
claims made on its behalf are so many, and so varied. In the discussion below, I follow
Inman and Rubinfeld, who nicely collapse the many justifications for decentralization
into three broad arguments,4 and ask How does decentralization affect (i) public sector
efficiency, (ii) government responsiveness to local wants and needs, and (iii) political
participation and a sense of the democratic community? I should note that this
4 Inman and Rubinfeld (1997), p.44.

Introduction
10
dissertation will focus squarely on the second question. I consider participation in depth
as well, not for its own sake but as a means to the end of improved government
responsiveness.
The first question, that of decentralization’s effect on public sector efficiency, is
an extremely broad one, ranging from large issues of macroeconomic management to
specific questions of cost improvements on small-scale projects. On the former, Tanzi
(1995) and Prud’homme (1995) set out clear examples of the dangers decentralization
can pose to macroeconomic stability. Treisman (1999) cites recent events in Yugoslavia,
Russia, Argentina and Brazil to suggest that decentralization can interact with economic
liberalization to intensify fiscal, macroeconomic and even territorial instability.
Dillinger and Webb (1999) show that decentralization has led to significant fiscal
problems in Colombia, at both the national level as central resources are transferred
outwards, and the sub-national level where unsustainable deficits have accumulated.
And Wildasin (1998) cites a number of countries where decentralization-inspired deficits
have put pressure on central banks to monetize debt, placing exchange rates and price
stability at risk. Shah’s (1998a) is practically the lone voice asserting that decentralized
fiscal systems offer greater potential for macroeconomic management than do
centralized systems, largely due to better clarity and transparency in the rules of the
game.
On the related question of corruption, Fisman and Gatti (2000) – despite
ambiguous predictions from the theoretical literature – find that fiscal decentralization is
consistently associated with lower measured corruption across a sample of countries.
But Blanchard and Shleifer (2000), distinguishing the case of Russia from Weingast’s
(1995) account of China, argue that local governments’ capture by existing firms and the
competition for rents by local officials eliminated incentives to firm entry in Russia, thus
strangling a nascent economy. They attribute the absence of such behavior in China –
and hence the superior performance of its decentralization – to political centralization
through the party.
There is evidence that decentralization can improve cost efficiency at the sectoral
level. Humplick and Moini-Araghi (1996) use panel data to study the cost of road
provision; they conclude that concave resource costs are offset by downward-sloping
“preference costs”, so that initial losses in economies of scale from decentralization are
outweighed by efficiency gains when the locus of roadworks is closer to the people.
Where road maintenance was decentralized, unit costs were lower and roads were of
Introduction
11
better quality. In Mexico, World Bank studies of small-scale rural projects managed by
the Comités de Solidaridad (community groups supported by World-Bank-financed
projects) have found cost savings of up to 50% relative to similar projects managed by
state agencies.5
Piriou-Sall describes a mixed record on education: in Brazil decentralization
resulted in increased administrative costs, while Chile managed to avoid this problem.
Decentralization also boosted the overall cost-effectiveness of health services in the
latter country. Estache and Sinha (1995) highlight some of the methodological
difficulties faced by the decentralization scholar. Their study of twenty countries’
spending on infrastructure over ten years finds that decentralization increased both total
and sub-national spending on public infrastructure. As they note at the outset, however,
no conclusions can be drawn from this about whether decentralization made spending
more or less efficient. They point out various data problems: the absence of information
on autonomous parastatals’ spending; the inability to distinguish between capital and
recurrent expenditures; and finally the volatility of exchange rates and multiplicity of
exchange rate regimes, which made data from one of the countries unreliable. To these
can be added the perils of using measures such as the share of sub-national expenditure
in total expenditure to define the degree of decentralization.6
Research into the question of the effect of decentralization on government
responsiveness to local need is considerably more scarce. Piriou-Sall and Smoke agree
that few scholars have systematically assessed the impact of decentralization on service
delivery. One case study of decentralization in Colombia often cited found that
satisfaction with government and local services improved notably after decentralization.7
In Brazil, Piriou-Sall notes that decentralization may have increased access to education,
but might also have worsened inequalities between regions. In a carefully researched
econometric study, Galasso and Ravallion (2000) show pro-poor program benefits
increased with decentralization in Bangladesh. Case studies reported in Rondinelli et.al.
and Manor find that decentralization increased the access of people in neglected rural
areas to central government resources and institutions in most of the countries studied.
The former note evidence from Indonesia, Morocco, Thailand, Pakistan, and Tunisia that
shows “perceptible” improvements in resource distribution, extension of public services,
5 World Bank (1994). 6 See Smoke (2001), p.12 for a specific example. 7 World Bank (1995)

Introduction
12
and project identification and implementation. Devolution in Papua New Guinea also
seems to have made government more responsive to local needs, largely by improving
the capacity of provincial administrators.
On this last point Manor stands out for his enthusiasm, citing what he terms
strong evidence from Colombia, the Philippines, India and Côte d’Ivoire that
decentralization enhances the responsiveness of government. His claim contradicts the
World Development Report 1997, which states that little comparative evidence to this
effect exists. Samoff (1990), on the other hand, finds the evidence negative, asserting
that decentralization schemes around the world have largely failed to work. They have
neither enhanced local capacities nor improved local programs, in large part because
they were neutralized by elaborate mechanisms of central supervision and control.
Slater (1989) supports this view with the example of Tanzania, where elected councils
were eliminated and replaced by District Development Councils which reported directly
to central government, leading one observer to comment that “the state was now moving
its guns from Dar-es-Salaam to the villages”.8
Turning to the question of political participation and democratic community, a
cross-country study by de Mello (2000) makes use of indicators of social capital such as
confidence in government and civic cooperation to suggest that social capital can be
boosted by fiscal decentralization. He notes various weaknesses in the data as well as
likely endogeneity problems which make his empirical findings suggestive rather than
conclusive. Huther and Shah (1998) construct an index of quality of governance for a
sample of 80 countries and find that indices of political freedom and political
participation are positively correlated with an index of fiscal decentralization. They also
find positive correlations between decentralization and indices of social development,
economic liberalization, a quality index of economic management, and an overall
government quality index, from all of which they infer causal relationships.
Various case studies described by Parker (1995) find evidence in Colombia,
Mexico and Brazil that decentralization increased beneficiary participation in decision-
making in rural development schemes, leading to superior outcomes. Parker also relates
the suggestive story of decentralization in Bangladesh, where extremes of wealth and
power allowed local elites to capture nascent local governments. Subsequent elections
8 Slater (1989), p.514, commentator unidentified.

Introduction
13
overcame this distortion, however, and over 90 percent of local councilmen were ejected
from office.9
The broad range of conclusions on the overall effects, or “performance”, of
decentralization summarized above underline the deeper point that decentralization is
inherently neither “good” nor “bad”, but rather an institutional form which may be useful
in certain circumstances to achieve certain ends (Bird 1994, among others). The
question then becomes: Under what conditions does decentralization flourish? A
number of authors have focused on what variations in performance can tell us about the
conditions necessary for successful decentralization. It is important at this stage to make
a clear distinction between two fundamentally different sets of factors: essentially
technocratic issues of program design; and the pre-existing, largely exogenous
economic, political, social and other (geographic? cultural?) attributes of society that
affect how it is governed. The first category is inspired above all by a concern for legal,
institutional and political instrumentality, asking if the reforms it examines were
appropriate to desired results. Parker’s “soufflé theory of decentralization”, which
underlines the importance of achieving just the right mix of political, administrative and
fiscal tools, falls clearly into it, as to a lesser extent do Rondinelli et.al. and Smoke. The
second category is epitomized by Putnam’s (1993) argument that social capital, defined
as horizontal linkages within society, is the decisive factor for achieving good local
government. Putnam’s contribution is particularly salient to my research, and I return to
it in Chapter 4. Other contributors include Fisman and Gatti, and Manor. This strain of
the literature teaches us that decentralization is better suited to contexts with:
• democratic political traditions • relative macroeconomic stability • low local socio-economic disparities • low levels of pre-existing political conflict • high heterogeneity in demand for public services • low population density, and • legal origins in the common law system. This study falls unequivocally into the second camp. I focus on the impact of
decentralization within a single country, allowing me to take policy design and macro-
institutional context as given, and focus instead on the differing effects of local
economic, political and social characteristics as they vary across municipalities.
Although such factors are properly held to be exogenous by theoretical political
9 Parker (1995), p.25.

Introduction
14
economy, my research design in a sense endogenizes them as the central object of study.
This is in explicit contrast to the program design school, which leaves such issues at the
periphery of research, focusing instead on how policy tools and outcomes vary across
countries. My approach is consistent with a judgement that social characteristics are
more important than program design, which I do not disown.
But even such contingent results regarding when decentralization may be
appropriate are few, and weak in light of the mass of studies undertaken. This is in large
part due to a definitional failure at the core of the subject. Instead of articulating a clear
definition of decentralization from the start, many authors have often allowed themselves
to be led conceptually by the phenomena they have encountered. The quasi-spontaneous
definition which has so emerged is thus opaque, malleable and ultimately unstable. It
ranges from the deconcentration of central personnel to field offices in authoritarian
systems, to wholesale divestiture of public functions to the private sector (see Ostrom
et.al. (1993) and Rondinelli, et.al. for detailed discussions). As a result, researchers
often use the same language to talk about different things, and the literature as a whole
stagnates. This multiplication of meanings is not entirely incidental, as Slater notes,
paraphrasing Curbelo.
The popularity of the concept of decentralization can be linked to a combination of elements – its ambiguity, its capacity to conceal more than it reveals, its identification with long-established sentiments, its facile justification from purely technocratic points of view and the political instrumentality that it potentially engenders.10
This study seeks avoid some of the pitfalls identified above first by proposing a
definition of decentralization that is conceptually discrete, and so facilitates analytical
precision.
Decentralization is the devolution by central (i.e. national) government of specific functions, with all of the administrative, political and economic attributes that these entail, to democratic local (i.e. municipal) governments which are independent of the center within a legally delimited geographic and functional domain.
I restrict my focus to decentralization under democratic regimes. The reasons for
choosing this usage are both compelling and fortuitous. First, its restrictiveness aids
analysis by excluding a number of phenomena which, though superficially similar, are in
incentive terms fundamentally different to that which I study here;11 this greatly
simplifies the identification of endogenous and exogenous variables, and thus the
10 ibid., p.501. 11 Such as deconcentration and privatization.
Introduction
15
measurement of ultimate effects. And second, the case of Bolivia involves precisely this
form of decentralization, implemented vigorously.
I then seek to push the question of decentralization onto more fertile terrain by
departing from the main body of literature in two important ways: (1) a one-country
focus which seeks results that do not have worldwide generality, but are conclusive and
convincing regarding the effects of decentralization in Bolivia; and (2) an explicitly
interdisciplinary approach that combines econometric tests for broad questions amenable
to such techniques with qualitative research that probes deeper into issues where data-
intensive methods are either impossible or inappropriate. By marrying contrasting
approaches in this way, I seek to generate a higher level of overall methodological rigor
than either independently could achieve. In addition, the complex nature of
decentralization processes, as well as the thread of my initial findings and the questions
that they in turn prompted, argue for focused interdisciplinarity.
The text is divided into two parts. Part I, which opens with this chapter, relies
mainly on the empirical and theoretical tools typical of applied economics to study the
Bolivian experience. Chapter 2 begins describing Bolivia’s 1994 reform, and then
examines whether decentralization changed government responsiveness to local need,
and if so how, using a unique database that includes measures of municipalities’ social
and institutional characteristics, as well as information on its policy-making processes.
The tight focus of the question renders it both well-suited to the characteristics of the
available data, and answerable in an unambiguous way. This methodological approach
allows me to study variations in local social, economic and institutional characteristics
while holding constant for national factors, variation in which bedevils cross-country
studies generally. It also marks a break with the literature by adopting a quantitative
approach to the question of responsiveness. Evidence to date on this issue is
overwhelmingly qualitative, based on case study. My empirical tests show that
decentralization did change the distribution and use of investment across Bolivia, with
the ultimate effect of making government more sensitive to local need (e.g. education
investment rises where illiteracy is higher). Impressively, these national changes were
driven by the smallest, poorest municipalities investing in their highest-priority projects.
How can we explain such differences in behavior? What institutional or political
features link policy-making to need at the local level while isolating them at the center?
The empirical findings of Chapter 2 are consistent with a model of public investment in
which local government’s superior knowledge of local needs dominates the center’s

Introduction
16
technical and organizational advantage in the provision of public services. But in order
to understand why decentralization has the effects that it does, we must understand how
central and local government work; we must go beyond ad hoc assumptions and
investigate the processes by which decisions are taken under each regime.
Chapter 3 uses econometric models of policy-making to do this. I seek to exploit
information on the political, administrative and procedural characteristics of government
to investigate the determinants of central and local government investment separately.
The complex social and institutional nature of the mechanisms in question imply that
such attempts push econometrics to the limits of its explanatory power, my extensive
database notwithstanding. I find that central government investment is regressive both
economically and in terms of need. Local government investment decisions are
progressive, and largely determined by a competitive interest group dynamic which
provides poorer citizens, as well as private sector firms and civic institutions, with
political voice. This ensures that accountability is binding for elected officials. My
results highlight the importance of the legal-political "hardware" of an open and
transparent local political system, in marked contrast to the training and systems
"software" approach that dominates many donors' good governance programs, which
appears to have little effect on policy outputs. I also develop a model of government
which relies on political bargaining between municipal representatives and central agents
over the allocation of public resources. By invoking central government self-interest, I
can explain the two central facts of Bolivian decentralization: (1) the sharp fall in the
geographic concentration of investment, and (2) the sea-change in the uses of investment
away from infrastructure towards the social sectors.
Part I underlines that in order to understand decentralization, both its aggregate
effects and why it appears to work better in some places than others, we must
comprehend the inner workings of local government. The tools of economic theory
employed therein can suggest general reasons why certain changes occur, but are not
adequate for analyzing in depth the social and institutional factors which actually bring
them about, nor for establishing causality.
Thus Part II of the dissertation exploits qualitative information from extensive
field work to conduct a much deeper and more detailed examination of local government
in nine case studies, selected to broadly represent Bolivia’s regional, economic, political
and social characteristics. Chapter 4 introduces the main issues through the lens of
political science’s understanding of local government, and introduces the conceptual

Introduction
17
framework of the new institutional economics. Chapters 5 and 6 provide an account of
the workings of local government in the best and the worst cases, using the tools of
comparative politics to analyze the character and interactions of the major political,
economic and social actors in great detail. I seek to establish how democracy at the local
level actually works – what is the social and institutional dynamic that leads to real
policy decisions of the sort that generated the patterns found in Part I. I locate the
fundamental causes of good and bad government in the economic structure of a district
as it relates to the political party system, and in the cohesiveness and organizational
capacity of its civil society. Chapter 7 abstracts away from these results to explain the
local government process through the interactions of political, economic and civic actors.
I describe a simple model of local government in which control rights over public
institutions and resources are allocated to politicians in a first stage, and policy is
determined in a second stage through a series of single issue lobbying sub-games. I then
operationalize the model for qualitative research by collapsing it into an atemporal
framework focused on the real institutions of local government, and their interactions
with the major economic, political and social actors in a given district. I show how
imbalances between these elements can cripple accountability and distort the policy-
making process.
Chapter 8 returns to the other seven municipalities, testing the model on a larger
and more diverse set of districts. It analyzes the economic, social and political
determinants identified above, and shows that my local governance framework can
explain the emergence of responsive and accountable institutions of government with
greater accuracy than competing explanations of government performance. I review
evidence from all nine case studies and identify the quality of local politics as emerging
endogenously from interactions between economic structure and the degree of civic
organization, both exogenously determined. Overall, civil society – and especially its
coherence and organizational capacity – is the key to explaining local government
performance. In order to understand where government works and where it doesn’t, it is
necessary to study the insertion of civil society into the governing process. Chapter 9
concludes by synthesizing the results of the dissertation, and returning to the question of
why local government proved systematically more responsive to local needs than central
government.
Lastly, a few words on the history of decentralization in Bolivia. Readers will
notice that the subject is mostly absent from the chapters that follow. This is chiefly

Introduction
18
because the topic is not directly related to the main thrust of my research agenda. Fully
expecting the opposite, I investigated the economic and political history of reform in
Bolivia extensively,12 discovering that the most salient quality of decentralization was its
ahistorical character. The Law of Popular Participation (LPP), as reform was christened,
marked an important break with three decades of discourse amongst Bolivia’s policy-
making and regional elites. Since the 1960s, the decentralization debate focused on
Bolivia’s nine departments. Regional elites, especially the powerful Comité Pro-Santa
Cruz, bid for power and resources by appealing to strong regional identities, and
threatening civic disorder and even secession.13 Their efforts were largely blocked by
concerns for the unity of a highly diverse nation with a chronically weak state.
So ingrained was this regional concept of decentralization in the policy discourse
that, according to one close observer of the process, the first 30-odd drafts of the LPP
ignored municipalities entirely.14 The idea to “go lower” originated late in the process
with President Sánchez de Lozada himself, who sought above all to promote accountable
local government. Remaining details were finalized by a small team of technocrats
without consultation until the law was ready to be presented to the nation. Hence
Bolivia represents an episode of discontinuous reform, and not a process of negotiation
or accommodation amongst competing interest groups. Although the many local
contexts of decentralization – historical and otherwise – are central to its success (or
failure) across 311 districts, the national environment is simply less significant than it
might be elsewhere. Moreover the history of decentralization – without doubt an
interesting one – has already been told in accounts which are detailed and insightful.15
12 The interviews in La Paz, for example, were mostly on this topic (see Interview List). 13 For a discussion of Santa Cruz’s regionalism and central-local relations, see Rodríguez (1993), and Dunkerley (1984) Chapter 3. 14 David Tuchschneider, World Bank rural development officer, interview, La Paz, 3 May 1997. 15 See for example Molina (1997), Gonzales-Arana (1992) and Grupo DRU (1996).

Does Decentralization Increase Responsiveness to Needs?
19
2
Does Decentralization Increase Government Responsiveness to Local Needs?
1. Introduction
Chapter 1 discussed the curious discrepancy between enthusiasm for
decentralization amongst governments and policy analysts across the world, and the
weak and contradictory evidence on its effects. In particular the literature records no
econometric analysis of the effects of decentralization on government responsiveness to
local needs, and relevant anecdotal evidence is ambiguous. This is especially surprising
given that increased responsiveness constitutes one of the central claims in favor of
reform. This chapter seeks to fill the gap by examining this question in a careful,
methodical way using data from Bolivia. Focusing on one country allows me to control
for political regime, external shocks, and other exogenous factors more systematically
than a cross-country approach can. And Bolivia is particularly appropriate since reform
was comprehensive and sustained, and so constitutes a social experiment. It also
coincided with a huge upsurge in the collection of local-level and national data which are
of surprising scope and quality, including political, institutional, and even
procedural/administrative indicators for all of Bolivia’s 311 municipalities. The use of
such variables constitutes an innovation of this dissertation.
The remainder of the chapter is organized as follows. Section two discusses
Bolivia’s decentralization program, and then examines the changes in national resource
flows which it brought about. Section three develops a model to analyze the trade-off
between local government’s knowledge of local needs v. central government’s technical
and organizational advantage in the provision of public services in districts with
heterogeneous preferences. Section four tests whether decentralization changed public
investment patterns across Bolivia’s 311 municipalities, and then examines the
determinants of this change focusing on variables of need. Section five concludes.

Does Decentralization Increase Responsiveness to Needs?
20
2. Decentralization In Bolivia
2.1 Popular Participation And The Decentralization Reform
On the eve of revolution, Bolivia was a poor, backward country with extreme
levels of inequality, presided over by a “typical racist state in which the non-Spanish
speaking indigenous peasantry was controlled by a small, Spanish speaking white elite,
[their power] based ultimately on violence more than consensus or any social pact.”16
The nationalist revolution of 1952, which expropriated the “commanding heights” of the
economy, land and mines, launched Bolivia on the road to one of the most centralized
state structures in the region. The government embarked upon a state-led modernization
strategy in which public corporations and regional governments initiated a concerted
drive to break down provincial fiefdoms, transform existing social relations, and create a
modern, industrial, more egalitarian society. To this end the President directly appointed
Prefects, who in turn designated entire regional governments and associated
dependencies, forming a national chain of cascading authority emanating from the
capital.
Successive governments through the 1950s promoted the unionization of miners,
laborers, peasants, public servants and professionals into a hierarchical “peak
association”, whose representatives negotiated national policies directly with their
similars from the private sector and government. Together these three planned the
exploitation of Bolivia’s natural resources, the development of new industries, and
sectoral and regional policy in a bid to orchestrate a rapid development process from the
heights of La Paz. The intellectual trends of the 1950s-1970s, Dependencia theory,
Import Substitution Industrialization, and Developmentalism, only contributed to this
tendency, as did the military governments which overthrew elected administrations with
increasing frequency from the 1960s on.17 With political power so little dispersed, there
was little point in establishing the legal and political instruments of local governance.
As a result beyond the nine regional capitals (including La Paz) and an additional 25-30
cities, local government existed in Bolivia at best in name, as an honorary and
ceremonial institution devoid of administrative capability and starved for funds. And in
most of the country it did not exist at all.
16 Klein (1993), p.237. Author’s translation. 17 See Klein (1993), Chapter 9.

Does Decentralization Increase Responsiveness to Needs?
21
Against this background, the Bolivian decentralization reform was announced in
1994. The Law of Popular Participation, developed almost in secret by a small number
of technocrats, was announced to the nation to general surprise, followed by ridicule,
followed by determined opposition of large parts of society.18 First made public in
January of that year, the law was promulgated by Congress in April and implemented
from July. The scale of the change in resource flows and political power that it brought
about were enormous. The core of the law consists of four points:19
1. The share of national tax revenues devolved from central government to municipalities was raised from ten percent to twenty percent. More importantly, whereas before these funds were apportioned according to ad hoc, highly political criteria, after decentralization they are allocated on a strict per capita basis (see below).
2. Title to all local health, education, roads, irrigation, culture and sports infrastructure was transferred to municipalities free of charge, along with the responsibility to administer, maintain and equip it, and invest in new infrastructure.
3. Oversight Committees (Comités de Vigilancia) were established to oversee municipal spending of Popular Participation funds, and propose new projects. These are composed of representatives from local, grass-roots groups who can petition to have disbursements from central government suspended if they judge that such funds are being misused or stolen. When suspension occurs, the center undertakes no arbitration, but simply waits for the two sides to resolve their dispute, relying on economic incentives to speed agreement.
4. 198 new municipalities – 64% of the total – were created, and existing ones expanded to include suburbs and surrounding rural areas.
The reform heralded a new era of municipal government for the overwhelming majority
of Bolivian towns and cities. In many parts of Bolivia where before the state was
present, if at all, in the form of a local schoolhouse, health post, or perhaps military
garrison or customs office, each reporting to its respective ministry, there was now for
the first time elected local government accountable only to local voters.
2.2 Descriptive Statistics
The extent of the change is perhaps best appreciated by examining the changes in
resource flows that it catalyzed. Figure 1 shows that before decentralization 308
Bolivian municipalities divided amongst them a mere 14% of all devolved funds, while
the three main cities took 86%. After decentralization their shares reversed to 73% and
18 “Participación Popular: Se Cierne La Tormenta”, Reflejos de la Semana, No.368, 14-21 January 1994; “Injertos Tramposos en “Participación Popular””, Hoy, 19 January 1994; “La Declaratoria de Guerra del Primer Mandatario”, La Razon, 27 January 1994; “Arrogancia Insultante”, Presencia, 27 February 1994; and “Participación Popular: Se Democratiza la Corrupción?”, La Razon, 6 March 1994 are only a few of the many articles which appeared in the Bolivian press documenting popular reaction to the “Ley Maldita” (“Damned Law”).

Does Decentralization Increase Responsiveness to Needs?
22
27%. The per capita criterion resulted in a massive shift of resources in favor of the
smaller, poorer districts.
% of NationalTotal
City 1993 1995 % Change 1993 1995La Paz 114,292 61,976 -46% 51% 10%Santa Cruz 51,278 63,076 23% 23% 10%Cochabamba 25,856 38,442 49% 12% 6%
3 Cities Sub-total 191,427 163,494 -15% 86% 27%Rest of Bolivia 32,099 444,786 1286% 14% 73%
Total 223,525 608,280 172%
Central-to-LocalRevenue Sharing (Bs'000)
Figure 1: The Changing Allocation of Public Funds
A more important and telling change was to the composition of investment.
Figure 2 shows central and local government investment by sector for the periods 1991-3
and 1994-6 respectively. The differences are large. In the years leading up to 1994
central government invested the largest sums in transport, followed by hydrocarbons,
multisectoral20 and energy. Together these four sectors account for 73% of total public
investment during 1991-3. But after decentralization local governments invest most
heavily in education, urban development, and water & sanitation, together accounting for
79% of municipal investment. Of the sectors accounting for roughly three-quarters of
total investment in both cases, central and local government have not even one in
common. The evidence implies that local and central government have very different
investment priorities.
19 Ley de Participación Popular, Reglamento de las Organizaciones Territoriales de Base, Secretaría Nacional de Participación Popular, Ministerio de Desarrollo Sostenible y Medio Ambiente, 1994. 20 A hodgepodge of projects including feasibility studies, capital acquisitions, technical assistance and emergency relief that is difficult to categorize.

Does Decentralization Increase Responsiveness to Needs?
23
Figure 2: Local v. Central Government Investment
0% 5% 10% 15% 20% 25% 30% 35%
Education
Urban Dev't
Water & San.
Transport
Health
Energy
Agriculture
Water Mgt.
Multisectoral
Communications
Industry
Hydrocarbons
Se
ctor
% Total Investment
Local
Central
Lastly, it is instructive to examine how investment was distributed
geographically among Bolivia’s municipalities before and after decentralization. Figures
3-5 below give us a rough sense of this by placing Bolivia’s municipalities along the
horizontal axis and measuring investment per capita as vertical displacement. A highly
skewed allocation would appear as a few points strewn across the top of the graph, with
most lying on the bottom; an equitable distribution would appear as a band of points at
some intermediate level. How does Bolivia compare? Figure 3 shows that per capita
investment before decentralization was indeed highly unequal, with large investments in
three districts and the vast majority at or near zero. Figure 4 corrects for the skewing
effect of the highest observations by excluding the upper twelve and showing only those
below Bs.2000/capita. Though the distribution now appears less unequal, there is still
monotonically increasing density as we move downwards, with fully one-half of all
observations on or near the horizontal axis. Investment under centralized government
was thus hugely skewed in favor of a few municipalities which received enormous sums,
a second group where investment was significant, and the unfortunate half of districts
which received nothing. Compare this with figure 5, which shows municipal investment
after decentralization. This chart shows no district over Bs.700/capita, a broad band with

Does Decentralization Increase Responsiveness to Needs?
24
greatest density between Bs.100-200/capita, and only a few points touching the axis.
Average municipal investment for this period is Bs.208/capita, and thus the band
contains the mean.21 These crude indicators imply that central government, with a much
larger budget and free rein over all of Bolivia’s municipalities, chose a very unequal
distribution of investment across space, while decentralized government distributes
public investment much more evenly throughout the country.
Figure 3: Investment per capita, 1991-93
0
10,000
20,000
30,000
40,000
50,000
60,000
0 50 100 150 200 250 300
Municipal Identity No.
Bs
per
capi
ta
Figure 4: Investment per capita, 1991-93
0
500
1,000
1,500
2,000
0 50 100 150 200 250 300
Municipal Identity No.
Bs
per
capi
ta
21 Investment sums here are much lower because they exclude central government funds.

Does Decentralization Increase Responsiveness to Needs?
25
Figure 5: Local Investment per capita, 1994-96
0
100
200
300
400
500
600
700
0 50 100 150 200 250 300
Municipal Identity No.
Bs
per
capi
ta
3. Theory
3.1 Background
In terms of productive efficiency, central government should be naturally
superior to local government so long as returns are at least slightly increasing. Any
economic case for decentralization must therefore invoke a counterbalancing source of
efficiency in which local government has an advantage. Different authors have
approached the problem in different ways. Tiebout’s (1956) seminal work posits a
world in which individuals move costlessly amongst localities that offer different levels
of provision of a public good. The ensuing competitive equilibrium in locational choices
produces an efficient allocation. But this approach assumes a highly mobile population
and fixed governments, which is at odds with both anecdotal evidence from Bolivia and
studies of the (comparatively mobile) United States, as Bardhan (2001) points out.22 A
better assumption would seem to be that government is the mobile element in most local
democratic systems, changing with relative frequency, whereas the population is
essentially fixed over typical, four or five year electoral periods. European countries’
notably low rates of internal migration support this view. Tiebout-style “voting with
your feet” is undoubtedly a valid mechanism for preference revelation at the margins,
and may be more important for particular services, such as education. But the principal
mechanism for joining demand and supply for public goods must involve the political
process. Indeed this is arguably why local government exists at all.

Does Decentralization Increase Responsiveness to Needs?
26
Oates (1972) examines heterogeneity in tastes and spillovers from public goods
through a model in which local government can tailor public goods output to local tastes,
whereas central government produces a common level of public goods for all localities.
He finds that decentralization is preferred in systems with heterogeneous tastes and no
spillovers; with spillovers and no heterogeneity, centralization is superior on efficiency
grounds. But Oates’ results rest largely on his assumption of uniform central provision
of public goods which, though it mirrors an empirical regularity, is theoretically
ungrounded and problematic when viewed in the Bolivian context. Besley and Coate
(1999) provide a model in which this restriction is lifted. Like Oates, they invoke
uniform taxation to finance public goods provision. But they then devise a model of
central policy-making in which elected representatives bargain over public goods
provision in multiple districts. For heterogeneous districts, they find that
decentralization continues to be welfare superior in the absence of spillovers, but
centralization is no longer superior when spillovers are present. They also find that
higher heterogeneity reduces the relative performance of centralization for any level of
spillovers. This model is both more representative of how real central governments
operate, and more in keeping with the facts of the Bolivian transition from centralized to
decentralized provision. The results below can be interpreted as an indirect test of their
findings, given reasonable assumptions about representative local utility functions. Thus
construed, my results weakly support their findings.
Bardhan and Mookherjee (1998) develop a model of public service provision
which examines the implications of decentralization for the targeting and cost-
effectiveness of public expenditure. They find that for provision of a merit good
available on competitive markets to the poor, decentralization dominates with respect to
inter-community targeting and cost-effectiveness, though not necessarily for intra-
community targeting. For the provision of infrastructure, decentralization dominates
only if local governments are not vulnerable to capture, local government has adequate
financing, inter-jurisdictional externalities do not exist, and local governments have all
the bargaining power vs. public enterprise managers. On a separate but related issue,
Persson, Roland and Tabellini (1997) examine how the separation of powers can lead to
political accountability. They examine how voters can combine incentives produced by
elections and the separation of powers to control moral hazard and reduce politicians’
22 Bardhan cites Hanson and Hartman’s (1994) finding that few poor people move amongst US states in
Does Decentralization Increase Responsiveness to Needs?
27
rents under a variety of constitutional regimes (presidential, parliamentary, etc). Under
appropriate checks and balances, they find that separation of powers helps voters elicit
information about both politicians and the state of nature. These results are of interest
not only here but for Part II as well, as the separation of powers is central to the
operation of local government in Bolivia.
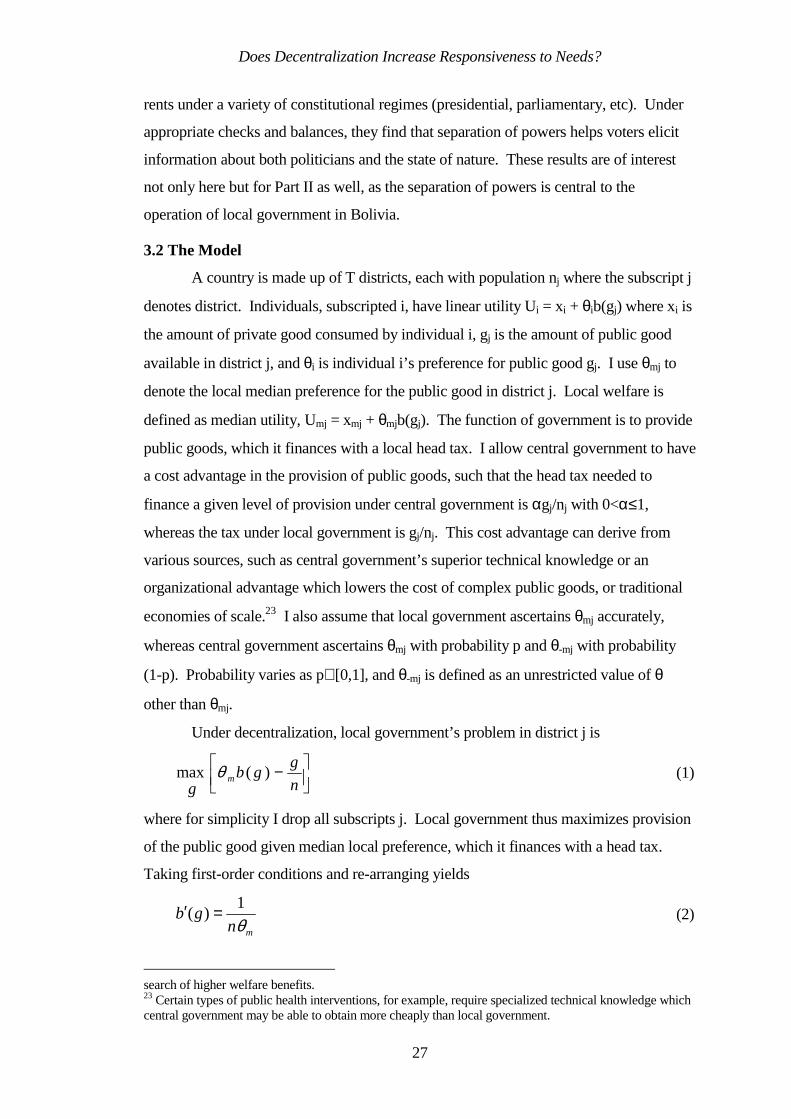
3.2 The Model
A country is made up of T districts, each with population nj where the subscript j
denotes district. Individuals, subscripted i, have linear utility Ui = xi + θib(gj) where xi is
the amount of private good consumed by individual i, gj is the amount of public good
available in district j, and θi is individual i’s preference for public good gj. I use θmj to
denote the local median preference for the public good in district j. Local welfare is
defined as median utility, Umj = xmj + θmjb(gj). The function of government is to provide
public goods, which it finances with a local head tax. I allow central government to have
a cost advantage in the provision of public goods, such that the head tax needed to
finance a given level of provision under central government is αgj/nj with 0<α≤1,
whereas the tax under local government is gj/nj. This cost advantage can derive from
various sources, such as central government’s superior technical knowledge or an
organizational advantage which lowers the cost of complex public goods, or traditional
economies of scale.23 I also assume that local government ascertains θmj accurately,
whereas central government ascertains θmj with probability p and θ-mj with probability
(1-p). Probability varies as p∈[0,1], and θ-mj is defined as an unrestricted value of θ
other than θmj.
Under decentralization, local government’s problem in district j is
−n
ggb
gm )(max θ (1)
where for simplicity I drop all subscripts j. Local government thus maximizes provision
of the public good given median local preference, which it finances with a head tax.
Taking first-order conditions and re-arranging yields
mn
gbθ1
)( =′ (2)
search of higher welfare benefits. 23 Certain types of public health interventions, for example, require specialized technical knowledge which central government may be able to obtain more cheaply than local government.

Does Decentralization Increase Responsiveness to Needs?
28
The level of public good provided by local government is thus an implicit function of θm,
the median preference for the public good, and of the population n. Citizens receive the
level of public good that they prefer, which they pay for fully.
Central government’s problem is
( )
−−+ ∑∑
− j
j
j
jj mjmjT n
ggbpp
ggαθθ )(1
,...,max
1
(3)
Solve for district j. Taking first-order conditions and re-arranging yields
( )
−−+=′
mm ppngb
θθα1
)( (4)
The level of public good provided by central government is thus an implicit function not
only of local median preference and population, but also of the probability that central
government correctly assesses local preferences, the difference between “true” local
preferences and those otherwise ascertained by central government, and central
government’s cost advantage.
Hereafter the amounts of the public good provided in equilibrium by local and
central governments, defined by equations (2) and (4) respectively, are denoted gl and gc.
Utility is a strictly concave function of g, and hence b′′(g)<0. Comparing the two
equations, it is easy to see that, ceteris paribus, public goods provision under central
government will be higher than under local government when the former has a cost
advantage (α<1). Citizens will prefer central government which, for a given head tax
levied, provides more of the public good than does local government. This is clear from
figure 6(a), where central government’s cost advantage changes the slope of the budget
line, and allows the residents of j to move from a local-government equilibrium on Ul to
the new tangency on Uc where Uc>Ul.
For the sake of simplicity, I assume from this point on that θ-m = 0 and analyze
central government’s assessment of local preferences via the pθm term. The central
government equilibrium is now defined by b′(gc) = α/(npθm). Where p<1, central
government underestimates local preferences, and ceteris paribus public goods provision
will be lower than under local government. This is equivalent to comparing points 1 and
2 in figure 6(b). Because there is no cost advantage, the budget line remains the same
and citizens consume less g but more x. Choosing central government entails moving to
a lower indifference curve Uc<Ul, and citizens prefer local government provision. When

Does Decentralization Increase Responsiveness to Needs?
29
p=1 the center accurately assesses local preferences, provision is equal to that under
local government (point 1 below), and citizens are indifferent between the two regimes.
x x
g g
Uc
U l
U l
Uc
(a) α<1 (b) α=1, p<1
Figure 6: Utility Under Central v. Local Government
gl
xl
xc
gc
1
2
By setting b′(gc) = b′(gl) we can find critical values for the indifference points at which
the countervailing effects are equal. It is straightforward to see that if α = p, citizens will
be indifferent between central and local government, as the center’s inaccuracy in
assessing local preferences is counterbalanced by its cost advantage, and provision of
gc=gl. If α>p, the cost advantage is dominated by the center’s inaccuracy in measuring
local preferences, and gc<gl. Citizens will prefer local government. If α<p, then the
center’s cost advantage outweighs its inability to perceive local preferences accurately,
and gc>gl. Citizens prefer central government. These results are summarized in figure 7.
Figure 7
Indifference condition:
mmlc nnp
gbgbθθ
α 1)()( =⇒′=′
Assuming Condition Result Preference
θ-m = 0 α>p gc<gl Local α<p gc>gl Central

Does Decentralization Increase Responsiveness to Needs?
30
For simplicity, the analysis above depicts the function of the public sector as the
provision of a single public good g, and examines the effects of competing political and
institutional factors on that provision. In reality, of course, local and central
governments provide many public and private goods and services, and perform a large
variety of functions which this approach is too simple to capture. Cost advantage and
assessment inaccuracies are likely to affect these different activities in different ways.
Section four examines this question empirically by comparing central and local
investment patterns across ten different sectors for Bolivia before and after
decentralization.
4. Empirical Tests: Decentralization and Investment
4.1 Methodology
My objective is to test whether decentralization made public investment more
responsive to local needs in Bolivia. This can usefully be decomposed into two
questions: (i) did the pattern of public sector investment change with decentralization?
and if so, (ii) do indicators of need determine that change? It is possible that public
investment did not change with decentralization. If so decentralization and
centralization would be largely equivalent from an economic perspective, though one
might be preferable to the other on political or administrative grounds. If
decentralization did change investment patterns it becomes important to try to
characterize this change in terms of welfare and distribution, and determine which social
and institutional factors were most important in defining it. Ideally public goods would
be measured in quality-adjusted units of output, separated by type. But such information
is unavailable for Bolivia, and instead I measure investment inputs in the form of
resources expended on public investment projects. This approach has the advantage of
using natural, non-controversial units, and of facilitating comparisons across different
sectors. I separate these flows into thirteen distinct sectors, of which I analyze ten (see
figure 9).24
For each sector I estimate the model
Gmt = β1αm + β2α*m + β3δt + εmt (5)
24 Multisectoral includes a sufficient diversity of projects as to be functionally meaningless as a category. And almost no local governments invest in Hydrocarbons or Mining, rendering comparisons across regimes impossible.

Does Decentralization Increase Responsiveness to Needs?
31
where αm and δt are vectors of state and year dummy variables as per above, and α*m is
the product of αm and a decentralization dummy variable which takes the values 0 before
1994 and 1 after (i.e. post-decentralization).25 Investment patterns are thus decomposed
into three terms: a state effect, αm, which captures all of the characteristics of a state
fixed in time, a year effect, δt, which captures year shocks and time-specific
characteristics, and a decentralization-interacted state effect, α*m, which captures state-
specific characteristics commencing in 1994 which were previously absent. As
decentralized public goods provision began in 1994, this term will capture the effects of
local government, local civic associations and other local institutions that sprang up with
the reform, and social and political dynamics more generally that impact upon local
government but lay dormant under central rule. The data cover the period 1987-1996.
I then perform three tests:
1. β1 = β2 Means test. This is a simple t-test to determine whether the means of the αm and α*m coefficients are significantly different for each sector. Significance indicates that decentralization changed national investment patterns through the effects and actions of local governments.
2. β1m = β2m Individual tests. This F-test checks municipality by municipality whether the decentralization-interacted state coefficients are different from the simple state coefficients for investment in a given sector. A significant F-test constitutes evidence that decentralization caused a change in local investment patterns in a particular municipality. Significance in many municipalities constitutes stronger evidence that decentralization changed national investment patterns.
3. Lastly, I place the differences in state dummy coefficients on the LHS and estimate the model
β2m–β1m = ζSm + ηZm + εm (6)
for each of ten sectors, where S is a scalar or vector of the existing stock of public
services (variously defined, as we will see below) at an initial period, and Z is a
vector of institutional and civic variables, both indexed by municipality m. This
approach isolates those changes in investment patterns resulting from a move to a
decentralized regime and then examines its determinants. Notice that equation (6) is
a general-form and not structural model, and hence the results will not be sensitive to
specific theoretical assumptions.
The LHS variable should by construction be unrelated to all factors which remain
constant between the two periods, and thus I omit socio-economic, regional and other
variables which do not vary between the centralized and decentralized regimes. I
25 Thus α*m takes the value 0 for all municipalities and all years before 1994, and is identical to αm for all years from 1994 onwards.

Does Decentralization Increase Responsiveness to Needs?
32
assume that the variables in Z, as well as the stock of public services in the ten sectors of
interest, S, are constant over the period in question.26
Literally hundreds of variables that might be included in the Z vector are
available for Bolivia. To facilitate analysis, and in order to combine very specific Z-type
variables into more meaningful and conceptually defensible indicators, I characterize
them according to the groups in figure 8, and construct principal component variables
(PCVs) for each.
Figure 8: Interpretation of PCVs
PCV GroupPCV No.
Interpretation - Variable increases in... listed in order of importance, where applicable (see Annex 1 for details)
Civil Institutions 1 Strength of local civil institutions and organizationsPrivate Sector 1 Dynamism of the local private sectorTraining & Capacity-Building 1 Intensity of the local capacity-building efforts undertaken
by/for local governmentInformation Technology 1 IT systems - hardware and softwareProject Planning 1 Informed project planning which follows consensual and
open procedures
This process is explained in detail in the following section (4.2). The PCVs and their
constituent variables, as well as variables of need, are summarized in Appendix 1.
Equation (6) can thus be written
β2m–β1m = ζSm + η1Z1m + … + η5Z5m + εm , (7)
where subscripts 1 to 5 denote the groups above.
In theoretical terms, the main coefficient of interest is ζ, which is interpreted as
an indicator of the degree to which investment is based on need. I define “need” as the
marginal utility arising from a particular type of public service, N = U′(g), where N is
need and utility is defined as in the model in section 3.2. In the language of the model,
let θm = U′(g). Hence need falls as the stock of g rises, and vice versa. I use two types of
information as indicators of the stock of public services: (1) the penetration rates27 of
public services or benefits in the local population, r, or the population without access to
the same, 1-r,28 and (2) the initial per capita stock of infrastructure (at the outset of
decentralization). Examples of these are: (1) the literacy and illiteracy rates, the share of
population without water or sewerage; and (2) the number of sports facilities and
26 For most of the demographic and socio-economic variables in question, which tend to show change that is statistically significant only over longer periods of time, this is reasonable. It is less reasonable in the case of the S variable. Unfortunately the data leave no choice. 27 Note that “rate” here denotes a stock and not flow concept.

Does Decentralization Increase Responsiveness to Needs?
33
markets per capita in 1994. Of these, type 1 variables can be considered truer indicators
of need, as they better capture the criterion of public service use by the population and
are likely to be better measures of the flow of benefits produced by public investments.
Type 2 variables indicate existence more than exploitation by the local population, and
hence should be less accurate indicators of need. I use type 2 variables when type 1
variables are unavailable. It is also important to note that need here is a relative concept,
rising and falling with U′(g). This is an important distinction, as the semantics of its
common usage imply that need is an absolute, and even discrete, concept, existing in
some places (at some times) but not in others.
Following the argument in section 3.2, I expect ζ to be negative and significant
when Sm is measured by the penetration rate r, and positive and significant when Sm is
measured by (1-r). If Sm is measured by r, a negative coefficient suggests that
decentralized government invests more heavily in a type of public good where it is
scarce, and hence presumably where it is more strongly preferred. Decentralization
would thus lead to a more progressive investment pattern in terms of objective need than
obtained under centralized government. A positive coefficient implies that decentralized
government behaves regressively, accentuating the pre-existing differences in public
goods endowments. I interpret this as evidence that the relationship posited in 3.2 is
exactly backwards, and central government allocates public investment with more
sensitivity to need than local government. A coefficient equal to zero suggests that local
government does not take the existing stock of public goods into account at all in making
its investment decisions, implying that the model is misguided and local preferences
should not appear in the expression.
The variables in Z are not included as mere controls, however. Their
coefficients, η, are of interest insofar as they help explain the institutional, civic and
procedural determinants of decentralized investment decisions, and so constitute indirect
tests of the theoretical argument above. The case put forward by political scientists29 for
local government’s superior assessment of local preferences and needs includes greater
sensitivity to grass-roots demand, greater accessibility of local lobby groups to local
government, and greater political accountability to the local populace. Some of the ways
in which this can happen include the use of participative planning techniques, and the
existence of private sector and civic organizations that are strong and dynamic.
28 I use both for education, and obtain the expected variation in sign in our results (see below).

Does Decentralization Increase Responsiveness to Needs?
34
Remember that these factors were not relevant to central decision-making, which
occurred in the center. Hence I interpret positive coefficients on these PCVs as weak
evidence that local government assesses preferences more accurately than central
government, implying that the value of p is less than 1 and the difference between real
preferences and those perceived by the center (θm-θ-m) is high.
4.2 Empirical Approach and Data Reduction
The surprisingly large amount of information available for Bolivia during the
period 1987-1996 demands a strategy for choosing, from among 1200+ variables, those
which are most appropriate and most closely related to the underlying concepts I wish to
test. In particular a number of measures in which I am interested are present in my
dataset as multiple, finely differentiated variables the interpretation of which –
collectively and across sectors – is problematic. I have, for example, sixteen variables of
municipal capacity-building exercises by type, and thirteen variables measuring
technical assistance drafting municipal development plans. The challenge is to reduce
such groups to at most one indicator each without loss of information.
I commence by narrowing down the dataset to a manageable size. My empirical
strategy is iterative, and begins by finding the best idiosyncratic model of public
investment for each of the ten sectors of interest. I fit the equation
Gm = ζSm + ηZ + εm , (8)
separately for central public investment (1991-3) and local public investment (1994-7)
where Gm is aggregate investment per capita in the public good subscripted by
municipality, Sm is a scalar or vector of the existing stock of public goods of that type
(variously defined) at an initial period, and Z is a vector of socio-economic,
demographic, regional, political, institutional, administrative and procedural variables
which might affect investment decisions. The use of the Z term follows the literature on
the demand for public goods exemplified by Bergstrom & Goodman (1973) and
Rubinfeld, Shapiro and Roberts (1987) within the context of the available data. In
particular, no income data is available at the municipal level in Bolivia, and so I
substitute several alternative indicators of income and wealth, for example type of
cooking fuel, and housing size, quality and related characteristics. But I expand the
scope of the Z vector considerably compared to previous authors by including measures
of the strength of local political forces as well as municipal institutional capacity. This
29 See for example Wolman in Bennett (1990).
Does Decentralization Increase Responsiveness to Needs?
35
innovation allows me to investigate the micropolitical basis of local government
decision-making, explored in detail in Chapter 3.
No constraints across sectors are allowed on the particular variables admissible
in Z. I use the Huber/White estimator of variance to produce consistent standard errors
in the presence of non-identically distributed residuals. This produces ten different
models of public sector investment, one for each sector. Individually these models are
quite satisfactory, with high R2 and few variables insignificant. But because of large
variation in the specification of the Z vector, comparison across sectors is problematic.
Additionally, on a theoretical level these models would seem to assert that public
investment in different sectors happens according to different processes, in which
different variables intervene. This is evidently unsatisfying.
In a second iteration I re-estimate equation (8) holding the Z vector constant
across all sectors. But I take advantage of the previous stage by using only those
variables found significant there; in this sense the previous stage constitutes a method for
reducing the 1200+ indicators to a subset of 197. But a dimensionality problem persists
even so. I then employ a method of forward and backward substitution and elimination
in order to reduce this subset to 22 variables encompassing the thirteen categories of Z,
in specifications of 23-30 variables overall. These models benefit from being readily
comparable across sectors. The ratio of significant to insignificant variables drops
sharply compared to the first stage, however, and R2 values are somewhat lower.
The insignificance of the variables chosen is not entirely separable from the issue
of comparability, however. In these results none of the variables is significant in most of
the sectors, and many are significant in only two or three. How does one interpret a
given variable across sectors, knowing that an alternative one from the same group
would produce a different pattern of significance and insignificance? For example, how
do we interpret the insignificance of a given training & capacity building variable in
most models when we know from stage one that there is at least one alternative such
variable that is significant for each sector? We evidently cannot assert that capacity
building does not matter and must conclude that the comparability constraint forces us to
omit information from our models that is important in explaining investment behavior.
Indeed, given that there are 197 variables, many of them quite specific, which
have explanatory power over the dependent variable, any subset of twenty, 30, or even
100 will omit valuable information. I require a solution that allows me to retain the full
breadth of information, and yet produce a specification which is both comparable and

Does Decentralization Increase Responsiveness to Needs?
36
parsimonious. I turn to principal component analysis, a data reduction technique in
which the objective is to find the unit-length combinations of explanatory variables with
the highest variance. I follow Maddala (1977) in calculating variables z1 to zk where z is
a linear combination of the x variables,
z1 = a1x1 + a2x2 + … + aLxL
z2 = b1x1 + b2x2 + … + bLxL etc.30
ranked in order of variance, with highest first. Principal component analysis regresses y
on z1, z2, …, zk, where k < L and z’s are constructed so as to be orthogonal. So long as
the z’s chosen represent combinations of variables that have economic meaning and can
be interpreted, this provides a method for estimating parsimonious models with limited
loss of information.
I calculate a set of principal component variables (PCVs) based on the raw
variables retained in stage one. I discard all those with low eigenvalues, as per normal
procedure, and then find the remaining subset which optimally estimate equation (8),
where Z is a vector of PCVs. The eigenvectors associated with each of the PCVs used in
this chapter are listed in Appendix 1, along with more detailed interpretations of each
PCV.
4.3 Results
Figure 9 shows the results from the means test β1 = β2. Mean values are
significantly different at the 0.1% level for education, water & sanitation, agriculture,
transport, urban development and communication, and at the 1% level for industry &
tourism and water management. In health, values are significantly different at only the
13% level, and worse for energy. The evidence is that decentralization changed national
investment patterns in the first eight sectors. Examination of the β2 values indicates that
the effect of local government on average investment under decentralization was to
increase investment in education, urban development, water management and perhaps
health, no change in energy, and decrease investment in agriculture, transport,
communication, industry and tourism, and (puzzlingly given the increase in water
management) water & sanitation. But figure 10 shows that the number of municipalities
investing in these sectors increased for all except agriculture. This implies that the
concentration of investment fell, as more municipalities invested in a large number of
(often smaller) projects in nine sectors.
30 For further treatment of this topic, see also Greene (1997), and Jackson (1991).

Does Decentralization Increase Responsiveness to Needs?
37
Figure 9Test 1: Coefficients Equal? Test ββββ1-ββββ2 = 0
Test TestSector Mean Std Error t-statistic P Value
Education β 1 0.00128 0.00032 -22.798 0.0000
β 2 0.01685 0.00042
Water & Sanitation β 1 0.00374 0.00043 17.343 0.0000
β 2 -0.01174 0.00049
Agriculture β 1 0.00867 0.00080 8.667 0.0000
β 2 -0.00535 0.00086
Transport β 1 0.05464 0.00890 5.967 0.0000
β 2 -0.05152 0.00890
Urban Development β 1 0.00307 0.00049 -5.324 0.0000
β 2 0.00791 0.00053
Communication β 1 0.00191 0.00032 4.011 0.0001
β 2 -0.00055 0.00031
Industry & Tourism β 1 0.00101 0.00023 3.768 0.0002
β 2 -0.00071 0.00023
Water Management β 1 0.00075 0.00018 -2.932 0.0034
β 2 0.00182 0.00020
Health β 1 0.00258 0.00038 1.540 0.1238
β 2 0.00141 0.00041
Energy β 1 -0.00489 0.00185 1.281 0.2004
β 2 -0.00963 0.00186
Variable

Does Decentralization Increase Responsiveness to Needs?
38
Figure 10Number of Municipalities ReceivingInvestment, by Sector (in municipality-years)
%Sector Before After ChangeUrban Development 66 675 923%Education 75 685 813%Health 95 484 409%Water Management 46 175 280%Communications 38 97 155%Water & Sanitation 202 506 150%Energy 180 259 44%Industry & Tourism 44 60 36%Transport 357 444 24%Agriculture 343 309 -10%
Figure 11 shows the number of municipalities where we can reject the hypothesis
β1m = β2m, that is, the number of municipalities where decentralization changed
investment patterns significantly during the first three years. The test is significant in
about three-quarters of municipalities for water & sanitation and education, and in one-
third of municipalities for urban development and water management, but in only one-
fifth of municipalities for agriculture and health and fewer in other sectors. This suggests
that investment patterns changed significantly for water & sanitation, education, urban
development and water management, did not change for industry & tourism, energy,
communication and transport, with agriculture and health on the border between
significantly different and not. Taking into account the results from test 1, I conclude
that agriculture spending did change significantly between the two periods, while for
health it may have but the evidence is inconclusive. Thus two sectors can be added to
the two above for which decentralization did not significantly change investment
patterns across Bolivia’s 311 municipalities. From this point the analysis focuses on
water & sanitation, education, urban development, water management and agriculture.

Does Decentralization Increase Responsiveness to Needs?
39
Figure 11Test 2: Coefficients Equal?
Test ββββ1m−β−β−β−β2m = 0
Sector
Water & Sanitation 224 76%
Education 209 71%
Urban Development 107 36%
Water Management 105 36%
Agriculture 65 22%
Health 49 17%
Transport 29 10%
Communication 7 2%
Energy 7 2%
Industry & Tourism 7 2%
No. Significant
% Significant
These results can best be understood by considering the following: (i) One-half
of all municipalities in Bolivia received no public investment at all during the three years
before decentralization, and these are for the most part the poorest municipalities. As all
municipalities have funds to invest post-decentralization, the most pronounced changes
in investment patterns are accounted for by the poorest municipalities. And, (ii) given
high levels of poverty and low levels of public investment before decentralization, poor
municipalities have a need for investment in more than one sector. Thus, rather than
spread resources around thinly, most reasonably choose to concentrate investment in a
few, high-priority sectors during the initial years of decentralization.
Hence the results are driven by investment by the poorest districts responding to
their greatest needs. By revealed preference we can infer that local administrations in
these areas prioritize basic social service projects above productive projects, and
productive (i.e. income-enhancing) projects in turn above economic infrastructure.
Hence they will tend to invest in education and water before agriculture, and agriculture
before transport or communication. Because only a few years of post-decentralization
data are available, the F-test is expected to fail in low-priority sectors, as poor
municipalities received little or no investment under central government and continue to
invest little under decentralization. In high-priority sectors, however, investment will
leap upwards from a very low base if decentralization matters. This is indeed what
happens. Decentralization leads to an increase in investment in water & sanitation and

Does Decentralization Increase Responsiveness to Needs?
40
education in three-quarters of all municipalities, and urban development and water
management in one-third. There are moderate changes in investment patterns in
agriculture and health, and very little change in transport, communication, energy and
industry & tourism. In conclusion, decentralization did change the pattern of Bolivian
public investment, and this difference was strongest in the social services and urban
development.
Test 3 investigates the determinants of the difference in dummy state variables,
β2 – β1, equivalent to the increase in investment due to decentralization. Results are
examined sector-by-sector, beginning with education.
Education
Figure 12Test 3: ββββ2m– ββββ1m = ζζζζSm + ηηηη1Z1m + … + ηηηη5Z5m + εεεεm
Independent Variable I II III IV VPrivate Sector PCV1 -0.000983 -0.00121 -0.00106 -0.0003-0.00056
(-2.466) (-3.004) (-2.689) (-1.004) (-1.619)Project Planning PCV1 -0.000538 -0.00049 -0.00055 -0.00037 -0.00052
(-0.919) (-0.830) (-0.925) (-0.703) (-0.879)Civil Institutions PCV1 0.000973 0.00101 0.00103
(1.752) (1.774) (1.839)Training & Capacity Building PCV1 -0.00063
(-0.591)Information Technology PCV1 0.00118
(1.010)Illiteracy Rate (Adult) 0.000173 0.00019 0.0002
(2.906) (3.116) (3.306)Illiteracy Rate (Over-6's) 0.00018
(2.505)Literacy Rate -0.00011
(-1.844)Local Education Authority 0.005603 0.00534 0.00543 0.0053 0.00479
(1.421) (1.356) (1.378) (1.354) (1.379)_constant 0.0075759 0.02037 0.00806 0.00722 0.00704
(1.814) (3.728) (1.816) (1.862) (1.731)R-square 0.0176 0.0136 0.0162 0.0155 0.0172Prob>F 0.001 0.0025 0.0016 0.0128 0.0104* OLS regressions reported with robust standard errors t-stats in parentheses; PCV1 = 1st pricipal component variable
Model*

Does Decentralization Increase Responsiveness to Needs?
41
Investment rises under decentralization where the illiteracy rate is higher, and
investment is thus progressive in terms of need. This implies that local government is
more sensitive to local need than central government. This finding is not sensitive to
specification or to the measure of illiteracy used, as is evident in Figure 12 above, where
the literacy rate is significant and negative. In terms of the model of section 3.2, the
results imply that p<1, and hence that the center assesses local preferences less
accurately than local government. Educational investment falls where the private sector
is stronger, a finding which is again insensitive to specification. This is most likely
because private firms lobby for resources to flow to other sectors where they stand to
profit more. The results for urban development (below) support this interpretation. Civil
Institutions, by contrast, lead to an increase in investment after decentralization,
suggesting grass roots support for education (i.e. parents worried about their children).
Participative planning methodologies have no effect on investment, nor do information
technology or local training and capacity-building activities.
Water & Sanitation
Figure 13Test 3: ββββ2m– ββββ1m = ζζζζSm + ηηηη1Z1m + … + ηηηη5Z5m + εεεεm
Independent Variable I II III IVPrivate Sector PCV1 0.000123 -0.000856 -0.000712
(0.130) (-1.265) (-1.058)Project Planning PCV1 -0.003165 -0.003322 -0.003517
(-2.002) (-2.237) (-2.205)Civil Institutions PCV1 -0.001227
(-1.230)Training & Capacity Building PCV1 -0.001129
(-1.161)Information Technology PCV1 -0.000196
(-0.163)% Pop. w/out Sewerage 0.000194 0.000170 0.000180
(1.881) (1.768) (1.756)% Pop. w/out Water 0.000157
(1.791)_constant -0.030616 -0.027167 -0.028461 -0.029259
(-3.324) (-4.492) (-3.348) (-3.217)R-square 0.0323 0.0064 0.0320 0.0302Prob>F 0.0000 0.0743 0.0000 0.0000* OLS regressions reported with robust standard errors t-stats in parentheses; PCV1 = 1st pricipal component variable
Model*

Does Decentralization Increase Responsiveness to Needs?
42
Investment rises under decentralization where more people have no sewerage. It
also rises where the percent of the population without access to drinking water increases,
though this finding is sensitive to specification and drops out when other variables are
included in the model. Thus local governments invest more where need is greatest, and
investment is progressive in terms of need. This implies that p<1 in the model above.
Participative planning methodologies are significant and negative, thus decreasing
investment, and the private sector and civil institutions are both insignificant. This last
result is surprising given the positive effect of civil institutions on investment in
education.
Water Management
Figure 14Test 3: ββββ2m– ββββ1m = ζζζζSm + ηηηη1Z 1m + … + ηηηη5Z 5m + εεεεm
Independent Variable I II III IVPrivate Sector PCV1 0.000171 0.000170 0.000056 0.000155
(0.602) (0.609) (0.405) (0.758)Project Planning PCV1 -0.000550 -0.000540 -0.000533 -0.000525
(-0.877) (-0.878) (-0.906) (-0.829)Civil Institutions PCV1 -0.000171 -0.000182
(-0.655) (-0.655)Training & Capacity Building PCV1 -0.000024
(-0.063)Information Technology PCV1 -0.000445
(-1.326)% Pop. w/out Water -0.000087 -0.000088 -0.000088
(-2.363) (-2.339) (-2.412)% Pop. w/Water (Int. Plumbing) 0.000135
(0.879)% Pop. w/Private Standpipe 0.000067
(1.639)% Pop. w/Public Standpipe 0.000101
(2.012)% Pop. w/out Sewerage 0.000085 0.000110 0.000087 0.000077
(2.217) (1.485) (2.249) (2.097)% Pop. w/"Other" Sewerage** 0.000113 0.000139 0.0001120.000103
(1.793) (2.481) (1.850) (1.725)_constant -0.001260 -0.012457 -0.001367 -0.000426
(-0.393) (-1.441) (-0.404) (-0.136)R-square 0.0110 0.0114 0.0103 0.0116Prob>F 0.0832 0.1422 0.0824 0.0635* OLS regressions reported with robust standard errors t-stats in parentheses; PCV1 = 1st pricipal component variable** "Other" Sewerage refers to non-public-utility, non-septic-tank methods of sewerage disposal.
Model*

Does Decentralization Increase Responsiveness to Needs?
43
The water management sector is related to water & sanitation but is broader in
scope, including reservoirs and wastewater treatment lagoons, levees, and storm
drainage works. In general the degree of overlap between the two sectors is high, and
similar indicators of need are used for both. Investment in water management is lowest
where the share of population with no access to water is highest, rises as more people
have access to public and private standpipes, and then falls again as internal plumbing
becomes widespread. Investment is also highest where few people have access to
sewerage, or access to rudimentary sewerage, and decreases as municipal sewerage
systems become widespread. These results point to investment that is progressive in
terms of need at intermediate and high levels of provision, with a poverty trap amongst
the most needy. Within this range, local government fails to respond to need and central
government provision is superior. The model can explain this indirectly, if in these
neediest districts the costs and complexity of making initial investments in water are so
great (e.g. from developing water sources, laying water mains and building treatment
plants) that local governments cannot undertake them alone, but once these initial
investments are made the marginal costs of extending the system are manageable. In the
language of the model, central government has a cost advantage over local government
for initial investments, α<1. But at intermediate and higher levels of provision p<1 and
local government’s needs-orientation dominates. Perhaps surprisingly, institutional and
civic variable appear to have no effect on investment – only variables of need matter.

Does Decentralization Increase Responsiveness to Needs?
44
Agriculture
Figure 15Test 3: ββββ2m– ββββ1m = ζζζζSm + ηηηη1Z1m + … + ηηηη5Z5m + εεεεm
Independent Variable I II IIIPrivate Sector PCV1 -0.000286 -0.000665 -0.000837
(-0.156) (-0.466) (-0.657)Project Planning PCV1 -0.005871 -0.005644 -0.005932
(-1.819) (-1.727) (-1.853)Civil Institutions PCV1 -0.000401
(-0.226)Training & Capacity Building PCV1 -0.001492
(-0.420)Information Technology PCV1 0.000885
(0.303)Malnutrition Rate (Low), Males 0.000720 0.000680 0.000702
(1.962) (1.987) (1.931)_constant -0.032749 -0.031594 -0.032157
(-2.936) (-2.981) (-2.918)R-square 0.0198 0.0209 0.0201Prob>F 0.0768 0.0818 0.0798* OLS regressions reported with robust standard errors t-stats in parentheses; PCV1 = 1st pricipal component variable
Model*
It is notable that even though agricultural investment decreased after
decentralization – fewer municipalities invested here (see Figure 10) and the mean
difference in state variables is negative and significant – investment nonetheless
increases with the male malnutrition rate, a finding which is insensitive to specification.
This implies that those municipalities that did invest in this sector after decentralization
did so progressively according to need. Hence p<1 in the model above. Once again
participative planning techniques decrease agricultural investment under
decentralization, and the number of private sector enterprises and civil institutions has no
effect. Investment is similarly unaffected by local training and capacity-building
programs and installed IT capacity.

Does Decentralization Increase Responsiveness to Needs?
45
Urban Development
Figure 16Test 3: ββββ2m– ββββ1m = ζζζζSm + ηηηη1Z1m + … + ηηηη5Z5m + εεεεm
Independent Variable I II IIIPrivate Sector PCV1 0.004749 0.004869 0.005125
(4.486) (4.804) (4.704)Project Planning PCV1 -0.000801 0.000263 0.000175
(-0.994) (0.219) (0.143)Civil Institutions PCV1 0.000439
(0.750)Training & Capacity Building PCV1 -0.000540
(-0.716)Information Technology PCV1 -0.000609
(-0.285)# Markets per capita (1994) 0.136135 0.124015 0.108250
(6.130) (3.048) (2.371)# Sports Facilities per capita** 4.728497 4.758151 4.814974
(1994) (2.815) (2.991) (3.013)_constant 0.006800 0.005830 0.005801
(4.340) (3.244) (3.176)R-square 0.0684 0.0474 0.0474Prob>F 0.0000 0.0000 0.0000* OLS regressions reported with robust standard errors t-stats in parentheses; PCV1 = 1st pricipal component variable** Defined as other than football fields, multi-use courts and coliseums.
Model*
The initial (i.e. pre-decentralization) stock of infrastructure is used directly as the
measure of need. Investment under decentralization increases as the initial number of
markets per capita increases, and as the number of general sports facilities per capita
increases as well. Investment is thus regressive in terms of need in this sector, as
opposed to the others considered above, and this finding is not sensitive to specification.
Thus it would seem to be central government that more accurately assesses local need in
this sector, and local government that mis-estimates it. Investment increases with the
number of private sector firms, which is as expected given that urban development
projects often result in lucrative contacts for these firms. Investment is unaffected by
participative planning techniques and civil institutions, implying that it is not a high
priority at the grass-roots level. Neither training programs nor IT affects investment.
The results show that the changes in investment patterns detected above in
education, water, agriculture and urban development are strongly and positively related

Does Decentralization Increase Responsiveness to Needs?
46
to indicators of local need. Other plausible variables, including civil and social
dynamism, the strength of institutions, and local government procedures, are not
consistently significant. These results can be combined with the data of section 2.2 in
order to distinguish between the cost advantage and needs-assessment effects posited in
section three. Remember that in every sector except agriculture the number of
municipalities investing increased, and the effect of local government on average
investment was positive in the social sectors and urban development, and negative in
economic infrastructure and agriculture. The average rise in investment (i.e. across all
municipalities) in education, water management and urban development after
decentralization can be interpreted as a product of the need-orientation of local
government detected above, and evidence that the center cannot produce these services
at lower cost than the periphery. The fall in average investment in agriculture, by both
volume and number of municipalities, combined with the significance of need, is
evidence that the center was over-investing in this sector, and that given the choice
municipalities prefer to redirect resources elsewhere. The fall in average investment by
value in water & sanitation, combined with an increase in the number of districts
investing and the significance of need, implies that the central government concentrated
investment in too few projects and districts; local government thus re-allocates resources
in a larger number of smaller projects where need is greatest. And lastly, the systematic
fall in investment by value throughout Bolivia in transport, communication and industry
& tourism, combined with modest increases in numbers of municipalities investing and
the irrelevance of need, implies weakly that the center may have had a cost advantage in
these sectors, leading volumes to fall after decentralization.
5. Conclusions
The results show that decentralization significantly changed national public
investment patterns in Bolivia. Investment changed unambiguously in education, water
& sanitation, water management, agriculture and urban development after the 1994
reform. And these shifts are strongly and positively related to real local needs. In
education, water & sanitation, water management, and agriculture, post-decentralization
investments are higher where illiteracy rates are higher, water and sewerage connection
rates lower, and malnutrition a greater risk respectively. These changes were driven by
the actions of Bolivia’s 250 smallest, poorest municipalities investing newly devolved
public funds in their highest-priority projects. Decentralization thus led to higher

Does Decentralization Increase Responsiveness to Needs?
47
investment in human capital and social services as the poorest regions of the country
chose projects according to their greatest needs. In terms of the model of section 3.2,
this implies that decentralized provision dominated central provision in these sectors
through local government’s superior sensitivity to local needs. In transport,
communication and industry & tourism, on the other hand, central government may have
had a positive cost advantage.
In econometric terms, the most interesting feature of the results is that no terms
other than need are consistently significant across the five principal sectors analyzed.
Relationships of need are robust and insensitive to specification. By contrast social,
institutional and procedural variables are infrequently significant across sectors, and
seem to account for little total variation. Indeed, the only apparent effect of private
sector firms is to transfer resources from education to urban development. Civil
institutions are significant only for education, where they increase investment, and
insignificant everywhere else. Training, capacity-building and IT are insignificant for all
sectors. This implies that the differences in investment patterns chronicled above are not
related to the number of private enterprises or civil institutions, or driven exogenously by
training programs or information technology, but are instead determined by local needs.
I conclude that the Bolivian experience, where decentralization led to an investment
increase in municipalities with the worst demographic indicators and infrastructure
endowments in the sectors examined, is exactly the opposite of what many academics
and policy-makers predict, and what other researchers have found in the past. It is
accordingly important to investigate the social and institutional mechanisms that cause
these changes. I turn to these questions in the following chapters.
By demonstration, this chapter seeks to make a case for conducting empirical
research on decentralization and fiscal federalism in the manner employed here. Much
of the empirical work on decentralization to date focuses on the share of national
expenditures conducted by different levels of government, and ignores the many insights
waiting to be uncovered by moving down to the level of the local political economy and
conducting a careful comparison of spending and investment patterns with economic,
institutional, social and demographic indicators. The data presented here is from one of
the poorest countries in the Western hemisphere, and took years to collect, clean and
organize. But as this chapter demonstrates, its quality is sufficient to permit significant
and counter-intuitive results. Applying a similar methodology to more sophisticated
countries in the region, not to mention Europe and North America, might prove very

Does Decentralization Increase Responsiveness to Needs?
48
fruitful. Lastly, the above analysis leaves open the question of how political power is
distributed in a central government, the institutional mechanisms by which governments
sense and take up local demand for public services, and the precise nature of the
organizational or technical advantages or scale economies which might benefit one level
of government over another. That is, p, θm and α are all exogenous here. Research is
needed to understand these processes and endogenize them in our models of public
goods provision.

How Do Central and Local Governments Differ?
49
3 How Do Central and Local Government Differ?
Two Extensions
1. Introduction
Chapter 2 showed that decentralization did indeed change Bolivian public
investment patterns, and in a way which made them more attuned to local needs than
centralized government had been. Most telling is the contrast between policy-making at
the highest and lowest levels. Before decentralization national government concentrated
investment in transport, hydrocarbons and energy in Bolivia’s largest, wealthiest
municipalities. After decentralization the country’s smallest, poorest districts redirected
investment toward social services and agriculture, allocating it much more evenly
throughout the national territory. Even the most isolated municipalities benefited. These
changes were sufficiently strong to cause dramatic shifts in national investment
aggregates.
How can we explain these differences? Why do central and local government
make different decisions when faced with the same objective needs? Economic and
political models of decentralization often rely on assumptions about the policy
constraints faced by different levels of government, or their differing sensibility to local
demands, that are largely ad hoc.31 The model presented in the previous chapter is one
example. If we are to understand decentralization and its impact on policy outcomes, we
must go beyond this level of theorizing and comprehend the precise ways in which
central and local government decision-making operate, and how they differ. We must
model the institutional and political features that link policy priorities to need, or fail to,
explaining thereby what “closeness” is and why it might matter.
I examine these questions here through two extensions of the previous chapter:
one empirical, the other theoretical. Section two employs econometric models of public
investment that include a broader range of variables than those of Chapter 2 to examine
the policy choices of central and local government in more detail. We are fortunate to
31 A broad range of such approaches is discussed in Chapters 1, 2, 4 and 7.

How Do Central and Local Governments Differ?
50
have a rich seam of data on the political, social and civic, economic, institutional, and
administrative characteristics of all Bolivian municipalities that begs to be exploited. By
modeling policy decisions under each regime separately, I am able to probe deeper into
the political economy mechanisms that govern outcomes in each. Ultimately the social
processes in question are too complex and nuanced in nature, requiring qualitative
characterization of actors and the relationships between them, to lend themselves
naturally to quantitative estimation. This is thus an exploratory exercise, pushing at the
limits of such techniques to see how much they can tell us, before moving on to the
qualitative analyses of Part II. That interesting, even provocative insights do emerge is a
testament to the quality and breadth of the data. But in the end the conceptual tools of
Part II are required for a complete analysis of the local government process.
Section three shifts the focus to central government. As Chapters 4 to 8
comprise an extended empirical and theoretical investigation of the nature of local
government, this is my last chance to explore how central government works. I do so
with the tools of theory, seeking to explain the two stylized facts of decentralization in
Bolivia: (1) a sharp fall in the geographic concentration of investment, and (2) a
generalized change in the uses of investment away from infrastructure towards the social
sectors. By showing that central investment was regressive economically and in terms of
need systematically across Bolivia, while local investment was progressive on both
counts, the empirical section confirms that these are not statistical artefacts but
phenomena that require explanation. It is evident that the more even distribution of
resources after 1994 is largely due to the per-capita criterion adopted by the
decentralization reform. But strong evidence suggests that central government was
essentially unconstrained before decentralization (see section 2.1 below). Hence the
question must be turned upside down: Why did the center choose to invest nothing in
one-half of all Bolivian municipalities? And why did it prefer such different sectors?
I focus accordingly on structural attributes of central government in order to
explain why its behavior differs from the periphery’s. I move beyond a simple view of
central and local government as mutually exclusive social planners with parametrically
varying objective functions, to a bargaining framework that explicitly models
interactions between the two and permits Pareto-improving cooperation. By locating the
center in a particular district with its own constituency, preferences, and utility-
maximizing incentives, I can explain why decentralization triggers the substantial policy
changes that we observe. Section five summarizes the findings of the chapter, as well as

How Do Central and Local Governments Differ?
51
the first part of the dissertation more generally, and provides suggestions for further
research.
2. Central v. Local Government Investment
The object is to investigate the institutional, socio-political and administrative
determinants of investment decisions by both central and local government. Specific
questions include: Which local political forces are important in determining policy?
How do voting and lobbying affect investment? How do the institutions of government
shape policy choices? I wish to estimate the effects of these factors on public decisions
under both central and local government, and compare them to those of need identified
in Chapter 2. The nature of the data allows me to probe more deeply into the
institutional and administrative characteristics of local government than I can for the
center. Data on factors such as the planning procedures, training and capacity building,
and information systems implemented by municipalities allows me to decompose their
investment decisions to a surprising degree. For obvious reasons, central government
data offers no cross-sectional variation of this nature, and hence less opportunity to pry
open the black box of decision-making. The weight of analysis is accordingly biased in
favor of the periphery.
2.1 Empirical Approach
The economic literature on local government includes a strong strain on the
demand for local public goods and services. In a seminal contribution, Bergstrom and
Goodman (1973) develop a method for estimating the demand functions of individuals
for municipal public services. They find positive income elasticities and negative price
elasticities for different types of municipal expenditures using a technique which takes
explicit account of population heterogeneity. Rubinfeld, Shapiro and Roberts (1987)
build on this to propose a maximum-likelihood estimation technique that incorporates
the sorting of individuals among communities on the basis of quality and quantity of
local goods provided. They find price and income elasticities considerably smaller than
those of Bergstrom and Goodman and others. Pommerehne and Schneider (1978) allow
for differences in democratic institutions, dividing their sample of Swiss districts into
direct democracies, and representative democracies with and without referenda, and find
that the median voter model works best for direct democracies. This literature
establishes a method for estimating demand for local public services which I follow
below.

How Do Central and Local Governments Differ?
52
Ideally public goods would be measured in quality-adjusted units of output,
separated by type. But such information is unavailable for Bolivia, and instead I
measure investment inputs in the form of resources expended on public investment
projects. This approach has the advantage of using natural, non-controversial units, and
of facilitating comparisons across different sectors. Following the example of Chapter 2,
I separate these flows by sector. For each sector I estimate the model
Gm = ζSm + ηZm + εm , (1)
where Gm is aggregate investment per capita in the public good subscripted by
municipality, Sm is a scalar or vector of the existing stock of public goods of that type
(variously defined) at an initial period, and Z is a vector of socio-economic,
demographic, regional, political, institutional, administrative and procedural variables
which might affect investment decisions. My use of the Z term follows Bergstrom and
Goodman, and Rubinfeld, Shapiro and Roberts within the context of the available data.
In particular, no income data is available at the municipal level in Bolivia, so I substitute
several alternative indicators of income and wealth, including for example housing size,
quality and related characteristics, and type of cooking fuel. But in comparison with
previous authors I expand the scope of the Z vector to include measures of political
regime type, municipal decision-making processes, and civic institutions and
organizations, allowing me to investigate the micropolitical basis of local government
decision-making.
For reasons similar to those of Chapter 2, I adopt a simple cross-sectional
approach where investment flows are summed over the years 1992-9332 for central
investment, and 1994-96 for local investment. I assume that the variables in S, the stock
of public services, as well as those in Z, are constant over the five-year period in
question. As in Chapter 2, I reduce the large number of potential Z variables to a
manageable and conceptually coherent set through principal component analysis. This
produces ten dimensions of Z containing thirteen principal component variables, which
are summarized in figure 1 and explained in detail in Appendix 2. Equation (1) can thus
be written as
Gm = ζSm + η1Z1m + … + η13Z13m + εm , (2)
where subscripts 1 to 13 denote the PCVs below.
32 I reduce the sample to the period 1992-93 in order to be able to use census data as initial values of Sm without incurring endogeneity. Extending the sample to 1991-93 does not change the results significantly.

How Do Central and Local Governments Differ?
53
Figure 1: Interpretation of PCVs
PCV GroupPCV No.
Interpretation - Variable increases in... listed in order of importance, where applicable (see Annex 1 for details)
1 Demographic 1 Protestants, atheists (i.e. non-Catholics) and rural dwellers2 2 Native-language speakers and rural dwellers3 Economic 1 Wealth and income4 3 Family size and poverty5 Civil Institutions 1 Strength of local civil institutions and organizations6 Private Sector 1 Dynamism of the local private sector7 Political Disaffection/Protest 1 Electoral abstention, null and anti-government votes8 Training & Capacity-Building 1 Intensity of the local capacity-building efforts undertaken
by/for local government9 Information Technology 1 IT systems - hardware and software
10 Central Government Auditing 1 Audits by, reports to, and information system shared withcentral government
11 Municipal Administration 1 Robust administrative guidelines and operatingprocedures, and a strong executive
12 2 Strong, activist municipal council and weak mayor13 Project Planning 1 Informed project planning which follows consensual and
open procedures
Following the notation of equation (2) above, I use coefficient ζ to characterize
central and local investment patterns according to need, where “need” is defined per
Chapter 2 as the marginal utility arising from a particular type of public service,
N=U´(g). Hence need falls as the stock of g rises, and vice versa.33
In theoretical terms, the main coefficients of interest are η5-η13, corresponding to
the social, political, institutional and procedural factors that underpin local governance.
To a significant degree this vector of variables represents competing hypotheses about
how government works, and thus we do not expect all to be significant for any given
sector. Each sector also includes an interacted need-municipal training variable, to test
the theory that even where training and capacity building have no independent effect on
investment, they may affect investment indirectly via local government’s ability to
perceive need.
Before moving to the results I briefly discuss two considerations which could
affect the interpretation of the results in important ways. The first is the possibility that
central government investment between 1992-3 was externally constrained, and thus its
correlates reflect not central government preferences but rather the structure of these
constraints. The second is that municipal investment between 1994-6 was externally

How Do Central and Local Governments Differ?
54
constrained, and thus these patterns similarly reveal little about local-government
preferences and dynamics. If neither possibility holds, we may take investment
decisions between 1992-3 and 1994-6 to reflect central and local priorities subject to
budget constraints. Otherwise we must account for additional external constraints, and
include them in our models. I take each consideration in turn.
(i) Central Government Discretion: As Chapter 2 shows, any external constraints
binding on central government before decentralization would be of a sort that forced it to
skew investment dramatically towards a few, large municipalities and away from the
smaller half, as well as favor transport and hydrocarbons over health, education and
water & sanitation. In Bolivia’s case such constraints would most likely come from the
multilateral agencies and bilateral and other donors on which the country depends for
scarce investment resources, and which impose numerous policy conditions as the price
of aid. But careful consideration of Bolivia’s international context during 1992-3 reveals
no such pressures. Indeed, if anything international pressures would seem to have
pointed in opposite directions from those Bolivia took. By 1992 Bolivia had ended its
second structural adjustment program (ESAF) with the IMF, and begun its second
Structural Adjustment Credit (SAC) with the World Bank. The conditions upon which
these were based include a number of provisions designed to redirect public investment
away from productive activities (mining and hydrocarbons especially) and toward the
social sectors (i.e. education, health and water & sanitation).34 Furthermore, a number of
prominent projects undertaken by the Bolivian government at the time, including the
Emergency Social Fund35, Social Investment Fund36, Education Reform Project37 and
the incipient Integrated Child Development Project38, co-financed in various
combinations by the Word Bank, Inter-American Development Bank, USAID,
WHO/PAHO, GTZ, KfW, the Dutch, Swiss, Swedish, Belgian and several other
governments – that is to say, as far as Bolivia is concerned, the entire international
community – sought explicitly to redistribute investment flows toward poorer, rural
areas and away from Bolivia’s cities. But according to the data in Chapter 2, on neither
33 Per Chapter 2, I use two types of information as indicators of the stock of public services: (1) the penetration rates of public services or benefits in the local population, r, or the population without access to the same, 1-r, and (2) the initial per-capita stock of infrastructure (at the outset of decentralization). 34 World Bank Staff Appraisal Report, Second Structural Adjustment Credit, September, 1991. 35 World Bank Staff Appraisal Report, Emergency Social Fund Project, 1987 36 World Bank Staff Appraisal Report, Social Investment Fund Project, 1993 37 World Bank Staff Appraisal Report, Education Reform Project, 1993 38 World Bank Staff Appraisal Report, Integrated Child Development Project, 1994

How Do Central and Local Governments Differ?
55
criterion did international pressures have any effect. The fact that investment outcomes
were the exact opposite of those the international community supported forces us to
conclude that central government in Bolivia faced no binding constraints on its
investment decisions during this period. The implication for relevant donors’ aid policy,
of course, is that collectively at least their conditionality was entirely ineffectual.
(ii) Constraints on Local Government: The question of external constraints on municipal
governments between 1994-6 is only somewhat more subtle. Legal constraints certainly
did exist – after the Popular Participation Law itself, central government passed
Executive Decree 24182 which directed municipalities to dedicate at least 25% of their
resources to productive investment, 30% to social investment, and no more than 15% to
operating costs. The center sought to reward municipalities that did so through
additional investment via the Social Investment Fund, Campesino Development Fund,
National Environmental Fund, and the Regional Development Fund. Were this binding,
changes in national investment patterns between the two periods would be the result of
changed priorities in La Paz and not the action of local governments. But the evidence
demonstrates the opposite – the center proved too institutionally weak to enforce this
decree. No sanctions were taken against offending municipal governments, and the
system of matching grants fell apart as the Funds (all of them executive agencies)
ignored requirements and continued working with municipalities regardless of their
compliance.39 An examination of the limit on operating costs reveals that 203
municipalities exceeded 15% in 1994, 157 did so in 1995, and 147 more in 1996.
Indeed, departmental capitals were amongst the biggest violators, and received
correspondingly broad media coverage of their finances. Smaller municipalities took
notice. Indeed, Chapter 5 illustrates the extraordinary extent of real discretion that
municipalities enjoyed after 1994. As for central government, we must conclude that
local governments faced no binding constraints on their investment decisions.
2.2 Results
I examine central and local investment in the five sectors analyzed in Chapter 2
plus health, where results are strongest. We shall see that central government
coefficients are generally larger by an order of magnitude or more than local government
coefficients. This should be interpreted bearing in mind that even after decentralization
39 Mauricio Lea Plaza, Director of Participative Planning, National Secretariat of Popular Participation, interview, La Paz, 29 September 1997.

How Do Central and Local Governments Differ?
56
the center manages over seven times the resources that local government manages, and
that it concentrated investment in a relatively small number of municipalities. Larger
coefficients should thus not be interpreted as greater sensitivity to the factors that interest
us, but rather as by-products of budgetary scale and concentration.40
Health Figure 2 shows that of the eight indicators of need used in three models of central
government investment, only one – the percentage of households using NGO or church-
run health facilities – is significant. Its positive sign indicates that investment increased
where private (i.e. non-public41) medical facilities already exist, which in Bolivia is
where public facilities are also in abundance.42 This implies an increasing geographic
concentration of infrastructure. The insignificance of the other seven indicators implies
central government investment was insensitive to need, or at most weakly regressive.
40 This effect is magnified for the case of civil institutions, which sprouted by the hundreds throughout Bolivia after 1994. 41 The majority of private health facilities in Bolivia are NGO or church-operated. 42 The Municipal Census (Secretaría Nacional de Inversión Pública y Financiamento Externo 1997) shows that private health facilities are mostly concentrated in municipalities that also benefit from public facilities of the same type. In the municipalities where all 46 private health posts are located, there are 436 public facilities. Of the 145 private centers nationwide, 107 are located in just two municipalities. Far from complementing the state health network and making up for its deficiencies, these facilities operate in parallel to the public system and compete with it for patients.

How Do Central and Local Governments Differ?
57
Figure 2
Ind. Var I II III I II IIIDemographic & Regional
Controls?Economic PCV1 0.11361 0.12081 0.13094 -0.0016 -0.0014 -0.0012
(2.237) (2.420) (2.441) (-2.940) (-2.698) (-2.309)Economic PCV3 0.12182 0.12324 0.12294 0.0022 0.00224 0.00189
(1.648) (1.628) (1.695) (2.020) (2.022) (1.793)Political Protest Vote PCV1 -0.211 -0.2187 -0.2397 -0.0008 -0.0015 -0.0008
(-1.455) (-1.508) (-1.620) (-0.801) (-1.390) (-0.798)Civil Institutions PCV1 0.12452 0.1203 0.1199 0.00161 0.00159 0.00152
(2.401) (2.399) (2.336) (2.488) (2.401) (2.380)Private Sector PCV1 -0.0727 -0.0767 -0.0756 -0.0018 -0.0021 -0.0015
(-1.866) (-1.912) (-1.868) (-2.022) (-2.363) (-1.807)Training & Capacity Building 0.06995 -0.1389 0.09059 0.00156 -0.0016 0.0016
PCV1 (0.733) (-0.917) (0.965) (1.041) (-1.008) (1.079)Information Technology PCV1 0.12397 0.12628 0.13478 0.00187 0.00172 0.00167
(1.700) (1.750) (1.825) (2.135) (2.016) (1.961)Central Gov Auditing PCV1 -0.0353 -0.0315 -0.0369 -0.0012 -0.0014 -0.0012
(-0.501) (-0.461) (-0.533) (-1.636) (-1.867) (-1.692)Municipal Administration PCV1 0.1012 0.10708 0.11265 -0.0006 -0.0007 -0.0006
(Robust Guidelines) (1.350) (1.335) (1.486) (-0.648) (-0.686) (-0.636)Municipal Administration PCV2 0.0637 0.06782 0.04703 0.00167 0.00183 0.00141
(Strong Municipal Council) (0.866) (0.928) (0.633) (2.203) (2.188) (1.971)Project Planning PCV1 0.03738 0.03858 0.04565 0.00083 0.00082 0.00098
(0.473) (0.490) (0.603) (1.083) (1.046) (1.258)Health Care, Min. Health % -0.0019 -0.0004 0.00018 0.00014
(-0.219) (-0.048) (2.513) (1.991)Health Care, Public Insurance % 0.01408 0.01883 0.00045 0.00033
(0.725) (1.051) (2.272) (1.807)
Health Care, None % 0.01665 0.0184 0.01593 -0.0003 -0.0003 -0.0003
(1.293) (1.558) (1.138) (-1.673) (-1.935) (-1.847)Health Care, NGO & Church % 0.03638 -0.0003
(1.860) (-1.549)
Malnutrition Rate (Low) 0.01761 0.01808 0.01531 0.000380.00039 0.00041
(1.273) (1.285) (1.068) (1.881) (1.850) (1.951)
Local Health Authority -0.373 -0.416 -0.0019 -0.0021
(-0.975) (-1.083) (-0.527) (-0.557)Needs-Training Interacted 1 -0.0045 -0.0055 -0.0001 -0.0001
(-0.709) (-0.839) (-1.323) (-1.304)
Needs-Training Interacted 2 0.00433 5.8E-05
(1.219) (1.067)
constant -1.6044 -1.6839 -2.0193 -0.0008 0.00731 0.00132
(-2.147) (-2.667) (-3.020) (-0.107) (1.312) (0.208)sigma 0.8949 0.88729 0.87899 0.01652 0.01674 0.01662
(5.038) (5.016) (5.080) (4.482) (4.561) (4.512)
χ2 42.05 43.32 43.23 60.84 53.17 57.99
Prob>χ2 0.0041 0.0019 0.0019 0.0000 0.0001 0.0000N 265 265 265 259 259 259* Tobit estimation with robust standard errors z-stats in parentheses; PCVn = nth pricipal component variable
Model*Central Government Local Government
YES YES YES YES YES YES
Civil institution PCVs are positive and significant in all three models, implying
that strong civil institutions are associated with increasing investment in health. As this
data pre-dates both central and local investment, the direction of causality must be from

How Do Central and Local Governments Differ?
58
civil society to investment outputs. This implies that civil institutions were able to
successfully lobby central government to increase investment in health. The private
sector variable is similarly significant in all three models, but negative. I interpret to
mean that where the private sector is strong it successfully lobbied the center to reduce
investment in health in favor of other sectors which interest it more, as we shall see
below. The information technology PCV is also significant and positive in the three
models, but because these IT investments only began with the decentralization program,
I discount them as spurious correlations. Such results may imply that these variables
proxy for deeper characteristics of municipalities before decentralization, but this
possibility is not explored here.
Investment under local government shows several important differences from
that under central government. First, need variables are significant in all three models.
Investment rises with indicators of need, although in the neediest municipalities there
appears to be a poverty trap. Thus, investment increases with the malnourishment rate.43
Investment is also higher where public facilities and those run by public insurers are
used intensively. But investment is lower where the proportion of the population that
receives no health care is high. I interpret this to mean that local government responds to
demand for local health services, as well as to indicators of poor public health. But
where very few health care services exist, people may be ignorant about their benefits
and not demand health investment, leading local government to invest less. Second, and
interestingly, investment is progressive in economic terms according to both PCVs in all
three models; health investment increases as wealth and income fall, and as family size
and poverty measures rise. This is the opposite of the usual, expected pattern, where
investment is higher in wealthier municipalities.
Civil institution and private sector PCVs are also significant in these models,
with the same signs as for central government. This indicates that both civic groups and
private sector firms are successful in lobbying local government to increase/decrease
investment as they prefer. Municipalities which acquire IT systems invest more in
health, perhaps because IT helps them to execute complex health projects, though as we
shall see this result is not repeated in any other sector. Municipalities subjected to
central audits and similar external pressures invest less in health, and municipalities
where the local council is strong and active and the mayor relatively weak invest more.

How Do Central and Local Governments Differ?
59
Note that the interacted needs-training variables are insignificant in all three models,
reinforcing the conclusion that training has no effect on investment. Curiously, the
presence of a local health authority also has no effect on investment, either before and
after decentralization.
Water & Sanitation Figure 3 shows few determinants for central government investment in water &
sanitation. Investment increased with the number and strength of civil institutions,
indicating – as in health – their success in lobbying the center for resources. But no
other variables in our four models are significant. In particular, central government does
not seem to have responded to any of our five measures of local need.
Decentralized investment in water is quite different. All indicators of need are
significant. Investment rises as the share of population without access to sewerage rises,
and falls with the square of this term. The trend holds across different measures of
population without sewerage. This implies investment that increases in need up to a
high level of deprivation,44 beyond which it falls again, signaling the existence of a
poverty trap where existing levels of provision are extremely low. Investment also rises
with the per capita number of public urinals, the lowest level of public sewerage
available in poor communities. It is likely that the presence of urinals in such
communities helps to build grass-roots support for further investment by showing people
the benefits of sewerage. Investment decreases with the percentage of people who
already have private sewerage, additional evidence that investment is concentrated
where need is greatest. The models are robust to alternative specifications.
Of the main variables of interest, both municipal administration and central
auditing are consistently significant across our models. Investment rises where districts
have a strong municipal council, whereas the PCV for robust municipal rules and
procedures is not significant. Central auditing and budgeting systems that operate in the
municipality are also associated with rising investment. None of the other institutional
or procedural variables seems to affect local government investment, nor does the
interacted needs-training term.
43 Associated in Bolivia much more with nutritional balance than caloric intake, and hence susceptible to simple medical interventions. 44 The implied inflection point is about 92% of the population without sewerage.

How Do Central and Local Governments Differ?
60
Figure 3
Independent Var I II III IV I II III IVDemographic & Regional
Controls?Economic PCV1 0.00512 0.00281 0.00311 0.00524 0.00348 0.00292 0.00286 0.00371
(0.780) (0.472) (0.504) (0.804) (3.313) (2.949) (2.843) (3.384)Economic PCV3 -0.0115 -0.0103 -0.0104 -0.0112 -0.0029 -0.0023 -0.0025 -0.003
(-0.944) (-0.913) (-0.844) (-0.898) (-2.320) (-1.909) (-2.004) (-2.314)Political Protest Vote PCV1 -0.0131 -0.0139 -0.0135 -0.0131 0.00133 0.00162 0.00142 0.00114
(-0.776) (-0.837) (-0.801) (-0.770) (0.918) (1.117) (0.958) (0.761)Civil Institutions PCV1 0.01931 0.01897 0.01911 0.01878-0.0002 -0.0003 -0.0002 -0.0003
(2.857) (2.830) (2.819) (2.797) (-0.233) (-0.265) (-0.216) (-0.292)Private Sector PCV1 0.00177 0.00132 0.00162 0.0018 -0.0019 -0.0032 -0.0025 -0.0021
(0.213) (0.186) (0.241) (0.211) (-0.819) (-1.429) (-1.131) (-0.952)Training & Capacity Building 0.00993 0.00979 0.00979 0.01226 0.00109 0.00094 0.00016 0.00208
PCV1 (1.114) (1.094) (0.405) (0.503) (1.055) (0.909) (0.050) (0.709)Information Technology PCV1 -0.0142 -0.0151 -0.015 -0.0128 -0.0004 -0.0006 -0.0006 -0.0001
(-1.393) (-1.449) (-1.430) (-1.263) (-0.303) (-0.449) (-0.464) (-0.074)Central Gov Auditing PCV1 0.01542 0.01606 0.01602 0.01484 0.0039 0.00398 0.00419 0.00418
(1.353) (1.450) (1.451) (1.281) (2.029) (2.165) (2.246) (2.125)Municipal Administration PCV1 0.01125 0.01084 0.01087 0.01181 -0.0022 -0.002 -0.0019 -0.0021
(Robust Guidelines) (1.055) (1.023) (1.032) (1.092) (-1.432) (-1.345) (-1.290) (-1.353)Municipal Administration PCV2 -0.0114 -0.0112 -0.0111 -0.0108 0.00176 0.00207 0.0019 0.00201
(Strong Municipal Council) (-1.151) (-1.192) (-1.147) (-1.082) (1.549) (1.817) (1.662) (1.691)Project Planning PCV1 0.00519 0.00553 0.00529 0.00481 0.00116 0.00084 0.0011 0.00092
(0.629) (0.638) (0.624) (0.595) (0.892) (0.650) (0.854) (0.687)% Pop. w/out Sewerage 1 0.00141 0.00164 0.00145 0.00153
(0.298) (0.338) (2.408) (2.480)% Pop. w/out Sewerage 1, -4E-06 -6E-06 -8E-06 -8E-06
Square of (-0.110) (-0.148) (-1.850) (-1.920)
% Pop. w/Private Sewerage** -4E-05 -0.0004
(-0.022) (-2.888)% Pop. w/out Sewerage 2, 0.00025 0.00028
(0.187) (2.045)
Public Urinals per capita 1.0385 4.69693
(0.045) (3.057)
Needs-training interacted 1.3E-06 -3E-05 1.3E-05 -2E-05
(0.003) (-0.088) (0.308) (-0.458)constant -0.3197 -0.2358 -0.2558 -0.3246 -0.0417 0.02773 -0.0007 -0.0447
(-1.758) (-3.338) (-2.432) (-1.783) (-1.843) (6.270) (-0.062) (-1.938)
sigma 0.16295 0.16327 0.16319 0.1628 0.02775 0.02788 0.02799 0.0277
(4.612) (4.617) (4.585) (4.623) (11.48) (11.58) (11.77) (11.18)
χ2 51.13 50.76 50.81 49.16 35.97 33.67 31.37 37.95
Prob>χ2 0.0000 0.0000 0.0000 0.0002 0.0046 0.0060 0.0180 0.0060N 276 276 276 268 269 269 269 261* Tobit estimation with robust standard errors
z-stats in parentheses; PCVn = nth pricipal component variable
** Includes septic tanks, outhouses, etc.
Model*Central Government Local Government
YES YES YES YES YES YES YES YES

How Do Central and Local Governments Differ?
61
Education Figure 4
Ind. Var I II III IV I II III IVDemographic & Regional
Controls?Economic PCV1 0.00462 0.00415 0.00484 0.00471 -0.0017 -0.0016 -0.0017 -0.0013
(1.489) (1.360) (1.522) (1.415) (-1.695) (-1.652) (-1.718) (-1.420)Economic PCV3 -0.0007 -0.0002 -0.0007 -0.0015 0.00161 0.00172 0.00173 0.00174
(-0.184) (-0.054) (-0.203) (-0.417) (0.997) (1.086) (1.105) (1.046)Political Protest Vote PCV1 -0.0185 -0.0183 -0.0189 -0.0167 -0.0003 -0.0004 -0.0004 -0.0012
(-2.198) (-2.198) (-2.231) (-2.171) (-0.142) (-0.176) (-0.193) (-0.566)Civil Institutions PCV1 0.00865 0.00885 0.00875 0.008750.00338 0.00347 0.00344 0.00307
(2.459) (2.507) (2.489) (2.520) (1.986) (2.078) (2.033) (1.923)Private Sector PCV1 0.00024 0.00033 0.00033 0.00116 -0.0054 -0.0055 -0.0054 -0.0065
(0.144) (0.204) (0.206) (0.786) (-2.012) (-2.037) (-1.995) (-1.883)Training & Capacity Building -0.0004 0.00213 0.00226 0.00381 0.00161 0.00218 0.00221 0.00185
PCV1 (-0.061) (0.682) (0.725) (0.483) (0.533) (1.615) (1.639) (0.593)Information Technology PCV1 -0.0055 -0.0054 -0.0055 -0.0059 -0.0021 -0.002 -0.002 -0.0014
(-1.220) (-1.203) (-1.206) (-1.263) (-1.312) (-1.268) (-1.311) (-0.896)Central Gov Auditing PCV1 0.01288 0.01317 0.01235 0.01029 -0.0019 -0.002 -0.0021 -0.0023
(2.899) (2.912) (2.720) (2.345) (-0.967) (-1.056) (-1.076) (-1.084)Municipal Administration PCV1 -0.0057 -0.0056 -0.0059 -0.0067 0.00117 0.00127 0.00119 0.00161
(Robust Guidelines) (-1.205) (-1.190) (-1.250) (-1.313)(0.819) (0.896) (0.838) (1.092)Municipal Administration PCV2 0.00679 0.00669 0.00719 0.0064 -0.0008 -0.0008 -0.0008 -0.0004
(Strong Municipal Council) (1.682) (1.649) (1.750) (1.711) (-0.532) (-0.539) (-0.510) (-0.308)Project Planning PCV1 0.00243 0.00241 0.0022 0.00084 -0.0001 -0.0002 -0.0003 0.00021
(0.568) (0.568) (0.518) (0.181) (-0.095) (-0.153) (-0.184) (0.146)Illiteracy Rate (Adult) 0.0003 0.00058
(0.462) (1.958)Illiteracy Rate (Over-6s) 1.8E-06 0.00065
(0.002) (1.822)
Illiteracy Rate (Over-15s) 0.00059 0.0006
(0.788) (1.766)Educational Attainment, Low 0.00125 0.00082
(0-3 years) (1.552) (2.476)
Educational Attainment, 0.00114 0.00252
University (0.537) (1.093)
Local Education Authority -0.027 -0.0265 -0.0268 0.00890.0084 0.00867
(-1.803) (-1.764) (-1.785) (1.810) (1.726) (1.777)Needs-Training Interacted 1 8.2E-05 1.7E-05
(0.409) (0.197)
Needs-Training Interacted 2 -6E-05 -4E-06
(-0.213) (-0.038)
constant -0.086 -0.077 -0.0954 -0.1737 0.02294 0.02377 0.02208 -0.0107
(-2.452) (-2.268) (-2.483) (-2.437) (1.978) (2.065) (1.705) (-0.443)sigma 0.05658 0.05672 0.05656 0.05782 0.03645 0.03649 0.03647 0.03647
(4.674) (4.661) (4.716) (4.510) (13.13) (13.08) (13.20) (13.09)
χ2 32.20 31.94 32.39 30.91 34.74 34.20 34.47 35.08
Prob>χ2 0.0208 0.0153 0.0134 0.0295 0.0102 0.0079 0.0073 0.0092N 276 276 276 275 269 269 269 269* Tobit estimation with robust standard errors z-stats in parentheses; PCVn = nth pricipal component variable
Model*Central Government Local Government
YES YES YES YES YES YES YES YES
Central investment in education showed no discernible relation to need. I use a
variety of indicators of literacy and educational attainment, but none is significant.

How Do Central and Local Governments Differ?
62
Interestingly, the presence of a local educational authority caused investment to fall
under central government. This implies that the center went out of its way to deprive of
resources those districts where sectoral authorities were in operation, a perverse result.
As with health and water, investment increased with the strength of local civil
institutions, implying that the grass roots were able to lobby the center successfully for
investment in education. I discount the central auditing, municipal administration and
protest vote coefficients as spurious correlations. Note that unlike health, the private
sector PCV is not significant anywhere.
Decentralized investment patterns, once again, are very different. Investment
rises with indicators of need across all models, including various measures of illiteracy
and educational attainment. The presence of local health authorities is also significant
here, but now positive as we would expect. It is also notable that investment rises as
wealth and income fall, making local education investment economically progressive.
As in health, investment rises in all three sectors where civil institutions are stronger, and
falls in measures of the private sector. This signals the existence of a healthy local
political economy, where groups lobby for the sorts of investment that interest them
most.
Urban Development
Very few municipalities received any investment in urban projects before 1994,
with only 24 non-zero observations for central government investment. Hence I reduce
the number of explanatory variables in each model by dividing the Z vector into two
subvectors, Z1 and Z2,45 and estimate
Gm = ζSm + η1Z1m + εm and (2´)
Gm = ζSm + η2Z2m + εm (2´´)
separately using the same needs variables, as well as economic, demographic and
regional controls in each model.
45 Where, using the notation of equation (2), Z1=Z1-Z7 and Z2=Z1-Z3 & Z8-Z11.

How Do Central and Local Governments Differ?
63
Figure 5
Independent Var I II III IV I IIDemographic & Regional
Controls?Economic PCV1 -0.0043 -0.0232 -0.0229 -0.0763 0.003124 0.003575
(-0.099) (-0.361) (-0.536) (-1.262) (2.759) (3.061)Economic PCV3 -0.0954 0.11492 -0.1006 0.06418 -0.00477 -0.00449
(-0.965) (0.879) (-1.117) (0.570) (-2.777) (-2.561)Political Protest Vote PCV1 -0.4303 -0.3555 -0.00542 -0.00575
(-2.114) (-1.867) (-2.022) (-2.319)Civil Institutions PCV1 0.11442 0.13407 0.002936 0.002915
(1.839) (2.096) (1.000) (0.910)Private Sector PCV1 -0.0704 -0.0325 0.013894 0.013566
(-0.958) (-0.671) (2.080) (2.011)Training & Capacity Building 0.07368 0.0798 -7.2E-05 0.000118
PCV1 (1.145) (1.201) (-0.050) (0.085)Information Technology PCV1 0.0923 0.13464 0.000428 0.000988
(1.488) (2.050) (0.294) (0.704)Central Gov Auditing PCV1 0.15289 0.19215 0.001128 0.000324
(1.481) (1.450) (0.631) (0.168)Municipal Administration PCV1 -0.048 -0.0737 0.000886 0.000806
(Robust Guidelines) (-0.575) (-0.706) (0.527) (0.494)Municipal Administration PCV2 -0.2028 -0.1886 0.0002060.000578
(Strong Municipal Council) (-2.327) (-2.230) (0.148) (0.424)Project Planning PCV1 -0.0056 0.03371 -0.00033 -0.00069
(-0.059) (0.319) (-0.239) (-0.504)Sports Facilities per capita** -1989.9 -1240.5 9.555442
(1994) (-0.841) (-0.327) (3.473)Solid Waste Disposal sites -1620.1 -32251 135.2504
(Landfills) per capita (1994) (-0.464) (-1.744) (2.002)
Museums per capita (1994) -376.88 -2326.5 40.59828
(-0.378) (-0.705) (1.869)Markets per capita (1994) -41.835 -647.89 0.186157
(-1.033) (-1.119) (2.517)
Commercial & Recreational -3.5377 -19.14 0.19468
Infra. (aggregate, per cap 1994) (-0.804) (-0.919) (1.920)
Needs-training interacted 118.697 17.92777
(0.074) (2.158)constant -1.6378 -1.783 -1.7413 -1.7514 0.048671 0.048174
(-3.341) (-2.704) (-3.102) (-2.571) (9.671) (8.904)
sigma 0.72378 0.65308 0.75333 0.71266 0.034031 0.033904
(4.185) (2.802) (4.170) (2.721) (11.265) (11.225)
χ2 56.89 54.63 51.15 43.76 92.31 83.09
Prob>χ2 0.0000 0.0000 0.0000 0.0000 0.0000 0.0000N 273 257 269 255 245 244* Tobit estimation with robust standard errors
z-stats in parentheses; PCVn = nth pricipal component variable
** Defined as other than football fields, multi-use courts and coliseums
Model*Central Government Local Government
YES YES YES YES YES YES
Urban development is the only sector where central government seems to have
invested progressively in terms of need. Of the five indicators of need employed, one –
solid waste disposal (i.e. landfills) – is significant in one of the models. Its negative sign
implies that the center invested more where such facilities were more scarce, and hence
where need was greater. But no other needs indicator is significant, and landfills is

How Do Central and Local Governments Differ?
64
insignificant in model 1. Evidence for progressivity is thus weak. Civil institutions
seem to have increased central investment where they are abundant, but the private
sector variable, surprisingly, is insignificant.
Investment under decentralization shows a very different pattern. All five
variables of need are significant and positive, implying that local government invests
more where existing infrastructure is in abundance, and investment is regressive in terms
of need. These results are supported by the economic variables, which are significant
and strongly regressive; investment rises as wealth and income rise, and falls where
poverty is greater. As we would expect, investment rises with the number and
dynamism of private sector firms, which I ascribe to firms lobbying for the type of
projects (i.e. contracts) from which they stand to gain. It is notable that the variable for
political disaffection and protest is significant and negative. Given the pattern of local
investment we observe, I interpret this as an indication that voters are successful in at
least partially reducing resource flows to a sector in which investment is generally
regressive and largely benefits firms. This describes a local political economy with a
healthy dynamic in which different interests compete for resources, and – crucially –
voters and non-business interests can affect policy decisions. Given the number of
municipalities that invest in this sector and the scale of resources involved, this is an
important result.
Of the remaining coefficients only the interacted need-training variable is
significant. Like pure indicators of need above, it is also regressive. Although training
seems to have no direct effect on investment, to the extent that it makes local
government more aware of need it may make investment more regressive.

How Do Central and Local Governments Differ?
65
Water Management Figure 6
Ind. Var I II III IV V VI I II IIIDemographic & Regional
Controls?Economic PCV1 -0.0161 -0.0184 -0.0126 -0.0094 1.3E-06 -0.0069 0.0013 0.00114 0.00078
(-1.366) (-1.226) (-0.992) (-0.622) (-0.618) (1.956) (1.405) (1.259)Economic PCV3 -0.0167 -0.0385 -0.0175 -0.0569 -0.0423 -0.0427 -0.0029 -0.003 -0.0019
(-1.130) (-2.684) (-0.995) (-2.529) (-2.167) (-2.436) (-3.050) (-2.762) (-2.174)Political Protest Vote PCV1 -0.0784 -0.1176 -0.0808 -0.0023 -0.0021 -0.0024
(-1.752) (-2.161) (-1.822) (-1.855) (-1.675) (-1.887)Civil Institutions PCV1 -0.0094 -0.0199 -0.0087 0.0012 0.00088 0.00149
(-0.913) (-1.238) (-0.661) (1.732) (1.352) (1.868)Private Sector PCV1 0.00553 -0.0113 0.00671 0.0004 0.00538 -0.0002
(0.867) (-0.251) (0.825) (0.517) (1.395) (-0.276)Training & Capacity Building -0.1254 -0.1075 0.00046 0.00237 0.00499 0.0004
PCV1 (-1.962) (-1.381) (0.020) (0.964) (1.593) (0.505)Information Technology PCV1 0.01334 0.01093 0.01512 -0.0004 -0.0007 -0.0006
(0.769) (0.565) (0.772) (-0.448) (-0.799) (-0.640)Central Gov Auditing PCV1 0.00603 0.0116 8.9E-05 -0.0016 -0.0011 -0.0009
(0.305) (0.510) (0.005) (-1.596) (-1.157) (-0.981)Municipal Administration PCV1 -0.0233 -0.0315 -0.0224 0.00079 0.00116 0.00106
(Robust Guidelines) (-1.375) (-1.843) (-1.391) (0.911) (1.306) (1.264)Municipal Administration PCV2 0.04589 0.04313 0.03772 0.00072 0.00105 0.00105
(Strong Municipal Council) (1.904) (1.725) (1.691) (0.853) (1.146) (1.244)Project Planning PCV1 0.00562 -0.0028 -0.0045 -0.0003 -0.0007 -0.0008
(0.260) (-0.132) (-0.219) (-0.387) (-0.718) (-0.790)Local Health Authority 0.63796 0.85599 0.65894 1.10805 0.68496 0.89958 0.00297 0.00503 0.0019
(3.313) (2.776) (3.111) (2.916) (3.235) (2.863) (0.470) (0.707) (0.287)% Pop. w/out Sewerage 1 -0.0179 -0.0055 -0.0057 -0.0049 0.00178 0.00026
(-2.739) (-0.828) (-1.492) (-1.281) (3.106) (1.753)
% Pop. w/out Sewerage 1, 0.0001 1.5E-05 -1E-05
Square of (2.658) (0.243) (-2.816)% Pop. w/out Sewerage 2 -0.0047 -0.0039 0.00023
(-1.486) (-1.324) (2.045)
% Pop. w/out Water 1 0.00316 0.01223 0.00188
(0.645) (1.197) (4.215)
% Pop. w/out Water 1, -3E-05 -9E-05 -1E-05
Square of (-0.798) (-1.085) (-4.068)% Pop. w/out Water 2 0.001 0.00088 -0.0001
(0.799) (0.773) (-1.468)
% Pop. w/Water -0.0029 -0.0034 4.9E-07
(Internal Plumbing) (-0.965) (-1.043) (0.003)
% Pop. w/Private Standpipe 0.00026 -0.0005 0.00032
(0.153) (-0.275) (1.639)% Pop. w/Public Standpipe -0.0148 -0.01 0.00042
(-2.676) (-1.773) (2.114)
Storm Drainage per capita -298.46 -297.96 -16.668
(1994) (-1.049) (-0.563) (-0.857)Needs-Training Interacted 1 0.00182 -3E-05
(1.834) (-0.849)Needs-Training Interacted 2 0.00152 -6E-05
(1.335) (-1.440)
Model*Central Government Local Government
YES YES YES YES YES YES YES YES YES

How Do Central and Local Governments Differ?
66
Ind. Var I II III IV V VI I II III
Model*Central Government Local Government
constant -0.2879 -0.9658 -0.6264 -1.5882 -0.5857 -0.8976 -0.0669 -0.084 -0.0321
(-1.633) (-2.189) (-2.743) (-2.674) (-3.408) (-3.194) (-2.832) (-3.680) (-2.234)sigma 0.16573 0.17072 0.17567 0.19856 0.16219 0.17232 0.0173 0.01738 0.01751
(2.978) (2.809) (3.096) (3.015) (2.936) (2.762) (6.649) (6.793) (6.936)
χ2 30.85 29.83 25.51 21.32 32.36 27.53 79.86 84.40 72.99
Prob>χ2 0.0092 0.0125 0.0613 0.1664 0.0090 0.0247 0.0000 0.0000 0.0000N 300 282 294 275 300 282 269 263 269* Tobit estimation with robust standard errors z-stats in parentheses; PCVn = nth pricipal component variable
The water management sector is related to water & sanitation, but is broader in
scope. It includes such projects as reservoirs and wastewater treatment lagoons, which
are components of municipal (potable) water systems, as well as levees and storm
drainage works, which are not. In general the degree of overlap between the two sectors
is high, and I use similar indicators of need for both. As for urban projects, central
government invested in water management in very few municipalities prior to 1994, and
so again I estimate equations (2´) and (2´´).
The striking result in models I-VI is that those needs variables that are significant
are negative, and hence regressive in terms of need. As more people had no water in
their homes (i.e. rely on public standpipes) and as the proportion of people without
sewerage grew, central government invested less in water. This trend is marked, with
three indicators significant at the 1% level and one more at the 10% level. This finding
is confirmed by the second economic indicator, which shows that investment fell as
measures of poverty increased. Interestingly, the presence of a local health authority
served to increase investment in all six models. The fact that this term is insignificant in
the decentralization models implies that local health authority lines of communication
and influence are sectoral more than geographic. That is, they were better able to lobby
central government – presumably through their ministerial representatives in the capital
– than their own, local representatives. The fact that local health authorities are
generally composed of chief physicians and hospital managers who are often devolved
ministerial staff, and hence “foreign” to the locality, may explain this pattern. Indicators
of municipal government, training and capacity building, and the political protest vote
are also significant, but I dismiss these as spurious correlations.
Once again, the results for decentralized government are completely different.
Local government invested greater sums in municipalities where people lacked running

How Do Central and Local Governments Differ?
67
water and sewerage. The models are robust to the several measures of water and
sewerage provision used. A series of indicators in increasing quality of service (model
III) reveals a progressive pattern of investment that increases where households receive
water from public or private standpipes and then falls to zero where the proportion of
households with internal plumbing is high. But significant squared terms of population
without water and sewerage point to a poverty trap for the neediest localities.46 I
interpret these results to indicate a virtuous cycle where knowledge of the benefits of
water and sanitation spreads through a population via a demonstration effect. But where
existing infrastructure is below some critical threshold, voters remain ignorant and do
not pressure their local government for investment.
This interpretation is supported by the coefficients for civil institutions, which
imply that strong local organizations succeed in pressing local government to invest
more in water projects. As we found for urban projects, the indicator of electoral protest
is negative and significant, implying that local governments without a strong electoral
base are unable to undertake the expensive and complicated projects of the water sector.
No other institutional or procedural variables are significant.
Agriculture
The models of central investment in agriculture are significant at the 10% and
30% levels respectively, and hence I discount the second and interpret the results of the
first with extra care. The evidence is that central government invested regressively in
terms of need, with female malnutrition negative and just significant, and male
malnutrition approaching significance. The data thus weakly suggests that central
government invested less where levels of malnutrition were higher. On the other hand,
civil institutions were able to increase investment where they are abundant and well
organized. Unsurprisingly the indicator of the private sector, which excludes private
farming of all types, is not significant, nor are economic variables.
46 Implied inflection points are around 65% of the population without access to water and 80% without access to sewerage.

How Do Central and Local Governments Differ?
68
Independent Var I II I IIDemographic & Regional
Controls?Economic PCV1 0.00983 0.0080 -0.0007 -0.0005
(0.773) (0.611) (-1.690) (-0.919)Economic PCV3 -0.0048 -0.0112 0.00015 -0.0009
(-0.190) (-0.457) (0.286) (-0.752)Political Protest Vote PCV1 -0.0091 -0.0262 -0.0001 -0.0026
(-0.270) (-0.847) (-0.156) (-1.139)Civil Institutions PCV1 0.02137 0.02504 0.00023 0.00043
(1.703) (1.942) (0.528) (0.818)Private Sector PCV1 0.00973 0.0072 -0.0012 -0.0016
(0.922) (0.664) (-1.896) (-1.748)Training & Capacity Building 0.11584 0.02446 -0.0007 0.00076
PCV1 (2.238) (1.208) (-0.311) (1.093)Information Technology PCV1 -0.0243 -0.0304 0.00083 0.00081
(-1.053) (-1.234) (1.219) (0.919)Central Gov Auditing PCV1 0.03112 0.03264 4.2E-06 0.0002
(1.291) (1.313) (0.007) (0.247)Municipal Administration PCV1 -0.0029 -0.0003 0.00042 -0.0007
(Robust Guidelines) (-0.160) (-0.017) (0.756) (-0.720)Municipal Administration PCV2 -0.0095 -0.0085 1E-05 -0.0006
(Strong Municipal Council) (-0.399) (-0.362) (0.021) (-0.693)Project Planning PCV1 0.01359 0.0104 0.00036 -4E-05
(0.720) (0.504) (0.723) (-0.061)Malnutrition Rate, Males -0.0092 0.00034
(-1.410) (1.963)Malnutrition Rate, Females -0.0084 -9E-05
(-1.639) (-0.776)
Slaughterhouses per capita -60.953 -63.316 -1.4784 -2.2122
(1994) (-1.120) (-1.055) (-2.047) (-2.014)Municipal Nurseries per capita -391.03 -25.21
(i.e. Plants - 1994) (-1.007) (-1.978)
Needs-training interacted -0.0039 4.2E-05
(-1.677) (0.407)
constant 0.05426 -0.3183 0.00129 0.00589
(0.420) (-4.189) (0.313) (1.779)sigma 0.34342 0.36165 0.01203 0.01848
(6.301) (6.520) (6.564) (4.911)
χ2 27.78 19.61 36.06 31.79
Prob>χ2 0.0878 0.2946 0.0104 0.0160
N 263 274 257 267
* Tobit estimation with robust standard errors z-stats in parentheses PCVn = nth pricipal component variable
Model*Central Gvt. Local Gvt.
YES YES YES YES
Figure 7
By contrast, local
government invests more where
more males are malnourished,47
where there are fewer municipal
slaughterhouses, and where
municipal nurseries are scarce.
Local investment is thus
progressive in terms of need.
These results are weakly
supported by the first economic
variable, which suggests in one
of the two models that investment
falls as wealth and income
increase. Investment falls with
measures of private sector
activity in both models, which is
not surprising as explained
above, and points to a healthy
local political economy where
competing interests lobby for the
types of investments they most
prefer.
2.3 Results – Summary
Detailed econometric
models of investment across ten
sectors show how public
investment decisions changed with
decentralization, and provide insight into the social and institutional mechanisms by
which these changes took place. Decentralization changed the policy regime from one
where central government invested less where need was greater to one where local
government invests more. Whereas the center invested regressively in terms of need in

How Do Central and Local Governments Differ?
69
three of the six main sectors of interest: health, water management and agriculture, local
government invests progressively in terms of need in five of these six: health, water &
sanitation, education, water management and agriculture. Indeed, local investment is
regressive only for urban development. The fact that local investment was economically
progressive in health, education and agriculture increases confidence in these findings.
So far the results mirror those of Chapter 2, albeit in greater detail. But the
models also allow us to probe much more deeply into the decision-making processes
which led to this change, giving us insight into the political and institutional dynamics of
local government and their effects on policy. Variables for civil institutions and the
private sector are significant across a number of sectors and imply that each is successful
in pressing local government to increase investment in those areas of greatest interest to
it. Thus, local firms successfully lobby for lower investment in health, education and
agriculture in districts with a vigorous private sector in order that more resources may be
devoted to urban development, a sector which offers them many more lucrative contracts
than training farmers or refurbishing schools.48 And civil organizations, representing
civil society via neighborhood organizations, rural syndicates and other grass roots
groups, succeed in getting local government to increase investment in health, education
and water, their areas of highest priority.49 The fact that the variable for political
disaffection and protest enters negatively in our model of urban development, where
investment is strongly regressive both economically and in terms of need, suggests a
healthy picture of local democracy in which voters are able to influence local
government through both their civil institutions and the electoral mechanism. Where
local government works well, even the poorest citizens have voice and may participate in
the policy debate, providing an effective counterweight to the power of private firms and
government’s own politico-bureaucratic interests.
It is thus not surprising that local government is sensitive to local need. The
competitive interplay of local political forces ensures that the local administration will be
47 Interestingly, female malnourishment seems to have no significant effect. 48 It may at first glance seem perverse that local business would be associated with decreasing levels of educational investment, implying a less skilled workforce. But the time inconsistency between local firms facing a high failure rate (in Bolivia as elsewhere), and social projects whose full benefits may lag by a generation or more, leads firms to prefer investment in urban development, where the benefits are large and immediate. Businessmen may rationally prefer useless urban projects that ensure them a few years’, or even months’, survival over projects with a much higher social return but where the contracts are less generous.

How Do Central and Local Governments Differ?
70
well informed about voters’ preferences. And binding mechanisms exist to ensure
accountability. Chapters 5 and 6 explore in great detail the question of how a consensus
on local preferences is established and then represented before local authorities by
interest groups and various mediating organizations.
The type of municipal administration, though less important than the interplay of
political forces, does seem to affect local investment in interesting ways. A strong,
activist municipal council is associated with increasing investment in health and water,
two sectors where investment is progressive in terms of need and which civil
organizations favor. This combination of results suggests that a strong council serves the
governance process by effectively transmitting demand from the grass-roots up to the
level of decision-making, resulting in investment more closely aligned with people’s
preferences. This argues against the common claim that robust oversight mechanisms
obstruct government action, whereas a strong executive promotes agile government.
Indeed the first municipal administration PCV, representing a strong executive and clear
operating procedures, is not significant in any of the main sectors of interest. I examine
this issue more deeply in Part II.
The results for IT, training and capacity building, project planning, and central
government auditing are mostly insignificant, with the few coefficients that are
significant and not self-contradictory scattered unsystematically amongst the various
sectors.50 This is interesting precisely because it is counter-intuitive – indeed, I expected
the opposite. In the case of IT, it could be that the types of investments undertaken by
the majority of Bolivian municipalities are insufficiently complex to take full advantage
of the technology, and thus it will take some time for its full potential to be realized.
Given high rates of obsolescence, the necessary implication is that a significant part of
the investment undertaken in IT systems to date was premature, and much of it wasted.
In the case of training and capacity-building, I have at my disposal 29 indicators of
training programs undertaken and requested. If the models have failed to detect a
significant effect in any sector, it is likely that there is none to be detected, at least with
current data. The same is true for project planning techniques.
49 This interpretation agrees with evidence presented in Part II, which cites extensive interviews with voters and the leaders of grass-roots organizations that reveal strong local preferences for investment in education, health, water and productive projects (usually agriculture). 50 Project planning is not significant in any of the main sectors of interest, training approaches significance in one, IT achieves it only in health, and central auditing seems to increase investment in water but decrease it in health.

How Do Central and Local Governments Differ?
71
Lastly I return to my models of central government, where civil institutions
increased investment in health, water, education, urban development and agriculture, and
the private sector decreased investment in health. I interpret this as evidence that a
political-economy dynamic was also at work there, with municipal forces competing for
influence over central government resources. But the fact that central investment was
regressive both economically and in terms of need, as well as concentrated in a minority
of municipalities (as we saw in Chapter 2), indicates that the center was much less
sensitive to local political forces and local priorities than decentralized government.
Although a local political dynamic did operate under the former, and managed to
influence policy, it did so with much lower efficacy and a correspondingly smaller effect
on government outputs. But this begs the question of decentralization: If the center
attempts to take account of local politics in its provision of public services but does so
ineffectively, then why not decentralize? Why run a system where government’s
response to local priorities is muted by distance, incentives, and (geographically)
extraneous political considerations?
3. Theory: A Problem of Agency and Control Rights
Section two leaves us with four facts about central government that require
explanation. Not only was centralized investment (1) concentrated across space,
ignoring one-half of Bolivia’s districts, and (2) dominated by economic infrastructure
projects while ignoring social and human capital investment; it was also (3)
economically regressive and (4) regressive in terms of need. We saw evidence above
that a form of political economy mechanism was at work under central government
which somehow involved private and civic actors in the policy-making process. But this
was evidently insufficient to link investment to the needs of the districts that received it,
or distribute it more widely. Why is this when the opposite of each of the four facts is
true for local government? What factors account for such behavior? The data can take
us no further, and the question in any event does not appear susceptible to marginal
analysis. I turn instead to structural factors, and to theory.
Chapter 2 showed that a given district j will be better off under central
government when the center’s cost advantage dominates its inaccuracy in ascertaining
local preferences, α<p. This assumes that resource allocation is essentially a function of
external parameters, and the differences between central and local government do not
have to do with the structure of government and the processes by which decisions are

How Do Central and Local Governments Differ?
72
taken. Given α<p, welfare will be maximized under central government as it
disinterestedly distributes a bigger pie amongst districts according to its objective
function, without regard to external considerations. But the data in Chapter 2 implies
that a more sophisticated approach is needed to explain the Bolivian experience. The
fact that half of all Bolivian municipalities received no investment at all in the years
before decentralization, even in sectors such as energy and transport where a priori we
expect the center to have a cost advantage, suggests that policy is the product of a
competition amongst interest groups and not just objective parameters, and that more
complex institutional factors are at work than those proposed in Chapter 2.
This model builds on the previous one, adding a mechanism of political
bargaining that provides a more refined portrayal of the ways in which central and local
governments interact and simplifies our results. It assumes the same political-
geographic context as Chapter 2, but diverges from it in the way it conceptualizes central
government’s problem. Unlike Chapter 2, central and local government are not mutually
exclusive, but rather coexist, and the choice between centralization and decentralization
concerns the way each interacts with the other. Specifically, under decentralization there
is no cooperation between center and periphery, while under centralization mutually
beneficial cooperation is possible but not assured. Municipalities’ allocation of public
goods under centralization is the result of bargaining in a national legislature in which a
district’s representatives negotiate with central government officials, representing all
other districts, in a zero-sum game51 centered on the public purse. This mimics real-
world political horse-trading, where central government politicians bargain with local
leaders for political support in exchange for commitments of public expenditure, locally-
favorable policies, or other political rewards in the center’s gift.
3.1 The Model
Following Chapter 2, a country is made up of T districts, each with population nj
where subscript j denotes district. Local welfare is defined as median utility, Umj = xmj +
θmjb(gj), where θmj denotes local median preference for the public good g in district j,
and xmj is the median consumption of private good x in district j. The function of
government is to provide public goods, which it finances with a local head tax. Central
government has a cost advantage in the provision of public goods, such that the head tax
51 The allocation of resources within central government is zero-sum, while the shift from local to central government is not.
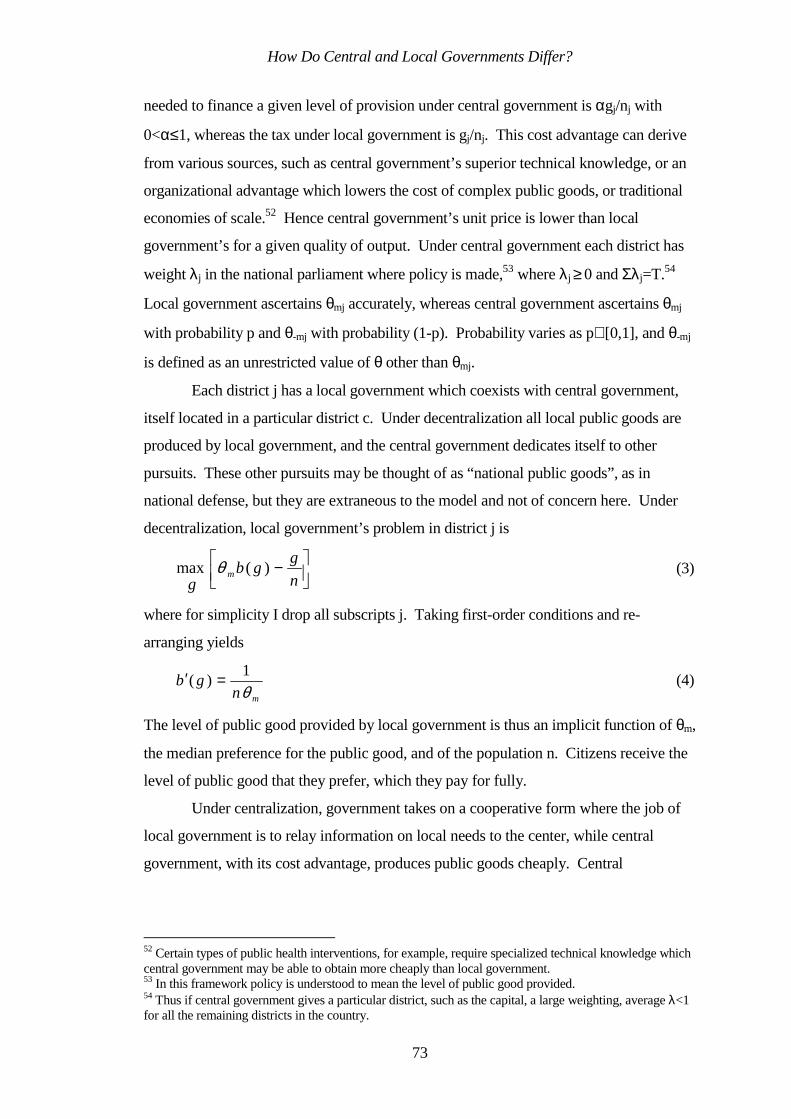
How Do Central and Local Governments Differ?
73
needed to finance a given level of provision under central government is αgj/nj with
0<α≤1, whereas the tax under local government is gj/nj. This cost advantage can derive
from various sources, such as central government’s superior technical knowledge, or an
organizational advantage which lowers the cost of complex public goods, or traditional
economies of scale.52 Hence central government’s unit price is lower than local
government’s for a given quality of output. Under central government each district has
weight λj in the national parliament where policy is made,53 where λj ≥ 0 and Σλj=T.54
Local government ascertains θmj accurately, whereas central government ascertains θmj
with probability p and θ-mj with probability (1-p). Probability varies as p∈[0,1], and θ-mj
is defined as an unrestricted value of θ other than θmj.
Each district j has a local government which coexists with central government,
itself located in a particular district c. Under decentralization all local public goods are
produced by local government, and the central government dedicates itself to other
pursuits. These other pursuits may be thought of as “national public goods”, as in
national defense, but they are extraneous to the model and not of concern here. Under
decentralization, local government’s problem in district j is
−n
ggb
gm )(max θ (3)
where for simplicity I drop all subscripts j. Taking first-order conditions and re-
arranging yields
mn
gbθ1
)( =′ (4)
The level of public good provided by local government is thus an implicit function of θm,
the median preference for the public good, and of the population n. Citizens receive the
level of public good that they prefer, which they pay for fully.
Under centralization, government takes on a cooperative form where the job of
local government is to relay information on local needs to the center, while central
government, with its cost advantage, produces public goods cheaply. Central
52 Certain types of public health interventions, for example, require specialized technical knowledge which central government may be able to obtain more cheaply than local government. 53 In this framework policy is understood to mean the level of public good provided. 54 Thus if central government gives a particular district, such as the capital, a large weighting, average λ<1 for all the remaining districts in the country.
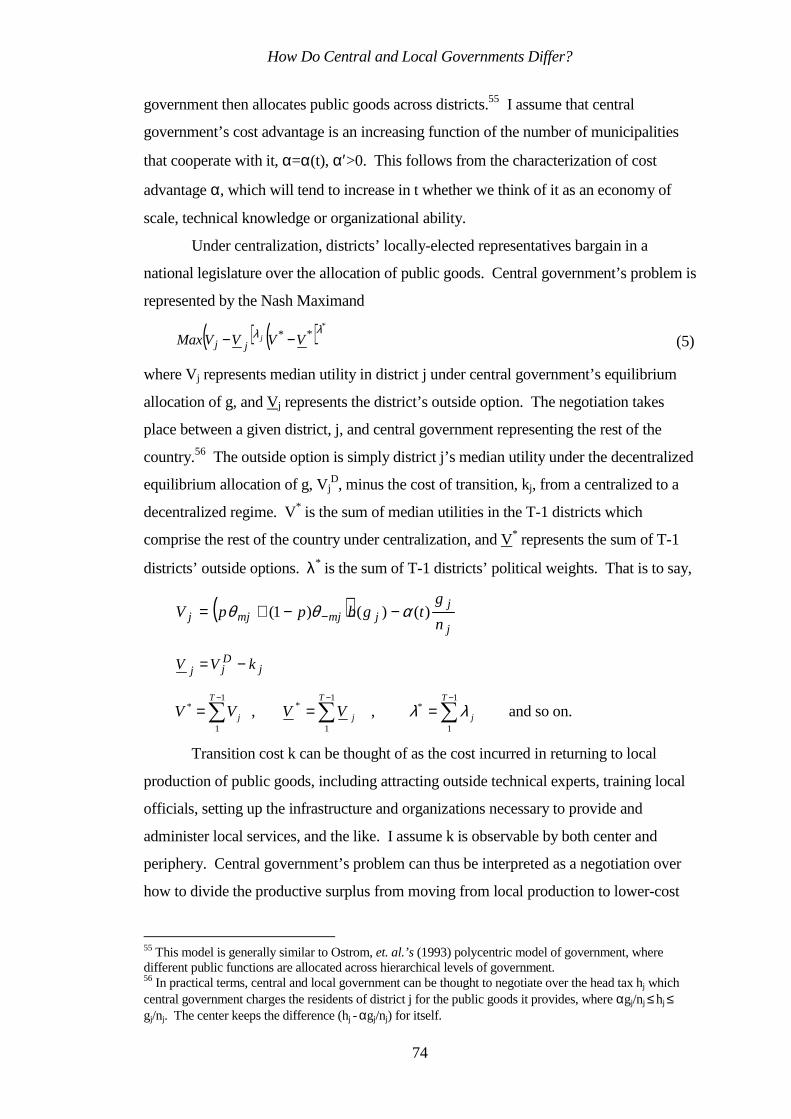
How Do Central and Local Governments Differ?
74
government then allocates public goods across districts.55 I assume that central
government’s cost advantage is an increasing function of the number of municipalities
that cooperate with it, α=α(t), α′>0. This follows from the characterization of cost
advantage α, which will tend to increase in t whether we think of it as an economy of
scale, technical knowledge or organizational ability.
Under centralization, districts’ locally-elected representatives bargain in a
national legislature over the allocation of public goods. Central government’s problem is
represented by the Nash Maximand
( ) ( ) *** λλ VVVVMax j
jj −− (5)
where Vj represents median utility in district j under central government’s equilibrium
allocation of g, and Vj represents the district’s outside option. The negotiation takes
place between a given district, j, and central government representing the rest of the
country.56 The outside option is simply district j’s median utility under the decentralized
equilibrium allocation of g, VjD, minus the cost of transition, kj, from a centralized to a
decentralized regime. V* is the sum of median utilities in the T-1 districts which
comprise the rest of the country under centralization, and V* represents the sum of T-1
districts’ outside options. λ* is the sum of T-1 districts’ political weights. That is to say,
( )j
jjmjmjj n
gtgbppV )()()1( αθθ −−+= −
jDjj kVV −=
∑−
=1
1
*T
jVV , ∑−
=1
1
*T
jVV , ∑−
=1
1
*T
jλλ and so on.
Transition cost k can be thought of as the cost incurred in returning to local
production of public goods, including attracting outside technical experts, training local
officials, setting up the infrastructure and organizations necessary to provide and
administer local services, and the like. I assume k is observable by both center and
periphery. Central government’s problem can thus be interpreted as a negotiation over
how to divide the productive surplus from moving from local production to lower-cost
55 This model is generally similar to Ostrom, et. al.’s (1993) polycentric model of government, where different public functions are allocated across hierarchical levels of government. 56 In practical terms, central and local government can be thought to negotiate over the head tax hj which central government charges the residents of district j for the public goods it provides, where αgj/nj ≤ hj ≤
gj/nj. The center keeps the difference (hj - αgj/nj) for itself.

How Do Central and Local Governments Differ?
75
central production of public goods. Note that the preference structure of Chapter 2 is
retained, folded into a bargaining structure.
Taking first-order conditions and re-arranging yields
*
**** )(
)(
gV
gV
VV
VV j
j
jjj
∂∂
∂∂
=−
−
λ
λ (6)
and
)(
)(
**
*
* VV
VV
pV
pV
jj
j
j
−
−−=
∂∂
∂∂
λλ
(7)
Equation (6) shows that district j and the rest of the country divide the surplus in
proportion to their respective political weights and the marginal utility of the public good
in each. Equation (7) states that the ratio of marginal utilities in district j and the rest of
the country from increasing probability p is negative. Hence a unit increase in the
probability that θmj is assessed correctly, which by definition must improve welfare in
district j, must decrease welfare in the rest of the country – including district c where
central government resides. We can interpret this as an implicit cost of coordination
which the center must incur to liaise with district j and use information on j’s preferences
accurately. Doing so reduces the size of the surplus, providing the center with an
incentive to mis-assess local preferences. Note that this is not an explicit assumption,
but emerges from the structure of the model. Thus in the aggregate, taking account of
multiple negotiations, the center will tend to provide a policy mix different to that
preferred by the T districts. At this point the model can already explain the second
general result of decentralization – the shift in the sectoral composition of investment.
Figure 8 illustrates equilibrium allocations under both centralized and
decentralized regimes. For convenience I assume λj=T/2 and draw the welfare frontier
as a straight line.57
57 If λj is allowed to vary, then lines A´F´ and AF become curves.

How Do Central and Local Governments Differ?
76
Figure 8: Centralized and Decentralized Equilibria (for λλλλ j = T/2)
V *D
V j(0,0)
V*
V jDV
j D – k
j1 = V
j1
Vj D
– k
j2 =
Vj2
A
F
B
C
D
E
A´
F´
Under decentralization, the equilibrium solution for district j and the rest of the country
is located at point D (VjD,V*D). The move from local to central provision generates a
productive gain which shifts the welfare frontier (in terms of aggregate utility) out from
A´F´ to AF. Note that the size of the welfare gain (A´F´�AF) increases with central
government’s cost advantage and decreases with the cost of coordination. Triangle BCD
northeast of point D contains all combinations of Vj and V* that are Pareto-superior to
(VjD,V*D). The two parties will negotiate over points in this triangle. Line segment BC
represents feasible allocation sets that Pareto-dominate all other sets in BCD, including
the decentralized optimum D. BC thus describes all of the solutions that can occur in
equilibrium. As the graph illustrates, the number of admissible solutions is infinite. This
is a product of the unstructured form that negotiation has taken thus far. Adding a
simple structure along the lines of a Nash bargaining game permits the reduction of an
infinite set to an equilibrium that is unique.
A Nash Bargaining Game
Representing central government’s problem as a Nash bargaining game permits
the incorporation of a participation constraint for district j, which provides the key to

How Do Central and Local Governments Differ?
77
solving the model. The game is structured so that the negotiation over dividing up the
centralization surplus involves central government offering district j enough incentive to
cooperate. Three facets of the model are salient. First, the fact that central government
is located in a given district c implies that its employees live in c and benefit from the
public goods available there. Second, centralized production implies that the residents of
c appropriate any part of the productive surplus not allocated to other districts in the
country. Locating central government in a particular district thus ensures it is selfish.
Third, the fact that α=α(t) gives central government an incentive to induce as many
districts as possible to cooperate. District j, meanwhile, seeks to improve upon its
decentralized allocation VjD. This combination of incentives generates a game in which
the center offers districts the minimum allocation necessary to ensure the cooperation of
the largest number, thereby maximizing its own allocation of public goods.
Bargaining takes the form of a repeated four-period, single-offer game.
Negotiations between central government and all districts j occur simultaneously. In a
negotiation with any given district j, central government represents all T-1 remaining
districts. The four periods simulate a typical electoral cycle. Centralizing agreements
take effect with a lag of one period. Defection from central to local government,
however, can take place within a single period.58 Districts know the number of periods
between elections, and form their expectations about the next period’s allocation based
on current and past allocations. The structure of the game is as follows:
58 Negotiation and coordination amongst numerous districts is assumed to take longer than a unilateral decision to return to local production of public goods. This has the effect of increasing district j’s bargaining power compared to central government.
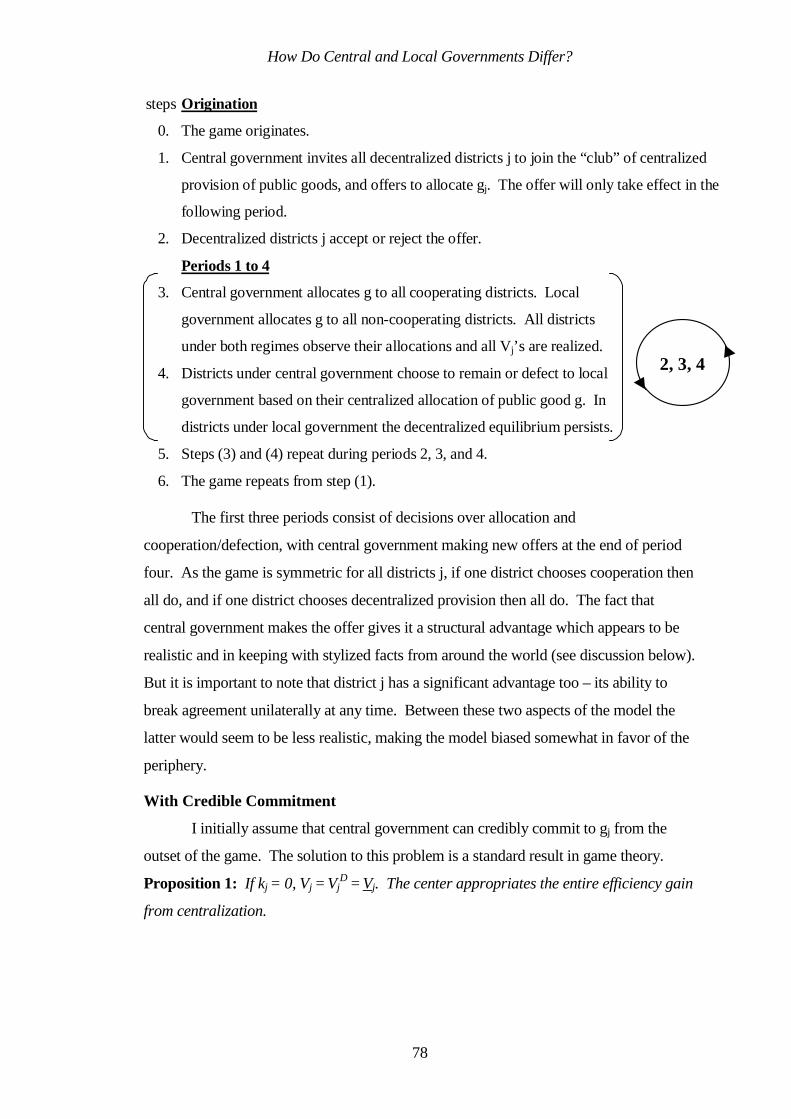
How Do Central and Local Governments Differ?
78
stepsOrigination
0. The game originates.
1. Central government invites all decentralized districts j to join the “club” of centralized
provision of public goods, and offers to allocate gj. The offer will only take effect in the
following period.
2. Decentralized districts j accept or reject the offer.
Periods 1 to 4
3. Central government allocates g to all cooperating districts. Local
government allocates g to all non-cooperating districts. All districts
under both regimes observe their allocations and all V j’s are realized.
4. Districts under central government choose to remain or defect to local
government based on their centralized allocation of public good g. In
districts under local government the decentralized equilibrium persists.
5. Steps (3) and (4) repeat during periods 2, 3, and 4.
6. The game repeats from step (1).
2, 3, 4
The first three periods consist of decisions over allocation and
cooperation/defection, with central government making new offers at the end of period
four. As the game is symmetric for all districts j, if one district chooses cooperation then
all do, and if one district chooses decentralized provision then all do. The fact that
central government makes the offer gives it a structural advantage which appears to be
realistic and in keeping with stylized facts from around the world (see discussion below).
But it is important to note that district j has a significant advantage too – its ability to
break agreement unilaterally at any time. Between these two aspects of the model the
latter would seem to be less realistic, making the model biased somewhat in favor of the
periphery.
With Credible Commitment
I initially assume that central government can credibly commit to gj from the
outset of the game. The solution to this problem is a standard result in game theory.
Proposition 1: If kj = 0, Vj = VjD = Vj. The center appropriates the entire efficiency gain
from centralization.

How Do Central and Local Governments Differ?
79
This is easily proven: District j has no incentive to accept a lower allocation than it
receives under decentralization, and thus its payoff space has lower bound VjD.59 Central
government has no incentive to offer more than the VjD+ε necessary to obtain j’s
agreement. Equilibrium thus occurs at point B in figure 8.
Allowing kj to take on nonzero values increases central government’s bargaining
power at the expense of j. At cost kj1, the default allocation set (Vj,V*) shifts leftwards,
suggesting an equilibrium at E. With high cost kj2, kj2 > kj1, the implied equilibrium
shifts back to A, with j’s welfare close to the origin. But j will not accept offers at A and
E, as both are below VjD. Central government must offer a level of gj such that Vj ≥ Vj
D
in order to secure the agreement of j, and we return to point B on figure 8.60 The result
implies that district j can never improve on its decentralized optimum, VjD, despite the
center’s cost advantage in service provision, credible commitment, and the possibility of
accurate preference assessment by the center. Only district c can improve its welfare
under central government. The presence of credible commitment, however, does keep
j’s welfare from falling below VjD despite non-zero transition costs.
With Limited Commitment
Suspending the assumption of credible commitment changes the problem
significantly. If commitment is completely absent and all parties know this ex ante,
cooperation will be impossible as individual districts’ expected allocation will be less
under self-interested central government than under decentralization. Local government
will prevail. Under different types of limited commitment, however, central government
is possible.
The concept of limited commitment is problematic, however, as different
limitations may inherently conflict with the very concept of a commitment that is
credible. Commitment with uncertainty, where the center commits to an agreed
allocation of public goods which it can provide only with a given probability, is one such
example.61 More generally, any form of limited commitment where the object of the
commitment – in this case a level of gj – cannot be fully specified in advance should not
be regarded as a commitment in the formal sense. I focus instead on commitment that is
59 For ease of expression, I refer hereafter to g and V interchangeably as the allocation received under central or local government, although in strict terms g refers to the allocation and V to the resulting welfare. 60 Note that this may entail a lower level of gj than under decentralization, as the unit cost of g may now be lower. 61 Following the earlier example, we can give this the form (πgj + (1-π)g-j), where g-j is some level of g other than gj and π is a probability, π∈[0,1].

How Do Central and Local Governments Differ?
80
limited in time rather than in kind. For the sake of simplicity I examine commitment
limited to one period in a multi-period game. Such commitment is both credible and
specifiable, but limited in that parties may only make promises about outcomes one
period in advance. This has practical relevance to the extent that it mimics negotiation in
an uncertain political climate with shifting alliances. Other, more sophisticated forms of
limiting commitment are possible, but for the sake of brevity I do not consider them
here.
Proposition 2: The equilibrium solution to the repeated Nash game with limited
commitment is for central government to offer district j an allocation such that
Vj = VjD + 15/6 kj in period one, Vj = Vj
D – 1/3 kj in period two, Vj = VjD– ½kj in period three,
and Vj= VjD– kj in period four.
The proof is as follows, and is illustrated in figure 9a below. The game occurs
over four-period cycles where agreement is implemented in period one, and negotiations
are conducted over the following cycle in period four.62 Periods one to four thus
represent the continuing sequence of plays where a stable equilibrium may be found.
Analyze the sequence of plays in reverse, beginning with period four, for a repeated-
game equilibrium. Once central government is implemented, j will defect if Vj < Vj, as
by defecting it can achieve Vj immediately and VjD thereafter. Hence central
government will offer Vj= VjD– kj in period four. In period three, however, the center
must offer Vj > Vj, as an allocation of Vj in period three implies the same in period four
and j is better off defecting. Its decision to cooperate or defect can be characterized as
2Vj = 2VjD – kj, and the center must offer at least Vj = Vj
D– ½kj for j to cooperate. The
offers for periods two and one are derived by the same logic.63
Limiting commitment in this way thus alters the stream of allocations that district
j obtains from central government from an even pattern to one where public goods are
front-loaded in the first period and then decrease steadily through the cycle. Aggregate
welfare over the cycle is equal to that under local government, as well as that under
central government with credible commitment. But the temporal distribution changes
significantly. The experience of Bolivian municipalities under centralization, most of
which saw investment levels vary wildly from large sums down to nothing, supports this
result. Once again, district j cannot improve on its decentralized optimum despite the
center’s cost advantage and the ability to elicit accurate information on preferences, and
62 I consider this feature realistic, but the results are not sensitive to it.

How Do Central and Local Governments Differ?
81
only district c gains from centralization. But the presence of limited commitment once
again keeps j’s welfare from falling below 4VjD over the cycle. Note that Vj rises with
the cost of transition, leaving less for central government to appropriate for itself. Note
also that the solution’s parameters depend on the periodicity of the game, and that
extending or compressing its temporal structure will increase or decrease equilibrium
allocations accordingly.
Figure 9
(a) With Limited Commitment
Allocation (in welfare terms)
V j=VjD+15/6kj V j
D – 1/3kj V jD – 1/2kj V j
D – kj
0 1 2 3 4Period
(b) Without Commitment
Allocation (in welfare terms)
V jD – 1/4kj V j
D – 1/3kj V jD – 1/2kj V j
D – kj
0 1 2 3 4Period
When the Center Can Renege
In many countries the question of central government submitting itself to an
enforceable commitment, even a limited one, may be quite unrealistic. By definition, the
transition from local to central government involves not just a change in fiscal regime
but a fundamental change in the allocation of political power. Whereas before
centralization the residents of j administered their own affairs, afterwards it is the central
government that holds political power and administers resources on their behalf. They
are the government, they make decisions, they uphold rules as they see fit. In countries
where the legal and constitutional instruments for enforcing the center’s commitment are
not available to counterbalance the pure political power of the center, making an ex ante
commitment on allocation bundles which central government is bound to honor may not
be possible. Where checks and balances are weak, central government will have every
63 This is easily derived by equating 4Vj
D to the stream of centralized allocations.

How Do Central and Local Governments Differ?
82
incentive and complete liberty ex post to renege on its promise and increase its own
allocation, and will face no sanction for doing so.
Proposition 3: Where central government can renege on its commitment, district j’s
allocation over the four-period cycle will be such that ΣVj = 4VjD – 2
1/12kj. Districts will
be worse off under centralization than under decentralization.
The proof is straightforward. Once district j has joined central government in such a
setting, we can expect the allocation in period one to fall to Vj = VjD
– ¼kj, with
allocations in periods two to four remaining the same as before (see figure 9b). Under
the logic explained above, district j will have no incentive to defect from centralization
in any given period, but the center can renege on any offers of front-loaded benefits.
Hence in a context of a strong central government and weak countervailing powers
brought about by a weak legal and institutional framework, self-interested central
government will systematically under-invest in public goods in non-central districts by
an amount that depends on transition cost k.
But this outcome depends on the center essentially fooling district j, convincing
it to join central government and incur potential cost k in the absence of guarantees that
the agreed Vj will be provided. Why would localities agree to such a game? I note first
that district j will not agree to such a game if accurately characterized ex ante. That it
finds itself in such a situation is a product of the center changing the rules in mid-game,
or its own ignorance or mistake. But whatever the cause, assume path dependency
obtains and in a given period district j finds itself in the midst of an inherited, welfare-
inferior centralization scheme. The question then becomes: why does the equilibrium
persist? With the payoff structure of figure 9b, j has no incentive in a given period to
return to decentralization as its welfare will immediately fall in that period. Over several
periods, of course, a short-term loss will lead to a long-term gain, and j should defect.
But timing may be crucial. Elected officials in j – those responsible for the decision to
defect – face a short time horizon given by the electoral cycle, and may have too high a
discount rate to incur the cost of a transition which will mainly benefit future politicians.
If their electoral cycle does not coincide with that of central government, they might
prefer to wait for a general election in the hope of faring better under new leadership. Or
they may take time to settle into office and comprehend their situation – and as the
payoff to defection declines over time, they may not be ready to make such a decision
until it is no longer worthwhile. External factors may also intervene. Defection may be

How Do Central and Local Governments Differ?
83
perceived as less prestigious than remaining in central government, and might leave
elected officials open to charges of political weakness, poor negotiation skills, etc.
Lastly, the center may offer local leaders opportunities for graft, future allocations of
public goods, or other benefits if they cooperate. These possibilities are all beyond the
confines of the model, and some violate its assumption of rationality. I will not pursue
them further except to indicate that when surveying countries’ fiscal arrangements, a
number of complex factors may help explain the persistence of low centralized equilibria
when districts would be better off decentralizing.
The model shows that in a framework of legislative bargaining, where central
government can provide public services more cheaply than local government and has
access to accurate information on local preferences, districts on the periphery can never
improve upon their decentralized allocations even when credible commitment is
possible. And without commitment districts are worse off under centralization as the
center hoards the resource pool. By modeling central government as an independent
actor analytically distinct from local governments, with a privileged constituency and its
own incentives and bureaucratic interests, the model can explain the two principal results
of decentralization noted above: (1) central government invested very unequally across
space and entirely ignored one-half of Bolivia’s municipalities because it preferred to
accumulate resources in the center and a few other districts with significant political
weight; and (2) the sectoral composition of investment changed significantly because the
center has different preferences from the periphery, and can increase its own welfare by
failing to ascertain the sorts of investment that the periphery prefers.
This second point comes out of the structure of the model, and can be interpreted
as the straightforward result of differing preferences across space. If large construction
companies and oil & gas firms are based in the capital, for example, the center will
naturally prefer transport and energy projects to health and education, regardless of
where the latter are physically located. Widespread economic and need regressiveness
logically follow.64 The assertion that local government does invest according to local
need rests on the results of the previous chapter. Part II of the dissertation turns to the
how and why of that question in detail.
64 This is obviously a simplification of how central government works. A more nuanced view would begin recognizing that it is not the residents of the capital per se, but those interests able to organize and place representatives in the capital that benefit disproportionately. Chapter seven provides a more sophisticated model which incorporates this observation.
How Do Central and Local Governments Differ?
84
The model’s results hinge upon the question of credible commitment. Across
countries, the mechanisms used and the degrees of commitment achieved appear to vary
greatly. In countries without a strong and independent judiciary, where the constitution
does not protect districts, and/or where institutions are too weak to oppose the political
will of the executive, the model would predict resource accumulation in the capital, with
considerably less accruing to the periphery. Nigeria, Mexico, Egypt, Thailand, and until
recently Bolivia would seem to be a few examples. Elsewhere, however, the
mechanisms of government seem designed to produce a different outcome. In Europe for
example, regional aid and structural funds are explicitly designed to favor poorer
countries and regions, which on the whole receive more EU funds than they pay in.
Indeed, the fact that European integration is advancing slowly, within the framework of
institutions where national interests are finely balanced and an elaborate set of side
agreements and opt-outs exist, suggests that nations are aware of the danger of central
confiscation and are keen to avert it. Similar claims can be made for the distribution of
federal funds among US states and German länder, where the rights and privileges of
states and länder are enshrined in law and safeguarded by the constitution. The fact that
all three of these examples are federations of strong regions with comparatively weak
centers, and the previous examples are the opposite, suggests that a robust legal and
institutional framework can help to protect the power of the periphery against central
encroachment. The unification of Germany and attendant relocation of the capital to
Berlin could be seen in this context as a social experiment, a tug-of-war between an
entrenched framework favoring the regions and a “new” capital in ascendancy which
unites the economic, cultural and social elite of the nation. Lastly, a number of past and
present wars may be understood in this light. The North and South American wars of
independence, wars of decolonization, the US Civil War, and the recent wars of
Yugoslav disintegration, may be viewed to varying degrees as violent attempts by
regions to throw off the yoke of central governments that expropriate their resources.

How Do Central and Local Governments Differ?
85
5. Conclusions
This chapter differs from the standard literature on decentralization in two
important respects: (i) the way in which it conceptualizes the role of central government,
and (ii) its use of empirical models of investment to peer into the black box of local
government decision-making and unpack its institutional dynamic. I consider each in
turn.
The economic literature on decentralization typically treats central government
either as an enlightened social planner (Oates, 1972), or as a neutral forum in which the
representatives of different localities vote (Pande, 1999) or bargain (Besley and Coate,
1999) over policy choices. This chapter treats central government as an independent
political actor in its own right, analytically distinct from local governments, and with its
own constituency, bureaucratic interests and policy goals. Such an approach is common
in the political science and public choice literatures on bureaucratic (budgetary)
maximization (see especially Niskanen (1971) and Tullock (1965)), but has been ignored
in the literature on decentralization. By incorporating this idea into a framework in
which the center bargains with the periphery over policy outcomes, I am able to show
that districts can never be better off under central government than they are under local
government. Among the model’s conclusions, its prediction that investment flows will
vary predictably with the electoral cycle mirrors the political business cycle literature
(e.g. Alesina and Roubini (1992)), although derived from a different starting point.
This permits me to contradict another of the standard tenets of the literature,
which holds that rising inequality is one of the dangers of decentralization, as richer
districts invest in more public goods and so increase their advantage over poorer
districts. In this view, central government can ameliorate the problem through various
systems of matching and bloc grants (see Rubinfeld (1987) for a good general
exposition). But the data demonstrate exactly the opposite phenomenon in Bolivia –
central government increased already considerable disparities amongst municipalities by
concentrating investment in the richest ones and those where need was lowest, and it is
local government that has invested more equitably and worked to decrease such
disparities. My model explains this apparent anomaly by locating central government in
the richest and most developed municipality in the country and acknowledging that it has
a vested interest in perpetuating this state of affairs.

How Do Central and Local Governments Differ?
86
Another curious feature of the decentralization literature is that most of the
theoretical effort goes into modeling central government through different techniques of
preference aggregation and various decision-making mechanisms. But very little
attention is given to how local government operates, with most papers assuming some
variant of average local preference maximization. Although the model above is similar
in this respect, the empirical work is not. Through six sectoral models of local
government investment I seek to shed light on the social forces that compete for power
locally, the political dynamic to which this competition gives rise, and the characteristics
of the institutions through which these forces shape policy-making at the local level. I
seek to provide systematic and generalizable evidence of the micro-political foundations
of local government decision-making. These themes are explored in much more detail
in the chapters that follow.
What conclusions can we draw from the results? Decentralization in Bolivia was
largely a process in which the center empowered municipal governments, which it then
could not control. Given the center’s performance during the years leading up to
decentralization, it is not surprising that the reform worked best in the smaller, poorer,
more distant communities, as these are precisely those where the central state was most
weakly represented, when it existed at all. As smaller districts are the ones which
disproportionately drive the changes documented above, understanding local
government dynamics there is equivalent to understanding why decentralization works.
My results provide a good point of entry. Strong civil institutions cause municipalities to
raise investment in the social sectors, whereas strong private sector firms decrease
investment in the social sectors and increase it in urban development. Far from
contradictory, this should be taken as a sign that the local political economy is
developing along healthy lines in Bolivia’s towns, with interests groups competing to
obtain the outcomes each prefers. A local administrative regime characterized by a
strong, activist municipal council working with a relatively weak mayor is also
associated with more investment in social projects. And political disaffection and protest
decreases investment in sectors where projects are very expensive and where investment
tends to be regressive. These results paint a picture of a robust local political economy
in which accountability operates through both the electoral mechanism and interest
group lobbies. And the free interplay of these political forces in a context of strong local
institutions, especially a representative council transmitting grass-roots demands, is at
the heart of successful local government.
How Do Central and Local Governments Differ?
87
It is instructive to contrast the importance of civil institutions and the private
sector with the irrelevance of IT, training and capacity building, project planning, and
central government auditing. The technocratic approach to institution building and good
governance is often to deploy systems and procedural “software” in the place of building
the institutions and the legal-political “hardware” necessary to the functioning of a
democratic system. This tendency is at least partly due to the difficulty of the latter, and
the fact that the former fits well with many donors’ project orientation. We see here
direct evidence of the irrelevance of this approach, and of the importance of the interplay
between civil and economic forces in the local political regime. This points to a way in
which aid priorities can be reordered. Instead of spending on IT, training, and
government processes more generally, resources could be invested in measures to secure
the foundations of an open political system. This would include improving transparency
and strengthening the legal and institutional framework to the point where it can
successfully contain the societal pressures which clash therein, and is not torn apart by
them. In the absence of such elements, installing information systems and training local
officials is unlikely to succeed, and may actually hinder good governance by
empowering self-interested agents in a dysfunctional system with inadequate barriers to
rent-seeking.
Such an interpretation is intuitively appealing, and coincides with much of the
political science literature on the importance of an open, fair and competitive political
system. It describes an institutional and legal arrangement, however, which is as
available to large, rich districts as it is to those which are small and poor. In order to
push our understanding of decentralization further, we must examine the advantages that
smaller districts evidently have in its implementation. One likely advantage is
transparency. The econometric results point to the role of accountability in policy-
making, and transparency is an important component of accountability. In large districts
the mayor and councilmen are separated from voters by layers of bureaucracy and by the
sheer size and complexity of the city over which they preside. Local politicians can
counter the oversight mechanisms designed to keep watch over them with bureaucratic
allies of their own. And they can take refuge in a range of municipal activities so great
in number and variety that voters cannot reasonably hope to be informed about all of
them. Citizens will thus rationally come to expect that public funds “disappear” in a
work program which they neither understand nor expect to see the results of. In small,
rural districts, by contrast, the mayor is never far from voters. Her neighbors greet her

How Do Central and Local Governments Differ?
88
each morning as she crosses the square. They see her clothes and her manner; they
observe her level of effort. They know if she has suddenly become rich. The scale of
municipal operations is a much more human one, readily comprehensible by voters,
greatly facilitating accountability.
Similarly, and closely related, civil society is likely to be more homogeneous and
coherent in small districts than in large ones. Partly this is due to issues of scale and
complexity noted above. And partly it is a result of the manner in which people
associate in large urban areas versus small towns. In the former, social bonds often form
more strongly around occupations, leisure activities, and other geographically non-
specific criteria. Accountants know their clients and they know other accountants, and
their prosperity depends largely on both groups and not on where they live. In villages
and rural areas, by contrast, the environment plays a much larger role in people’s lives,
and the axis around which social activity revolves is accordingly geographic. Neighbors
make common cause because their fate is tied to the same factors, such as the weather or
the change in a river’s course. Where civil society is more unified and willing to work
together to achieve consensual goals, accountability will tend to improve as local
oversight becomes easier and its cost falls. This point is both subtle and complex, and I
only mention it here; it is treated it much more extensively in Part II.
All of this points to the fundamental difference between centralized and
decentralized government – incentives. Whether ex ante, via the electoral process, or ex
post, via the oversight and accountability mechanisms outlined above, decentralization
fundamentally alters the incentives facing public servants, and thus their performance.
Under centralization local investment is carried out by central agents whose interests are
firmly aligned with those of their ministerial superiors and their constituency in the
center, and not the beneficiaries of the investments for which they are responsible.
Under decentralization, by contrast, the beneficiaries of public projects themselves hold
the reigns of local power, and determine the future of those they depend on to serve their
needs. The incentives of local politicians are thus clearly aligned with those of their
voters, and the effect of this is strong enough to appear in national investment trends.
Greater transparency and the lower cost of civic action explains why this phenomenon is
stronger in smaller districts. In larger districts, issues of size, urban complexity, and the
patterns of social relations may conspire to obstruct transparency, and hinder the
accountability necessary for effective local government.
How Do Central and Local Governments Differ?
89
There are other explanations for the discrepancy between the performance of
small and large municipalities, of course. It is possible that the social structure of
smaller, poorer districts is less hierarchical than that of larger districts, and thus less open
to domination by a narrow elite. Alternatively, interests of groups on either side of
social cleavages such as wealth and race might naturally be more closely aligned in
smaller localities, due perhaps to a lower degree of social stratification or a narrower
economic base than in large urban areas. The patterns of social relations and social
organization would thus affect governance not only through oversight mechanisms, as
per above, but via the very preferences which different groups articulate. In either case,
arriving at a consensus on how to invest public funds would be easier, and the consensus
itself more robust, facilitating local government and contributing to its success. This
issue is potentially a very large one, and one that crosses the boundaries of political
economy into sociology. Unfortunately it is beyond the scope of this chapter. I raise it
here as a provocative possibility, and topic for future research.

90
Part II
The Local Governance System

91
source: US Central Intelligence Agency: Maps Released to the Public; downloaded from the University of Texas at Austin, Perry-Castañeda Library Map Collection (http://www.lib.utexas.edu/maps); author’s modifications.

Introduction to Part II
92
4
Introduction to Part II
Part II of this dissertation follows the analysis of decentralization developed in
Part I by seeking to unlock the black box of local government decision-making, first in
two districts at the extremes of municipal performance, and then in a larger and more
diverse group. In Chapter 2 I showed that decentralization changed public investment
patterns significantly in terms of both the sectoral uses of funds and their spatial
distribution, and that changes were driven by local needs. Moreover, these changes were
a product of the decisions and priorities of Bolivia’s newly-created (largely rural and
poor) local governments, and did not merely coincide with decentralization. Chapter 3
extended this work by exploring why local and central governments behave so
differently. I first examined the institutional and socio-political determinants of central
versus local government investment. I found that local decisions are largely determined
by a competitive interest group dynamic which provides poorer citizens, as well as
private sector firms and civic institutions, with political voice, and which ensures that
accountability is binding for elected officials. The data highlights the importance of the
legal-political structures of an open and transparent local political system, and
institutions strong enough to contain the political pressures that inevitably arise. Central
government, by contrast, invested where need was lowest, and concentrated resources in
a minority of Bolivia’s municipalities. This is consistent with a bargaining model of
government that locates the center in a particular district, with its own constituency,
preferences, and utility-maximizing incentives.
This second part of the dissertation builds on these insights by exploring in great
depth and detail how local government’s decision-making process works, and why it
produces the outcomes that it does. The theoretical methodology of the previous
chapters treated local government as a unitary actor that seeks to maximize median
social welfare. Although useful for exploring the incentives and informational
constraints that local governments may face, this broad-brush approach misses important
institutional and political features which, far from mere details, may determine the

Introduction to Part II
93
quality of local government that a district receives. Similarly the empirical methodology
used there, though benefiting from a powerful generality – the results it produces apply
to the universe of Bolivian municipalities – can suggest only correlations between
variables, not causality. And the measures used of such complex factors as municipal
decision-making processes, institutional capacity, the strength of social organizations
and ethnicity are necessarily imperfect approximations. If we wish to gain deeper
insight into the nature of local government decision-making and establish causality
amongst relevant factors, we must look further into the institutional and political
processes that comprise it.
Accordingly, Chapter 5 examines the processes, actors and institutions of local
governance, the economic and political interests that compete for power locally, and the
characteristics of civil society in one of the worst-run municipalities in Bolivia, Viacha.
Chapter 6 does the same for one of the best, Charagua. I focus on the extremes in order
to more easily identify the key factors that lead to good or bad government. The
approach is very detailed, often allowing key protagonists to tell the story in their own
words, in order to establish the fundamental facts and relationships that underlie
government in each district. Chapter 7 abstracts away from the particulars of actors and
institutions to offer a theoretical explanation of why each government worked as it did,
using the conceptual tools of political theory and the new institutional economics. A
contrast of the respective logics inspires an analytical model of local government which
can explain the experiences of Viacha and Charagua. This model is then made
empirically tractable, and tested and refined in Chapter 8 through the analysis of
government effectiveness in seven additional municipalities. Chapter 9 concludes.
Chapter 1 noted the essentially ahistorical nature of Bolivia’s decentralization
reform. Similar questions of interest concern the politics of redistribution.
Decentralization inevitably deprives some groups of resources and bestows them on
others. Bolivia, as we saw in Part I, was no exception. What effects did redistribution
have on Bolivia’s (tenuous) national unity and integration? Why was reform not
opposed more tenaciously by urban constituencies accustomed to the center’s largesse
who stood to lose most from it? Why did interest groups not distort it, seeking to control
or curtail municipalities’ actions? Such issues, and the basic question of how central
government managed to pass and implement the LPP with few modifications, are both
interesting and important, but ultimately tangential to my research agenda. The
unchallenged fact is that by mid-1994 the center had deprived itself of resources in favor

Introduction to Part II
94
of the periphery, where municipal authorities were largely free to pursue local
priorities.65 The local decisions that ensued can accordingly be analyzed as local
phenomena, the product of local conditions, substantively independent of the politics of
the center.66
The data used in Part II, and the empirical methods employed to obtain them, are
quite different from those of Part I. I rely here on qualitative information gathered
during six months of field work in Bolivia, in nine municipalities selected to control for
size, region, economic base, rural vs. urban setting, and cultural and ethnic
characteristics. In each of these I conducted extensive semi-structured and unstructured
interviews of local government and community leaders, key informants, and citizens at
the grass-roots level. I spoke to over 300 people in more than 200 interviews, following
a systematic program in which I put standard questionnaires to
• the mayor • other government leaders • government and opposition local councilmen • president of the oversight committee • heads of several grass-roots organizations • principal local health authorities • principal local education authorities • heads of major businesses and economic interests • union leaders • parish priest or other religious leader(s) • commander of the local military garrison • important local NGOs • chief municipal technical officer • chief municipal financial officer • leaders of grass-roots organizations • members of grass-roots organizations
To this standard list were added informants of particular local import in each
municipality. Interviews were carried out in the main city/town and throughout the rural
catchment area in each district. I also collected each district’s Annual Operating Plan
(OAP) – its investment budget – and a detailed map of the communities that comprise it.
In each district I was careful to visit a significant number of rural communities. The
research was conducted in two rounds, March-May and September-November, 1997, on
either side of a general (but not municipal) election. During the intervening period I
analyzed initial results and designed the second round of interviews and questionnaires
65 The extent to which municipalities were free of external constraints was discussed in Chapter 3. 66 Instances to the contrary – in Viacha and Baures – are exceptions, and duly noted.

Introduction to Part II
95
to pursue promising lines of inquiry and test early theories. The length of the above list
notwithstanding, the majority of the interviews by number (and duration) were with
members and spokesmen of grass-roots organizations.
Before attempting to analyze real municipalities in Bolivia, it is useful to quickly
review the political science literature on local government. The intellectual case for
decentralization originates in the most basic rationale for democratic government and the
effective representation of citizens' interests. Political philosophers such as Rousseau
(1978), Mill (1993), de Tocqueville (1969), Montesquieu (1989), and Madison,
Hamilton and Jay (1961) distrusted autocratic central government and held that small,
democratic units could, like ancient Athens, preserve the liberties of free men. In several
of the Federalist Papers, Madison theorized about the prevention of tyranny via a balance
of powers not only among the branches of central government, but between central and
regional and local governments as well.
The modern argument is well represented in Musgrave’s (1959) familiar
tripartite division of the functions of the public sector. Macroeconomic Stabilization, or
the exercise of countercyclical policy, and Income Redistribution and Equality in the
name of social justice are both primary responsibilities of central government; it has both
policy tools and the scale appropriate to such functions, which local government largely
lacks. The Provision of Public Goods and Services, on the other hand, provides the
primary argument for the existence of local government. Many public services are of
mainly local concern (e.g. fire protection, law enforcement, trash collection), but, as de
Tocqueville noted, centralization tends to result in a uniformity of policy outputs which
often ignores the diversity of local tastes and conditions. Placing control of such
services in local hands can provide scope for setting levels and qualities of outputs
according to the circumstances of individual jurisdictions.
Wolman (1990) develops the theme further, arguing that decentralization can
enhance efficiency, and hence social welfare. When tastes vary within the population,
the divergence between individual preferences for public goods and those government
supplies can be decreased when provision is by local governments operating in relatively
homogeneous districts. This operates
by placing government closer to the people, foster[ing] greater responsiveness of policy-makers to the will of the citizenry and, it is argued, result[ing] in a closer congruence between public preferences and public policy. This is not only because decision-makers in decentralized units are likely to be more knowledgeable about and attuned to the needs of their area than are centralized national-government decision-
Introduction to Part II
96
makers, but also because decentralization permits these decision-makers to be held directly accountable to the local citizenry through local elections.67
This comprises the core of the political case for local government.68 But how
precisely can we account for the superior responsiveness of local government to local
tastes and conditions? Beyond unspecified notions of proximity – to which a surprising
number of authors appeal – this generally accepted idea is ultimately founded on the
principle of accountability through the electoral system. But when we examine its
micro-political foundations carefully, it is not clear how – or indeed if – it can function.
As Verba, et. al. (1993) point out, elections are a poor mechanism for accountability
because “the vote differs from many kinds of activity in being a rather blunt instrument
for the communication of information about the needs and preferences of citizens.”69
Voting suffers from the well-known dimensionality problem,70 which makes it
unsuitable for relaying complex information about citizen preferences to political leaders
(this point is developed further in Chapter 7). The majority of political science’s claims
about the superior responsiveness of local government are thus only moderately more
sophisticated than those of Tiebout, Oates and Chapters 2 and 3 above, which in essence
assume such responsiveness but provide no convincing social mechanism to justify it.
On the other hand, the results from Bolivia show that local government was indeed much
more responsive to local conditions than central government had been. How did this
come about? By what means did local society enforce its will on local government?
Answering these questions is the subject of the rest of this dissertation. But before
turning to it, we must first consider a seminal work which attacks the problem directly,
and then develop some necessary conceptual tools.
Undoubtedly the most important recent contribution to the field is Robert
Putnam’s Making Democracy Work: Civic Traditions in Modern Italy, which poses the
question “What are the conditions for creating strong, responsive, effective
representative institutions?”71 His setting is Italy after the creation of fifteen new
regional governments in 1970. Despite essentially identical institutional structures and
mandates, Putnam shows that institutional performance and policy outputs vary strongly
67 Wolman (1990), p.32. 68 Additional political arguments in favor of decentralization are largely systemic, concerned with such issues as the value of participation, national diversity, or subnational governments as an arena of policy experimentation, all of which are beyond the scope of this study. 69 p.304. 70 The vote is a unidimensional political instrument, and therefore cannot provide signals about voters’ multi-dimensional preferences unless circumstances are highly, and conveniently, constrained. 71 p.6.

Introduction to Part II
97
and systematically between northern and southern regions. He sets out to explain why
governments in the North are so much more efficient, effective and responsive than their
counterparts in the South. Quickly he establishes that this is not simply an issue of
resources, as large transfers have flowed for decades from North to South in a bid to help
the South catch up. Putnam carefully considers and discards a number of competing
explanations, settling on the concept of social capital as the principal explanatory
variable. His central idea concerns the differences between horizontal and vertical social
linkages, the ability of each to foster trust and cooperation in society, and through these
affect the performance of public institutions and ultimately a society’s wealth and
standard of living. This historical approach reaches back through the mists of time to the
year 1100, locating the causes of contemporary patterns of social relations in the
autocratic regimes of southern Italy, and the free city-states of the North. He
summarizes his argument as follows:
In all societies… dilemmas of collective action hamper attempts to cooperate for mutual benefit, whether in politics or economics. Third party enforcement is an inadequate solution to the problem. Voluntary cooperation (like rotating credit associations) depends on social capital. Norms of generalized reciprocity and networks of civic engagement encourage social trust and cooperation because they reduce incentives to defect, reduce uncertainty, and provide models for future cooperation. Trust itself is an emergent property of the social system, as much as a personal attribute. Individuals are able to be trusting (and not merely gullible) because of the social norms and networks within which their actions are embedded.72
Like conventional physical capital, social capital is cumulative and positively
associated with outputs; unlike physical capital it tends to be self-reinforcing,
strengthening with use and deteriorating with disuse. Putnam argues that the differing
efficacies of governments in North and South respond to two distinct social equilibria:
high and low social capital. Society can be held together by reciprocity, trust and
cooperation, or force, dependence and exploitation. Once in either situation, rational
individuals have strong incentives to act consistently with its rules. Equilibria thus
persist for centuries. But they occur at very different levels of efficiency and
institutional performance. This, ultimately, is why the Italian North is so much wealthier
and better governed than the South. “History determines which of these two stable
outcomes characterizes any given society.”73
The chapters that follow lead me to agree with the first half of Putnam’s thesis:
the civic characteristics and cooperative potential of society are fundamental to
72 p.177. 73 p.179.

Introduction to Part II
98
government performance. But the second half, that these characteristics are exogenously
determined over long historical intervals, is contradicted by the Bolivian experience.
The case of Charagua shows most clearly that social capital can evolve over relatively
short periods with powerful consequences for the quality of governance a district can
achieve. A millenium is not required; less than a generation can suffice. I then build on
Putnam’s work by providing an explicit model of local government that includes civic
groups directly in the policy-making process, providing structure to the notion that social
capital affects policy. My approach is consistent with Tarrow’s (1996) critique, that
Putnam looked into history with a model in mind that conceived of civic capacity as
given and state structures as endogenous, when in fact patterns of state-building and state
strategy shape civic capacity in important ways.
The New Institutional Economics
We turn for helpful theoretical tools to the new institutional economics, which
according to Clague (1997a)
represents a kind of “expanded economics”. Like standard economics, it focuses on the choices people make in their lives. But it enriches the simple rational choice model by allowing for the pervasiveness of information problems and human limitations on processing information, the evolution of norms, and the willingness of people to form bonds of trust. The NIE seeks to explain not only individuals’ choices with a given set of institutions but, more important, the way that individuals’ beliefs and choices affect the evolution of the institutions themselves.74
I follow Clague (1997a) and Olson and Kahkonen (2000) in construing the NIE broadly
to include the economics of transaction costs, institutional innovation and efficiency,
property rights, collective action, and the evolution of cooperation and norms.75 Note
that some of the foremost exponents of some of these subjects might well disagree with
so broad a definition (see North (1990) and Williamson (1995a)). My purpose here is
not to give a comprehensive account of the NIE, but rather to highlight useful concepts
in a framework which can be employed to analyze local government.
According to Williamson (1995a), the NIE insists on realistic, commonly
verifiable instead of analytically convenient, behavioral assumptions: (i) opportunism,
and (ii) bounded rationality. Opportunism does not assume that all people are always
dishonest, but rather that “some individuals are opportunistic some of the time and that it
74 p.16. 75 See Clague (1997), pp.17-23 for a discussion of these components. Good alternative definitions include Bardhan (2000), Moe (1995), Williamson (1995a), and Williamson (2000).
Introduction to Part II
99
is costly to ascertain differential trustworthiness ex ante.”76 Opportunism thus prompts
agents to seek credible commitments before executing transactions. The concept of
bounded rationality was proposed by Simon (1957) as behavior that is “intendedly
rational, but only limitedly so”.77 It arises because people are limited in the information
they possess and in the computational skills they bring to bear in making choices. “The
capacity of the human mind for formulating and solving complex problems is very small
compared with the size of the problems whose solution is required for objectively
rational behavior in the real world.”78 Bounded rationality makes the mind itself a
scarce resource.
Closely related to bounded rationality is what North (1990) calls imperfect
subjective mental models. This relates to the implicit behavioral assumption of the
rational choice and neoclassical economics schools that
actors possess cognitive systems that provide true models of the worlds about which they make choices or, at the very least, that the actors receive information that leads to convergence of divergent initial models. This is patently wrong for most of the interesting problems with which we are concerned. Individuals make choices based on subjectively derived models that diverge among individuals and the information the actors receive is so incomplete that in most cases these divergent subjective models show no tendency to converge.79
Imperfect mental models interact with and reinforce the bounded nature of human
rationality to create significant obstacles to efficiency in transactions.
Bounded rationality and imperfect mental models, combined with uncertainty,
imply that “all complex contracts are unavoidably incomplete”.80 Modern complex
contracts are both multidimensional and extend over time. Agents’ limited mental
abilities imply that parties to a contract will be unable to specify all possible future
contingencies. Parties will thus deliberately leave possible unknowns unspecified,
rendering contracts incomplete. Instead they delegate the resolution of disputes which
may arise to some third party, which accounts for the rise of certain institutions, to which
we turn presently.
A fifth idea central to the NIE is costly transactions, pioneered among others by
Coase (1937). North expands on this theme:
The costliness of information is the key to the costs of transacting, which consists of the costs of measuring the valuable attributes of what is being exchanged and the costs
76 p.190. 77 Simon (1957) in Williamson (1995a), p.178. 78 ibid., p.179. 79 p.17. 80 Williamson (1995a), p.179, original emphasis.

Introduction to Part II
100
of protecting rights and policing and enforcing agreements. […] Commodities, services, and the performance of agents have numerous attributes and their levels vary from one specimen or agent to another.81
Ascertaining the level of these attributes, protecting rights, and policing and enforcing
agreements makes transactions costly.
With these tools in hand, we can now turn to the structural characteristics of
society. Consider first organizations and institutions. North defines organizations as
“purposive entities designed by their creators to maximize… [some] objective defined
by the opportunities afforded by the institutional structure of society.”82 They are groups
of individuals united by a common purpose and shared objectives. Firms are specific
cases of organizations, as are political parties, churches, clubs, and the houses of a
congress. And so like firms, their justification – and many of their structural
characteristics – lie in the limits of human decision-making. Institutions, on the other
hand, “are the humanly devised constraints that shape human interaction.”83 They
compensate for human limitations in computing information by limiting actors’ choice
sets, thus providing structure for political, social and economic interaction. In doing so
they reduce uncertainty in everyday life. The distinction between institutions and
organizations is crucial, and analogous to that between rules and players in sport.
Institutions are the written and unwritten rules of the game, while organizations are the
teams who employ skills, strategy and coordination to win. “Institutions, together with
the standard constraints of economic theory, determine the opportunities in a society.
Organizations are created to take advantage of those opportunities, and, as the
organizations evolve, they alter the institutions.”84
The importance of institutions goes deep to the heart of socio-economic activity.
Without institutional constraints, for example, complex exchange would likely cease
because of uncertainty about whether self-interested parties would abide by their
agreements. As Olson (2000a) points out, the failure of institutions can thus explain the
historical persistence of underdevelopment in most of the world, locking societies into
patterns of comparatively low-value, self-enforcing economic activity. Institutions are
also central to property rights. “Property rights are the rights individuals appropriate
over their own labor and the goods and services they possess. Appropriation is a
function of legal rules, organizational forms, enforcement, and norms of behavior – that
81 North (1990), p.27-29. 82 ibid., p.73. 83 ibid., p.3.

Introduction to Part II
101
is, the institutional framework.”85 Without the existence of such institutions, property
rights would not exist.
The NIE conceives of organizational – and hence institutional – change as
occurring through a quasi-evolutionary mechanism in which the environment selects
fitter, but not necessarily the fittest, forms. The mechanism is transaction-cost
economizing, as bounded rationality and imperfect mental models strictly prevent
organizations from optimizing. Williamson (1995a) calls this weak-form selection.
Alchian (1950, in Moe, (1984)) provides a stronger account of the idea, in which
uncertainty negates the possibility of rationality and hence of profit maximization.
Under these conditions, firms survive because they make a positive profit, regardless of
how far from optimality they are. The economic environment de-selects loss-making
firms, and over time innovation generates new forms for selection. But innovation will
tend to serve groups with strong bargaining power at a given juncture, and not any social
consensus on efficient forms. As environmental selection can only choose from amongst
those organizational forms that are tried, surviving organizations are unlikely to be
efficient, and the resulting population is unlikely to be optimal.
The last concept central to the NIE is what Williamson (2000) calls
remediableness. This corresponds to his concern with “making a place for and being
respectful of politics.”86 Remediableness pertains to the probability of changing an
institution or policy given real constraints. Hence a policy that is inefficient when
compared to a theoretical construct can be efficient in practice because economic or
political conditions render it unremediable. Williamson suggests a two-stage test of
remediableness. The first, economic question is: Can a superior form of organization
that is feasible be described? The second, political question is: Does the proposed
alternative have the necessary political support to be implemented? Employing this test
will help to avoid lapses into ideal but operationally irrelevant reasoning patterns and
policy advice. The principle of remediableness is very important and has significant
implications for understanding economic development and reform. As Williamson
points out, “many practices that are regarded as reprehensible when viewed through the
84 ibid., p.7. 85 ibid., p.33. 86 p.105. See also Williamson (1995b).

Introduction to Part II
102
lens of price theory/applied welfare economics actually serve efficiency purposes and/or
are not remediable when examined through the lens of transaction cost economics.”87
These, then, are the concepts that Part II of this dissertation will employ to
analyze local government in nine Bolivian municipalities. Although the ideas remain
latent in the next two chapters, we do well to keep them in mind as they comprise the
intellectual tools with which the extremes of municipal performance are analyzed. The
framework becomes explicit in Chapter 7, which describes an analytical model of local
government that abstracts from previous evidence in terms of the ideas discussed above.
The conceptualization of local government with which I approach the following two
chapters, though very general, arises in part from the results of Chapter 3. It holds that
local government occurs in an institutional context defined by (a) the legal framework of
local government, and (b) norms and codes of behavior that govern political activity,
which in turn give rise directly and indirectly to (c) governmental and political
organizations (e.g. municipal council, local parties) which actually produce policy.
Social and economic interests compete for influence over governmental and political
organizations. The legal-institutional framework of local government may be strong
enough to contain the pressures that these interests create or it may not be, in which case
policy can become deformed, creating tensions in local society.
Before commencing the analysis, it is useful to review quickly the institutional
framework of local government in Bolivia. The Law of Popular Participation (LPP)
stipulates that municipal councilmen be elected from party lists in single-constituency
elections. The council then elects the mayor indirectly from amongst those of them who
garnered the most votes. Bolivia’s European-style, fragmented political culture, grafted
onto an American-style presidential system, ensures that most municipal (and national)
governments are coalitions. Hereafter, this chapter uses “mayor” to refer to the mayor
and executive branch of local government, including all appointed administrative and
technical officials – by far the largest and most important of the three. The third
institution of local government is the oversight committee (OC), which is composed of
the representatives of grass-root organizations within each municipality. A municipality
will typically be divided into four or more regions, each of which nominates one
member to the OC from amongst its local grass-roots leaders. OC members elect from
amongst themselves a president, whose legal status is comparable to the mayor’s. The
87 p.118.

Introduction to Part II
103
OC’s power lies in its natural moral authority, as well as the ability to suspend
disbursements from central to local government if it judges that funds are being misused.
Oversight committees thus comprise a parallel, corporatist form of social representation
similar to an upper house of parliament, enforcing accountability on the mayor and
municipal council.88
Lastly, two purely stylistic notes. Throughout the second part of the dissertation
I adhere to the NIE definitions of the terms “organization” and “institution” as given
above, with the exception of references to (local) government institutions, where I revert
to the everyday usage of an establishment devoted to the public cause such as the
mayoralty, municipal council, and oversight committee. This is mainly to distinguish
them from civic and other organizations, which arise spontaneously from society and are
not formally part of the government structure. Secondly, when referring to village-level
testimony I will often use the construction “Village X said” to mean “the leaders of
Village X said” in order to avoid repetition.
88 I am indebted to Dr. Teddy Brett for this apt analogy.

Viacha
104
5 Local Government at the Extremes
Viacha
1. Introduction
Wilting under the afternoon sun, Viacha squats on the altiplano like a dusty
cholita at market, tired after a long day selling pantyhose and cigarettes smuggled across
the border. Approaching along the old southern road from La Paz, you notice the outer
edges of El Alto lapping like wavelets at Viacha, the two cities bridged by a progression
of nameless eateries and roadside mechanics that never quite peter out. One may be
forgiven for considering Viacha a medium-sized urban offshoot of the La Paz-El Alto
conurbation. Urban viacheños would take exception. They clearly think of their home
as a city, and their surrounding countryside – when they think of it at all – as a catchment
area of little importance. But to believe this is a mistake, as Viacha is in fact a large rural
municipality with a medium-sized city in one corner. Of the seven districts that
comprise it, four are rural. Of its 54,761 inhabitants, two-thirds are dispersed amongst
300 rural communities that reach all the way to the border with Peru, with the remaining
third living in the city.89
By Bolivian standards Viacha is a wealthy industrial town. It is home to the
main cement plant of the Sociedad Boliviana de Cementos (SOBOCE), Bolivia’s largest
cement company, as well as a large bottling plant belonging to the Cervecería Boliviana
Nacional (CBN), Bolivia’s largest brewery. Both companies contribute directly and
significantly to Viacha’s municipal coffers through property tax, business licenses,
electricity bills, and – in the case of the CBN – generous in-kind lending of trucks and
other heavy machinery, and large donations of beer, all placed at the mayor’s disposal.
Strung along the main road out of Viacha are numerous medium-sized and small textile,
brick and tile, and other construction-related businesses, all of which contribute to local
incomes and tax receipts. Municipal income includes receipts from property and vehicle
taxes, licenses and place-rents for businesses and street commerce, planning and zoning

Viacha
105
approval fees, and a number of other items – more than most other cities in Bolivia. But
the city is curiously free of the signs of wealth, and hence of inequality, with
neighborhoods ranging in appearance from poor peri-urban to middle class, but no
higher. This is probably because the most successful Viachans take up residence in La
Paz, underlining the city’s status as a dormitory town. Viacha’s index of Unsatisfied
Basic Needs90 (0.852 on a scale where 0 is best and 1 worst) places it in the best-off 25%
of Bolivian municipalities; its proximity to the cities of La Paz and El Alto ensures a
higher level of economic activity than in other cities of comparable size.
Yet by the middle of 1997 Viacha was a troubled town. After three consecutive
electoral victories, the populist Unión Cívica de Solidaridad (UCS) party had lost its
sheen in a hail of corruption accusations, and was increasingly seen as ineffective. Two
million bolivianos of investment funds went unspent from the 1996 budget despite the
mayor’s pleas that he lacked the resources to satisfy communities’ project requests. A
rival oversight committee (OC2) was established demanding the mayor’s resignation and
disbandment of the official oversight committee (OC1 – sanctioned by the municipal
government). With two competing OCs (and two sets of neighborhood councils), the
participative planning process broke down as the city became polarized between groups
supporting the mayor and those demanding his resignation. In the midst of this
poisonous political and social climate, thieves broke into the municipal garage, killed the
elderly guard and stole two vehicles. This gave rise to numerous accusations and
counter-accusations. “There are cars parked on the street all over La Paz and El Alto,”
the president of OC1 said, explaining that one of the stolen vehicles had been located in
El Alto. “If you want to steal a car, why would you come to Viacha and steal it from a
guarded garage?”91 In his opinion, the crime was the work of the opposition seeking to
sully the mayor’s reputation. Others saw the hand of the mayor himself, ordering a
robbery to blame on the opposition in order to reap a vote of sympathy in the upcoming
elections. In interviews in March of that year, however, municipal councilmen seemed
not to appreciate the severity of their problems, telling me “not everything is going
89 Instituto Nacional de Estadística. 1992. Censo Nacional de Población y Vivenda. La Paz: INE. Viacha is the fourteenth most populous municipality in Bolivia 90 This is a Bolivian government index calculated from a variety of demographic and poverty indicators from the 1992 census. 91 Remigio Quispe Mendoza, Walter Patzi Paty and Nemesio Mamani Fernández, oversight committee (1) president, federation of neighborhood councils (1) president and federation officer respectively, interview, Viacha, 18 March 1997.

Viacha
106
badly, nor is all well – we have our imperfections,”92 and then blaming the crisis on the
opposition’s “exaggerations”.
The eruptions of Viachan politics occur within a broader tide of urban migration
which flows around and through the city, giving Viacha its character. Perched on the
edge of the La Paz-El Alto metropolis, Viacha is the first stop for many peasants fleeing
the hardships of subsistence agriculture on the altiplano. Some move directly on to El
Alto, but others stay and complete the transition to urban life in Viacha. They fill the
streets with their Aymara dress, speech and rural customs, and are the objects of ridicule
by city-folk who wear shoes and use electricity to cook.93 Supporting themselves at first
through menial labor or selling in the markets, and then through better-paid jobs in La
Paz-El Alto to which they make the daily hour-long commute, they build the adobe
neighborhoods of the city further and further outwards. They take little pride in the
history of a city which has traditionally defined itself in opposition to the countryside;
they stay, having found jobs in the metropolis, because the living is cheap.94 The battle
against prejudice to improve their livelihoods gives many Viachans a disconcerting
blend of aggressive opportunism and rural tastes. “Viacheños are the New Yorkers of
the region – they have vices that others don’t. There’s too much alcohol about and
everyone shows off their money drinking,”95 according to Carlos Núñez, financial
director of SOBOCE. The city’s northward expansion along the road to La Paz is in
effect fusing it with El Alto96, leading to numerous problems of delimitation, land
registration and taxation, which the two municipalities struggle to resolve.
92 Huber Quintela and Esteban Ticona, municipal councilmen (MNR & Condepa respectively), interview, Viacha, 18 March 1997. 93 Dr Reynaldo Aguilar, district director of health, interview, Viacha, 10 October 1997. 94 Luis González, departmental director, Social Investment Fund, interview, Viacha, 17 March 1997. 95 Interview, Viacha, 19 March 1997. 96 El Alto, itself a former suburb of La Paz, is largely the result of rural-urban migration on a much larger scale.

Viacha
107
Figure 1VIACHA Electoral Social Indicators
Governing Coalition** % of Population Speaks:General Spanish 14%Total Pop. 54,761 % Vote 1995 48.4% Native Tongue 19%Urban Pop. 19,036 Main Opposition Condepa Spanish & Native 65%Urban Share 35% % Vote 1995 24.5% Literacy Rate 77%Rural Communities 300 Electoral Absenteeism 39.4% No Ed. Attainment 20%Indigenous Comms. 0 % Blank Votes 3.1% # Schools (Bldgs) 163Unsatisfied Basic Needs 0.852 % Null Votes 4.4% Total Students 18,860Urban UBN 0.598 Students/Teacher 16.4Rural UBN 0.974 Municipal Employees 43%
1997 150Oversight Committee 1993 70 # Health Facilities 18Total Members* 7 Increase 114% Malnutrition Rates:Village Members 5 per 1000 pop 2.7 Low 19%President is from? Urban Top Salary+ Bs 1,560 Moderate 6%
Qualifs. Req'd? Yes (?) Severe 1%sources: 1992 census, 1997 municipal census, National Electoral Court, National Institute of Statistics, author's interviews* Refers to the officially recognized oversight committee (OC1)** In order of importance, 1995-99; the MNR continued to cooperate with the UCS after the 1995 elections, although its support was no longer necessary+ Highest-paid non-elected official
UCS-MNR
Uses Formal Health Care System
Cen
tral
Loca
l
Edu
catio
n
Urb
an D
ev
Wat
er &
San
Tra
nspo
rt
Agr
icul
ture
Hea
lth
Oth
er
0
20
40
60
80
100
Share of Budget
Sector
Figure 2: Public Investment in Viacha

Viacha
108
2. Local Government Institutions
2.1 The Mayor and the Local Executive Branch
The mayor of Viacha in early 1997 was Edwin Callisaya, from the Aymara
community of Tilata-Santa Trinidad in rural Viacha. Before entering politics Callisaya
had taken courses in business administration at university, and then gone to work as a
public sector employee in La Paz. He was first elected to local government as a
councilman for the UCS in 1993, and became mayor shortly thereafter when the re-
elected mayor resigned to become a substitute MP for the UCS. He governed in
coalition with the MNR through the 1995 election, which the UCS won easily with a
large electoral surge attributed by many observers to the death of its leader, Max
Fernandez, in a tragic airplane crash.97 From 1995-99 the UCS governed Viacha
alone.98
As a son of the poor countryside, Callisaya set out to ensure that resources
reached rural villages. “He argues that the rural areas never received anything, and so he
must invest there,” said Oscar Magnani Meyta, the District Director of Education in
Viacha.99 Callisaya visited rural communities more often than the previous mayor and
met with their inhabitants, the concerns and desires of whom he was well-placed to
understand. He invited rural leaders to Viacha and hosted them at municipal events,
including a prominent one where the yearly investment plan was agreed and co-signed
by 56 local community leaders.100
Callisaya also expressed the desire to make Viacha a “model municipality”, with
a modern, rational administration that was transparent and a beacon to Viacha’s less
fortunate neighbors.101 To this end he sought to use resources from the World Bank, the
Social Investment Fund (FIS), and others – who he claimed recognized Viacha’s natural
importance – to increase both the size and quality of the municipal workforce. The
municipal payroll rose accordingly from 70 to 150 during his mayoralty, and in the
second year of his term he called a public competition to fill the posts of Chief Financial
97 Councilman Esteban Ticona and Lt.Col. Adolfo Dávila Chacón, commander of the local military garrison, are two of the many people who recounted this commonly held view to me. In Dávila’s words, “The death of Max Fernández was a big boon to the UCS. Condepa was stronger than the UCS in Viacha, but Max’s death brought out the sympathy vote and the UCS won easily.” (Interview, 19 March 1997) 98 The structural reforms of 1993-94 extended the local electoral cycle from two to four years. 99 Interview, Viacha, 21 March 1997. 100 Alejandro Yujra, Rony Morales and Hipólito Tovar, vice-president of the Federation of Neighborhood Councils (Juntas) of Viacha (2), secretary of the neighborhood council of San José, and member and spokesman for OC2, interview, Viacha, 19 March 1997. 101 Interview, Viacha, 18 March 1997.
Viacha
109
and Technical Officers. Seventy applicants with professional qualifications applied for
the two positions, marking the first important step in the technification of Viachan
government. Despite this, Viacha’s government still seemed lost on fairly basic issues.
The newly-hired Chief Financial Officer admitted to me that “SOBOCE and the CBN
are our great problems – we don’t know what taxes we are allowed to charge them, nor
for what amount. And it’s worse if they obtain legal advice. We don’t know which way
north is.”102
From the outside, Callisaya’s administration was seen as somewhat successful in
some quarters. In an interview after the 1997 elections, the District Director of
Education (DDE) reported that the municipality complied with minimum legal
requirements by providing funds for maintenance (e.g. desks, paper, classroom supplies)
as well as investment (e.g. building classrooms, fixing buildings, equipping schools).103
But even this praise was balanced by complaints that the municipal government refused
to coordinate with the DDE, planning, designing and building educational infrastructure
with no DDE input. Because the municipality has more resources than the DDE,
communities solicit projects directly from them. The DDE is thus excluded at every
stage of the project cycle, and as a result “municipal projects do not abide by the
standards of the education sector,” including especially those set out by the Education
Reform Program that Bolivia is currently undertaking.104, 105 This problem is
compounded by the municipality’s “constructionist” mentality, which prefers building
infrastructure to running programs and providing services. “The municipality thinks the
money should be used for urban development projects anyway,” said the DDE,
complaining that what educational investment it does carry out is almost entirely
restricted to building and refurbishing simple schoolhouses dotted across the
countryside. “And were it not for the PASE (a central government matching-grants
schemes for school refurbishment) they would not do even that.”106
Even this investment is unequally allocated across Viacha, with a small
community like Titik’ana Takaka receiving three classrooms in addition to its existing
three while many others receive nothing. The DDE estimated that some 40% of Viachan
102 Jorge Rada, chief financial officer, interview, Viacha, 15 October 1997. 103 María Luisa Lucuy (who had recently assumed the position of DDE), interview, Viacha, 15 October 1997. 104 Magnani, op.cit. 105 For example, the Education Reform Program calls for hexagonal primary school classrooms, but all of those built in Viacha in the previous few years were traditional “square boxes”. 106 Magnani, op.cit.

Viacha
110
villages are forgotten by the municipal government. He attributed this to an ad-hoc
planning system which depends fundamentally on pressure politics and makes no effort
to objectively assess local needs, or equitably allocate investment resources. Thus, in his
words, “the communities which demand the most get the most,” implying a bias in favor
of villages that lie closer to the city, or those with the resources to fund travel and
lodging for grass-roots leaders who lobby the mayor’s office on the community’s behalf.
The mayor effectively agreed with this analysis, admitting that communities whose
leaders were most “political” were most successful at getting their projects approved and
obtaining municipal funds.107 And the Chief Financial Officer conceded that he did not
know how many projects the municipality had financed, nor how the Annual Operating
Plan (AOP) had been drawn up, though he understood that the criteria used were not
technical.108
That the municipality ran such a “system” instead of making a serious attempt at
investment programming was at least partly due to the poor quality of municipal
personnel, “who are mostly UCS hacks instead of professionals.”109 “The cultural level
of the local authorities isn’t optimal,” agrees Mr Núñez of SOBOCE. “The first things
the municipal government bought when Popular Participation funds arrived were cars,
TVs, and so on,” he added with disdain.110 Even some municipal councilmen agreed
with this view, arguing that the increase in the municipal payroll was “all numbers and
no quality, or even with decreasing quality”.111 The head of Incerpaz, the largest of
Viacha’s brick and tile firms, extended this judgment to the municipal council itself,
asserting that “the main problem this municipality faces is a lack of qualifications and
ability on the part of the municipal council and administration,“ and noting that qualified
people tend to migrate to La Paz. “This municipality isn’t sufficiently technical to
devise a master plan of development for the
municipality – something that the private sector in Viacha has directly requested.”112
On the other side of Viacha, the DDE’s colleague Dr Reynaldo Aguilar, District
Director of Health (DDH), agreed with his diagnosis, while reporting a situation that was
significantly worse. “The municipal government refuses to pay its share of the Maternal
107 Callisaya, op.cit. 108 Rada, op.cit. 109 Lucuy, op.cit. 110 Núñez, op.cit. 111 Quintela and Ticona, op.cit. 112 Luis Paz, CEO Incerpaz, interview, Viacha, 15 October 1997.

Viacha
111
& Infant Health Insurance, as the law demands”113 he said, explaining that the
municipality seized on incomplete documentation to declare the DDH’s payment
requests invalid and refuse disbursement. “In health the municipality is hypocritical, “
he sighed. “They talk a lot but invest nothing.” Like the DDE, Dr Aguilar was never
invited to review Viacha’s Annual Operating Plan despite requests for coordination. He
detailed how the DDH lost the only hospital in the city and all of the equipment that they
and others had bought for it, due to a mixture of incompetence, bad luck and sheer lack
of interest on the part of the municipality. “The mayor is terribly bad,” he concluded, a
sentiment shared by Sub-Prefect Gladys Lozano, the local representative of the
departmental government.114 It is notable that the mayor managed to alienate the
representatives of the ministries of Education and Health and the Prefect, arguably the
three most important agents of central government in the city, during a relatively short
period of time.115 In the case of Lozano the distrust became active and angry opposition.
Among Viacha’s private firms, the most important politically is the CBN bottling
plant. The man who formed the CBN was an unschooled laborer, Max Fernández,
whose fabled ascent began at the wheel of a delivery truck and ended with him buying
several breweries and dominating the industry. Turning his populist and paternalistic
attentions to politics, he founded the UCS party and integrated it tightly into his beer
empire, distributing pamphlets out of CBN delivery trucks and selling beer at political
rallies. Thus, to interview a spokesman for the CBN is to speak to the largest employer
in the region; but it is also to see the other face of the Fernández family enterprise. The
opinion of the mayor offered by José Luis Claros, production supervisor at the CBN
bottling plant, is accordingly benign: “Our relations with the HAM are obviously good
because we’re from the same party,” he said, explaining how the CBN provides the
municipality with “trucks, machinery, beer – everything. And all free of charge. We
give them beer in small quantities, say twenty cases at a time, for their meetings, events,
celebrations. We support them too much,” and his smile implied a professional
impatience with this open drain on his accounts.116 “All the same, the municipality
doesn’t prioritize us with any of its expenditures – it only takes.”
113 Aguilar, op.cit. 114 Gladys Lozano, sub-prefect for Ingavi province (MNR), interview, Viacha, 17 March 1997. 115 Bolivian prefects are appointed directly by the president. Sub-prefects are thus broadly viewed as representatives of the central government. 116 Interview, Viacha, 21 March 1997.

Viacha
112
At SOBOCE, Claros’ counterpart, Núñez, was less generous in his assessment,
arguing that the municipality is largely dedicated to a symbolic equality, wasting its
resources on cosmetic and essentially pointless investments like “government houses”
and plazas in rural areas that make locals feel they are not ignored, but do little to
improve the quality of life in these villages – a point which the local priest echoes.117
“There’s no civil leader here who gives guidance on good, significant projects” that
respond to local needs, he said.118 Luis González of the FIS agreed, adding, “Many
viacheños want to rid themselves of Callisaya…but he’s proven good at managing
relations with the brewery, and manipulating [public opinion] through the parties and
local festivals they sponsor.”119
In addition to a showman the mayor was a shrewd tactician as well, conspiring to
neutralize the opposition and short-circuit municipal accountability mechanisms. “The
original oversight committee used to cut his financing and give him all sorts of trouble,”
according to Lt.Col. Dávila, “but he wanted to be the ‘little king’ and considered them
the enemy. When the OC was being renewed, he divided the nominating congress of
grass-roots leaders – divided and conquered them.”120 With no effective oversight,
Callisaya was able to do as he pleased and impose his will freely. In everything from the
petty to the scandalous, the executive branch was not held to account. “He buys the
peasants off with stupidities, and other times he sends them away, telling them ‘Come
back tomorrow’.”121 The community leaders of Santa Ana de Machaqa, to name just
one example, provided details:
The mayor comes along brightly to ask us what projects we want, but then does nothing about it…. The municipality isn‘t like the Plan Internacional [an NGO active in the area], which does come through for us. […] We spend money making trips to Viacha to make formal requests for projects but nothing comes of it.122
The municipality did build a schoolhouse and public urinals in Santa Ana, but
local residents were not consulted about the project design and were not told the value of
the counterpart contribution that they were expected to make. The community’s request
to change the urinals to an additional classroom was rejected. Then they were
overcharged for their lime supplies, and discovered that the wood the municipality had
117 Fr Justino Limachi, parish priest, interview, Viacha, 16 October 1997. 118 Núñez, op.cit. 119 González, op.cit. 120 Dávila, op.cit. 121 ibid. 122 José Quezo Cusi, community leader, Lorenzo Julián, teacher and electoral notary, and Olga Cusi de Julián, Plan Internacional liaison, interview, Santa Ana de Machaqa, 23 March 1997.

Viacha
113
provided was rotten.123 But the mayor’s high-handed rule proved even worse in
Sombrapata. According to Sub-Prefect Lozano, this community was excluded entirely
from the municipal participative planning exercise because of the UCS’ low vote tally.124
Project quality suffered as well. “The sewerage extension was badly done with pipes
that were too small,” explained Dávila. “They exploded and inundated the city with
waste. […] Even today water and sewerage service does not extend beyond four blocks
from the main square,” leaving his military base unattended.125 The mayor himself
admits that municipal performance has been “bad” in health, garbage collection,
sewerage, roads and irrigation.126
The picture that emerges is of a municipal executive which makes some effort to
spread resources throughout the municipality, but which lacks the personnel, technical
criteria, quality control, beneficiary participation, budgetary controls and ultimately the
leadership to articulate a clear investment strategy and use resources effectively. With a
municipal staff awash in people but lacking skills, and an institutional structure
undermined and incapable of carrying out oversight, the mayor’s impulses to
modernization and equality were drowned in a sea of mismanagement and
demagoguery. Political imperatives were allowed to override all others, and the
municipality ignored community needs and the requirements of the education and health
networks in a crude attempt to maximize votes.
Such a situation would seem destined to lead to corruption, and in Viacha it did.
Paz asserts that municipal employees stole municipal property as a matter of course.127
According to Lozano, the mayor authorized the purchase of cement at twice the market
price in a transparent kick-back scheme.128 According to Dávila the mayor bought a
large piece of land alongside the main road to La Paz in a clear conflict of interest.
SOBOCE’s Núñez places corruption in the larger context of the municipality’s overall
performance.
The municipality plans roads and related works badly. First they tear up the roads to lay down sewerage, and then a few months later they tear them up again for water works. Our cement trucks take the blame for poor state of roads, but it’s also the municipality’s fault with their poor-quality repairs. We have serious suspicions of corruption in all of this. It seems to be all about payments to certain firms for
123 ibid. 124 Lozano, op.cit. 125 Dávila, op.cit. 126 Callisaya, op.cit. 127 Paz, op.cit. 128 Lozano, op.cit.

Viacha
114
construction and equipment rental. Imagine – they’re paying more for pavement here than in La Paz!129
Even councilman Ticona stated simply, “Edwin Callisaya is corrupt,” referring to the
regular over-pricing of projects during his tenure. “One cemetery was budgeted at
Bs.50,000 but then built for only Bs.28,000. But the municipality poured Bs.50,000 or
more into it anyway. Callisaya and his officers conspired to do this.”130 But the most
impressive evidence of the effects of the mayor’s near-impunity concerns the checks and
computer records of community counterpart contributions for the sewerage projects
mentioned above.
The account, earmarked for the purchase and laying of pipes, reached Bs.6 million, but nothing happened. When the neighborhood committees began asking what was going on, the computer was stolen along with the checks. Shortly afterwards, the checks reappeared, having been cashed in Argentina.131
Both Dávila and Lozano claimed that the mayor and Edgar Robles, then-president of the
municipal council, were involved, and Lozano went so far as to accuse the two of going
on a vacation-cum-spending spree in Argentina with the sewerage funds.
It is not surprising, then, that by the end of his tenure Callisaya was deeply
unpopular. The national auditing agency informed the municipality that it had found
evidence of administrative charges against him.132 Newspaper articles appeared
documenting allegations of corruption, and the rival OC2 called repeatedly and loudly
for his resignation. “The mayor acts in a ‘verticalist’ way like a dictator,” the president of
OC2 declaimed. “He is a peasant who wouldn’t know how to speak to a donkey.”133
“The CBN gives the city equipment, money and beer. But they don’t give them brains,
or at least not the mayor,” added Dávila.134 As viacheños seemed to awaken out of their
torpor and political tensions mounted, the impression dawned in Viacha that the
municipality was actually worse off than before the Law of Popular Participation. Local
government was now larger, inefficient, and more corrupt. Voters were demoralized by
the municipality’s ineffectiveness in the countryside, and scandalized by its corruption in
the city.
129 Núñez, op.cit. 130 Esteban Ticona, municipal councilman, interview, Viacha, 9 October 1997. 131 Dávila, op.cit. 132 Rada, op.cit. 133 Hipólito Tovar, OC2 president, interview, Viacha 19 March 1997. 134 Dávila, op.cit.

Viacha
115
2.2 Municipal Council
The UCS’ electoral surge of 15% in Viacha’s 1995 municipal election had the
net effect of wresting one council seat away from Condepa. Hence the balance of
councilmen in early 1997 was UCS four, Condepa two, and MNR one. Although the
UCS now held a majority of seats on its own, in practice the MNR continued to
cooperate with it, mirroring the parties’ coalition at the national level. The president of
the municipal council was Edgar Robles, a former schoolteacher from Sucre and Potosí
whose family lived in La Paz. Despite having no family or community ties to Viacha, he
had been elected to public office three times there – as mayor in 1991 and again in 1993
(succeeded by Callisaya when Robles became a substitute MP in La Paz), and as a
councilman in 1995. Robles’ fellow party-members on the council were farmers and
local leaders from the Aymara communities of the Machaqas region towards Peru.
Unskilled in the practice of urban politics, both they and the city seemed slightly stunned
by their presence in city hall as late as 1997. The two Condepa councilmen were both
city viacheños and former employees of public enterprises, one of them in La Paz, who
entered politics by becoming party activists. And the lone MNR representative, also
from Viacha, was the recently-elected head of his party comando and a public employee
who worked for the central government in La Paz.
When asked about Popular Participation, councilmen universally opined that it
was a very good law and beneficial to their constituency. But they also seemed
somewhat intimidated by the process, and worried about the expectations it was
generating in rural communities.135 Unfortunately their worries did not necessarily spur
them to action. They admitted to ignorance about the 1994 Municipal Development
Plan, which maps local needs and preferences for public investment throughout
Viacha,136 implying that they were not using it as part of the budgeting and investment
planning process in the municipality. And while noting that Viacha’s needs in health
and waste disposal were considerable, they acknowledged that the municipality’s
performance in these areas so far was poor, and that in electricity, roads, irrigation and
water little or nothing had been achieved.137
135 Quintela and Ticona, op.cit. 136 PDMs were developed through an elaborate series of participative planning seminars held in each of about 100 Bolivian municipalities in 1994. Delegates were invited from a broad spectrum of society to workshops where needs were identified and projects ranked based on individual communities’ priorities. PDMs were meant to be multi-year plans, and the basis for drawing up Annual Operating Plans. 137 Quintela and Ticona, op.cit.

Viacha
116
This peculiar combination of concern with inaction may be partly explained by
the municipal council’s view of its role in local government, which is that of a tail
wagged by the executive (i.e. mayoral) dog. “We have one secretary and one adviser,”
the councilmen complained, “how are we supposed to cope? They [the executive] have
140 people there.”138 When asked about the organization of the local administration,
salary levels, and hiring criteria, they responded that they had made same queries
formally to the mayor, but had received no response. “We do not have access to that
information,” they pleaded.139 They went on to float a proposal for more training of
municipal staff, and more resources generally to improve the municipal administration.
They seemed not to appreciate the irony that it is the municipal council that approves the
local budget, and it is thus within their power to increase funding for any item that they
choose.
Regarding its external role in the municipality, the council claimed to set policy
and priorities according to their voters’ wishes. But on this point they were directly
contradicted by the voters themselves. Community leaders in Santa Ana de Machaqa
testified that “councilmen obey their parties – they’re elected as representatives of the
local people here, but then they go to Viacha and get absorbed by the political parties
there and forget their home.”140 In Titik’ana Takaka, the leaders said that “councilmen
respond mainly to the parties and the municipal government’s own interests, not
ours.”141 Judgments were virtually identical in the communities of District Five, District
Six, Chama, and the city of Viacha.142 Even the mayor testified that councilmen ignore
their voters, explaining “there is a party discipline that has to be obeyed.”143 As if to
underline the point, Quintela and Ticona admitted to knowing nothing about how a large
and controversial project to re-build a school in Viacha was designed and tendered.
“The Social Investment Fund did it all – we weren’t involved.”144
138 ibid. 139 ibid. 140 Quezo, Julián and Cusi, op.cit. 141 Genaro Mamani Chiri, Gumercindo Vito Guarachi, Saturnino Tola Mamani, and Doroteo Callisaya Mamani, community leader, district official, representative to the Federation of Ayllus and Indigenous Communities of Ingavi Province (FACOPI), and community official respectively, interview, Titik’ana Takaka, 20 March 1997. 142 Gerónimo Colque, community deputy leader (District Six), Severo Guarachi, community leader (Chama), Simon Canavi, community leader (Viacha), and Alicia Rodríguez, women’s leader (District Five), interviews, Viacha, 17 March 1997. 143 Callisaya, op.cit. 144 Quintela and Ticona, op.cit

Viacha
117
Not surprisingly given this panorama, outsider’s views of the municipal council
were unflattering. “The one who thinks on the municipal council is Edgar Robles,” said
Lt.Col. Dávila. “The mayor is also clever. The rest are a brotherhood of imbeciles.”
Luis Paz agreed, calling the member of the council “ignorant and imperceptive”.145
Some, including the Sub-Prefect and the local leader of Condepa, singled out the UCS
rural councilmen for scorn as unsophisticated and easily manipulatable. “They’re
ignorant peasants – they don’t know where they’re standing,” elaborated the latter.146 I
had the good fortune to travel with two of these UCS rural councilmen for a long day
across the Viachan hinterland to the border with Peru and back. Both men were very
kind and helpful, and kept high spirits throughout a tiring ride in a crowded jeep. But
neither showed much interest in the opinions and priorities of the communities which we
visited, all of which lay in their constituencies. I spent hours that day speaking to local
leaders about their concerns and needs for municipal investment, but the two men were
largely absent. Unfortunately, the criticism went deeper still. Ms Lozano also accused
some councilmen of corruption and political treachery. “The Condepistas used to
complain and give the mayor trouble. But then the UCS found them jobs and now
they’re silent.”147 The District Director of Health asserted that the problem was more
widespread – “The [entire] municipal council has been bought off – bought off by the
UCS.”148
All of the evidence points to a municipal council in Viacha which failed to
operate as an independent deliberative and policy-setting body, and thus as a
counterweight to the significant power of the mayor and local executive branch. Council
members were of poor quality, untrained in the legal and procedural details of the post to
which they had been elected and uninterested in learning the same. This was
compounded by their perception of themselves as the residual in the local political
equation, systematically uninformed about municipal business and powerless to affect
the mayor’s decisions; powerless, in fact, to learn what these decisions were until well
after they had been taken. This is difficult to understand given the broad authority
granted to the council by Bolivia’s constitutional and legal framework, as well as the
system of countervailing approvals and oversight specified in the Law of Popular
Participation. Indeed, Bolivian mayors emanate from municipal councils through
145 Paz, op.cit. 146 Tomás Palacios Rodríguez, Condepa local leader, interview, Viacha, 15 October 1997. 147 Lozano, op.cit.

Viacha
118
Box 1: The Cure Esteban Ticona wheezes and sneezes his way through our second interview. His nose is bright red and his gaze floats towards me through a sea of misery. As we finish, his secretary arrives with a dark potion she has just bought in the market outside. Elated, Ticona leaps into the Council chamber and drops his pants. She jabs him with a huge syringe and decants the murky liquid into his bottom. “Guaranteed to cure a sore throat,” she says, gleaming. Ticona emerges shortly, smiling, wincing, and clutching his rear.
indirect elections, and council members then have the prerogative to oust the mayor after
his first, trial year via a “constructive vote of censure”.149 This option was exercised in
over 100 municipalities in 1995-96 by councils that refused to tolerate the mayors they
had elected. But in Viacha, councilmen sat idly by, complaining occasionally, while
their municipality sank into a pit of
waste and corruption.
The question we must ask is
why Viachan councilmen behaved
in this way, when the formal legal
and institutional context within
which they operated was identical to
that in scores and scores of other
municipalities where the governing
dynamic was altogether different. A key piece of evidence is that the man chosen to be
president of the municipal council was Edgar Robles, previous mayor and close
associate of Callisaya who handed power over to him when the party elevated him to
Congress. Combine him with three rural representatives who, though initially popular,
were thoroughly unprepared and uninterested in exercising their responsibilities, and we
have a council majority which serves as the right arm of the mayor, rubber-stamping his
decisions and helping to obscure his dishonesty. Such a majority is completely unsuited
for municipal oversight and control, and most unlikely to engage in it. Eventually
opposition councilmen did cause trouble for the mayor, attempting to scrutinize his
accounts and call him to order. When this happened, the opposition was simply bought
off by the UCS wielding the huge economic power of the Cervecería Boliviana
Nacional.
The trail leads directly to the door of the CBN/UCS, which would appear to have
constructed a strategy of neutralizing the municipal council by choosing candidates,
structuring authority within the council, and buying off the opposition so as to ensure the
council’s docility. Under this theory, rural UCS candidates were picked with the twin
aims of maximizing the rural vote and minimizing their functional independence once
elected, and not because of any personal qualities they might bring to the office. The
ultimate institutional effect was to short-circuit the governance process and free the
148 Aguilar, op.cit.

Viacha
119
mayor’s hand in his conduct of official business, allowing him to do whatever he chose.
The evidence suggests that he seized the opportunity. The larger question of how the
CBN was able to achieve this and why must await completion of our survey.
2.3 Oversight Committee(s)
Viacha is divided into five rural and two urban districts. Within each of these,
communities are represented by mallkus, ayllus, peasants’ unions, neighborhood
councils, or any other natural form which civil society chooses to express itself. The
organizations within each district elect a junta, which represents communities’ interests
at the district level. The president of each junta is a member of the municipal oversight
committee, which elects its own president from amongst its seven members.
Of the nine municipalities studied here, Viacha is distinguished by having two
oversight committees. But far from leading to a greater level of scrutiny, this situation
undermined the oversight that municipal business received. As reported above, Mayor
Callisaya was the enemy of the OC he inherited, which opposed his policies and caused
fiscal flows from central government to Viacha to be suspended.150 At a congress called
by the Federation of Juntas to renew the OC, and attended by grass-roots organizations
from throughout the municipality, the mayor saw his chance. Accounts of the precise
events at this conference differ in the details, but agree on the following facts. The
congress elected Hipólito Tovar and Teddy Montalvo, both known to be opponents of
the mayor, as representatives to the OC for the two urban districts. As Tovar was also
chairing the assembly, a dispute broke out during his confirmation over conflict of
interest and his eligibility to stand. The assembly divided on this point and the situation
became quite tense. Then the congress was invaded by “UCS activists, many of them
employees of the municipalities, who had been drinking and were drunk. They caused
disturbances and broke up the congress. They also used ladies from ADRA [a food-for-
work scheme active in the area] armed with clubs,” who threatened the delegates and
barred their exit from the meeting hall.151 The congress recessed early before exhausting
its agenda.
One month later, the part of the congress supporting Tovar and Montalvo
reconvened and finalized its nominations. Its action was recognized by the Federation of
Juntas of La Paz, which validated the election of the two men. But during the interim,
149 This is only one, albeit the most radical, of the municipal council’s countervailing powers. 150 Dávila, op.cit. 151 Max Mercado, president of the Viachan Federation of Juntas, interview, 11 October 1997.

Viacha
120
another “assembly of the people” was called, in which Remigio Quispe and Walter Patzi
were named representatives to the OC and the Viachan Federation of Juntas respectively.
The OC formed by the five previously elected rural representatives – about whom there
was no controversy – and the two new urban ones duly elected Remigio Quispe as their
president; a meeting of the juntas did likewise to Walter Patzi. The municipality
recognized this result and installed both Quispe and Patzi in offices in city hall. Tovar
and Montalvo were thereby excluded from the acting OC. During my time in Viacha
Teddy Montalvo had faded into the background, and Hipólito Tovar had assumed the
role of spokesman for the rival oversight committee and for community organizations
opposed to the mayor’s rule.
Remigio Quispe, representative for the first (urban) district and an ex-
cooperative miner from the southern mining region of Bolivia recently arrived in Viacha,
reported that the previous OC had done “nothing during the past two years – there’s no
documentation, nothing. Now we’re going to comply with the law and scrutinize the
municipality.”152 But there was little sign of this in his actions at the time. When asked
about specific investment projects that Viacha was undertaking in the city, Quispe
admitted ignorance. He knew none of the financial details of a large school project a few
blocks from his office, and surmised that they must have been worked out in private
between municipal technicians and those of the FIS. He knew nothing of the projects
completed before his tenure. Amongst more general issues, he did not know how many
people worked in the municipality nor what their salary levels were; he did not know
what IT and accounting systems had been implemented in the municipality since 1994;
and he didn’t know the voting details of the last election. He nonetheless claimed that
Viacha had done comparatively well after decentralization, and called it a “model
municipality”. He attributed this in part to a mayor who responded more to the people
than his party. “Here in Viacha things aren’t so polarized,” he added, numb to the public
mood. He conceded that the OC did not receive requests for projects directly from
communities, as in other municipalities, and that politics played a role in the allocation
of funds, with UCS representatives leveraging resources out of the municipality more
successfully than others. And yet his opinion of local government’s performance in
152 Remigio Quispe, president, oversight committee, interview, Viacha, 18 March 1997.

Viacha
121
Viacha was higher than that of the mayor and municipal council, with higher
performance ratings across five sectors.153
Not surprisingly, Hipólito Tovar and his associates from the (opposition) district
junta disagreed with this assessment of municipal success. Tovar, a retired railway
mechanic and long-time resident of Viacha, was categorical – and even emotional – in
denouncing the mayor as a corrupt demagogue, and his administration as little short of a
disaster for the city. His associates, Alejandro Yujra154 and Rony Morales,155 vice-
president of the opposition Viachan Federation of Juntas and secretary of the San José
neighborhood council respectively, agreed with the substance of his position, though at
times taking exception to his florid language. Accusing the municipality of consulting
no one in the planning of its investment, the three qualified all of the municipality’s
projects as “very bad” and accused it of ignoring garbage disposal and irrigation entirely.
“The municipality has drawn up several Annual Operating Plans in any given year –
they keep changing their mind,” Morales said, explaining how the mayor manipulates
the planning process to obfuscate municipal goals and the uses of funds, so subverting
effective oversight. In this confusion, “the municipal architect set up his own
construction firm and built the [Evaristo Valle] school” with 100% cost over-runs. He
was also the construction supervisor for the project, incurring an obvious conflict of
interest.156
As one might expect, these three men who sought to oversee and control local
expenditures found themselves frozen out of all municipal business, with no access to
records, investment plans, local resolutions, or any of the other information they
requested. They nevertheless toured me around a number of recent or ongoing
investment projects in Viacha to substantiate their many claims. At the Evaristo Valle
school they pointed out obvious cases of poor construction, including a new wall that
was cracked, sinking foundations and a sunken roof, among others. The Ballivián
school showed similar problems, with cracked walls and a new section built with bricks
standing instead of lying flat.157 Montes Avenue near the central square was in a terrible
state, with large sunken sections where the ground had subsided and new holes opening
at one end despite being repaired five times. The “Toboggan”, a long, high slide located
153 Of five sectors rated from “very good” to “very bad”, Quispe rated only one sector “bad”. Both the mayor and the municipal council rated two sectors as “bad”. 154 A mathematics schoolteacher and resident of Viacha. 155 An engineering student and also resident of Viacha. 156 Yujra, Morales and Tovar, op.cit.

Viacha
122
in a children’s playground which seems to have particularly captured the mayor’s
attention, had fallen apart after only a few months, with a large central section missing.
The M. Pinilla Avenue was literally an unusable ruin despite three re-constructions,
occasioned in part by the exploding sewerage project described above. But of these and
other projects we saw in various states of decomposition, nothing compares to the Park
of the Americas. This was a large, overgrown area cordoned off by a low wire fence,
with a high rubbish dump in the middle and a sewage-contaminated lake158 off to one
side. According to Morales, Viacha had invested Bs.200,000 in this park the previous
year.159
Outside of the city no one I spoke to knew of the existence of rival OCs.
Because there had been no controversy surrounding the nomination of rural OC
members, rural leaders referred to OC1 as “the” OC. Disappointment with its
performance was widespread. Local leaders from Santa Ana de Machaqa accused the
OC of doing no work with them and ignoring them completely.160 Leaders from
Titik’ana Takaka asserted that the OC did not work well, but that they knew few details
and were seeking information in order to sanction or overturn it. Even in the city, people
as prominent as the CEO of Incerpaz knew nothing of the Viachan OC nor if it
operated,161 indicating that he had never come across it in his dealings with the
municipality.
All of the evidence points to an official OC1 which was beholden to the mayor,
completely uninformed and operationally inert, not only failing to provide any sort of
counterbalance to his power but actively endorsing his demagogic manipulations. Thus
we have the approval of the 1997 Annual Operating Plan, in which the mayor
summoned community leaders to a “planning seminar” in the city. Having paid and fed
them, he invited them all to endorse a plan which his technicians had drawn up earlier.
“The communities didn’t propose a single project in that plan. Each of the 56 leaders
who signed was given a can of beer,” said Tovar. “And Remigio Quispe approved it all”
in the name of the OC. That night they celebrated at the health post with a big party.
Things got out of control and the guard was killed and the two vehicles stolen.162 Quispe
157 Building in this manner saves on bricks but results in a weaker structure. 158 According to Morales and Tovar. 159 Rony Morales and Hipólito Tovar, secretary of the neighborhood council of San José, and member and spokesman for OC2 respectively, interview and site visits, Viacha, 21 March 1997. 160 Quezo, Julián and Cusi, op.cit. 161 Paz, op.cit. 162 Yujra, Morales and Tovar, op.cit.

Viacha
123
and the mayor both publicly blamed the opposition. So extreme was the situation that
even councilman Ticona admitted that the OC did not function in Viacha, and that
Quispe received a municipal salary in direct violation of the law.163
The opposition OC2, in the meantime, was considerably more active, better
informed, and intent on providing active oversight of municipal policies. But having
been effectively sidelined by the mayor, it was excluded from local governance and
unrecognized by the state, and thus powerless to oppose his actions. When
representatives of OC2 and the opposition Viachan Federation of Juntas approached the
departmental secretary of popular participation to request that municipal funds be frozen
due to corruption, he ignored their pleas. Already liberated by his party from the
political oversight of a functioning municipal council, the mayor was also able to block
social oversight of his activities by dividing civil society against itself, neutralizing its
mechanism for accountability, and hiring his own. And the ensuing circus of accusation
and counter-accusation between OC1 and OC2 served, if anything, to divert popular
attention and shield him further from public scrutiny. The result was the squandering of
capital and opportunity described above.
2.4 National and Departmental Government
Departmental governments are not elected in Bolivia – rather the president
directly names prefects, who in turn name their sub-prefects and other departmental
officials. Thus departmental and national government are regarded here as a continuum,
as they are by most Bolivians. The highest departmental representative in Viacha is the
Sub-Prefect, an honor accorded the city on account of its status as the first municipality
of the Ingavi province.164 The holder of this post in 1997 was Gladys Lozano, a local
resident and former nurse who holds a university degree – probably the only person
active in local politics at the time so qualified. With almost no budget nor staff and few
operational responsibilities, she threw herself wholeheartedly into the political battle
against the mayor, whom she despised. She clearly regarded her job as primarily, or
even exclusively, political, and in a day-long journey through the countryside did not
hesitate to point out the many party slogans that she had proudly painted herself on
hillsides, boulders and cliffs. But her power was limited to exhortation and public
complaint. She had neither the resources nor the authority to challenge the mayor.
163 Ticona, op.cit. 164 Municipalities are ranked administratively within each province, 1st, 2nd, 3rd, etc. The 1st municipality in each province is the capital, and residents thereof seem to take pride in this fact.

Viacha
124
Despite an avowed and burning desire to oust him, she was able to do little more than
conspire with the local opposition and urge them on.
The two other important central government authorities in Viacha are the district
directors of education and of health, already encountered above. Each reports to his
respective departmental secretary, who in turn report to sectoral ministries in La Paz. As
we saw above, neither the DDE not the DDH, despite strong criticisms of the mayor’s
policies, was able to affect local policy in significant ways. In both education and health,
the municipality ignored or actively flouted sectoral policies without fear of reprisal from
local authorities or their superiors in La Paz.
The mayor and municipal councilmen confirmed their own supremacy locally.
“The prefecture doesn’t get in the way of the municipal council,” reported Ticona,
adding that “the change of government has had no effect on Viacha so far – the National
Fund for Regional Development [an executive agency] treats us the same as before,”165
two sentiments with which Quintela agreed.166 The mayor confirmed on several
occasions that central and departmental government officials cooperated with the
municipality, or at least kept out of their way, and that he was fully satisfied with his
relationship with the authorities in La Paz.167 Local leaders from the communities of
Villa Santiago de Chacoma, Rosapata, Názacara, and the city of Viacha confirmed
independently that little or nothing had changed when the national government changed
hands in 1997, and that central government thus appeared to have little leverage over
local policies. Both OCs supported this view. Perhaps the main reason for this was
provided by Quintela, who pointed out that “the mayor’s and municipal council’s
authority emanate from popular elections, whereas the prefect is designated. Hence in
any conflict between the two the municipal authorities must prevail” because of their
democratic legitimacy.168
The evidence from Viacha thus supports the argument made in Chapter 3 that
central government regulations on local government behavior did not constitute a
binding constraint on the latter. This was not, it is important to note, for lack of wanting
or even trying. The DDE and DDH were strongly opposed to different aspects of
municipal policy in their respective sectors, and the sub-prefect on several occasions
declared her heartfelt intent to topple the mayor. But central government authorities in
165 Ticona, op.cit. 166 Huber Quintela (a), municipal councilman (MNR), interview, Viacha, 10 October 1997. 167 Callisaya, op.cit.
Viacha
125
Viacha proved too weak institutionally, and too lacking in resources and democratic
legitimacy, to mount a serious challenge to the ruling administration. Once the mayor
had cleared local obstacles along the path to his own impunity, he was able to travel it in
comfort, secure in the knowledge that his authority would not be contradicted by the
government in La Paz.
3. Local Civil Society
3.1 Private Sector
Of the large private firms in Viacha, the most typical of local industry is
Industrias de Cerámica Paz, or Incerpaz. The most successful of the tile and brick firms
that line the highway between Viacha and El Alto, Incerpaz has factories in several
departments and sales throughout the country. Its CEO in 1997 was Luis Paz, an
engineer by training and descendant of the company’s founder. He boasted of excellent,
though limited, relations with the municipality. Despite the firm’s size, Incerpaz paid
only some US$2000169 per year in property tax to Viacha, and the remainder of his tax
bill to the city of La Paz, where the company is legally registered. Paz asserted that that
sum would rise to $13,000 to $15,000 per year if he were to change Incerpaz’s legal
domicile to Viacha. Sitting in his factory office from which he runs the firm, he
professed a willingness to do this. He cited the case of Warnes, a similar satellite city
just outside Bolivia’s second city of Santa Cruz, which tempted companies to relocate
there with a five-year tax holiday. “If the municipality offered to improve the main road,
street lighting, and other local installations, this property would rise in value and I could
borrow more,” he explained. “Then it would be worthwhile for me to register in Viacha.
But they don’t propose anything,” he added with exasperation.170
Incerpaz had essentially no other dealings with the municipality, with neither
approaching the other, and Paz was content to watch municipal affairs from the
sidelines. He reported that “the principal mechanism of power” in Viacha was money,
and that the CBN bought power through its financial support of municipal activities.
“They support all folkloric activity here,” he said, in order to support the mayor and
simultaneously increase beer sales. In his opinion, corruption was rampant in Viacha.
168 Huber Quintela (b), municipal councilman (MNR), interview, Viacha, 16 October 1997. 169 The “$” sign hereafter refers to US dollars, the most common unit of account for large transactions in Bolivia. 170 Paz, op.cit.

Viacha
126
“But the money from the CBN washes away corruption, and the people vote for them
anyway.”171
Paz explained the high degree of social conflict in Viacha as an endemic problem
based on viacheño culture and even geography.
The altiplano is very poor, with only one crop per year. In Cochabamba and Santa Cruz nature is abundant and no one lacks food. But not here – on the altiplano they’re on a knife’s edge of hunger and poverty. Here when they find a vein of gold they never ever let go because it’s the only one they’ll ever get. This is typical of the altiplano. In the valleys and tropics people are more generous. Here people work longer hours and are more productive but still they have less. We have factories in La Paz, Oruro, Cochabamba, and Santa Cruz. Our best personnel are here – much harder working. In Santa Cruz they won’t work more than eight hours. Here they put in fourteen hours and charge overtime down to the penny. And they know – Bs.125.25, and they charge you the 25 cents. In Santa Cruz they don’t worry about pennies.172
According to this interpretation, the deprivation of the Viachan region leads
people to fight over resources in a way that is more desperate and raw than elsewhere.
And the presence of a few large sources of patronage leads society to polarize around
competing political-industrial poles of influence. In Paz’s view, traditional forms of
community government, where elected leaders are expected to serve as advocates for
local interests before municipal and regional government, only exacerbate this. “The
moment someone declares himself a social representative, he starts demanding donations
and favors” to pay for his activities. Thus people fight over these positions and create
even more social divisions at the grass-roots level. Community representatives from the
villages of District Five, District Six and Chama as well as from the city agreed with Paz
about the presence of industrial patronage, and were not afraid to name the interests
involved. “Beer and cement call the shots in Viacha.”173
With its huge factory on the dusty outer edge of the city, SOBOCE’s physical
presence in Viacha is certainly large. The plant generated $30 million/year in sales and
$2,340,000/year in VAT, which was paid in La Paz where the firm was legally based.
Owned by the prominent politician and ex-Minister of Planning from the Movimiento de
la Izquierda Revolucionaria (MIR), Samuel Doria Medina, the company had in recent
years given up its previously activist stance in local politics. “We don’t want to be too
involved in local politics,” Núñez said. “We have no intention of installing a MIR
171 Paz was evidently referring to votes for the UCS (party), and not the CBN (brewery). The failure to distinguish between them is common throughout the region. 172 ibid. 173 Colque, op.cit.; Guarachi, op.cit.; Canavi, op.cit.; and Rodríguez, op.cit.

Viacha
127
mayor.”174 The company provided regular support for the municipality’s sporting and
cultural events, but otherwise kept its distance from local politics. This stemmed at least
in part from the political beating SOBOCE had suffered four years earlier. Núñez
explained that a decade before the plant had been highly inefficient, operating at a
fraction of its capacity. Then a new management team took over and increased output
considerably, with a resulting increase in pollution. The local population protested
vociferously, spurred on by environmental groups from La Paz. After at first holding
firm, SOBOCE eventually capitulated and installed filters when it was made clear that
the plant was losing potential revenue up the chimney. The fight was intense according
to those who opposed the firm. “I’m the one who pushed and pushed for them to get
filters,” said Robles, who was mayor at the time. “So they tried to oust me.”175 In 1993
SOBOCE invested $3 million in electric filters which dramatically reduced pollution,
and thereafter maintained a low public profile in Viacha.
This did not imply, however, that the plant’s managers approved of their
municipal administration. Claros and Núñez reported that local government had not
involved SOBOCE in its participative planning exercises, nor informed it of its
municipal development plan. The mayor and municipal council had repeatedly
condemned SOBOCE for tearing up local roads with its large cement trucks. Yet when
the firm offered to build a ring road specially for the factory, the proposal became
bogged down in the municipal council and no decision was ever taken. But it was
SOBOCE’s electricity payments that seemed to gall the two men most. “We pay the
municipality $15,000 per month for our electricity supply,” Núñez said, explaining that
this was set by official municipal resolution and not metered in any way. “It must be
enough to light up the whole town.” The plant’s management had in fact offered to light
the entire municipality free of charge, but local government rejected the offer. So where
did the money go? “It goes directly into the municipal coffers.”176 It was thus not
surprising that local officials were completely unprepared for the plant’s planned growth.
“We are going to invest $45 million in this place, expanding the factory and machinery
to make Viacha definitively the national center of cement production,” Núñez explained.
The plant’s local taxes and user fees would double, but so would the strain it imposed on
174 Núñez, op.cit. 175 Robles, op.cit. 176 Núñez, op.cit

Viacha
128
local services. “Even so the municipal government ignores this – they have no position
at all regarding this.”
With regard to broader issues of local society, Núñez seemed to agree with Paz,
complaining that relations with local organizations and institutions were not very
productive. “The altiplano mentality is too closed, too difficult,” he said. Like Incerpaz,
SOBOCE also had a plant in Santa Cruz, where Núñez found the atmosphere completely
different. “There it’s easy to reach agreement – agree compromises that make the city
grow.” If SOBOCE’s relations with the municipality were problematic, that was not the
case for the Cervecería Boliviana Nacional. Both Núñez and Claros pointed to the
dominant role of the bottling plant in Viachan local affairs. “[The plant’s director]
Blanco owns this town,” testified the former, adding that relations between the two
companies had been difficult in the past but were now quite friendly. In Núñez’s view
the CBN did not recognize a distinction between business and politics. These opinions
were not exceptional, and were widely shared amongst observers of Viachan affairs.
“Blanco runs the show here,” declared Dávila. “He lifts an eyebrow and heads roll. He
plays politics from the CBN.”177 Luis Paz and the OC2 agreed, with the former calling
Blanco “the éminence grise behind the curtain”.178
After determined lobbying, I met Blanco in his office at the CBN bottling plant;
despite high expectations, he did not disappoint. At well over six feet Juan Carlos
Blanco is a bear of a man, with larger-than-life expressions and a booming voice that
spews a stream of obscenities. When I met him he was director of the bottling plant,
leader of the local UCS and a prominent figure in the national party, director of
Integration Radio and host of his own radio show, and a director of the National Fund
for Regional Development. He told me he worked very hard, and made $8000/month.179
He defended himself against the accusations noted above. “The councilmen say ‘Juan
Carlos Blanco said so’ to shield themselves, but I don’t know what’s happening!” he
insisted, with an enormous smile. “It’s true that I have influence, but I don’t use it.”180
When the interview turned to Viacha’s many problems, especially accusations of official
corruption, his tone changed. “There are 50 or 60 people here who bitch about the party
and the municipality in order to be bought off,” he explained. “We bought off Rafael
177 Dávila, op.cit. “But SOBOCE doesn’t get involved,” he added, “they’re too pragmatic.” 178 Paz, op.cit. 179 An enormous sum in Bolivia. 180 Juan Carlos Blanco, CBN bottling plant director, interview, Viacha, 16 October 1997.

Viacha
129
Box 2: Who’s the boss? “They say I’m the boss in Viacha?” Blanco mocks my question and his roar echoes round the large office. “Call him,” he barks at an aide. “Call him! I want him now!” A few minutes later Callisaya wanders meekly into the meeting. Dressed in blue jeans and tired cowboy boots, this CBN worker is a shadow of the proud, besuited mayor I’d met that autumn. “Sit down,” Blanco commands. Callisaya gazes around in confusion. “There, next to him.” And he takes the empty seat at my side. Blanco is leaning back in his office chair now, almost horizontal. The altiplano sun blazes in through the large window behind him, enveloping him in tones of gold. “They’ve told him that I’m the boss in Viacha. What do you think? Am I the boss?” Callisaya’s eyes are wide open, a slight tremor in one hand. He is nervous and deeply confused. “No,” he says, swallowing. He looks first at me and then at Blanco. “No, he isn’t the boss.”
Rodríguez by hiring him, and he shut up.” Still, local complaints about the UCS
administration had only grown, and this annoyed him.
“My problem is that I have to manage rural councilmen,” he explained, referring
to three of the four UCS
representatives.
The pie is too small and the necessities are very large. And the people think it’s all a rush of money…. The town wants all of the money for itself, and then Jesús de Machaqa181 brings 1000 peasants marching on Viacha demanding money and projects. But I’m lacking projects!
he bellowed in frustration. The
Popular Participation Law had
raised local expectations
significantly, and the
municipality had proven unequal
to the task. “The municipality’s
employees are bad – they can’t distinguish between good and bad materials.” As a result
his party’s popularity had decreased dramatically. “I lost the elections horribly here,” he
moaned, referring to the recent national poll. “The UCS used to own this town because
of the money Max182 spent. But the opposition was very agile here. Now they’re
making me throw out this corrupt guy,” he said, referring to the recently resigned
Callisaya. And with that Blanco admitted that Viacha’s problems went deeper than
implementational weakness. “There is corruption in my municipality. Everything
involves a percentage, everything is cooked.” Local government was corrupt from the
mayor down, and municipal employees had grown used to abusing their positions for
personal gain. The graft and venality extended into civil society as well. “The peasant
congresses run on money. He who pays out the most money reaps the most
representatives.” Blanco explained that the CBN had sent beer and cash to the previous
congress and won significant support amongst rural leaders.
181 An important rural community. 182 Max Fernández, founder of both the UCS and CBN. See above.

Viacha
130
The irony, in Blanco’s view, was that decentralization had made his job not
easier but more difficult. “Before Popular Participation the municipalities were nothing.
Max gave Viacha everything,” he said nostalgically. The party’s authority was
unquestioned. But the devolution of large sums of money to local governments had
raised local expectations and increased opportunities for graft, both problematic issues
for someone in Blanco’s position. Worse still, the price of the electorate’s gratitude had
risen significantly. The projects with which the UCS was previously able to win over
the city were now lost in a sea of public investment. Unable to buy the UCS’ electoral
share with his traditional ease, Blanco turned to more explicitly political action,
sponsoring cultural and sporting events and providing beer for public occasions of all
varieties. This strategy gradually lost effectiveness, however, as Viachans – newly
empowered – grew dissatisfied with the politics of gesture. And UCS/CBN largesse
became tainted by association with the officials who dispensed it, and entwined in the
public’s mind with the scandal of public drunkenness and violence that led to murder at
the municipal garage.
3.2 Political Parties and Elections
The advent of decentralization in Bolivia brought a new political dynamic to
Viacha, as elections which had previously been fought only in the city now extended
through a large rural area. Seeing their opportunity, rural leaders from the Machaqa
region took the initiative in the run-up to these elections and chose two respected local
men with a history of service to their communities as their candidates to the municipal
council. As the LPP recognizes only candidates from legally registered parties, rural
leaders needed to come to agreement with the political establishment in order to include
their candidates on the ballot, and decided that the UCS offered them the best chance.
The mayor, who co-managed the campaign with Blanco, agreed to include the names on
the UCS electoral list in exchange for the massive UCS vote that the Machaqa leaders
promised in their region. In doing so he opened his party to the countryside for the first
time. He also effectively co-opted forms of social organization and representation which
were deeply rooted in the community structure of the Machaqa region, with all of their
attendant legitimacy and capacity to mobilize public opinion. But then the mayor
betrayed them. During the campaign he attempted to renege on his promise by changing
the list to favor his own political allies, causing great consternation amongst
machaqueños. In the end the original names were included, but lower down the list than

Viacha
131
had been promised. The UCS vote was sufficient to elect both to the council anyway,183
but the goodwill Callisaya had begun to build with rural voters was tainted by his
scheming and the cavalier way he treated their representatives.
Such a lack of political commitment on the part of the UCS should not be
surprising. The previous section documents that where the Viachan UCS was
concerned, the party was the business and the business was the party. The two concepts
were intimately conflated in their means and their ends. The party availed itself of the
brewery’s delivery trucks, sales agents and retailers to disseminate political literature and
mobilize supporters. And political campaigns served as traveling beer rallies and brand-
building exercises, the ubiquitous logo emblazoned behind every podium, campaign
workers clad in blue CBN uniforms, and the famous froth gracing the lips of candidates
as they communed with their voters. A number of times, as the sun set behind the
mountains, I found uniformed workers from the brewery enthusiastically unloading UCS
materials from their delivery trucks, working to capture the vote and earning valuable
overtime. With impeccable entrepreneurial logic, the twin imperatives “drink Paceña”
and “vote UCS” were seductively paired in a seamless operation which never really shut
down, a sort of permanent campaign enjoining consumers to enjoy life but also do their
civic duty. Once the UCS was firmly in control of the city hall, the concept of boundary-
less enterprise was extended to include municipal business as well. “The UCS
inaugurates projects, donates materials and gives away beer as if it all came from the
party, and not from the municipality’s popular participation funds,” Sub-Prefect Lozano
complained.
In the heated political atmosphere of Viacha, only the fellow-populists of
Condepa were able to challenge the UCS’ dominance. The party was founded by a
charismatic radio and television host who specialized in airing the grievances of La Paz’s
recent indigenous and mestizo migrants from the countryside. Condepa was adept at
manipulating the symbols of race and oppression into an emotionally charged discourse
of liberation which at times strayed towards vengeance. Without the economic power of
the largest private business in Bolivia behind it, Condepa relied on its media outlets to
generate a politics of identity that mobilized voters and nourished its constituency. Its
position was illustrated by councilman Ticona’s response when questioned about the
support he received from the national party. “The party’s support depends on me getting
183 Esteban Ticona Alejo and Xavier Albó, Jesús de Machaqa: La Marka Rebelde 3, La Lucha Por el

Viacha
132
the condepistas jobs.184 But I can’t because we’re a minority in Viacha, and so the
support of the national party has ebbed away.”185 With few links to the local business
community, the party was dependent upon placing its activists in municipal jobs in order
to sustain itself. The leader of the local party was an ex-railway worker named Tomás
Palacios. He claimed that the party’s electoral lists were set by an assembly of all local
Condepa members from short lists drawn up by the party leadership. “But in effect
urban members decide because rural members don’t want to come to Viacha to
participate.”186 The pragmatic Ticona, himself a product of this selection system,
contradicted him.
Candidate lists are mostly set in La Paz by party or departmental leaders. Local people don’t participate. This is true of all the parties except for the UCS, which is run out of the bottling plant. When someone ambitious isn’t popular locally, he goes to La Paz to lobby [the party leadership], and often the order comes down to name him candidate.187
The third most important party in Viacha was the MNR, architect of the 1952-53
“nationalist revolution” in which the traditional criollo188 land-owning and mining upper
class was overthrown in favor of an ascendant, educated middle class which nationalized
the mines and redistributed land to dispossessed peasant farmers. Although the MNR
was traditionally strong amongst rural voters, during the previous decade it had lost
supporters throughout the altiplano to the potent appeal of Condepa and the UCS;
between the 1993 and 1995 elections its vote tally had fallen by half. The local MNR
leader in 1997 was councilman Quintela, who worked as a public employee in La Paz.
He had been elected leader during the internal democratization of the party which had
occurred a short time previously. “The MNR is the most democratic party in Bolivia,”
he averred. In electoral terms, this amounted to a strategy for winning over the educated
professional and middle classes more concerned about good governance than
government patronage – a group largely absent in Viacha. But this democratization, he
then added “only goes so far. For the uninominal [a local congressional seat] the local
party preferred one person, but the big men in La Paz preferred another, and the other
was chosen. The MNR has party discipline, and I lost.”189 Unlike the UCS, the MNR
had few business links locally and resorted to selling seals and letters of approval to
Poder Comunal, CIPCA/CEDOIN, La Paz:1997, pp. 295-6. 184 i.e. Jobs for the boys. 185 Ticona, op.cit. 186 Palacios, op.cit. 187 Ticona, op.cit. 188 Literally “Creole”, meaning locally-born descendants of European immigrants.

Viacha
133
people looking for jobs in local, regional or national government in order to finance
itself. The MNR in Viacha was clearly a party in decline, unused to being marginalized
and unsure how to stem the rapid erosion in its base of support.
The last party of any importance in Viacha, more by association than its electoral
weight, was the MIR. Despite its association with SOBOCE and its owner, the
prominent politician and vice-presidential candidate Samuel Doria Medina, the MIR’s
fortunes were at a low ebb in 1997. Its vote had fallen by more than one-half in the last
election, an abrupt recent change in party leadership had left much confusion locally, and
some prominent observers doubted whether the Viachan MIR even continued to exist.
Quintela, for one, could not name its leader. He was Antonio Soto, an unemployed
former railway worker elected in April of that year. Soto explained that Doria Medina
has thrown out the former leadership due to personal dislike, following a struggle for
power amongst them. In previous years, he said, party leaders had nominated electoral
lists amongst themselves and their wives, and had manipulated party assemblies to
maintain themselves in power. Now all this had changed. “Now we’re ordered by
Jaime Paz or Oscar Eid [the MIR’s national leaders] to keep the current leadership or
reorganize it. And I’m happy to let Jaime Paz decide these things.”190 The national
party required nothing of him, and Soto – who had only joined the MIR a few months
earlier after many invisible years in the MNR – remained obediently quiet.
The deeper dynamic in Viachan politics was a long-term shift away from the
traditional parties arrayed left to right along a fairly typical policy spectrum, in favor of
the politics of identity, race and redress in the form of two new, populist and highly
personalized parties: Condepa and the UCS. These two competed for the support of a
common electoral group with two distinct elements: (1) a large and growing
constituency of rural migrants to peri-urban areas – largely uneducated people uprooted
from their tight communities who were thrust into the confusion and anonymity of a
precarious existence in the La Paz-El Alto-Viacha conurbation, and (2) the relatives they
left behind in rural villages who were as a result increasingly connected to the urban
economy. Popular opinion held that truckers and other transport workers were in the
camp of the UCS, while small merchants voted Condepa. The larger truth was that
amongst urbanizing indigenous and mestizo groups political identity was weak, and the
fortunes of the two parties competing for their votes ebbed and flowed unpredictably.
189 Quintela (b), op.cit.

Viacha
134
Condepa’s Palacios admitted as much when he ascribed his party’s victory in the
previous election to having captured all of its target voter groups, “peasants, factory
workers, small businessmen, and railroad workers”.191 In recent years each party had
seen its vote surge in waves of sympathy following the untimely deaths of their
respective leaders; the UCS’ vote surged in Viacha by two-fifths in 1995, only to be
reversed in favor of Condepa in 1997. With similar populist and charismatic appeals
aimed at voters immersed in a rapidly growing and changing local economy, neither
party could count on a stable electoral base.
To voters outside the city of Viacha, however, politics looked very different.
Spokesmen from Villa Santiago de Chacoma, Rosapata and Názacara reported that no
local people had been put forward as candidates in the previous elections. All were
“foreigners” to them, cityfolk they suspected. With no knowledge of how candidate lists
were set, all three communities viewed political parties as “vehicles of business and rich
people’s interests.”192 And the elections they competed in were a dirty affair.
Representatives of Chama, District Five and District Six complained that fraud, though
less common than before, continued to mar elections. The ultimate result of such
behavior was both widespread throughout the municipality and unsurprising. “People
are voting less and losing interest in elections,” said Santa Ana de Machaqa, “as they
lose faith in politicians.”193
3.3 Community and Grass-Roots Organizations
With a huge area that extends from the urban factories of Viacha-El Alto to the
cold, empty highlands adjoining Peru, Viacha has an economically and socially diverse
population which embraces a wide variety of cultural and organizational patterns. It is
possible to array Viacha’s communities along a scale of increasing “urbanness” where
rural communities which have retained their traditional ayllu and mallku authorities
define the rural extreme, and Viachans who live in the city but work in La Paz occupy
the urban extreme. On this scale, rural communities that organize themselves as peasant
unions, and rural-dwelling day migrants who find work in the informal economy of the
city, would lie somewhere in between as in figure 3 below.
190 Antonio Soto, MIR local leader, interview, Viacha, 10 October 1997. 191 Palacios, op.cit. 192 Villa Santiago de Chacoma, Rosapata and Názacara, interviews, 11, 14 and 14 October 1997. 193 Cusi, Julián and Cusi, op.cit.

Viacha
135
Figure 3: Rural-Urban Communities in Viacha
DormitoryViachans
Ayllus &Mallkus
PeasantUnion
Peri-UrbanMigrants
This schematization along a continuum should not obscure the fact that the major
divides in Viachan society are first between city and countryside, and second, within
rural Viacha, between the Machaqas region and the remainder. These differences are a
product of communities’ economic activity, environment, history, and to a lesser extent
language and culture. They resulted in the adoption of organizational forms for
neighborhood and community self-governance that differed widely by area. Not
surprisingly, the demand for public services also varied significantly over such a diverse
region, as did political views and affiliations.
The superiority that Viacha’s city-folk felt towards their rural neighbors, with
whom they had never felt any affinity and who had only very recently been made part of
their district, is documented above. The insulting views that many in the city had of their
mayor and councilmen are only the most blatant examples of the low regard in which
viacheños held villagers and rural migrants generally. The resulting tensions in social
relations, and unwillingness or inability of urban whites to cooperate with peri-urban
migrants and rural villagers, were evident in everyday city life and became a barrier to
the smooth operation of the institutions of government. When OC2 denounced
corruption on the part of the mayor, for example, they were widely and instinctively
dismissed as the rantings of racially prejudiced cityfolk; not even the documentation they
produced to substantiate their claims was enough to convince many. The contempt with
which insular urbanites viewed the villages and their problems was tempered only by
their determination to ignore them altogether in favor of the city.
Rural Viacha contained its own fault-lines as well. As a number of community
spokesmen pointed out to me, all of Viacha is Aymara, but the rural area is divided into

Viacha
136
two sectors, the Machaqas and the rest. The Machaqas, a large area in the western part
of the district around Jesús de Machaqa and San Andrés de Machaqa, is a distinct region
with a strong identity and long history of rural uprisings against both the Spanish
colonialists and the criollo republic that followed. The machaqueños supported
numerous uprisings against successive regimes throughout the 18th, 19th and 20th
centuries, culminating in the fatal rebellion of 1921 in which a new Republican
government – which had acceded to power pledging to defend indigenous communities
– instead turned on them and slaughtered them in the massacre of Jesús de Machaqa in
March of that year.194 Whereas in the rest of rural Viacha communities are organized
around the general secretariats of the peasants’ union movement, modernizing and
“rational” forms of social organization which spread throughout Bolivia after the
revolution of 1952-3 and were meant to break the social relations of the past, in the
Machaqas the traditional ayllus and mallkus predominate. The former think of
themselves as one of the progressive forces which ended the oppression of the
indigenous majority by a small, white elite fifty years earlier; the latter base their
legitimacy in ethnic pride and traditions which predate the arrival of the Spanish in
South America. Aymará is by far the prevalent language in the Machaqas, whereas
elsewhere a mixture of Spanish and Aymará is spoken. And the ferocity remains. “The
Machaqas are rebellious and conflict-prone,” one observer told me. “They still have
‘whipping-justice’ there.”195
Community life in the city was organized around neighborhood councils. These
organizations were riven by the conflicts that divided and paralyzed the oversight
committees, as described above. Hence Viacha had two rival sets of neighborhood
councils, and rival representatives to the federation of neighborhood councils at the
departmental level.196 While these conflicts were partly due to hostilities particular to
Viacha’s urban population, they were also due in part to the ethnic cleavages that divided
the city. As a result, when the mayor appointed a migrant from Potosí to head his own
OC, the peri-urban population of Viacha did not voice disapproval. And the “authentic”
viacheños determined to oust both mayor and OC1 visibly failed to carry this large and
growing population. Despite their relative wealth, high living standards, and the
194 Ticona and Albó, op.cit. 195 Armando Godínez, anthropologist, numerous conversations, La Paz, February - May and September - November 1997. 196 Quispe, Patzi and Mamani, op.cit.; Tovar, Yujra and Morales, op.cit.

Viacha
137
facilities of living in a city, the residents of Viacha were unable to form community
organizations that adequately represented their interests before local government.
The reality in rural areas, by contrast, was very different. The leaders of the
communities of Chama, District Five and District Six reported successful participative
planning exercises, where the community met to discuss and prioritize their requests for
public investments. The three representatives appeared to take their jobs very seriously,
and were familiar with the financial and technical details of projects being carried out in
their communities. They had convened popular assemblies to approve project designs,
and had participated in the various legal steps involved in launching the projects.197
Santa Ana de Machaqa, among many other communities, boasted a democratically
elected work committee to manage projects and mobilize community contributions. In
this village projects were chosen via communal assembly, which prioritized them
democratically and informed city hall.198 And the practice of community contributions
to projects worked well throughout rural Viacha. “There’s a big difference between how
projects are implemented in the city and how it’s done in the countryside,” said Titik’ana
Takaka. “In the city people don’t lift a finger for their projects, whereas in the country
we build everything ourselves” with materials purchased by the municipality.199 The
leaders of Názacara were also concerned with the needs of their people, and in particular
with those who migrated to Viacha and El Alto in search of work. “In the city people
suffer,” they told me. “What people want is a job here…. This region has great
potential.”200 They proposed that the university establish an institute locally to bring
them new crops and improved agricultural techniques. And rural communities were able
to cooperate amongst themselves to at least some extent, something impossible in the
city. Titik’ana Takaka explained that the jurisdiction of Jesús de Machaqa owned a
truck which communities within the jurisdiction shared to transport materials and people.
It was not clear whether cooperation extended to non-machaqueños, however. Despite
poor language skills in some areas, and low levels of human capital in others, rural
communities in Viacha shared a social legitimacy and capacity to mobilize that were
utterly lacking in the city.
197 Colque, op.cit.; Guarachi, op.cit.; and Rodríguez, op.cit. 198 Francisco Juliano Paz, Santa Ana de Machaqa community officer, interview, Viacha, 18 March 1997. 199 Mamani, Vito, Tola and Callisaya, op.cit. 200 Juan Laurel Hinojosa, Dona Francisca Plata de Maldonado, Julio Choque Huanca and Jaime Gómez, community coordinator, community leader, education officer and school director, interview, Názacara, 14 October 1997.

Viacha
138
But strong village structures were insufficient to make government work
effectively where government had little interest in villages. Even where communities
were well organized and levels of participation and cooperation were high, the requests
that communities made to local government were ignored, and local needs were not
taken into account in municipal policy decisions. Hence in Villa Santiago de Chacoma,
where leaders gathered the entire community to discuss its needs in a meeting open to
all, and decisions were taken by acclamation, requests for local investment were rejected
by the municipality without explanation.201 Santa Ana de Machaqa’s petition for a
schoolhouse was rejected in favor of public urinals made of surplus materials from an
urban construction site.202 And in Titik’ana Takaka, the municipality decided to build
schoolhouses with a large community contribution without consulting the community,
and despite the fact that three good schoolhouses were already in operation there.203
Even when government did fund projects that satisfied locals, villagers had to negotiate a
labyrinth of corruption involving extra-official payments to municipal engineers,
architects, workmen and drivers in order to persuade them to take measurements,
provide technical drawings, and deliver materials.204 Not surprisingly, public opinion
was unenthusiastic about decentralization throughout the Viachan countryside. Districts
Five, Six and Chama said the LPP had improved things “to a tiny degree” only, and
complained that too many popular participation resources remained in Viacha.205
Titik’ana Takaka broadly agreed. In the view of Názacara, “Popular Participation has
mainly benefited the wealthy – doctors, lawyers, not people like us,”206 while Santa Ana
accused municipal employees of being the principal beneficiaries of the LPP.207
The many failings of Viachan local government also had two unintended and
interesting social consequences. The first was a vocal demand among the communities
of Jesús de Machaqa for training their grass-roots leaders in the processes and norms of
modern government: budgeting, the legal and regulatory framework, etc. They also
requested that local government post municipal officials in their jurisdiction, “in order to
be closer to the people”.208 Far from disillusioned with decentralization, the residents of
201 Eulogio Choque and Valentín Atahuichi Callisaya, cantonal officer and community construction officer, interview, Villa Santiago de Chacoma, 11 October 1997. 202 Cusi, Julián and Cusi, op.cit. 203 Mamani, Vito, Tola and Callisaya, op.cit. 204 Laurel, Plata, Choque and Gómez, op.cit. 205 Colque, op.cit.; Guarachi, op.cit.; and Rodríguez, op.cit. 206 Laurel, Plata, Choque and Gómez, op.cit. 207 Cusi, Julián and Cusi, op.cit. 208 Mamani, Vito, Tola and Callisaya, op.cit.

Viacha
139
Jesús de Machaqa reacted to its shortcomings by demanding that it be deepened. This
culminated in a movement within the jurisdiction to secede from Viacha and form the
fifth municipality of Ingavi Province. Given the history and strong local identity of
Jesús de Machaqa, this was in retrospect a natural response to the indifference of
government in Viacha.
The second consequence of decentralization was much less predictable, and
involved the autonomous reorganization of society at the village level. Titik’ana Takaka
was a case in point. The community had been part of an ayllu which was divided into
three affiliates of the peasants’ union by the syndicalist movement of the 1950s. But
these sub-centrales began re-grouping with decentralization, and by 1997 were returning
to their traditional forms of authority and representation. The residents of Titik’ana
Takaka hoped to increase their political weight by banding together with nearby
communities, and so improve their ability to capture resources and tend to local needs.209
In doing so they rejected the social forms of the 20th century in favor of those of five
centuries earlier.
Another, deeper motive was that decentralization changed the logic of social
organization in Bolivia. A lasting legacy of the revolution was that between 1952-1994
the means for sharing out public resources were national negotiations, strikes and
lobbying conducted in La Paz between representatives of government, business and
labor, each organized in its own “peak association”.210 Economic identity was thus
much more important to rural dwellers than where they lived. After 1994, by contrast,
bargaining over resources was largely conducted at the municipal level amongst
community representatives. Whether citizens fished, farmed or drove a truck no longer
mattered. Where they lived, and how well the leaders they elected negotiated the
division of resources across municipal space, became paramount. The effects of this
change reached deep down into village life, and made the way in which communities
were organized much more important.
3.4 Other Local Actors – The Military and the Church
In the past the armed forces and the Catholic Church had figured large in
Viachan life, but their shared history of association with an oppressive white minority
209 ibid. 210 The peasants’ union was, along with miners and public employees, an important component of the Confederation of Bolivian Labor, the leadership of which for many years wielded great power in the capital.

Viacha
140
under both colony and republic conspired to make them insignificant forces in the local
democratic context of 1997. Of the two, the military’s role in oppression was by far the
more direct. For centuries the army was the state’s instrument of domination for the
benefit of a landowning and mining criollo elite. The government in the capital
legislated, regulated and taxed the countryside so as to push Aymara communities off
their traditional territories, allowing latifundistas to purchase the land at convenient
prices. It also enforced the mit’a, a distortion of the ancient practice of communal labor
by which young men were extracted from peasant communities throughout the altiplano
and forced to work in the silver and tin mines of Potosí.211 When the peasants revolted,
the army was sent to put them down, which they did with a ferocity made easy by
superior armor. These events were seared into the memory of the campesinos, and
became important touchstones in their ethnic history and identity. Even today the
residents of Jesús de Machaqa take pride in their rebellious past and continue to
celebrate their doomed uprising which led to the 1921 massacre.
By 1997 the military found itself in quite a different position in Viacha. The
revolution of 1952-3 had largely ended the systematic military repression of the
peasantry, and the restoration of an open, democratic regime in the 1980s had returned
them to their garrisons. Years of curtailed military spending had reduced the army unit
based in Viacha to a distressed state, with outdated equipment and insufficient resources
for training. Its commander was Lt.Col. Adolfo Dávila, a native of Viacha, who led the
2000 soldiers of the army’s 1st Division GADA 231 unit, based only a few blocks from
the city’s central square. A confident, well-spoken man, he was a keen observer of local
affairs and well-versed in the workings of local government. Unusually for Bolivia, he
and the mayor had found no way in which to cooperate, and if his relations with local
government were cordial they were also largely empty. The commander complained
about the government’s inefficiency and described the schemes by which senior officials
misappropriated public funds, but in the end his power to affect local events was very
small.212
The Viachan Catholic Church stands silently at one corner of the central plaza,
itself the very symbol of a “civilized” urban society which defined itself in opposition to
the indigenous countryside.213 On both sides of the ethnic divide the church was
211 See Dunkerley (1984), Klein (1993), Albó, et.al. (1990), Ticona and Albó (1997), among others. 212 Dávila, op.cit. 213 Ticona and Albó, op.cit., pp.29-43.

Viacha
141
traditionally and strongly associated with the dominant white and mestizo classes.
Throughout the colony and the republic local authorities allied themselves repeatedly
with the church, and used this alliance to amass rural landholdings for the church and
themselves.214 The church was thus regarded by campesinos as a foreign institution, and
in the uprising of Tupaq Katari in 1781 rebels killed the local priest. Despite this, the
evangelical efforts of the church over 500 years were not in vain, and the church was
also an integral part of daily rural life, with “the sacred role to bless, celebrate baptisms,
festivals, and many other rites that, from as early as the 18th century, were already part of
Aymara daily life.”215 Aymará and Quechua speakers throughout the altiplano
internalized many of the doctrines and symbols of Catholicism in a sui generis religious
form which intertwined them with elements from traditional indigenous spiritual
beliefs.216 Thus, for example, the Virgin Mary was viewed by many as a manifestation
of the Pachamama,217 and the lightning which made stones sacred and revealed the
identity of yatiris218 was thought to come from the apostle Santiago.219
Beginning in the late 1960s, the Aymara Church movement sought a more
explicit reconciliation with its indigenous flock, introducing the Aymará language and
music into liturgical celebrations. The parish priest of Jesús de Machaqa was one of the
founders and principle exponents of this movement. This represented a significant
change from the historical pattern of relations between the church and the rural masses,
and an important attempt at outreach. Unlike comparable developments elsewhere in
Bolivia, it was more a religious than a social or political movement. It was, indeed, a
product of the withdrawal of the church from political life to concentrate on the spiritual
and evangelical. Fr. Justino Limachi, the Viachan parish priest, confirmed that the
Church had little interaction with Viacha’s government. “We don’t work with the
municipality. There was talk of church involvement early on, but people go into local
government to steal, so the church didn’t participate.”220 In his view municipal events
were driven by politics, and this was an area that the church no longer engaged.
214 ibid., p.40. 215 ibid., p.137. Author’s translation. 216 ibid., pp.137-139. 217 The mother earth “goddess”. 218 Andean holy men or “priests”. 219 Xavier Albó, Armando Godínez, Kitula Libermann and Francisco Pifarré, Para Comprender Las Culturas Rurales en Bolivia, MEC/CIPCA/UNICEF, La Paz:1990, pp.125-135. 220 Limachi, op.cit.

Viacha
142
4. Summary: How Government Works in Viacha
The evidence strongly indicates that local government in Viacha was of very
poor quality. The institutions of government varied between merely ineffective and fully
corrupt, and the interplay amongst them produced service and policy outputs which were
insensitive to local needs and unsatisfying to local voters. There is substantial evidence
that Mayor Callisaya was inadequate as a manager: he expanded his payroll by over
100% without significantly increasing the administrative ability or technical skills of the
local executive branch; and he squandered huge sums of money on pet urban
development projects, like a municipal coliseum, the toboggan, and municipal sewerage,
which suffered significant cost overruns and were badly conceived and badly executed.
These white elephants stood unfinished or broken, in ugly testimony to his
administration’s penchant for gesture over judgment. Unfortunately, the charges against
Callisaya did not end there. Numerous sources, including public officials, municipal
councilmen, and even the mayor’s political boss at the CBN, testified to Callisaya’s
corruption, and a national audit of municipal accounts charged him with malfeasance.
And the example the mayor set spread throughout his administration, until it formed a
chain of corruption in which everyone from municipal truck drivers to experienced
technicians demanded paybacks before they would unload supplies, draw up technical
studies, and otherwise provide the services funded by city hall.
Across the hall from the mayor’s office, the municipal council were a good-
natured and ineffective bunch. The councilmen themselves readily admitted that they
had little knowledge of the workings of their municipality, and displayed no interest in
informing themselves. Regardless of party, councilmen were oblivious to the powers
and privileges inherent in their post as municipal legislators, and were content to react to
the requests they received from time to time from the mayor’s office, or occasionally
from a community organization. Authoritative observers in Viacha called the municipal
council “ignorant and imperceptive”, unsophisticated and easily manipulatable. One
could only expect uninformed councilmen who showed so little initiative to be uncritical
agents of the parties that got them elected. Respondents from both the city and
countryside testified that the council was indeed insensitive to local needs, unresponsive
to community requests and beholden to their parties. And increasingly their loyalties
belonged to just one party. When opposition representatives began to question
municipal policy, the CBN/UCS hired them and members of their family, and the

Viacha
143
councilmen were thereafter quiet. The Viachan municipal council was thus the residual
in the local political equation, unable to act as an independent deliberative and policy-
setting body. It offered no institutional or political counterweight to the power of the
mayor, and effectively short-circuited the first layer of checks and balances designed to
protect local government against executive abuses of power.
The next layer of checks and balances was based on the oversight committee,
and its interactions with the mayor and municipal council. But in Viacha this tier was
broken, and Viacha suffered from two OCs. OC1, the “official” OC recognized by both
city hall and national government, was completely uninformed and operationally inert.
Its president was unaware of the financial details of the projects initiated during his
tenure, and professed no knowledge of such basic information as how many people the
municipality employed, what their salary levels were, and whether or not any
information or accounting systems had been implemented recently. An ex-miner
recently arrived in Viacha, he did not even know the results of the previous elections.
Rural community leaders testified that OC1 was ignorant of their needs and ignored their
requests, and prominent urban observers did not even know of its existence.
Uninterested in municipal affairs and insensitive to public opinion, he not only failed to
counterbalance the mayor’s power, but actively endorsed his demagogic manipulations,
including notably the beer-soaked planning exercise that led to theft and manslaughter.
In this way he earned the illegal salary that the mayor paid him. The opposition OC, by
contrast, was considerably more active, intent on providing local oversight. And despite
the mayor’s attempts to sideline them, they were surprisingly well-informed, brandishing
the municipal budget and readily quoting project details. Unrecognized by the national
and local state, however, and thus excluded from the processes of local government,
OC2 was ultimately powerless to intervene in the formulation of municipal policy.
The institutional mechanism for the production of local government in Viacha
was thus doubly short-circuited. Having freed himself from political oversight, the
mayor was able to block social oversight of his activities by dividing civil society against
itself, neutralizing its mechanism for accountability, and hiring his own. The stress
placed on Callisaya’s role is intentional. These events were neither coincidental nor
casual but rather engineered deliberately by a canny political strategist in order to free
his hand. The corruption of the entire municipal apparatus subsequently, and naturally,
ensued. And the policies and investments that local government carried out in Viacha

Viacha
144
were grossly inefficient, largely ineffective, and more importantly bore little relation to
public need.
This story begs the deeper question of how such a situation came about. What
incentives were there for such behavior? What social and economic factors sustained a
municipal government which should have collapsed under the weight of its own
ineptitude and corruption? The dominant actors in Viachan society were potent
industrial-political groups which had stormed into the vacuum left by the withdrawal of
the church and military from public life. The most powerful of these were the CBN-
UCS and SOBOCE-MIR complexes. In order to understand their role it is important to
consider first how Viacha fit into the larger context of Bolivian national politics.
Viacha’s proximity and ease of travel to La Paz, and the increasing migration of the
owners of its factories and businesses to that city, made its politics the by-product of the
political strategies and dynamics of the capital. Viachan local parties were mere
franchises of their national organizations. They were not mechanisms for aggregating
individual preferences and transmitting them to the institutions of local government, nor
did they champion local causes. They were, rather, the tools by which the consequences
of national struggles for power and influence were played out locally. Local party
leaderships were made and unmade on the whim of national and departmental leaders
based on loyalty, electoral success, and subservience. The MIR, for example, was not
permitted to hold a meeting without explicit approval from La Paz. The only exception
was the UCS, which was run out of the CBN bottling plant.
National party bosses expected their local operatives to conduct electoral
campaigns while doing nothing to constrain the party’s strategies in La Paz. They were
uninterested in the problems of government in Viacha, and provided local leaders with
minimal resources with which to do their jobs. Of the two imperatives, the latter was by
far the more important – silent electoral ineptitude was preferable to winning elections
and causing a stir. The leaders of the MIR, for example, essentially closed down the
local party after losing a heated political battle against a UCS mayor, among others, over
the cement factory’s pollution. The battle had been politically costly for a leftist party
with environmentalist pretensions, and the owner of SOBOCE wanted no surprises to
upset his vice-presidential ambitions.221 The retirement from politics of the only force
capable of acting as a counterweight to the CBN-UCS freed it to pursue its interests
221 Samuel Doria Medina was the MIR’s vice-presidential candidate in the 1997 general election.

Viacha
145
without external constraint. In Viacha the party’s interests were identical to those of
Juan Carlos Blanco, its paramount leader. His goal was to improve his standing within
the party by delivering large majorities in Viacha,222 and he exploited the considerable
resources of the bottling plant, as well as the municipality, to win over voters. And in
the CBN Blanco had a business, with its large labor force, its wide distribution network,
and the enticement of beer, that was particularly suited to proselytism. With such a
narrow objective and a time horizon never more than an election away, the UCS proved
as uninterested in Viacha’s collective welfare as it was in its long-range development
needs. That local government proved a disaster is thus not surprising.
By 1997 Viachan civil society seemed absent from the government process,
cowed by the tight grip of party, government and brewery on local affairs. Callisaya had
skillfully manipulated the hostilities between city and countryside and set them fighting
against each other, and there was, it seemed, no remedy to UCS misrule. Then, to the
surprise of many, the grass roots flexed their muscle and proved that they were not
powerless after all. Rural communities might be too distant and poor to confront their
government, but urban society was not. Following a series of town meetings that aired
their grievances, the people of Viacha rose up against their mayor on the 22nd of March
and marched on city hall demanding his resignation.223 A crowd of several hundred
people224 paraded through town and then massed in the central square opposite
Callisaya’s office loudly and angrily demanding his departure. A few days later he
announced that he was stepping down to run for a congressional seat. And then, in the
June general election, Viacha recorded a huge swing from the UCS to Condepa. It
added insult to injury and, coming after an expensive and frenetic electoral season, was a
slap in the face to a party which had, literally, given away so much. The experience
suggested that in the new context of local government in Bolivia no local government,
no matter how rich or powerful the interests that supported it, could govern against its
people for long. The UCS had taken voters for fools, and the voters had had their
revenge.
222 Blanco, op.cit. 223 Presencia. “Los vecinos viacheños marchan hoy para que se vaya su Alcalde”. 22 March 1997. 224 Estimates of crowd size vary from 150-200 according to UCS spokesmen, to 500 according to OC2.

Charagua
146
6 Local Government at the Extremes
Charagua
1. Introduction
The road to Charagua is an orange ribbon of earth that carries travelers away
from the exuberance of Santa Cruz’s tropical flowers and swaying palms, deep into the
Chaco. The bouncing and banging of your jeep along the dusty road is interrupted by
slippery silences as you slide softly into mud. The sun’s relentless glare melts the lush
green surrounding the city into the scrubgrass and low twisted bushes of the arid plain.
The journey takes five hours in the dry season, and becomes impossible during the rains.
Located in the southeastern corner of the country, Charagua is the second
municipal district of the Cordillera province and shares a long border with Paraguay. It
was overrun by the Paraguayan army during the Chaco War of 1932-35, and the memory
of violence lives on in the stories of village elders and the statues in the central square. It
boasts the biggest municipal area in Bolivia – its 60,000 km2 make it larger than
Holland, Costa Rica or Denmark, and about twice the size of Belgium. Only 13% of its
18,769 inhabitants live in the town of Charagua, with the rest scattered across 80
indigenous and rural communities, a handful of newer Mennonite communities, and the
smaller town of Charagua Station. The economy is accordingly rural, with agriculture,
cattle-ranching, education in the form of a teacher-training college, and commerce the
main sources of income. Of these only cattle-ranching achieves a respectable scale, with
a few families raising thousands of heads of cattle on tens of thousands of hectares. By
contrast Charagua’s agricultural sector is planted firmly in antiquity, with Guaraní
peasants farming communal lands without the benefit of the plow, let alone tractors or
irrigation, relying on their traditional stick method to break the earth.
The population of Charagua is overwhelmingly Guaraní, with Ava-Guaraníes in
the northern foothills and Tupi-Guaraníes in the South, especially the Izozo region.
Although official business is conducted mostly in Spanish, the principal language of the
region is Guaraní. Quechua, a distant third, is heard primarily in the urban market,
where recent migrants from the altiplano ply their trades, and in the few rural

Charagua
147
communities where they have settled. The town of Charagua lacks industry and has
little commercial activity. Its importance comes rather from the fact that it is the seat of
power of the landowning cattle families who traditionally dominated the region and its
inhabitants. Charaguan townsfolk think of themselves as either white or mestizo, in
strict opposition to the Guaraní hinterlands, a division which is clear in the minds of
townspeople and Guaraníes alike.
Despite the huge landholdings of some Charaguans, the town itself retains a
curiously classless, colorless air, its low one and two-story buildings fronted by shaded
porches often in need of a coat of paint. There are no conspicuous displays of wealth,
and no abject poverty is visible. This is probably due to the fact that its richest
inhabitants maintain only secondary homes in town, and spend most of their time and
attention on their farms, where their estancias are. But it is also indicative of the crisis
affecting the rural economy, with low commodity and land prices and an exodus of the
ranchers’ most talented children to the city. This crisis, which has been going on for
over a decade, is likely to deepen in coming years, and we return to it below. Despite its
unprepossessing appearance, however, the town benefits from a significantly higher
level of public service provision than do its surrounding communities. Charagua town’s
index of Unsatisfied Basic Needs is 0.453, tenth best for Bolivia as a whole and very
similar to the scores of Bolivia’s three main cities. By contrast, the value for rural areas
is 0.926, ranking Charagua 100th amongst Bolivia’s 311 municipalities.
A principal problem of landowning wealth is illiquidity, and this is to a great
extent Charagua’s problem too. With few businesses in the entire district, the
opportunities for charging license fees are very limited. And the small quantities of land
that change hands in any given year make reaching realistic property tax assessments
difficult. Up until 1997 this was compounded by cattle ranchers’ practice of paying
property taxes via their regional association, headquartered in Santa Cruz. Hence all
such revenues accrued to the departmental government, with none returned to the areas
where it was generated. As a result, Charagua’s own resources amounted to only
Bs.49,000 in 1996, out of a budget of Bs.2,328,060, or a tiny 2% of the total. And given
the subsistence economy of Guaraní agriculture, essentially all of these revenues came
from the town. “The Guaraníes don’t pay taxes,” the mayor declared with a twinkle in
his eye, “they just procreate.”225
225 Luis Saucedo Tapia, mayor of Charagua, interview, Santa Cruz, 31 March, 1997.

Charagua
148
Despite this lack of resources, by the middle of 1997 Charagua had acquired a
reputation within the department of Santa Cruz, and increasingly nationally, of being
well run by a competent and enthusiastic mayor. The mayor came out top in a ranking
of all of the mayors in the department. “He is a very good administrator,” said the
departmental head of the Social Investment Fund, “and a very active person. […] He has
a very good image – even people from rival parties recognize this.”226 Decentralization
had increased municipal resources by some 6500% year-on-year, and yet the funds
appeared to be well-spent. Local government had resisted the temptation to inflate and
had managed to keep operating costs to just 4% of total budget. A series of municipal
audits carried out by the national government on medium-sized municipalities supported
this view, finding no deficiencies in Charagua’s operational programming,
administrative organization, budgeting, personnel administration, administration of
goods and services, treasury management, accounting, and internal auditing and
control.227
The foundation of good local government in Charagua was a strong social
consensus which upheld a political coalition between the center-left Movimiento Bolivia
Libre (MBL) party and the center-right Acción Democrática Nacionalista (ADN) party.
This consensus consisted of two closely-related components: (i) a political covenant
between the MBL and the Guaraní People’s Association (APG), whereby the former
allowed the latter to choose candidates for its local electoral list in exchange for Guaraní
votes in municipal elections; and (ii) the animosity felt by rural inhabitants of Charagua
towards the MNR party and its previous mayor, who was widely accused by Guaraníes
of racism and brutality towards rural villagers.228 To this second point was added a more
general, if less acute, rejection of the local MNR by townspeople who associated it with
an increasingly unpopular national government. The nature of this social and political
consensus is central to understanding the success of local government in Charagua, and
we examine its components in detail below. Its immediate results were to allow the
MBL, which had never done well in Charagua, to win almost as many votes as the first-
place MNR, and then to propel the ADN and MBL into coalition government behind an
MBL mayor, thus excluding the MNR from power. In a municipality where Guaraníes
226 Dr. Fernando Muñoz Franco, interview, Santa Cruz, 31 March, 1997. 227 Secretaría Nacional de Participación Popular. 1997. Matriz Resumen de las Auditorías SAYCO Practicadas en Gobiernos Municipales Categoría "C" ( Pob. Mayor a 15,000 y Menor a 50,000 Hab.): Informe SCAE/IEA. 228 Eulogio Núñez, CIPCA director (NGO) and municipal adviser, interview, Charagua, 2 April 1997.

Charagua
149
Box 1: The Slavery of Captive Communities Councilman Solano explained that some of the migrants to Charagua were from Ivo, Boyuibe and Huacareta. “They come without land or money, and the locals here tend to the needs of brother Guaraníes.” The source of these desperate arrivals are the “captive communities” deep in the Chaco, where modern slavery flourishes. The CIPCA’s Núñez explained how it works. There are towns
where the rich families run everything and occupy all the important posts. […] They have between 10 and 30 Guaraní families living on large properties where they are kept as slaves on the land and aren’t paid for their work. […] The patrón keeps them in debt. They can’t leave before paying or they’re put in jail.
The debt is passed down from father to son, and Guaraní families are allowed neither education nor contact with the outside world. “These families have radio communications amongst themselves,” Núñez continued. “They set up roadblocks and radio warnings to each other when an outsider appears. Then they send the Guaraníes up into the hills with the cattle, and the outsiders are told no one lives there.” The patrones even had the gall to register themselves as a rural community so they would not have to pay taxes. “Now these rich families have formed a GRO and are able to demand public money for wells, roads, etc. on their private property. And they put Guaraní families on their lists of GRO members.” CIPCA has purchased the freedom of some captive Guaraníes at a price of around Bs.1000 each. The APG has proposed the wholesale liberation of these slaves, but successive governments have been afraid to tackle the issue.
did not vote and the MNR traditionally beat the ADN into second place in town, this was
a shocking turn of events for many.
The ADN-MBL coalition proved surprisingly robust in practice, and provided
the mayor with a strong political base for his administration. By his own account this
was very fortuitous. “Never before have so many distant communities received so
much” in public services and investment, he said, explaining a planning and budgeting
system built around the principle that each community in the district must receive an
equitable share229 of the municipal budget over a multi-year cycle.230 But the effort
needed to run a planning system in which communities discuss their needs and
prioritized their own projects, in a municipality as big as Charagua, was immense. “It
took two months just to meet all 67 indigenous communities and agree their needs,” he
explained. “The workload is very heavy for many municipalities that weren’t used to so
much responsibility. […] Every year we have to re-structure ourselves better.” It is
doubtful that the municipality would have achieved the results it did without the
unwavering support that the municipal council provided the mayor.
The deeper background to Charagua’s municipal dynamics is a Guaraní cultural
renaissance which began in the early 1980s and gathered pace in the 1990s. The
229 i.e. Based on population. 230 Saucedo (a), op.cit.

Charagua
150
Guaraníes, who as a people had managed to survive Spanish colonialism successfully for
over three centuries, succumbed throughout the 19th century to the criollo republic’s
potent mix of Christian conversion, government territorial annexations, and cattle
ranchers’ land purchases and confiscations, all backed by repression of the Bolivian
army.231 With their spears and arrows the Guaraníes were no match for the firearms of
the state, and at Kurujuky in 1892 an indigenous uprising led to a massacre which almost
destroyed the Guaraní culture.232 Coming as it did after a long string of setbacks, the
massacre of Kurujuky cast the Guaraníes onto the margins of society, where they
survived as the perpetually indebted slaves of large landowners or as subsistence farmers
in isolated rural communities. The Guaraníes spent the better part of a hundred years in
material and spiritual deprivation, a proud and bellicose people beaten into docility, lost
in a sort of collective amnesia triggered by their defeat.233
After the chaos of successive coups d’état and hyperinflation, the 1980s
witnessed a re-birth of Guaraní consciousness and Guaraní pride, as is discussed in detail
below. The Asamblea del Pueblo Guaraní (APG) was formed in 1986-7 to coordinate
Guaraní affairs, foment cooperation amongst communities, and articulate Guaraní
interests. The moment was evidently ripe for such an organization, and the APG
flourished and very quickly established a central role throughout the Guaraní world from
the most mundane community tasks to the international arena via its representation of
Guaraníes across Bolivia and Paraguay. Thus when the MBL sought to mount an
electoral coup in Charagua by capturing the hitherto ignored Guaraní vote, it found in the
APG an interlocutor which not only spoke with authority but possessed the legitimacy
and organization to mobilize a highly dispersed population. When the Guaraníes voted
for the MBL, they also voted for the Guaraní candidates that the APG had chosen. The
party’s vote increased by over 360% in the 1995 local election.234 Rural voters and
community leaders that I spoke to reported satisfaction with their electoral success and
the subsequent government’s performance. With the presence of Guaraníes on the
municipal council for the first time, they felt not only that their voices were heard but
231 Xavier Albó, Los Guaraní-Chiriguano: La Comunidad de Hoy, CIPCA:La Paz, 1990, pp.19-22. Albó is acknowledged to be one of the premier authorities on Guaraní culture in Bolivia. 232 Fr. Gabriel Sequier (Tianou Pirou), parish priest, interview, Izozo, 3 April 1997. Sequier is another Spanish priest who has dedicated his life to understanding and working with the Guaraní people. 233 Javier Medina (Ed.), Arakuarenda: Un Centro Intercultural de Capacitación Para el Desarrollo Guaraní, Arakuarenda/FIS:La Paz, 1994, pp.19-30. 234 Corte Nacional Electoral (Dirección de Informática), Estadística de Votación Absoluta, Elecciones Municipales de 1993 y 1995. [Database]

Charagua
151
that they had assumed control of the municipality. “Councilmen are sent to represent us.
They pay attention to us and not to the parties – they do what we want.”235 Quietly,
tenuously, but with evident pride, the Guaraníes were emerging from obscurity to take
their rightful place at the center of Charagua’s political life.
Figure 1CHARAGUA Electoral Social Indicators
Governing Coalition* % of Population Speaks:General Spanish 34%Total Pop. 18,769 % Vote 1995 44.0% Native Tongue 14%Urban Pop. 2,486 Main Opposition MNR Spanish & Native 46%Urban Share 13% % Vote 1995 37.6% Literacy Rate 80%Rural Communities 37 Electoral Absenteeism 39.5% No Ed. Attainment 17%Indigenous Comms. 51 % Blank Votes 2.1% # Schools (Bldgs) 46Unsatisfied Basic Needs 0.873 % Null Votes 1.4% Total Students 4,316Urban UBN 0.453 Students/Teacher 17.5Rural UBN 0.926 Municipal Employees 87%
1997 9Oversight Committee 1993 4 # Health Facilities 18Total Members 8 Increase 125% Malnutrition Rates:Village Members 7 per 1000 pop 0.5 Low 24%President is from? Rural Top Salary** Bs 1,700 Moderate9%
Qualifs. Req'd? Yes (?) Severe 2%sources: 1992 census, 1997 municipal census, National Electoral Court, National Institute of Statistics, author's interviews* In order of importance, 1995-99** Highest-paid non-elected official
MBL-ADN
Uses Formal Health Care System
Cen
tral
Loca
l
Edu
catio
n
Urb
an D
ev
Wat
er &
San
Tra
nspo
rt
Agr
icul
ture
Hea
lth
Oth
er
0
20
40
60
Share of Budget
Sector
Figure 2: Public Investment in Charagua
235 Pablo Diego Vaca and David Segundo, community leader and adviser, interview, Yapiroa, 3 April 1997. Local leaders held similar views in rural communities throughout Charagua, including Kapiwasuti,
Charagua
152
2. Local Government Institutions
2.1 The Mayor and the Local Executive Branch
Prof. Luis Saucedo Tapia is a retired schoolteacher originally from Villamontes,
on the southeastern edge of the Chaco in Tarija. He has lived in Charagua since 1967,
working for most of that time in the town’s large educational establishment. A
sympathizer of the center-left MBL party and its brand of politics emphasizing human
rights, rural development, and periodic anti-corruption drives, he became mayor when
the APG nominated him to the top position of the MBL’s electoral list. “The Guaraníes
borrowed a karai236 as candidate for mayor” in order not to scare Charaguan
townspeople, explained the president of the oversight committee. All of the other names
on the list were Guaraní, and the APG made an implicit bargain with the town to control
Charagua through one of them in exchange for the support, or at least restrained
hostility, of the white elite.237 Saucedo agreed with this, explaining that “the town
demanded that the ADN give me their vote in the municipal council. Now they’ve
turned against me because they say I give all the money to indigenous people.”238 But
the countryside continued to support him, he added.
Saucedo was relaxed and patient during various lengthy interviews that spanned
several months. With a thorough grasp of the administration over which he presided, he
easily rattled off population and investment figures, project names and budgets, and
much other municipal information in detail without reference to notes. “Our plan is to
attend to the basic needs of all of the communities first,” he explained, “and then to
invest in productive projects that raise future income.”239 To this effect the
municipality’s 1997 budget prioritized the following areas, in order of importance: (i)
Education – fourteen schools throughout the district; (ii) Health – the Mother and Child
Health Insurance scheme and an anti-chagas program; (iii) Water & Sanitation – a
number of new wells in rural areas; and (iv) several tourism projects and heavy road
maintenance. Saucedo noted that Charagua was investing some 50% of its municipal
budget in human development, compared to the 30% that central government guidelines
recommend. He reported municipal investments in all eight of the sectors about which
Taputamí, Acae and El Espino, among others. 236 Guaraní for white man. 237 Florencio Antuni Sánchez, oversight committee president, interview, Charagua, 1 April 1997. 238 Luis Saucedo Tapia, mayor, interview, Charagua, 1 April 1997. 239 ibid.
Charagua
153
he was questioned, and judged the results obtained so far as good in six of these and bad
in two.
Saucedo was most emphatic about the distribution of resources in his
municipality. “This has undeniably improved since the Popular Participation Law –
there’s no comparison.” He described a planning system which breaks the municipality
into four zones and allocates resources to each strictly by population. Thus Charagua
Norte received Bs.500,000, Charagua Sur Bs.350,000, the Izozo Bs.650,000, and the
town and surrounding Guaraní and Mennonite communities received Bs.900,000. He
then recited the population of each region to prove his point. Within these limits,
specific projects and policy interventions are decided by local meetings in each
community. These agree on local priorities and send a list of each community’s
preferences to the oversight committee and the mayor. The mayor and OC pre-select
which of these projects they will undertake. The municipality then hosts general
meetings in each of the four zones to discuss projects requested, make the final selection,
and establish an investment plan for each. From these meetings the municipal Annual
Operating Plan emerges. This AOP cannot be modified by the municipal council or
mayor alone, and requires a written resolution from community leaders or the OC before
changes can be considered.240
Other local authorities confirmed Saucedo’s outline of the planning system, and
all stressed the high degree of grass-roots participation which made it successful. “Each
zone demands a share of the budget proportional to its population,” the mayor explained.
But it did not end there. “Even after the AOP is finished, some groups want to benefit
always. They send written requests for more projects and stage demonstrations” to voice
their demands. These are analyzed by the mayor, municipal council and OC; they may
lead to reformulations of the entire AOP. Grass-roots leaders are also instrumental in
setting the level and type of community contribution that financing agencies like the FIS,
the World Bank, and others demand, according to the president of the OC. And once the
project is going, “they press for the FIS, the municipality and the contractor to deliver on
their obligations as well.”241
MNR councilman Julián Segundo Chipipi described an atmosphere of
cooperation and accommodation in zonal meetings. “The money of communities that
240 Crispín Solano Menacho, municipal councilman (MBL) and ex-oversight committee president, interview, Charagua, 28 October 1997. 241 Antuni (a), op.cit.

Charagua
154
have already satisfied their needs goes to other communities. They understand this and
are in agreement.”242 “Peasants today aren’t like they used to be,” added the (ADN)
president of the municipal council. “Now they’re learned, able, awake and agile,” and
can easily handle complex negotiations amongst distant communities.243 Despite the
mayor’s protests that this planning system was still new, its results – the municipality’s
AOP – satisfied all of the rural communities that I interviewed in Charagua. Only civic
leaders from the town itself complained that the 1997 AOP represented the
municipality’s wishes and not communities’ greatest needs.244 But this was probably
due to resentment of the shift in resources and priorities away from the town that Popular
Participation had brought about. “It’s the Guaraníes who are most successful in
extracting resources from the municipality,” admitted Saucedo.
The mayor was obviously pleased with his success in Charagua, declaring
merrily, “this system of programming funds is good! It’s right to do things this way.”245
But he also worried that managing the process was stretching his municipal government
to the breaking point. Even though it had increased in size from four to nine employees,
the administration was still too understaffed to provide effective local government to an
area twice the size of Belgium. The mayor had three executive, four operational and two
support staff working for him, plus a few occasional employees hired for specific
projects. The highest qualification required – for the executives – was a high school
diploma, and salary levels were too low to attract technically trained staff from the city.
And to make matters worse, they were building institutional capacity on a non-existent
base. “Before Popular Participation,” said Saucedo, “there were no educational
requirements for hiring people. Any cripple who limped past was given a job.” The
mayor earned a derisory Bs.250/month, and the others less. With no salary, no staff and
no budget to work with, those who served in Charagua’s government were motivated by
a sense of civic duty, not by hopes of what they might achieve.
After decentralization, various central agencies attempted to strengthen the
municipality by installing the SICOPRE and SICOM information systems and training
staff in their use. But the mayor did not hold out much hope for these. “In the end no
one understood the SICOPRE,” he admitted. “And they’re implementing SICOM now,”
242 Julián Segundo Chipipi, municipal councilman (MNR), interview, Charagua, 2 April 1997. 243 Abelardo Vargas Portales, municipal council president (ADN), interview, Charagua, 1 April 1997. 244 Walter García Juárez and Jorge Cortez Romero, community association president and community member, interview, Charagua, 3 April 1997. 245 Saucedo (b), op.cit.

Charagua
155
he added, shrugging. Instead Saucedo opted to hire an NGO called CIPCA (Center for
the Investigation and Promotion of the Peasantry) for institutional development and
technical advice. CIPCA is a left-of-center group formed by politically active university
graduates who had settled in Charagua some years earlier, established their NGO, and
took over the ailing branch of the MBL.246 CIPCA signed a covenant with the mayor to
provide technical support for the formulation of the AOP, advice on relations with rural
communities, and help with administrative development. In practice CIPCA quickly
became involved in most aspects of daily business, helping the government to design
and find financing for projects, formulate its five-year Municipal Development Plan, and
assist in relations with the various national development funds (e.g. FIS). Some local
observers, such as the parish priest Fr. Luis Roma, lauded CIPCA’s role, saying “The
good shape the municipality is in is due to CIPCA. The mayor blindly does what
CIPCA tells him to do.” But others, especially in town, complained that CIPCA’s
influence was too strong, and that it had become a parallel government. The president of
the OC, the man perhaps in the best position to know, countered this, explaining that
CIPCA supported the local planning procedure only, and was not involved in the
decision-making stage.247
But not even Charagua’s careful planning system, nor the widespread goodwill
that it engendered among civic and political leaders, could guarantee success. In order to
multiply his investment budget, the mayor had obtained co-financing for school
construction projects from the FIS. But a number of these suffered delays in late 1996,
and by mid-1997 construction had stopped at ten of them as the FIS sued the contractor
for damages. The mayor, municipal councilmen, and many of the community leaders
interviewed attributed these suspensions primarily to the particularly heavy rains that had
affected the region that year, washing out roads and paralyzing even the trains. The
mayor also cited the contractor’s weak cashflow, which made it unable to operate ten
construction sites simultaneously and led it to demand larger community contributions
than had been initially agreed. In both cases the mayor lay blame squarely at the FIS’
door. He argued that the FIS worked backwards – using the dry season to complete
project paperwork and initiating construction at the onset of the rains; and he complained
that the FIS should never have awarded ten projects to a single firm in the first place,
246 Núñez, op.cit. 247 Antuni (a), op.cit.

Charagua
156
especially one only recently formed and with little experience building schools to FIS
specifications.248
Saucedo was quick to point out that the rest of his investment program had gone
well and was largely completed. But these schools represented one-half of Charagua’s
yearly investment budget, and their interruption froze Saucedo’s budget and crippled his
government. Large swathes of rural Charagua had agreed to expect nothing more from
local government than a school. The projects’ suspension broke local government’s
credibility in the areas affected, and undermined its claim to be focusing resources on
rural problems more generally. Although local authorities such as the District Director
of Education and the president of the OC defended the municipality and accused the FIS
and the contractor of poor planning,249 their view was not shared by all of the grass-roots
leaders I spoke to. At the community level people seemed disillusioned by the turn of
events, and unsure whom to blame for services they’d been promised that were not being
delivered. As time passed and no solution was found the public began to lose patience
with the mayor and his municipal council, and in some quarters opinion turned hostile.
The fact that the Charaguan government retained significant credibility amongst
most of its voters despite these setbacks, and that many civic leaders seemed prepared to
suspend judgment for a time, is probably due to the stark contrast between the MBL
administration and the MNR regime which preceded it. According to Mr Núñez of
CIPCA, “The previous government was absolutely urban – rural communities weren’t
represented…. Its AOPs were drawn up for it by the Office of Municipal Strengthening
in the Prefecture in Santa Cruz. The communities complained that their needs weren’t in
it.” 250 Saucedo paints a much more dire picture of the state of affairs.
The previous government was taking Charagua to the brink of disaster. The FIS could find nothing in Charagua to finance in 1994 and 1995. Finally the municipality began sending money directly to the communities because projects would not materialize. Some spent well, others badly…. This distorted the local idea of what revenue-sharing means.251
But more important perhaps were the purely political elements of government.
“Rolando Gutiérrez [the previous MNR mayor] had serious problems with the
Guaraníes. He had been a policeman here. He was one of those who went to Guaraní
248 Saucedo (a), op.cit. 249 Antuni (a), op.cit.; Oscar Hugo Aramayo Caballero, district director of education, interview, Charagua, 4 April 1997. 250 Núñez, op.cit. 251 Saucedo (b), op.cit.

Charagua
157
villages to demand labor, and if they didn’t comply he beat them and put them in jail.”252
It is thus not surprising that Guaraníes voted overwhelmingly against the MNR, and
were happy to see the party vacate power. I attempted to interview Mr Gutiérrez about
these allegations but he refused to speak.
In the rural communities where most Charaguans live people displayed a lively
pragmatism, judging the mayor and his administration on their performance and little
else. When asked about the legal provision which allowed the municipal council to
overturn the mayor after his first year in office, the common view was that this was
positive and should be freely used if the mayor did not satisfy expectations. According
to the leadership of La Brecha, “This measure is necessary. Municipal projects must
benefit everyone. The municipality either works or it doesn’t work.”253 Respondents in
the community of Yapiroa made the point that “We know how much we’re due from the
Law of Popular Participation – it’s according to our population. If this isn’t disbursed,
then we must get rid of the mayor.”254 Civic leaders in Kapiwasuti, Taputamí and Acae
echoed these sentiments, stressing that the decisive criterion for such decisions must be
municipal performance at the community level, and official responsiveness to
community needs.
And the general view from the communities was that municipal performance had
been at least satisfactory, and for the most part good. Representatives from Kapiwasuti
reported projects in four of the eight sectors queried, and judged all of them good.
“Popular Participation has increased the distribution of money in this municipality….
And the municipality is investing well. They’re not wasting money. These aren’t bad
investments.”255 Leaders from Taputamí held a similar view, reporting investments in
two sectors, both good. The villages of Yapiroa, Acae and El Espino all suffered from
the school suspension debacle, and did not hesitate to express their disappointment. But
despite this, all reported satisfaction with a local government that listened to their needs
and at least attempted to respond to them. The response of El Espino’s leader was
typical, reporting projects in four sectors: three good and one mediocre. But despite the
252 Núñez, op.cit. 253 Francisco Chávez Flores, Delcio Moreno Candia, Mario Arreaga, Andrés Chávez Flores, Vicente Moreno, and Licelio Cuéllar Martínez, community leader, aid to the capitanía, hospital administrator, nursing assistant, school association president and Alto Izozo district deputy, interview, La Brecha, 3 April 1997. 254 Vaca and Segundo, op.cit. 255 Demetrio Caurey and Florencio Altamirano, president of the community irrigation committee and infrastructure officer, interview, Kapiwasuti, 2 April 1997.

Charagua
158
travails of the school, he praised the municipality for responding to a genuine need. “We
chose the school in a community meeting,” he explained, “according to greatest need.
Because there are many students here, and the nearest schools are far away.”256
But perhaps the most surprising response came from the community of La
Brecha. As of mid-1997, this community, the traditional capital of the Izozo region, had
received nothing from its municipal government. And yet local spokesmen lauded the
law and their local government for the schools it had built and the road it had improved
elsewhere in the Izozo. Referring to one school in particular, they said “all of the Izozo
benefits because that school is a nucleus.257 And the road runs the full length of the
Izozo. […] These projects are necessities that emerge from the community itself, which
has prioritized their greatest needs. They’re discussed and analyzed in a community
meeting.”258 They went on to describe how the needs of the entire Izozo were discussed
in a meeting of the region’s civic leaders. Largely because of this consensual process,
the projects that were approved were seen as belonging to the entire region. The local
concept of “community” had expanded to include villages hours away by jeep. “Things
that were never seen before have been seen now,” they enthused. The strong Guaraní
identity, and the social bonds that link Izozeño communities, allowed even a village that
had seen no municipal investment to appreciate local government’s work elsewhere.
By contrast, this attitude was missing amongst the Charaguan townspeople. Of
the five sectors in which they had received municipal investment, they judged one good,
three mediocre, and one bad. Local leaders approved grudgingly of the main public
investments there, a new motor for the electricity generator and the renovation of the
town square, but complained that other urban priorities were being ignored in favor of
investment in rural areas. “Sewerage, domestic gas, street paving, storm drainage, waste
recovery and treatment – they’re all expensive projects and there’s not enough money,”
they groused.259 The fact that their existing public services were far superior to those of
any rural community in Charagua did not prevent them from resenting the investments
the latter received. And when queried about neighborhood construction officers and the
arrangements they’d made for the plaza’s upkeep, they admitted that there was no civic
oversight of project finances, quality, etc., and that maintenance of the plaza would be
the exclusive responsibility of the municipal government. Unlike in the rural
256 Pablo Carrillo and Marcial Arumbari, community leader and officer, interview, El Espino, 4 April 1997. 257 i.e. A “magnet” school accepting students from a large rural area. 258 Chávez, Moreno, Arreaga, Chávez, Moreno, and Cuéllar, op.cit.

Charagua
159
communities, townspeople clearly felt that the municipality belonged to them, its
resources theirs to exploit to their own ends. They did not conceive of local government
as something external with which they had to reach accommodation.
Grass-roots perceptions of larger questions of the effectiveness and equity of
municipal government seemed to proceed directly from communities’ appraisals of its
performance at home. In most communities people noted that decentralization had
brought about improvements in the effectiveness of government that ranged from
modest to large. Community leaders in Copere Brecha, Yapiroa, Acae, Kapiwasuti, El
Espino and La Brecha all reported that municipal government had improved
significantly with the Popular Participation program. The commentary from El Espino
was typical:
Things are much better with Popular Participation, because now we know how much money arrives each year. Before they said ‘There are royalties’ but there was no way to find out [how much] and we never received anything. Now the mayor is closer [to us].260
“Before the money was all for the people in the local administration itself – not even for
the town,” added Israel Romero Macuendí and Florencio Altamirano of Acae. “Now we
have people who know the laws [and can prevent this]. The communities choose the
most important projects.”261 Interestingly, the leaders of El Espino and La Brecha
attributed this wholesale change to the presence of three Guaraníes on the municipal
council. “They control things here. Hence things aren’t done so badly.”262 Other
communities attributed increased municipal effectiveness to procedural changes that
improved responsiveness to local needs. “The municipal government improved a lot
after Popular Participation – now the municipality comes here to meet with the people
and budget resources with them.”263 Spokesmen for other communities agreed, citing
direct contact with and listening to voters as crucial attributes of an ideal mayor.
Of the eleven communities I visited in Charagua, most were fairly or very
satisfied with the quality of their local government generally. Only one – Rancho Nuevo
– complained government was unsatisfactory, saying, “The municipality spends its
259 García and Cortez, op.cit. 260 Carrillo and Arumbari, op.cit. 261 Israel Romero Macuendí and Florencio Altamirano, community leader and community member, interview, Acae, 2 April 1997. 262 Carrillo and Arumbari, op.cit. 263 Vaca and Segundo, op.cit.

Charagua
160
money elsewhere – not here. What it promises remains on paper only.”264 Two
communities, Charagua town and Isiporenda, reported little change in the quality of
government since decentralization. Two communities, Taputamí and La Brecha, were
fairly satisfied with the quality of government. And the remaining six communities were
very happy with municipal government, reporting significant changes since 1994.
Remarks in El Espino were typical: “There are paralyzed schools here – but this is not
the fault of municipal government…. Most people are quite satisfied with the
municipality because they see the works that are being carried out.”265 It is interesting to
note that this summary reflects the deterioration in local perceptions between the first
and second halves of 1997, due mostly to the paralyzed FIS schools. Chávez and the
others in La Brecha, where satisfaction had dropped from high to moderate, summed up
the feelings of many when he said “Up to a year ago things really looked good. But now
we see things differently because the money never arrives. The AOP – which itself is
good – isn’t being executed.”266
From the outside, the mayor and the local executive branch were regarded quite
positively by prominent local observers. Civic and private sector leaders alike praised
the mayor for his honesty, and his hard working and transparent administration. Juan
Carlos Gutiérrez, president of the local branch of the Cattle Ranchers Association of the
Cordillera province, professed satisfaction with the municipality. “Local government
works well as far as we’re concerned. We call the municipality and they respond. The
municipal council and the mayor work well together.”267 Given the very large share of
the local wealth that cattlemen represented, this was an important vote of confidence.
The District Director of Education was even more enthusiastic:
We receive everything that local government can give us. […] In 1995 we got almost nothing from them. In 1996 we got Bs.4 million and this year Bs.3 million more…. This mayor is good because he invests in human capital, including teacher training. He has a great will to do good.268
Fr. Gabriel Sequier, who has worked for decades with poor Guaraní communities in the
region, put it more bluntly still. “The municipality is working here like never before. It
deserves our applause…. The Law of Popular Participation is a blessing from God.”269
264 Luis García and Hipólito Sirari Ena, community founder/adviser to the capitanía, and community leader, interview, Rancho Nuevo, 28 October 1997. 265 Carrillo and Arunbari, op.cit. 266 Chávez, Moreno, Arreaga, Chávez, Moreno, and Cuéllar, op.cit. 267 Juan Carlos Gutiérrez, interview, Charagua, 1 April, 1997. 268 Aramayo, op.cit. 269 Sequier, op.cit.

Charagua
161
The other institutions of local government concurred. Florencio Antuni, the
president of the oversight committee, was enthusiastic about the quality of the local
executive. “Almost everything is being done now. Before 1994 nothing was being done
– the municipality had no money. Now, with a little money from the LPP law, they can
go in search of co-financing from external sources. They can consult communities and
do what the local people want.”270 In a relatively short period of time the mayor and his
staff had proceeded from an initial shock of managing unprecedented resources to the
strategic ability to leverage them in order to obtain central government and external
financing which multiplied the local budget. But Antuni’s praise did not end there.
“The opinions and necessities of the grass-roots are being taken into account here. And
for the Guaraní people this is very important,” a point with which the Izozeño
councilman Julián Segundo Chipipi agreed.271 Both men joined municipal council
President Vargas in declaring that the distribution of resources had improved notoriously
under the present government, using words that echoed the most enthusiastic community
leaders cited above. Regarding specific investment projects, Segundo judged them good
in three sectors and mediocre in two, Antuni good in five sectors and Vargas very good
in five sectors. But Vargas pointed out that institutional weakness was still a significant
problem. “A team of advisers financed externally should come for at least a year and
provide technical and legal advice…. And the municipality needs to pay better salaries
to attract better people – especially technicians and functionaries. They need money …
to hire financial and administrative officers to run the local administration.”272 He
recommended a sort of apolitical municipal civil service which would maintain local
service standards through local and national changes of government.
The mayor himself was sanguine, and even modest, about his role in the
transformation that his municipality had undergone over the previous three years. “In
the beginning no one understood what Popular Participation was – including the
municipality. Now we’re beginning to reap the fruits of the LPP.”273 But he did not
underestimate its importance. He thought decentralization had visibly and “undeniably”
improved municipal government in Charagua. “We see better civil works; the
necessities of the people are being attended to.” Of the 88 communities in the district,
over 50 had received new investment since 1994, and the rest had benefited in other
270 Antuni (a), op.cit. 271 Julián Segundo Chipipi, municipal councilman (MNR), interview, Charagua, 2 April 1997. 272 A. Vargas, op.cit.

Charagua
162
ways, via building repairs, road improvements and the cleaning of public areas. But
more important than the projects were the changes to the process of governance itself:
Now the people that run the show are the common, rural people. Classist principles are being abolished here. Marginalized people are entering the political realm. Before the cattlemen ruled here. Now it’s the indigenous villages and marginalized people who reap most of the benefits of Popular Participation.274
This shift in power relations had permitted a change in the relationship between
government and its citizen-beneficiaries. No longer were rural communities cast in the
role of supplicants, making formal requests to local representatives of a state which
might never deign to answer, for public services which in the best circumstances would
be bestowed deus ex machina upon a grateful populace. Responsive local government
responded to the people by working with them. “The municipality has to help people
with the greatest needs. But we must not be paternalistic. We give but we make
demands as well – that those who benefit work, produce, etc. There must be
counterparts. Nothing should be given freely.”275 And the concept of counterparts was
much broader than community contributions in building materials and projects costs. “If
we build them a school then they must educate themselves.”276 But the mayor kept the
process in perspective, his gaze clearly fixed on his ultimate goal. Charagua had for
decades suffered high levels of poverty and deprivation, with a highly dispersed rural
population mired in a trap of ignorance, endemic diseases such as Chagas and
tuberculosis, and the low productivity of a subsistence economy. His goal was to
increase the human capital of his poorest voters and then invest in public infrastructure to
increase their incomes. “All of these productive projects serve to keep the Guaraníes
from having to beg,” he explained. After much municipal investment, for example,
“Charagua Norte is now producing large quantities of corn.” Change was possible, he
believed. “It all depends on how you invest the money.”
2.2 Municipal Council
Voting patterns in the town of Charagua remained largely stable in the 1995
municipal elections, with the MNR and the ADN vying for first place amongst urban
preferences. But the inclusion of a large rural area into the Charaguan district space
changed municipal voting patterns significantly, increasing the total vote by 140%. The
MBL captured more than half of these new voters, with an especially dramatic surge in
273 Saucedo (a), op.cit. 274 ibid. 275 ibid.

Charagua
163
the Guaraní communities of Charagua Norte and Charagua Sur. This was the motor
which propelled that party from under 10% to over a third of the vote district-wide and a
close 2nd place behind the MNR, increasing its representation on the municipal council
from none to two. Also notable was the MNR’s success in capturing votes in the Alto
and Bajo Izozo regions, which partly compensated for its slump in town on the heels of a
highly unpopular outgoing mayor and a less unpopular national government. Concerned
that the MBL-APG electoral pact would cost it votes in rural Charagua, the MNR had
reached a similar agreement with the Capitanía del Alto y Bajo Izozo (Cabi), the
traditional Guaraní authority for the Izozo region,277 which allowed Cabi to name the
second candidate on the MNR’s electoral list in exchange for official Cabi support. All
of this left the local legislature with two MNR and two MBL councilmen, and one from
the ADN. The latter three easily reached agreement whereby the ADN councilman
supported the MBL candidate for mayor in exchange for the presidency of the municipal
council and the job of Chief Municipal Officer for his son. According to one local
observer, “Vargas behaved well – he was offered money, a farm, and more if he gave his
vote to the MNR for mayor. But he said ‘If I vote for the MNR the town will kill
me.’”278
Abelardo Vargas Portales, the president of the municipal council, was born and
raised in Charagua town. Ex-principle of the rural teacher training school, he has the
gray hairs and serious air of a man who thinks before speaking. Vargas praised the civic
attitude and will to work of his fellow councilmen. “Councilmen don’t wear their
party’s colors,” he said. “They don’t speak of politics. They all want the development
of the community.”279 Councilman Abilio Vaca agreed and developed the point further.
We don’t have sectarian politics here. We work together for the municipality. We take advantage of the parties to move the wheels of government in Santa Cruz if things get stuck there. But there’s no party politics here. It’s all work, progress, and solutions to problems. […] Parties don’t get involved in local affairs. I’m here for the APG, not the MBL.
Vargas extended his praise to the opposition MNR councilmen as well. “There’s
no real opposition on the council – the MNR doesn’t actively oppose us. Outside they
do campaign against other parties, but in the council they work [with us].” This last
276 ibid. 277 Cabi forms part of the APG, though with somewhat older traditions than most of the rest of the APG, as is explained in greater detail below. 278 Fr. Luis Roma, parish priest, interview, Charagua, 29 October 1997. 279 Abelardo Vargas Portales and Abilio Vaca, municipal council president and councilman (ADN and MBL) respectively, interview, Charagua, 28 October 1997.

Charagua
164
point was quite easy to corroborate. Councilman Julián Segundo Chipipi freely admitted
“I was named to this post by the Cabi. I’m not here representing any party.”280 And
Rolando Gutiérrez, the ex-mayor much hated in his own town, had virtually disappeared
from sight and ceased to play an active role in local politics.
Segundo, a Guaraní farmer and civil registrar from the town of Yapiroa, had
never been active in politics until the 1995 election. He explained the dynamic within
the municipal council. “The three Guaraní councilors respond more to their grass roots
[than their respective parties]. They are the ones who demand that the municipality
perform.”281 Behind the closed doors of the council these three cooperated, oblivious to
their party and government-opposition divides, to promote service provision and
investment in Guaraní villages. Councilman Crispín Solano, from the Guaraní village of
Masaki, concurred, citing his own political freedom from the MBL and the absence of
national party-politics in Charagua. “The municipality seeks instead to work with the
APG,” eschewing political intrigue in favor of community development.282
The oft-heard phrase “responding to the grass roots” appeared to be more than a
slogan in Charagua. Segundo and Vargas set out what this signified. “The peasants are
very direct. If they send me a note [containing their demands] and I don’t comply they’ll
kick me out of my job,” said the former.283 But most grass-roots demands were
channeled through the Cabi/APG, which played an important role coordinating requests
and following them up.
There is a good understanding on the part of the Capitanía. They come to see how the projects are going. They send requests [for modifications or new projects] to the municipal council. The council investigates the possibility of approving. [And at the end,] I write a letter of information directly to the capitán.284
Segundo testified that the council listened to such requests carefully and took them
seriously. Vargas agreed, noting that whether civic pressures took the form of official
letters or demonstrations, the council always viewed them as legitimate expressions of
the popular will. The APG (including the Cabi) also coordinated community requests
and pressure of national institutions, including the FIS.
The councilmen’s accounts of their own work were corroborated by community
leaders throughout Charagua. Of the eleven communities questioned, only three
280 Segundo, op.cit. 281 ibid. 282 Solano, op.cit. 283 Segundo, op.cit. 284 ibid.
Charagua
165
reported that the council did not respond to their needs. The other eight expressed
satisfaction with a local legislature which in their opinion listened to and worked for
them. Spokesmen for Kapiwasuti said simply, “councilors respond to the people who
voted for them,”285 and those from Yapiroa, “councilmen are sent to represent us. They
pay attention to us and not to the parties. They do what we want.”286 El Espino
attributed this to the way in which candidates for the council were selected, indicating
that information on the electoral deals that had been struck – and the resulting political
dynamic – had penetrated to the village level in Charagua. Community leaders were
well aware of where they stood vis-à-vis local government, and were eager to exploit
their advantage. “Politicians have opened their eyes and seen that they have to work,”
noted La Brecha. “Their behavior has improved.”287 And in Isiporenda, “The municipal
council’s job is to approve everything that is formally requested by the communities.
The capitanes direct only just requests to the council.”288
Only Isiporenda, Rancho Nuevo and Charagua town expressed dissatisfaction
with the council. “Currently councilmen obey the commands of an NGO and not their
parties nor the people,” García and Cortez from Charagua explained, referring to
CIPCA. They qualified the work of the municipal council as no better than mediocre
“on account of the inexperience of the three Guaraní representatives, not because of bad
will or negligence.”289 Even enthusiastic communities admitted that the councilmen
required assistance. “The council needs to be well advised because the Guaraníes aren’t
well educated and need advice in order not to go backwards,”290 said El Espino.
Charagua town recommended training in planning, legal matters and parliamentary
procedure in order to foster a non-political atmosphere in the council. Other
communities agreed.
Outside government, local authorities also rated the municipal council highly.
Gutiérrez of the cattle ranchers declared that the council worked well and that he was
pleased with it. “One of the councilors is an ex-leader of the cattle ranchers. He clarifies
things for us when necessary,” thus facilitating trust and a smooth flow of
285 Caurey and Altamirano, op.cit. 286 Vaca and Segundo, op.cit. 287 Chávez, Moreno, Arreaga, Chávez, Moreno, and Cuéllar, op.cit. 288 Hilda Ibáñez vda. de Castro and Vidal Durán Sala, community leader and adviser, interview, Isiporenda, 29 October 1997. 289 García and Cortez, op.cit. 290 Carrillo and Arumbari, op.cit.

Charagua
166
information.291 Some esteemed the municipal council more highly than the mayor.
“The council is better than the mayor – it is more equitable because of the Guaraníes and
the presence of Vargas, who is an honest and dependable man,” said the parish priest of
Charagua.292 The mayor and the president of the oversight committee agreed that the
presence of the Guaraní councilors was the key to the council’s effectiveness. Saucedo
echoed the councilors’ thoughts about the absence of party politics in the council,
explaining that the councilmen had made a joint commitment to resign if they
campaigned actively in national elections. “Councilmen respond to the interests of the
region. It’s the ethnic factors that unite them in this way. There are no political
fanaticisms, no frontal fights. This is a stable municipality despite the diversity of its
composition.”293
The dynamic described by prominent local observers, community leaders and
councilmen alike was of a well-organized civil society expressed through representative
and legitimate institutions working closely with the municipal council to detect and
prioritize local needs throughout a large municipal area. This close cooperation, once
established, allowed a process of feedback to develop in which municipal plans could be
constantly reviewed and altered to respond better to changing community conditions.
The policy outputs of this system, in the form of municipal investments, commanded the
respect and enthusiasm of voters even in far-flung communities as citizens felt that their
concerns were being addressed. And where projects were delayed or suspended, the
grass-roots pressure on the municipal council was intense. The obvious question which
presents itself is whether it was necessary for an APG-like institution to virtually take
over local government in order for these favorable dynamics to emerge. We return to
this issue in detail below.
2.3 Oversight Committee
Charagua’s oversight committee was the preserve of the Guaraníes, with seven
of its eight members from rural villages and only one karai, the secretary – an
orthodontist from the town. The president of the OC was Florencio Antuni Sánchez, a
peasant farmer from Acae and member of the MBL. Although he has only a fourth-
grade education, Antuni is an impressive man – rapid, with intelligent eyes and a
speaking style which is direct and succinct. I met him the day after he stepped down as
291 J.C. Gutiérrez, op.cit. 292 Roma, op.cit. 293 Saucedo (b), op.cit.

Charagua
167
president of the APG. He sat sideways in his chair, tilting against the wall and swinging
his legs, and the confidence born of experience was evident in his relaxed and cheerful
air. Unlike other municipalities in Bolivia, where OC presidents often had little relevant
experience, Antuni entered the job with an extensive preparation in leadership,
administration, and politics.
Is the oversight committee active here? “Oh yes – I’m very good,” Antuni said
smiling, and then more seriously, “Up to now there hasn’t been even one letter of
complaint against me. Never – because we work well there aren’t any conflicts.”294 He
went on to describe how the OC met regularly with the full municipal council to discuss
and solve problems that cropped up throughout the municipality. But he also stressed
that there was much room for improvement in the OC’s operation.
The oversight committee has no money, no means for moving about the municipality, etc. Oversight committees should be supported. Most members are peasants who are forced to return to their homes because there’s no money for the OC to carry out its activities.
He explained that the work of the OC requires it to travel throughout the municipality in
order to plan investments, review ongoing projects, and respond to local concerns. In a
municipality the size of Charagua, this implies significant expense just to reach far-flung
communities. But the OC had no budget, its representatives received no salaries, and
there was no vehicle at its disposal. The mayor lent the OC his official car on occasion,
but it was old and unreliable, constantly in use, and lacked the four-wheel drive
necessary to travel around the district during the rainy season. Antuni stressed that the
provision of operating funds for the OC was a key way in which to improve the quality
of local government in Bolivia. His plea found an echo at the grass-roots level. “The
president of the OC is a hidden mayor. He’s given a bigger responsibility than that of
the mayor, but he doesn’t have Bs.1 to do it with,” said Charagua town. “What is he
supposed to eat? He has to leave his work in order to do that job.”295 Interestingly the
central government also agreed, and in mid-1997 decreed that 1% of all devolved funds
should be earmarked for the operating costs of oversight committees.296
The division of the responsibilities of local governance between mayor,
municipal council and oversight committee seemed very clear to Antuni, as was the
power that lay in his hands. “If there’s corruption… then we must get rid of the mayor.
294 Antuni (a), op.cit. 295 Omar Quiroga Antelo, neighborhood council president, interview, Charagua, 30 October 1997. 296 This measure took effect after the research for the present study was completed.

Charagua
168
[…] In the house of the people you cannot take possession of what isn’t yours.”297 He
was not shy about the possibility of confronting the mayor in a direct battle for local
power, if necessary, and confident that he would prevail. This was based on the strength
of his mandate, which in turn depended upon the high degree of legitimacy and
representation of the APG system which selected him. In any local fight for resources or
power Antuni could rely on an organization that reached down into the smallest
community, for support that in principle was comprehensive, unambiguous and
untainted by the horse-trading and compromises of party politics (see below). Antuni
stressed this last point. “Politics screws everything up. The MNR pushed and pressed
town hall about the [restoration of the] plaza. They held loud street demonstrations
about it demanding action.” But nothing came of it. Local people showed little interest,
spurning public meetings called by the party, and the MNR’s claims to voice local anger
were shown to be nothing more than politiquería.298 In Antuni’s opinion, the apolitical
nature of the OC system of representation was one of the keys to its success, at least in
Charagua.
At the grass-roots level Charaguans testified to the importance of the work of the
oversight committee for effective local government, and vouched for the quality of the
previous OC leadership, but were divided in their judgment of the current OC. Taputamí
and Isiporenda were most positive. “The OC does work here – it does oversee municipal
funds. Requests from the community to change projects are taken up by the OC and
reviewed with the mayor. Then they meet with the municipal council to make a
decision.”299 Other communities, while lauding the work of the previous OC, noted that
the current leadership had not yet made its weight felt. “The OC has stumbled this year
– it doesn’t report on municipal expenditures like an OC should,” complained the leaders
of Antuni’s village of Acae.300 El Espino concurred but refused to condemn the OC,
noting that “the current OC is still new – only two months old,” and it was still too early
to judge.301 Kapiwasuti, Yapiroa and Charagua Station agreed that the current OC had
not yet reached the standard set by the previous one. But the leaders of El Espino put
this issue in perspective. “Before 1995 there was no OC – and the municipality paid no
attention to us then.” Even if the current OC was not yet fully satisfactory, its very
297 Antuni (a), op.cit. 298 “Playing politics” in Spanish. 299 Josué Aiduare and Florencio Aiduare, community leaders, interview, Taputamí, 2 April 1997. 300 Romero and Altamirano, op.cit. 301 Carrillo and Arumbari, op.cit.

Charagua
169
existence gave rural communities additional weight in the competition for public
resources.
At the other end of the spectrum, Charagua town and La Brecha agreed that the
previous OC had been effective but condemned the inaction of the current one. “It does
not work,” said Charagua.302 La Brecha saw evidence of a sinister dynamic behind the
OC’s declining effectiveness. Alleging that the OC president was a member of the
ADN, and its vice-president a member of the MBL, they accused the OC of conspiring
with the mayor and municipal council to ignore community requests and cover up local
complaints. Instead of representing rural communities during the last round of
participative planning to draw up the AOP, “the OC became a supporting agency for the
mayor’s office…. The parties have become so powerful that they have been able to co-
opt civil society,” they explained. “The APG is being undermined here by
politicization.”303 Such a development would be serious, with the potential to undermine
accountability in local government. But this accusation was not voiced by any other
respondents that I interviewed in Charagua. And indeed, with Guaraníes appointed by
the APG and Cabi in majority on the municipal council,304 it is difficult to conceive of
political parties conspiring to co-opt the OC in order to have it collaborate with
municipal government against the interests of Guaraní villages. In Charagua, the co-
opting would seem to have worked in the opposite direction.
Other local authorities had a favorable opinion of Antuni and the work of his OC.
Mayor Saucedo weighed in without reservation:
The OC is working well, without problems. It’s structuring itself better in order to meet more often. And its members are receiving training…. They have many criticisms [of investment projects] and demand modifications. But they don’t have the money to comply with their obligations – especially to mobilize themselves…. The bureaucracy thinks they’re peons whose time is free.305
Gutiérrez affirmed that the cattle ranchers worked well with the OC, a sentiment which
Antuni reciprocated. Councilman Vargas described the OC as an effective body.
“They’re Guaraní –” he explained meaningfully, “they’re vigilant and they watch over
things.”306 He noted that the OC had not fought with the municipal council yet, and
ascribed this to the presence on the council of three Guaraníes, whose strong cultural
302 García and Cortez, op.cit. 303 Francisco Chávez, Alberto Rodríguez and Ignacio Álvarez, community leader, adviser to the capitanía grande, and community member, interview, La Brecha, 28 October 1997. 304 And Guaraníes who were so openly disdainful of their party affiliations. 305 Saucedo (b), op.cit. 306 A. Vargas, op.cit.

Charagua
170
tendency was to reach consensus at any cost in order to avoid open conflict (see below).
Saucedo was eager to promote the institutions he judged necessary for good government,
but unsure how to approach the problem of the OC. “If you don’t give them money
they’re against you,” he pointed out, “but if you do they’re beholden to you.”307
Other observers mentioned the deterioration in OC performance noted above.
“The OC is not so active lately,” said councilman Segundo. “Their presence hasn’t been
in evidence.”308 Chief Municipal Officer Vargas agreed with this assessment, and noted
a quiet shift in the institutional dynamic of the town. “The Guaraníes are in the majority
here, and named a Guaraní directorate of the OC. But they’re uneducated peasants and
hence timid and unchallenging before the municipal government.”309 Concerned that
their interests were being ignored by the OC, and seeking a voice of their own with
which to address the municipality, the nine neighborhood councils of Charagua and
Charagua Station joined to form the Community Association. This was a new
institutional interlocutor with no standing in law, but one which nonetheless proved
adept at representing urban Charagua’s concerns. “The Community Association is more
active in meeting with the mayor and asking what’s going on,” said the Chief Officer.
“The OC has allowed its functions to be usurped by the Community Association. […]
The town is dominating the participatory element of the Law of Popular Participation.”
This Association thus afforded Charaguans a tool with which to redress the rural bias
that they felt themselves subjected to. It is interesting to note that the system of local
government established by Bolivian decentralization was sufficiently flexible to allow
for the emergence of new institutional forms to fill the vacuums of representation and
voice that might occur from time to time.
Interestingly, the role of the oversight committee in the institutional dynamic of
Charagua’s local government can be summarized by two semi-contradictory facts. The
first is that in the OC, as opposed to the municipal council, Guaraní leaders did not feel
the need to disguise their preponderance behind a white figurehead in order to comfort
the urban elite. They regarded the OC, built on a foundation of grass-roots
organizations, as their natural habitat and simply took it over. They felt no need to
compromise on its administration or the form that social representation took. This was
not true of the mayoralty nor the municipal council, with their urban seats, political
307 Saucedo (b), op.cit. 308 Segundo, op.cit. 309 Roberto Vargas, chief financial officer, interview, Charagua, 30 October 1997.

Charagua
171
parties, and electoral campaigns, which were claimed by the town and seemed alien to
many Guaraníes. This view was repeatedly confirmed to me by rural leaders,
independent urban observers and other local authorities, who acknowledged the OC as
“theirs” and saw the three indigenous councilors as a natural bridge between “them” and
the council. It was also confirmed by the complete absence of Mennonite participation
in OC activities, elections, etc, and by the urban neighborhoods’ decision to break away
from the OC and form a separate body. Indeed, the identification of the OC with
Guaraní interests explains why non-Guaraní spokesmen in Charagua had so little to say
about it, and sought separate, parallel channels of influence over local policy-making.
The second, more striking, fact is that the need for an OC dominated by rural
Guaraní-dwellers was low in a municipality like Charagua. The presence of three
Guaraníes amongst the five councilmen, and a mayor selected by the Guaraní People’s
Association, ensured that the interests of the indigenous rural majority would be well
represented in local government even without the participation of the OC. In an
institutional framework built around checks and balances,310 the role of the OC was
essentially oppositional, based on the power to hobble municipal finances if the OC
disagreed with local government decisions. As a representational vehicle it was
structurally different from the mayor and municipal council, and intended to give voice
to groups under-represented therein. But there was little scope for such opposition in a
municipality in which the OC and municipal council were both rooted in the social
network of the APG. This eliminated many of the key functions of the OC, rendering it
in these respects redundant. The conspiracy theory voiced above by residents of La
Brecha is probably due to this phenomenon, and not to any political party’s success in
manipulating the organs of local government. In this respect the efficacy of the OC in
Charagua, while interesting in the abstract, was at best a second-order concern.
2.4 National and Departmental Government
Unlike Viacha, Charagua’s status as the second municipality in the Cordillera
province did not merit a sub-prefect, nor other direct representative of the departmental
government.311 The highest central government representatives resident in town were
the district directors of education and health. Satisfied with local government’s focus on
310 James Madison, Alexander Hamilton and John Jay, The Federalist Papers, NY: New American Library, 1961. See especially no.10. 311 Departmental prefects, named directly by the president, are essentially central government authorities (see above).

Charagua
172
investment in primary health and education, both authorities professed good relations
with the municipality individually and throughout their respective sectors. “The
municipality…supports us paying salaries, supplying personnel, and helping with the
costs of the hospital,” said Dr. Wilfredo Anzoátegui Vaca.312 No conflicts between local
and departmental or national government were evident in either sector. Local
community leaders supported this view and went further. When questioned about the
change in national (and departmental) governments after the 1997 election, spokesmen
from throughout the district replied that there had been no effect on the day-to-day
operations of local government. “We have seen no difference since the change of
government,” affirmed La Brecha, reflecting the near-universal view that the national
politics simply did not matter for local affairs. Of the eleven communities visited, only
Rancho Nuevo dissented, saying “It’s politics as usual – we’d like to change to an ADN
mayor so things work better than with the MBL one we have now.”313 But his omission
of any specific failures of coordination implied that this was a general impression based
on expectations or even political bias, and not a complaint founded in experience.314
Amongst local government authorities – those in the best position to know – the
view that little had changed prevailed. Councilmen Vaca, Vargas and Solano all
asserted that “things are the same after the change of government. Popular Participation
is working the same.”315 It is telling that these three represented both the incoming
(nationally) ADN and outgoing MBL parties. Vaca and Vargas went further, accusing
the prefecture of ignoring Charagua, a charge echoed by Edgar Gutiérrez, leader of the
local ADN, who testified that his local work was quite unsupported by the ADN prefect
in Santa Cruz.316 The mayor provided a more nuanced view of the state of affairs,
explaining
There have been few concrete changes, but relations with the prefecture have improved [since the change of government]. Before the MNR waged war on us because of our alliance with the ADN.317 But the new ADN prefect has pledged not to treat us as opposition despite being MBL.318
312 Dr. Wilfredo Anzoátegui Vaca, hospital director, interview, Charagua, 30 October 1997. 313 García and Sirari, op.cit. 314 The speaker admitted to campaigning in the past for the ADN and being a banzerista (a supporter of the ADN then-president). 315 Vargas and Vaca, op.cit. 316 Edgar Gutiérrez Hurtado (a), ADN chief, interview, Charagua, 28 October 1997. 317 Bolivian politics traditionally divides into two groups centered on the MNR on one hand, and the ADN on the other. The two parties can fairly be said to despise each other. 318 Luis Saucedo Tapia (c), mayor, interview, Charagua, 27 October 1997.

Charagua
173
“The ADNistas made a lot of noise after the national election and turned up wanting to
govern,” added Antuni. “But they were told that for that they have to win local
elections, and from then on they were quiet.”319
These political (non-)dynamics took place in a deeper context of the relative
power and legitimacy of local and regional governments respectively. And on this point
Charaguan opinion was unanimous. “Municipal government is autonomous and free of
the prefecture,” explained Solano. “The prefecture is not a departmental government
because it’s not elected, unlike local government.”320 Vaca and Vargas agreed. “The
municipality is autonomous – no outside authority can impose itself on it. It’s never
happened.”321 Opinion in the villages was both informed and in agreement. “The
municipality is stronger,” was the response of Isiporenda, typical of the eleven
communities, “it’s based on elections.”322
3. Local Civil Society
3.1 Private Sector
With nothing else to sustain the local economy but teacher-training schools and
small-scale commerce, cattle-ranching and the private sector are synonymous in
Charagua. The Cattle Ranchers Association of the Cordillera province (AGACOR)
represents the ranchers of Charagua and neighboring districts. AGACOR has 200-250
members, each with an average of 2500 hectares; collectively AGACOR claims some
50,000 head of cattle, and controls over a half-million hectares of land. In addition to a
voice for ranchers’ interests locally and regionally, AGACOR is a self-help group
dedicated to providing ganaderos with technical assistance and disseminating best
practice amongst them. One of its most important programs in 1997 was a campaign to
eradicate hoof-and-mouth disease. Juan Carlos Gutiérrez, president of the local branch,
assured me that the Cordillera would be the first region in Bolivia to accomplish this,
and to this end AGACOR was working with local ranchers whether they were members
of the organization or not. He went on to explain that the region’s cattle were grass-fed
and hormone-free. “Our meat is ecological,” he said, with evident pride.323 But there
were also dark clouds on the ranchers’ horizon, as Pedro Ribera of AGACOR’s
319 Florencio Antuni Sánchez, oversight committee president, interview, Charagua, 30 October 1997. 320 Solano, op.cit. 321 Vargas and Vaca, op.cit. 322 Ibáñez and Durán, op.cit. 323 J.C. Gutiérrez, op.cit.
Charagua
174
directorate explained. “With MERCOSUR the meat market will open up, and we will
face competition from better quality and cheaper meat. And we face high interest rates
and a high cost of transport here.”324 Business was set to become considerably more
difficult for the cattlemen.
Although it was generally agreed that the cattle ranchers were predominantly
ADNistas, they were known for supporting all of the main political parties, donating
cows during electoral campaigns for candidates to serve up at political bar-b-que rallies.
“Even the MBL gets cattlemen’s support for their churrascos,” said Antuni.325 In the
same catholic spirit, Gutiérrez declared his support for distributing municipal resources
evenly throughout the district. “All of Charagua benefits from rural schools and roads –
the town should not get everything.” But he hinted that the authorities were not taking
advantage of their resources as they could. “They need to learn how to leverage their
funds, to turn twenty into 100. We need strategic associates for community
development.”326
Under Gutiérrez’s leadership, AGACOR sought to be one such partner,
contracting to drill wells in rural areas for the municipality for significantly less than
commercial drillers charged. “In 1996 we hired a private company to drill and lay pipes
for us,” the mayor reported, “for about Bs.100,000 [per well]. This year the cattle
ranchers are doing the same for Bs.35,000 each.”327 “We’ve had success recently
drilling wells at 60-120 meters in a region where the experts said there was no water
above 300 meters,” Gutiérrez smiled, explaining that they developed this expertise
providing technical aid for AGACOR members. “This ‘Dry Chaco’ is a myth.”328, 329
But Gutiérrez’s vocation stretched beyond the mayor’s finances. “One way we help
indigenous people is by drilling wells for them. I told the mayor to ask for anything and
we’ll give it to them.” Gutiérrez’s offer was certainly generous. But it also denoted the
“gift” logic of public action that the ganaderos espoused, which was born in and
reinforced the traditional relationship of dependency between ranchers and Guaraníes.
324 Prof. Pedro Fidel Ribera Caballero, member of the directorate of AGACOR, interview, Charagua, 30 October 1997. 325 Antuni (b), op.cit. 326 J.C. Gutiérrez, op.cit. 327 Saucedo (b), op.cit. 328 J.C. Gutiérrez, op.cit. 329 The region denoted as the “Dry Chaco” is accepted widely throughout Bolivia.
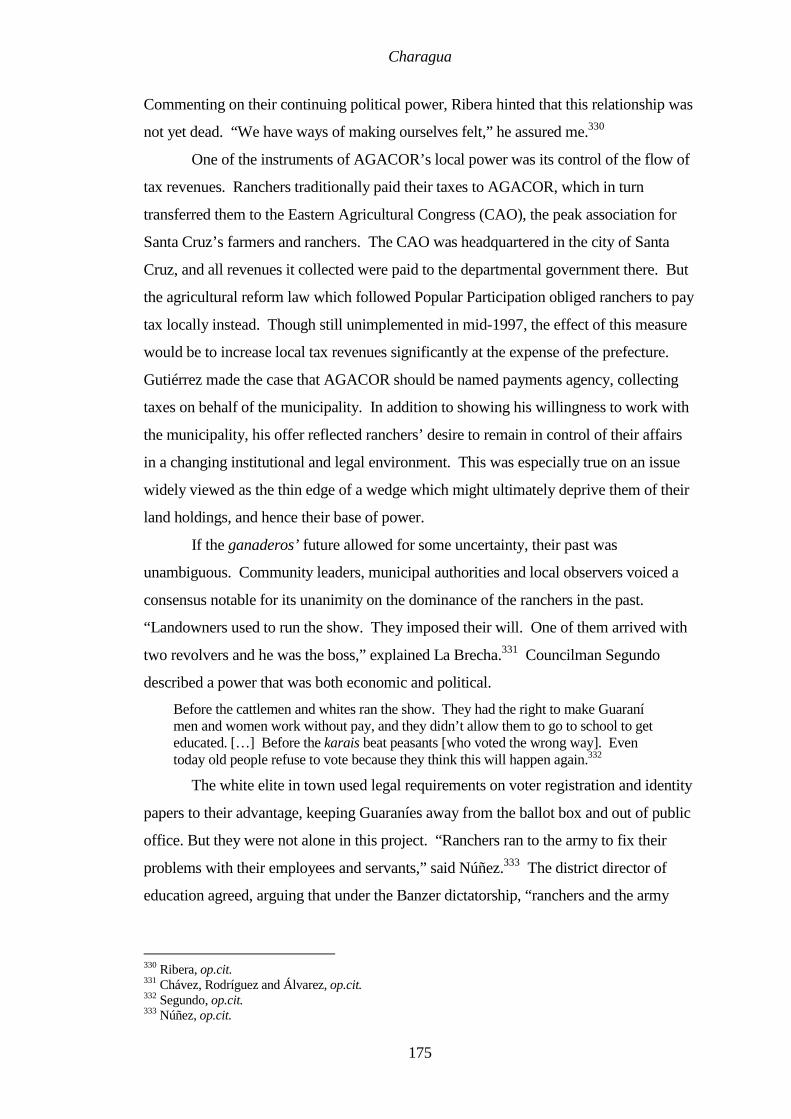
Charagua
175
Commenting on their continuing political power, Ribera hinted that this relationship was
not yet dead. “We have ways of making ourselves felt,” he assured me.330
One of the instruments of AGACOR’s local power was its control of the flow of
tax revenues. Ranchers traditionally paid their taxes to AGACOR, which in turn
transferred them to the Eastern Agricultural Congress (CAO), the peak association for
Santa Cruz’s farmers and ranchers. The CAO was headquartered in the city of Santa
Cruz, and all revenues it collected were paid to the departmental government there. But
the agricultural reform law which followed Popular Participation obliged ranchers to pay
tax locally instead. Though still unimplemented in mid-1997, the effect of this measure
would be to increase local tax revenues significantly at the expense of the prefecture.
Gutiérrez made the case that AGACOR should be named payments agency, collecting
taxes on behalf of the municipality. In addition to showing his willingness to work with
the municipality, his offer reflected ranchers’ desire to remain in control of their affairs
in a changing institutional and legal environment. This was especially true on an issue
widely viewed as the thin edge of a wedge which might ultimately deprive them of their
land holdings, and hence their base of power.
If the ganaderos’ future allowed for some uncertainty, their past was
unambiguous. Community leaders, municipal authorities and local observers voiced a
consensus notable for its unanimity on the dominance of the ranchers in the past.
“Landowners used to run the show. They imposed their will. One of them arrived with
two revolvers and he was the boss,” explained La Brecha.331 Councilman Segundo
described a power that was both economic and political.
Before the cattlemen and whites ran the show. They had the right to make Guaraní men and women work without pay, and they didn’t allow them to go to school to get educated. […] Before the karais beat peasants [who voted the wrong way]. Even today old people refuse to vote because they think this will happen again.332
The white elite in town used legal requirements on voter registration and identity
papers to their advantage, keeping Guaraníes away from the ballot box and out of public
office. But they were not alone in this project. “Ranchers ran to the army to fix their
problems with their employees and servants,” said Núñez.333 The district director of
education agreed, arguing that under the Banzer dictatorship, “ranchers and the army
330 Ribera, op.cit. 331 Chávez, Rodríguez and Álvarez, op.cit. 332 Segundo, op.cit. 333 Núñez, op.cit.

Charagua
176
divided up [public] lands between them according to their taste and pleasure.”334 And
they availed themselves of the local institutions as well. “Local power was in the hands
of three or four families that occupied all of the ‘spaces of power’ locally – the electricity
and water cooperatives, the television station, and AGACOR.”335 Through their control
of resources, political power and local institutions, the landowning elite acquired a
stature that tended to legitimize and perpetuate their position.336 “The people saw them
as [natural] leaders too.”337
But the twin forces of economics and the socio-political emergence of the
Guaraníes from what Albó describes as a sort of spiritual exile338 conspired to change
the Charaguan panorama. Roma explained that the ranchers continued to exercise
power,
but much less aggressively than before. It’s less visible here than in the Beni, for example. This is because the profitability of their farms is much lower. Farming is only feasible on a large scale now. So the sons of the ganaderos go to the city [instead of staying on the farm]…. The triangle of power – jobs, power, money – has been broken.339
The ranchers’ decline is mirrored in that of their traditional political vehicle as
well. “The MNR used to dominate also, but as it has lost power so has that old class.”340
Though Roma argues that these changes began well before the LPP, the law contributed
to them and earned the landowners’ enmity. Respondents from the villages agreed that
the ranchers’ dominance was over. “Here anyone who wants to order others around is
chased out,” announced La Brecha triumphantly, “Huasca!”341 But respondents differed
on the origins of their decline. Many, such as Kapiwasuti and La Brecha, dated it to the
Chaco war, which opened the door of a closed society and its ways to a huge influx of
people from distant parts of Bolivia. Others, such as El Espino, thought the change
happened later. “Very recently this has finished – because of people in the communities
organizing themselves. Now the people don’t go out to the ranches to work
anymore.”342 But there was widespread agreement that both the landowning elite no
334 Aramayo, op.cit. 335 Núñez, op.cit. 336 Albó, op.cit., pp.19-31 and 332-338. See also Kevin Healey, Caciques y Patrones: Una Experiencia de Desarrollo Rural en el Sud de Bolivia, Cochabamba:CERES, 1982, and Francisco Pifarré, Los Guaraní-Chiriguano: Historia de un Pueblo, La Paz:CIPCA, 1989. 337 Núñez, op.cit. 338 Albó, op.cit. 339 Roma, op.cit. 340 ibid. 341 Chávez, Rodríguez and Álvarez, op.cit. 342 Paul Carrillo, Ricardo Melgar and Marcial Arumbari, community leader, community member, and community officer, interview, El Espino, 31 October 1997.

Charagua
177
longer held the town in its grip, and the interests of the Guaraníes were now effectively
safeguarded by the APG and its representatives in local government. The Law of
Popular Participation had contributed to and accelerated this dynamic, but the
fundamental change in the power structure was underway from well before 1994.
Antuni summed things up with three illustrative facts.
(i) It would be difficult for someone to force you to chop wood for him these days. Before you had to chop five meters of wood in exchange for a piece of bread and an ounce of coca leaf. […] (ii) People no-one thought would ever enter town hall now sit on the municipal council. […] (iii) Cuéllar, Gutiérrez, Pantoja and García [the most prominent cattlemen] no longer rule the roost. Now they’re my friends – or at least I don’t have problems with them.343
The new Charagua incorporated all of its inhabitants, rich and poor, into its
political life, and the various actors treated each other with civility and even respect. The
private sector appeared eager to work with local government on projects for the common
good, and publicly elected and accountable officials, not ranchers, were the final arbiters
of local policy and the use of resources. The list of practices and abuses that were
commonly accepted before and had now disappeared was a long one, but perhaps the
most telling change in Charagua was in the general climate of relations between
townspeople and villagers. This change was both difficult to characterize and obvious
and pervasive even to the unaccustomed eye. “The ganaderos lead on initiatives
because they have money – for any initiative the town knocks on their door. But they
don’t impose themselves on Charagua,” assured Lt.Col. Villaroel, commander of the
local garrison. “Town hall runs things now.”344 And Gutiérrez added,
We’ve had a few problems with the APG over land rights. When the land reform law came into force there was confusion on both sides. But problems were resolved through talk, through negotiation…. Keeping the peace here is priceless.345
“Here there are many ganaderos who are Guaraníes or mixed,” he continued, explaining
that AGACOR and the APG had good reason to get along well. And for good measure,
“It’s as if everyone was a millionaire here – you can drink a beer and a humble person
sits down next to you and speaks to you, just like that.”
3.2 Political Parties and Elections
The political topography of Charagua before decentralization was relatively well-
defined, according to local political leaders. The MNR was “the party of the old guard –
343 Antuni (b), op.cit. 344 Lt.Col. Fair Eduardo Villaroel, army garrison commander, interview, Charagua, 2 April 1997. 345 J.C. Gutiérrez, op.cit.

Charagua
178
old professors, old cattlemen. Some Guaraníes are grateful for 1952346 and still vote
MNR in the communities.”347 The party was highly centralized, with local candidates
named directly by departmental leaders in Santa Cruz. Cattle ranchers dominated the
ADN, electing local leaders from amongst their senior figures. Some rural communities
were allowed to name candidates directly (a dedo) onto the lower parts of the list.348
The MBL, the insurgent which upset the ruling duopoly, was a traditional also-ran in
Charagua, depending for its support on the goodwill generated by rural NGOs associated
with it. It was able to advance beyond the third rank of local politics when a new
generation of MBL leaders arrived from Santa Cruz to displace an entrenched and
ineffective cupola.349 They revitalized the party by holding meetings with
representatives of Guaraní areas, and inviting them to name from amongst themselves
the top candidates to the MBL electoral list (see above).350 Thus a movement that began
in dialogue ended taking over local government. The other national and regional parties,
including Condepa, MIR and the UCS, commanded little support locally, and were not
serious contenders for power.
Although the MNR consistently won three of five seats on the local council, it
traditionally eschewed internal elections, leaving little room for local activists or the
development of local leadership. The head of the local branch of the MNR in mid-1997
was Nelson Eguez Gutiérrez, a native of the town who was unemployed at the time.
Santa Cruz always wants to order us around. I proposed that the local commando designate candidates directly, but Santa Cruz named the ex-mayor [Rolando Gutiérrez] instead. I tried to get rid of him but couldn’t – that’s why we lost so many votes…. People don’t like the MNR candidate.351
Cattle ranchers and businessmen were also kept at arm’s length. Some donated money
or lent vehicles for campaigns, but there was no consultation with private interests for
the selection of MNR candidates. Eguez blamed this political arrogance for the party’s
disastrous performance throughout the province in the last elections. What the party lost
in this way it then tried to recoup through bribery, offering the ADN an alleged $30,000
for supporting the MNR candidate in the municipal council. But the local ADN leader
346 The 1952-53 revolution and subsequent agrarian reform. 347 Quiroga, op.cit. 348 ibid. 349 Núñez, op.cit. 350 Quiroga, op.cit. 351 Nelson Eguez Gutiérrez, local leader of the MNR comando, interview, Charagua, 30 October 1997.
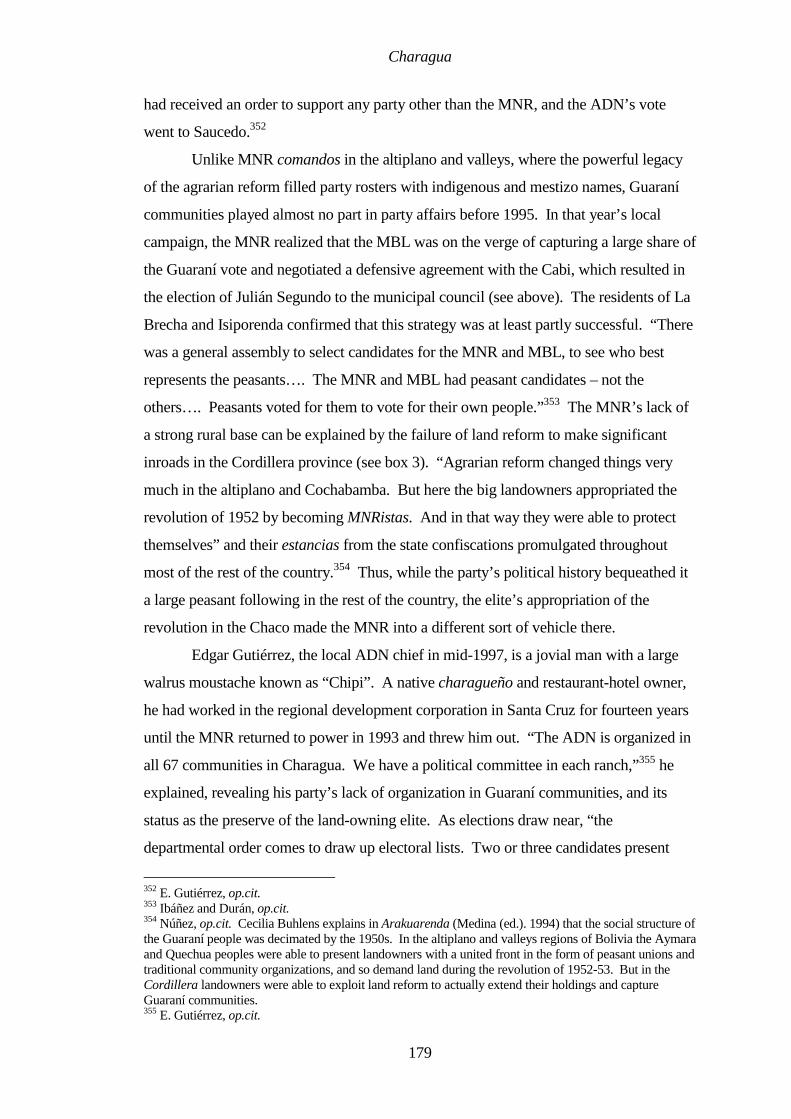
Charagua
179
had received an order to support any party other than the MNR, and the ADN’s vote
went to Saucedo.352
Unlike MNR comandos in the altiplano and valleys, where the powerful legacy
of the agrarian reform filled party rosters with indigenous and mestizo names, Guaraní
communities played almost no part in party affairs before 1995. In that year’s local
campaign, the MNR realized that the MBL was on the verge of capturing a large share of
the Guaraní vote and negotiated a defensive agreement with the Cabi, which resulted in
the election of Julián Segundo to the municipal council (see above). The residents of La
Brecha and Isiporenda confirmed that this strategy was at least partly successful. “There
was a general assembly to select candidates for the MNR and MBL, to see who best
represents the peasants…. The MNR and MBL had peasant candidates – not the
others…. Peasants voted for them to vote for their own people.”353 The MNR’s lack of
a strong rural base can be explained by the failure of land reform to make significant
inroads in the Cordillera province (see box 3). “Agrarian reform changed things very
much in the altiplano and Cochabamba. But here the big landowners appropriated the
revolution of 1952 by becoming MNRistas. And in that way they were able to protect
themselves” and their estancias from the state confiscations promulgated throughout
most of the rest of the country.354 Thus, while the party’s political history bequeathed it
a large peasant following in the rest of the country, the elite’s appropriation of the
revolution in the Chaco made the MNR into a different sort of vehicle there.
Edgar Gutiérrez, the local ADN chief in mid-1997, is a jovial man with a large
walrus moustache known as “Chipi”. A native charagueño and restaurant-hotel owner,
he had worked in the regional development corporation in Santa Cruz for fourteen years
until the MNR returned to power in 1993 and threw him out. “The ADN is organized in
all 67 communities in Charagua. We have a political committee in each ranch,”355 he
explained, revealing his party’s lack of organization in Guaraní communities, and its
status as the preserve of the land-owning elite. As elections draw near, “the
departmental order comes to draw up electoral lists. Two or three candidates present
352 E. Gutiérrez, op.cit. 353 Ibáñez and Durán, op.cit. 354 Núñez, op.cit. Cecilia Buhlens explains in Arakuarenda (Medina (ed.). 1994) that the social structure of the Guaraní people was decimated by the 1950s. In the altiplano and valleys regions of Bolivia the Aymara and Quechua peoples were able to present landowners with a united front in the form of peasant unions and traditional community organizations, and so demand land during the revolution of 1952-53. But in the Cordillera landowners were able to exploit land reform to actually extend their holdings and capture Guaraní communities. 355 E. Gutiérrez, op.cit.

Charagua
180
themselves and party members vote…. About twenty people go to meetings to elect
candidates,” he explained, describing the cozy atmosphere in the local party. “There’s
not much rivalry within the ADN – not much competition.”
But Gutiérrez also complained of a complete lack of support at the departmental
level. “Santa Cruz sent no money [for internal elections]. I had to finance it all myself.”
And as if to rub in his lack of resources, “then our second candidate switched to the
MNR for $300 plus a job at ENFE [the national railroad corporation].” The regional
party’s neglect of its Charaguan branch stretched well beyond the setting of electoral
lists. “There’s little contact between them and us. We have to go to Santa Cruz to
inform ourselves of what’s going on.” The problem continued even into elections.
“They sent us $600 for national elections. But you need at least $3000 for good results.”
Other parties sent considerably more. Gutiérrez was very disappointed that the Santa
Cruz leadership did not get involved with the local party or the municipality, and did not
manage to pay him a “decent” salary for his efforts. “Now I’ll be corregidor356 and will
earn Bs.1300/month. I have a daughter studying in Santa Cruz and another who leaves
next year,” he said plaintively, explaining why he could not afford to retain his political
independence.
It was perhaps Gutiérrez’s disappointment that led him to a surprising
conclusion. “The MNR knows how to govern. We do not. Look now! Nothing’s
happening,” he said, referring to the newly elected ADN president. “The government
hasn’t changed anyone yet in the local institutions. I’ve traveled to Santa Cruz to speak
to the prefect and leave lists [of names] with him, but all the same people are still
working in health, education, etc.” So the smiling “Chipi” revealed his conception of
politics as a naked game of power and patronage, where political tribes compete to gain
control of government in order to share out its resources amongst themselves. And his
tribe was a white tribe, and the game was tinged with racism. He freely referred to his
party’s electorate as “we the white people”.357 And he complained that
CIPCA teaches the peasants not to deal with whites – to fight the whites. There’s going to be a conflict here. Money comes to the MBL from outside. No one controls this. The priests are also MBL to the death. The professors are almost all MBL. That’s why we must change the people in local institutions!
356 Literally chief magistrate, usually a departmental official. The corregidor in Charagua is a municipal employee. 357 “Nosotros los blancos.”
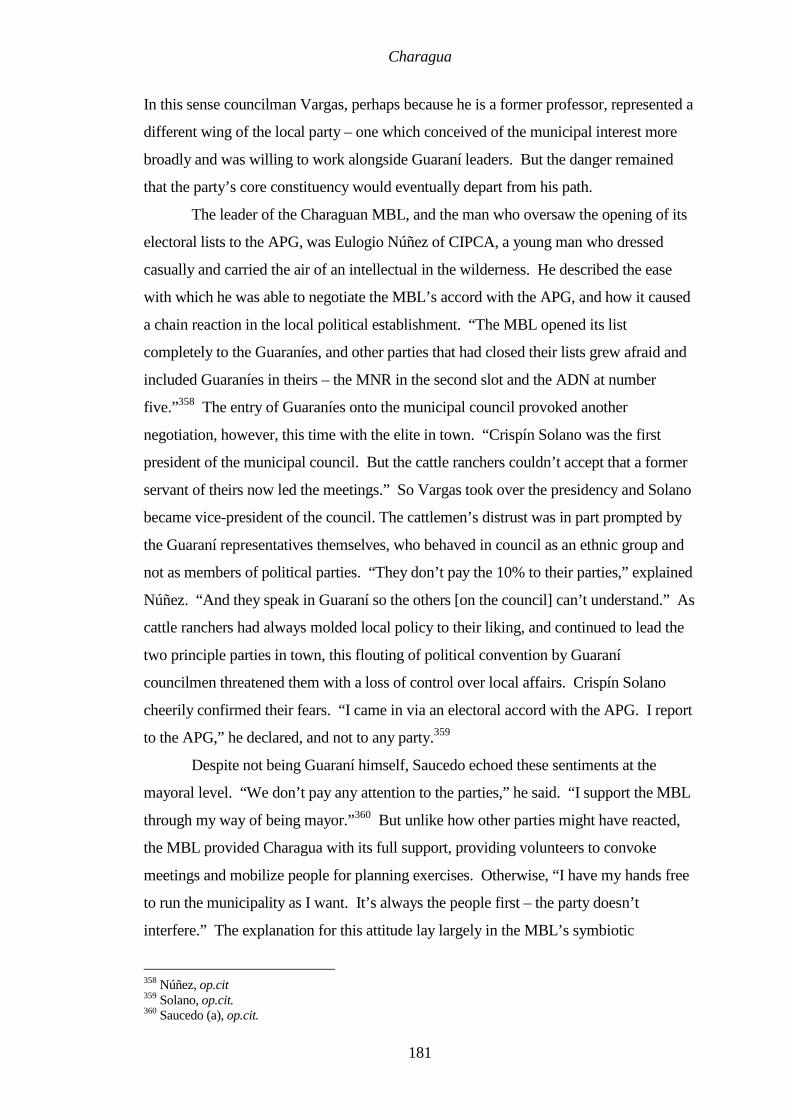
Charagua
181
In this sense councilman Vargas, perhaps because he is a former professor, represented a
different wing of the local party – one which conceived of the municipal interest more
broadly and was willing to work alongside Guaraní leaders. But the danger remained
that the party’s core constituency would eventually depart from his path.
The leader of the Charaguan MBL, and the man who oversaw the opening of its
electoral lists to the APG, was Eulogio Núñez of CIPCA, a young man who dressed
casually and carried the air of an intellectual in the wilderness. He described the ease
with which he was able to negotiate the MBL’s accord with the APG, and how it caused
a chain reaction in the local political establishment. “The MBL opened its list
completely to the Guaraníes, and other parties that had closed their lists grew afraid and
included Guaraníes in theirs – the MNR in the second slot and the ADN at number
five.”358 The entry of Guaraníes onto the municipal council provoked another
negotiation, however, this time with the elite in town. “Crispín Solano was the first
president of the municipal council. But the cattle ranchers couldn’t accept that a former
servant of theirs now led the meetings.” So Vargas took over the presidency and Solano
became vice-president of the council. The cattlemen’s distrust was in part prompted by
the Guaraní representatives themselves, who behaved in council as an ethnic group and
not as members of political parties. “They don’t pay the 10% to their parties,” explained
Núñez. “And they speak in Guaraní so the others [on the council] can’t understand.” As
cattle ranchers had always molded local policy to their liking, and continued to lead the
two principle parties in town, this flouting of political convention by Guaraní
councilmen threatened them with a loss of control over local affairs. Crispín Solano
cheerily confirmed their fears. “I came in via an electoral accord with the APG. I report
to the APG,” he declared, and not to any party.359
Despite not being Guaraní himself, Saucedo echoed these sentiments at the
mayoral level. “We don’t pay any attention to the parties,” he said. “I support the MBL
through my way of being mayor.”360 But unlike how other parties might have reacted,
the MBL provided Charagua with its full support, providing volunteers to convoke
meetings and mobilize people for planning exercises. Otherwise, “I have my hands free
to run the municipality as I want. It’s always the people first – the party doesn’t
interfere.” The explanation for this attitude lay largely in the MBL’s symbiotic
358 Núñez, op.cit 359 Solano, op.cit. 360 Saucedo (a), op.cit.

Charagua
182
relationship with rural NGOs, many of which were active in the region. The party had
split away from the larger Movement of the Revolutionary Left during the 1980s, and
had taken with it its left-leaning anthropologists, agronomists, and rural development
practitioners. After years of working with MBL-affiliated NGOs, communities
throughout Bolivia’s foothills and eastern regions had come to trust the party and
identify with its values, and provided it with a natural constituency. For its part, taking
over local government was for the MBL a natural scaling-up of the rural development
activities carried out by its affiliated NGOs. As the NGOs were an important component
not only of the party’s ideology but also of its electoral success, it was happy to give its
elected officials a relatively free reign to invest municipal resources in community
development. The experience of CIPCA, whose officers also led the local MBL,
provides a good illustration of this dynamic. Having negotiated with communities that
knew them well to elect their candidate mayor, CIPCA then provided technical
assistance to the mayor’s office, focusing on a planning and investment strategy that was
firmly focused on rural areas.
Charaguans were also happy with the more general changes that had occurred
recently in their local political system. Respondents from Taputamí, Yapiroa, El Espino,
Acae, La Brecha, and Charagua town agreed that the most recent elections had been
clean – a welcome change from how things used to be. “Before they hit the peasants and
obliged them to vote for the party of the rich man by removing all of the ballots naming
the parties favored by the poor. Then they showed the campesinos the door. That no
longer happens.”361 And where the voting was fair, “results from here never made it to
the capital. Ballots were thrown away and replaced with others.”362 “But now they can’t
do that,” explained El Espino. “The votes are counted here and the radio and press are
present, observing.”363 Recent electoral reforms allowing more voting stations to be
located in rural areas also pleased Charaguans, and had increased turnout. “Now we
vote here,” said Acae with satisfaction. “Before we had to go to Charagua 8km
away.”364 Related reforms aimed at providing rural citizens with the identity papers had
also helped. Since women formed the majority of undocumented Bolivians, this had had
a disproportionate effect on women’s voting, as had rural literacy campaigns, where
much the same was true. The aggregate effect on voter turnout was dramatic in some
361 Romero and Altamirano, op.cit. 362 García and Cortez, op.cit. 363 Carrillo and Arumbari, op.cit.

Charagua
183
areas, increasing from one-quarter of eligible voters in La Brecha to about three-quarters
in the previous election.365 Overall these changes generated a virtuous circle in which
voting became feasible or significantly easier for rural Charaguans, who then took an
increased interest in local politics. Local politicians accordingly took an increased
interest in them, and for the first time municipal policy and life in the villages began to
interact.
But the deep-seated suspicion that rural dwellers harbored for things political did
not disappear. “Here in the community there are no politicians,” said El Espino, and the
sentiment was echoed in La Brecha. “Where there are politicians people fight a lot.”366
Mennonite communities continued to shun politics in all its forms. Even the residents of
Charagua Station argued for “a pure representation of the people. Parties get in the way.
We should get rid of the parties and allow communities to nominate councilmen directly.
This would better represent the interests of the people.”367 Such an attitude was
surprising in a community that regarded itself as an urban satellite of Charagua town,
where the parties were embraced as their own.
3.3 Community and Grass-Roots Organizations
The maximum expression of Guaraní social organization in Charagua, and
indeed throughout the Chaco, is the APG, which acts as the voice of Guaraní interests.
But to understand how it works and the legitimacy it has locally, it is important to
consider its roots in the organization of rural communities. Guaraní communities benefit
from a traditional system of self-government. Leadership is rotational, and indigenous
communities change their leaders every year. Communities nominate individuals,
according to ability and interest, as community officers responsible for priority tasks.
“Of 100 [villagers], there’s always one who loves a particular type of work,” explained
Antuni. “So the community names an education officer, for example. He has the keys
to the schoolhouse and decides how it’s to be used and keeps it in good repair. He lends
it out for meetings.”368 Each community has its own statutes setting out the
responsibilities of community officials, how they are selected, and how it is governed.
“They operate via assemblies,” explained Muñoz of the FIS, “everything is consensual.
364 Romero and Altamirano, op.cit. 365 Chávez, Moreno, Arreaga, Chávez, Moreno, and Cuéllar, op.cit. 366 Carrillo and Arumbari, op.cit. 367 Abelino Sánchez Ramírez, neighborhood council vice-president, interview, Charagua Station, 30 October 1997. 368 Antuni (a), op.cit.

Charagua
184
Box 2: Building Consensus in Guaraní I arrive on a golden late afternoon to speak to the leaders of Taputamí. We shake hands and retire to a badly-kept classroom to conduct the interview. Numerous onlookers and passers-by squeeze into the little room with us, sitting in desks meant for 8-year-olds and crouching on the floor. I count 13 inside, and perhaps 10 more peering in at both windows and the door. They are badly dressed and look poor. Their curiosity blocks the light and I find it difficult to see what I am writing. Later night falls and someone brings a flashlight. I continue to scribble in its pallid beam, and they sit still in the darkness. Many of my questions trigger long discussions in Guaraní. The strange, lyrical tones linger in the night air, and when they have finally reached agreement one or two explain the answer to me in Spanish, which they all seem to speak. The scene is similar in La Brecha. Deliberations are invariably followed by a broad smile as the one sitting nearest turns to me and begins “Well, I think…”. The rest listen to the collective verdict with approving nods – the Guaraní system of consensus.
There’s no majority voting, nothing like that. They spend days and days talking in order
to reach a decision. But once they do agree, that decision is very strong – no one can
later say ‘I did not want it so.’”369, 370
Until the 1980s, Guaraní communities labored in isolation and with an acute lack
of resources. But beginning in 1983, a diagnosis of Guaraní poverty and exclusion
carried out by the Santa Cruz Regional Development Corporation, CIPCA and others
resulted in the adoption by Guaraní leaders of PISET as the guiding principle for their
local development efforts.371 The concept of PISET, the Spanish acronym for
production, infrastructure, health, education, and land/territory, comprises a system of
work that defines how the community should progress. “They have a directorate at the
regional level that directs PISET efforts. They work PISET at each level from the
community up to the department and beyond.”372 Sequier placed great emphasis on the
emergence of this consensus. “PISET marks the opening of a new historical process
here…a re-birth of Guaraní culture” after the Battle of Kurujuky.373
The Guaraníes’ success in
integrating local PISET efforts
into a regional development
strategy inspired the creation of
the APG in 1986-87. From its
very inception, the APG built its
organization on the pre-existing
social structure of Guaraní
communities; it benefited from
the deeply ingrained legitimacy of
autochthonous village institutions
founded in consensual decision-
making. According to both
Muñoz and Antuni, the APG was
energetic and achieved a great
deal in its first years of existence.
369 Muñoz, op.cit. 370 Albó, op.cit., pp.240-250. 371 ibid. pp.302-317. Albó describes the long Guaraní process of social organization. 372 Muñoz, op.cit. 373 Sequier, op.cit.
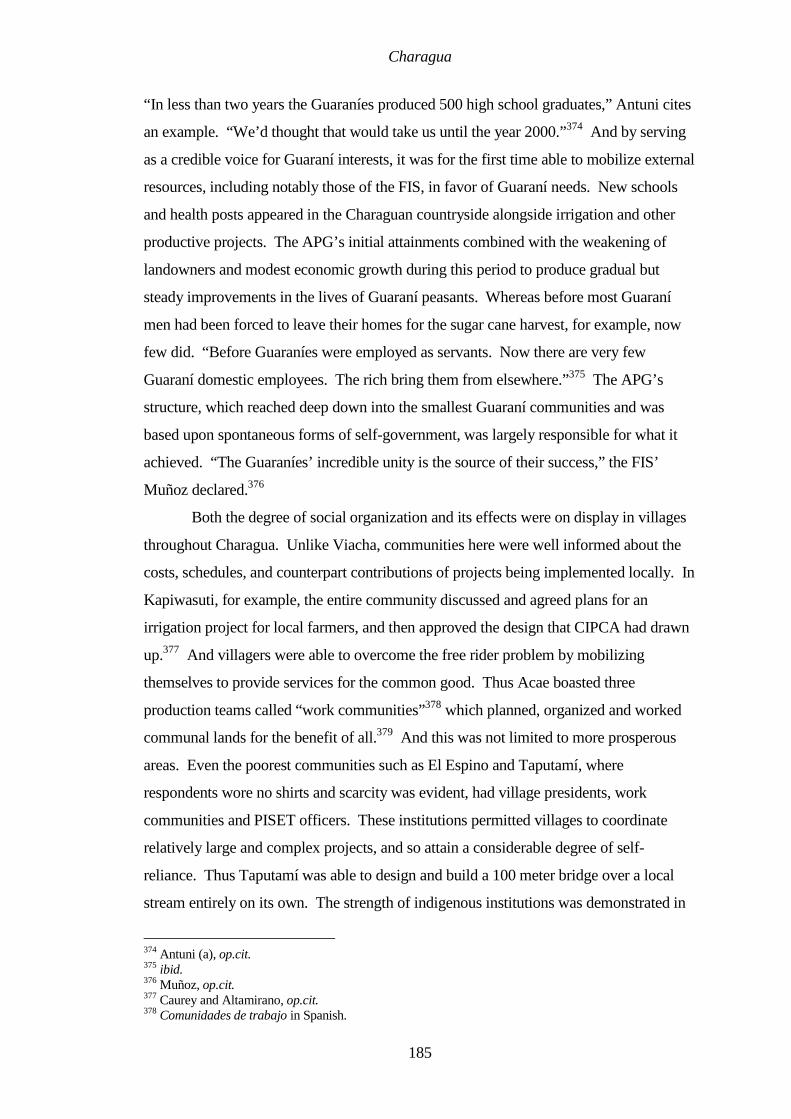
Charagua
185
“In less than two years the Guaraníes produced 500 high school graduates,” Antuni cites
an example. “We’d thought that would take us until the year 2000.”374 And by serving
as a credible voice for Guaraní interests, it was for the first time able to mobilize external
resources, including notably those of the FIS, in favor of Guaraní needs. New schools
and health posts appeared in the Charaguan countryside alongside irrigation and other
productive projects. The APG’s initial attainments combined with the weakening of
landowners and modest economic growth during this period to produce gradual but
steady improvements in the lives of Guaraní peasants. Whereas before most Guaraní
men had been forced to leave their homes for the sugar cane harvest, for example, now
few did. “Before Guaraníes were employed as servants. Now there are very few
Guaraní domestic employees. The rich bring them from elsewhere.”375 The APG’s
structure, which reached deep down into the smallest Guaraní communities and was
based upon spontaneous forms of self-government, was largely responsible for what it
achieved. “The Guaraníes’ incredible unity is the source of their success,” the FIS’
Muñoz declared.376
Both the degree of social organization and its effects were on display in villages
throughout Charagua. Unlike Viacha, communities here were well informed about the
costs, schedules, and counterpart contributions of projects being implemented locally. In
Kapiwasuti, for example, the entire community discussed and agreed plans for an
irrigation project for local farmers, and then approved the design that CIPCA had drawn
up.377 And villagers were able to overcome the free rider problem by mobilizing
themselves to provide services for the common good. Thus Acae boasted three
production teams called “work communities”378 which planned, organized and worked
communal lands for the benefit of all.379 And this was not limited to more prosperous
areas. Even the poorest communities such as El Espino and Taputamí, where
respondents wore no shirts and scarcity was evident, had village presidents, work
communities and PISET officers. These institutions permitted villages to coordinate
relatively large and complex projects, and so attain a considerable degree of self-
reliance. Thus Taputamí was able to design and build a 100 meter bridge over a local
stream entirely on its own. The strength of indigenous institutions was demonstrated in
374 Antuni (a), op.cit. 375 ibid. 376 Muñoz, op.cit. 377 Caurey and Altamirano, op.cit. 378 Comunidades de trabajo in Spanish.

Charagua
186
Kapiwasuti shortly after decentralization, when villagers set about organizing a “grass-
roots organization” as the law stipulated. But Kapiwasuti already had a community
president, and he retained the people’s support. “The GRO380 shriveled and the
community president took over as de facto GRO,” the villagers said, explaining how
they preferred their own institutional forms to the foreign ones of the Bolivian state.381
The organizational capacity of Guaraní communities was largely based on
feelings of solidarity amongst villagers. And these feelings extended far and wide
through the ethnically homogeneous Guaraní countryside. Thus many villages reported
working with neighboring villages on joint projects. “The people from neighboring
communities are the same as us – they have the same customs,” reported Isiporenda.382
Copere Brecha agreed, adding that they participated in meetings of the huge upper and
lower Izozo to coordinate activities and plan joint projects.383 Yapiroa went further,
affirming its willingness to forgo further municipal investments for the benefit of other
communities. “There’s a lack of money in the municipality, and other communities have
needs too.”384 This solidarity persisted despite the historical and cultural differences
between the Ava-Guaraníes of the northern Charaguan Serranía Aguarague and the
Tupi-Guaraníes of the Izozo farther south.
To the outsider these differences are difficult to perceive. The Guaraníes
themselves refer to each other as cousins very similar in appearance, discernible only by
the “echo” in their speech.385 A more telling distinction lies in the organization of their
communities. Tupi-Guaraníes retain the traditional capitanías of their forebears, while
Ava-Guaraníes’ local authorities are called local mayors, corregidores, etc. Village
capitanías are subordinate to the authority of the Capitanía del Alto y Bajo Izozo (Cabi)
– headed by the Capitán Grande – while local Ava-Guaraní authorities are integrated
directly into the APG. The Cabi is also formally part of the APG, but maintains its
distance and prefers to think of itself as a separate entity. The differences between the
two surpass the semantic and the symbolic. “The Cabi has an autocratic structure, while
379 Romero and Altamirano, op.cit. 380 Grass-roots organization. 381 Caurey and Altamirano, op.cit. This, of course, was the original intent of the law. 382 Ibáñez and Durán, op.cit. 383 Leoncio Pabaroa and Javier Yupico, interim community leader and ex-leader, interview, Copere Brecha, 29 October 1997. 384 Vaca and Segundo, op.cit. 385 Tupi-Guaraní more closely resembles the Guaraní spoken in Paraguay.

Charagua
187
the APG is more democratic,” the mayor explained to me. “With the capitanes, all that
they get386 is for themselves and the people go hungry.”387 Antuni was more explicit.
Boni [the Capitán Grande] takes the men out to work in the sugar harvest in Santa Cruz. He charges Bs.10/head, supposedly for the benefit of the capitanía. But it’s all for him. You’d think they’d have at least one building after thirty years of this. […] And the Capitán Grande has a woman in each community. 388
Avas saw themselves as more modern while Tupis thought themselves more
authentically Guaraní. But the solidarity amongst them overcame this divide. Village
spokesmen throughout the countryside reported good relations and numerous joint
projects with nearby rural communities. Tupi and Ava families alike identified with the
larger Guaraní cause.389 There was neither visible resentment nor a struggle for
resources between the two groups. But even amongst rural peoples, solidarity ended at
the racial barrier. “We have good relations with other communities,” said La Brecha,
“but few relations with the Mennonites.”390 All of the villages I spoke to with
Mennonite neighbors agreed. Some complained about the Mennonites’ farming
methods, and others seemed worried that they were buying up land. But none reported
more than minimal, strictly commercial relations with them.
Civic activity in town, on the other hand, took on a very different character.
Communities were organized into neighborhood councils and focused their attention on
infrastructure and urban development – much narrower concerns than in rural
communities, where authorities’ concerns extended to residents’ livelihoods and cultural
identity. They operated not as community governments but as interest-group lobbies
competing for municipal funds. Indeed, according to the MNR’s Eguez, neighborhood
councils did not exist before 1994. “All of them were formed specially for the LPP.”391
The councils’ formation of the Community Association (described above) as a means of
increasing their political weight and wresting the initiative from the Guaraní-dominated
OC is a telling sign of their underlying concerns. They were not motivated by social
solidarity, but rather by the refinement of political antagonism as a tool for controlling
the public purse. It is ironic that the town, in creating new representative institutions,
was following the example of the Guaraníes in form even as it betrayed it in substance.
The responses of both neighborhood councils and rural communities to general questions
386 Saucedo here referred to both locally and externally raised resources. 387 Saucedo (c), op.cit. 388 Antuni (b), op.cit. 389 Isiporenda, La Brecha, Yapiroa and Copere Brecha, among others, testified to this effect. 390 Chávez, Rodríguez and Álvarez, op.cit.

Charagua
188
of governance support this view. To the question of how to improve local government,
townspeople proposed granting official functions to the civic committee – a sort of local
chamber of commerce – as well as urban social and educational organizations. “The OC
is being politicized…, and we must involve other organizations in local administration.
[…] White people are better at leading … because we can’t be influenced as readily,”
they affirmed.392 Their intent was essentially to exclude the OC, and hence the peasant
majority, from government.
In answer to the same question, by contrast, spokesmen for El Espino innocently
proposed organizing the APG in the town itself. “It still doesn’t work there – they need
officers in charge of education, infrastructure, etc.”393 Though naïve, this idea was based
on a concept of community organization that springs from the grass roots upwards, and
which is deeply rooted in the Guaraní mentality.394 Respondents throughout the
Charaguan countryside invoked it responding to a variety of questions about governance
and identity. When asked what caused a community organization to be bad, for
example, Copere Brecha replied “A grass-roots organization is always good. It is able to
work for the community.”395 They did not admit the possibility of a bad GRO. For
them a GRO is the institutional expression of the community and all of its inhabitants. A
GRO could not be bad any more than a community could be bad, though it might prove
more or less effective over time. This essentialist view of community organization as an
expression of the collective will contrasted sharply with the townspeople’s view of
GROs as interest group lobbies immersed in pork-barrel politics. This idea was in turn
founded in a deeper, Hegelian notion of historical progression.396 “We always wanted
education,” pleaded Yapiroa. “We want to advance as a people. The older generations
eliminated slavery. Now we want to continue to move forward.”397
3.4 Other Local Actors – The Military and the Church
The last two actors of any significance on the Charaguan political scene are the
military and the church. The local army garrison traces its history to the soldiers who
bravely fought back the invading forces during the Chaco War and re-took Charagua
from the Paraguayans. But the years of small military budgets left their installations in
391 Eguez, op.cit. 392 García and Cortez, op.cit. 393 Carrillo and Arumbari, op.cit. 394 Albó, op.cit. 395 Pabaroa and Yupico, op.cit. 396 Hegel, GWF, Philosophy of Right, trans. SW Dyde, Amherst, N.Y.: Prometheus Books, 1996.

Charagua
189
poor condition, with no funds for equipment and inadequate resources for training. The
garrison commander, Lt.Col. Fair Villaroel, boasted of good relations with the municipal
government, with numerous projects on which the two had cooperated. For example, the
garrison provided a large part of the labor for the plaza renovation and park projects.
“They provide the cement and we provide the rest,” Villaroel said.398 The army had also
helped to clean the cemetery and the streets of the town, and had provided manpower for
several health campaigns.
Villaroel had in effect taken advantage of an ambitious municipal government to
substitute the combat training he could not afford with civic exercises, the running costs
of which the municipality paid. This work broke the tedium of barracks life, and
afforded his officers the chance to develop their organizational skills and instill
discipline in the rank and file. The commander’s only complaint was of too few such
opportunities. “We’d like to do more,” he declared, “but the mayor is a little
disorganized.” The garrison’s civic spirit also extended into the Guaraní hinterland.
“We have very good relations with the Guaraníes and the APG,” said Villaroel,
explaining that he sent a doctor and dentist to the Guaraníes’ medical center regularly,
and that “any community that requests help gets it”. Mindful of the army’s historical
role in the repression of the Guaraní people, Villaroel sent officers to village festivals
and ceremonies, and tried to ensure that his soldiers would not disrupt Guaraní life.
Local observers were not in disagreement with the picture Villaroel presented, observing
that after many years the army had returned to the barracks and now played a benign role
in the affairs of the municipality.399
The leader of the Catholic Church in Charagua in mid-1997 was Fr. Luis Roma,
a Spanish priest who had worked for 40 years in Bolivia, three of them in Charagua. In
addition to overseeing the parish, Roma was responsible for the school run by Fe y
Alegría, a Catholic NGO dedicated to education. Roma professed good relations with
the municipal government, the army, rural villages and the townspeople, an impression
that was shared by each of these in turn. But the Church’s role had not always been
impartial, nor benign. “Before 1955 local power was held by the landowners and the
Church, plus the politicians in power at the time,” explained AGACOR’s Ribera, himself
397 Vaca and Segundo, op.cit. 398 Villaroel, op.cit. 399 Núñez and Aramayo, among others, concurred on this point.

Charagua
190
a landowner. “But after the revolution the Church changed and took up popular causes
and began working with marginal populations.”400
The Church had previously formed part of the criollo establishment, sanctioning
the violence of the state against the non-Christian Guaraní people. But then it changed,
and its new attitude was exemplified by such men as Albó, Sequier and Roma – foreign-
born, activist priests who had crossed the globe to work with the rural poor and the
dispossessed. They employed a new, highly involved form of outreach which addressed
not just the spiritual needs of Guaraníes, but their physical and cultural concerns as well.
Their instruments were traditional church-centered community activities, parish
programs in the villages, and a range of church-supported NGOs dedicated to education,
health and rural development. Fe y Alegría and CIPCA were two prominent examples; a
third was Teko-Guaraní, led by Jesuits and dedicated to bilingual education for
Guaraníes as a form of cultural assertion. No longer seated at the right hand of temporal
authorities in town, the Church’s profile was much reduced, its power greatly diffused
compared to a half-century earlier. But it remained an important and influential actor in
Charaguan daily life.
4. Summary: How Government Works in Charagua
The evidence points overwhelmingly to the conclusion that local government in
Charagua was of high quality. Through dozens of hours of interviews with authorities
and citizens from all walks of Charaguan life not a single accusation of official
corruption surfaced. This is surprising given the state of public disaffection with elected
authorities in Bolivia, as well as Charagua’s inexperience managing large financial
flows. Respondents from communities scattered throughout the municipal area reported
satisfaction with their local government, and felt that their concerns were being
addressed by municipal policy. The mayor, working in concert with the oversight
committee, had implemented an investment planning system which the authorities and
grass-roots alike agreed was transparent, equitable, and highly participative. The
projects which resulted from this process pleased citizens both because they responded
to real needs, and because of the importance given to local opinions in their conception
and design. Informed observers with a variety of political and organizational affiliations
agreed that municipal authorities were well-meaning and effective, and that the quality
of the investments and services they provided was correspondingly high.
400 Ribera, op.cit.

Charagua
191
Good government resulted from the interplay of the institutions of local
government – the mayor, municipal council and oversight committee – operating in a
political context dominated by the principle actors in Charaguan society – cattle-ranchers
and the APG. The mayor’s office, the executive branch of local government, was
institutionally weak in Charagua, suffering, as Saucedo admitted, from poor human
resources and relatively low administrative capacity. This was largely compensated by
the virtues of the mayor himself, who was widely admired as energetic, honest, and
ambitious for his municipality. The strength of his electoral mandate was an additional
advantage. Hand-picked by the APG leadership, Saucedo was the white face of Guaraní
political power in Charagua. His nomination by an organization which embraced the
majority of the population and reached deep down into its community structure
conferred upon his office immense legitimacy. At the lowest, grass-roots level, the
people trusted their mayor. This proved instrumental in eliciting the ideas and
preferences for municipal investment of communities more used to the violence of the
state; their subsequent cooperation during project implementation was similarly
forthcoming. And so the mayor was able to integrate the demand from dozens of rural
communities into an investment strategy that reflected their needs: human development,
productive projects, and road maintenance. And he was also able to make demands of
them – to donate labor and materials, but more importantly to exploit public investment
to their benefit. If a school would be built, they had to get educated. The fact that the
municipality now spoke with the voice of the poor illustrates the degree to which power
had shifted in Charagua. Town hall was no longer the domain of the ganaderos.
Like the mayor, the council worked closely with community leaders and listened
carefully to grass-roots demand. Like the mayor, councilmen were held in high esteem
in their constituencies as hard-working, honest and able. Villagers judged them
effective, and were pleased with the outcome of their work. But in institutional terms the
municipal council was perhaps more remarkable than the mayor, as the APG’s influence
crossed party boundaries and overcame well-established political and ideological
rivalries. The two MBL and one MNR Guaraní councilmen essentially ignored their
parties once elected, admitting enthusiastically that they reported to their superiors in the
APG and to no one else. They formed a majority on the council of five and worked,
along with the ADN representative, to advance the interests of their rural communities.
The presence of the Guaraníes, and they way in which they operated, was clearly the key
to the municipal council’s effectiveness. Once again, the foundation of its electoral

Charagua
192
mandate in the APG, and the legitimacy that this bestowed upon its efforts, allowed it to
work closely with village authorities to detect and prioritize needs throughout a large
municipal area. This led to a process of feedback in which municipal plans were
constantly reviewed and revised to better respond to changing community conditions.
If the Guaraníes controlled the municipal council, they completely dominated the
oversight committee. With seven Guaraníes out of eight members, the OC was
essentially an arm of the APG cast in the guise of a municipal institution. Its authorities
were APG authorities, and its president, Florencio Antuni, spent the first part of his term
as president of the APG as well. Whereas the mayor and municipal council represented
the APG’s positions in local government, the oversight committee essentially was the
APG. Whereas Guaraní interests were able to transcend party politics in the municipal
council, the OC was overtly apolitical. The grass-roots perceived the OC as they did the
APG – representative, honest and as practically an extension of their own will. Antuni
could exploit the APG ‘s organization directly to ascertain village opinion, and to
mobilize Guaraníes from the grass-roots upwards. This placed him in a strong position
vis-à-vis the mayor and municipal council, and he knew it.
But ironically, the electoral underpinnings of power in Charagua were such that
the OC did not find it necessary to assert itself. Bolivian local government is designed
around checks and balances, where the different institutions of government represent
competing interests. The role of the OC is as a veto-wielding upper house of parliament
where rural populations are over-represented; it is able to paralyze municipal business if
government proves corrupt or insensitive to its constituents’ needs. But in a
municipality where both municipal council and mayor sprang out of the APG, the
interests of the rural majority were already well represented. There was little role left for
an OC which also spoke for the countryside. Its mere existence probably gave rural
communities greater weight in the competition for public resources. But its efficacy was
ultimately of second-order importance to the question of government effectiveness.
With their complementary roles in policy planning and execution, it was the mayor and
municipal council that jointly determined local government’s success in Charagua. Of
these the mayor, the protagonist who helped to plan investment and then carried it out,
was probably more important. To the extent that the council provided oversight for a
mayor already watched over by the APG, it was somewhat redundant. But the common
political roots of the two institutions render such distinctions both difficult and ultimately
futile. The strength of the mayor was based on the social consensus represented by the

Charagua
193
governing majority in the municipal council. Both institutions were ultimately founded
in the social network of the APG.
The Guaraní assault on local politics began only in 1995. Their history over the
previous hundred years was a long, sad tale of official oppression and abandonment.
What changed? What underlying economic and social conditions allowed the Guaraní
people to successfully occupy the central spaces of local power? The story most
obviously begins with the foundation of the APG, discussed in detail above. Built on the
pre-existing social structure of Guaraní communities, the APG quickly gained a
legitimacy and organizational strength which belied its youth. The consensual basis of
its decision-making, along with the natural level of solidarity amongst Guaraníes, greatly
facilitated the APG’s ability to coordinate their aspirations and actions over a sparsely
inhabited area larger than some European countries.
But this is clearly insufficient as an explanation of political change. The urban
elite in Charagua town had dominated local life for decades, through wars and
revolution, and the rise of a network of rural communities did not represent a serious
challenge to their supremacy. In previous times AGACOR might have squashed the
APG, or easily excluded it from power. That it made no such attempts in 1995 is
indicative of the depths that the cattle economy, and cattlemen’s morale, had plumbed.
Once the rulers of the southern plains, with vast landholdings and herds that numbered in
the tens of thousands, Charagua’s ganaderos were by 1995 the dispirited victims of
years of agricultural crisis that had slashed food prices, incomes, property prices, and
borrowing ability. As economic power passed from the countryside to the cities, the
children of the ranchers left the farm in search of education and careers in the city. The
ancient certainty of rich farms and perpetual prosperity passed from father to son was
broken; no longer would land be the sustenance of generations of rancher families
stretching into the indefinite future. For many, farming would become a hobby. As the
value drained from the land, the ganaderos found that they had much less invested in
their farms, and thus much less interest in controlling local politics. And thus when a
conciliatory APG emerged to claim the municipality for itself, they found that they had
no strong reason to oppose it.
AGACOR retained its importance as an institution, with control over a large
budget and good technical and human resources. But as a political protagonist and
defender of interests it was lost in the new Bolivia. One sensed that even the ranchers
regarded themselves as a dying breed. Whereas AGACOR’s will once echoed in the

Charagua
194
town hall, it now found no place for itself in the new institutional context. One
interpretation of the townspeople’s formation of the Community Association is as an
attempt to find an organizational form that might fit into the new scheme. But even this
was not so much a strategy as a response to the APG’s success, a sign of their
ambivalence, and a groping attempt to regroup. In an era when history and ideology had
stripped the ranchers of their traditional allies, the armed forces and the church, and they
found themselves lost in a sea of change, the APG was able to stroll into town and
simply assume power.

Theorizing Local Government
195
7
Theorizing Local Government
1. Introduction
Chapters 5 and 6 examined in great detail how local government functions in two
very different municipalities. We focused on extremes of municipal performance in
order to highlight how different institutional characteristics and political dynamics affect
the quality of government. The districts operated in a common constitutional and legal
framework, under the same institutions of the central state. And yet in Viacha
government was deplorable during the period in question, with an ineffective council, a
corrupt mayor, and competing oversight committees, while in Charagua an energetic and
competent mayor, hard-working council and strong oversight committee governed well.
How can we explain these differences? The previous two chapters employed a close
analysis of the dominant social forces in each municipality to argue that the quality of
their government institutions, and hence of the policy outputs they provide, is a product
of deeper economic and political factors that characterize each district. This chapter
probes further by focusing on emergence – the political mechanism by which the
institutions of local government are engendered, and how competition amongst social
interests to control them limits or enhances their capabilities.
In order to comprehend decentralization we must understand how local
government works. We must be able to explain why some municipalities are good and
others terrible. But the economic and political theories explored thus far are of limited
help. They largely assume that local government will be more sensitive to local needs,
and fail to ground this in convincing micro-political foundations. As a result, these
theories cannot adequately explain why some local governments are more responsive or
effective than others. Empirical analyses based on such ideas are often left clutching at
the straws of staff quality, resources available, and other idiosyncratic explanations (see
Chapter 1). This chapter approaches the problem in reverse. It first contrasts the
empirical attributes and experiences of our two extreme cases of municipal performance
as a means of generalizing about the deeper social and institutional dynamics that

Theorizing Local Government
196
underpin local government. From these observations it induces an analytical model of
government that accounts for both responsiveness and accountability through simple
electoral and social behavior. These insights will in turn serve to explain the results of
Chapters 2 and 3 – why decentralized government is systematically more responsive to
local needs than centralized government.
The rest of this chapter is organized as follows. Section two contrasts the social
and institutional characteristics of Viacha and Charagua under three headings – the local
economy, local politics, and civil society – in a search for underlying patterns that
explain municipal performance. Section three reviews existing models of public choice
focusing on the difficulties they have in explaining responsiveness and accountability,
especially as manifested (or not) in Charagua and Viacha. Section four proposes a
simple two-stage model which does this. Section five operationalizes the model in
preparation for testing it in the following chapter using qualitative evidence from seven
additional municipalities. Section six concludes.
2. Society and Governance
2.1 The Local Economy
The economic differences between Viacha and Charagua are huge. The former
district is dominated by an industrial city, home to two of Bolivia’s largest businesses
and with a well developed and vibrant private sector. The latter is a rural district
dominated by cattle ranching and subsistence farming, centered on a town of 2500
inhabitants with little commerce and no industry. With respect to local government, the
fundamental difference between the two is in the economic interest that dominates each
and its role in the local political system. The vast majority of Charagua’s wealth is held
by the large landowning cattle-ranchers who traditionally ran the region. But by 1997,
after years of economic hardship, the ganaderos were dispirited, increasingly
impoverished, and felt that the tide of history had turned against them. Their power was
at a nadir and both they and the Guaraníes knew it. Viacha, by contrast, had in the CBN
a firm which was in clear economic and political ascendancy, which dominated the
city’s political life like few others in Bolivia.
Even though the brewery’s assets and income were a considerably smaller share
of the local economy than those of the cattle-ranchers in Charagua, its single-minded
exploitation of its human and financial resources, combined with skillful political tactics,

Theorizing Local Government
197
allowed it a degree of influence over local politics and government far in excess of what
Charagua’s ranchers managed. Unlike the CBN, the latter were not, after all, a firm, but
rather a collection of independent businessmen who did not face identical business
conditions, and accordingly did not act politically or commercially with a single will.
Although most AGACOR members sympathized with either the ADN or MNR, at least
a few could be found in all of Charagua’s political parties. In addition, ranchers were
willing to support parties’ electoral campaigns regardless of their personal sympathies, in
order to remain on good terms with all of the principal parties. In business also,
AGACOR helped Guaraní farming communities to drill rural wells and gave non-
members technical and veterinary assistance. In Viacha, by contrast, the CBN behaved
with fiercely partisan aggression, and went to great lengths to undermine or discredit
opposition political parties, including bribing their councilmen and – in the case of the
MIR – mounting a campaign against the SOBOCE factory. The bottling plant made no
pretense of working evenhandedly with rival political or business groups. All of its
public actions formed part of a simple strategy designed to capture votes and promote
the UCS-CBN brand.
The withdrawal of SOBOCE from local politics left the CBN in a dominant
position, as the near-monopsonistic provider of political funds to the local party system.
The brewery was only too happy to exploit this role to hobble the opposition in the
interests of the political dominance of the UCS. Thus what was in political terms an
economic monoculture became, at least for a time, a political monopoly as well, as the
CBN-UCS stifled competition and steadily raised the price of opposition and dissent.
Charagua’s ranchers behaved in a very different way, eschewing monolithic political
action in favor of a gentler and more diverse approach better suited to a pluralistic group
of businessmen. By supporting a variety of parties, they contributed to opening the
political regime in Charagua and encouraging competition amongst parties. And when
their rivals won power, far from attempting to undermine them the ranchers of
AGACOR found an accommodation and were able to work with the new municipal
authorities.
This analysis suggests a political analogue of the neoclassical argument in favor
of the efficient allocation of resources via open and competitive markets. Parties –
especially those in opposition – are not self-financing entities, and require resources in
order to mount campaigns and generally carry out party functions. Where a
municipality’s economic landscape is dominated by an economic hegemon, that

Theorizing Local Government
198
hegemon will tend to reduce political competition by financing a favored party, and may
well abuse its position in other ways in order to hinder its political rivals. Thus
monopsony in the provision of political funds will tend to lead to monopoly in the party
system. Such a reduction in political competition will reduce the level of oversight that
local government institutions are subjected to as a by-product of political competition,
and may well leave sectors of the population unrepresented and effectively
disenfranchised. An open and competitive local economy, by contrast, promotes
competition in politics, leading to an increased diversity of ideas and policy proposals
that compete for public favor, as well as improved public accountability for government
officials. Where an economic hegemon and a dominant political party actively collude,
the effects can be multiplicative – together they can distort the local party system,
capture the institutions of government, and deform the governance process to their own
ends, as happened in Viacha in the mid-1990s. Charagua was also run on such a basis
for much of the twentieth century, with comparably deleterious effects on local policy-
making, until long-term economic changes paired with political reforms to end the
cattlemen’s dominance.
2.2 Local Politics
The analysis of local politics can be usefully divided into systemic issues and the
party system per se. The former refer to the ground rules of electoral competition, and
its fairness and openness to both parties and voters, while the latter refers to the nature of
local party organizations and how they compete. The systemic reforms noted in
Charagua correspond to nationwide changes which affected municipalities throughout
Bolivia. These included reforms to electoral laws to increase transparency in the vote
count, ensure voting secrecy, provide for independent oversight of the voting process,
and increase the number of polling stations in rural areas. But they also included non-
electoral reforms, such as a new, efficient citizen registration process (which in turn
permitted voter registration), and the extension of rural literacy programs (especially
amongst women). Their collective effects were a broad increase in voter registration and
improved voter participation. But the secret to the success of these reforms lay in large
part with the design of the decentralization program itself. The LPP brought rural areas
into the municipal system, and then devolved significant authority and political
responsibility to them. Whereas before rural dwellers voted, if at all, for cantonal
officials who had neither resources nor political power, now fully-fledged municipal

Theorizing Local Government
199
governments with real resources and legislative authority were at stake. The prospect of
gaining control over these drove political parties into the countryside in search of rural
votes. The prospect of benefiting from them pushed villagers and farmers into municipal
politics and into the voting booth. In this way the concerns and opinions of the rural
50% of Bolivians were brought into the political mainstream as electoral politics
penetrated deeper and deeper into the hinterland.
Charagua provides a case study of this process. Registered voters increased by
72% between the 1993 and 1995 elections, the great majority of whom participated, with
an increase in suffrage of 139% and absenteeism falling by one-third.401 The reforms
which opened politics to a new electorate simultaneously established the conditions for
fair and open competition. The old methods of bribery and intimidation no longer
worked in Charagua; the MNR’s attempt to bribe Councilman Vargas failed because,
given electoral transparency, the transaction would have been apparent and would have
exposed Vargas to the voters’ wrath.402 And so the Guaraní majority was able to
overturn the cozy duopoly which had run the town for so long. In this political aperture,
the parties that underwent comparable openings benefited most, and those which
attempted to carry on as before suffered. Thus the MBL, previously irrelevant in
Charagua, struck a deal with the APG and captured the majority of new votes, while the
MNR lost its local pre-eminence and was thrown out of government. But the MBL was
more than tactically clever – it had deep roots in rural life through its affiliated NGOs,
which had earned the trust of Guaraníes after years of patient work. The presence of
such a party not only facilitated the alliance between the APG and the political
establishment, but was instrumental in raising the quality of government after the
election. NGOs like CIPCA and Teko-Guaraní specialized in planning and carrying out
rural projects. The skills they had developed, and their relationships with rural
communities, were instrumental to the transformation of Charagua into an effective
municipality that served its rural majority.
Decentralization, by contrast, contributed to a very different process in Viacha.
Although voter registration did increase, Viacha’s gain of 22% was an order of
magnitude lower than Charagua’s, while absenteeism remained roughly static.403 This
reflected the fact that Viacha’s politics remained a closed affair, inured to the concerns
401 Corte Nacional Electoral, op.cit. 402 Vargas, op.cit. See Chapter 6, section 2.2. 403 Corte Nacional Electoral, op.cit.

Theorizing Local Government
200
and priorities of the rural majority. This, in turn, was largely due to Viacha’s status as a
comparatively small city dominated politically by the imperatives and dynamics of the
La Paz-El Alto conurbation. Viacha was sufficiently close to the capital, and transport
links sufficiently good, that national political leaders could intervene in local affairs at
relatively low cost. Because it offered a fairly easy way to score political points without
the public scrutiny that they were subjected to at home, party leaders essentially ran their
Viachan affiliates from La Paz. They allowed their subordinates in Viacha very little
room for initiative, reducing them to spokesmen and messengers. And with cavalier
disregard for the popular will, their directives were based on strategies that responded to
events in the capital or nationwide, and not on the needs and circumstances of Viacha.
In this way, more powerful actors invaded the local political stage, trampling on local
concerns in the thrust and parry of a drama that was as threatening as it was foreign.
A particularly lamentable consequence of this intervention was that the legal-
electoral reforms detailed above were insufficient to counter the CBN-UCS’ capture of
local government. The party exploited the resources of the CBN to suborn and
intimidate the opposition until it achieved near-monopolistic power in the local political
context. With its hand thus freed, it indulged in the corruption and misrule documented
above. Under normal conditions, political competition and openness could be expected
to catalyze a cleansing of the political system. But a substantive political choice is
required for this mechanism to operate. And in Viacha the choices on offer were wan
simulacra of political options, marionettes whose strings jerked across the horizon. The
fact that the Viachan party system was dominated from beyond implied that local party
leaders did not innovate in search of new voters. They did not have the operational
independence to strike a deal along the lines of the MBL’s in Charagua, and any such
agreement that might occur was likely to be rejected by a national leadership more
concerned with avoiding embarrassment than policy experimentation. The generally
poor quality of Viachan political leaders – another by-product of political dependence –
made the leadership even less likely to tolerate local originality. Thus, while
decentralization created many opportunities to make political gains and win votes in
Viacha by reaching out to newly incorporated communities and addressing their
concerns, the local establishment’s efforts were limited to mundane extensions of
campaign rallies and sloganeering to the countryside. Voters offered a false choice
between options devoid of local content eschewed politics altogether and dropped out of

Theorizing Local Government
201
the system. And so Callisaya was able to perpetuate his misrule until popular revulsion
spilled into the streets and forced him from power.
This suggests that effective local governance requires a vigorous local politics in
which competition spurs political entrepreneurship and policy innovation as parties vie
to win new voters. The analysis above indicates two conditions necessary for such a
local politics to obtain: (i) an open and transparent electoral system, which both
promotes and is (indirectly) sustained by (ii) a competitive party regime. These combine
naturally to produce a third, endogenous requirement of good local politics, especially
important for the case of Viacha: a substantive focus on local issues and local people.
Systemic electoral reforms which increase the transparency and ease of voting serve to
increase participation by making voting both feasible and fair. Voters who are able to
reach a polling center and cast a vote will be more likely to do so the less likely it is that
results will be misrepresented or distorted by local interests. Reforms which promote all
of these things encourage citizens to express their political preferences freely, both inside
and outside the voting booth. This in turn raises the electoral return to parties which
actively canvass local opinions and propose policies that respond to changing voter
needs. Policy innovation of this sort can be termed political entrepreneurship.
But a competitive party system must be in place if the full beneficial effects of
systemic opening are to occur. Political entrepreneurship which attempts to offer
dissatisfied voters a political alternative will be thwarted by a party regime which is
monopolized by one actor. Viacha provides a compelling example of how competition
in a political environment which is formally open can be subverted through the
systematic use of bribery and intimidation by a dominant faction to undermine
substantive opposition. In a way which is, again, closely analogous to the working of
competitive markets, a competitive political environment will encourage policy
entrepreneurs to innovate in the hopes of capturing electoral share from their rivals.
Party systems characterized by multiple participants and free entry, featuring political
agents who succeed or fail based on their ability to attract votes, will tend to serve the
welfare of their constituents better than those dominated by a single actor, and hence a
narrower range of policy options. And a competitive local economy, as discussed above,
will tend to promote a competitive political system.
If the first two conditions refer to complementary aspects of competition in the
local political economy, the third consideration can be characterized as a deepening of
the logic of decentralization from the administrative to the political realm. This is the

Theorizing Local Government
202
seemingly obvious point that a district’s local political dynamic must be driven by local
concerns and local incentives if it is to benefit local inhabitants. A policy discourse
which is carried out in terms natural to a different city or larger political unit will result
in a political debate essentially foreign to the priorities of local people. When carried out
on a small scale, this will work to the detriment of offending parties, as the MNR
discovered when it attempted to micromanage its Charaguan affiliate from Santa Cruz
after decentralization. But where such behavior is widespread in a municipality’s
political establishment the damage can be considerably larger. As Viacha vividly
illustrates, the beneficial effects of systemic opening can be undermined as local politics
becomes a sterile and corrupting battle-by-proxy. In such circumstances, the process
described above by which competitive politics leads to effective and responsive local
government will be short-circuited, as politicians ignore the voters and voters lose faith
in their leaders. Moreover, such a predicament may constitute a stable equilibrium, as
parties oblivious to local discontent fail to capitalize on the electoral opportunity it
represents. The question is why parties would err in such an obvious way in the first
place. A compelling answer lies in their own organizations and internal power
structures. Political parties are by nature national organizations, and the devolution of
authority required for municipal politics to take on its own, self-sustaining dynamic
requires an internal decentralization which many party leaders will resist as an
unacceptable erosion of their power. But this is, of course, precisely the point, and
confirms a much larger truth about decentralization: in order to work it requires people
who hold resources and power to let go, and they will always have strong reasons not to.
A final consideration is the common counterclaim that the fundamental variable
explaining government performance is the quality of local political leadership. This line
of reasoning focuses primarily on the character of the individuals concerned. Hence, the
principal difference between Viacha and Charagua is that the former suffered a corrupt
mayor whereas the latter benefited from an honest and able one. A simple exchange of
mayors (and other institutions of government) between the two would thus have restored
probity to Viachan public life and plunged Charagua into the abyss. This study rejects
such a position as simplistic and short-sighted, and prefers to treat political leadership as
an endogenous variable determined by the economic, political and social processes
analyzed above. In this view, politicians can be regarded as mobile agents who are
exogenously determined as “good” or “bad”. The question then becomes, what are the
characteristics of municipalities where bad politicians gain control of public institutions?

Theorizing Local Government
203
and where and why do good politicians prevail? In addition to being more interesting,
this question permits a deeper, multidimensional analysis of local government which
exploits the empirical insights developed in the preceding chapters. Building on the
previous analysis, the answer can be stated simply: corrupt political agents will have far
more opportunities to enrich themselves in municipalities where government oversight
and accountability are crippled by economic monopoly, distorted political competition or
deep-set social antagonisms (see below). In districts where competition and
transparency naturally lead politicians to concentrate on satisfying voters’ needs, bad
political agents will dedicate themselves to other pursuits or leave. We return to this
point below.
2.3 Civil Society
The conspicuous economic and political differences between Viacha and
Charagua are matched by the disparate characteristics of local society in each. In
Charagua the Guaraní majority formed a territorially vast network of rural villages with
similar social characteristics and similar self-governing community structures. These
villages had autonomously organized themselves in the 1980s into the APG, an
independent civic organization which acted as ethnic advocate and regional self-
government. The APG’s roots in the spontaneous village traditions of the Guaraníes
gave it both tremendous legitimacy and a high capacity for mobilizing the opinions and
efforts of its constituents, qualities which were to prove invaluable after decentralization.
Townspeople formed the other important local group, with their own organizational
structures based on neighborhood councils. They were less uniform socially than the
Guaraníes, and less united in their goals and policy preferences. But they proved
pragmatic in the end, willing to work with the new majority when the Guaraníes took
over local government.
Viachan civil society, by contrast, is a heterogeneous mix, including two groups
with strong and divergent identities and a long history of mutual antagonism marked by
episodic outbreaks of civil violence. The city of Viacha is dominated by an urban elite
which defines itself in opposition to the indigenous countryside, and which suddenly
found itself miscegenated with a large rural hinterland which greatly outnumbered it.
Like Charagua, urban organization is centered on neighborhood councils, which are
quick to confirm their legitimacy in national federations headquartered in La Paz. Rural
Viacha is itself divided between the Machaqas in the west and the remainder, closer to

Theorizing Local Government
204
the city. The former is a distinct region where the Aymará language predominates and
communities are organized into traditional, pre-Columbian Ayllus and Mallkus. The
latter see themselves as more modern, speak a mixture of Spanish and Aymará, and base
their social organization on the peasant union’s general secretariats. Of these three, the
Machaqas region – the furthest from the city – is the most homogeneous and boasts the
most robust social organization. The other two regions are strongly affected by the
status of Viacha as an urban transition zone, an important threshold in the slow
urbanization process that characterized Bolivia during the latter half of the twentieth
century. The difficult journey from rural campesino on the altiplano to urban vecino in
La Paz-El Alto can take several generations, and for many thousands their path takes
them through Viacha. The two worlds collide in the city’s markets and peri-urban areas,
and in adjacent rural communities, and the resulting frictions lead inevitably to social
tensions.
That these differences proved crucial to the quality of governance achieved in the
two municipalities should not be surprising. Even without a theory of how society
relates to government, the Law of Popular Participation marked the formal incorporation
of civil society into the governance process as a governing institution, via the oversight
committee. The OC is charged with overseeing all municipal activities on behalf of
grass-roots organizations, and can effectively paralyze the administration if it objects.
But the law did not specify the norms or procedures by which the social groups which
give rise to the OC should operate, preferring to trust in their autonomous dynamics.
The innate characteristics and internal workings of civil society are thus vital to the
quality of government that municipalities can achieve, as both Viacha and Charagua
illustrate.
In order for civil society to provide useful oversight and a feedback mechanism
for the governing process, it must be able to accomplish a limited but important set of
tasks. First, it must be able to identify a specific failing of local policy at the community
level. It must then formulate a coherent demand or complaint and transmit it upwards
through, typically,404 two or three of its own hierarchical levels. Finally, local civic
leaders must be able to take up this complaint and communicate it convincingly to the
mayor or municipal council. Such abilities are not culturally or organizationally specific,
and thus a wide variety of societies are likely to have them. But they will all share four
404 Typically for Bolivia.

Theorizing Local Government
205
general traits that facilitate these tasks. The first is simply the ability to communicate,
often across large areas and diverse ethnic groups – a significant challenge in many areas
of Bolivia. The second is norms of trust and responsibility, both within communities and
across them (including leaders in the seat of government), as well as across time. Where
community leaders do not comply with their duties of leadership and advocacy,
government will not reap the information it needs to right policy mistakes. Communities
must then trust leaders farther up the hierarchy to accurately represent their interests
before government, and leaders must trust that their information is correct. And civic
leaders at the municipal level must then actively pursue communities’ demands if
government is to be held socially accountable for its policies at the community level.
The third trait is a minimum level of human capital amongst civic leaders such
that those at the municipal level are able to interact productively with local government.
This involves both cooperating with elected officials to advance policy goals, and
opposing their decisions in such a way as to modify their actions. The last trait, and
often the most difficult in Bolivia, is a minimum level of resources required to carry out
these activities. Even if civic officials are unpaid, there remain unavoidable and non-
trivial transaction costs associated with their activities. Communities in Bolivia have for
the most part long-standing traditions of reciprocal generosity which cover the
transactions costs of community self-government.405 But the extension of these social
institutions to the municipal level has in many places strained such finances beyond the
breaking-point, making it impossible for OC presidents in districts as diverse as Viacha,
Porongo, Baures and Atocha to operate effectively.406
In these terms it is easy to see why civil society was a significant benefit to local
government in Charagua, and a significant liability in Viacha. Charagua benefited from
a highly structured and coherent civil organization dating from before decentralization,
in which communication was fluid and norms of trust and responsibility were strong.
Through it, civic and municipal authorities found it easy to stay in touch with local
demand at the village level, as well as mobilize support for collective efforts. By
promoting local authorities up through its hierarchy, the APG developed its own leaders
internally; and the covenants it signed with NGOs provided it with the modest resources
necessary to conduct its activities. In Viacha, however, civil society was functionally
405 See Albó (1990), Chapters 3 and 8, and Albó, et.al. (1990), Part I, Chapters 2 and 3, and Part III, Chapter 4. 406 Chapter 8 provides details for Porongo, Baures and Atocha.

Theorizing Local Government
206
broken. Its constituent parts did not trust each other, and in many cases could not even
speak to each other. Government travesties in the countryside went unreported in the
city, where civil authorities of all extractions ignored village requests. Civic leaders with
proven effectiveness at the village level were overwhelmed by the pressures and scale of
municipal government. With no budget of their own and depending on official
generosity for their sustenance in the city, they were easily neutralized as independent
actors by government authorities. In Charagua, a civil society which functioned
organically essentially took over local government and made it work. In Viacha society
was a bubbling cauldron of resentment and discontent, composed of people so mutually
suspicious of each other as to make social oversight virtually impossible. Callisaya’s
installation of his own OC only added insult to a deep injury. Viachan society’s inability
to resist such a ludicrous ploy confirms that its internal divisions left it unable to act in
even its most basic defense.
It is instructive to remember that Charagua, while in some ways more
homogeneous than Viacha, is itself a heterogeneous society, with its minority criollo,
Mennonite, Quechua and Aymara populations. Even with a well-functioning APG, it
would have been feasible for Guaraní politicians to assume authority and ignore or
exploit rival ethnic groups. That they did not must in part be due to enlightened
leadership. But it is also due to the value of fairness in such a district. The fact that
Guaraníes are not only the largest population group but form a majority of the population
implies that the question of how to allocate public investment is essentially a problem of
how to share out municipal resources amongst themselves. An arbitrary investment
scheme such as Viacha’s that produced unequal distributions would lead to strife
amongst the Guaraníes, an outcome which Guaraní government would seek to avoid.
Allocations that were fair amongst Guaraní communities but systematically lower for
minority groups might be feasible, if administratively problematic, but would come up
against a different barrier. Most of the wealth in Charagua is held by the criollo
townspeople. Policies which discriminated systematically against them would alienate
them from local government, thus depriving the latter of the technical expertise and
financial resources they controlled. In addition, the moral case made by Guaraníes for
decades was for an end to discrimination and fair treatment at the hands of the Bolivian
state. The fact that they identified themselves for years with a given moral position
(fairness) gave them a strong incentive once in power to defend it. And, coincidentally,
the party which carried the APG to power – the MBL – preached fairness and

Theorizing Local Government
207
transparency during the years that it was effectively shut out of power. Taken together,
these considerations provided Guaraní-dominated government with strong incentives to
fairness in government, and to the transparency with which that fairness might be
announced to the electorate.
In Olson’s terms, there existed in Charagua an “encompassing interest” – i.e. one
whose incentives were consistent with the growth of the collectivity.407 Viacha, on the
other hand, had no encompassing interest, only narrow interests which sought to exploit
power for the short-term gain of narrowly-defined groups. This explains why the role of
history varies so much between the two districts. For centuries both had suffered from
state oppression, extremes of inequality, and periodic outbursts of civil violence. But
Charagua’s history was if anything more repressive and more cruel than Viacha’s,
leaving a potentially deeper reservoir of resentment. And yet it is in Charagua that the
victims of oppression were able to overcome their past sufficiently to reach an
accommodation with the urban elite, whereas in Viacha lingering social tensions
contributed to government breakdown. In Charagua the group that stood to benefit most
from government formed the majority, and therefore had an encompassing interest in its
success. In Viacha, groups that lacked such interest fought for and abused municipal
power to the point of disaster.
An alternative, and tempting, view is to infer from a comparison of the two
municipalities’ demographics that social homogeneity is an important determinant of the
quality of local government. Casual empiricism suggests that homogeneity is positively
associated with communication, trust and social responsibility in a society. Sameness
may also make it easier for civil institutions to elicit contributions for projects of
collective benefit, although its effect on the formation of human capital is difficult to
predict a priori. But the immigrant nations of North America and Australia provide a
clear counterexample of the possibility of organizing heterogeneous civil societies that
function cohesively. They also suggest that the more subtle, multi-dimensional concept
of encompassing interest provides a fuller explanation than simple homogeneity of why
some societies are more cohesive and equitable than others. The topic is addressed in
more detail in the chapter that follows. But for now this study asserts that while
homogeneity may be helpful through its association with social characteristics that lead
to good government, it is not a necessary factor.
407 Olson (2000), Chapter 1.

Theorizing Local Government
208
3. Information and Accountability
The political and economic interactions between diverse actors in society were
evidently important to the quality of government in Viacha and Charagua. But how can
we think about them more systematically? In order to understand events in the two
districts we must be able to distinguish cause from effect and describe a structure within
which protagonists in each district operated. If we are to use these experiences to inform
a more general theory of local government, we need a model.
The political economy and public choice literature has no shortage of these,
including models of voting, lobbying, bureaucratic decision-making, and much more.
This section reviews those most relevant to determine how useful they are in explaining
the divergent quality of government in our two districts. The previous analysis showed
the importance of three factors to effective local government: (i) a competitive local
economy, (ii) openness and competition in local politics, and (iii) well-functioning civic
organizations that represent society’s grass-roots. These factors contributed to
responsive local government in Charagua by conveying information on local needs and
preferences to government officials through the APG’s extensive rural network, and
enforcing accountability on them via electoral competition and the oversight committee.
In Viacha, by contrast, their absence led to crippled mechanisms of accountability and
breakdown in the channels by which information on local needs might be
communicated; the result was a deep insensitivity of elected officials to voters’ needs.
Indeed, the effects of economics, politics and society on local government can, at the
limit, be reduced to information and accountability. I define these terms as follows:
i. Information. A mechanism exists by which citizens’ policy preferences are revealed to government officials. This typically occurs either through the selection of politicians with majority-preferred platforms, or the communication of the majority’s preferences to elected officials.
ii. Accountability. A mechanism exists by which elected officials are held responsible to voters for acting upon this information. By placing power over officials in the hands of voters, the former are given incentives to act in the interests of the latter.
The following uses these concepts as a lens through which to review the
literature, focusing specifically on how information can be used to make government
accountable to voters. I examine how existing models provide for each, and discuss
whether the mechanisms involved are consistent with the major features of the previous
two chapters.

Theorizing Local Government
209
3.1 The Literature
Tiebout (1956) offers no such mechanism. His is a world in which district
governments offer different public good-tax bundles, and individuals allocate themselves
costlessly across districts according to their preferences for the same. A competitive
equilibrium in locational decisions ensues. Local government is not responsive to
“voters”, rather voters are responsive to local governments. Voting-with-your-feet
models generally share this characteristic, making them inappropriate for the analysis of
information and accountability as described above.408
The more general question is how the demand for public services409 is joined
with supply. Tiebout-type models posit individual mobility as the mechanism, whereas
other authors (see below) rely on voting. Which is more useful? Consider the
reasonably common occurrence where more than half a district’s population opposes its
local government. Does the majority vote to change the government, or does it move to
another district? It seems self-evident that the costs of the latter are significantly larger
than those of the former – at either the individual or aggregate level – and hence that
moving is an unrealistic remedy for poor government. Seen in this light, the many
empirical studies of voting with your feet410 would seem to estimate marginal Tiebout-
type effects operating in larger decision frames. That is, within a broader decision to
move, a household’s decision of where to move to is likely to be affected by the quality
of public services, level of local taxes, etc. But the basic decision whether to move – a
costly and highly disruptive event411 – is likely to be based on a larger set of
considerations. I argue that citizens dissatisfied with local government will turn first to
voting and other political instruments to effect change, and only much later to moving
from the district. Accordingly, our primary focus should be on the local political system.
Subsequent models of decentralization, such as Besley and Coate (1999) and
Bardhan and Mookherjee (1998 and 1999) among others, place voting in a more central
role. To varying degrees they rely upon Downs’ (1957) median voter result to
select/inform politicians with regard to voter preferences, and hold them accountable for
the policies they subsequently implement. These models have the virtue of realism,
408 Rubinfeld (1987) has observed that Tiebout’s model, used for decades to analyze decentralization, is not actually a model of decentralization. 409 Unless specified, public “policy” and “services” are used broadly interchangeably here. 410 See Cebula (1979), and Cebula and Kafoglis (1986) for reviews of this literature. 411 Psychological studies consistently rank moving house amongst the most stressful of life events, alongside death in the family and divorce.

Theorizing Local Government
210
invoking a dynamic which would seem to predominate in decentralized, democratic
countries.
But voting carries with it problems of its own as a mechanism for both
accountability and preference revelation. Most obviously, it offers only weak constraints
on the actions of elected officials between elections, via calculations of the effects of
policy decisions on officials’ future chances of re-election. In a context of preference
aggregation this implies that accountability may well not operate over issues that are
small, or affect isolated populations within an electoral district. Additionally, voting a
government out of power may be too blunt an instrument for effective accountability
where complex or nuanced policy questions are concerned.
More subtly if government exists primarily to provide public goods, then at least
some component of voter satisfaction with their provision must relate to the “publicness”
of these goods. Relevant characteristics of public education and health, for example,
may well include not only their quality and cost, but their extension and accessibility
throughout the population. In other words, voters may endogenize the private utility of
other individuals from public services. But the simple median-voter model presumes
rational individual voters who lack obvious horizontal connections for the transmission
of such information. Such a criticism is at best implicit, as there is nothing in these
models to prevent such horizontal linkages from occurring. But if they are indeed
important to voter’s appreciation of public goods, and hence to electoral outcomes, they
should be made explicit in our models of local government.
But the fundamental objection to voting is the well-known difficulty of finding
an equilibrium. The possibility that voting in a multi-dimensional space will lead to
cycling was recognized over two hundred years ago by Condorcet (1785). If a voting
equilibrium cannot be shown to occur, then elections are an indeterminate method of
social choice. For our purposes the problem can be divided in two:
(a) Existence – the existence of a stable equilibrium in multi-dimensional space; and
(b) Instrument – voting as a means for bringing about such an equilibrium.
We take each in turn.
Black (1948), building on Hotelling (1929), showed that the majority voting rule
can bring about equilibrium in single-dimensional space given single-peaked
preferences. But both uni-dimensionality and “single-peakedness” are implausible if
votes are to transmit information. Local government provides services in many different
areas, each of which constitutes a policy – and hence informational – dimension. Indeed

Theorizing Local Government
211
even individual policy initiatives can be multi-dimensional when voters care about more
than one aspect (e.g. the cost, quality and location of a school). To assume that elections
operate in just one dimension is thus highly restrictive. And given multi-dimensional
concerns, single-peaked preferences on individual votes are improbable. Davis,
DeGroot and Hinich (1972) provided a way forward by showing that under majority
rule, equilibrium can obtain in multi-dimensional space as well, but at the cost of four
restrictive assumptions about preferences: (i) reflexivity, (ii) completeness, (iii)
transitivity and (iv) the extremal restriction. Taken together, these restrictions specify
the form that individuals’ preferences must take when they are non-identical. This, as
Kramer (1973) illustrates, is highly unlikely to arise naturally.412
If the existence of an equilibrium is problematic, the literature on voting does not
offer an obvious solution. Approaches to voting can be broadly divided into
deterministic and probabilistic models. Where voting is deterministic, difficulties
concerning the existence of majority-rule equilibria map directly into electoral results, as
the problem of finding a multi-dimensional candidate or platform that defeats all others
is equivalent to finding an issue in multi-dimensional space that is majority-preferred.
Researchers have found one way around this through the claim that all (multi-
dimensional) political issues can be collapsed into a single left-right dimension.413
Piketty and Spector (1995) generalize this claim by modeling a process in which rational
communication causes beliefs to converge toward a one-dimensional axis. A number of
empirical studies that test the median-voter hypothesis claim support for this position.414
If true, the instrumentality of voting and debate would serve to transform multi-
dimensional preferences into a theoretically tractable uni-dimensional decision space,
thereby solving the existence problem. But voting of such a nature would not satisfy the
condition of information, and by extension accountability, set out above. Complex
information on the nature and intensity of voters’ preferences for different types of
government services, and accompanying taxation, would be collapsed – and thereby lost
– into a single left-right instrument of (dis-) approval. If individuals’ preferences are to
be revealed across a range of policy issues, the exercise must be resolved in multi-
dimensional space.
412 In simulation exercises “when no special restrictions are placed on the types of preference orderings individuals may have, the probability of a cycle is high, and approaches one as the number of alternatives increases.” – Mueller (1989), p.81. Mueller recommends Niemi (1969) and Riker and Ordeshook (1973) for reviews of this literature. 413 See, for example, Poole and Romer (1985).

Theorizing Local Government
212
A more sophisticated solution to the problem of existence comes through
probabilistic voting, which assumes that voters vote for a candidate according to a
probabilistic function of the candidate’s position.415 By smoothing out the discontinuity
inherent in a deterministic voting function, this approach cuts through the thicket of
cycling results to permit voting equilibria in multi-dimensional space. But it does so at
the significant cost of introducing uncertainty on the part of voters regarding candidates’
positions, or of candidates regarding voters’ preferences, or both. If candidates and
voters cannot know where each other stand, the informational content of elections will
be weak. In a way comparable to the dimensionality collapse described above, the
probabilistic approach neutralizes the ability of the vote to convey information.
More recent work has departed from the strictures of the median-voter approach
in a number of interesting ways. Besley and Coate (1995) model a political process
featuring citizen-candidates and no restrictions on the number or type of policy issues to
be decided. Individuals vote over the preferences and competence of candidates, about
which they have complete information, and candidates who win implement their
preferred policies. Policy outcomes are efficient. Their model solves the problem of
existence without directly addressing that of information. In a multi-dimensional policy
world, elected officials have no way to distinguish which of their own policy preferences
are majority-preferred and which are not. As a result, they simply act on their own
priorities, making them a sort of elected dictator. Such an approach resembles politics in
Viacha, not Charagua, and is unlikely to capture the key differences between the two.
Piketty (1995) explores the extent to which voting can be used to communicate
preferences through a model in which individuals are intermediate between strategic and
sincere voters. He finds that two-round electoral systems permit more efficient
communication than one-round systems. While this model is more nuanced than many
previous attempts, the mechanism is too simple to permit the transmission of detailed
information on multi-dimensional policy preferences, and hence does not satisfy the
initial criteria set out above.
This leaves us with a significant dilemma: models of voting in a multi-
dimensional world cannot be solved while maintaining the integrity of information on
voters’ complex preferences over fundamental issues of public policy. And if elections
cannot transmit information, how does effective accountability come about? Officials
414 Inman (1979) surveys this literature. Mueller (1989) disputes the strength of these results.

Theorizing Local Government
213
may be ejected from office, but what lessons will their successors learn about which
policies the majority prefers?
The “rational ignorance” strand of the literature provides bleak answers to these
questions. It builds on Downs’ idea that individuals have a negligible probability of
affecting electoral outcomes, and hence rational voters will not expend time or energy
informing themselves about candidates. The voter is carried to the polls by social
conditioning, but lacks the information required to make a discriminating choice. Such
rational ignorance about candidates and issues drains the vote of meaningful
information, and with it the power of elections to enforce accountability. Quite apart
from the technical characteristics of the instrument, people are unwilling to use it.
Brennan and Buchanan (1984) take this further, describing voting as an expressive act,
like cheering at a stadium. The inconsequential nature of a single vote frees the
individual to allow “non-substantive” factors to sway his decision – slogans,
advertisements, peers. The likelihood that such random factors determine electoral
outcomes implies that the vote is empty.
While it is important to recognize the limited ability of our theory to explain
policy outcomes, we must guard against being overly critical. Many of its shortcomings
are due to features which are realistic. Most real-world elections evidently do occur in
one-dimensional space, for example. Despite complex policy preferences we cast a
simple vote in favor of a single candidate or party. Hence it is not necessarily our
models of voting that are limited, but rather our real voting systems. Or, more
interestingly, the way we model government. It is possible to go beyond simple electoral
mechanisms to consider a comprehensive government regime that captures the complex
reality of political competition in multi-issue, multiple-priority space.
Consider the evidence from Charagua and Viacha. The Charaguan municipality
had considerable information on local needs available to it, but this did not come through
the vote. Rather it came through civil society – specifically through the explicit
incorporation of civic organizations into the municipal planning process, directly and via
the OC. In Viacha this channel was blocked, the OC disabled and civic organizations
weak, and government remained largely uninformed about what its voters wanted. But
in both elections were held regularly according to the minimum standards specified by
law. Information did not obtain in the way voting models define, and these models
415 Mueller (1989) reviews and summarizes this literature.

Theorizing Local Government
214
cannot explain how it was in fact revealed (in Charagua). So too with accountability. In
Charagua accountability was enforced through the combination of a well-functioning
electoral system featuring substantive competition, and active civic organizations which
mediated policy-relevant information between communities and town hall. This
provided voters with the necessary inputs to judge the performance of their local
government, as well as the means to enforce their will. Accountability was binding, and
local officials responsive. In Viacha by contrast, town hall and the hegemonic political
party joined forces to undermine civic organizations and corrupt the electoral mechanism
through endless shenanigans and political machinations. Accountability was crippled
and corruption and mismanagement flourished.
The insertion of civil society into the local government process was thus key to
information and accountability in both districts. Charagua provides clear examples of
this. There some villages were happy with a school the municipality built, while others
delighted in the repairs their road received. Still other villages were satisfied despite
obtaining no investment from their local government. But how did local government
know where to site specific projects? How did it avoid giving a hospital to the village
that preferred a school? And how did it know which communities it could leave
unattended? The leaders of these villages were in no doubt that the information was not
electoral, but came, rather, through their direct participation in the governing process.
They informed officials about local needs and explained to communities receiving
nothing that their turn would come. The public choice models reviewed above
contemplate no civic mechanism, and hence provide little insight into why government
in these two districts was so very different. Hence we need a new model.
What follows is an attempt to provide one derived inductively from the results of
Chapters 5 and 6. It adheres to the maxim that in order to analyze local government
decision-making we must first describe how local government works. Our departure is
the simple observation that the voting models discussed above do not represent the
familiar local government systems common in most Western democracies. In addition
to voters, politicians and elections, we observe civic groups, producer and consumer
lobbies, newspapers and diverse media, and other actors who lobby, advocate, oversee
and otherwise participate in the policy-making process, with important effects on policy
outputs. Our task is to incorporate such actors into the local government system, and
describe their channels of influence over policy-making.

Theorizing Local Government
215
4. A Two-Stage Model of Local Government
This section describes a two-stage model of local government which incorporates
realistic features of observable local political systems, and handles multi-dimensional
policy space through a simple, sequential structure. I follow Williamson’s (1995b)
injunction regarding commonly verifiable assumptions and the primacy of discrete
structural over marginal effects; the framework incorporates important features of local
government identified in the field. The model is described, but not formalized here.
Assume a two-stage local government game. In the first stage, politicians
compete in elections for control rights over public institutions, public resources and the
right to make local policy. The second stage consists of a number of single issue sub-
games in which civic and private actors lobby elected officials for policies that favor
them. There are as many sub-games as there are distinct policy questions. The overall
model is simple, analytically tractable, and incorporates realistic elements of electoral
and lobbying behavior. It handles multi-dimensional policy space in a straightforward
way through an institutional structure which separates the allocation of power to political
agents from substantive policy decisions. In so doing, it provides a natural way to
incorporate non-voting actors (e.g. civic groups, firms) into the policy-making process.
In the first stage, control over the institutions of government is allocated to a
particular set of individuals via elections, which serve an establishing/legitimizing
function. These elections occur in a single dimension, which I identify not as “left/right”
but rather “trust” or “confidence”. The resolution of complex concerns about candidate
ability and priorities into a single dimension of trust is an idiosyncratic, unobservable,
voter-specific process. Since the results of such calculations are externalized through the
vote, the underlying process need not be modeled explicitly.416 Moreover, the structure
of the model implies that individual policy outcomes are not determined by prior
electoral equilibria; that is, we may take the identity of elected officials as given. The
winners of elections enter into implicit contracts with voters, which can be renewed or
terminated at the following election. These contracts are necessarily incomplete on
account of the intrinsically unforeseeable, and hence unspecifiable, nature of political
contingency, and on account of voters’ bounded rationality. Voters can no more know
candidates’ future policy actions than they can predict future policy surprises; indeed,
they cannot even appreciate the full (i.e. general equilibrium) consequences of
416 In this respect my framework follows the spirit, if not the form, of Besley and Coate (1995).

Theorizing Local Government
216
candidates’ stated platforms due to their humanly limited computational skills. The
indeterminacy of voting in multi-dimensional space is thus rendered irrelevant.
Given the incompleteness of political contracts, candidates’ platforms do not represent
legislative agendas, and voters do not seek to anticipate candidates’ policy decisions
once elected.417 Platforms are instead instruments that signal candidates’ political
values, broad policy priorities, and ability to govern. Voters vote for the candidate they
trust most, not least to cope with unforeseen future problems. They vote over single-
dimensional personalities (i.e. “trust”), and not multi-dimensional issues. The vote
allocates power, it does not bear information. This interpretation reconciles appealing
features of both the rational ignorance and median voter approaches. Like the former,
voters do not expend energy learning about candidates’ policy proposals. But this is
because of bounded rationality and incomplete political contracts, and not because voters
do not seek to influence political outcomes. Indeed, like the latter approach they seek to
determine elections that take place in a single dimension – candidate “trustworthiness”.
Such factors, which the rational ignorance view considers “non-substantive” personality
issues, are in fact the only thing that matter.
In the second stage political competition is in some sense replayed, but with
different rules and different players in discrete settings which treat the various
dimensions of local policy one-by-one. Here the local government process devolves into
issue-specific sub-games in which the institutions of local government (e.g. mayor, local
council) are lobbied by private sector and civic organizations (e.g. firms, producer
lobbies, traditional tribal structures, neighborhood associations, issue-specific interest
groups, NGOs) over specific policy decisions. The precise characteristics of these sub-
games – and the equilibria that may result – depend upon the characteristics of the
question at hand; this allows us to deal with such factors as history, ideology, and the
organizational structure of local society. But all share a simple over-arching structure.
Each stage two decision process can be described as a simple n-player game, where
players include interested civic and private organizations who compete to lobby a local
government decision-maker. The object of each sub-game is a decision regarding a
particular policy question (e.g. build a school, issue a bond). Hence each sub-game
occurs in uni-dimensional policy space. Through their lobbying, players reveal the
payoffs they will provide the decision-maker if the policy is implemented in terms of

Theorizing Local Government
217
cash and expected votes at the next election. Cash payoffs must be non-negative,
whereas vote payoffs can take positive as well as negative values. Players’ ability to
provide cash and votes will vary. Once all vote-cash pairs have been revealed, the
government official’s decision consists of a simple constrained maximization in which
she maximizes her payoff subject to sufficient votes to be re-elected in the following
period.418
Stage two is thus where preference revelation occurs. Sub-games are preference-
revelation incentive compatible as the events that trigger them – whether planned to a
regular schedule (e.g. the public budgeting process, the public works program) or not
(e.g. an external shock) – naturally call forth the lobbying efforts, testimony, demands,
and expressions of interest of diverse parties. Voters and organizations that are
indifferent remain on the sidelines. All of this information enters the political arena, and
based on it a decision is taken. This part of the model relies on the pressure group
politics literature of scholars such as Bentley (1967), Finer (1997) and Truman (1951),
which claims that “real” democratic decision-making is a function of the interaction of
such groups with government officials.
If stage two is where specific policy outcomes are determined, the quality of
elected officials is set in stage one. The trust over which individuals vote will be based
on their impressions of candidate ability. Where candidates have experience in
government, their records will tend to weigh heavily in this calculation.419 In an open,
competitive political system where information flows freely, corrupt agents will be
associated with low trust and will have difficulty being re-elected. Crooked candidates
will have to deform the political system to win elections consistently. The fairness and
transparency of the electoral mechanism is thus essential to the proper operation of the
local government model. This is consistent with the discussion of good and bad political
agents in section 2.2 above, and is supported by the experiences of Viacha and
Charagua.
A key assumption of the model is that preference revelation involves the
mediation of intervening organizations. Voters do not reveal their preferences
417 This is similar to Austen-Smith and Banks (1989), who find no necessary structural relationship between post-electoral policy outcomes and candidates’ announced electoral platforms. 418 A stochastic term can be added to a policy outcome function, or equivalently to a voter turnout function, to prevent politicians being able to ensure re-election through the policies they enact. 419 This constitutes a feedback mechanism from stage two outcomes to stage one elections.

Theorizing Local Government
218
individually, as per median-voter models.420 Rather an initial round of preference
aggregation is carried out by the spontaneously occurring organizations of civil society
and the private sector. Thus an intermediate stage ensues in which partially aggregated
preferences are revealed for public consideration in advance of the policy making stage.
These actors then represent group-collective preferences to policy makers in the second
stage of the governing process. Hence much will depend on the quality of these
organizations and the rules and norms that govern their interaction. Questions of interest
include: Is the sub-game dynamically transparent? Is it open to participation by all? Do
organizations, and the interplay amongst them, elicit a broadly representative range of
opinion from interested parties such that no players are privileged/dominant? Where
these questions can be answered affirmatively, the resulting equilibria should entail
political accountability in the strict sense that policies implemented are majority-
preferred.
Another approach to these questions is to ask how the civic organizations that
represent the poor or marginalized interact with other actors in the sub-game context.
Private sector firms and associations will tend to have relatively strong cash
endowments, and relatively weak vote endowments with which to engage in sub-game
strategies. By contrast the civic organizations of the poor will tend to be relatively well-
endowed in votes and badly endowed in cash. Middle class civic organizations will lie
between these extremes. Because cash is easier and cheaper to administer and offers
policy-makers the prospect of immediate gratification, the poor enter a sub-game
dynamic at a disadvantage. But in a developing country such as Bolivia where the poor
are in majority, their countervailing electoral advantage may compensate. Much
depends on the skills such groups display in eliciting members’ needs and opinions.
Much also depends on their ability to mobilize the vote. Both sets of activities rely on
civic groups’ ability to communicate information credibly: upwards in the case of
preference revelation – from individuals to elected officials; and downwards in order to
mobilize the vote – informing citizens about candidate quality and policy commitments
in a way which coordinates voting behavior and achieves favorable electoral outcomes.
Section 2.3 above discusses the characteristics of civic organizations that are
politically effective. Where these traits obtain amongst the poor, their civic
organizations can comprise a resilient social network capable of mobilizing the
420 Indeed, the only way voters can know what aggregate preferences are in these models is by observing

Theorizing Local Government
219
information, social support and votes necessary to counterbalance the advantages natural
to other interest groups. Such organizations are well-armed to compete effectively for
power and resources in the political arena. But policy outcomes depend on the
characteristics of the political system as well. Section 2.2 discusses the traits of the
vigorous, competitive political system associated with good government. Such a system
will spur the political entrepreneurship and policy innovation necessary for political
exclusion to be arbitraged away, leading – as in Charagua – to a broadly representative
local politics. Distortions can come from civic or economic actors, in both stages one
and two. In Viacha, for example, the brewery damaged the integrity of electoral politics
by actively undermining opposition parties through bribery and intimidation; they used
similar tactics to cow civic organizations and rival private groups, and quell grass-roots
dissent. In both stages of the game, the CBN-UCS managed to effectively clear the field
of other players, leaving it a free hand to do as it pleased. From these experiences arise
the observations in section 2.1 about the importance of openness and competition in the
local economy.
In addition to incomplete contracts and bounded rationality, the model presented
here relies on the ideas of costly transactions and hierarchy from the new institutional
economics. Why do individuals organize into civic groups in the first place? Because of
the transaction costs of attempting to sway policy in stage-two sub-games. Collective
action through civic hierarchies – whether preference revelation or vote mobilization – is
more effective421 and cheaper than attempting to coordinate individual actions through
the market. Another implicit NIE concept is weak-form selection. Civic and private
organizational forms that are less successful in stage two should be de-selected over time
in an open, competitive governance system, as losers mimic winners and organizations
experiment with structure. Indeed, one of the most important consequences of Viacha’s
closed politics was the crippling of this mechanism. Weak civic organizations were
sustained and even propagated by a governance regime that was impaired so as to
prevent effective political competition in the second stage. In Charagua, by contrast, the
mechanism’s effectiveness was evident in the institutional changes it wreaked, as the
MBL and MNR vied to attract votes by adopting Guaraní candidates and political
positions.
electoral outcomes 421 Especially where public goods are concerned.

Theorizing Local Government
220
5. A Testable Conceptual Framework
Our task is not only to explain the processes that comprise local government
theoretically, but also to operationalize these ideas in such a way that they can be tested
empirically through the type of qualitative, interview-based research used in Chapters 5
and 6. Fortunately this is not difficult to do. Begin by dropping the staging of the
previous model, which – if important for the theory – is not important for empirical
work. This is because individual voting decisions are not observable, but overall voting
outcomes are. Hence I can take electoral results as given and focus attention on the
social and political dynamics of stage two (including examining political feedbacks into
the unobserved electoral process of stage one), to which qualitative data are in any event
better suited. To be useful, the new framework must relate to real, observed outcomes. I
define these as the policy outputs determined by the institutions of government. Hence I
collapse the model into an atemporal conceptual framework focusing on the institutions
of local government: mayor, municipal council and oversight committee, and the
decisions they make. I proceed by delving into qualitative attributes of the previous
model’s key relationships more carefully. These are characterized in such a way as to
render them directly comparable as social actors or political agents that compete for
influence or control over public institutions. Although I cannot observe the vote-cash
pairs that private organizations offer elected officials, through my interviews I do
indirectly observe their attempts to lobby government. And I observe what they obtain
first-hand via policy outcomes. This suffices to allow deep, multi-faceted insight into
how the system of governance operates in the districts I examine, as we shall see below.
5.1 The Framework
Local government is a hybrid. Its function is to produce local services and
policies at the intersection of two market relationships and one organizational dynamic.
Hence local government occurs at the confluence of two distinct forms of social
interaction. Political parties and politicians are at the center of both market relationships.
The first of these occurs between parties and individual voters. This can be thought of as
the primary, or retail, political market in which parties exchange ideas and declarations
of principle for votes;422 parties compete with promises and ideas to attract voters, who
vote for the party or candidate that inspires the most confidence. The second market
connects parties to private firms, producer associations, and other economic and issue-
422 Schlesinger (1984) describes a political market which is similar but not identical.

Theorizing Local Government
221
oriented interest groups.423 This can be thought of as a secondary, or wholesale, political
market in which specific policies or entire policy bundles, as well as broader influence
over legislators and the policy-making process, are sold to interest groups in exchange
for money.424,425 For simplicity, I assume from here onwards that civic organizations do
not engage in this market; the assumption is supported by evidence from all nine case
studies. The first of these relationships is intrinsic to the process of representative
democracy. The second is derivative but compelling, arising from political parties’ need
to fund election campaigns and sustain party operations.
It is important to emphasize the distinction between politicians/parties and
government institutions: it is politicians and not governments who compete for votes in
elections; likewise, it is not governments who sell influence in exchange for campaign
and political funds, but the parties and politicians who control them. I follow Downs in
defining party as “a team seeking to control the governing apparatus by gaining office in
a duly constituted election.”426 This raises a wealth of complex ethical issues concerning
the mechanics of political finance and the limits of official responsibility. For purposes
of the analysis that follows, I sidestep these issues by assuming that elected politicians
engage in this secondary market as politicians, and not as governing officials, observing
the organizational and behavioral constraints necessary to ensure this is so. The fact that
such constraints are regularly violated in practice does not contradict the logic of the
argument, nor its generality.
The second form of social interaction in local government involves civil society
conceived as a collectivity or set of collectivities – as opposed to atomized individuals –
and their relationship with the institutions of government. Where governance is
concerned local civil society operates like a complex of organizations, aggregating
preferences and representing communities’ needs, mediating community participation in
the production of certain services, facilitating social expression and the assertion of local
identity, and enforcing political accountability on the institutions of government. It is
not useful to conceive of it as a quasi-market, either internally or in its dealings with
government, as its dynamics are not founded on buying and selling. It is rather a set of
423 Interest groups form around specific issues as well, although this is more common in richer countries. 424 Schlesinger explicitly rejects the possibility of such a market, on apparently moral grounds. I assert that the party system does operate in this fashion, as even casual observation of US politics illustrates. 425 The relationship between campaign contributions and policy-making has been tested empirically, with positive results, by Ben-Zion and Eytan (1974), Palda and Palda (1985), and Poole and Romer (1985), amongst many others. 426 op.cit., p.25.
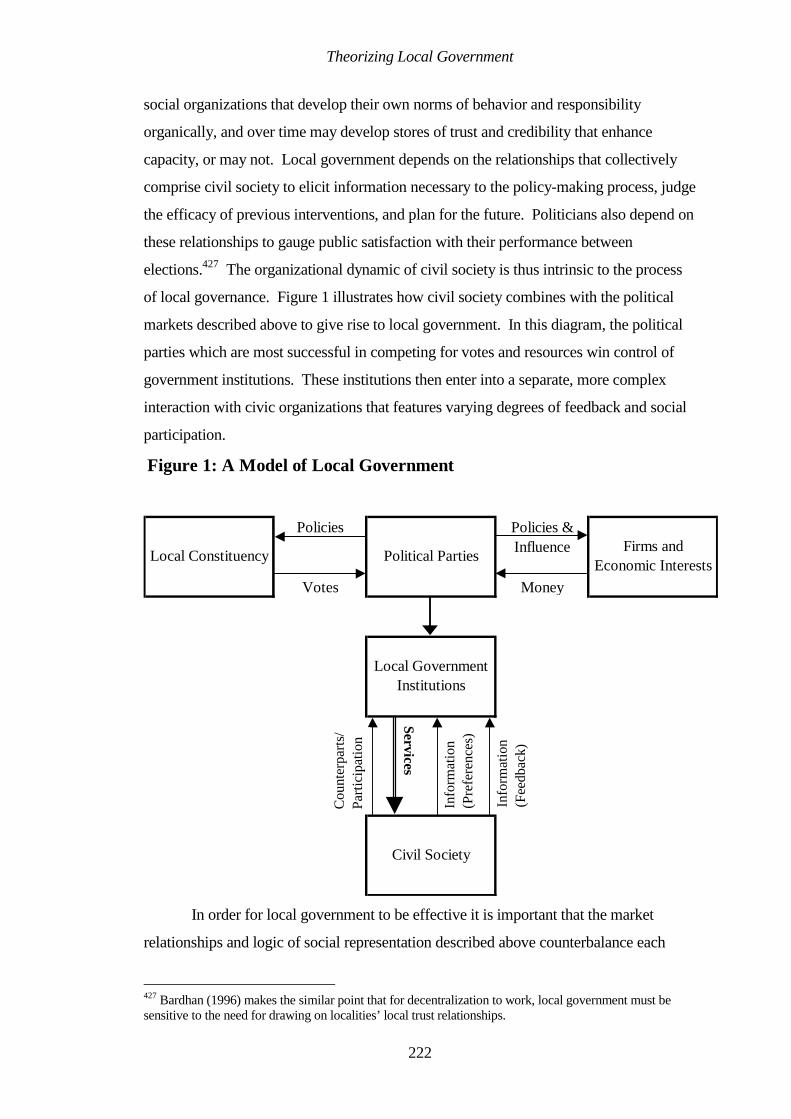
Theorizing Local Government
222
social organizations that develop their own norms of behavior and responsibility
organically, and over time may develop stores of trust and credibility that enhance
capacity, or may not. Local government depends on the relationships that collectively
comprise civil society to elicit information necessary to the policy-making process, judge
the efficacy of previous interventions, and plan for the future. Politicians also depend on
these relationships to gauge public satisfaction with their performance between
elections.427 The organizational dynamic of civil society is thus intrinsic to the process
of local governance. Figure 1 illustrates how civil society combines with the political
markets described above to give rise to local government. In this diagram, the political
parties which are most successful in competing for votes and resources win control of
government institutions. These institutions then enter into a separate, more complex
interaction with civic organizations that features varying degrees of feedback and social
participation.
Figure 1: A Model of Local Government
Firms and Economic Interests
Local Constituency Political Parties
Policies
Votes
Policies &
Money
Influence
Local Government Institutions
Civil Society
Cou
nter
part
s/P
artic
ipat
ion
Services
Info
rmat
ion
(Pre
fere
nces
)
Info
rmat
ion
(Fee
dbac
k)
In order for local government to be effective it is important that the market
relationships and logic of social representation described above counterbalance each
427 Bardhan (1996) makes the similar point that for decentralization to work, local government must be sensitive to the need for drawing on localities’ local trust relationships.

Theorizing Local Government
223
other, and none dominate the others. A stable tension between the three elements creates
a self-limiting dynamic in which the impulses and imperatives of interest groups can be
contained within the bounds of political competition, and do not spill into the machinery
of government nor erupt as civil strife. This is equivalent to allowing the economic,
political and civic conditions outlined in the model above to obtain. Breaking this
tension, on the other hand, can hobble government. Where the market for votes is weak
or missing, government will tend to be undemocratic; where the economic market for
political influence is weak, government may be insensitive to economic conditions; and
where society’s civic organizations are weak government will be lacking in information,
oversight and accountability. In the interplay between these, the market for influence
has the advantage of being a continuous process of exchange in which the priorities of
economic interests are constantly brought to policy-makers’ attention. By contrast, the
electoral dynamic is binding on local governors only intermittently at elections. This
lower periodicity is balanced however by the severity of the potential consequences – the
ejection of politicians from power. These imperatives are therefore roughly balanced.
Under usual circumstances, as discussed above, civil society is at a comparative
disadvantage. Despite having the most pervasive network of the three, the instruments
which civic leaders can deploy to influence policy define the extremes of costs and
consequences. They carry in one hand the relatively inexpensive lever of public
complaint and admonishment, including encouraging the grass-roots to vote in a
particular way. But experience indicates that this tool is weak against well-financed
politicians with strong incentives to continue along a particular course. In its other hand
society carries the threat of demonstrations and civil disobedience, culminating in civil
revolt. This instrument is powerful indeed, but also very costly to deploy, and is only an
effective threat when levels of social discontent have passed a given, relatively high
threshold. The genius of Bolivian decentralization was to include civil society directly in
the local governance process via oversight committees, thus making accountability an
explicit and continuous process. Bolivian society now has a third instrument at its
disposal: the ability to freeze all central disbursements to municipalities – and thus
effectively cripple the vast majority of the country’s districts – if it is dissatisfied with
local policy. This, along with the direct insertion of the OC into the policy-making
process, gives it a permanent voice and continuous participation in how it is governed. It
allows public problems to be identified at an incipient stage, before discontent rises

Theorizing Local Government
224
dangerously.428 It also levels the playing field between the competing logics of market
and representation that are intrinsic to local government.429 But in doing so it increases
the premium on social trust and responsibility and the coherence of social organizations,
which enable civil organizations to effectively represent their interests before
government.
6. Conclusions
Thus we see how careful consideration of a wealth of information from a very
good and a very bad municipality yields a theory of local government which can
untangle the conceptual knot of multi-dimensional policy space by incorporating realistic
institutional features observed in the field. This theory is in turn resolved into a
conceptual framework that can be tested with qualitative, interview-based information.
Chapter 4 noted that while the fundamental argument in favor of decentralization is
based on accountability and responsiveness, how these attributes come about is not
elucidated. Theories lacking a convincing micro-political foundation for presumed
mechanisms of accountability ultimately fail to explain why decentralized government
should be more responsive than the centralized variety. We know how decentralization
should work, but we do not know why it should. This failing is mainly due to the lack of
a theory of local government. Failure to understand how local government works
implies ignorance of how it differs from central government.
This chapter provides a theory of local government. The key difference between
local and central government, and the key to why decentralization works, is contained in
the second stage of the local government game. There is nothing comparable in central
government to the incentive-compatible social dynamic of sub-games focused on
specific policy issues. Indeed nothing in central government can be comparable.
Unelected agents will lack clear incentives to obtain necessary local information. And
civic and private organizations will lack the means to affect policy. Under central
government the first element of vote-cash pairs will not operate with local specificity;
and the second half – in the absence of elections and hence the need to finance them –
will constitute bribery. Local interest groups will thus be limited to voting in national
elections and contributing to national campaigns, and accountability for local policy
428 The counter-example of Viacha, with its neutralized OC, highlights this point. 429 Indeed, the timing of events in Charagua suggest this. The APG existed from the mid-1980s, but it was not until the first election after decentralization that everything changed.

Theorizing Local Government
225
decisions will not obtain. Hence our model of local government can explain not only the
phenomena observed in Viacha and Charagua, but also the results of Chapters 2 and 3.
By creating 198 municipalities and initiating second-stage dynamics throughout Bolivia,
decentralization made government more responsive to local needs. It granted both
political voice and real power to civic groups and the poor, as well as private-sector
interests, and made policy makers accountable to the citizens they represent. Public
investment became progressive in terms of wealth and need.
The separation of political selection from policy decision in our model reflects
Breton and Galeotti’s (1985) distinction between the two principle views of the role of
elections in democracy. In the first of these, elections serve primarily to choose a
government, which governs so long as it retains the confidence of parliament. In the
second, elections are primarily to signal public preferences to government, which seeks
to satisfy them. The ideal of the first view is a sort of elected Hobbesian sovereign,
while the ideal of the second is Athenian democracy. The distinction is all the more
important because it is ignored by the median-voter model.430 This paradigm conflates
the two ideas, and the confusion is central to understanding its basic weakness. In the
Athenian ideal, individuals present their own views directly by debating and voting on
discrete legislative proposals. The problems of revealing and transmitting information
are solved when citizens vote directly in assembly. In representative government, on the
other hand, individuals vote for people to debate and decide legislative issues for them.
Representatives are not many-stringed puppets who on any issue merely voice the views
of their constituents. They are professionals whose job it is to inform themselves about
policy options and act in their district’s best interests. Voters, having delegated this
responsibility, are thus free to get on with their lives. By positing elections as a
mechanism not only for candidate selection but also preference revelation, the median-
voter model simultaneously invokes two conflicting views of representation, and creates
an insoluble problem. The model proposed here solves the problem by separating the
functions into two distinct stages of the government process.
The chapter that follows will test the ideas developed here against evidence from
seven additional Bolivian municipalities. But before doing so, it is instructive to do the
same quickly for Viacha and Charagua. In Charagua the rural Guaraní population was
strongest in the market for votes, which they distributed between two parties, while
430 As well as by much of the literature on representative government.

Theorizing Local Government
226
economic power was overwhelmingly concentrated in the hands of its cattle-ranchers.
But Charagua’s civic organizations were also in essence run by Guaraníes through the
APG, an organization as structured and disciplined as it is legitimate in the eyes of most
residents. There was thus a tension between competing sources of power in Charagua
which resulted in balanced government with substantial social participation. In Viacha
the panorama was utterly different. There, both the market for influence and that for
votes were dominated by the brewery and its political offshoot, the UCS. And civil
society was divided along ethnic and historical lines, riven with hostilities and mistrust,
which rendered its organizations incapable of cooperation and unable to work with
government institutions in any substantive way. Local government was thus completely
unbalanced. Having mastered the market dynamics out of which government arises, the
UCS was able to perpetuate its corrupt and ineffective rule in the absence of any
countervailing economic, political or social forces which might have moderated it or
demanded accountability. The framework thus appears to explain the quality of local
government in the two districts adequately. The next chapter examines seven more
municipalities in order to tests its insights and extend its generality.

Testing the Theory in Seven Municipalities
227
8 Testing the Theory: The Micro-Political Foundations of Government in
Seven Bolivian Municipalities
1. Introduction
So far Part II has examined the determinants of effective local government in two
extreme cases of good vs. bad municipal performance by delving deeply into the social
relations and economic and political dynamics which underlie governing institutions in
each. I developed a model of local government which (i) describes how government
works, and (ii) identifies key relationships between voters, firms, interest groups and
civil society on the one hand, and elected politicians and the institutions of local
government on the other. I showed how imbalances amongst these relationships can
cripple accountability and distort the policy-making process, and located the
fundamental causes of good and bad government in the economic structure of a district
as it relates to the political party system, and in the cohesiveness and institutional
capacity of its civil society. This chapter extends the analysis by applying the model to a
further seven municipalities with diverse characteristics, in order to test its insights and
generality and thereby refine its structure.
The municipalities in question were studied at the same time and in the same
way as Viacha and Charagua, through a systematic program of extensive semi-structured
and unstructured interviews of local government and community leaders, key
informants, and citizens at the grass-roots level. Detailed financial, administrative and
geographic information was collected in each district.431 As in Viacha and Charagua, the
field work was largely focused on recording the opinions of people at the neighborhood
and village level on the quality of public services and local government they received,
and then determining how these outcomes came about. The municipalities were chosen
to include Bolivia’s main regions, ethnicities and cultures, and to mirror the country in
terms of size, population, degree of urbanization, and economic base. The group thus
“represents” Bolivia in the weak sense of representing each of its essential characteristics
431 This is explained in more detail in Chapter 4.

Testing the Theory in Seven Municipalities
228
in one or more of its number, and not in the strong sense of a representative sample used
in the econometric work of Chapters 2 and 3. The absence of opportunities for statistical
inference is hopefully more than compensated, however, by the depth of the analysis that
this approach makes possible.
Of the seven municipalities, two are on the altiplano: Desaguadero, perched on
the edge of lake Titicaca by the Peruvian border, and Atocha, in the heart of Bolivia’s
southern mining country in Potosí. Two are in the valleys region of Bolivia between the
altiplano and the eastern plain: Sucre, the historic seat of the Spanish audiencia and the
country’s constitutional capital, and Sipe Sipe, just east of Cochabamba, itself known as
the “capital of the valleys”. And three municipalities are in Bolivia’s vast eastern region:
Guayaramerín, a frontier town on the river Mamoré which forms Bolivia’s northern
border with Brazil; Baures, further south and east and also in the department of the Beni;
and Porongo, just off the main road twenty minutes southwest from Bolivia’s second
city of Santa Cruz. The seven are mixed in terms of population as well, ranging from the
tiny Desaguadero and Baures, with 4,000 and 5,000 inhabitants respectively, through
Porongo and Atocha, all small by Bolivian standards, to Sipe Sipe, Guayaramerín and
Sucre, whose populations varying between 20,000 and 153,000 make them large for
Bolivia. In terms of the rural/urban divide the group generally mirrors the country, with
five rural municipalities ranging in urban share of the population from 0-43%:
Desaguadero, Baures, Porongo, Sipe Sipe and Atocha; and two highly urban
municipalities, Sucre and Guayaramerín, both with 86% of their populations in the city.
Their physical sizes also vary, from Desaguadero and Porongo, small towns with modest
catchment areas, to huge Baures which covers an empty swathe of land, rivers and
marshes stretching from the main town to the mining communities on the river Iténez, on
the border with Brazil.
In economic and social terms the group is quite varied as well. Desaguadero and
Sipe Sipe, in the more settled Andean region of Bolivia, have relatively stable mestizo
and indigenous populations who speak a mixture of Spanish with Aymará or Quechua
respectively, with Spanish preferred in town and the indigenous tongue in the
countryside. Both are essentially farming areas, although Desaguadero combines an
agricultural hinterland with a classic border-town economy based on transport and trade.
Most migration is of the young departing for the cities of La Paz or Cochabamba, or the
fertile lands of the east, and hence the populations of both are relatively ethnically
homogeneous. On the far side of the country Baures shares some of these

Testing the Theory in Seven Municipalities
229
characteristics, although its agriculture is more cattle-based and its mestizaje is of white
Spanish-speakers with indigenous speakers of the Baures dialect. Its location in the
Bolivian north and the lack of a passable land route have kept Baures isolated from the
rest of the country, blocking in-migration. Hence its population is a stable mix of a small
white minority with a mestizo-indigenous majority.
Atocha, Porongo and Guayaramerín, on the other hand, are essentially immigrant
societies, with a majority of their inhabitants born elsewhere and a dissonant mix of
languages, religions and ethnic groups. Their populations have changed dramatically
over the past two decades, to the point where in the latter two many people from eastern
and western Bolivia are virtually unable to communicate with each other. Other than
their heterogeneity and demographic instability, however, the three municipalities have
little in common. Atocha is a mining economy bolted onto a subsistence-level
agricultural hinterland, and its migration is mostly of western Bolivians from the
departments of Potosí, Oruro and La Paz. Demographic movements are highly sensitive
to mineral prices, and flows of people in and out in recent years first slashed the district’s
population and then doubled it. In Porongo and Guayaramerín, on the other hand, there
is abundant evidence of the long-term Bolivian pattern of migration from the
agriculturally poor western highlands to the fertile lowlands of the east. In both,
migrants from other parts of Santa Cruz and the Beni mingle with ex-miners and farmers
from the highlands, and the remaining locals struggle to recall what their hometown was
once like. In economic terms Porongo is closer to Sipe Sipe, an agricultural district close
to a large city, while Guayaramerín is more like Desaguadero, with its border-town
economy and a hinterland of poor farming villages.
The seventh municipality, Sucre, stands apart as by far the largest of the group
and sixth-largest in Bolivia, with a service-oriented economy based on government and
the university, and well-established small industries. Sucre also has a fairly large
hinterland extending several hours’ drive to the north and west, where rural communities
practice subsistence farming. Home to the self-styled bluest-blood descendants of
Spanish colonizers, Sucre’s mix of white, mestizo and indigenous has become even
more heterogeneous in recent years as it has been joined by tens of thousands of ex-
miners and farmers from Potosí and Oruro, along with smaller numbers from the
Bolivian east. These Aymará and Quechua-speakers have brought their native languages
into a Spanish-speaking city which traditionally shunned the Quechua countryside, so
adding another layer onto Sucre’s traditional rural-urban divide. The divide is apparent

Testing the Theory in Seven Municipalities
230
in Sucre’s index of Unsatisfied Basic Needs432 (UBN), where the value for the city,
0.388, is far superior to the rural value, 0.971. This difference is especially striking as
Sucre has the second-best urban UBN value in the country; indeed, the difference
between Sucre’s urban and rural UBN values, and by implication the disparity between
urban and rural provision of basic services, is the largest in Bolivia. This gap is
reflected, albeit less dramatically, amongst the other six municipalities, with urban
Guayaramerín and near-urban Atocha registering significantly lower UBN values than
rural Desaguadero, Baures, Porongo and Sipe Sipe. Figures 1-7 present a broad array of
descriptive statistics for the seven municipalities.
Lastly, the political complexion of municipal government in our districts is quite
telling. Only three of the seven respected the political alliances which dominated
national politics at the time: Sucre, where the mayor was sustained by a political
coalition which reflected the 1993-97 national government, and Sipe Sipe and Baures,
run by parties of the opposition (which assumed power in 1997). Each of the other four
municipalities was run by coalitions which in one way or another spanned the national
government-opposition divide. This suggests that local politics in these municipalities
was not subordinate to national political strategies, but rather responded individually to
local conditions and local imperatives. I return to this point in greater detail below.
This chapter will not employ the high level of descriptive detail used in the
previous one, preferring a more conceptual and analytic approach. The remainder of the
chapter is organized as follows. Section two reviews how municipal government has
changed in the seven districts since decentralization, both administratively and in terms
of policy outputs, and considers how successful these changes have been. Section three
examines the social, economic and political factors which underlie local governance,
focusing on their most salient features. Section four examines how these factors
combine to produce the institutions of local government, and hence the quality of the
local governance system. Section five summarizes the analysis, highlighting notable
comparisons and drawing lessons from the outliers. Section six modifies the model in
light of the analysis and concludes.
432 This index represents the gap between a municipality’s basic needs and available public services, and is calculated from census data. A value of one represents maximum deprivation.

Testing the Theory in Seven Municipalities
231
Figure 1BAURES Electoral Social Indicators
Governing Coalition** % of Population Speaks:General Spanish 93%Total Pop. 5,133 % Vote 1995 53% Native Tongue 0%Urban Pop.@ 0 Main Opposition MNR Spanish & Native 5%Urban Share 0% % Vote 1995 41% Literacy Rate 87%Rural Communities 5 Electoral Absenteeism 24% No Ed. Attainment 11%Indigenous Comms. 0 % Blank Votes 1% # Schools (Bldgs) 14Unsatisfied Basic Needs 0.913 % Null Votes 2% Total Students 1,733Urban UBN ----- Students/Teacher 20.2Rural UBN 0.913 Municipal Employees 91%
1997 7Oversight Committee 1993 4 # Health Facilities 3Total Members 4 Increase 75% Malnutrition Rates:Village Members 3 per 1000 pop 1.4 Low 20%President is from? Rural Top Salary* Bs 1,500 Moderate 8%
Qualifs. Req'd? No Severe 1%
Figure 2PORONGO Electoral Social Indicators
Governing Coalition** % of Population Speaks:General Spanish 82%Total Pop. 8,272 % Vote 1995 79% Native Tongue 2%Urban Pop.@ 0 Main Opposition - None - Spanish & Native15%Urban Share 0% % Vote 1995 ----- Literacy Rate 84%Rural Communities 29 Electoral Absenteeism 28% No Ed. Attainment 13%Indigenous Comms. 0 % Blank Votes 2% # Schools (Bldgs) 31Unsatisfied Basic Needs 0.928 % Null Votes 3% Total Students 2,209Urban UBN ----- Students/Teacher 21.9Rural UBN 0.928 Municipal Employees 83%
1997 12Oversight Committee 1993 1 # Health Facilities 8Total Members 4 Increase 1100% Malnutrition Rates:Village Members 3 per 1000 pop 1.5 Low 16%President is from? Rural Top Salary* Bs 1,300 Moderate 5%
Qualifs. Req'd? No Severe 2%
Figure 3SUCRE Electoral Social Indicators
Governing Coalition** % of Population Speaks:General Spanish 32%Total Pop. 153,153 % Vote 1995 69% Native Tongue 11%Urban Pop. 131,769 Main Opposition MIR Spanish & Native52%Urban Share 86% % Vote 1995 8% Literacy Rate 49%Rural Communities 103 Electoral Absenteeism 29% No Ed. Attainment 41%Indigenous Comms. 1 % Blank Votes 2% # Schools (Bldgs) 74Unsatisfied Basic Needs 0.467 % Null Votes 3% Total Students 47,211Urban UBN 0.388 Students/Teacher 15.2Rural UBN 0.971 Municipal Employees 81%
1997 361Oversight Committee 1993 520 # Health Facilities 126[Sucre has separate Decrease -31% Malnutrition Rates:urban and rural per 1000 pop 2.4 Low 18%OCs.] Top Salary* Bs 4,891 Moderate 5%
Qualifs. Req'd? No Severe 1%
ADN-MIR
Uses Formal Health Care System
MNR-ADN-MIR
Uses Formal Health Care System
MNR-MBL-UCS-IU
Uses Formal Health Care System

Testing the Theory in Seven Municipalities
232
Figure 4ATOCHA Electoral Social Indicators
Governing Coalition** % of Population Speaks:General Spanish 29%Total Pop. 12,216 % Vote 1995 74% Native Tongue 4%Urban Pop. 5,275 Main Opposition - None - Spanish & Native 64%Urban Share 43% % Vote 1995 ----- Literacy Rate 85%Rural Communities 0 Electoral Absenteeism 55% No Ed. Attainment 14%Indigenous Comms. 0 % Blank Votes 4% # Schools (Bldgs) 20Unsatisfied Basic Needs 0.555 % Null Votes 5% Total Students 3,552Urban UBN 0.499 Students/Teacher 18.6Rural UBN 0.605 Municipal Employees 74%
1997 9Oversight Committee 1993 5 # Health Facilities 13Total Members 6 Increase 80% Malnutrition Rates:Village Members 4 per 1000 pop 0.7 Low 30%President is from? Rural Top Salary* Bs 800 Moderate 13%
Qualifs. Req'd? No Severe 3%
Figure 5DESAGUADERO Electoral Social Indicators
Governing Coalition** % of Population Speaks:General Spanish 6%Total Pop. 4,337 % Vote 1995 45% Native Tongue 20%Urban Pop.@ 0 Main Opposition MNR Spanish & Native 72%Urban Share 0% % Vote 1995 26% Literacy Rate 68%Rural Communities 32 Electoral Absenteeism 34% No Ed. Attainment 27%Indigenous Comms. 0 % Blank Votes 1% # Schools (Bldgs) 13Unsatisfied Basic Needs 0.927 % Null Votes 2% Total Students 1,123Urban UBN ----- Students/Teacher 14.4Rural UBN 0.927 Municipal Employees 28%
1997 (full-time) 18Oversight Committee 1993 (full-time) 14 # Health Facilities 1Total Members 4 Increase 29% Malnutrition Rates:Village Members 2 per 1000 pop 4.2 Low 18%President is from? Town Top Salary* Bs 700 Moderate 5%
Qualifs. Req'd? No Severe 1%
Figure 6GUAYARAMERIN Electoral Social Indicators
Governing Coalition** % of Population Speaks:General Spanish 85%Total Pop. 32,273 % Vote 1995 70% Native Tongue 0%Urban Pop. 27,706 Main Opposition MBL Spanish & Native 5%Urban Share 86% % Vote 1995 10% Literacy Rate 92%Rural Communities 23 Electoral Absenteeism 48% No Ed. Attainment 8%Indigenous Comms. 0 % Blank Votes 1% # Schools (Bldgs) 80Unsatisfied Basic Needs 0.659 % Null Votes 1% Total Students 16,910Urban UBN 0.627 Students/Teacher 30.5Rural UBN 0.978 Municipal Employees 86%
1997 50Oversight Committee 1993 30 # Health Facilities 7Total Members 10 Increase 67% Malnutrition Rates:Village Members 8 per 1000 pop 1.5 Low 21%President is from? City Top Salary* Bs 4,360 Moderate 7%
Qualifs. Req'd? No Severe 2%
MNR-UCS-ADN
Uses Formal Health Care System
UCS-Condepa
Uses Formal Health Care System
MNR-ADN
Uses Formal Health Care System

Testing the Theory in Seven Municipalities
233
Figure 7SIPE SIPE Electoral Social Indicators
Governing Coalition** % of Population Speaks:General Spanish 7%Total Pop. 19,132 % Vote 1995 42% Native Tongue 21%Urban Pop. 2,033 Main Opposition MNR Spanish & Native 69%Urban Share 11% % Vote 1995 19% Literacy Rate 73%Rural Communities 7 Electoral Absenteeism 36% No Ed. Attainment 24%Indigenous Comms. 0 % Blank Votes 3% # Schools (Bldgs) 25Unsatisfied Basic Needs 0.815 % Null Votes 4% Total Students 3,685Urban UBN 0.659 Students/Teacher 16.0Rural UBN 0.834 Municipal Employees 74%
1997 21Oversight Committee 1993 13 # Health Facilities 8Total Members+ 4 Increase 62% Malnutrition Rates:Village Members 2 per 1000 pop 1.1 Low 22%President is from? Town Top Salary* Bs 1,000 Moderate 9%
Qualifs. Req'd? No Severe 3%sources: 1992 census, 1997 municipal census, National Electoral Court, National Institute of Statistics, author's interviews* Highest-paid non-elected official** In order of importance, 1995-99@ Town's population is below the urban threshold+ OC then in transition
Condepa-MIR
Uses Formal Health Care System
2. Local Government After Decentralization
Decentralization brought about significant changes in the finances,
administrations and policy priorities of our seven districts. But these changes were not
uniform across the group. The municipal budgets and staffing of the smaller, less
established districts grew spectacularly after 1994, while the older and more settled ones
saw smaller gains. The Law of Popular Participation (LPP) increased central-local
devolutions for all municipalities in Bolivia433, and hence all municipalities saw their
budgets rise. But in smaller districts with fewer sources of revenue these increases were
enormous. Thus Baures’ budget grew ten times, Atocha’s and Porongo’s grew 23 and
24 times respectively, and Sipe Sipe’s growth was technically infinite.434 Districts with
sources of own revenues before decentralization, on the other hand, saw increases which
– while significant – were more modest: 470% in Guayaramerín, 138% in Desaguadero,
and 40% in Sucre.435 Municipal staffing levels show a similar pattern before and after
1994. The poorer, more tenuous districts saw increases in personnel that ranged from
62% in Sipe Sipe to 80% in Atocha and an impressive 1100% in Porongo, which before
433 The main articles of the LPP are summarized in Chapter 1. 434 From nothing to Bs. 2.7 million. 435 See figures 8-14 for sectoral breakdowns. Sources: municipal interviews and Ministry of Finance database.

Testing the Theory in Seven Municipalities
234
decentralization “had only one municipal employee, the chief municipal officer, who did
everything.”436 Desaguadero’s payroll, by contrast, rose just 29%, and Sucre’s actually
fell by one-third. Lastly, the salaries municipalities paid their employees reflected this
divide as well, staying roughly constant in Desaguadero and Sucre, doubling in
Guayaramerín, and rising by considerably more in the rest.437
It is reasonable that the group would divide on these criteria between places
where functioning municipal institutions pre-date the LPP, and places where they only
sprang into being in 1994. In the former, “old” municipalities, local taxes had long
permitted governing institutions to operate and provide public services, and hence the
changes decentralization catalyzed, while not unimportant, were incremental.438 The
“new” municipalities, by contrast, essentially lacked local government before
decentralization, and hence the reform marked a revolution in their local affairs.439 It is
interesting to note that the one municipality that did not exist at all before
decentralization – Baures, previously an agency of the municipality of Magdalena – did
not register the largest budgetary and payroll increases. That honor was taken by
Porongo, followed by Atocha. This is an indication of just how desperate the state of
many of Bolivia’s small, rural municipalities was. Although these districts existed in
theory, many of them – like Baures – may as well not have existed at all.
It is particularly interesting to consider the municipalities’ hiring practices and
the technical competence of their staff in this light. That new municipalities did not
enforce qualifications requirements for their personnel is not surprising. Their history
was of struggling to find individuals to act as mayor or chief municipal officer with no
administrative support and a salary which – in the best of circumstances – was risible.
When the opportunity to hire a full complement of staff at realistic salaries arose, the
local labor force was generally too small and unskilled to allow a careful selection of
employees according to strict technical criteria. Hence mayors hired as opportunities
arose, and there was a strong component across all four of “doing their best” under
heavy constraints.440 The old municipalities, on the other hand, already benefited from
established bureaucracies, relatively high staffing levels, and a local pool of qualified
labor. With new resources at their disposal, and given the extra responsibilities
436 Silvio Rojas Aguilera, mayor, interview, Porongo, 7 April 1997. 437 Interviews with the mayors and key municipal staff of all seven municipalities. See interview list for details. 438 Interviews with the mayors and key municipal staff of Desaguadero, Guayaramerín and Sucre. 439 Interviews with the mayors and key municipal staff of Atocha, Baures, Porongo and Sipe Sipe.

Testing the Theory in Seven Municipalities
235
decentralization imposed, one might expect them to have implemented a more rigorous
policy of hiring by qualifications. But none of the three did so. In fact their personnel
policies were worse than neutral in this respect, as all three operated quotas systems
whereby staff were chosen by ruling political parties according to their electoral
strength.441
The results, not surprisingly, were poor. Whereas local observers and grass-roots
leaders in the new municipalities reported improvements in the quality of municipal
employees since 1994, their similars in Sucre and Guayaramerín did not. “The
municipality is more a political than a technical institution,” said Sucre’s General
Secretary. “There are no educational requirements and lots of political pressure. Lots of
[our] people are unprepared… it’s a disaster.”442 Respondents in Desaguadero went
further still, testifying that the municipal administration had actually worsened during
this period. In the words of the mayor, municipal employees “were more capable and
better paid before”.443 This begs the question of how political quotas arose in these
districts. Quotas may have been the coincidental result of idiosyncrasies in each of these
three municipalities, or they might be related systematically to their “oldness”, some
formalization of political bargaining arising out of repeated interactions.
Decentralization also brought about significant changes in public investment in
the seven municipalities. Consider figures 8-14, which compare public investment under
central government during the last three years before decentralization with that of local
government during the first three years after. Most striking is that central government
invested nothing at all in three of the municipalities – Atocha, Desaguadero and Sipe
Sipe – and in Baures invested only in transport. After decentralization, by contrast, the
four carried out a varied menu of investment projects, in concert with the other three.
Also compelling is the shift away from economic and urban infrastructure, which
dominated investment pre-decentralization, in favor of human capital investment.
Indeed, before 1994 energy, transport and urban development accounted for 78-100% of
investment in three of the four municipalities that received any. After 1994, local
governments’ investments in education, water and health accounted for 70% or more of
public investment in four districts, and between 41-51% in two others. Only in Sucre,
curiously, did human capital investment remain low.
440 ibid. 441 Desaguadero, Guayaramerín and Sucre, op.cit. 442 Raimundo Candia, municipal general secretary (i.e. chief officer), interview, Sucre, 15 April 1997.

Testing the Theory in Seven Municipalities
236
But variations in priorities are also evident amongst the decentralized
governments. Focusing on investment after 1994, we see systematic differences
between large and small municipalities’ use of public resources. The large districts444 in
the group, Sucre, Guayaramerín and Sipe Sipe, invest much less in human capital: only
35% of their portfolio on average vs. 71% for small districts. Conversely, large
municipalities invest three times as much as small ones on urban development: 49% vs.
16%. Among those that received no investment before decentralization, investment after
is also concentrated in human capital in the range of 51-74% of their portfolios vs.
Ce
ntr
al
Lo
cal
Ed
uca
tion
Urb
an
De
v
Wa
ter
& S
an
Tra
nsp
ort
Ag
ricu
lture
He
alth
Oth
er
0
20
40
60
80
100
Share of Budget (Local =
1997 only)
Sector
Figure 8: Public Investment in Baures
Ce
ntr
al
Ed
uca
tion
Urb
an
De
v
Wa
ter
& S
an
Tra
nsp
ort
Ag
ricu
lture
He
alth
Oth
er
0
20
40
60
Share of Budget
Sector
Figure 9: Public Inv. in Porongo
Ce
ntr
al
Lo
cal
Ed
uca
tion
Urb
an
De
v
Wa
ter
& S
an
Tra
nsp
ort
Ag
ricu
lture
He
alth
Oth
er
0
20
40
60
80
Share of Budget
Sector
Figure 10: Public Investment in Sucre
Ce
ntr
al
Lo
cal
Ed
uca
tion
Urb
an
De
v
Wa
ter
& S
an
Tra
nsp
ort
Ag
ricu
lture
He
alth
Oth
er
0
20
40
Share of
Budget
Sector
Figure 11: Public Investment in Atocha
443 Rosendo Mamani Quispe, mayor, interview, Desaguadero, 25 March 1997. 444 I define “large” as those in the upper quintile of municipalities by population.

Testing the Theory in Seven Municipalities
237
Ce
ntr
al
Lo
cal
Ed
uca
tion
Urb
an
De
v
Wa
ter
& S
an
Tra
nsp
ort
Ag
ricu
lture
He
alth
Oth
er
0
20
40
60
Share of Budget
Sector
Figure 13: Public Inv. in GuayaramerínC
en
tra
lL
oca
l
Ed
uca
tion
Urb
an
De
v
Wa
ter
& S
an
Tra
nsp
ort
Ag
ricu
lture
He
alth
Oth
er
0
20
40
Share of Budget
Sector
Figure 12: Public Inv. in Desaguadero
12-39% in urban projects and less for
economic infrastructure. These
magnitudes imply that human capital was
the top priority of the worst-off
municipalities in Bolivia – the smallest,
poorest and most rural that were
traditionally ignored by the state. This is
consistent with the findings of Chapter 2,
which concluded that it was the policy
priorities of precisely these districts that
drove national changes in investment
patterns after decentralization. By contrast central government, which faced no external
restrictions on its choice of investments, chose to focus instead on infrastructure projects
in the cities.
Given such large differences amongst the seven municipalities’ administrations
and policy decisions, it is important to ask how satisfied were the inhabitants of each?
Were local governments open to their opinions and participation? What did they think
of the public services they received, and in what regard did they hold town hall? The
information from six months of fieldwork is abundant in this respect, and revealing. Top
marks amongst civic leaders, grass-roots respondents, business, union and religious
authorities, and other local notables clearly go to the youngest municipal government of
the bunch, Baures. The quality of its investment projects and the public services it
Cen
tral
Edu
catio
n
Urb
an D
ev
Wat
er &
San
Tra
nspo
rt
Agr
icul
ture
Hea
lth
Oth
er
0
20
40
Share of Budget
Sector
Figure 14: Public Inv. in Sipe Sipe

Testing the Theory in Seven Municipalities
238
provides was judged “good” or “very good” by all of the respondents I spoke to, a
standard which none of the others approached.445 Its investment planning system was
based on village-level assemblies which discussed and approved project requests, on
which local government then based its Annual Operating Plan (AOP). These meetings
were reported to be extremely open and participatory – “even animals can attend,” in the
words of one respondent446 – and won the broad approval of the local population. And
the mayor and municipal council were deemed of high quality and eager to serve their
jurisdiction. “Here they work well and the people are content with them,” the leader of
Jasiakiri said of the council. “They’re with the people.”447 Several respondents from
both town and countryside testified approvingly that town hall had so far favored rural
farmers, “as they have the greatest needs and are in the majority here,”448 and not cattle-
ranchers nor miners, whose needs were less pressing. Baureños’ contentment with their
municipal government stood in stark contrast to their denunciation of the previous one,
based in Magdalena, of which they were then a part. There was a broad consensus in
Baures that Magdalena had ignored their needs and given them nothing, and had run an
untransparent administration that was possibly corrupt. Self-government, they testified,
had solved these problems.
Second place in terms of popular satisfaction goes jointly to Porongo and Sucre.
Most of their investment projects were described by respondents as “good” or “regular”,
with the balance of opinion favoring “good”. It is notable, however, that rural
communities’ appraisals in Sucre were significantly lower than those of urban
communities. The planning processes of both districts were described as reasonably
open in principle, but in practice susceptible to personal influences or the capriciousness
of municipal officers. For example, Sucre uses a well-designed participative planning
system in which project ideas rise from neighborhood/community level through multiple
stages of discussion and approval to city hall, where they are screened by technicians for
feasibility, cost, and overall consistency. The resulting draft AOP then goes back down
to the local level in its entirety to repeat the process of discussion and modification. But
despite this exhaustively participative protocol, local government used its technical
oversight to alter or ignore some communities’ requests, telling Chuqui-Chuquí,
445 All respondents were asked to rate public investment projects and the quality of local public services on the following scale: Very Bad – Bad – Regular – Good – Very Good. 446 Oscar Durán, neighborhood council president, interview, Baures, 2 May 1997. 447 Juan Jahnsen, Jasiakiri community leader, interview, El Cairo, 3 May 1997.

Testing the Theory in Seven Municipalities
239
nonsensically, “not to request a dike or water project because those were not in the
AOP.”449 And in Porongo, the president of the oversight committee (OC) reported that
several farming communities had changed their project requests during preparation of
the 1996 AOP, in order to conform to an official list of “acceptable projects”.450
Both municipalities had mixed, but ultimately positive opinions of their
municipal executive, and poor opinions of their municipal councils. Porongo’s mayor
was praised for his effort and good intentions in travelling throughout the district to meet
the people. But many opined that his technical staff were of poor quality. And they
singled out the municipal council for censure as highly politicized individuals most of
whom lived in Santa Cruz, making them unresponsive to local needs. By contrast
Sucre’s urban majority seemed reasonably content with the quality of government they
received, though they similarly reproached the municipal council as place-holders who
obeyed their parties and ignored voters. But rural sucrenses denounced city hall for
betraying them, declaring their condition to be the same or worse than before
decentralization. “Up to now we’ve had nothing from popular participation,” said
Chuqui-Chuquí.451 “It doesn’t respond to need locally. First one comes [from city hall]
and says there’s money for us, then another comes and reduces the amount, and in the
end there’s nothing.”452
Atocha occupies third place alone, with highly dispersed opinions of its
investments and public services. Most opinions were clustered between “good” and
“bad”, but collectively covered the entire range. There seems to be no pattern to
respondents’ judgements between town and countryside, or farming vs. mining
communities. Atocha’s planning regime was quite open and participative, and in fact
seemed to reflect local inputs more faithfully than Sucre’s or Porongo’s, although the
mayor did push to secure the approval of a fairly large pet project in defiance of local
demands in 1997.453 Regarding the performance of the local executive branch,
atocheños were reticent, referring more generally to the changes decentralization had
448 Hugo Melgar Barbery and Erland Ayllón Parada, municipal council president (MIR) and member (independent, ex-MNR), interview, Baures, 2 May 1997. 449 Claudio Torres, community leader, interview, Chuqui-Chuquí, 18 April 1997. 450 Benedicto Bonilla Rojas, oversight committee president, interview, Porongo, 7 April 1997. 451 As in Chapters 5 and 6, when referring to village-level testimony I often use the construction “Village X said” to mean “the leaders of Village X said”, in the interest of parsimony; footnotes also receive this treatment in the interest of accuracy. 452 Chuqui-Chuquí, op.cit. 453 Raúl Mamani Villca, oversight committee president, interview, Siete Suyos, 22 April 1997. The project in question is a cameloid (i.e. llamas, alpacas and vicuñas) development project.

Testing the Theory in Seven Municipalities
240
wrought. But the general perception seemed to be that town hall, while better than
before, was still not good enough, especially as it ignored some rural communities
entirely. “We’ve seen little change here,” reported Chorolque, “but it was worse
before.” Although the mayor was regarded as well-meaning and reasonably competent,
his municipal council was judged ignorant, uninterested, and ineffectual. Its president,
one observer mentioned with contempt, did not know how to read.454 Surprisingly, a
number of respondents testified that the council had been even more politicized in
previous years, and was forced to improve by the OC.
Desaguadero, Guayaramerín and Sipe Sipe collectively bring up the rear. Like
Atocha, popular verdicts on their investments and public services were dispersed over
the entire range of possibilities, though most vary from “bad” to merely “regular”. It is
striking that planning procedures in all three cases were largely closed to popular input,
dominated by municipal staff. While some projects did originate in community ideas,
others did not, and communities had little or no say in project planning or execution, and
no recourse for altering official plans. One technical officer in the municipality of
Guayaramerín told me, “We reformulate the AOP as we see fit. We don’t consult grass-
roots organizations because they bitch too much. We know we should, but we don’t.”455
In Sipe Sipe the community of Siquisiquía wanted a well, but had to settle for a school
when government refused to fund the former.456 Not surprisingly, popular assessment of
the institutions of local government was poor in all three districts. It was worst in Sipe
Sipe, where the previous mayor, under pressure to resign, switched jobs with the
president of the municipal council. But popular opinion was not satisfied, and grass-
roots organizations forged a consensus to rescind their recognition of the oversight
committee, which was seen as partial to the mayor, in order to appoint a new OC to
investigate the new mayor. The leader of Mallco Rancho explained that their intention
was to cause the suspension of central-government transfers in order to force him from
power.457
454 Fr. José Dessart, parish priest, interview, Atocha, 25 April 1997. 455 Alberto Albert, municipal technical advisor and ex-municipal council president, interview, Guayaramerín, 20 October 1997. 456 Eduardo Ala, Celso Cuba and Andrés Cuba, community leader, spokesman and officer, interview, Siquisiquía, 29 May 1997. 457 Guillermo Saavedra Crespo, César Árnez Mondragón, Eduardo Céspedes and Fernando Montán Árnez, community president, vice-president, officer, and oversight committee vice-president, interview, Mallco Rancho, 28 May 1997.

Testing the Theory in Seven Municipalities
241
Opinions in Guayaramerín were mixed. In the city, in the wake of a previous
mayor widely considered corrupt and ineffective, people suspended judgement as they
waited to see what the current one might accomplish. In the countryside, however,
community leaders attacked the mayor for grossly favoring the city at their expense. But
it was Desaguadero that had the most curious assessment. There urban opinion was that
the municipality was marginally acceptable because it invested large sums in the
countryside. But rural communities accused the mayor of depriving them of all
resources and denying them political voice. Lastly, the municipal councils of all three
districts were widely held in very low esteem as politicized, unresponsive institutions.
And the councilmen of Sipe Sipe and Guayaramerín, in particular, were generally
considered corrupt. “The municipal council,” observed the director of the Guayaramerín
Hospital, “is worthless.”458 Figure 15 summarizes popular perceptions of municipal
performance.
Figure 15The Perceived Quality of Local Government
Investment
Project Project
Rank Municipality Ratings* Planning** Rural Urban/Town1 Baures Good-Very Good Very Open2 Porongo Good Fairly Open
Sucre Good Open but Arbitrary Bad Mediocre3 Atocha Good-Bad Open but Distorted4 Desaguadero Regular-Bad Closed Bad Mediocre
Guayaramerín Regular-Bad Closed Bad MediocreSipe Sipe Regular-Bad LG-Dominated+Sources: Author's interviews, observation and other fieldwork
* Most common ratings as given by communities and grass-roots leaders** Degree of openness to local ideas, needs and participation+ LG = Local Government
++ As rated by communities and grass-roots leaders; urban/rural differences notedwhere relevant
Mediocre - Not Good Enough
Bad
Performance++
Local Government
Good - Much ImprovedGood Mayor, Poor Council
3. Economics, Politics, Society
What patterns can we glean from the successes and failures of our seven
municipalities? How can such large differences in local government effectiveness be
accounted for? I maintain that an explanation based on the quality of local government
institutions focuses only on apparent reasons. More fundamental causes, as argued in
458 Gabriel Sosa Salvatierra, hospital director, interview, Guayaramerín, 22 October 1997.
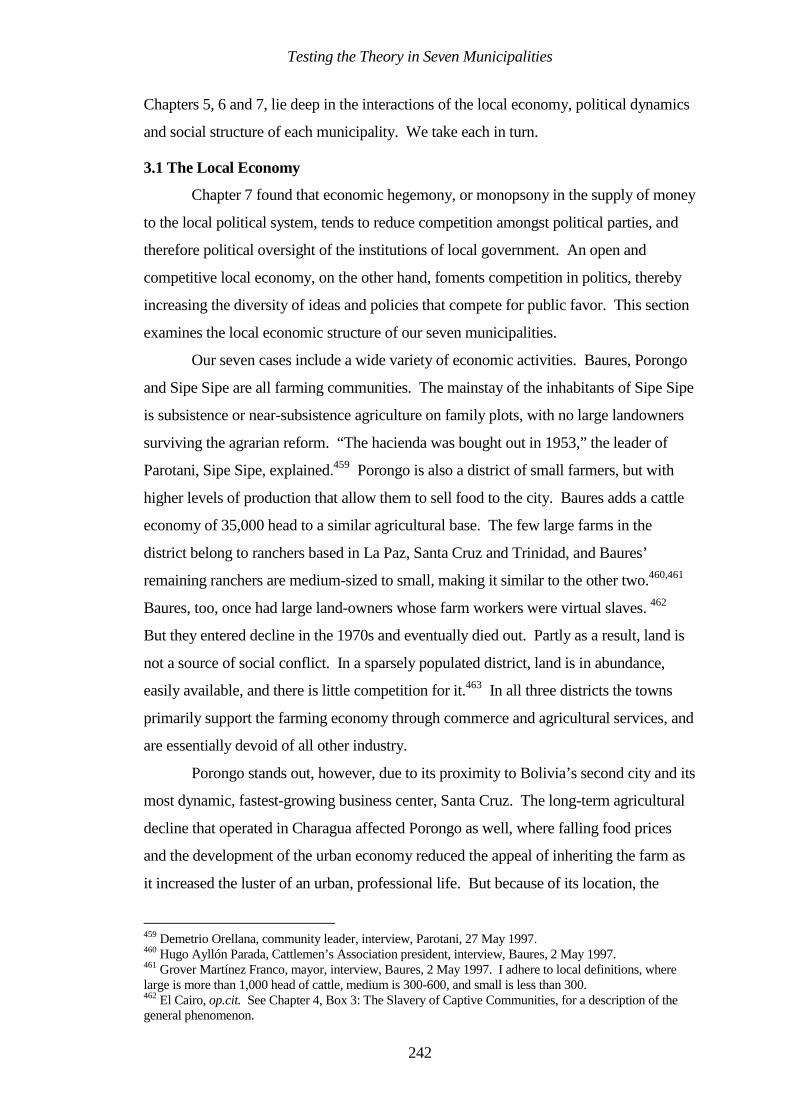
Testing the Theory in Seven Municipalities
242
Chapters 5, 6 and 7, lie deep in the interactions of the local economy, political dynamics
and social structure of each municipality. We take each in turn.
3.1 The Local Economy
Chapter 7 found that economic hegemony, or monopsony in the supply of money
to the local political system, tends to reduce competition amongst political parties, and
therefore political oversight of the institutions of local government. An open and
competitive local economy, on the other hand, foments competition in politics, thereby
increasing the diversity of ideas and policies that compete for public favor. This section
examines the local economic structure of our seven municipalities.
Our seven cases include a wide variety of economic activities. Baures, Porongo
and Sipe Sipe are all farming communities. The mainstay of the inhabitants of Sipe Sipe
is subsistence or near-subsistence agriculture on family plots, with no large landowners
surviving the agrarian reform. “The hacienda was bought out in 1953,” the leader of
Parotani, Sipe Sipe, explained.459 Porongo is also a district of small farmers, but with
higher levels of production that allow them to sell food to the city. Baures adds a cattle
economy of 35,000 head to a similar agricultural base. The few large farms in the
district belong to ranchers based in La Paz, Santa Cruz and Trinidad, and Baures’
remaining ranchers are medium-sized to small, making it similar to the other two.460,461
Baures, too, once had large land-owners whose farm workers were virtual slaves. 462
But they entered decline in the 1970s and eventually died out. Partly as a result, land is
not a source of social conflict. In a sparsely populated district, land is in abundance,
easily available, and there is little competition for it.463 In all three districts the towns
primarily support the farming economy through commerce and agricultural services, and
are essentially devoid of all other industry.
Porongo stands out, however, due to its proximity to Bolivia’s second city and its
most dynamic, fastest-growing business center, Santa Cruz. The long-term agricultural
decline that operated in Charagua affected Porongo as well, where falling food prices
and the development of the urban economy reduced the appeal of inheriting the farm as
it increased the luster of an urban, professional life. But because of its location, the
459 Demetrio Orellana, community leader, interview, Parotani, 27 May 1997. 460 Hugo Ayllón Parada, Cattlemen’s Association president, interview, Baures, 2 May 1997. 461 Grover Martínez Franco, mayor, interview, Baures, 2 May 1997. I adhere to local definitions, where large is more than 1,000 head of cattle, medium is 300-600, and small is less than 300. 462 El Cairo, op.cit. See Chapter 4, Box 3: The Slavery of Captive Communities, for a description of the general phenomenon.

Testing the Theory in Seven Municipalities
243
outcome in Porongo was diametrically opposed to that of Charagua. Here the sons of
wealthy landowners, who migrated to the city for educations and then careers, stayed
close enough to maintain weekend houses in the town and a strong interest in its affairs.
Through their wealth and social position they were able to dominate local politics despite
their urban residences and occupations. Hence a district that comprises a single, rural
economy with few differences between town and countryside, where a commonality of
economic interest should have prevailed, was captured by a wealthy enclave which
served as a vector to import the concerns and priorities of the city into its midst. This
had, as we shall see below, decisive effects on its politics and government.
Sucre, Guayaramerín and Desaguadero present a different case of more complex
economies, where an agricultural hinterland coexists with an industrial/commercial hub.
Despite being at opposite extremes of the size distribution, Sucre and Desaguadero share
the characteristic of combining a modern, urban market economy with a rural sector of
subsistence agriculture. In Desaguadero the urban economy is dominated by transport
and trade with neighboring Peru, with some 300 vehicles per day passing through the
town, most of them high-capacity trucks.464 This traffic generates significant revenues
for the municipality, and control of local government is lucrative. The small town’s
economy revolves around truck owners, truck drivers, and the businesses that serve
them. Economic actors are mainly small, and there are no large owners. Desaguadero’s
farmers, on the other hand, work small plots and do not grow for export. The town’s
economic links are therefore stronger with the La Paz-El Alto conurbation than with the
villages that stretch outward to the south and east. The fact that trade depends on the
relative fortunes of Bolivia and Peru – two very volatile economies in recent years –
serves to strengthen the town’s focus across the border, away from its hinterland.
In Sucre, the city is largely a service economy, dominated by the institutions of
national and departmental government, and the large, very old and prestigious
Universidad Mayor y Pontificia San Francisco Xavier. Its biggest industrial concern,
the cement company Fancesa, is a public firm co-owned by the university, the prefecture
and the municipality. After these, Sucre’s most important economic institutions are its
chocolatiers, hat makers and tanneries, none of them large. “Sucre was founded for
bureaucratic reasons, not economic ones,” the Chamber of Commerce’s directors
463 H. Ayllón, op.cit. 464 Alfredo Bravo Mujica and Mario Cerda Escalante, municipal councilmen (MNR and ADN respectively), interview, Desaguadero, 24 March 1997.

Testing the Theory in Seven Municipalities
244
elaborated, “because the wives of the Spanish died giving birth in Potosí.”465 It was
once run by a mining and landowning oligarchy, according to the District Director of
Education, but the revolution of 1952-53 ended that, and there have been no dominant
economic interests since.466 Today the countryside is made up of poor family farms that
grow potatoes, wheat and corn in the dry hills of Chuquisaca. With little surplus
production, the cash economy is fragile and trade with the city is small. In both
municipalities the two economies, rural and urban, are internally homogeneous,
characterized by small-to-medium-sized actors and no dominant (private) interests. But
there is little to connect them, and they coexist side-by-side, barely interacting.
Guayaramerín consists of a highly urbanized municipality with an extensive rural
hinterland which, alone amongst our group, comprises a single agribusiness economy.
Like Desaguadero, it has the transport and trade-based economy of a frontier town. But
unlike it, Guayaramerín also benefits from large agricultural enterprises, including
almond, Brazil nut, and heart-of-palm packagers/exporters, cattle ranchers, loggers and
timber merchants, and a significant retail sector that exploits exchange-rate movements
between the Boliviano and Real. This last spans the barrier of legality, running to drugs
and contraband. The nature of these businesses implies that the urban and rural
economies are intertwined: wealthy businessmen have large rural landholdings and
employ many villagers, and the economic conditions that large and small actors face –
given by weather, disease and infrastructure among others – are often the same. Unlike
Sucre and Desaguadero, however, Guayaramerín’s economy is dominated by a small
group of powerful businessmen who collectively own much of the local economy and all
of its large businesses. Some of the strongest among them are timber merchants and
cattle ranchers, who also control the local political parties and through them local
government, treated in more detail below. The most important two businessmen,
“Cacho” and “Gigi”, were locked in a battle for influence that is typical of the
dominance of the business elite to which they belong. Hernán “Cacho” Vargas Rivera is
the most powerful businessman in Guayaramerín, with Brazil nut, heart-of-palm, and
river and land transport companies, two television stations, and 140,000 hectares of land
in Pando.467 His rival, Adrián “Gigi” Rivera, is a hotel-owner, president of the local
465 Alfredo Yáñez and Juan Carlos Sobut, directors of the Chamber of Commerce, interview, Sucre, 16 April 1997. Sucre is located 1500m lower than the mining center of Potosí and has a dry, mild climate. 466 Samuel Montellano Aparicio, district director of education, interview, Sucre, 14 April 1997. 467 Hernán Vargas Rivera, agro-industrialist, TV station owner and ADN chief, interview, Guayaramerín, 21 October 1997.

Testing the Theory in Seven Municipalities
245
electricity cooperative, and money-lender at rates of 5-7% per month.468 Their names
came up often in my interviews throughout the district when respondents were asked
“who runs the show”.469 While Cacho attempted to gain control of municipal policy via
the local Acción Democrática Nacionalista (ADN) party, which he leads, Gigi refused to
lend the electricity cooperative $37,000 unless the municipality agreed to assume the
debt, thus ensnaring it in his web. Though Cacho raged against this “scandal”, he also
admitted that, in his view, “the municipality has become an instrument” of powerful
interests in Guayaramerín.470
Last of all is Atocha, where the economy is cleanly divided into two more or less
equal parts: mining and subsistence agriculture. The former is centered on a number of
mining communities471 made up of rows of small huts with few or no basic services, a
level of deprivation which resembles Atocha’s rural villages. At each one the miners are
organized in a loose cooperative, and work individually or in teams in narrow, often
dangerous stretches of tunnel. “The cooperative no longer has the solidarity it once did,”
the parish priest lamented. “Before everyone earned the same wage, but now each miner
is left to his fortune.”472 By 1997 miners had fallen a long way since the heyday of
Comibol473 and the COB,474 when the two organizations in essence ran Atocha. No
large miners were left, and the district’s leading figures were the rich townsfolk, many of
them alcohol and coca salesmen, and its politicians, often the same individuals. These
changes notwithstanding, miners retained a higher capacity to mobilize than any other
group in Atocha. With their tradition of militancy and a strong organization, they were
quick to march on the town to defend their interests if necessary, as the mayor had
discovered more than once.475 The other, agricultural economy was organized around
the small, low-yielding family farms typical of the altiplano; as elsewhere, large
landowners had not survived agrarian reform. This economy did not grow so much as
persist in the high altitude of Atocha, weakly linked to the mining and urban sectors and
468 Adrián Rivera, electricity cooperative president, money-lender and hotel owner, interview, Guayaramerín, 21 October 1997. The only bank in Guayaramerín is a branch of BIDESA, which dispenses local salaries but does not lend. 469 Quien manda? in Spanish. 470 Vargas R., op.cit. 471 Chorolque, Animas, and Siete Suyos are the main ones. 472 Dessart, op.cit. Fr. Dessart worked in Atocha for more than three decades. 473 The state mining enterprise, formed in the 1952 revolution. 474 The Bolivian Confederation of Labor, of which miners were traditionally the backbone. Between the 1950s and the 1980s the COB deliberated economic policy directly with the employers’ federation and the government of the day. 475 Pablo Victorio Ayala, mayor, interview, Ánimas, 22 April 1997.

Testing the Theory in Seven Municipalities
246
largely ignored by the town. Atocha itself was the commercial center where mineral
traders and other mining services, as well as more general commerce, were based. Its
fortunes were largely dependent on the mines, and it looked naturally to them in search
of its future.
Although the seven municipalities present a broad range of economic interests
and structures, summarized in figure 16, it is evident that economic structure alone is
insufficient to explain their divergence in local government performance. We turn now
to the local political system.
Figure 16The Local Economy
Size of
Rank Municipality Principal Sectors* Leading Actors
1 Baures Cattle, Agriculture Medium/Small2 Porongo Agriculture, City Medium
Sucre (rural) Agriculture Small(urban) Services, Small Industry Medium/Small
3 Atocha Mining, Agriculture Small4 Desaguadero Transport, Trade & Agriculture Medium/Small
Guayaramerín Transport, Trade, Industry, LargeCommerce, Agriculture & Timber
Sipe Sipe Agriculture SmallSources: Author's interviews, observation and other fieldwork
* In rough order of importance
3.2 The Local Political System
Chapter 7 found that a vigorous and competitive local politics, marked by
political entrepreneurship and policy innovation, was necessary for effective local
government. It listed three conditions for this to obtain: (i) an open and transparent
political system, (ii) a competitive party regime, and (iii) a substantive focus on local
issues and local people. Of these, the first would seem to be present in the seven cases.
Complaints were common in all of our municipalities about the vituperative nature of
political discourse: “We’re worse off than before,” reported Mojotoro, Sucre. “Before
there was no politics here. Now they have campaigns and fight for power.”476 But there
was a broad consensus everywhere, with the possible exception of Porongo (see below),
that electoral chicanery and intimidation were ills of the past, and elections were now
476 Juan Velabaruta, Esteban Copa, Felipe Sapana and Sabanio Fernández Alanoca, community leader, community, ex-leader, and officer, interview, Mojotoro, 18 April 1997.

Testing the Theory in Seven Municipalities
247
free and fair. “The elections were clean here,” said Sucre’s district director of education,
in a typical response. “Before they stuffed ballot boxes – there were many
irregularities.”477
The only district with a fully competitive party regime was Baures, where clearly
delineated governing and opposition alliances existed which mirrored at least in form the
national pattern of politics. Local government was in the hands of an ADN-MIR
coalition, and the MNR was in opposition. Indeed although politics in such a small
population had an undeniably cozy air, and politicians knew each other and their families
personally and well, politics was quite competitive in Baures, with rival blocs vying to
unseat each other in local elections. “There’s a lot of politics in this town,” said one
observer, referring to how party loyalties ran deep in local society. “Yesterday the
people [at the village festival] were absolutely divided by political party, each off to one
side.”478 Not surprisingly, Baures had the lowest rate of electoral absenteeism amongst
the seven, at 24%. Perhaps as a result, politics was not dominated by powerful economic
or other interests, but was open to all and represented a broad range of views. Indeed, in
the previous election the MNR had coopted the indigenous vote Charagua-style by
naming a Baureño to its party list.479 And unlike other municipalities, as we shall see
below, municipal councilmen did not cover up each other’s transgressions; thus two
MNR councilmen from the 1995 election had not yet been recognized, pending
allegations against them from the previous government. But despite political
competition that was often sharp, politicians managed to work relatively smoothly
together, and it is telling that Baures’ worst political conflict during this period came
from the outside. This happened when the (MNR) prefect unilaterally donated a
generator belonging to the town of Baures to nearby El Cairo when the latter’s, used to
pump water, broke down. The municipal council and oversight committee intervened at
the scene of a public commotion and prevented him from doing so.480 Their action was
widely applauded throughout the district, even in the village of El Cairo.481
In Sucre, Porongo and Atocha, by contrast, competition in the local political
system was essentially absent. So disinterested were Sucre’s politicians in political
rivalry that MNR councilmen, upon winning the 1995 local election, voted to return the
477 Montellano A., op.cit. 478 Sisters Pilar and Teresa and Prof. Oscar Velázquez, CETHA, interview, Baures, 4 May 1997. CETHA is a church-supported institution specializing in adult education. 479 Juan Oni Antelo, municipal councilman (MNR), interview, Baures, 2 May 1997. 480 Melgar and Ayllón, op.cit.

Testing the Theory in Seven Municipalities
248
Socialist Vanguard Germán Gutiérrez to the mayor’s office, while they, the MBL and
their other electoral allies quietly split municipal patronage amongst themselves.
Gutiérrez was known as a competent and honest politician, and the MNR was happy to
support such a front-man in order to avoid political strife over municipal power. Politics
in Sucre was not, therefore, a real clash of ideas or opportunity to effect change, but
rather the means by which the political class shared out the spoils of power amongst
itself. In Atocha politics was less fractious, with three parties holding 74% of the vote,
led by the MNR. These three held all five council seats between them, and were all
allied in a governing coalition. The MNR, a party which brought together the miners,
peasant smallholders, and a number of the town’s rich men, considered itself the natural
party of government in this region. And no one was willing to oppose it. Porongo was
more like Sucre, but for quite different reasons. Here a small clique of urbanites – sons
of the town who had left it for the city (see above) – captured control of local
government and used it to further their own, foreign priorities. As in Atocha, they
represented the rich of the town, except that they did not live in the town.482 This small
group of friends referred to themselves curiously as los residentes, or more ominously la
fraternidad, and were distributed amongst all the main political parties in what was in
effect, if not by design, a group strategy for political domination. Once in power they
showed no party discipline and no desire to compete; the MNR mayor governed in
coalition with the ADN and MIR and there was no political opposition. The terms of the
local political debate accordingly reflected not the problems and interests of most
porongueños, but rather those of the few amongst them who lived in Santa Cruz.
The three municipalities also shared the problem of electoral absenteeism in rural
areas. In Atocha this was largely due to a lack of identification documents amongst
would-be voters in rural areas, compounded by identification and voter registration
drives in the city and environs that never reached most of the district’s villages.483
Hence Atocha’s urban and surrounding voters had a disproportionate say in its politics at
the expense of the countryside. Sucre’s absenteeism was fairly low in the city, but rose
as distance from the center increased. Peri-urban dwellers often lacked documents, or
were not registered to vote locally; rural villagers also lacked identification and – with no
electoral tradition and a city hall closed to their needs – were uninterested in politics and
481 El Cairo, op.cit. 482 “Rich” here is a relative term specific to the local context of each case.

Testing the Theory in Seven Municipalities
249
politicians.484 Thus the rural-urban gulf that divided Sucre revealed itself in politics as
well. Absenteeism took on a different form in Porongo. There, a number of rural
communities found themselves closer to polling centers in Santa Cruz than any of
Porongo’s three,485 and accordingly registered and voted in the former. Other residents,
more typically, lacked the interest or identification to vote, and did not bother to register.
Thus while Porongo’s rate of absenteeism appears low at 28%, its “true” absenteeism
was much higher, estimated by different observers at between 60% and 75%.486
The effect of high rates of absenteeism was to facilitate the manipulation of
electoral results by means which, while perhaps not strictly illegal, were ethically
dubious. Thus in Porongo the mayor cheerfully asked me, “Do you know how I won the
election? I had more trucks than my opponent!”487 And he burst out laughing. To the
extent that he simply provided local voters with free transport, he was guilty only of a
partisan effort to get out the vote in a district lacking transport. But several observers
accused him and others of trucking in paid “voters” from other municipalities, in
violation of election laws.488 It is not clear that this in fact occurred, although the
Mayor’s boast provides cause for alarm. If it did, then Porongo stands out as the
exception in our group to increasing electoral transparency. More generally, “residents”
were resented for bringing their families from Santa Cruz to vote in Porongo, in an
attempt to tip electoral results.489 In such a setting, the ultimate effect of Porongo’s
quasi-absentee voters was to facilitate the success of such strategies by reducing the
overall vote tally, thus abetting outsiders’ attempts to distort the local political system.490
As a result of these factors, all three municipalities suffered from weak political
accountability.491 In Atocha and Porongo, high absenteeism sapped the power of
elections to elicit information or constrain government’s policy decisions; strategic
bargaining by councilmen in the indirect election of Sucre’s mayor produced a similar
483 Victorio A., op.cit.; Severo García Cándia, neighborhood council ex-president, interview, Atocha, 23 April 1997. 484 Mojotoro, op.cit.; Walter Encinas, community leader, interview, Potolo, 19 April 1997. 485 In an area of 110,000 ha. 486 Bonilla R., op.cit.; Hernán Gutiérrez Viveros and Rómulo Oyola Morales, chief administrative officer and ex-mayor, and technical officer, interview, Porongo, 8 April 1997. 487 Rojas A., op.cit. 488 Bonilla R., op.cit.; Roberto Suárez, district doctor, interview, Porongo, 9 April 1997. 489 Cecilia Bonilla, school association president, interview, Villa Guadalupe, 8 April 1997. 490 The probability that an incremental voter (brought in from outside) will be electorally decisive is a decreasing function of the number of voters in the district. See Seabright (1996). 491 I refer here to the internal accountability of the local political system. For purposes of analysis, this is distinguished from the institutional accountability that the OC brings to bear within the local institutional framework

Testing the Theory in Seven Municipalities
250
result there. All three municipalities lacked the disciplining effect of an active
opposition on government decisions, with negative consequences for policy-making in
each. Indeed, the only real opposition government faced in Porongo was beyond party
politics, from the (real) residents of Porongo. This was voiced by the OC, which
opposed certain investment projects considered of little benefit to most rural
porongueños. Atocha displayed a similar dynamic, in which an urban political game for
control of the municipal apparatus was interrupted episodically by a more raw
interaction of miners and municipal authorities in which the former marched,
demonstrated and even took hostages in support of their demands.492 This was how
decisions of local importance were taken in Atocha, punctuating periods of personal and
political harvest for elected officials. Porongo’s OC, starved of funds, personnel, and
bargaining power, was altogether less successful. To try to overcome this problem, its
president proposed a new “micro-regional” party to contest local elections on behalf of
rural farmers. The MBL, as it had done in Charagua, accepted.493 But in Sucre neither
form of “external” opposition was present, and politics as a result remained strangely
disconnected from local society. Perhaps because its urban population was so much in
flux, parties did not have strong socio-economic identities.494 Politics thus occurred in a
sort of gap, an empty space between society and government where politicians hid,
dealing quietly amongst themselves, with little incentive to seek change.
Lastly come Desaguadero, Guayaramerín and Sipe Sipe, the three worst-
performers of our group. All three had medium-to-high rates of absenteeism, between
one-third and one-half of the electorate. Guayaramerín, with the highest rate, suffered
what in terms of the model of Chapter 7 can be called a weak relationship in the primary
political market for votes. The people there, a heterogeneous mix resulting from a
migratory boom that lasted two decades, had little tradition of political participation, and
hence a weak voting spirit. I return to this point below. In Desaguadero and Sipe Sipe,
two more demographically settled districts, absenteeism was lower but still significant.
This was due in large part to such factors as distance and lack of identification,
especially in rural areas, discussed above.
492 Victorio A., op.cit.; Albino García Choque, Juan Bonifacio Onofre, Esteban Marcha Cachambre and Ivan Marca, miners’ cooperative welfare officer, oversight officer, oversight officer and member, interview, Chorolque, 23 April 1997. 493 Bonilla R., op.cit. It remained to be seen if this initiative would succeed. 494 i.e. labor, landowners, owners of capital, etc.

Testing the Theory in Seven Municipalities
251
Perhaps not surprisingly given low voting participation, interest-group capture
afflicted both Guayaramerín and Desaguadero, though not Sipe Sipe. In the former,
money politics was a very strong phenomenon. Prominent businessmen – the spiritual
descendants of the cattle barons of the past – were firmly in control of the major political
parties, and through them local government, using their resources to fight elections and
expedite their political strategies. And once in power, officials and their businesses
profited from the contracts, contacts and policy-making powers that local government
afforded to further their business interests. Thus when the MNR sought to prevent the
re-election of Guayaramerín’s long-time ADN mayor, who had won the popular vote,495
it offered the MBL councilman $30,000 for his vote. This councilman, an ex-priest of
modest means, used the money to buy a local television station, and so became one of
Guayaramerín’s media magnates.496 His vote elevated a prominent logging and timber
merchant to the mayoralty of a district that contained large tropical forests. But it is
notable that these political dealings occurred amongst individuals much more than
amongst parties. Political alliances were much the same. Indeed, during my stay the
mayor and senior ADN councilman inaugurated a new coalition between their respective
parties with a karaoke duet in a local nightclub. This broke up the previous MNR-MBL
pact. But the local ADN chief was unconvinced. “Ivan [the ADN councilman] and Tico
[the mayor] don’t seem to belong to any party anymore. They’re just looking to
accommodate themselves.”497 Political competition in Guayaramerín was the province
of narrow interests – i.e. individual businessmen – vying for control over the machinery
of government and its policy-making. It was not a broader contest of ideas or ideologies,
and in it broad collective interests were essentially unrepresented. Once elected,
Guayaramerín’s politicians were content to find an accommodation, and did little to
oversee or discipline each other’s activity. The fact that they were friends and members
of the same restricted social set greatly facilitated this process. The fate of the previous
mayor, widely accused of embezzlement but never investigated by the municipal council
on which he still sat, was illustrative.498
Desaguadero, by contrast, was politically two separate municipalities – an urban
one where politics happened, and a rural one where it did not. In a way similar in type,
though smaller in scale, to Guayaramerín, urban politics in Desaguadero took the form
495 Guido Roca 496 Vargas R., op.cit. Cacho owned Guayaramerín’s two other TV stations. 497 ibid.

Testing the Theory in Seven Municipalities
252
of a contest amongst a business elite to occupy power and control municipal resources.
Once elections were over, the spoils were divided amongst the victors and public life
resumed its cozy, quiet pace. But the fact that the assets of Desaguadero’s biggest
businessmen were literally on wheels – they could get into their trucks and drive away –
made them essentially opportunists and not entrenched interests in the sense of factory or
land owners. Partly as a result of this, Desaguadero’s politics was a less ruthless, less
deliberate affair than Guayaramerín’s, largely free of ideology or broader (national)
strategies. With a substantive focus on patronage, and a mobile, changing elite, the
district lacked political competition because in many ways it lacked substantive politics.
Sipe Sipe went further still along this continuum. Like Desaguadero it had no
entrenched interests, but unlike it no powerful businessmen either, and hence no money
politics. Despite this the district hosted fairly strong political rivalries, with a MIR-
Condepa coalition ensconced in town hall, strong MBL sympathies amongst community
groups, and constant frictions between the two.499 But somehow this did not translate
into substantive competition in the political realm. The job switch between the mayor
and president of the municipal council showed that local politicians were willing to act
demagogically to undermine such mechanisms of accountability. Politicians’ desire to
avoid political competition did not entirely stifle it, however, but rather re-located it
outside the municipal council, in the hands of grass-roots organizations (GROs). Thus
the discipline that competing parties might normally have injected into the political arena
was instead provided outside it when Sipe Sipe’s GROs mobilized to challenge the
mayor.
This combination of voter absenteeism and a lack of political competition led to
weak accountability in all three districts, as it had in Atocha, Porongo and Sucre,
facilitating the self-perpetuation of prominent politicians and amplifying their discretion
once in government. In Desaguadero and Guayaramerín citizens had yet to learn how to
use the political system to enforce accountability on government officials. Sipe Sipe, by
contrast, was in the middle of an experiment in which civic activism attempted to
remedy the problem by challenging its root cause – the political dominance and
manipulations of the Condepa-MIR coalition. By substituting for political parties, GROs
sought to loosen the grip of a small coterie of politicians on their municipal government,
498 ibid. “Tilly” Rodríguez was widely denounced by people throughout Guayaramerín. 499 Demetrio Orellana, community leader, interview, Parotani, 27 May 1997.

Testing the Theory in Seven Municipalities
253
and so regain control of local affairs. Unfortunately this research ended before it was
clear whether the experiment would succeed or fail.
It is interesting that there was no evidence of political capture in three of the six
municipalities where political accountability failed. None of these – Atocha, Sipe Sipe
and Sucre – had interest groups sufficiently powerful to dictate to local government.
This implies that the dual failure of political opposition and electoral participation is
sufficient to undercut accountability in the local political system even in districts that
lack dominant interests, thus leaving municipalities prey to the volition of their leaders.
Not surprisingly, respondents in three of these districts, Sucre, Porongo and
Guayaramerín, and to a lesser extent Desaguadero as well, reported a loss of faith in
governments which did not answer for their actions, and a loss of interest in politics. In
Sucre the re-election of Gutiérrez, who came in second, had caused many voters
throughout the district to despair “because one wins the election but another winds up in
power.”500 “The people here feel that their vote has no value,” added an observer in
Guayaramerín. “It’s all cooked between them [politicians], so why vote?”501 This
worsened the problem of absenteeism, which in turn made it easier for elites to
perpetuate themselves and decreased their accountability – a vicious cycle that was
potentially difficult to break. Figure 17 summarizes our districts’ political
characteristics.
Figure 17The Local Political System
Interest
Group Electoral Open, Competitive
Rank Municipality Capture? Absenteeism Political System?1 Baures No Low Yes2 Porongo Yes High* No
Sucre No Low/Medium No3 Atocha No High No4 Desaguadero Yes Medium No
Guayaramerín Yes High NoSipe Sipe No Medium Yes, outside MC+Sources: Author's interviews, observation and other fieldwork
* Many adults are unregistered or registered elsewhere: see text+ Competitive politics occurs outside the municipal council and
largely outside the party-political system: see text
500 Juan José Bonifaz, general advisor to the prefect, interview, Sucre, 15 April 1997.

Testing the Theory in Seven Municipalities
254
3.3 Civil Society
Chapter 7 conceptualized the role of civil society in local governance as an
institution that aggregates preferences and represents community needs, mediates
community participation in the production of public services, facilitates social expression
and the assertion of local identity, and enforces political accountability on the institutions
of government. Whatever organizational form civil society takes – and in Bolivia the
distance from mining cooperatives to pre-conquest ayllus is great – its institutional
coherence and ability to mobilize grass-roots participation around a particular goal are
fundamental to its ability to participate in the local governance process. These qualities
are in turn dependent upon people’s ability to communicate effectively with each other,
the degree to which they share interests and priorities, and ultimately the trust which they
invest in their leaders and in each other. Unfortunately such characteristics are
subjective social traits, and thus difficult to measure reliably. Hence this section
examines communities’ ethnic and organizational heterogeneity, and the (objective)
existence of an encompassing socio-economic interest,502 as proxies for ease of
communication and similarity of social priorities.503 It also uses interview responses as
evidence for the existence of trust. Taken together, these attributes point to levels of
institutional ability and coherence which vary significantly amongst our seven civil
societies.
With five rural and three urban GROs, Baures comprised a compact society
where whites lived largely in town, indigenous people in the countryside, and mestizos
in both. The district had some 720 indigenous residents,504 and people of mixed race
made up the majority. But the social implications of this ethnic diversity were less than
elsewhere in Bolivia due to the greater degree of assimilation by Baureño natives and
mestizos. In linguistic terms, for example, 93% of Baures’ people spoke only Spanish,
5% Spanish plus a native tongue, and 0.1% a native tongue only; this compares starkly
with Bolivian averages of 32%, 19% and 43% respectively.505 Baureños’ dress was
essentially Western dress, largely free of distinguishing features such as the multi-
layered skirts and bowler hats of the altiplano, and mixed Baureño-Spanish surnames
abounded, indicating a high rate of intermarriage. Consistent with this, observers
501 Sr. Ana López, NGO director, interview, Guayaramerín, 22 October 1997. 502 Olson (2000). My use of this concept is explained in Chapter 7. 503 Respectively and jointly. Heterogeneity points to both characteristics, whereas encompassing interest refers mainly to the latter. 504 Self-identified.

Testing the Theory in Seven Municipalities
255
reported smooth social relations among these groups, and described Baures as “pacific”.
“Here everyone gets along well,” said the nuns from CETHA. “All participate equally
in each others’ feast days.”506 Indeed, the controversy surrounding the generator and the
prefect “was the first time since 1704 that there was a commotion in the town,” the head
of one GRO reported.507
Good social relations can partly be explained by the similar economic interests of
its citizens, whether indigenous, mestizo or white. As explained above, Baures
comprised a single agricultural and cattle economy devoid of industry, lacking in trade,
where small and medium-sized landowners prevailed. Town and countryside faced
similar economic incentives, and when the countryside prospered the town did too.
There was, thus, an encompassing interest in Baures, and one that expressed itself in a
context of social harmony using a common language, Spanish. This bred a similarity of
outlook that transcended politics and reached down into the social realm; as their goals
were similar, the social organizations they employed to advance them were similar too.
Rural and urban communities alike described their communities as “grass-roots
organizations”,508 using the language of the 1994 LPP reform, so eschewing the
opposition between “indigenous/original communities” and urban “neighborhood
councils” common in the rest of Bolivia. We might expect trust to flourish in such a
context, and in Baures it did. “The distribution of money is much better now,” said the
head of Jasiakiri’s GRO, explaining that his community was willing to forego
investments in one year so that resources might flow to other communities. “Now
communities take turns to receive investment. It’s good this way.”509 This leader valued
cooperation as such, illustrating an attitude that was common throughout the district.
With high levels of trust, a clear encompassing interest, and social relations that
were close and smooth, Baures’ civil society boasted a high level of institutional
coherence and the ability to involve the people in their local government. Its geography
may well help to explain these characteristics. Isolated by large plains that flooded half
the year, its only reliable link to the rest of Bolivia was by air. With only 5,133
inhabitants, and outside Bolivia’s main west-east migratory flows, it comprised a micro-
society with its own rules, traditions and social patterns of interaction. It was a stable
505 1992 census. 506 Sisters Pilar and Teresa and Prof. Oscar Velázquez, op.cit. 507 Oscar Durán, president of the Nicolás Carageorge neighborhood council, interview, Baures, 2 May 1997. 508 Organizaciones Territoriales de Base in Spanish, or OTBs.

Testing the Theory in Seven Municipalities
256
population that changed little from year to year, and its inhabitants knew that conflicts
with their neighbors would not go unnoticed, nor become much diluted. With only the
most limited of outside recourse, Baureños got along because they had to.
In Atocha, Porongo and Sucre, by contrast, deep-seated ethnic and cultural
differences had significant implications for the social dynamics and organizational
abilities of civil society. In Sucre the major difference was between rural and urban
sectors. The former was a large but fairly uniform area of 103 rural communities
populated by peasant farmers who spoke Quechua before Spanish, and worked their own
land using mainly pre-modern methods. The latter was a highly urbanized, Spanish-
speaking, industrial and service economy where migration over the past fifteen years
from the western highlands, the eastern lowlands, and a large stream of students from
Brazil had relentlessly pushed the city’s boundaries outwards, and profoundly changed
its ethnic composition. This was reflected in the city’s linguistic makeup, where only
32% speak Spanish exclusively, 11% a native language, and 52% Spanish plus a native
language. Unlike other Bolivian cities, Sucre lacked strongly marked social strata; the
city was abundant in the middle and working classes, and had almost no rich
inhabitants.510 But the differences between urban and rural Sucre were dramatic
nonetheless, and the district was essentially two municipalities – one agricultural and
socially homogeneous, the other (post-)industrial and socially mixed.
Like Sucre, Porongo had also seen large influxes of migrants during the past two
decades, in this case from Chuquisaca, the valleys of Santa Cruz, and the western
highlands. Although the district was older than the city of Santa Cruz, most of its rural
communities were formed recently by migrants from the west, and social heterogeneity
was high. Entire villages of recently arrived chuquisaqueños alternated on Porongo’s
map with villages of orureños, and others where provenance was mixed. Many recent
arrivals spoke Spanish quite poorly, and often had significant trouble communicating
with each other when their native languages differed. Language barriers were
compounded by differences of attire, diet, and religion, to the point where porongueños
commonly regarded each other as foreign and mutual suspicion impeded collective
action. This was especially true of the “residentes”, whose antipathy towards colla511
migrants exceeded that of the town’s native inhabitants. Atocha suffered public
509 Jasiakiri, op.cit. 510 Yáñez and Sobut, op.cit.; Jaime Gallo Garabinto, municipal councilman (MIR), interview, Sucre, 15 April 1997. There was general agreement on this point.

Testing the Theory in Seven Municipalities
257
divisions of comparable magnitude, though of a very different character. Local society
was divided between cooperativist mining communities, subsistence farming
communities, and a market town that served both. Each had its own traditions and
history, and its own forms of organization. The population of rural villages was fairly
stable: Quechua-phones who spoke some Spanish, with little in-migration and a small
but stead outflow. Miners were almost entirely recent migrants from throughout western
Bolivia who preferred Spanish to their native tongues and were ethnically mixed. And
the town, which also preferred Spanish, contained a significant floating population of
traders and salesmen that waxed and waned as mineral prices rose and fell.512 While
town-dwellers organized themselves into long-standing neighborhood councils, and
mining communities mobilized around the officials of their elected cooperative, rural
farmers had only weakly adopted the local institutions of the peasants’ union, and a
number of villages had no representative institutions at all.513
The constituent groups in all three districts faced divergent economic incentives
and priorities; in none was there an encompassing interest around which society could
rally. Atocha’s miners depended fundamentally on the price of minerals for their
prosperity, while its farmers operated in a separate economy with little surplus
production and little trade with the mines or town. The town sold the miners supplies
and bought their product, and hence shared their interests while largely ignoring the
countryside. The situation was similar in Sucre, where the city’s scale and sophistication
isolated it even more from its rural hinterland. If Atocha turned its back on the
countryside, Sucre was hardly aware that it existed. “The villages – they’re screwed,”
Fancesa’s general manager asserted, “because of their own characteristics.”514. Only in
Porongo were the interests of town and countryside broadly aligned, despite having the
most comprehensively mixed population, across both town and villages, of the three.
Here town and country alike comprised single, agricultural economy, richer and more
fertile than the other two, which sold its surplus to the nearby city. The town served the
agricultural hinterland, and what was good for the latter was good for the former. It was
thus all the more striking that this latent encompassing interest did not assert itself, but
511 A Bolivian term for highlanders. 512 García C., op.cit. 513 Villa Solano, for example, reported that its first attempt to form a GRO had failed when the elected leader disappeared from Atocha. 514 Fernando Beltrán, FANCESA (cement company) general manager, interview, Sucre, 18 April 1997.

Testing the Theory in Seven Municipalities
258
was undermined by interloping “residents” with fundamentally different priorities who
nevertheless managed to dominate local government.
Unsurprisingly, trust was at a low ebb in all three districts. In Porongo social
differences were simply too great, and the population too unsettled, for trust to have
developed amongst divergent communities. And in Sucre the lack of contact between
contiguous populations prevented trust from being born. Urban leaders were largely
unaware of the concerns of the villages, and rural leaders complained that municipal
officials refused to see them when they visited the city.515 But Atocha was the most
extreme case, where a lack of trust between villages and town became active distrust
where mining communities were concerned. At Chorolque, for example, miners took
project evaluators from the Social Investment Fund hostage for two days, demanding
that a delayed water project be approved for construction.516 With a history of militancy
and direct political action, Atocha’s miners did not believe the assurances of their local
and national authorities, and possessed the means to take matters into their own hands.
With low trust, a subverted encompassing interest, and levels of heterogeneity so
high that many of its people could not speak to each other, Porongo’s civil society
suffered from institutional weakness and little ability to mobilize around a goal.
Although some of its civic leaders were determined and knowledgeable, the social body
had too many cleavages too coalesce, and as a result lay dormant before local authorities,
unable to initiate policy discussions or defend its interests. In Atocha, the miners stood
alone in their coherence and organization, much more involved in the selection, design
and execution of public investment projects than farming or urban communities.
Amongst these three there was little interaction, low levels of trust, and no encompassing
interest. Hence civic mobilizations were of and for miners, and Atochan society as a
whole was dysfunctional. In a broadly similar pattern, Sucre functioned for all intents
and purposes as two independent societies, each in its own way internally consistent.
Urban society was able to overcome significant heterogeneity to organize itself
reasonably effectively around neighborhood priorities. Rural society, by contrast, had
far fewer social differences and much stronger institutions. But with low levels of trust
between the two and little in common beyond the municipal budget, their interaction –
such as it existed – took the form of a zero-sum contest for public investment which
515 Potolo, op.cit. 516 Chorolque, op.cit.

Testing the Theory in Seven Municipalities
259
urban groups were strongly placed to win. Sucre’s society, as a collective, was
dysfunctional.
Desaguadero and Guayaramerín offer social panoramas similar to the previous
three, while Sipe Sipe stands out for its relative homogeneity. Located in the fertile
valleys of Cochabamba, Sipe Sipe was an agricultural municipality centered on a market
town. Its population spoke Quechua and Spanish throughout the district, with no
apparent ethnic or cultural divides between town and countryside beyond a tendency to
favor Spanish in the former. Interestingly, the communities of Sipe Sipe assumed
similar organizational forms regardless of whether they were urban or rural. Although
local respondents referred to comités cívicos or juntas vecinales in urban areas and the
peasant’s union in the countryside, their underlying structures were very similar, with
secretarios generales for leaders, and officers elected according to a rotating system
throughout. In Desaguadero, however, the difference between urban and rural
communities was significant. The district was composed of eleven rural communities517
where Aymará and (some) Spanish were spoken, and two urban associations where
Spanish prevailed. Rural communities were organized into either traditional mallkus
originarios or local branches of the peasant’s union, as is common in the region. These
institutions, in the words of Albó, et.al.,
4 “are a form of social expression and a process of collective decision-making that surprise the outsider with their degree of participation and democratic respect… They operate more by consensus than by majority vote…[and have a] highly evolved system of jobs and authorities that organize the internal life of the community… and assure its articulation with society at large.”518
The two organizational forms are functionally very similar, as to a great extent
union authorities took on the duties of the pre-existing indigenous authorities during the
revolution of 1952-53; name changes were largely semantic, and at the community level
the underlying participative social structures remained.519 Desaguadero’s urban
associations, by contrast, featured leaders elected by majority vote and the hierarchical
structures typical of modern representative democracy. But the difference did not end
there. The town, unusually, was split between two different organizational forms: a
neighborhood council, and the Comunidad San Pedro, each comprising roughly half its
517 Interview evidence is at variance with official statistics on this point. I assume interview subjects’ figure of eleven is correct, and ascribe discrepancy with the official number to two causes: (i) several communities joining to form a single GRO, and (ii) the high dispersion/low spatial density of many of Desaguadero’s communities. 518 Xavier Albó, Armando Godínez, Kitula Libermann and Francisco Pifarré, Para Comprender Las Cultural Rurales en Bolivia, MEC/CIPCA/UNICEF:La Paz, 1990, pp.48-56.
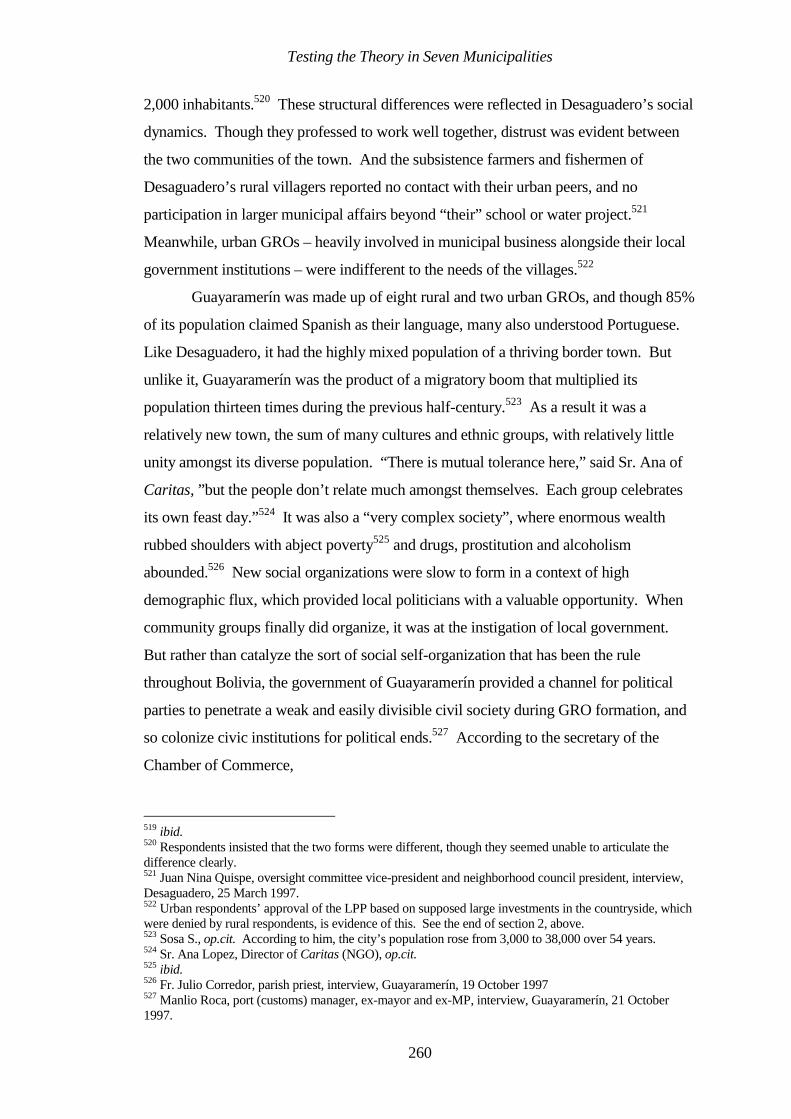
Testing the Theory in Seven Municipalities
260
2,000 inhabitants.520 These structural differences were reflected in Desaguadero’s social
dynamics. Though they professed to work well together, distrust was evident between
the two communities of the town. And the subsistence farmers and fishermen of
Desaguadero’s rural villagers reported no contact with their urban peers, and no
participation in larger municipal affairs beyond “their” school or water project.521
Meanwhile, urban GROs – heavily involved in municipal business alongside their local
government institutions – were indifferent to the needs of the villages.522
Guayaramerín was made up of eight rural and two urban GROs, and though 85%
of its population claimed Spanish as their language, many also understood Portuguese.
Like Desaguadero, it had the highly mixed population of a thriving border town. But
unlike it, Guayaramerín was the product of a migratory boom that multiplied its
population thirteen times during the previous half-century.523 As a result it was a
relatively new town, the sum of many cultures and ethnic groups, with relatively little
unity amongst its diverse population. “There is mutual tolerance here,” said Sr. Ana of
Caritas, ”but the people don’t relate much amongst themselves. Each group celebrates
its own feast day.”524 It was also a “very complex society”, where enormous wealth
rubbed shoulders with abject poverty525 and drugs, prostitution and alcoholism
abounded.526 New social organizations were slow to form in a context of high
demographic flux, which provided local politicians with a valuable opportunity. When
community groups finally did organize, it was at the instigation of local government.
But rather than catalyze the sort of social self-organization that has been the rule
throughout Bolivia, the government of Guayaramerín provided a channel for political
parties to penetrate a weak and easily divisible civil society during GRO formation, and
so colonize civic institutions for political ends.527 According to the secretary of the
Chamber of Commerce,
519 ibid. 520 Respondents insisted that the two forms were different, though they seemed unable to articulate the difference clearly. 521 Juan Nina Quispe, oversight committee vice-president and neighborhood council president, interview, Desaguadero, 25 March 1997. 522 Urban respondents’ approval of the LPP based on supposed large investments in the countryside, which were denied by rural respondents, is evidence of this. See the end of section 2, above. 523 Sosa S., op.cit. According to him, the city’s population rose from 3,000 to 38,000 over 54 years. 524 Sr. Ana Lopez, Director of Caritas (NGO), op.cit. 525 ibid. 526 Fr. Julio Corredor, parish priest, interview, Guayaramerín, 19 October 1997 527 Manlio Roca, port (customs) manager, ex-mayor and ex-MP, interview, Guayaramerín, 21 October 1997.

Testing the Theory in Seven Municipalities
261
5 “The GROs are terrible here…they’re totally politicized. They make midnight deals in search of payoffs…. GROs don’t consult their members before making decisions – rather the leaders meet with the parties, receive money, and then commit their misdeeds.”528
By falling under the sway of the parties, GROs became complicit in the endemic
corruption of Guayaramerín’s local government. Such collusion was both a symptom of,
and contributing factor to, the lack of social mobilization in Guayaramerín. Had
organized civil society preceded politics, it might not have been coopted so easily, nor so
thoroughly, by the parties. Instead GROs became political franchises that stifled civic
participation in government. “The people are like children here,” the 1o de Mayo
community explained. “They receive a misery [from local government] and are happy
with that.”529 Lacking an autochthonous organization and excluded by their civic
leaders, the people of Guayaramerín lay dormant before the government they had
elected.
Both Guayaramerín and Sipe Sipe benefited from an encompassing interest.
Agriculture provided this interest in Sipe Sipe, and bound the farming countryside to its
agricultural market town. Good years for the farmers were good years for the
townspeople too, and all tended to benefit from the same policies. The situation was
similar in Guayaramerín, where urban and rural sectors were intertwined in a modern
agribusiness economy, as is explained in detail above. This gave city and countryside
similar interests, and facilitated collective action for the progress of the municipality.
“The development of this town has been through the money of its own citizens,”
reported the parish priest. “They pooled their efforts to form their own water, telephone,
and other cooperatives” in order to provide basic services and improve the local standard
of living.530 These efforts were spearheaded by the city’s well-organized business elite,
which formed a powerful, all-party, pro-Guayaramerín lobby. They benefited from
growth throughout the district, and hence favored a comprehensive local development.
If public services were better in richer than poorer areas, this was due as much to the
financial constraints of cooperatives in a context of rapid population growth as to
discrimination by the governing class. By contrast Desaguadero, with a much smaller
and less developed urban center, consisted of two distinct economies, and hence two
528 Elío Simoni Casangeli, Chamber of Industry and Commerce secretary, interview, Guayaramerín, 21 October 1997. 529 Dionisia Cuéllar Pérez, Emilse Choquere and Santiago Méndez, community officers, interview, 1o de Mayo, 23 October 1997. 530 J. Corredor, op.cit.

Testing the Theory in Seven Municipalities
262
separate sets of interests. The town was dominated by transport and related businesses
that serviced the large volume of trade that daily coursed through it; the countryside
hosted subsistence agriculture which sold little to, or through, the town. Hence while the
villages were turned inwards, the town looked out to Peru and La Paz, and there was no
encompassing interest for the two to share.
In questions of trust, Guayaramerín was similar to Porongo while Desaguadero
was similar to Sucre. Guayaramerín’s migrant peoples were simply too diverse and too
unaccustomed to each other for trust to blossom amongst them. And the politicization of
its civic institutions served to replace the logic of cooperation that operates at their core
with a logic of (political) competition. Thus, on the few occasions when the practice of
local government brought Guayaramerín’s social groups into contact, it was not so much
to organize collective action as to do battle on behalf of their political patrons. A process
which might otherwise have promoted trust served instead to undermine it further. And
in Desaguadero, social and economic diversity was magnified by isolation. Although
they lived next to each other, its town and village populations had so little contact of any
sort that trust was practically impossible. In Sipe Sipe, on the other hand, the situation
was very different. With a culturally homogeneous and stable population, and a similar
model of social organization throughout the district, the conditions were well-established
for trust to develop. And the fact that Sipe Sipe’s GROs were able to coordinate their
efforts outside the ambit of formal politics with the aim of overturning a politicized and
unpopular mayor indicates that it did.
High heterogeneity and low levels of trust left society institutionally crippled in
Desaguadero and Guayaramerín. In the latter case, a latent and potentially powerful
encompassing interest was counteracted through the active subversion of society’s
organizational structure by political parties intent on widening the sphere of political
competition. In the former, civic institutions with relatively high ability and legitimacy
in the countryside, and medium ability in town, had almost no interactions with each
other, and – devoid of mutual trust – were, like Sucre’s, collectively dysfunctional. Of
the three districts, only Sipe Sipe boasted the conditions necessary for a coherent and
active civil society to emerge. Its younger GROs dated from the 1950s agrarian reform
period, while the older ones trace their history back to the pre-conquest villages of the
Inca and Tiawanacota civilizations. With a homogeneous population, widespread civic
trust, a clear encompassing interest, and strong civic traditions of participation in
community government, Sipe Sipe’s GROs enjoyed high levels of popular legitimacy

Testing the Theory in Seven Municipalities
263
and an ability to mobilize residents for collective action. Given this, its rank amongst the
lowest tier of municipalities is surprising. As we shall see below, this can be explained
in part as a transition dynamic: GROs were still learning to use the (new) system of
municipal government to their advantage, and once they did the persistence of
unresponsive local governments would become very much more difficult. Figure 18
summarizes the districts’ social characteristics.
Figure 18Civil Society
Institutional
Social Encompassing Coherence &
Rank Municipality Heterogeneity Interest Trust Ability ( ICA)1 Baures Low Yes High High2 Porongo High Yes* Low Low
Sucre High No Low Low**3 Atocha Medium No Low Low+4 Desaguadero High No Low Low**
Guayaramerín High Yes Low LowSipe Sipe Low Yes High HighSources: Author's interviews, observation and other fieldwork
* Latent encompassing interest** Rural high + urban medium = collectively low+ Rural low + urban medium + mining communities high = collectively low
4. The Local Governance System
This section turns to the question of how the economic, political and social
factors identified above interact within the confines of the legal-political framework to
determine the quality of local governance. Although these factors account for the deep
logic of local government, they operate through the proximate causes of governing
institutions. Hence this section will also trace how economics, politics and society
jointly determine the quality and character of the municipal council, oversight
committee, and the local executive branch (mayor) in each of our seven municipalities.
4.1 Baures
Baures was a small, ethnically and culturally homogeneous municipality where
both town and countryside were bound together in a single agricultural and cattle
economy. Small to medium-sized farms predominated, and there were no conspicuously
powerful economic interests. Such a small, isolated district provided its residents with

Testing the Theory in Seven Municipalities
264
strong incentives to get along, and life in Baures had a familial, cozy air. Civil society
was well-organized into urban and rural community associations that had high
organizational ability and benefited from broad popular legitimacy. As a result, these
associations were able to both involve the people in the governance process and engage
with official institutions in town on an equal footing. Politics was quite competitive and
party identity was strong, perhaps in part because of a previous administration widely
reviled as corrupt and ineffective. All of these factors combined to produce a high-
quality local governance system that was focused on voters and responsive to their
needs. In terms of the model of Chapter 7, there was balance between the political
markets for votes and influence and the logic of social representation as mediated by
Baures’ civic associations (see figure 19 below). The inherent tension between these
three elements created a self-limiting dynamic in which the pressures of local interest
groups were contained within the bounds of political competition, and did not spill into
the machinery of local government nor erupt as civil strife. This served to create
responsive institutions of local government.
Thus the municipal council was responsive and highly attuned to local needs.
Respondents affirmed that the council met with them regularly, and commented
approvingly of its work with the mayor to solve local problems and respond to their
demands.531 “The councilmen respond mostly to the people,” said the leader of El
Cairo, echoing the general sentiment. “They don’t take account of who voted for them
and who didn’t, but rather of the needs of everyone.”532 The mayor, too, was held in
high esteem throughout the district. First elected in 1996, he had been confirmed in his
post the following year and was judged far superior to his predecessor. Like the council,
the mayor was credited with planning projects well and distributing municipal resources
equitably, including for the first time the district’s small villages.533 Lastly, the oversight
committee was described as well-intentioned and moderately active, but lacking the
funds to perform its role properly. “It’s a job that demands a lot, but they aren’t paid
anything,” explained councilman Oni Antelo.534 Nonetheless the OC was credited with
successfully mediating local demands during the yearly budget planning exercise, and
more generally with consulting townspeople and villagers before acting. Perhaps
because of the legitimacy it so generated, the only time it opposed municipal policy it
531 Hugo Ayllón Parada, Cattlemen’s Association president, interview, Baures, 2 May 1997. 532 El Cairo, op.cit. 533 El Cairo, op.cit.; Jasiakiri, op.cit.; Srs. Pilar and Teresa, and Velázquez, op.cit.

Testing the Theory in Seven Municipalities
265
won.535 Together, these three institutions produced good-quality local government in
Baures that was accountable to voters and focused, instead of politics, on their needs.
The generator incident exemplified this. It is not surprising that baureños were satisfied
with the quality of government they received and rated public investment projects
highly.
Political PartiesLocal ConstituencyPolicies/InfluencePolicies
Local Government Institutions
Votes Money
Civil Society
Figure 19: The Local Governance System in Baures
Firms and Economic Interests� �
�Cou
nter
part
s/P
artic
ipat
ion
Services
Info
rmat
ion
(Pre
fere
nces
)
Info
rmat
ion
(Fee
dbac
k)
4.2 Sucre
Sucre, in comparison a huge, diverse, and highly urbanized district, was in some
ways also a sleepy municipality. Its two major social divisions were: (i) city vs.
countryside, and (ii) native-born sucrenses vs. recent (urban) immigrants. Civil society
in the countryside was well organized by village associations, keepers of the traditions
and identity of Sucre’s peasant farmers; city society was organized by neighborhood
councils and other civic associations which, though many were still in the process of
formation, enjoyed reasonable levels of legitimacy amongst their members. But between
the two there was essentially no contact and very little in common, social, economic or
534 Oni Antelo, op.cit. 535 The OC was able to have a fence, originally planned for a sports field, re-assigned to the local cemetery in order to keep out stray dogs.

Testing the Theory in Seven Municipalities
266
otherwise. As an institutional whole, civil society in Sucre did not work. The local
economy was similarly divided between a hinterland of subsistence agriculture and an
urban economy of services and small-to-medium sized industry, with little integration
between the two. Surprisingly given its size, the city lacked large firms or other
dominant private interests. To a large extent this was reflected in Sucre’s politics, which
was uncompetitive to the point of being inert. Parties did not represent societal interests
or sectors. Rather than compete on ideas in the foreground of municipal life, they
preferred to remain in the background, carving up official patronage amongst themselves
in a broad cohabitation, behind the façade of a popular mayor from a minor party. With
political debate stifled, politics became a cozy enclave from which politicians had little
incentive to emerge.
In terms of the model, the cash market for influence between parties and private
interests was very weak, while the market for votes was comprehensively subverted by a
non-competitive party regime. The division and weakness of civil society completed
local government’s isolation from local needs, and from incentives to meet them. Figure
20 illustrates Sucre’s local governance system. I leave similar illustrations for the
remaining districts to the reader. Together, these factors produced a curious mix of
competence and detachment in city hall. On the one hand, the institutions of government
were isolated by an anti-dynamic in which no one fought to control them. But on the
other hand, a capable, and even sophisticated, municipal administration toiled at the
center of this vacuum to ensure that local services never fell below minimally acceptable
levels. Perhaps because of its history as a center of government under both the Spanish
and the republic, Sucre had developed a tradition of competent municipal administration,
with well-trained operational officials, some of the best budgeting and IT systems in
Bolivia, and an unusually high rate of local tax collection. Local government in Sucre
was thus a well-maintained but rudderless ship, drifting without direction.
The municipal council certainly did not provide leadership. Independent
observers, unenthusiastic about their government, reserved their greatest scorn for
Sucre’s councilmen, who were judged almost universally to obey their parties and ignore
voters. “They are unprofessional and incoherent,” reported the manager of FANCESA.
“They’re interested in other things, not the city nor municipal government.”536
Communities urban and rural alike asserted that councilmen were poor-quality and did
536 Beltran, op.cit.

Testing the Theory in Seven Municipalities
267
not represent them or their aspirations. Sucrenses had a higher opinion of their mayor,
though opinion was divided between city and countryside. Urban dwellers appeared to
be reasonably content with their local executive, while rural villagers reported that
municipal resources never arrived; they judged their condition as bad as before
decentralization or worse, to the point where some wanted to secede from the district.537
While the mayor pursued important investment projects in the city, he was criticized for
offering the villages “little patches that distract them but don’t satisfy their needs”.538
The weakness of civil society meant that most rural (and many urban) communities did
not have the capacity to draw up project plans, or lobby government to answer their most
pressing needs. This, along with Sucre’s political vacuum, meant that the mayor faced
few binding external incentives, and hence responded to public needs largely on account
of his own preferences.
Instead of seeking to overcome the urban/rural divide, government
institutionalized it by establishing an independent oversight committee for each. While
this might at first appear to be a reasonable response to heterogeneity, its effect in
practice was to weaken civil society still further before institutions of government which
had not, after all, themselves divided. In the event, both OCs were poor. The urban
consensus held that its OC was ineffective, repeatedly failing to provide project
oversight, with only its vice president complying with his duties. The performance of
the rural OC was more variable, suffering from its own weakness and the hostility of
some mid-level municipal authorities; the few good reports it merited from village
leaders stood out amongst a mass of negative opinion. Thus a surprisingly sophisticated
and effective administrative apparatus coexisted alongside an ineffective municipal
council, a weakly accountable mayor, and a divided OC. It is not surprising that public
investment responded only tepidly to popular demand, and that satisfaction with local
government was only lukewarm. Sucre’s investment planning system was symptomatic
of its local government: the municipality employed a well-designed, comprehensive,
iterative planning procedure that carefully incorporated participation throughout. But it
also took advantage of its influence and technical competence to distort some
communities’ requests arbitrarily. Unusually for Bolivia, Sucre’s municipal government
was the largest local actor. It had significant power over civil society, not the other way
around, and this showed in the way the district was governed.
537 Potolo, op.cit.

Testing the Theory in Seven Municipalities
268
Figure 20: The Local Governance System in Sucre
Local Constituency Political PartiesFirms and
Economic Interests
Policies
Local Government Institutions
Civil Society
Policies/Influence
Votes MoneyX X
XC
ou
nte
rpar
ts/
Par
ticip
atio
nS
ervices
Info
rmat
ion
(Pre
fere
nce
s)
Info
rmat
ion
(Fee
db
ack)
4.3 Porongo
Small, rural and poor, Porongo was in some ways similar to Baures, with an
economy dominated by small family farms, no industry, and no powerful interests in
residence. But its population was much more mixed by years of migration, to the point
where most porongueños were recently arrived Quechua-speakers who did not share the
local diet, religion or other traditions. Nonetheless conflict was rare amongst these
diverse groups, who shared very similar economic interests. What might have been a
quiet, consensual public life amongst Porongo’s residents was instead riven and distorted
by its residentes, a powerful and relatively wealthy group of ex-porongueños who lived
in the industrial economy of nearby Santa Cruz and ran the municipality from their urban
enclave. They used their money and status to dominate local politics, which accordingly
turned on their particular concerns. By and large these were the children of the leading
lights of the town, who left to study and work in Santa Cruz. They assuaged feelings of
rootlessness or disorientation in the city by conjecturing a happy, bucolic past consisting
largely of games and traditional crafts set in a rural idyll. This they then sought to
recreate and impose on the actual residents of Porongo. Hence the Civic Committee for
538 J. Bonifaz, op.cit.

Testing the Theory in Seven Municipalities
269
Women, composed of “residents”, hoped soon to offer local women courses in “dress-
making, pastry-making, knitting and traditional artisanery,” its president reported.539
“There’s no inventory of the town’s cultural patrimony,” she added worriedly,
explaining her proposal for a museum of local culture. In effect, the “residents” sought
to turn a dynamic community in the midst of significant economic and demographic
change into a museum of their imagined past, a sort of zoo filled with the traditions and
symbols they themselves had left behind. Not surprisingly, this was resisted by a
population that never knew such a past, and who did not want it as their future. The real
interests and problems of rural Porongo were unable to penetrate this evocative haze, and
in this way the residentes’ fixation with the town’s plaza central displaced the
agricultural priorities of a rural economy.
The urban elite was able to get away with this because of the fragmented nature
of Porongo’s civil society, and because they completely dominated its politics. The
district’s many and diverse migrant groups distrusted each other and, often too weak to
organize amongst themselves, were unable to establish broad civic associations that
spanned the district’s villages and ethnicities. Thus splintered, civil society could neither
effectively represent grass-roots demand to local government, nor mobilize popular
support against the ruling elite. Meanwhile local politics – completely uncompetitive –
offered no recourse. Local parties were all colonized by “residents”, and all allied
together in the municipal council. With no political opposition, party dynamics in
Porongo comprised a sharing out of power amongst the “residents”, something
facilitated by high voter absenteeism in the countryside. In terms of the model, the cash
market for influence between parties and private interests was very strong, and in turn
undermined the market for votes and policies; the entire political system, in effect,
represented a single narrow interest group. At the same time, the logic of social
representation was interrupted by civil society’s institutional weakness. It is thus not
surprising that local government in Porongo was neither representative of nor responsive
to the people.
Thus municipal councilmen, four of five of whom lived in Santa Cruz, were
widely judged untransparent, oblivious to local needs, and primarily concerned with
their own or their parties’ interests.540 They held more council sessions in Santa Cruz
539 Marta Oyola Morales, president of the Civic Committee for Women, interview, Porongo, 7 April 1997. Oyola lived in Santa Cruz but came to Porongo “every weekend”. 540 The order of priorities is telling.

Testing the Theory in Seven Municipalities
270
than Porongo, and were accused by many of conspiring to exclude porongueños –
including the OC – from municipal business by keeping the times and places of their
meetings secret. The mayor, on the other hand, was an attractive and expansive ex-
footballer from Santa Cruz whose populist instincts took him deep into the countryside
regularly. Public opinion credited him with good intentions but criticized his officers as
poor and unaccountable, and reproached his administration more generally for operating
in a desultory, capricious manner. Much of this was blamed on politicians’ residence in
the city, which complicated coordination with officials in town and helped obscure
responsibility. But it is notable that neither was subject to external political or economic
constraints which might otherwise have modified their behavior. Lastly, respondents
agreed that the oversight committee was lucky to have a president who was honest and
hard-working. But the mayor and municipal council worked equally hard to obstruct
him and exclude the OC from official decision-making, denying him the office to which
he was entitled and refusing to provide transport. Given no resources and civic
organizations too weak to either support him or oppose the municipality actively, the
ability of this modest farmer to hold government to account was minimal. In the words
of one community leader “they’ve left him all alone.”541 As a result, and despite a
healthy moral authority, the OC in Porongo was weak.
With a weak OC, a terminally unresponsive municipal council, and a mayor with
more will than ability to satisfy voters, it is not surprising that the quality of government
was mediocre, but rather that it was not worse. This can largely be attributed to the
mayor’s desire for popularity, which led him to make investments which – community
leaders agreed – satisfied some of their needs, and led to modest improvements in public
services. Such is the value of leadership in a governing system which otherwise would,
in all likelihood, have performed even worse. Porongo’s bridge project exemplified the
system out of which it came. This, the star investment in the municipal portfolio, was set
to connect an uninhabited point fifteen kilometers east of the town with the exclusive
neighborhood of Equipetrol in Santa Cruz. But local farmers sold their produce in a
different part of the city, for which this bridge was not useful. And with no extant road
connecting the town to the bridge site, it was not difficult to judge the bridge either a
prestige project or a piece of land speculation, designed to urbanize the near bank of the
541 Villa Guadalupe, op.cit.

Testing the Theory in Seven Municipalities
271
river and multiply property prices. In either case, those who stood to benefit were the
“residents” and not Porongo’s rural population.
4.4 Atocha
Atocha sits alone on the third rung of municipal quality, with an economy
diversified to the point of disjointedness. Local economic actors were almost entirely
small-scale, and divided cleanly between cooperative mining and subsistence family
farms, with little to connect the two. As the town’s economy was built around mining
services and trade in minerals, urban interests were more receptive to miners’ demands
than those of rural farmers. This bias was compounded by high electoral absenteeism in
the countryside, which gave villagers little voice inside local government. The political
system as a whole was uncompetitive, with a three-party governing coalition holding
three-quarters of the vote and no active opposition. It was also primarily an urban
phenomenon, focused on control of the apparatus of local government, and thus
intrinsically sterile. Real political interaction, in the sense of genuinely opposed interests
competing over resources, occurred sporadically outside formal politics, in Atocha’s
streets and plazas, when the miners mobilized and marched on city hall in defense of
their interests. Civil society was also clearly divided in Atocha, between highly
organized immigrant miners with a large capacity for mobilization, poor and poorly
organized native farmers in the countryside, and the merchants and employees in town
who were relatively well-off and well-placed to lobby local government.
The irony of Atochan politics was that the two groups with significant power to
influence policy and capture resources – miners and merchants – were precisely the
groups most dependent on the highly cyclical mining industry, and hence the most
willing to abandon the district when the industry slumped. Recent history had illustrated
this dramatically, with Atocha’s mines abandoned wholesale in the late 1980s, followed
by an upswing a decade later which more than doubled the district’s population. Hence
those who were most adept at securing public investment were also those with the least
incentive to invest in their communities themselves. Meanwhile those who combined
the worst level of public services with the clearest long-term interest in the prosperity of
their communities – Atocha’s peasant farmers – suffered the weakest ability to mobilize
to press local government with their needs. With sterile politics and a civil society that
was divided and incoherent, it is not surprising that Atocha’s government performed
poorly. Local public opinion reflected this. In terms of the model, the cash market for

Testing the Theory in Seven Municipalities
272
policies and influence operated normally, while the primary political market for votes
was in large part strangled by electoral absenteeism and an uncompetitive party system.
The divided and institutionally crippled nature of civil society completed a governance
system which was unbalanced and inequitable. Hence public resources and attention in
Atocha were skewed towards areas where they were least needed – the town – and least
sustainable over time – the mines – while ignoring those areas – rural villages – where
need was greatest and investments most likely to prove sustainable. The municipality
went so far as to allocate resources to miners from adjacent districts before its own
villagers.
The failure of Atochan politics was seen most clearly in its municipal council.
The least impressive of Atocha’s institutions of local government, it was largely inactive
and headed by an illiterate president. Councilmen seemed rarely to leave the town, and a
strong public consensus held that they responded primarily to their parties “due to their
own ignorance”.542 With little incentive to tend to villagers’ needs, the council focused
on urban issues and the simplistic politics of municipal patronage. In the words of the
OC president, “Initiatives aren’t followed up from year to year. There’s little
coordination amongst parties and between governing periods. This is bad for projects
and for municipal work.”543 The mayor, on the other hand, was regarded as well-
meaning and honest, but lacked administrative ability and leadership. Although he made
special efforts to reach out to rural villages, the combination of his own background and
the highly partial political environment in which he operated led him also to favor the
town and miners. In institutional terms, the oversight committee stood between the
mayor and municipal council, divided like the society it represented. Of its six members,
three worked conscientiously to represent civic opinion in public debate, but two
members were inactive and a third – the vice president – had escaped to Potosí. A lack
of resources and the presence of only one member, the secretary, in the town further
hampered the OC’s effectiveness. Nevertheless, community leaders agreed that the OC
was effective in overseeing and modifying government policy, especially in the town
and main mining centers. But transport to farming villages was more difficult, and there
its effect was scarcely felt. Thus government in Atocha consisted of a reasonably
competent mayor working with an ignorant and ineffective municipal council, and an
oversight committee that was fairly capable but faced severe institutional limitations.
542 Victorio A., op.cit.

Testing the Theory in Seven Municipalities
273
The result was mediocre policy-making which skewed investment towards those with
the loudest political voice, and ignored those with greatest need. Like Porongo, this case
highlights the importance of leadership: with a compromised system of local governance
and weak public institutions, Atocha was pregnant with the possibility of even worse
government. That it was merely mediocre is testament in large part to the mayor’s good
will and the OC president’s leadership.
4.5 Desaguadero
Desaguadero heads the trio of worst-performers in our group. A rich border
town with abundant own-revenues, its government was lucrative to hold and local
businessmen vied to run it. But despite a large and valuable trade with neighboring Peru,
Desaguadero’s main economic interests – transport firms and related businesses that
serviced cross-border trade – were small and medium sized, with no dominant actors.
The fact that the most important businesses were mobile implied that these interests, by
and large, were not entrenched, and hence more sensitive to the costs of political
involvement than elsewhere. Socially Desaguadero was really two municipalities, with
two economies and two civil societies quite disconnected. Rural Desaguadero, though
well-organized at the village level, was too poor to mobilize itself at the district level,
and hence remained splintered and weak in the face of urban society. The town’s GROs,
by contrast, were better-financed and – living on the municipality’s doorstep – found it
much easier to catch government’s attention. They were able to dominate civic
discourse to the exclusion of rural concerns and interests, but were themselves divided
between two organizational forms, which sapped their institutional strength. Lastly
politics, in the sense of ideology or national party dynamics, barely mattered in
Desaguadero. Local politics was about occupying power, and although a formal
opposition existed politics was not competitive. Rather it was an accommodative pursuit
free of substantive political discourse, where the sharing out of spoils was punctuated by
periodic elections in which a changing business elite sought to gain control of the
instruments of power. With no political accountability, limited social oversight from
urban areas, and none from the countryside, local government was free to be
manipulated at will by the interest groups that captured it, responding grudgingly to
urban demands and ignoring those of the villages. Local governance was worse in rural
areas than in town, and overall quality was poor. In terms of the model, the cash market
543 Mamani V., op.cit.

Testing the Theory in Seven Municipalities
274
for policy influence was healthy and dominated the political market for votes, itself
undermined by an uncompetitive party system. Meanwhile civil society, twice divided,
was too ill-informed and too weak to hold politicians to account. It is thus not surprising
that disappointment with local government was rife at the grass-roots level.
The municipal council exemplified local government’s failings. A broad
consensus held that it was thoroughly politicized, attuned to the needs of the parties and
insensitive to its voters. “It’s all politics,” said the leaders of Titijumi and Huancollo,
describing the council’s work.544 Tellingly, not even townspeople could explain how it
functioned, though some evidence suggested the council was cowed and manipulated by
the mayor. The mayor himself, and his staff, received poor reviews from his
constituents, though a number attributed this to his short time in office. Subject to little
social or political oversight, he could do as he pleased, as the town’s 70% share of the
investment budget – twice its share of population – indicated. But so far he had done
little. Lastly, the oversight committee reflected the lay of the district. Its presidency
alternated between the two urban GROs, never going to any rural member, and hence the
OC – like the municipal council – remained in the grip of the town. This, however, was
less significant that it might have been, as the OC was convincingly ineffective. Some
residents accused them of ignoring their duties and others of taking bribes to do so.
When I arranged to interview its president he did not arrive – I later found him with his
(OC) officers on a street corner, literally falling down drunk.545 The vice president, to
whom I did speak, professed ignorance about one of the town’s largest investment
projects. “I demand to know which are our most important objectives,” he thundered at
me, “as soon as possible!”546 With the institutions responsible for oversight and
accountability either politicized or suborned or both, leaving the municipal executive
free of external discipline, local government was no better than mediocre and possibly
corrupt, and largely ignored its residents’ needs.
4.6 Guayaramerín
Guayaramerín was a complex combination of extremes of wealth and power in a
context of high social diversity, which produced a very particular political dynamic. The
city had been transformed by the migratory boom of the post-war period, which
544 Justo José Apaza, community leader, interview, Desaguadero, 25 March 1997; Constantino Aruquipa and unnamed, school association president and member, interview, Desaguadero, 25 March 1997. 545 The following day he was still too ill to see me. 546 Nina Q., op.cit.

Testing the Theory in Seven Municipalities
275
multiplied its size and filled it with people and cultures from throughout Bolivia. With
different languages and traditions, Guayaramerín’s many ethnicities jostled each other in
the streets and markets of the city, but found it difficult to trust each other or even, in
some cases, to communicate. This impeded cooperation at the neighborhood level, and
civic organizations were slow to form. When they finally did, it was under the tutelage
of local government. This effectively allowed Guayaramerín’s political parties to
intervene in community formation for the sake of partisan advantage. Civil society was
thus party-politicized, making GRO leaders beholden to political masters and
neutralizing community groups as an independent source of authority in the district. In
Putnam’s terms, the horizontal linkages of civic organizations were instigated by
political parties for explicitly partisan ends, rendering them unable to conduct effective
oversight of politicians, and unlikely to promote their constituents’ interests in the
political process. Politics, meanwhile, was the preserve of local power-brokers, defined
by the agreements they reached, and not the domain of collective action nor action on
behalf of the collectivity. There was little ideology and little adherence to national
strategies; this was not a politics of ideas, but rather of power and of influence. In part
no doubt because society was fractured, the people of Guayaramerín had a weak
tradition of political participation. The elitist conduct of policy sapped the legitimacy of
politics and people’s belief in the possibility of voice. Electoral absenteeism was high.
Like Atocha, this in turn facilitated the efforts of a business and political elite to keep
themselves in power through a variety of means.
But the defining feature of Guayaramerín was its economy – rich, diverse, and
thoroughly dominated by a small coterie of powerful businessmen who also ran the
city’s important public and private institutions. Hence the president of the municipal
council was also head of the telephone cooperative, the mayor was a prominent timber
merchant, and the head of the local ADN owned two of the district’s three television
stations, along with several agribusiness and transport concerns. Guayaramerín was thus
run by a pro-business, of-the-business alliance primarily interested in the growth of the
local economy, as well as in distributing municipal business amongst themselves. They
admitted little public debate before key municipal decisions, and kept official accounts,
investment plans (including the OAP), and other records very much out of the public
eye. Once in power they left political divisions aside and behaved as a clan, providing
no restraint on each others’ actions and ignoring each others transgressions. They
adhered to a trickle-down philosophy, and were more interested in accumulation than in

Testing the Theory in Seven Municipalities
276
actively oppressing any group in particular. But because their cause was pro-growth and
their interests encompassed essentially the entire local economy, private accumulation
had historically led to public accumulation too.
This business elite proved adept at developing Guayaramerín during the decades
when it was a forgotten provincial town with few public resources because it was able to
marshal private resources for the collective good when the question at hand was also a
business priority. Thus electricity and telephone service were both brought to the city
through cooperatives led by prominent local businessmen; and much street paving and
the decoration of the central plaza were made possible through private contributions.
But this model of “governance”, which relied on informal contacts and private
agreements, proved deficient at running a more complex municipal government that
presided over a large rural hinterland. The advent of decentralization brought the district
significant public resources, the administration of which demanded transparency and
extensive consultation. And the business elite was not good at this. In terms of the
model, the primary market for votes and policies was weak on account of an elite-
dominated, uncompetitive party system. The cash market for policies and influence, on
the other hand, was very strong indeed. And the logic of social representation was
comprehensively undermined by the political capture of community organizations. Thus
Guayaramerín’s local governance system was severely unbalanced, and it is no surprise
that the municipality proved biased towards the city and insensitive to local needs.
Guayaramerín’s municipal council was in some ways the institutionalization of
its ruling elite, populated as it was by prominent locals. But whatever their abilities as
businessmen, as councilmen they rated very poorly. “The priest,” said one observer,
referring to the MBL councilman,” is a demagogue…. The rest of the council is
useless.”547 Popular opinion held that they responded to their own interests and to those
of their parties, and even the council president conceded that their parties told them what
to do.548 The leader of the 1o de Mayo community described the effects of such
politicization: “When we go to see them [councilmen] in Guayaramerín to request
something or discuss some concern, they ask us what party we belong to. If we answer
their own party, then we’re attended very well.”549 The mayor appeared to be somewhat
more effective and less aggressively political, although he benefited from the
547 Simoni, op.cit. 548 Nincevic, op.cit. 549 1o de Mayo, op.cit.

Testing the Theory in Seven Municipalities
277
comparison with a detested predecessor. The popular consensus held that he had
brought about some improvements in the city, but had had little or no effect in the
countryside. A number of observers accused him of promoting conspicuous
infrastructure projects while ignoring the more important needs of the populace.550
“There are big problems here, and the municipality is dedicated to small things,” said the
parish priest.551 Many others reproached him for refusing to meet with GRO
representatives, and obstructing participation generally.552 To the extent that the mayor
cultivated an image of effectiveness, this was largely a façade, a shield behind which the
ruling elite could strike the serious deals implicit in running a large municipality.
Guayaramerín’s oversight committee, lastly, was different in its overt
politicization from those of our six other municipalities. Political parties largely
determined its composition through their manipulation of GROs; OC candidates ran
political-style campaigns, and its president promptly identified himself as an ADN man.
But most importantly of all, city hall held the power to change the OC leadership if it
chose, and had wielded it in the past.553 Thus compromised by the parties, the OC was
neutralized as an independent authority and had little say in official decisions. With a
politicized and unresponsive municipal council, a posturing mayor who obstructed
popular participation, and an oversight committee infiltrated and neutralized by political
parties, popular dissatisfaction with local government was virtually assured, and was
forthcoming. But city hall seemed oblivious to such considerations. The mayor shifted
municipal alliances with ease after the ADN took power in La Paz, and the business of
governing continued undisrupted.
4.7 Sipe Sipe
Our last municipality, Sipe Sipe, was different from the other worst-performing
districts in several important ways. Unlike Desaguadero and Guayaramerín, it
comprised a homogeneous agricultural economy in which the town provided markets
and agricultural services for farmers in the villages. And with no haciendas remaining
after 1953, the district lacked dominant – or even large – economic actors. But common
economic interests did not lead to a government responsive to people’s needs, and this
was in part the fault of politics. Sipe Sipe’s party system was uncompetitive, afflicted by
550 Catalayud, op.cit. 551 Herrera, op.cit. 552 Catalayud, op.cit. 553 1o de Mayo, op.cit.

Testing the Theory in Seven Municipalities
278
demagoguery and an insider dynamic that allowed the mayor, when forced to resign
under a cloud of suspicion, to swap jobs with the president of the municipal council and
continue in government. Fairly low electoral participation rates facilitated such
manipulations by the political elite to remain in power. In this way the political system
was rendered unresponsive to popular concerns, and real, substantive political
competition occurred instead outside formal politics, spearheaded by GROs and the
oversight committee. Sipe Sipe’s civil society was well suited to this role, with strong
institutional characteristics arising from a high degree of ethnic and cultural
homogeneity that allowed it to mobilize around common goals effectively. Its civic
associations were well-established, some from before the Spanish conquest and others
from the 1950s, with strong traditions of self-government and popular mobilization. But
a local government both politicized and involuted failed to exploit its potential, and
community groups had little participation in the planning or execution of municipal
projects. This helps to explain popular discontent with Sipe Sipe’s government,
criticized throughout the district as unresponsive to local needs. It also explains why
civil society was plotting to seize the reins of power and overthrow the mayor. Old,
organized, and largely excluded from the local governance system, civic organizations
had both the means to fight local authorities and the will to do so. In terms of the model,
the secondary market for policies and influence, given feeble economic actors, operated
weakly, while the market for votes and policies was disrupted by an untransparent, anti-
competitive party system. And the logic of social representation, which should have
flourished in a context of social coherence, was artificially disrupted by authorities who
connived to stifle it.
The municipal council exemplified many of the flaws of government in Sipe
Sipe. A highly politicized body, it was a forum for political intrigue and widely believed
to be corrupt. Popular consensus held that councilmen obeyed first their own pockets
and then their parties, before considering the needs of the voters. The mayor and
municipal executive displayed similar characteristics, dictating which investment
projects a number of communities received and excluding popular participation from the
government process generally. “The municipality thinks the AOP is a sacred
document,” reported the leaders of Mallco Rancho.554 Popular consensus held that
government and public services had improved little or not at all since decentralization
554 Montán, et.al., op.cit.

Testing the Theory in Seven Municipalities
279
“because politicians cheat us [and] the municipality spends money according to its own
convenience.”555 Lastly, the oversight committee failed to oversee municipal business
adequately on account of its own ignorance and inactivity. When asked about a major
water project almost on his doorstep, the OC president proved utterly uninformed. GRO
leaders agreed that the OC did little to fulfill its official duties, accusing its leader of
partiality to the mayor. With a mayor and municipal council that were politicized,
unresponsive and corrupt, and an oversight committee ignorant and complicit with the
authorities it was bound to oversee, local government did not perform well. And the
people of Sipe Sipe, naturally, were discontent. But the striking fact about the system of
local governance in Sipe Sipe was the ability and willingness of its civic organizations to
confront the problem directly. The decentralization law strengthened their hand by
granting them control of the OC, which in turn gave them the means to challenge the
mayor and a chance to overthrow him.
Figure 21The Local Governance System Summarized
(1) (2) (3) (4)
Open and Civil Responsiveness and
Competitive + Society + Competitive ==> Accountability ofRank Municipality Economy ICA* Politics Governance System
1 Charagua 4 5 5 5Baures 4 5 5 5
2 Porongo 2 2 1 2Sucre 3 3 3 3
3 Atocha 4 2 2 24 Desaguadero 4 2 2 1
Guayaramerín 1 1 1 1Sipe Sipe 5 4 2 3Viacha 1 2 1 1Sources: Author's interviews, observation and other fieldwork
* Institutional Coherence and AccountabilityColumns 1, 2 and 3 summarize the information in figures 16, 18 and 17.Values: 1 = lowest, worst; 5 = highest, bestViacha and Charagua added for purposes of comparison.
4.8 Summary and Comparisons
The table in figure 21 summarizes the main factors used in the above analysis. It
does this by mapping the information in figures 16, 18 and 17 into three columns
respectively, which correspond to the following concepts: (i) openness and
555 Siquisiquía, op.cit.

Testing the Theory in Seven Municipalities
280
competitiveness in the local economy (vs. hegemony or dominance by a few
firms/actors); (ii) civil society’s institutional coherence and ability; and (iii) an open,
competitive political system marked by political entrepreneurship and policy innovation.
As is argued in section three and demonstrated in section four above, these variables are
key to explaining the quality of a district’s governing institutions, and hence the quality
of governance received. Mapping is done by assigning each municipality a value
between one and five, where one is lowest (worst) and five is highest (best). While the
value for each district is primarily based on that of the relevant column in figures 16-18,
it also attempts to summarize the information in each table more generally. The
schematization implicit in such notional values is a necessary compromise in order to
present a large and diverse amount of information succinctly.
Together, these economic, social and political factors determine the fourth
column, the overall responsiveness and accountability of the local governance system.
In simple terms, this captures the extent to which citizens are able to make local
government do things for them, where government is construed to include the mayor,
municipal council, and oversight committee. The column summarizes citizen’s
responses to a variety of questions put to them in my extended interviews. As argued in
the previous section, the responsiveness of a district’s governing institutions maps
directly into people’s perceptions of government quality, as given by their satisfaction
with the public services and policy they receive. The ranking of municipalities in figure
21 demonstrates this – rank is according to popular perceptions, and closely tracks the
values of column four. A comparison with figure 15 provides further corroboration.
The obvious exception to this analysis is Sipe Sipe, where a mediocre level of
government responsiveness and accountability is associated with performance that is
significantly worse. In other words, the model predicts a higher quality of government
than respondents reported. This is because the district possessed two of the three
conditions necessary for good local government: a competitive economy, and a high
level of social coherence; but the third – a competitive local politics – was actively
stymied by machinations of the mayor and municipal council. But Sipe Sipe’s civil
society, mobilized around a common goal, was taking the necessary steps to overturn the
mayor. This implies that the local governance system, if temporarily diverted by the
strategies of its officials, was in the longer term responsive to the demands of the people.
Hence Sipe Sipe’s low rank must be judged a transitory phenomenon – the district was
likely to perform closer to the model’s prediction soon.

Testing the Theory in Seven Municipalities
281
A less obvious exception is Porongo, ranked by its respondents in the second tier
of districts but with economic, social and political scores that are significantly worse. Its
combination of economic dominance by a small group of friends, a fractured civil
society lacking trust, and an almost comically uncompetitive political regime should
have secured it a place at the bottom of the table. That it did not is largely attributable to
the populist instincts of its mayor. This illustrates the difference leadership can make,
and the power of personality in a municipal system as systematically undermined as
Porongo’s. But it is instructive to remember the lesson of Chapter 7: leadership is not
entirely exogenous. The comparison with Sipe Sipe permits further refinement –
leadership is likely to be exogenous only in the short term, but determined endogenously
by municipal characteristics in the longer term. Unscrupulous political agents will tend
to operate in municipalities where government oversight and accountability are crippled
by economic monopoly, distorted political competition or deep-set social antagonisms.
Whereas in Sipe Sipe a responsive political system prepared to eject bad politicians who
sought to pervert it, Porongo’s dormant civil society if anything attracted them. Over
time the quality of government in Porongo was likely to fall more easily than rise,
dependent as it was on the quality of its leadership. Hence both cases comprise
exceptions that prove the rule, confirming the value of the model.
Another telling comparison is between the Atochan communities of Chorolque
and Villa Solano, or for that matter any of a number of unformed communities in
Porongo and elsewhere. In the former, a pre-existing social unit organized around a very
strong economic incentive – the miners’ cooperative – took on GRO responsibilities
quickly and effectively, and was highly involved in project selection, supervision and
execution. Civil society in Villa Solano, meanwhile, was still asleep, relatively
unorganized and uninvolved in its own governance. This highlights the role of social
organization per se, as distinct from demographic characteristics. It implies that a
community can take advantage of existing social organizations established for different
purposes to mobilize collective efforts in the interests of local government. The fact that
the people of Chorolque were migrants from across the altiplano and no community had
operated there a only few years earlier, whereas Villa Solano was stable and
homogeneous, underscores the point. But Chorolque also illustrates how the operational
characteristics of the underlying organization can spill over into local governance, not
always with salutary effects. In this case, the miners’ strong tradition of political

Testing the Theory in Seven Municipalities
282
activism led them to take FIS officials hostage in order to demand further investments.
The long-term effects of this action on local investment were unlikely to be positive.
Guayaramerín is notable as the only case where political competition preceded
the organization of civil society. Politicians’ success in colonizing community
organizations there suggests that civic institutions must precede political parties if they
are to act as checks and balances on their exercise of power. The logic of social
organization must be different from the narrow logic of factionalism, patronage and
electioneering. Where parties literally precede civil society, they place themselves in a
prime position to capture social groups as they are formed, and manipulate them for
partisan – and not civic – ends. The comparison of Guayaramerín, where citizens made
no attempt to change municipal policy, with Sipe Sipe, where they organized to
overthrow the mayor, makes this clear.
With respect to the oversight committee, the comparison between Baures and
Sipe Sipe is similar to that between Charagua and Viacha, and hence supports the
interpretation in Chapter 7: where the mayor and municipal council represent their voters
and respond effectively to popular demand, the function of the oversight committee is
greatly diminished. It only becomes a binding constraint when one or both institutions
malfunction. And if the OC itself is neutralized as a decision-making body, civil society
must rely on its own devices. But as the experiences of both Viacha and Sipe Sipe
vividly demonstrate, when society is coherent and well-organized it is more than capable
of defending its interests.
The final, small but compelling, observation concerns Baures and its separation
from the municipality of Magdalena two years into the decentralization process. While
it was subordinate to Magdalena, Baures was comprehensively ignored by town hall.
There was no local governance system in operation, as the sub-district received few
resources, and few GROs were organized. But after separation, local government
flourished in Baures. Neighborhood and community groups sprang up to participate in
policy decisions, and public resources were invested equitably according to
communities’ greatest needs. Public services improved considerably, and the people
applauded their local government. This transition from stasis to governance is an
illustration of the potential of decentralization. The exemplary experience of such a tiny
population suggests that decentralization in Bolivia can be taken further, driving
democracy even deeper into the roots of society.
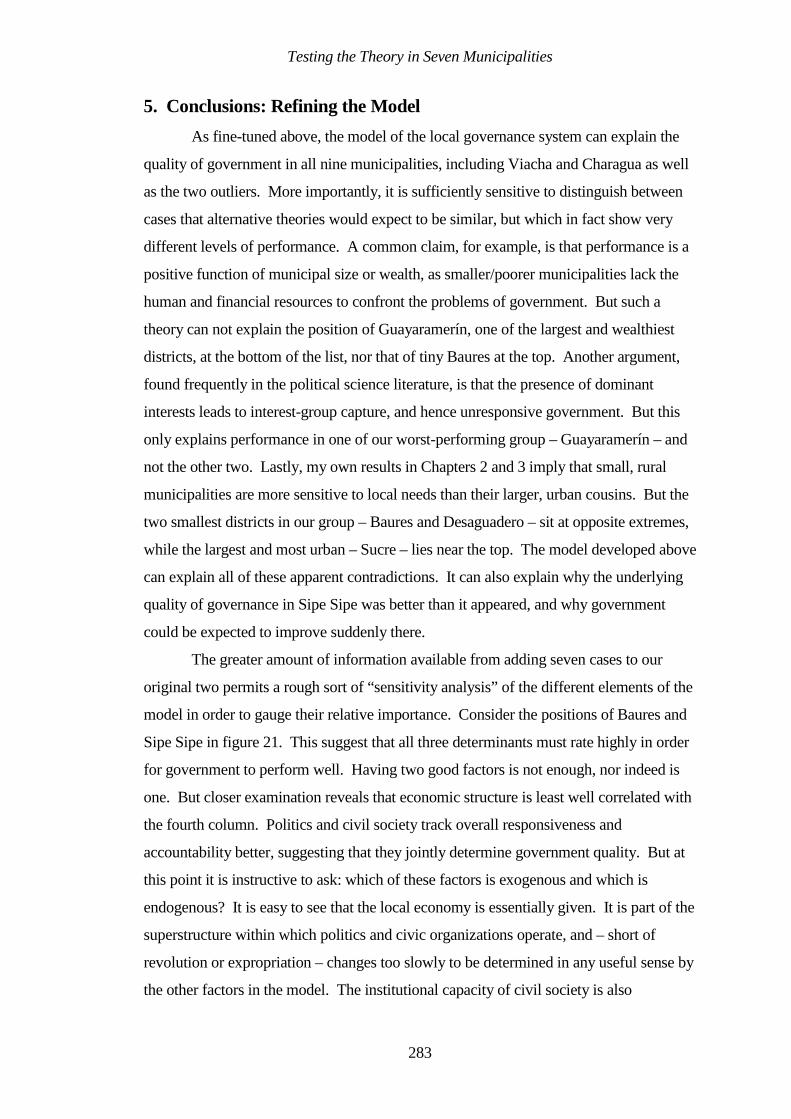
Testing the Theory in Seven Municipalities
283
5. Conclusions: Refining the Model
As fine-tuned above, the model of the local governance system can explain the
quality of government in all nine municipalities, including Viacha and Charagua as well
as the two outliers. More importantly, it is sufficiently sensitive to distinguish between
cases that alternative theories would expect to be similar, but which in fact show very
different levels of performance. A common claim, for example, is that performance is a
positive function of municipal size or wealth, as smaller/poorer municipalities lack the
human and financial resources to confront the problems of government. But such a
theory can not explain the position of Guayaramerín, one of the largest and wealthiest
districts, at the bottom of the list, nor that of tiny Baures at the top. Another argument,
found frequently in the political science literature, is that the presence of dominant
interests leads to interest-group capture, and hence unresponsive government. But this
only explains performance in one of our worst-performing group – Guayaramerín – and
not the other two. Lastly, my own results in Chapters 2 and 3 imply that small, rural
municipalities are more sensitive to local needs than their larger, urban cousins. But the
two smallest districts in our group – Baures and Desaguadero – sit at opposite extremes,
while the largest and most urban – Sucre – lies near the top. The model developed above
can explain all of these apparent contradictions. It can also explain why the underlying
quality of governance in Sipe Sipe was better than it appeared, and why government
could be expected to improve suddenly there.
The greater amount of information available from adding seven cases to our
original two permits a rough sort of “sensitivity analysis” of the different elements of the
model in order to gauge their relative importance. Consider the positions of Baures and
Sipe Sipe in figure 21. This suggest that all three determinants must rate highly in order
for government to perform well. Having two good factors is not enough, nor indeed is
one. But closer examination reveals that economic structure is least well correlated with
the fourth column. Politics and civil society track overall responsiveness and
accountability better, suggesting that they jointly determine government quality. But at
this point it is instructive to ask: which of these factors is exogenous and which is
endogenous? It is easy to see that the local economy is essentially given. It is part of the
superstructure within which politics and civic organizations operate, and – short of
revolution or expropriation – changes too slowly to be determined in any useful sense by
the other factors in the model. The institutional capacity of civil society is also

Testing the Theory in Seven Municipalities
284
exogenous. Although it will develop and change over time, internalizing the incentives
generated by its environment more rapidly than economic structure can, it is ultimately
dependent on characteristics such as culture, language, encompassing interest and trust –
characteristics which should remain exogenous in a political economy model of
government.
A competitive political system, on the other hand, is different – dependent as it is
upon the constellation of economic and other interests at the local level, as well as on
political participation by citizens and turnout at elections. According to their strength
and their behavior, a district’s private interests can monopolize its politics or contribute
to openness and competition; and voters can make their demands known and hold
politicians to account, or not, by the extent to which they vote and participate in policy
discussions. Thus assuming a legal and institutional framework that guarantees a secret
ballot, fair vote count, and free entry of political agents – essential assumptions for any
democratic system – competitive politics is determined endogenously. Poor or corrupt
leaders can emerge spontaneously, of course, but over time the character not only of
political leadership, but of the entire political system, will be given by the interactions of
civil society and economic structure. This is borne out by the preceding analysis, which
shows this process in action in our seven municipalities. Figure 22 presents these
relationships graphically, and shows how they relate to the previous model of local
governance. In essence this model is a restatement of the previous one. But whereas the
first model is structural, representing the main actors involved in the local government
process, this one is dynamic, focusing on the interactions between these actors, and the
chain of causality that leads to government responsiveness and accountability.
Lastly a question: what sorts of interventions can improve the quality of local
government? Very generally, and assuming that legal guarantees of free and fair voting
are in place, figure 22 suggests that civil society should be the key object of such
policies. If economic structure is exogenous and changes slowly, then efforts to increase
the responsiveness and accountability of government institutions can usefully focus on
strengthening civic organizations, increasing their participation in the policy debate and
their influence on the local political system. Such efforts should take account of how
civic groups enter the local governing process and which are the key inputs they provide,
as discussed above. Principal amongst these is continuous feedback on grass-roots needs
and the effectiveness of government action. This can serve to complement a voting
mechanism which is intermittent and un-graduated, and thus unsuited for prompting

Testing the Theory in Seven Municipalities
285
incremental policy changes. In so doing, it can help to counterbalance the influence of
private interests on politicians, which tends to be both continuous and compelling, and to
lead in the long term to patronage and insularity in the local political system. But
national authorities and development practitioners alike should be very wary when
planning such strengthening activities. The fundamental point of decentralization is that
decisions are made locally, according to local priorities. Outsiders must take care not to
disrupt this process. Hence their policy interventions must be discrete and highly
targeted, and focused above all on enhancing the insertion of civil society into the local
governance system.

Testing the Theory in Seven Municipalities
286
Figure 22: Two Models of Local Government
(i) Structural Model
(ii) Dynamic Model
Civil Society's Institutional
Coherence and Ability
Local Governance Responsiveness and
Accountability
Local Government Institutions
Civil Society
Economic Structure
Competitive Politics
Firms and Economic Interests
Influence
Votes Money
Local Constituency
Policies
Political Parties
Policies &

Conclusion
287
9
Conclusion
After long and detailed analysis of decentralization and the quality of local
government in Bolivia, it is time to weave together the strands of our various conclusions
and consider what we have learned.
Bolivia’s 1994 decentralization reform changed not only the allocation of public
monies amongst the country’s 311 municipalities, but more importantly national patterns
of investment. Chapter 2 demonstrated that investment changed significantly in the
social sectors (education, water & sanitation, water management, and possibly health),
agriculture and urban development. Econometric results further showed that changes in
the social sectors and agriculture are positively related to objective indicators of local
need – for example, investment in education and water & sanitation rose after 1994
where illiteracy rates were higher and water and sewerage connection rates lower,
respectively. Decentralization thus made government more responsive in Bolivia by re-
directing investment in public services to areas of greatest need. It is an impressive fact
that large shifts in national investment aggregates were driven by Bolivia’s smallest,
poorest municipalities investing newly-devolved resources in their highest-priority
projects. But how precisely did decentralization achieve such effects? What social or
political mechanisms link needs to policy? As discussed in Chapter 1, many
contributions to the literature invoke the idea that local government is “closer” to
demand, and responsiveness follows in some unspecified way. This account, though not
unattractive, is insufficient as an explanation of broad behavioral change as it simply re-
locates the question: Why does closeness matter? How does it operate? Why does local
government behave so differently?
Chapter 3 explored these questions, examining how central and local government
decisions are made by modeling the policy decisions of each econometrically. Local
government invested progressively in terms of need in agriculture and the social sectors
– five of the six sectors studied; central government invested progressively nowhere, and
regressively in terms of need in health, agriculture, and water & sanitation. So far this

Conclusion
288
confirms the pattern of Chapter 2. More interestingly, under both regimes private sector
lobbies were associated with investment reductions in some sectors, notably health,
while the presence of civic organizations led to investment increases in others, notably
education and water. At the simplest level this points to the existence of political
economy mechanisms under both central and local government through which private
sector and civic groups influenced policy outcomes. But the stark differences between
the two regimes noted above imply that such mechanisms function in quite different
ways.
Most importantly, civic lobbies and private interest groups have a much greater
effect on policy-making under local government than central government. While the
data do show that the center “listened” to local demands, it did so in only the 50% of
municipalities in which it chose to invest before decentralization. These were Bolivia’s
bigger, wealthier municipalities where service provision and the existing stock of
infrastructure were greater. Local governments, by contrast, listened essentially
everywhere. The resulting investment patterns reflect this. Whereas local investment
was economically progressive and responsive to local needs, the center invested where
need was lower, wealth higher, and ignored scores of small districts entirely. Taken
together, the results suggest a nuanced explanation of this behavior. The competitive
interplay of local political forces combines with the discipline of local elections under
decentralization to ensure that public officials are well-informed about voters’
preferences, and held accountable for the policies they pursue. Decision-makers’
incentives are more closely aligned to citizens’, and the effect is strong enough to appear
in national trends. In such a system of governance even poor citizens have voice and
may participate in the policy debate. By contrast, central government’s response to local
priorities is muted by distance, incentives and extraneous (e.g. political) considerations.
In terms of processing local signals the center is simply less efficient than the periphery,
and the resulting policies reflect this.
This explanation is consistent with a simple model of public investment in which
local government is more sensitive to local preferences, but central government has a
technical or organizational advantage in the provision of public goods. Thus the
periphery knows better what local citizens want, but the center can produce services of a
given quality more cheaply. By varying the parameters of this tradeoff I can show that
decentralization will lead to increased investment and better targeting in some sectors,
and decreased investment in others. A simple extension of this model that embeds the

Conclusion
289
objective functions of both regimes in a negotiations framework goes further. By
locating central government in a “national capital”, with its own particular interests and
policy goals, and making policy outcomes the result of bargains between center and
periphery, such a model can explain the two central facts of decentralization in Bolivia:
(1) the sharp fall in the geographic concentration of investment, and (2) the sea-change
in the uses of investment away from infrastructure towards the social sectors.
Provocative as they are, these approaches raise a number of deeper questions
about local government which must be answered if we are to fully understand
decentralization and the effects it brings about. Why should local government be more
sensitive to local information? Why is it more accessible to different social groups?
Amongst decentralized municipalities, why are some more responsive or effective than
others? The quantitative approach of the first part of this dissertation has several
strengths, not least the generality of the insights it provides: the trends I identify in the
data hold across all of Bolivia’s 310 municipalities, and my conclusions are thus national
in scope. But both its data and its estimation techniques are too blunt to allow us to push
our conclusions further. Contrast, for example, the insignificance of indicators of civic
and private lobbies in Chapter 2 with their overriding importance in Chapters 5 to 8.
Raw qualitative evidence establishes clearly that these actors mattered to the quality of
decentralized government, yet numerous econometric estimations failed to detect this.
Answering the questions above requires us to understand the tangle of social and
economic forces which underlie the institutions of local government. We must
characterize in qualitative terms the actors that compete for power in a political
environment, and understand the complex relationships between them.
Hence part two, where extensive qualitative analysis based on hundreds of hours
of interviews and observation built up detailed case studies of nine municipalities after
decentralization. Chapters 5 and 6 tackled these questions by examining local
government very closely in the best and worst of these in order to determine how
government works in each, and which factors explain their differences. In Viacha
government was unresponsive, violent and corrupt. This was largely due to the mayor’s
successful efforts to short-circuit public accountability by sabotaging the institutions of
government, leaving them unable to carry out their role in the governance system, and
him free to deform local policy in his own and his party’s interests. In Charagua, by
contrast, governance was participative and responsive, led by strong institutions of
government which produced high-quality policy outputs. Careful consideration of how
Conclusion
290
policy is made, from the perspectives of all the major and intermediate players in each
district, showed that the performance of public institutions was firmly grounded in the
local economy, political system, civil society, and the interactions amongst them.
Chapter 7 pushed the analysis further, showing that a vigorous local politics marked by
competition is conducive to effective government; the policy innovation and political
entrepreneurship thus enabled tend to arbitrage away distortions in political
representation and voice. And an open, competitive local economy is in turn conducive
to competitive politics, to the extent that it increases the diversity of ideas and policy
proposals that compete for public favor, as well as intensifying the enforcement of
accountability over local officials. Lastly, where civic organizations are resilient they
can aggregate preferences, represent community needs, enforce political accountability,
and otherwise facilitate the participation of civic groups – including the poor – in a
governance process which might otherwise be easily dominated by firms and business
interests.
Although compelling in light of the facts, this explanation of government in
Viacha and Charagua is still too loose to be fully satisfying. Chapter 7 accordingly
moved towards a more explicit model by identifying information and accountability as
the key conditions necessary for high-quality, responsive government. Where
economics, politics and society interact favorably as described above, information and
accountability will obtain in the local government process; where they do not, one or
both will be absent. I then derived a simple, two-stage model of local government
inductively from the experiences of the two districts. In the first stage, control rights
over public institutions and resources are allocated to particular politicians via elections.
The second stage consists of a number of single issue sub-games in which civic and
private actors lobby elected officials to implement the policies they prefer. Through this
two-stage structure, the model provides an elementary solution to the problem of
preference revelation in multi-dimensional policy space that has bedeviled public choice
theory for decades. More prosaically, it also explains the policy outputs described in
Chapters 5 and 6.
But in this form the model is not empirically tractable given the type of
qualitative data available. Hence I operationalized it by collapsing the structure into an
atemporal, single-stage framework focused on the real institutions of government: the
mayor, local council and oversight committee, and their interactions with the major
economic, political and social actors in a given district. This approach construes local

Conclusion
291
government as a nexus of two political markets and one organizational dynamic. In the
primary (retail) market, political parties offer policy-related ideas and values in exchange
for votes. This corresponds to stage one above. In the secondary (wholesale) market,
policy bundles and influence over the policy-making process are sold to interest groups
in exchange for money, corresponding to stage two. Meanwhile, civil society inserts
itself into the local government process through its own organizational dynamic,
transmitting local preferences and political opinions/complaints upwards to elected
authorities, and information on government proposals and policy conditions downwards
to the grass roots. This element is essential, as local government depends on the
relationships that collectively comprise civil society to elicit detailed information for use
in policy-making, judge the efficacy of past interventions, and plan for the future.
In order for local government to be effective, these three relationships must
counterbalance each other and none dominate the other. Such a stable tension leads to a
self-limiting dynamic where pressures from various interest groups are contained within
the bounds of political competition. Breaking this tension can hobble government,
leaving it undemocratic when the primary political market is impaired, insensitive to
economic conditions when the secondary political market is distorted, and unaccountable
and uninformed when the insertion of civil society is blocked. Because of the
organizational heterogeneity of civic groups, and because the currency of their influence
is often hard to measure – unlike the votes or money of other actors – this last element is
the most complex and difficult to observe of the three. But it lies at the heart of the
stage-two process described above, playing an important role in the transmission of
information and enforcement of accountability.
Chapter 8 refined the conceptual framework further by using it to analyze
evidence from seven additional municipalities, testing its generality and resilience
against new data. The model explained the quality of government in this diverse group
of districts well, and was sufficiently sensitive to distinguish between cases that
alternative theories would expect to be similar, but which in fact performed quite
differently. Specifically, its combination of economic, political and social arguments
permits greater analytical precision than any one independently could achieve. This was
illustrated pointedly in the case of the outlying municipality, Sipe Sipe, which according
to the analysis should have enjoyed moderately good government, but instead languished
at the bottom of the scale. After my research was complete, Sipe Sipe’s citizens –
supported by strong civic organizations and an open, competitive economy – challenged

Conclusion
292
their wayward authorities and were able to secure a change in local leadership. The
improvement in the quality of government they ultimately achieved returned the district
to a level of performance more in line with the model’s prediction.
Chapter 8 further confirmed that information and accountability are at the core of
a good policy-making process, and by extension that the insertion of civil society into the
local governance system is an important component of responsive government. This is
not to say that economic structure and the political system are not important – they are.
But these fields have been plowed extensively in the past, and their effects are well
understood. The role of civic organizations in the governing process, by contrast, is less
well understood. How is successful insertion achieved? In a competitive political
dynamic, private interests offering cash – and thereby immediate and even continuous
gratification – to elected officials enjoy an advantage over civic groups. The latter’s
comparative advantage lies in potential votes, a more distant, less constant enticement.
Facing such a challenge, the organizational cohesion, norms of behavior, and stores of
trust and credibility that civic groups develop can crucially level the field of political
competition. And a level playing field essentially defines the conditions for successful
insertion of civil society into a governing regime. Where such conditions obtain,
evidence from Bolivia shows that accountability is likely to become an explicit and
continuous element of local government. The grass roots gain a permanent voice, and
substantive participation in how they are governed. And the quality of government
improves.
As this synopsis demonstrates, the addition of a detailed qualitative approach to
an econometric methodology allowed me to combine generality and consistency with
empirical depth and richness. Useful on its own, this also facilitated the identification of
social mechanisms amongst the many actors and variables in question. By interpreting
quantitative results in light of qualitative findings I was able to engage in theory
selection, using case studies to rule out alternatives that correlations permitted but direct
observation did not. The ultimate goal of my mixed methodology was to establish
patterns of causality that explained the broad results of part one, and answered the deeper
questions posed in part two. This was largely achieved.
Finally, put method aside and consider in a nutshell what decentralization did to
Bolivia. Decentralization led to major changes in national policy by making government
more responsive to real local needs. It did so via the creation of hundreds of local
governments throughout the country. These proved more sensitive to local conditions,

Conclusion
293
and more accessible to lobbying and grass-roots pressure, than a central administration
that simply abandoned large expanses of territory as convenience dictated. The superior
responsiveness of local government is a product of the structure of local governance,
which I model as a two-stage game. Indeed, the effectiveness of decentralization as
policy reform is largely the result of enabling second-stage sub-game dynamics
throughout the country, where previously no policy-making took place. In so doing,
decentralization engaged thousands of neighborhood councils, peasant communities,
ayllus and mallkus that pre-date the Spanish conquest, as well as interest groups and
business associations which previously had no voice in how their communities were run.
By locating real resources and political power in municipal institutions it reached out to
rich and poor strata alike offering them the means to improve their lives, and thus a
concrete incentive to participate.
This changed not only the form of government in Bolivia, but also its substance.
The relatively few central officials stationed beyond national and regional capitals before
1994 had almost no incentive to concern themselves with local demands. Career success
was determined by ministerial fiat unrelated to local outcomes in distant districts.
Second-stage games did not exist in the provinces, and officials – who could afford to
ignore local interest groups – fixed their gaze firmly on La Paz. In a sparsely populated
country twice the size of France with a per-capita income of $2/day, poor groups beyond
the main few cities could realistically expect to wield no influence on central
government policy, especially on such issues as schools, and street lighting. Business
interests and the rich might eventually hope to gain some favors from the center, but
throughout most of the country ordinary citizens’ ordinary concerns were effectively
shut out. Decentralization changed this by creating local authorities beholden to local
voters. Throughout the national territory it put real power over public resources in the
hands of ordinary citizens. And it changed the way the country is run.
This dissertation has ultimately been about the possibility of change, and its
message is hopeful. The reform of institutions and their associated incentives can bring
about significant, nationwide changes in social and political behavior in the space of a
few years. The Bolivian experiment argues against Putnam’s assertion that policy
performance is determined by thousand-year historical conditioning. When reform
creates the opportunity to establish social organizations that improve group welfare,
people can rise to the challenge and succeed. This includes the very poor and oppressed.
The conditions necessary for reform to prosper are a complex of economic, political and

Conclusion
294
social characteristics, and may well be lacking as often as they are present. But under
the right circumstances, decentralizing resources and political authority can generate real
accountability where none existed before and improve the quality of government a
society achieves.
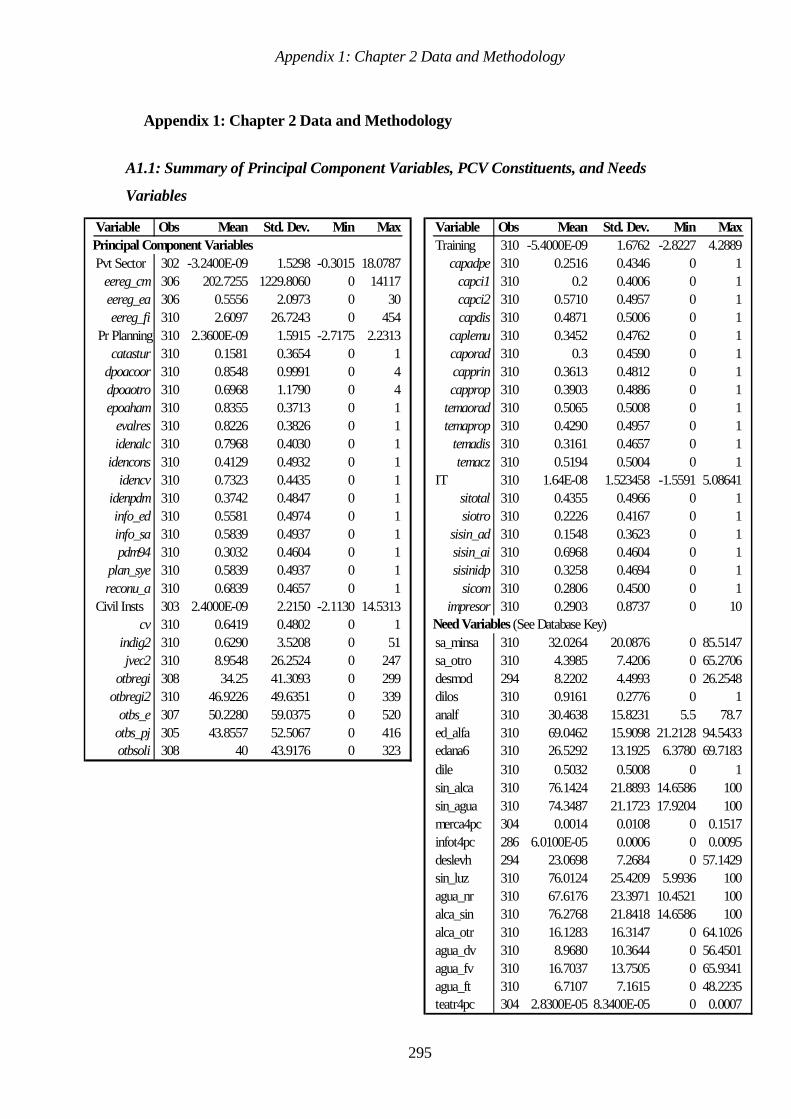
Appendix 1: Chapter 2 Data and Methodology
295
Appendix 1: Chapter 2 Data and Methodology
A1.1: Summary of Principal Component Variables, PCV Constituents, and Needs
Variables
Variable Obs Mean Std. Dev. Min Max Variable Obs Mean Std. Dev. Min Max Principal Component Variables Training 310 -5.4000E-09 1.6762 -2.8227 4.2889
Pvt Sector 302 -3.2400E-09 1.5298 -0.3015 18.0787 capadpe 310 0.2516 0.4346 0 1eereg_cm306 202.7255 1229.8060 0 14117 capci1 310 0.2 0.4006 0 1eereg_ea306 0.5556 2.0973 0 30 capci2 310 0.5710 0.4957 0 1eereg_fi 310 2.6097 26.7243 0 454 capdis 310 0.4871 0.5006 0 1
Pr Planning 310 2.3600E-09 1.5915 -2.7175 2.2313 caplemu 310 0.3452 0.4762 0 1catastur 310 0.1581 0.3654 0 1 caporad 310 0.3 0.4590 0 1
dpoacoor 310 0.8548 0.9991 0 4 capprin 310 0.3613 0.4812 0 1dpoaotro 310 0.6968 1.1790 0 4 capprop 310 0.3903 0.4886 0 1epoaham 310 0.8355 0.3713 0 1 temaorad 310 0.5065 0.5008 0 1
evalres 310 0.8226 0.3826 0 1 temaprop 310 0.4290 0.4957 0 1idenalc 310 0.7968 0.4030 0 1 temadis 310 0.3161 0.4657 0 1
idencons 310 0.4129 0.4932 0 1 temacz 310 0.5194 0.5004 0 1idencv 310 0.7323 0.4435 0 1 IT 310 1.64E-08 1.523458 -1.5591 5.08641
idenpdm 310 0.3742 0.4847 0 1 sitotal 310 0.4355 0.4966 0 1info_ed 310 0.5581 0.4974 0 1 siotro 310 0.2226 0.4167 0 1info_sa 310 0.5839 0.4937 0 1 sisin_ad 310 0.1548 0.3623 0 1pdm94 310 0.3032 0.4604 0 1 sisin_ai 310 0.6968 0.4604 0 1
plan_sye 310 0.5839 0.4937 0 1 sisinidp 310 0.3258 0.4694 0 1reconu_a 310 0.6839 0.4657 0 1 sicom 310 0.2806 0.4500 0 1
Civil Insts 303 2.4000E-09 2.2150 -2.1130 14.5313 impresor 310 0.2903 0.8737 0 10cv 310 0.6419 0.4802 0 1 Need Variables (See Database Key)
indig2 310 0.6290 3.5208 0 51 sa_minsa 310 32.0264 20.0876 0 85.5147jvec2 310 8.9548 26.2524 0 247 sa_otro 310 4.3985 7.4206 0 65.2706
otbregi 308 34.25 41.3093 0 299 desmod 294 8.2202 4.4993 0 26.2548otbregi2 310 46.9226 49.6351 0 339 dilos 310 0.9161 0.2776 0 1
otbs_e 307 50.2280 59.0375 0 520 analf 310 30.4638 15.8231 5.5 78.7otbs_pj 305 43.8557 52.5067 0 416 ed_alfa 310 69.0462 15.9098 21.2128 94.5433otbsoli 308 40 43.9176 0 323 edana6 310 26.5292 13.1925 6.3780 69.7183
dile 310 0.5032 0.5008 0 1sin_alca 310 76.1424 21.8893 14.6586 100sin_agua 310 74.3487 21.1723 17.9204 100merca4pc 304 0.0014 0.0108 0 0.1517infot4pc 286 6.0100E-05 0.0006 0 0.0095deslevh 294 23.0698 7.2684 0 57.1429sin_luz 310 76.0124 25.4209 5.9936 100agua_nr 310 67.6176 23.3971 10.4521 100alca_sin 310 76.2768 21.8418 14.6586 100alca_otr 310 16.1283 16.3147 0 64.1026agua_dv 310 8.9680 10.3644 0 56.4501agua_fv 310 16.7037 13.7505 0 65.9341agua_ft 310 6.7107 7.1615 0 48.2235teatr4pc 304 2.8300E-05 8.3400E-05 0 0.0007

Appendix 1: Chapter 2 Data and Methodology
296
Principal Component Variables
Interpretation
Civil Institutions: This is an indicator of the number organizations and institutions of
local civil society. It rises in all the variables, especially in the more general measures.
We interpret it as a proxy for the strength of local civil institutions.
Private Sector: This PCV rises in the number of private businesses registered locally.
We construe it as an indicator of the dynamism of the local private sector.
Training: This variable rises in categories of training (i.e. institutional strengthening)
received by the municipality and falls in those requested but not yet received. Hence we
interpret it as a measure of the intensity of capacity-building efforts undertaken by/for
local government.
Information Technology: This PCV rises in the IT systems - hardware and software
(especially software) - at the disposal of each municipality.
Project Planning: This PCV loads positively where municipalities use information on
education and health when planning projects, where sectoral regulations are followed in
water & sanitation, where a Municipal Development Plan exists, and where councilmen
and oversight committees identify investment projects using the MDP and urban
cadaster. It loads negatively where the mayor is the one who identifies investment
projects, and where problems arise with the Annual Operating Plan. This is thus a
straightforward indicator of informed project planning which follows consensual and
open procedures.
Eigenvectors
For the eigenvectors that follow, factor loadings on the raw variables can be read
vertically down each column.

Appendix 1: Chapter 2 Data and Methodology
297
CIVIL INSTITUTIONS TRAININGEigenvectors EigenvectorsVariable 1 Variable 1cv 0.09745 capadpe 0.28556indig2 0.01988 capci1 0.30671jvec2 0.29229 capci2 0.2612otbregi 0.4194 capdis 0.2793otbregi2 0.43286 caplemu 0.34451otbs_e 0.42137 caporad 0.38803otbs_pj 0.42934 capprin 0.37869otbsoli 0.42372 capprop 0.34559
temacz -0.14204temadis -0.20036
PROJECT PLANNING temaorad -0.22559Eigenvectors temaprop -0.18667Variable 1catastur 0.04701
dpoacoor -0.00839 INFORMATION TECH.dpoaotro -0.07581 Eigenvectorsepoaham 0.00306 Variable 1evalres 0.07426 sitotal 0.51744idenalc -0.00973 siotro 0.36119idencons 0.0145 sisin_ad 0.42748idencv 0.09214 sisin_ai -0.27289idenpdm 0.14818 sisinidp 0.28173info_ed 0.53349 sicom 0.38812info_sa 0.51649 impresor 0.3385pdm94 0.14019plan_sye 0.56911
reconu_a 0.24654 PRIVATE SECTOREigenvectorsVariable 1eereg_cm 0.61675eereg_ea 0.56212eereg_fi 0.55103
A1.2

Appendix 2: Chapter 3 Data and Methodology
298
Appendix 2: Chapter 3 Data and Methodology
A1.1: Summary of Principal Component Variables, PCV Constituents, and Needs Variables
Variable Obs Mean Std. Dev. Min Max Variable Obs Mean Std. Dev. Min Max Principal Component Variables CG Auditing 308 -4.60E-10 1.504751 -1.341 5.6282
Economic 1 309 -7.58E-09 3.379288 -5.5154 10.761 fis 308 0.4448052 0.4977529 0 1Economic 3 309 6.60E-10 1.950959 -6.8422 4.3846 inejpr_a 310 0.5774194 0.4947685 0 1
catvi_10 310 12.98603 22.74078 0 91.93 inejpr_m 310 0.1483871 0.356058 0 1catvi_11 310 9.743513 11.40623 0 76.923 inejpr_s 310 0.4548387 0.4987614 0 1catvi_hi 310 21.45342 20.4527 0 85.893 sisin_ad 310 0.1548387 0.3623357 0 1catvi_lo 310 53.01626 28.3189 0.1603 98.041 sayco 310 0.3516129 0.4782458 0 1
catvi_me 310 2.800774 6.003828 0 58.654 sayco_a 310 0.2967742 0.4575748 0 1cocina 310 63.18565 14.03657 15.138 90.726 sayco_o 310 0.2483871 0.88839 0 8
comb_hi 309 18.05282 21.35939 0 89.7 Mun Adm 1 303 -2.58E-09 2.089446 -5.5917 6.6973comb_lo 309 80.73161 21.95467 2.4997 100 Mun Adm 2 303 3.49E-09 1.758446 -4.2158 2.7704
comb_me 309 1.044559 1.860857 0 14.339 alc_co 310 0.8548387 0.3528329 0 1comb_otr 309 0.1710101 0.3831445 0 4.1667 alc_de 310 0.8096774 0.3931903 0 1
cuarto1 310 33.29116 11.54638 10.569 76.514 con_co 310 0.4064516 0.4919649 0 1cuarto2 310 34.75675 8.07081 16.239 76.613 con_de 310 0.3290323 0.4706214 0 1
cuarto2f 310 68.04791 11.18261 37.435 95.505 cuenpu_a 310 0.1032258 0.3047455 0 1cuarto3 310 17.61446 5.533153 2.7523 31.902 cuenpu_c 310 0.583871 0.4937124 0 1cuarto4 310 8.462401 3.735846 0.4032 18.883 cuenpu_o 310 0.4580645 0.4990439 0 1
cuarto4m 310 14.33763 6.984188 1.7431 34.756 evte_co 310 0.283871 0.451604 0 1cuarto5 310 5.875234 3.778269 0 18.358 evte_de 310 0.2258065 0.4187883 0 1dorms1 310 75.54401 11.86857 38.859 98.396 invdir 310 0.3064516 0.4617649 0 1dorms2 310 18.96714 7.565 1.6043 38.425 invpub 310 0.2129032 0.4100217 0 1
dorms2f 310 94.51115 5.055565 74.934 100 manpro_d 310 0.3483871 0.4772297 0 1dorms3 310 4.07507 3.498517 0 16.578 manpro_u 310 0.2741935 0.4468283 0 1dorms4 310 1.014941 1.16489 0 6.1956 otro_co 310 0.0483871 0.2149298 0 1
dorms4m 310 1.41378 1.66395 0 8.917 otro_de 310 0.0580645 0.2342435 0 1dorms5 310 0.3988394 0.5531117 0 4.3393 plieg_ad 310 0.8193548 0.3853459 0 1
ecact 310 55.97236 10.76106 15.233 80.622 plieg_ca 310 0.8451613 0.3623357 0 1ecactm 310 38.5921 10.1737 8.1356 60.096 plieg_pu 310 0.8483871 0.3592251 0 1ecdesm 310 18.08835 15.75617 0 100 pliego 310 0.7419355 0.4382771 0 1
ecina 310 43.51541 10.89542 19.257 84.767 progcont 310 0.5774194 0.4947685 0 1ecinam 310 62.55553 6.075064 40.87 84.848 regcon 310 0.4612903 0.4993053 0 1ecocum 310 38.8383 10.20898 7.8571 60.507 salar_pc 304 1082.977 1205.953 50 8300
hogar_ta 310 4.258899 0.7635836 2.04 6.32 salar_co 304 1042.796 1186.592 20 8300partbru 310 43.52524 8.523663 11.61 63.05 suped_a 310 0.3709677 0.4838449 0 1
ppdorm2 310 37.45356 10.59514 14.793 75.956 suped_c 310 0.5483871 0.4984578 0 1ppdorm4 310 33.72842 4.095746 16.279 43.478 supsa_a 310 0.3419355 0.4751251 0 1ppdorm5 310 28.81803 8.967728 5.3763 58.871 supsa_c 310 0.5451613 0.4987614 0 1
Demogr 1 308 1.22E-09 1.507338 -1.8943 7.413 supsa_o 310 0.5709677 0.4957382 0 1Demogr 2 308 -2.61E-09 1.260633 -2.7652 5.0168 usmanfun 310 0.3806452 0.4863305 0 1
pobpc.u 308 16.45709 27.28928 0 100 Pr Planning 310 2.36E-09 1.591479 -2.7175 2.2313pobpc.r 308 89.4978 110.0184 0 1947.4 catastur 310 0.1580645 0.3653913 0 1rel_cato 310 78.60554 11.02218 26.85 94.858 dpoacoor 310 0.8548387 0.9991384 0 4rel_evan 310 11.92324 8.643937 0.6503 62.183 dpoaotro 310 0.6967742 1.178964 0 4rel_ning 310 2.507558 1.987785 0 13.657 epoaham 310 0.8354839 0.3713427 0 1id_sine 310 0.4922058 0.8702676 0 7.69 evalres 310 0.8225806 0.3826409 0 1id_trad 310 23.18218 20.93228 0 81.408 idenalc 310 0.7967742 0.4030498 0 1inmasc 310 102.4356 15.32378 71.17 232.39 idencons 310 0.4129032 0.4931518 0 1
Altiplano 310 0.4741935 0.5001409 0 1 idencv 310 0.7322581 0.4434982 0 1Orient 310 0.2580645 0.4382771 0 1 idenpdm 310 0.3741935 0.4846964 0 1Politics 295 -2.42E-09 1.226105 -3.1397 4.4445 info_ed 310 0.5580645 0.49742 0 1
oficial 295 0.8440678 0.3634075 0 1 info_sa 310 0.583871 0.4937124 0 1margen93 306 15.45389 11.62267 0 60.714 pdm94 310 0.3032258 0.4603951 0 1
nulo93 306 4.20045 3.433944 0 35.949 plan_sye 310 0.583871 0.4937124 0 1ausent93 306 139.8737 83.67695 12.766 628.92 reconu_a 310 0.683871 0.4657157 0 1ausent95 310 67.93136 28.09571 0.3436 175.61

Appendix 2: Chapter 3 Data and Methodology
299
Variable Obs Mean Std. Dev. Min Max Variable Obs Mean Std. Dev. Min MaxCivil Insts 303 2.40E-09 2.214992 -2.113 14.531 Need Variables (See Database Key)
cv 310 0.6419355 0.4802064 0 1 sa_minsa 310 32.02643 20.08756 085.515indig2 310 0.6290323 3.520784 0 51 sa_caja 310 5.670032 6.809536 0 41.654jvec2 310 8.954839 26.25241 0 247 sa_noat 310 11.03071 9.780051 0 62.888
otbregi 308 34.25 41.30934 0 299 deslev 294 22.03739 6.866404 0 50otbregi2 310 46.92258 49.63505 0 339 dilos 310 0.916129 0.2776424 0 1
otbs_e 307 50.22801 59.03749 0 520 sandia2 310 -1.928033 24.44059 -143.9 106.09otbs_pj 305 43.85574 52.50669 0 416 sandia1 310 5.874423 66.25567 -161 228.34otbsoli 308 40 43.9176 0 323 sa_ong 310 3.192237 5.423862 0 33.078
Pvt Sector 302 -3.24E-09 1.529804 -0.3015 18.079 analf 31030.46375 15.82312 5.5 78.7eereg_cm 306 202.7255 1229.806 0 14117 dile 310 0.5032258 0.500798 0 1eereg_ea 306 0.5555556 2.09727 0 30 edndia1 310 -0.8299529 57.22902 -222.15 254.76eereg_fi 310 2.609677 26.72428 0 454 edana6 310 26.52921 13.1925 6.378 69.718
Training 310 -5.40E-09 1.676235 -2.8227 4.2889 ed_ana15 310 30.17335 15.69695 5.45 76.7capadpe 310 0.2516129 0.4346415 0 1 ni_low 309 60.43372 13.94498 24.507 88.391
capci1 310 0.2 0.4006467 0 1 ni_univ 309 1.210297 2.366874 0 18.984capci2 310 0.5709677 0.4957382 0 1 edndia2 309 -1.046648 46.17628 -173.02 202.3capdis 310 0.4870968 0.5006416 0 1 sin_alca 310 76.14236 21.88933 14.659 100
caplemu 310 0.3451613 0.4761895 0 1 sin_alc2 310 6275.256 2919.245 214.87 10000caporad 310 0.3 0.4589985 0 1 alca_pr 310 20.24793 20.40181 0 80.818capprin 310 0.3612903 0.4811511 0 1 alca_sin 310 76.27676 21.84184 14.659 100capprop 310 0.3903226 0.4886113 0 1 sbndia1 310 -4.155377 129.5403 -279.55 381.73
temaorad 310 0.5064516 0.5007667 0 1 mingi4pc 298 0.0001408 0.0006317 0 0.0069temaprop 310 0.4290323 0.4957382 0 1 infot4pc 286 0.0000601 0.0005954 0 0.0095
temadis 310 0.316129 0.4657157 0 1 desso4pc 306 5.05E-06 0.0000217 00.0002temacz 310 0.5193548 0.5004331 0 1 museo4pc 307 0.0000197 0.0000834 0 0.0007
IT 310 1.64E-08 1.523458 -1.5591 5.0864 merca4pc 304 0.0014271 0.0108282 0 0.1517sitotal 310 0.4354839 0.4966218 0 1 uvndia1 286 -0.0000284 0.0003887 -0.0058 0.0016siotro 310 0.2225806 0.4166515 0 1 infr24pc 276 0.0040978 0.0119325 0 0.1522
sisin_ad 310 0.1548387 0.3623357 0 1 deslevh 294 23.06979 7.268409 0 57.143sisin_ai 310 0.6967742 0.4603951 0 1 deslevm 294 21.10056 8.681828 0 92.308sisinidp 310 0.3258065 0.4694331 0 1 matad4pc 307 0.0002166 0.0008352 0 0.0072
sicom 310 0.2806452 0.4500409 0 1 agndia1 294 -0.2505279 39.43929-87.602 116.49impresor 310 0.2903226 0.8736913 0 10 viver4pc 307 0.0000261 0.0001473 0 0.0019
agua_nr 310 67.61759 23.39711 10.452 100rhndia1 310 -4.155377 129.5403 -279.55 381.73sin_agua 310 74.34871 21.17225 17.92 100sin_agu2 310 5974.549 2824.562 321.14 10000drena4pc 301 0.0000975 0.0010796 0 0.0176rhndia2 310 -3.57418 128.9131 -281.48 394.54agua_dv 310 8.967957 10.36443 0 56.45agua_fv 310 16.70372 13.75046 0 65.934agua_ft 310 6.710726 7.161523 0 48.224

Appendix 2: Chapter 3 Data and Methodology
300
Principal Component Variables
Interpretation
Economic: The first PCV loads positively on indicators associated with wealth (i.e.
stocks) and higher income (flows), and negatively on those that indicate poverty and
lower income. Notice especially the loadings on number of rooms per house, bedrooms
per house, and type of cooking fuel. It additionally loads negatively on economically
active population and positively on the economically inactive, but these values are much
lower than those for wealth. Thus PCV1 is an indicator of wealth and income, rising in
both. The third PCV, by contrast, loads negatively on high wealth and positively on low
wealth, and – interestingly – consistently negatively on economically active women. Its
most important characteristic, though, seems to be that it rises in family size (see
household size and people per bedroom), which is broadly consistent with loading
positively on measures of poverty. These two PCVs should thus be opposite in sign
where both are significant.
Demographic: The first PCV loads positively and strongly on Protestants and rural
dwellers, and negatively on Catholics and urban dwellers. Religion is by far its strongest
factor. It also decreases in Spanish-speakers and men. PCV2 loads similarly to PCV1,
but here the strongest factors surround the urban-rural divide, as well as native-language
speakers, in which it is positive.
Political Disaffection/Protest: This PCV increases strongly with absent and null votes
– a traditional sign of electoral protest in Bolivia – while loading negatively on oficialista
mayors (i.e. affiliated with the ruling (national) coalition) as well as the 1993 municipal
margin of victory. I interpret this as an indicator of political disaffection and protest.
Civil Institutions: This is an indicator of the number organizations and institutions of
local civil society. It rises in all the variables, especially in the more general measures. I
interpret it as a proxy for the strength of local civil institutions.
Private Sector: This PCV rises in the number of private businesses registered locally. I
construe it as an indicator of the dynamism of the local private sector.
Training and Capacity-Building: This variable rises in categories of training (i.e.
institutional strengthening) received by the municipality and falls in those requested but
not yet received. Hence I interpret it as a measure of the intensity of capacity-building
efforts undertaken by/for local government.
Appendix 2: Chapter 3 Data and Methodology
301
Information Technology: This PCV rises in the IT systems - hardware and software
(especially software) - at the disposal of each municipality.
Central Government Auditing: This variable is difficult to characterize succinctly,
though its interpretation is fairly clear. It loads positively on those administrative or
reporting processes which constitute some form of external lever of central on local
government. Thus, central government audits, municipal performance reports upwards,
and the involvement of the Social Investment Fund (a central executive agency) all
appear positively here, and signify direct and indirect ways in which the central state can
exert influence on local government activities.
Municipal Administration: While these variables include many raw indicators, the
strongest effects are as follows. The first PCV loads positively on variables related to
clear and transparent municipal procedures for purchases and contracting, on mayoral
discretion and on councilmen’s salaries, and negatively on councilmen’s discretion. I
interpret this variable as indicative of the character of local governance, rising where a
strong local executive administers under clear guidelines and regulations, and is
(actively) overseen by a strong (i.e. well-paid) council. The second PCV loads positively
on the municipal council’s discretion in contracting, and especially strongly on council
oversight of education and health services. Thus I interpret this PCV as indicative of an
activist council, whose power comes at the expense of the mayor. The second PCV is
thus not strictly opposed to PCV1, but rather different from it in thrust, representing an
alternative way of organizing municipal affairs.
Project Planning: This PCV loads positively where municipalities use information on
education and health when planning projects, where sectoral regulations are followed in
water & sanitation, where a Municipal Development Plan exists, and where councilmen
and oversight committees identify investment projects using the MDP and urban
cadaster. It loads negatively where the mayor is the one who identifies investment
projects, and where problems arise with the Annual Operating Plan. This is thus a
straightforward indicator of informed project planning which follows consensual and
open procedures.
Eigenvectors
For the eigenvectors that follow, factor loadings on the raw variables can be read
vertically down each column.

Appendix 2: Chapter 3 Data and Methodology
302
ECONOMIC TRAININGEigenvectors EigenvectorsVariable 1 3 Variable 1catvi_10 0.01611 0.10921 capadpe 0.28556catvi_11 -0.04421 0.05136 capci1 0.30671catvi_hi 0.2084 -0.22678 capci2 0.2612catvi_lo -0.15851 0.06463 capdis 0.2793catvi_me 0.06087 -0.04372 caplemu 0.34451cocina 0.06745 0.33713 caporad 0.38803comb_hi 0.21759 -0.24884 capprin 0.37869comb_lo -0.21306 0.26048 capprop 0.34559comb_me 0.00795 -0.19621 temacz -0.14204comb_otr 0.03941 -0.10044 temadis -0.20036cuarto1 -0.06973 -0.36405 temaorad -0.22559cuarto2 -0.11508 0.21652 temaprop -0.18667cuarto2f -0.15519 -0.22cuarto3 0.05774 0.30183
cuarto4 0.1403 0.16415 INFORMATION TECH.cuarto4m 0.20285 0.11295 Eigenvectorscuarto5 0.23616 0.04638 Variable 1dorms1 -0.26864 -0.1017 sitotal 0.51744dorms2 0.23697 0.16318 siotro 0.36119dorms2f -0.27588 0.00522 sisin_ad 0.42748dorms3 0.2747 0.01897 sisin_ai -0.27289dorms4 0.26493 -0.04564 sisinidp 0.28173dorms4m 0.26059 -0.05572 sicom 0.38812dorms5 0.22596 -0.07148 impresor 0.3385ecact -0.1933 0.10251ecactm -0.11158 -0.01077
ecdesm -0.0263 0.04999 CENTRAL GOVT. AUDITINGecina 0.19549 -0.09642 Eigenvectorsecinam 0.04078 0.0789 Variable 1ecocum -0.10776 -0.01538 fis 0.14973hogar_ta 0.15305 0.23915 inejpr_a -0.03459partbru -0.19109 0.06026 inejpr_m 0.22346ppdorm2 -0.03901 -0.25241 inejpr_s 0.04035ppdorm4 0.1756 0.13713 sisin_ad 0.29205ppdorm5 -0.0338 0.23506 sayco 0.59704
sayco_a 0.56841sayco_o 0.39998
A1.2

Appendix 2: Chapter 3 Data and Methodology
303
DEMOGRAPHIC MUNICIPAL ADMINISTRATIONEigenvectors EigenvectorsVariable 1 2 Variable 1 2pobpc.u -0.16648 -0.51111 alc_co 0.14604 0.05317pobpc.r 0.1533 0.30239 alc_de 0.11469 0.10791rel_cato -0.62433 0.17965 con_co -0.17274 0.12842rel_evan 0.58003 -0.13934 con_de -0.14717 0.14487rel_ning 0.41205 -0.04415 cuenpu_a -0.12553 -0.0198id_sine 0.21585 0.17824 cuenpu_c 0.11299 0.0764id_trad 0.0192 0.64723 cuenpu_o 0.05624 0.07114inmasc -0.07623 -0.37817 evte_co 0.18976 -0.04196
evte_de 0.18947 0.009invdir 0.09721 -0.02975
POLITICAL PROTEST invpub 0.15408 -0.06359Eigenvectors manpro_d 0.18016 0.02777Variable 1 manpro_u 0.16696 0.04719oficial -0.19005 otro_co 0.10092 -0.11738margen93 -0.21741 otro_de 0.08356 -0.11557nulo93 0.35565 plieg_ad 0.33515 -0.02376ausent93 0.60371 plieg_ca 0.3401 -0.00287ausent95 0.65243 plieg_pu 0.31971 0.00514
pliego 0.33117 0.01178progcont 0.15912 0.11538
PROJECT PLANNING regcon 0.19798 0.01987Eigenvectors salar_pc 0.27672 -0.08343Variable 1 salar_co 0.27409 -0.08945catastur 0.04701 suped_a -0.01201 -0.43222dpoacoor -0.00839 suped_c -0.03946 0.437dpoaotro -0.07581 supsa_a -0.07613 -0.42273epoaham 0.00306 supsa_c 0.0346 0.44233evalres 0.07426 supsa_o 0.05436 0.33874idenalc -0.00973 usmanfun 0.17885 0.05964idencons 0.0145idencv 0.09214
idenpdm 0.14818 CIVIL INSTITUTIONSinfo_ed 0.53349 Eigenvectorsinfo_sa 0.51649 Variable 1pdm94 0.14019 cv 0.09745plan_sye 0.56911 indig2 0.01988reconu_a 0.24654 jvec2 0.29229
otbregi 0.4194otbregi2 0.43286
PRIVATE SECTOR otbs_e 0.42137Eigenvectors otbs_pj 0.42934Variable 1 otbsoli 0.42372eereg_cm 0.61675eereg_ea 0.56212eereg_fi 0.55103

304
Appendix 3: Abbreviations*
ADN Acción Democrática Nacionalista
AGACOR Cattle Ranchers’ Association of the Cordillera
AOP Annual Operating Plan
APG Guaraní People’s Association
Cabi Capitanía del Alto y Bajo Izozo
CAO Eastern Agricultural Congress
CBN Cervecería Boliviana Nacional
CIPCA Center for the Investigation and Promotion
of the Peasantry
COB Bolivian Confederation of Labor
Comibol Bolivian (State) Mining Company
Condepa Conciencia de Patria
DDE District Director of Education
DDH District Director of Health
FIS Social Investment Fund
GRO Grass-Roots Organization
Incerpaz Industrias de Cerámica Paz (Viacha)
LPP Law of Popular Participation
MBL Movimiento Bolivia Libre
MNR Movimiento Nacionalista Revolucionario
NGO Non-Governmental Organization
OC Oversight Committee
OC1 Official OC (distinction valid
OC2 Opposition OC only for Viacha)
PASE Programa de Apoyo Solidario a las Escuelas
SOBOCE Sociedad Boliviana de Cementos
UCS Unión Cívica de Solidaridad
*Norms of abbreviation and capitalization adhere to most common usage in Bolivia.

Appendix 4: Data Key
Appendix 4: Data Key
EjecProgMunicipal spending by source, across sectors (in thousands of Bs.)VariableTotG General Total, All Sectors (1994-1996)TotI Total, Internal Resources (1994-5)TGN Treasury (1994-5)RRPP Own Resources (1994-5)PP Decentralized Funds (1994-5) _E ExpendituresACom Community Contribution (1994-5) _P Budgeted (1995 only)Otro Other (1994-5)Tran Transfers (Budgeted 1996 only)TotE Total, External Resources (1994-5)Cred External Credit (1994-5)Dona Donations (1994-5) [Tran = TGN + ACom]
Municipal spending, sectoral detailSectors Code Sources Code
1 Educacion y CulturaEd Total General TotG2 Urbanismo y ViviendaUV Total Interno TotI3 Energia En TGN TGN4 Saneamiento BasicoSB Recursos Propios RRPP5 Transportes Tr Participacion Popular PP _E Expenditures6 Agropecuario Ag Aporte Comunitario ACom _P Budgeted7 Salud y Seguridad SocialSa Otros Otro8 Multisectorial Mu Transferencias Tran9 Industria y Turismo IT Total Externo TotE# Comunicaciones Co Credito Cred# Hidrocarburos HC Donaciones Dona# Recursos Hidricos RH
* DMA No Municipality Number in Alphabetical Order by Department and then Municipality NameBase 95
Variable Definition (CNPV June 3, 1992)Dept DepartmentNo Municipality NumberName Municipality NameNo.Dept Department NumberPobl PopulationIndig Number of Indigenous CommunitiesCCamp Number of Peasant/Campesino CommunitiesJVec Number of (Urban) Neighborhood Councils [Juntas Vecinales]OTBSoli Number of GRO's [OTB's] that Applied to Register with the Central GovernmentOTBRegi Number of Grass-Roots Organizations [OTB's] RegisteredCV Vigilance Committee Operating [0,1]EdifEsc Number of School BuildingsTotAulas Number of ClassroomsEstEsc Number of SchoolsTotBanco Number of School DesksTotMatri Number of Students RegisteredTotDoc Number of Teachers
* Stprdoc Student/Teacher ratio [=totmatri/totdoc]FIS FIS Project Currently Being Implemented [0,1]Ed.Alfa Literacy Rate (%)Ed.Asis Attendance Rate
* Ed.Asis2 Square of Att RateNI.Nunca Never AttendedNI.Basic Basic [Grades 1-5]NI.Inter PrimaryNI.Medio SecondaryNI.Tecni Technical TrainingNI.Norma Teacher Training SchoolNI.Univ UniversityNI.Otro OtherNI.Igno Unknown
* NI.More Above Basic [=NI.Inter -- NI.Otro]* NI.IM NI.Inter + NI.Medio* NI.High NI.Tecni + Norma + Univ* NI.High2 Square of Ni.High
Educational Attainment Rates
Education
[Grades 6-8]
305

Appendix 4: Data Key
* NI.Low NI.Nunca + NI.Basic* NI.Low2 Square of NI.Low
Sa.Asis Attendance * Sa.Asis2 Square of Att Rate
Agua.DV Internal PlumbingAgua.FV External Plumbing
* Agua.Dom Plumbing [=Agua.DV+FV] WaterAgua.FT Public StandpipesAgua.NR NoneAlca.Pub Public Sewerage
* Alca.Pr Private SewerageAlca.CS Septic TankAlca.Otr OtherAlca.Sin NoneNBI Unsatisfied Basic Needs
JPFBasePob.Urb Urban PopulationPob.Rur Rural PopulationHom.Tot Male PopulationHom.Urb Urban Male PopulationHom.Rur Rural Male PopulationMuj.Tot Female PopulationMuj.Urb Urban Female PopulationMuj.Rur Rural Female Population
Pp'95Nuc.Esc Schooling Nucleus Present [0,1]Fort.Pao Received Institutional Strengthening in Budget Preparation [0,1]Fort.Ins Institution that Carried Out StrengtheningOficial Mayor's Party Belongs to National Governing Coalition [0,1]Marg93 Electoral Margin Between Winner and Runner-Up, Mayoral Race (%)NBI.U Unsatisfied Basic Needs, Urban AreasNBI.R Unsatisfied Basic Needs, Rural Areas
IDHIDH = Indice de Desarrollo Humano
SaldosVariable DefinitionSaldo Total Saldos to December 1996Saldopct Saldos as % of yearly PP disbursementAdjsaldo Saldos to December 1996 (excluding 1/2 Dec disbursement)Asaldpct % (net of 1/2 Dec disbursement)
* Above denotes created variables.
CreatedEsfiscal Own Resources as % of Total Budget, 1994-5 only [(=rrpp_e/totg_e)*100]
Sectors Code Variable Definition1 Educacion y CulturaEd Impl Implementation rate [=(XXtotg_e/XXtotg_p)*100]2 Urbanismo y ViviendaUV pcbd_e Percent of total expenditures [=(XXtotg_e/totg_e)*100]3 Energia En pcbd_p Percent of total budgeted resources [=(XXtotg_p/totg_p)*100]4 Saneamiento BasicoSB rppc_e Percent of own resources spent in sector [=(XXrrpp_e/rrpp_e)*100]5 Transportes Tr prcp_e Per capita expenditures [=XXtotg_e/pobl]6 Agropecuario Ag prcp_p Per capita budgeted resources [=XXtotg_p/pobl]7 Salud y Seguridad SocialSa prcx_e Per capita (aggregate) expenditures [=XXtotg_e/pob94_6]8 Multisectorial Mu prcx_p Per capita (aggregate) budgeted resources [=XXtotg_p/pob94_6]9 Industria y Turismo IT# Comunicaciones Co posXXpc1/2 Tobit left-censored interval data, post-D (I. data formatted for intreg)# Hidrocarburos HC# Recursos Hidricos RH
prcp_e Total investment per capita [=totg_e/pobl]Edprst_e Per student education expenditures [=Edtotg_e/totmatri] Boliviatot onlyEdprst_p Per student budgeted resources [=Edtotg_p/totmatri] Boliviatot onlyPobpc.u Urban population (%)Pobpc.r Rural population (%)Edifprst School buildings per student enrolled [=EdifEsc/Totmatri]Stpredif Students enrolled per school building [=Totmatri/EdifEsc]Aulaprst Classrooms per student enrolled [=Totaulas/Totmatri]Stpraula Students enrolled per classroom [=Totmatri/Totaulas]Alfa2 Ed_alfa^2
Sewerage
Health Care
306

Appendix 4: Data Key
Nunca2 NI_nunca^2Medio2 NI_medio^2Altiplan Regional dummyValley Regional dummyOrient Regional dummy
Electoral DataADN93, MNR93, IU95, MIR95Party voting share as % of Emitidos, 1993 and 1995 municipal electionsValido93, Blanco93, Nulo93 as % of EmitidosNValid93 No Validos as % of Emitidos [=(Blancos+Nulos)/Emitidos]Ausent93 Ausentes as % of Emitidos (i.e. not % of Inscritos)cADN, cMNR, cMIR, cTotal Number of Concejales elected per political party, 1995 municipal election onlycLeft No. of concejales from MBL, MIR, IU, Eje, MRTKL, MPP, MKN, VR-9 & FRIcRight No. of concejales from MNR & ADNcSwing No. of concejales from UCS & CondepacTechno No. of concejales from MNR, ADN, MBL & MIRcMajor No. of concejales from MNR, ADN, UCS, MIR & condepacMinor No. of concejales from MBL, IU, Eje, MRTKL, MPP, VR9, FRI, MKN
CreatedMargen93/5 Electoral margin (%) between 1st and 2nd placed parties, 1993 and 1995 municipal electionsLeft93 MBL, MIR, IU, Eje, MRTKL, VR-9, ASD, FRI, 1993 municipal electionsLeft95 MBL, MIR, IU, Eje, MRTKL, MPP, VR-9, FRI, MKN, 1995 municipal electionsRight93 MNR, ADN, FSB, 1993 municipal electionsRight95 MNR, ADN, 1995 municipal electionsSwing93/5 UCS, Condepa, 1993 and 1995 municipal elections
(Parties with populist political practice and policies, and which recently have provided swing votes in parliament to sustain one or another governing coalition)
Major93/5 MNR, ADN, UCS, MIR, Condepa, 1993 and 1995 municipal elections(Larger parties with significant national presence)
Minor93/5 All other parties, 1993 and 1995 municipal elections(Smaller parties without significant national presence)
Techno93/5 MNR, ADN, MBL, MIR, 1993 and 1995 municipal elections(Parties with qualified technical specialists, and that advocate technocratic policies)
PDMs (Plan de Desarrollo Municipal)PDM94 Existence of PDM [0,1] (i.e. one of 94 muns. whose PDMs have been compiled & registered )PDMmTot, PDMpTotTotal of PDM in amount (Bs'000) and no. of projects requested
PDM yearly subtotals across sectors, 1995-2001Year Requested
5 19956 19967 1997 _M Amount (Bs'000) demanded8 1998 _P Number of proyects demanded9 19990 2000 (2001 data for Villa Tunari transferred to 1999.)
PDMs, sectoral detailSectors Code
1 Educacion y CulturaEd Year Requested2 Urbanismo y ViviendaUV 95 19953 Energia En 96 19964 Saneamiento BasicoSB 97 1997 _M Amount (Bs'000) demanded5 Transportes Tr 98 1998 _P Number of proyects demanded6 Agropecuario Ag 99 19997 Salud y Seguridad SocialSa 0 2000 (2001 data for Villa Tunari transferred to 1999)8 Multisectorial Mu9 Industria y Turismo IT PDMpv Present Value of sectoral demands prioritized by year# Comunicaciones Co (i.e. sum of discounted yearly totals)# Hidrocarburos HC PDMpvc Per-capita PV of sectoral demands [=PDMpv/pobl]# Recursos Hidricos RH PDMx Preference index, vs. education [=PDMXXpv/PDMEdpv]# Minero Mi
Ex: pdmedp99 - cross-section data (Bolivia.dta)pdmedm - cross-sectional, time-series data (Bolxt.dta)pdmedx - cross-section data (Bolivia.dta)
PDM
PDM
_____________________Second Trip to Bolivia_____________________
307

Appendix 4: Data Key
CreatedYear Year variable for PDM-prioritized spending: 1995-2000pdmedmpc Per capita Education spending prioritized in the PDM, by year [=pdmedm/pobl]pdmuvmpc Per capita Housing and Urban Development spending prioritized in the PDM, by yearpdmenmpc Per capita Energy spending prioritized in the PDM, by yearpdmsbmpc Per capita Water & Sewerage spending prioritized in the PDM, by yearpdmtrmpc Per capita Transport spending prioritized in the PDM, by yearpdmagmpc Per capita Agriculture spending prioritized in the PDM, by yearpdmsampc Per capita Health spending prioritized in the PDM, by yearpdmmumpc Per capita Multisectoral spending prioritized in the PDM, by yearpdmitmpc Per capita Industry & Tourism spending prioritized in the PDM, by year Bolxt.dtapdmcompc Per capita Communication spending prioritized in the PDM, by yearpdmhcmpc Per capita Hydrocarbons spending prioritized in the PDM, by yearpdmrhmpc Per capita Water Management spending prioritized in the PDM, by yearpdmmimpc Per capita Mining spending prioritized in the PDM, by yearpdmmpc Total prioritized investments per capita [=pdmm/pobl]pdmuvmpu Housing & Urban Development spending prioritized in the PDM per urban resident, by year
[=pdmuvm/pob_urb] (28 obs./yr)pdmagmpr Agriculture spending prioritized in the PDM per rural resident, by year [=pdmagm/pob_rur]
PSIB (Public Sector Investment Budget)Central government (pre-decentralization) investment in each municipality by sector (Bs'000), 1987-1993 [Bolivia.dta]
Sectors Code1 Educacion y CulturaEd2 Urbanismo y ViviendaUV3 Energia En4 Saneamiento BasicoSB Years5 Transportes Tr 87 1987-19936 Agropecuario Ag 91 1991-19937 Salud y Seguridad SocialSa 92 1992-938 Multisectorial Mu9 Industria y Turismo IT Created# Comunicaciones Co pb7/1 Sectoral share as % of total investment (i.e. percent of budget)# Hidrocarburos HC PSI [=(PSIBXX87/PSIB87)*100]# Recursos Hidricos RH pc7/2 Sectoral investment per capita [=PSIBXX92/pobl]# Minero Mi ps7/1 Sectoral investment per student (only for Education)
[=PSIBEd87/totmatri]preXXpc1/2 Tobit left-censored interval data, pre-D (I. data formatted for intreg)
Ex: PSIBEd87 - Central government education investment by municipality, 1987-93PSIBSB91 - Central government water & sewerage investment by municipality, 1991-93PSIBAg92 - Central government agriculture investment by municipality, 1992-93PSIAgpb7 - Central government agriculture investment as % of total, 1987-93PSIEdpc1 - Central government per-capita education investment, 1991-93PSIEdps1 - Central government per-student education investment, 1991-93
Central & Local government investment in each municipality by sector (Bs'000), 1987-1996 [Boliviaxt.dta]Ex: PSIBEd - Central & Local education investment by municipality, 1987-96
PSIBEdpc - Central & Local per-capita education investment by municipality, 1987-96
Differences in Investment Pre- and Post-Decentraliz ationDecentralized-Centralized investment, by sector and municipalitySectors Code
1 Educacion y CulturaEd2 Urbanismo y ViviendaUV3 Energia En4 Saneamiento BasicoSB Years5 Transportes Tr 42 1994/6 - 1992/3 [=EdTotg_e - PSIBEd92]6 Agropecuario Ag 41 1994/6 - 1991/3 [=EdTotg_e - PSIBEd91]7 Salud y Seguridad SocialSa 47 1994/6 - 1987/93 [=EdTotg_e - PSIBEd87]8 Multisectorial Mu Created9 Industria y Turismo IT pc2 per capita, 1994/6 - 1992/3 [difedpc2= difed42/pobl]# Comunicaciones Co# Hidrocarburos HC# Recursos Hidricos RH Ex: DIFEd42 - Difference in educational investment, 1994/6 - 1992/3# Minero * DIFEdpc2 - Difference in per capita educational inv estment, 1994/6 - 1992/4
* No investments in this sector during 1994-96.
DIF
PSIB
308

Appendix 4: Data Key
SAYCO (Administration & Control Systems)Carried out through 5 June, 1997 by the Comptroller General (CG)sayco_a SAYCO audits (1 or more) carried out by Central Government of Municipal Governments [0,1]sayco_e No. of evaluations carried out by CG of municipal implementation of recommendations from previous auditssayco_o No. of other audits carried out by CG, including Income & Expenditure, Public Works, Payment of Salaries, Financial Reportssayco Any of the above [0,1]
Indicadores Sociodemográficos y Proyecciones de Pob lación (CD-Rom)Hogares No. of HouseholdsPercentage of Households Who Cook With:Comb_Len WoodComb_Gua GuanoComb_Car CharcoalComb_Ker KeroseneComb_Gas Natural GasComb_Ele ElectricityComb_NoC None/Doesn't CookComb_Otr Other
* Comb_Lo Low-income households by cooking fuel [=Comb_Len + Comb_Gua + Comb_NoC]* Comb_Me Medium-income households by cooking fuel [=Comb_Car + Comb_Ker]* Comb_Hi High-income households by cooking fuel [=Comb_Gas + Comb_Ele]
Percentage of Households by Type of Health Care & Facilities:Sa_MinSa Ministry of Health FacilitiesSa_Caja State/Private InsurersSa_ONG NGO/ChurchSa_Priv PrivateSa_Farm PharmacySa_Yati Traditional HealerSa_Otro OtherSa_NoAt Doesn't Receive Health CareSa_SinEs No AnswerPercentage of Households by Religion:Rel_Cato CatholicRel_Evan EvangelicalRel_Otro OtherRel_Ning NoneRel_SinE No AnswerSociodemographic Indicators:InMasc Masculinity Index (Men/100 Women)Ed_Ana15 Illiteracy Rate (Among Over-15's)Ed_2Asis School Attendance RateInDepEc Economic Dependency Index [(0-6 yrs + Ec. Inactive)/Ec. Active * 100]PartBru Labor Participation RateHogar_Ta Average Household SizePercent of Population Without Access to:Sin_Agua Water
* Sin_Agu2 Square of waterSin_Luz Electricity
* Sin_Luz2 Square of electricitySin_Alca Sewerage
* Sin_Alca2 Square of sewerageAmong Over 6's:EdAlfa6 Literacy RateEdAlfaM6 Literacy Rate, Female (Women as % of all Literates)EdAna6 Illiteracy RateEdAnaM6 Illiteracy Rate, Female (Women as % of all Illiterates)Among Over 7's:EcAct Economically Active Population (% of Total)EcActM Women as % of the Economically Active PopulationEcOcu Employment RateEcOcuM Women as % of the EmployedEcDes Unemployment RateEcDesM Women as % of the UnemployedEcIna Economically Inactive Population (% of Total)EcInaM Women as % of the Economically Inactive PopulationPercentage of Population that Speaks:Id_Cast SpanishId_Que Quechua
309

Appendix 4: Data Key
Id_Aym AymaraId_Gua GuaraniId_OtrN Other Native TonguesId_Nat Native Tongue [= any of 4 above]Id_CyQ Spanish & QuechuaId_CyA Spanish & AymaraId_CyG Spanish & GuaraniId_CyON Spanish & Other NativeId_CyN Spanish & Native [= any of 4 above]Id_Otras Other CombinationsId_Extr Foreign LanguageId_SinE No Answer
* Id_Eur At least one European language [=Id_Cast + Id_CyN + Id_Extr]* Id_Trad Only indigenous language(s) [=Id_Nat + Id_Otras]
Category of Housing by Predominant Construction Materials (% of total):CatVi_1 Best: Brick, Cement or Stone Walls & FloorsCatVi_2CatVi_3CatVi_4CatVi_5CatVi_6CatVi_7CatVi_8CatVi_9CatVi_10 Worst: Cane, Palm or Log Walls & Dirt FloorsCatVi_11 Other Combinations
* CatVi_Lo Low-income households by housing category [=CatVi_7 + 8 + 9]* CatVi_Me Medium-income households by housing category [=CatVi_4 +5 + 6]* CatVi_Hi High-income households by housing category =[CatVi_1 + 2 + 3]
Percentage of Households by Number of Rooms:Cuarto1 1Cuarto2 2Cuarto3 3Cuarto4 4Cuarto5 5 or more
* Cuarto2f 1 or 2 [=Cuarto1+Cuarto2]* Cuarto4m 4 or more [=Cuarto4+Cuarto5]
Percentage of Households by Number of Bedrooms:Dorms1 1Dorms2 2Dorms3 3Dorms4 4Dorms5 5 or more
* Dorms2f 1 or 2 [=Dorms1+Dorms2]* Dorms4m 4 or more [=Dorms4+Dorms5]
Cocina Household Has a Kitchen or Room for Cooking?Number of People per Bedroom:PPDorm2 Less than 2PPDorm4 2 to 4PPDorm5 More than 4
New Data - UDAPSO & INEPopulation Projections for: INEPob95 1995Pob96 1996Pob97 1997Pob98 1998Pob99 1999Pob00 2000Pob970_4 Population, 0-4 yr. olds, 1997
* Pob94_6 Aggregate 3-yearly population 1994-6 [=Pobl+Pob95+Pob96]Vaccination Rates (per thousand 0-4 year olds)Vac_Pol PolioVac_DPT DPTVac_BCG BCGVacunas Total VaccinationsMalnutrition Rate Among Children Examined Medically:DesLevH LowDesModH ModerateDesSevH Severe
Boys
310

Appendix 4: Data Key
DesLevM LowDesModM ModerateDesSevM SevereDesLev LowDesMod ModerateDesSev Severe
* DesMS Moderate+Severe* DesTot Low+Moderate+Severe INE
Analf Illiteracy Rate UDAPSOAnalfH Male Illiteracy RateAnalfM Female Illiteracy RateInasis School Non-Attendance RateInasisH Male School Non-Attendance RateInasisM Female School Non-Attendance RateType of Health Care:Sa_For FormalSa_Inf InformalSa_NA Doesn't Receive Health CareNo. of Grass-Roots Organizations (OTBs):Indig2 Indigenous CommunitiesCCamp2 Peasant/Campesino CommunitiesJVec2 (Urban) Neighborhood CouncilsOTBregi2 Total Registered GROs [=above 3] UDAPSO
Principal Component Variables* pcec1 1st PC* pcec2 2nd PC* pcec3 3rd PC* pcdem1 1st PC* pcdem2 2nd PC* pcpolx1 1st PC* pcpolx2 2nd PC
* pcci1 1st PC* pcci2 2nd PC* pcci3 3rd PC* pctr1 1st PC* pctr2 2nd PC* pcfp1 1st PC Financial Performance: esfiscal inopto* intntto4 intntto5 intntto6 trctto* coptrto** pcit1 1st PC* pcit2 2nd PC* pcit3 3rd PC* pcep1 1st PC* pcep2 2nd PC* pcep3 3rd PC* pcep4 4th PC* pcip1 1st PC* pcip2 2nd PC* pcip3 3rd PC* pcip4 4th PC
Interacted Need-Training Variables* sandia1 sa_minsa*pctr1* sandia2 sa_noat*pctr1* edndia1 analf*pctr1* edndia2 ni_nunca*pctr1* sbndia1 sin_alca*pctr1* sbndia2 mingi4pc*pctr1* uvndia1 infot4pc*pctr1* uvndia2 infr24pc*pctr1* agndia1 deslevh*pctr1* agndia2 matad4pc*pctr1* enndia1 sin_luz*pctr1* rhndia1 sin_alca*pctr1* rhndia2 sin_agua*pctr1* itndia1 coli4pc*pctr1
Economic: nbi nbi_u nbi_r idh comb* indepec partbru hogar_ta ec* catvi* cuarto* dorms* cocina ppdorm*
Demographic : pobpc.u pobpc.r rel* inmasc id_*
Political (Broadest): oficial marg93 cadn ccondepa cmbl cmir cmnr cucs ceje cfri ciu cmpp cmrtkl cmkn cvr9 ctotal adn* asd* condep* eje* fri9* fsb* iu* mbl* mir* mnr* mrtkl* ucs* vr9* valido* blanco* nulo* nvalid* ausent* margen* mkn* mpp* left* right* major* minor* swing* techno* cleft cright cswing ctechno
Internal Processes: pdm pdm94 epoa* dpoa* manfun usmanfun salar_pc salar_co alc_co alc_de con_co con_de evte_co evte_de invpub invdir otro_co otro_de info_sa info_ed info_sye plan_sye reconu* manpro_* progcont procomme pliego plieg_* regcon inventar suped_* supsa_* cuenpu_* iden* pm* catast* estprein preinvan preintir pscf* evalres
Civil Institutions: eereg* indig* ccamp* jvec* otb* cv
Training: fort_pao cap* tema*
Information Technology: sicom siotro sitotal computa impresor
External Processes: fis inejpr* sisin* sayco*
Girls
Total
Total
311

Appendix 4: Data Key
Censo Municipal - 1997
Variable DefinitionPopulation Served (No. People, Heads of Households?) by Basic Services (1997):
1.2 Agua_c Potable Water* Agua_pc Potable Water, percent of population served by* Agua_pc2 Square of potable water, percent of population served by
Alca_c Sewerage* Alca_pc Sewerage, percent of population served by* Alca_pc2 Square of sewerage, percent of population served by
Elec_c Electricity* Elec_pc Electricity, percent of population served by* Elec_pc2 Square of electricity, percent of population served by
Basura_c Garbage Disposal* Basu_pc Garbage Disposal, percent of population served by* Basu_pc2 Square of garbage disposal, percent of population served by
Drenaj_c Storm Drainage* Dren_pc Storm Drainage, percent of population served by* Dren_pc2 Square of storm drainage, percent of population served by
Telef_c Telephones* Tele_pc Telephones, percent of population served by* Tele_pc2 Square of telephones, percent of population served by
Alumbr_c Public Lighting* Alum_pc Public Lighting, percent of population served by* Alum_pc2 Square of public lighting, percent of population served by
1.3.1 Existing Infrastructure as of 1994 & 1998, Sporting and Cultural:Poli4 before 1994Poli8 after 1994Coli4 before 1994Coli8 after 1994Cancha4 before 1994Cancha8 after 1994InfOtro4 before 1994InfOtro8 after 1994Museo4 before 1994Museo8 after 1994Teatro4 before 1994Teatro8 after 1994Biblio4 before 1994Biblio8 after 1994Cultura4 before 1994Cultura8 after 1994
* infra1_4 before 1994* infra1_8 after 1994* infra1_d change 1994-7
Commercial and Recreational Infrastructure:1.3.2 Mercado4 before 1994
Mercado8 after 1994Matad4 before 1994Matad8 after 1994Frigo4 before 1994Frigo8 after 1994Parqueo4 before 1994Parqueo8 after 1994Feria4 before 1994Feria8 after 1994Parque4 before 1994Parque8 after 1994Zoo4 before 1994Zoo8 after 1994
1.3.3 Vivero4 before 1994Vivero8 after 1994Cement4 before 1994Cement8 after 1994
* infra2_4 before 1994* infra2_8 after 1994* infra2_d change 1994-7
Drenaje4 before 1994Drenaje8 after 1994
* Drenajed change 1994-7
Multi-use courts
Coliseums
Sports Fields
Other Sports Facilities
Museums
Theaters
Libraries
Slaughterhouses
Sporting & Cultural Infra. (sum of the above)
Cultural Centers
Markets
Parking Lots
Municipal Nursery (i.e. Plants)
Zoos
Parks
Fair Grounds
Cemetery
Commercial & Recreational Infra. (sum of
above 9)
Storm Drainage
Refrigerators
312

Appendix 4: Data Key
DesSol4 before 1994DesSol8 after 1994
* Dessold change 1994-7Laguna4 before 1994Laguna8 after 1994
* Lagunad change 1994-7Mingi4 before 1994Mingi8 after 1994
* Mingid change 1994-7OtroHig4 before 1994OtroHig8 after 1994
* Otrohigd change 1994-7* Sanbas_4 before 1994* Sanbas_8 after 1994* Sanbas_d change 1994-7* Poli4pc Multi-use courts* Coli4pc Coliseums* Canch4pc Sports Fields* InfOt4pc Other Sports Facilities* Museo4pc Museums* Teatr4pc Theaters* Bibli4pc Libraries* Cultu4pc Cultural Centers
* infra4pcSporting & Cultural Infra. (above 8)
* Merca4pc Markets* Matad4pc Slaughterhouses* Frigo4pc Refrigerators* Parqu4pc Parking Lots* Feria4pc Fair Grounds* Parqe4pc Parks* Zoo4pc Zoos* Viver4pc Municipal Nursery (i.e. Plants)* Cemen4pc Cemetery
* infr24pcCommercial & Recreational Infra. (sum of above 9)
* Drena4pc Storm Drainage* DesSo4pc Solid Waste Disposal (Landfills)* Lagun4pc Wastewater Treatment Lagoons* Mingi4pc Public Urinals* OtroH4pc Other Hygienic Services
* Sanba4pcCombined Water & San. (sum of above 3)
1.4.1 Municipal Educational Services: Early EducationEscPu_i PublicEscPr_i PrivateEscTot_i TotalMatPu_i PublicMatPr_i PrivateMatTot_i TotalDocPu_i PublicDocPr_i PrivateDocTot_i TotalEAdPu_i PublicEAdPr_i PrivateEAdTot_i Total
* StEsPu_i No. Students/School (Facility)Public* StDoPu_i No. Students/Teacher Public
1.4.2 Municipal Educational Services: Primary SchoolEscPu_1 PublicEscPr_1 PrivateEscTot_1 TotalMatPu_1 PublicMatPr_1 PrivateMatTot_1 TotalDocPu_1 PublicDocPr_1 PrivateDocTot_1 TotalEAdPu_1 PublicEAdPr_1 PrivateEAdTot_1 Total
No. of Teachers
No. of Administrators
No. of Facilities
No. of Students
No. of Teachers
No. of Administrators
Public Urinals
Other Hygienic Services
Solid Waste Disposal (Landfills)
Wastewater Treatment Lagoons
No. of Facilities
No. of Students
Combined Water & Sanitation (sum of above
3)
Per Capita [=X/pobl]
313

Appendix 4: Data Key
* StEsPu_1 No. Students/School (Facility)Public* StDoPu_1 No. Students/Teacher Public
1.4.3 Municipal Educational Services: Secondary SchoolEscPu_2 PublicEscPr_2 PrivateEscTot_2 TotalMatPu_2 PublicMatPr_2 PrivateMatTot_2 TotalDocPu_2 PublicDocPr_2 PrivateDocTot_2 TotalEAdPu_2 PublicEAdPr_2 PrivateEAdTot_2 Total
* StEsPu_2 No. Students/School (Facility)Public* StDoPu_2 No. Students/Teacher Public* EscPu_12 Public Primary & secondary* EscPu_i2 Public Early education through secondary* EscPu_1m Public Primary, secondary & multigrade
1.4.4 Municipal Educational Services: Further EducationEscPu_3 PublicEscPr_3 PrivateEscTot_3 TotalMatPu_3 PublicMatPr_3 PrivateMatTot_3 TotalDocPu_3 PublicDocPr_3 PrivateDocTot_3 TotalEAdPu_3 PublicEAdPr_3 PrivateEAdTot_3 Total
1.4.5 Municipal Educational Services: MultigradeEscPu_m PublicEscPr_m PrivateEscTot_m TotalMatPu_m PublicMatPr_m PrivateMatTot_m TotalDocPu_m PublicDocPr_m PrivateDocTot_m TotalEAdPu_m PublicEAdPr_m PrivateEAdTot_m Total
1.4.6 Municipal Educational Services: Boarding SchoolsEscPu_n PublicEscPr_n PrivateEscTot_n TotalMatPu_n PublicMatPr_n PrivateMatTot_n TotalDocPu_n PublicDocPr_n PrivateDocTot_n TotalEAdPu_n PublicEAdPr_n PrivateEAdTot_n Total
1.4.7 Municipal Educational Services: Alternative EducationEscPu_a PublicEscPr_a PrivateEscTot_a TotalMatPu_a PublicMatPr_a PrivateMatTot_a TotalDocPu_a PublicDocPr_a PrivateDocTot_a TotalEAdPu_a PublicEAdPr_a PrivateEAdTot_a Total
No. of Teachers
No. of Administrators
No. of Facilities
No. of Students
No. of Teachers
No. of Administrators
No. of Facilities
No. of Students
No. of Teachers
No. of Administrators
No. of Facilities
No. of Students
No. of Teachers
No. of Administrators
No. of Facilities
No. of Students
No. of Teachers
No. of Administrators
No. of Facilities
No. of Students
Total No. of Facilities
314

Appendix 4: Data Key
Created (Per Capita Education Indicators)Early Education
* espupci Public* esprpci Private* estopci Total* mapupci Public* maprpci Private* matopci Total* dopupci Public* doprpci Private* dotopci Total* eapupci Public* eaprpci Private* eatopci Total
Primary School* espupc1 Public* esprpc1 Private* estopc1 Total* mapupc1 Public* maprpc1 Private* matopc1 Total* dopupc1 Public* doprpc1 Private* dotopc1 Total* eapupc1 Public* eaprpc1 Private* eatopc1 Total
Secondary School* espupc2 Public* esprpc2 Private* estopc2 Total* mapupc2 Public* maprpc2 Private* matopc2 Total* dopupc2 Public* doprpc2 Private* dotopc2 Total* eapupc2 Public* eaprpc2 Private* eatopc2 Total* espupc12 Public Primary & secondary* espupci2 Public Early education through secondary* espupc1m Public Primary, secondary & multigrade
Further Education* espupc3 Public* esprpc3 Private* estopc3 Total* mapupc3 Public* maprpc3 Private* matopc3 Total* dopupc3 Public* doprpc3 Private* dotopc3 Total* eapupc3 Public* eaprpc3 Private* eatopc3 Total
Multigrade* espupcm Public* esprpcm Private* estopcm Total* mapupcm Public* maprpcm Private* matopcm Total* dopupcm Public* doprpcm Private* dotopcm Total* eapupcm Public* eaprpcm Private* eatopcm Total
No. of Administrators
No. of Teachers
No. of Administrators
No. of Facilities
No. of Students
Total No. of Facilities
Per Capita
No. of Facilities
No. of Students
No. of Teachers
No. of Administrators
No. of Facilities
No. of Students
No. of Teachers
No. of Facilities
No. of Students
No. of Teachers
No. of Administrators
No. of Facilities
No. of Students
No. of Teachers
No. of Administrators
315

Appendix 4: Data Key
Boarding Schools* espupcn Public* esprpcn Private* estopcn Total* mapupcn Public* maprpcn Private* matopcn Total* dopupcn Public* doprpcn Private* dotopcn Total* eapupcn Public* eaprpcn Private* eatopcn Total
Alternative Education* espupca Public* esprpca Private* estopca Total* mapupca Public* maprpca Private* matopca Total* dopupca Public* doprpca Private* dotopca Total* eapupca Public* eaprpca Private* eatopca Total
1.5.1 HEALTH - Health Posts:EstPu_pu No. of FacilitiesMedPu_pu No. of DoctorsAuxPu_pu No. of Medical AssistantsSAdPu_pu No. of Administrators
1.5.2 Doctors' Offices:EstPu_cm No. of FacilitiesCamPu_cm No. of BedsMedPu_cm No. of DoctorsAuxPu_cm No. of Medical AssistantsSAdPu_cm No. of Administrators
1.5.3 Health Centers (with limited in-patient facilities): [Centros de Salud]EstPu_cs No. of FacilitiesCamPu_cs No. of BedsMedPu_cs No. of DoctorsAuxPu_cs No. of Medical AssistantsSAdPu_cs No. of Administrators
* EstPu_1 No. of Facilities* MedPu_1 No. of Doctors* AuxPu_1 No. of Medical Assistants
1.5.4 Health Clinics: [Policlínicos]EstPu_pc No. of FacilitiesCamPu_pc No. of BedsMedPu_pc No. of DoctorsAuxPu_pc No. of Medical AssistantsSAdPu_pc No. of Administrators
1.5.5 Basic Hospitals:EstPu_hb No. of FacilitiesCamPu_hb No. of BedsMedPu_hb No. of DoctorsAuxPu_hb No. of Medical AssistantsSAdPu_hb No. of Administrators
* EstPu_2 No. of Facilities* CamPu_2 No. of Beds* MedPu_2 No. of Doctors* AuxPu_2 No. of Medical Assistants
1.5.6 General Hospitals:EstPu_hg PublicEstPr_hg PrivateEstTo_hg TotalCamPu_hg PublicCamPr_hg PrivateCamTo_hg Total
No. of Students
No. of Teachers
No. of Teachers
No. of Administrators
No. of Facilities
No. of Facilities
Public Sector
Public Sector
No. of Administrators
No. of Facilities
No. of Students
Public Sector
Public Sector
Public Sector
Public Sector
No. of Beds
Primary Level (Health Posts through Health
Secondary Level (Health Clinics and Basic Hospitals)
Public Sector
316

Appendix 4: Data Key
MedPu_hg PublicMedPr_hg PrivateMedTo_hg TotalAuxPu_hg PublicAuxPr_hg PrivateAuxTo_hg TotalSAdPu_hg PublicSAdPr_hg PrivateSAdTo_hg Total
1.5.7 Pharmacies:FarPu PublicFarPr PrivateFarTot Total
1.5.8 Other Health Services:SOtroPu PublicSOtroPr PrivateSOtroTot TotalCreated (Per Capita Health Indicators)
* epu.pupc No. of Facilities* mpu.pupc No. of Doctors* apu.pupc No. of Medical Assistants* spu.pupc No. of Administrators* epu.cmpc No. of Facilities* cpu.cmpc No. of Beds* mpu.cmpc No. of Doctors* apu.cmpc No. of Medical Assistants* spu.cmpc No. of Administrators* epu.cspc No. of Facilities* cpu.cspc No. of Beds* mpu.cspc No. of Doctors* apu.cspc No. of Medical Assistants* spu.cspc No. of Administrators* epu.1pc No. of Facilities* mpu.1pc No. of Doctors* apu.1pc No. of Medical Assistants* epu.pcpc No. of Facilities* cpu.pcpc No. of Beds* mpu.pcpc No. of Doctors* apu.pcpc No. of Medical Assistants* spu.pcpc No. of Administrators* epu.hbpc No. of Facilities* cpu.hbpc No. of Beds* mpu.hbpc No. of Doctors* apu.hbpc No. of Medical Assistants* spu.hbpc No. of Administrators* epu.2pc No. of Facilities* cpu.2pc No. of Beds* mpu.2pc No. of Doctors* apu.2pc No. of Medical Assistants* epu.hgpc No. of Facilities* cpu.hgpc No. of Beds* mpu.hgpc No. of Doctors* apu.hgpc No. of Medical Assistants* spu.hgpc No. of Administrators* FarPupc No. of Pharmacies* SOtrPupc No. of Other Health Services* segmiMpc Health Ins., Mothers Benefiting* segmiNpc Health Ins., Children Benefiting
1.6 Number of Economic Entities Registered, By Sector:EEReg_Mi MiningEEReg_In IndustryEEReg_EA ElectricityEEReg_Cn ConstructionEEReg_Cm CommerceEEReg_Tr Transportation & StorageEEReg_Fi FinanceEEReg_CS Community, Social & Personal ServicesEEReg_RH RestaurantsEEReg_To Total
No. of Facilities
No. of Facilities
No. of Doctors
No. of Medical Assistants
No. of Administrators
Per Capita
317

Appendix 4: Data Key
1.7.1 Municipal Government's Infrastructure & Basic Services:HamEd_p OwnedHamEd_a RentedHamEd_o OtherHamCa_p OwnedHamCa_a RentedHamCa_o OtherHamTe_p OwnedHamTe_a RentedHamTe_o OtherHamIOt_p OwnedHamIOt_a RentedHamIOt_o OtherHamInf_p OwnedHamInf_a RentedHamInf_o OtherHamLuz ElectricityHamAgua Potable Water
1.7.4 Municipal Government's Assets:HamVe_to TotalHamVe_2x 2WDHamVe_4x 4WDHamTrac TractorsHamMoto MotorcyclesHamBici BicyclesHamMaqui Other Construction EquipmentHamMuebl FurnitureHamCompu Computers Ojo! - Not the same as SISIN computersHamImpre PrintersHamFotoc PhotocopiersHamMEsc TypewritersHamCalc CalculatorsHamOtAct Other Assets
* HamActiv Total Assets [=sum of all assets above]2.A.1 Training & Capacity Building Received by the Municipal Government:
* Cap Any training or capacity building below received [0,1]* Captot Sum of training programs received
CapPP Participative PlanningCapPrOp Operations ProgrammingCapPre BudgetingCapCZ Cadaster & Zoning (Surveying/Property Appraisal)CapDis DistrictingCapFEP Project Formulation & AppraisalCapAdPr Project AdministrationCapPrIn Investment ProgrammingCapOrAd Administrative Organization
2.A.2 CapAdPe Personnel AdministrationCapAdBS Goods & Services AdministrationCapCI1 Internal Control
2.A.3 CapCI2 AccountingCapTCP Treasury & CreditCapAdTr Tax AdministrationCapLeMu Municipal Legislation
2.A.32Training & Capacity Building Requested by the Municipal Government:* Tema Any training or capacity building below requested [0,1]* Tematot Sum of training programs requested
TemaPP Participative PlanningTemaPrOp Operations ProgrammingTemaPre BudgetingTemaCZ Cadaster & Zoning (Surveying/Property Appraisal)TemaDis DistrictingTemaFEP Project Formulation & AppraisalTemaAdPr Project AdministrationTemaPrIn Investment ProgrammingTemaOrAd Administrative Organization
2.B.1 Municipal Development Plan (PDM - from the Participative Planning Exercises):PDM Municipality has a PDM [0,1]
2.B.2 Local Institutions/Actors Who Helped Devise the PDM:FPdmOtb Grass-Roots OrganizationsFPdmCV Vigilance CommitteeFPdmDDE District Education Authorities
Land/Lots
Other
Total Infrastructure
Building/Offices
Houses
Vehicles
318

Appendix 4: Data Key
FPdmUGS Health Sector Development UnitFPdmDLS Local Health AuthoritiesFPdmDLE Local Education AuthoritiesFPdmFIS Social Investment FundFPdmFDC Campesino Development FundFPdmIgle ChurchFPdmCoop CooperativesFPdmAsPr Producers AssociationsFPdmONG NGO'sFPdmOtro Other Private Groups
2.B.3 Who wrote the PDM?EPdmHAM Municipal Government AuthoritiesEPdmONG NGO'sEPdmCon ConsultantsEPdmPrIn Independent ProfessionalsEPdmPref Prefectural AuthoritiesEPdmOtro Other
2.C.1 Who wrote the 1997 Annual Operating Plan?EPoaHAM Municipal Government AuthoritiesEPoaONG NGO'sEPoaCon ConsultantsEPoaPrIn Independent ProfessionalsEPoaPref Prefectural AuthoritiesEPoaOtro OtherWhat & how many difficulties were encountered during the process of writing it?
* Dpoa Any of the difficulties below encountered [0,1]* DPoaTot Sum of difficulties encountered
DPoaInfo Informational ProblemsDPoaConc Consensus ProblemsDPoaCoor Coordination ProblemsDPoaOtro Other Problems
2.D.2 Information Systems Used by Municipal Governments:SICOM SICOMSIOtro Other Standard Packages (SICOPREFOX, SICOPREUNIX, LEXUS, SIEF, OTROS)SITotal Any of the above
2.D.3 Frequency of Municipal Spending Reports to Higher Levels of Government:InEjPr_m MonthlyInEjPr_s SemesterlyInEjPr_a AnnuallyInEjPr Any of the above
2.F.1 Municipal Employees:EmplH_To MenEmplM_To WomenEmpl_To TotalEmplH_Di MenEmplM_Di WomenEmpl_Di TotalEmplH_Te MenEmplM_Te WomenEmpl_Te TotalEmplH_Ad MenEmplM_Ad WomenEmpl_Ad TotalEmplH_Ob MenEmplM_Ob WomenEmpl_Ob TotalEmplH_Se MenEmplM_Se WomenEmpl_Se TotalEmplH_Ev MenEmplM_Ev WomenEmpl_Ev TotalEmplH MenEmplM WomenEmpl Total
* Emphtopc Men* Empmtopc Women* Emptopc Total* Emphdipc Men* Empmdipc Women* Empdipc Total
Total Permanent Employees
Temporary
Total Permanent Employees Per Capita
Executive Level Per Capita
All Employees
Service/Support
Low Skilled Workers
Executive Level
Technical
Administrative
319

Appendix 4: Data Key
* Emphtepc Men* Empmtepc Women* Emptepc Total* Emphadpc Men* Empmadpc Women* Empadpc Total* Emphobpc Men* Empmobpc Women* Empobpc Total* Emphsepc Men* Empmsepc Women* Empsepc Total* Emphevpc Men* Empmevpc Women* Empevpc Total* Emphpc Men* Empmpc Women* Emppc Total
2.F.2 Municipal Operational Manual:ManFun Existence OfUsManFun Use Of
2.F.3 Municipal Councilmen's Salaries:Salar_PC President of the CouncilSalar_Co Councilman
2.F.5 Municipal Hiring & Firing Procedures:Alc_Co HiringAlc_De FiringCon_Co HiringCon_De FiringEvTe_Co HiringEvTe_De FiringInvPub Public Invitation HiringInvDir Direct Contracting HiringOtro_Co HiringOtro_De Firing
2.G.3Further Questions About Social Services:Info_Sa HealthInfo_Ed EducationInfo_SyE Health or EducationPlan_SyE Info. Is Used for Planning?ReCoNu_S HealthReCoNu_E EducationReCoNu_A Water & SewerageReCoNu Social Services (i.e. any of the above)DesEsc Mun. Government Provides School Breakfast?DILOS Local Health Authority Operates HereDILE Local Education Authority Operates Here
2.G.4Number Who Benefit from the Mothers' & Children's Insurance (1996):SeguMI_M No. of MothersSeguMI_N No. of Children
2.G.5How Many Grass-Roots Organizations Exist in This Municipality?OTBs_e EstimatedOTBs_pj Legally Registered
2.H.1 Taxes & the Tax Base:Tributa Mun. Government Collects Local Taxes?ImPBI_N4 No. of TaxpayersImPBI_M4 Amount CollectedImPBI_N5 No. of TaxpayersImPBI_M5 Amount CollectedImPBI_N6 No. of TaxpayersImPBI_M6 Amount Collected
* Impbi_nd No. of Taxpayers* Impbi_md Amount Collected
ImPBI_N Total No. Registered (1996)ImPVA_N4 No. of TaxpayersImPVA_M4 Amount CollectedImPVA_N5 No. of TaxpayersImPVA_M5 Amount CollectedImPVA_N6 No. of TaxpayersImPVA_M6 Amount CollectedImPVA_N Total No. Registered (1996)
Mayor's Prerogative
Municipal Council's Prerogative
According to Technical Evaluation
Motor Vehicle Tax
Sectoral Regulations Applied To New Constructions In:
Real Estate & Property Taxes
Change 1994-6
1994
1995
1996
1994
Technical Per Capita
Administrative Per Capita
Other
Municipal Government Has Information On
Low Skilled Workers Per Capita
Service/Support Per Capita
Temporary Per Capita
All Employees Per Capita (1997 Pop. Projections)
1995
1996
320

Appendix 4: Data Key
ImTIV_N4 No. of TaxpayersImTIV_M4 Amount CollectedImTIV_N5 No. of TaxpayersImTIV_M5 Amount CollectedImTIV_N6 No. of TaxpayersImTIV_M6 Amount CollectedImTIV_N Total No. Registered (1996)
2.H.2 ImPat_N4 No. of TaxpayersImPat_M4 Amount CollectedImPat_N5 No. of TaxpayersImPat_M5 Amount CollectedImPat_N6 No. of TaxpayersImPat_M6 Amount CollectedImPat_N Total No. Registered (1996)ImTas_N4 No. of TaxpayersImTas_M4 Amount CollectedImTas_N5 No. of TaxpayersImTas_M5 Amount CollectedImTas_N6 No. of TaxpayersImTas_M6 Amount CollectedImTas_N Total No. Registered (1996)ImCE_N4 No. of TaxpayersImCE_M4 Amount CollectedImCE_N5 No. of TaxpayersImCE_M5 Amount CollectedImCE_N6 No. of TaxpayersImCE_M6 Amount CollectedImCE_N Total No. Registered (1996)ImOtr_N4 No. of TaxpayersImOtr_M4 Amount CollectedImOtr_N5 No. of TaxpayersImOtr_M5 Amount CollectedImOtr_N6 No. of TaxpayersImOtr_M6 Amount CollectedImOtr_N Total No. Registered (1996)
* Imtot_n4 No. of Taxpayers* Imtot_m4 Amount Collected* Imtot_n5 No. of Taxpayers* Imtot_m5 Amount Collected* Imtot_n6 No. of Taxpayers* Imtot_m6 Amount Collected* Imtot_nd No. of Taxpayers* Imtot_md Amount Collected
2.I.1 Municipal Administration:ManPro_D ExistsManPro_U Is UsedProgCont Mun. Formulates Hiring/Contracting PlansProComMe Procedures Exist for Small Purchases
2.J.1 Pliego Local Gov. Draws Up Bidding Documents for Municipal Purchases?Plieg_Pu Invitations are Published?Plieg_Ca Bids are Assessed?Plieg_Ad Contracts are Adjudicated?RegCon Mun. Government has Regulations for Contracting?Inventar Mun. Government Does Inventories of its Assets?SupEd_A MayorSupEd_C Municipal CouncilSupEd_O Grass-Roots OrganizationsSupSa_A MayorSupSa_C Municipal CouncilSupSa_O Grass-Roots OrganizationsCuenPu_A MayorCuenPu_C Municipal CouncilCuenPu_O Grass-Roots Organizations
3.1 Budgetary Revenues and Expenditures:Ingreso4 RevenuesGasto4 ExpendituresBalan4 Budget Surplus (Deficit)IngGast4 Revenues/Expenditures
3.2 Ingreso5 RevenuesGasto5 ExpendituresBalan5 Budget Surplus (Deficit)IngGast5 Revenues/Expenditures
Mun. Administrative Procedures Manual
Who Supervises the Performance of Local Education Authorities?Who Supervises the
Performance of Local Health Authorities?
Gives Public Account of Their Performance?
1994
1995
Specific Sales Tax (i.e. on Chicha )
1994
1995
1996
Other Taxes & Charges
1994
1995
1996
Municipal Licenses & Permits
Real Estate & Vehicle Transaction Tax
1996Total Municipal Taxes
Change 1994-6
Discretionary Municipal Taxes
1994
1994
1995
1996
1995
1994
1995
1996
1994
1995
1996
321

Appendix 4: Data Key
3.3 Ingreso6 RevenuesGasto6 ExpendituresBalan6 Budget Surplus (Deficit)IngGast6 Revenues/Expenditures
* Ingreso Revenues* Gasto Expenditures* Balan Budget Surplus (Deficit)* IngGast Revenues/Expenditures
3.4 Municipal Revenue Indicators:InOpTo4 Operating Revenue/Total RevenueInTNTTo4 Local Tax and Non-Tax Revenue/Total RevenueTrCtTo4 Transfers/Total RevenueCopTrTo4 National Revenue-Sharing/Total Revenue
3.5 InOpTo5 Operating Revenue/Total RevenueInTNTTo5 Local Tax and Non-Tax Revenue/Total RevenueTrCtTo5 Transfers/Total RevenueCopTrTo5 National Revenue-Sharing/Total Revenue
3.6 InOpTo6 Operating Revenue/Total RevenueInTNTTo6 Local Tax and Non-Tax Revenue/Total RevenueTrCtTo6 Transfers/Total RevenueCopTrTo6 National Revenue-Sharing/Total Revenue
* IngrTNT Total Local Tax and Non-Tax Revenues* InTNTTo Local Tax and Non-Tax Revenue/Total Revenue
3.7 Municipal Spending Indicators:PerGTo4 Personal Services/Total ExpenditureNPerGTo4 Non-Personal Services/Total ExpendituresMySGTo4 Materials & Supplies/Total ExpenditureActGTo4 Real Assets (i.e. Buildings, Equip.)/Total Exp.GCorGTo4 Current Expenditures/Total ExpenditurePerITo4 Personal Services/Total RevenueNPerITo4 Non-Personal Services/Total RevenueMySITo4 Materials & Supplies/Total RevenueActITo4 Real Assets (i.e. Buildings, Equip.)/Total Rev.GCorITo4 Current Expenditures/Total Revenue
3.8 PerGTo5 Personal Services/Total ExpenditureNPerGTo5 Non-Personal Services/Total ExpendituresMySGTo5 Materials & Supplies/Total ExpenditureActGTo5 Real Assets (i.e. Buildings, Equip.)/Total Exp.GCorGTo5 Current Expenditures/Total ExpenditurePerITo5 Personal Services/Total RevenueNPerITo5 Non-Personal Services/Total RevenueMySITo5 Materials & Supplies/Total RevenueActITo5 Real Assets (i.e. Buildings, Equip.)/Total Rev.GCorITo5 Current Expenditures/Total Revenue
3.9 PerGTo6 Personal Services/Total ExpenditureNPerGTo6 Non-Personal Services/Total ExpendituresMySGTo6 Materials & Supplies/Total ExpenditureActGTo6 Real Assets (i.e. Buildings, Equip.)/Total Exp.GCorGTo6 Current Expenditures/Total ExpenditurePerITo6 Personal Services/Total RevenueNPerITo6 Non-Personal Services/Total RevenueMySITo6 Materials & Supplies/Total RevenueActITo6 Real Assets (i.e. Buildings, Equip.)/Total Rev.GCorITo6 Current Expenditures/Total Revenue
* SerPer Total Personal Services* SerNPer Total Non-Personal Services* PerGTo Personal Services/Total Expenditure* NPerGTo Non-Personal Services/Total Expenditures* GastCor Total Current Expenditures* GCorGTo Current Expenditures/Total Expenditure* PerITo Personal Services/Total Revenue* NPerITo Non-Personal Services/Total Revenue* GCorITo Current Expenditures/Total Revenue
4.1.1 Project Selection in the Municipalities:IdenPdm PDM is used to identify Investment Projects?IdenAlc MayorIdenCon Municipal CouncilIdenCons CouncilmenIdenTec Technical Specialists of the Mun. GovernmentIdenCV Vigilance CommitteesIdenPob Local PopulationIdenOtro Other
Who Else Identifies/Initiates Projects?
1995
1996
1994
1995
Total, 1994-1996
Total, 1994-1996
1996
1994
1996
Total, 1994-6
322

Appendix 4: Data Key
4.1.2 Other Instruments Used to Identify Investment Projects:* PMCat Any of instruments below used to identify projects [0,1]* PMCattot Sum of instruments below used to identify projects
PMOrdTer Territorial Ordering Plan Ordenamiento TerritorialPMUsoSue Municipal Land Use PlanPMArProt Mun. Protected Areas PlanPMArUrb Mun. Zoning/Urban Areas PlanPMSect Sectoral Master PlansCatastUr Urban CadasterCatastRu Rural Cadaster
4.2.1.1Are Project Design Documents/Technical Studies Produced Prior to Investment:EstPrein Yes
4.2.1.2Indicators Used to Evaluate Projects:PreinVan Net Present ValuePreinTir Internal Rate of Return
4.2.2.2Project Programming & Execution - Physical Supervision and Financial Control (1996):PSCFs_Pr No. of ProjectsPSCFs_Fu No. of PersonnelPSCFn_Pr No. of ProjectsPSCFn_Fu No. of Personnel
* Pscfs_ra Projects per Supervisor Physical Supervision* Pscfn_ra Projects per Supervisor Financial Control
4.2.3.1Are Project Results Evaluated in the Operational Phase?EvalRes Yes
4.3.1 Forms of Access to the Investment Information System (SISIN):SISIN_AD Direct AccessSISIN_AI Indirect Access (via the Prefecture)SISIN_AN No Access
4.3.2 IT Equipment Available for Use with SISIN:Computa ComputersImpresor Printers
4.3.3 SISIN Subsystems Used by the Municipal Government:SISINidp Project Identification
* Above denotes created variables.
Physical Supervision
Financial Control
323

Appendix 5: Interview Questionnaires and Guides
324
APPENDIX 5: INTERVIEWS
BOLETA DE ENTREVISTA
ALCALDE, CONCEJAL, COMITE DE VIGILANCIA
I DATOS DE CONTROL
1. Entrevistador:______________ 2. Hora:___________ 3. Fecha:____________
4. Persona(s) entrevistada(s), cargo y ocupación anterior:
____________________________________________________________________
____________________________________________________________________
____________________________________________________________________
5. Lugar de entrevista: _________________________________________________
II ETAPA DE PREPARACIÓN DEL PROYECTO
6. Visité el proyecto XXX . Me gustaría que me cuente cómo participó la comunidad en
la fase de preparación del proyecto (incluyendo negociaciones con financiadores y
preparación técnica)
____________________________________________________________________
____________________________________________________________________
____________________________________________________________________
____________________________________________________________________
Appendix 5: Interview Questionnaires and Guides
325
____________________________________________________________________
____________________________________________________________________
7. Quién y cómo se decidió quién ejecutaría el proyecto?
____________________________________________________________________
____________________________________________________________________
III ETAPA DE EJECUCIÓN
8. Cómo participa(ó) la OTB en la ejecución del proyecto, y porqué?
____________________________________________________________________
____________________________________________________________________
9. Ha habido algún problema durante la ejecución? De qué tipo(s) y si se ha(n) resuelto,
cómo?
____________________________________________________________________
____________________________________________________________________
10. En su opinión se están tomando en cuenta las opiniones (y necesidades) de los
usuarios para la ejecución del proyecto?
____________________________________________________________________
____________________________________________________________________

Appendix 5: Interview Questionnaires and Guides
326
11. Se sabe quién se hará cargo del servicio cuando que se termine la obra? Cómo se ha
decidido?
____________________________________________________________________
____________________________________________________________________
12. Qué responsabilidad tiene el municipio y qué responsabilidad la (comunidad,
localidad, empresa privada u ONG) para el mantenimiento del proyecto (refacción,
reposición...)?
____________________________________________________________________
____________________________________________________________________
IV GOBIERNO MUNICIPAL Y SATISFACCIÓN
13. El sistema municipal de la ley de participación responde mejor que antes a las
necesidades o intereses de esta población (está mejor atendida que antes)? Porqué?
____________________________________________________________________
____________________________________________________________________
14. En la Ley de PP se dice que un alcalde puede ser removido de su puesto. Cree usted
que esta disposición es buena? Porqué?
____________________________________________________________________
____________________________________________________________________
15. A quién obedecen más los consejales - a los partidos o a la gente que votó por ellos?
O es lo mismo? Cómo es aquí?

Appendix 5: Interview Questionnaires and Guides
327
____________________________________________________________________
____________________________________________________________________
16. En el tiempo que lleva la participación popular, en este municipio se ha trabajado en
los siguientes servicios. Cómo calificaría usted el resultado de este trabajo? (MB, B, R,
M, MM) {en caso de no haber intervención explicar también porqué}
check calif Porqué
Educación ( ) ( ) ______________________________________
Salud ( ) ( ) ______________________________________
Agua ( ) ( ) ______________________________________
Residuos sólidos ( ) ( ) ______________________________________
Eliminación de excr. ( ) ( ) ______________________________________
Riego ( ) ( ) ______________________________________
Electricidad ( ) ( ) ______________________________________
Caminos ( ) ( ) ______________________________________
17. Ud. cree que la distribución de los recursos disponibles entre las localidades o barrios
de este municipio ha mejorado con la ley de PP? Porqué?
____________________________________________________________________
____________________________________________________________________
____________________________________________________________________
18. Se ha elaborado un PDM para este municipio? Cómo lo está usando?
____________________________________________________________________
____________________________________________________________________

Appendix 5: Interview Questionnaires and Guides
328
19. Cómo fue aquí el proceso de elaboración del PAO de 1997? {pausa} Hay alguna
institución que les está dando apoyo? En qué?
____________________________________________________________________
____________________________________________________________________
____________________________________________________________________
____________________________________________________________________
20. Ud. recibe presiones de la gente local para hacer o no hacer ciertos proyectos?
Cómo se expresan estas presiones? Ud. les hace caso? Quién consigue más?
____________________________________________________________________
____________________________________________________________________
____________________________________________________________________
____________________________________________________________________
____________________________________________________________________
21. El Comité de Vigilancia es activo en este municipio? Cuántas veces se ha opuesto a
algún proyecto o gasto de la alcaldía? Cómo se resuelven estos conflictos?
____________________________________________________________________
____________________________________________________________________
____________________________________________________________________

Appendix 5: Interview Questionnaires and Guides
329
22. Desde la participación popular, este municipio se ha beneficiado más, menos o igual
que otros municipios? Porqué?
____________________________________________________________________
____________________________________________________________________
23. Las últimas elecciones fueron limpias? Igual que antes o mejor?
____________________________________________________________________
____________________________________________________________________
24. Qué proporción de los adultos votaron en la ultima elección? Porqué no votó más
gente?
____________________________________________________________________
____________________________________________________________________
25. La reforma de la PP está dando poder a los que nunca antes mandaron, o siguen
mandando los de siempre? Qué grupos sociales se benefician más?
____________________________________________________________________
____________________________________________________________________
____________________________________________________________________
26. Qué sugerencias tiene usted para mejorar la administración municipal en este caso
específico?
____________________________________________________________________

Appendix 5: Interview Questionnaires and Guides
330
____________________________________________________________________
____________________________________________________________________
27. Que sugerencias tiene para mejorar el control social en este municipio?
____________________________________________________________________
____________________________________________________________________
____________________________________________________________________
V. CAPACIDAD TÉCNICA Y RECURSOS HUMANOS
28. Cuánta gente (NO ELECTA) de planta trabaja en la alcaldía ? Podría hacerme el
organigrama general? Cuál es el rango salarial y el tipo de formación por nivel? {sólo
alcalde}
NIVEL PERS.-NIVEL RANGO SALARIAL FORMACION
DIRECTIVO
EJECUTIVO
OPERATIVO
APOYO
29. Cuáles eran las características del personal antes de la ley de PP? (cantidad de
personal, salarios y nivel de estudios? {sólo alcalde}
____________________________________________________________________
____________________________________________________________________
____________________________________________________________________
30. Que sistemas de información y contabilidad se han implementado en el municipio?
Cuántos de estos desde 1994? {sólo alcalde}

Appendix 5: Interview Questionnaires and Guides
331
____________________________________________________________________
____________________________________________________________________
31. Han recibido alguna capacitación técnica o administrativa? Cómo fue? Algún otro
tipo de apoyo?
____________________________________________________________________
____________________________________________________________________
32. Además de las empresas que concursan por proyectos, el municipio contrata alguna
parte de su trabajo a empresas privadas? {por ejemplo} Qué y a qué empresas y por
cuáles montos? Como ha cambiado esto desde 1994? {sólo alcalde}
____________________________________________________________________
____________________________________________________________________
____________________________________________________________________
VII OBSERVACIONES Y COMENTARIOS
____________________________________________________________________
____________________________________________________________________
____________________________________________________________________
____________________________________________________________________
____________________________________________________________________

Appendix 5: Interview Questionnaires and Guides
332
BOLETA DE ENTREVISTA
COMITÉ DE VIGILANCIA - 2da Ronda
I DATOS DE CONTROL
1. Entrevistador:______________ 2. Hora:___________ 3. Fecha:____________
4. Persona(s) entrevistada(s), cargo y ocupación anterior (y partido politico):
____________________________________________________________________
____________________________________________________________________
____________________________________________________________________
5. Lugar de entrevista: __________________________________________________
II HETEROGENEIDAD Y CONFLICTO SOCIAL
6. A qué se dedica la gente por aquí (en su mayoría)?_______________________
___________________________________________________________________
7. Qué idiomas (y dialectos) se utilizan mayormente por aquí?_________________
____________________________________________________________________
8. Hay mucha migración a o de esta zona? De donde?_______________________
____________________________________________________________________
9. Qué diferentes tipos de instituciones actuan de OTB's en este municipio?_______

Appendix 5: Interview Questionnaires and Guides
333
____________________________________________________________________
10. La gente de las comunidades en este municipio son similares o hay diferentes grupos
(étnicos o culturales)? Como son diferentes? [etnia, religion, idioma, comida,
vestimenta, costumbres, actividad económica] __________________
____________________________________________________________________
____________________________________________________________________
11. Las varias comunidades de este municipio se llevan bien, o hay conflictos o pugnas
entre ellos?_________________________________________________
____________________________________________________________________
12. Han habido desacuerdos (entre las OTB's) dentro del Comité de Vigilancia?____
_____________________________________________________________________
III NECESIDADES Y LA PRIORIZACIÓN DE PROYECTOS
13. En que sectores está invirtiendo el municipio principalmente este año?
A.________________________________________________________________
B.________________________________________________________________
C.________________________________________________________________
14. Una vez terminados estos proyectos, la comunidad seguira pidiendo más proyectos
de educación/salud/agua y saneamiento, o pedirán ya inversiones en otros sectores?
Como qué? (e.g. caminos, riego) Porqué?
____________________________________________________________________

Appendix 5: Interview Questionnaires and Guides
334
____________________________________________________________________
____________________________________________________________________
15. Las OTB’s estan usando un criterio de necesidad? Al tener más adultos en esta
comunidad con mas educación (o atención en salud, o agua potable y saneamiento
básico en sus casas) igualmente hubieron pedido estos proyectos?
A.__________________________________________________________________
B.__________________________________________________________________
C.__________________________________________________________________
16. Se cumplio con el POA del año pasado a cabalidad? Porque no? Que factores
intervinieron para que no se ejecutara el POA completo? Existen fallas en el sistema
de presupuestacion y ejecucion?
____________________________________________________________________
____________________________________________________________________
____________________________________________________________________
____________________________________________________________________
____________________________________________________________________
17. Le falto plata al municipio para realizar todos los proyectos del POA? [Si Sí]==>
Como decidieron cuales proyectos se ejecutaban y cuales no? En que instancia de
tomo esta decision? Hubo consulta con las OTB’s? el CV?
__________________________________________________________________

Appendix 5: Interview Questionnaires and Guides
335
__________________________________________________________________
__________________________________________________________________
__________________________________________________________________
IV QUÉ ES UN BUEN GOBIERNO?
18. La gente de este municipio esta contenta con su gobierno municipal? Porqué?
____________________________________________________________________
____________________________________________________________________
____________________________________________________________________
19. Qué hace que un gobierno municipal sea bueno?__________________________
____________________________________________________________________
____________________________________________________________________
20. Qué hace que un acalde sea bueno? [honestidad, actividad, capacidad técnica,
apoyo político del gobierno, que escuche, que haga lobbying frente al gobierno,
que coopere?] Su alcalde es bueno?
____________________________________________________________________
____________________________________________________________________

Appendix 5: Interview Questionnaires and Guides
336
21. Qué hace que un Consejo Municipal/concejal sea bueno? [honestidad, actividad,
capacidad técnica, apoyo político del gobierno, que escuche, que haga lobbying
frente al gobierno, que coopere?] Su Consejo Municipal es bueno?
____________________________________________________________________
____________________________________________________________________
22. Qué tendría que hacer el alcalde de este municipio para ser mejor alcalde? El
Consejo Municipal?_________________________________________________
____________________________________________________________________
____________________________________________________________________
23. Con qué funciones debería cumplir una OTB óptimamente?_________________
____________________________________________________________________
____________________________________________________________________
24. Las OTB's trabajan solamente con el gobierno municipal, o también con los partidos,
los empresarios y/o terratenientes? Como y cuando?
____________________________________________________________________
____________________________________________________________________
25. Que diferencia una buena OTB de una mala OTB? [funciones, estructura,
operacion]________________________________________________________
____________________________________________________________________
____________________________________________________________________

Appendix 5: Interview Questionnaires and Guides
337
26. Que es más importante para que el gobierno municipal sea bueno, tener buen alcalde,
buen consejo municipal, o buen comité de vigilancia? Cual de los tres es más
podersoso aquí? Los tres trabajan juntos acá o hay conflictos?
____________________________________________________________________
____________________________________________________________________
____________________________________________________________________
V EL REGIMEN PARTIDARIO LOCAL
27. Quienes son las personas en las listas locales del partido? Qué actividades tienen?
(Cuál es su rol en la sociedad local?)
____________________________________________________________________
____________________________________________________________________
28. Como fueron escogidos ellos? [Procedimiento: titulares y suplentes] Hubo
consulta popular? o entre las bases del partido? Cuando y como? A qué sector
dentro del partido local representan?
____________________________________________________________________
____________________________________________________________________
____________________________________________________________________
____________________________________________________________________
29. Qué sector del electorado local se suponía que votaría por ellos? Fue así?______
____________________________________________________________________

Appendix 5: Interview Questionnaires and Guides
338
30. El jefe local del partido como llegó a serlo? Como ascendió la escalera local del
partido? Podría ser derrocado? Como? [énfasis en desempeño local vs. lo que
quiere el partido nacional]
____________________________________________________________________
____________________________________________________________________
____________________________________________________________________
31. Como es la relación entre los partidos gobernantes y los empresarios/terratenientes/
comerciantes/profesionales locales? Ellos aportan mucho dinero a los partidos?
Como lo hacen?
____________________________________________________________________
____________________________________________________________________
____________________________________________________________________
VI JERARQUÍA POLÍTICA Y ADMINISTRATIVA E INDEPENDEN CIA
32. Ud. tiene el apoyo de su partido local? nacional? Como se expresa este apoyo?
[Campañas - plata, movilizaciones, organización]
____________________________________________________________________
____________________________________________________________________
____________________________________________________________________
33. Ud. tiene la libertad política para manejar el (supervisar al) municipio y tomar las
decisiones de la forma que Ud. vea mejor, o se ve limitado desde afuera por el

Appendix 5: Interview Questionnaires and Guides
339
partido? Ocurren conflictos o contradicciones entre lo que es mejor para el
municipio y lo que el partido exige?
____________________________________________________________________
____________________________________________________________________
____________________________________________________________________
____________________________________________________________________
34. En el caso de conflicto entre el municipio y la prefectura, quién se impone? Ha
sucedido esto? Como fué?
____________________________________________________________________
____________________________________________________________________
____________________________________________________________________
35. De qué manera ha impactado el cambio de gobierno en el funcionamiento del
municipio? El gobierno municipal tiene más o menos apoyo que antes? De donde?
____________________________________________________________________
____________________________________________________________________
____________________________________________________________________
____________________________________________________________________
VII OBSERVACIONES ____________________________________________________________________ ____________________________________________________________________

Appendix 5: Interview Questionnaires and Guides
340
BOLETA DE ENTREVISTA
ORGANIZACIONES TERRITORIALES DE BASE
I DATOS DE CONTROL
1. Entrevistador:_________ 2. Hora:___________ 3. Fecha:___________
4. Persona(s) entrevistada(s), cargo y ocupación:
____________________________________________________________________
____________________________________________________________________
____________________________________________________________________
5. Lugar de entrevista: __________________________________________________
II DATOS GENERALES DE LA LOCALIDAD O BARRIO
6. Cuánta gente vive en esta comunidad o barrio: ______________________
7. A qué se dedica la gente por aquí (en su mayoría): _________________________
8. Cuénteme un poco cómo es la historia de esta (comunidad, localidad o barrio) {OJO:
poner énfasis en fechas, momentos clave, migraciones}
____________________________________________________________________
____________________________________________________________________
____________________________________________________________________

Appendix 5: Interview Questionnaires and Guides
341
____________________________________________________________________
____________________________________________________________________
9. Qué idiomas (y dialectos) se utilizan mayormente por aquí? _________________
____________________________________________________________________
10. Qué instituciones de base existen en esta (comunidad, localidad o barrio) y qué
funciones cumplen? {mencionar primero la que es OTB y después el resto}
____________________________________________________________________
____________________________________________________________________
____________________________________________________________________
____________________________________________________________________
11. Qué otras instituciones colaboran con la gente en esta (comunidad, localidad o
barrio), en qué y con qué grupos?
____________________________________________________________________
____________________________________________________________________
____________________________________________________________________
III IDENTIFICACION DE PROYECTOS
12. Qué proyectos tienen en ejecución con recursos de la participación popular? Qué
institución participa económicamente?

Appendix 5: Interview Questionnaires and Guides
342
A ____________________________________________________________________
B ____________________________________________________________________
C ____________________________________________________________________
13. Cuánta gente se beneficiará de estos proyectos?
A ___________________ B _______________________ C____________________
14. Quién es esta gente?
A ____________________ B _______________________ C___________________
15. Cuándo se inició y cuándo esperan terminar estos proyectos?
A ____________________ B _______________________ C___________________
IV ETAPA DE PREPARACIÓN
16. Los bienes o servicios que ofrecerán los proyectos, una vez terminados, ya existían o
los tendrán por primera vez aquí?
A ___________________ B _______________________ C_____________________
17. En su opinión estos proyectos satisfacen una necesidad real?
A ___________________ B _______________________ C_____________________
18. Cómo surgió la idea de hacer estos proyectos? {a quién se le ocurrió, cómo llego a
ser de conocimiento público, era algo que quería la mayoría, como se priorizó...}
____________________________________________________________________

Appendix 5: Interview Questionnaires and Guides
343
____________________________________________________________________
____________________________________________________________________
19. Qué otras ideas o proyectos tenía esta (comunidad, localidad o barrio) y no se harán
por lo menos en este año? Porqué?
____________________________________________________________________
____________________________________________________________________
____________________________________________________________________
20. Qué otras ideas o proyectos tiene esta (comunidad, localidad o barrio) y sí se harán
este año?
_____________________________________________________________________
21. Quién y cómo se completó la documentación para hacer los proyectos? Fueron
consultados los beneficiarios sobre detalles técnicos o económicos?
_____________________________________________________________________
_____________________________________________________________________
_____________________________________________________________________
22. Sabe Ud. cuánto cuesta este proyecto y quiénes ponen los recursos (y en qué
proporción)?
A ______________________ B ____________________ C____________________

Appendix 5: Interview Questionnaires and Guides
344
23. Sabe usted si alguien de la comunidad participó en las negociaciones con los
organismos de apoyo financiero?
_____________________________________________________________________
_____________________________________________________________________
24. Sabe Ud. quién y cómo se decidió quién ejecutaría los proyectos?
_____________________________________________________________________
_____________________________________________________________________
V ETAPA DE EJECUCIÓN
Contratista ( ) Autoconstrucción ( )
25. Existe algún responsable del control del dinero, de la calidad, de los plazos y/o de los
materiales por parte de la comunidad? Cómo se decidió esa responsabilidad?
_____________________________________________________________________
_____________________________________________________________________
26. Ha habido algún problema durante la ejecución? De qué tipo(s) y si se ha(n) resuelto,
cómo?
_____________________________________________________________________
_____________________________________________________________________
VI ETAPA DE ADMINISTRACIÓN

Appendix 5: Interview Questionnaires and Guides
345
27. Quién se hará cargo de el servicio una vez que se terminen las obras? Cómo se ha
decidido?
_____________________________________________________________________
_____________________________________________________________________
28. Qué responsabilidad tiene el municipio y qué responsabilidad la (comunidad,
localidad, empresa privada u ONG) para la mantención de los proyectos?
A:___________________________________________________________________
_____________________________________________________________________
B:___________________________________________________________________
_____________________________________________________________________
C:___________________________________________________________________
_____________________________________________________________________
VII GOBIERNO MUNICIPAL Y SATISFACCIÓN
29. El sistema municipal de la ley de participación responde mejor que antes a las
necesidades o intereses de esta población (está mejor atendida que antes)?
_____________________________________________________________________
_____________________________________________________________________
30. En la Ley de PP se dice que un alcalde puede ser removido de su puesto. Cree usted
que esta disposición es buena? Porqué?

Appendix 5: Interview Questionnaires and Guides
346
_____________________________________________________________________
_____________________________________________________________________
31. A quién obedecen más los consejales - a los partidos o a la gente que votó por ellos?
Cómo es aquí?
_____________________________________________________________________
_____________________________________________________________________
_____________________________________________________________________
32. Con cuales de los siguientes servicios cuenta esta comunidad? En cuales se han
hecho proyectos con la PP? Cómo califica usted el resultado de este trabajo? (MB, B, R,
M, MM) {en caso de no haber intervención explicar también porqué}
check PP calif Características/Porqué
Educación ( ) ( ) ( ) ______________________________________
Salud ( ) ( ) ( ) ______________________________________
Agua ( ) ( ) ( ) ______________________________________
Resids sólidos ( ) ( ) ( ) ______________________________________
Elimin. excr. ( ) ( ) ( ) ______________________________________
Riego ( ) ( ) ( ) ______________________________________
Electricidad ( ) ( ) ( ) ______________________________________
Caminos ( ) ( ) ( ) ______________________________________
Otros ( ) ( ) ( ) (ESPECIFICAR)
_____________________________________________________________________
33. Ud. cree que la distribución de los recursos disponibles entre las localidades o barrios
de este municipio ha mejorado con la ley de PP? Porqué?
Appendix 5: Interview Questionnaires and Guides
347
_____________________________________________________________________
_____________________________________________________________________
34. Desde la participación popular, este municipio se ha beneficiado más, menos o igual
que otros municipios (en la calidad de inversion y gasto)? Porqué?
_____________________________________________________________________
_____________________________________________________________________
35. Las últimas elecciones fueron limpias? Igual que antes o mejor?
_____________________________________________________________________
_____________________________________________________________________
36. Qué proporción de los adultos votaron en la última elección? Porqué no votó más
gente?
_____________________________________________________________________
_____________________________________________________________________
37. La reforma de la PP está dando poder a los que nunca antes mandaron, o siguen
mandando los de siempre? Qué grupos sociales se benefician más?
_____________________________________________________________________
_____________________________________________________________________
_____________________________________________________________________

Appendix 5: Interview Questionnaires and Guides
348
38. El Comité de Vigilancia es activo en este municipio? Está realmente vigilando los
proyectos en esta localidad/barrio? En caso de problemas, cómo se resuleven?
_____________________________________________________________________
_____________________________________________________________________
_____________________________________________________________________
39. Qué sugerencias tiene usted para mejorar la administración municipal en este caso
específico?
_____________________________________________________________________
_____________________________________________________________________
40. Que sugerencias tiene para mejorar el control social en este barrio/localidad?
_____________________________________________________________________
_____________________________________________________________________
VIII OBSERVACIONES Y COMENTARIOS
_____________________________________________________________________
_____________________________________________________________________
_____________________________________________________________________

Appendix 5: Interview Questionnaires and Guides
349
BOLETA DE ENTREVISTA
ORGANIZACIONES TERRITORIALES DE BASE – 2da Ronda
I DATOS DE CONTROL
1. Entrevistador:_________ 2. Hora:___________ 3. Fecha:___________
4. Persona(s) entrevistada(s), cargo y ocupación:
_____________________________________________________________________
_____________________________________________________________________
5. Tipo de OTB entrevistada:_____________________________________________
6. Lugar de entrevista: __________________________________________________
II HETEROGENEIDAD Y CONFLICTO SOCIAL
7. A qué se dedica la gente por aquí (en su mayoría)? _________________________
_____________________________________________________________________
8. Qué idiomas (y dialectos) se utilizan mayormente por aquí?__________________
_____________________________________________________________________
9. Hay mucha migración a o de esta zona? De donde? ________________________
_____________________________________________________________________

Appendix 5: Interview Questionnaires and Guides
350
10. Además de la suya, qué otros tipos de instituciones dieron origen a OTB's en este
municipio? [Sindicato Campesino, Allyu, Junta Vecinal,etc.]
_____________________________________________________________________
_____________________________________________________________________
11. La gente de otras comunidades en este municipio, es gente similar a Uds. o son
diferentes? Como son diferentes? [etnia, religion, idioma, comida, vestimenta,
actividad económica] _______________________________________________
_____________________________________________________________________
_____________________________________________________________________
12. [Si Sí]==> Cuánto contacto tienen con esas otras comunidades? A veces trabajan o
cooperan con ellos? Han hecho algún proyecto con una de estas otras comunidades?
Como fue?
_____________________________________________________________________
_____________________________________________________________________
_____________________________________________________________________
13. Ha habido alguna pugna o conflicto con alguna de las otras comunidades/OTB's en
este municipio?
_____________________________________________________________________
_____________________________________________________________________
14. Han habido desacuerdos (entre las OTB's) dentro del Comité de Vigilancia?_____
_____________________________________________________________________
Appendix 5: Interview Questionnaires and Guides
351
15. La alcaldía favorece a alguna OTB en particular, o tienen todas las mismas
oportunidades y acceso al municipio?
__________________________________________________________________
III QUÉ ES UN BUEN GOBIERNO?
16. La gente de esta OTB esta contenta con su gobierno municipal? Porqué?_______
_____________________________________________________________________
_____________________________________________________________________
17. Qué hace que un gobierno municipal sea bueno?___________________________
_____________________________________________________________________
_____________________________________________________________________
18. Sienten que su gobierno municipal los representa a Uds. y sus intereses? Porqué?
(De qué manera?)
_____________________________________________________________________
_____________________________________________________________________
_____________________________________________________________________
19. Qué hace que un acalde sea bueno? [honestidad, actividad, capacidad técnica,
apoyo político del gobierno, que escuche, que haga gestiones frente al gobierno,
que coopere?] Su alcalde es bueno (regular o malo)?
_____________________________________________________________________
_____________________________________________________________________

Appendix 5: Interview Questionnaires and Guides
352
20. Qué hace que un Consejo Municipal/concejal sea bueno? [honestidad, actividad,
capacidad técnica, apoyo político del gobierno, que escuche, que haga gestiones
frente al gobierno, que coopere?] Su Consejo Municipal es bueno (regular o
malo)?
_____________________________________________________________________
_____________________________________________________________________
21. Qué hace que un (Presidente de) Comité de Vigilancia sea bueno? [honestidad,
actividad, capacidad técnica, apoyo político del gobierno, que escuche, que haga
gestiones frente al gobierno, que coopere?] Su Comité de Vigilancia es bueno
(regular o malo)?
_____________________________________________________________________
_____________________________________________________________________
22. Qué tendría que hacer el alcalde de este municipio para ser mejor alcalde? El
Consejo Municipal?
_____________________________________________________________________
_____________________________________________________________________
_____________________________________________________________________
23. Con qué funciones debería cumplir una OTB óptimamente? La OTB trabaja
solamente con el gobierno municipal, o también con los partidos, los empresarios y/o
terratenientes? Cómo y cuando?
_____________________________________________________________________
_____________________________________________________________________
_____________________________________________________________________

Appendix 5: Interview Questionnaires and Guides
353
24. Que diferencia una buena OTB de una mala OTB? [funciones, estructura,
operacion] Cómo podria su OTB funcionar mejor?
_____________________________________________________________________
___________________________________________________________________....
_____________________________________________________________________
25. Cual es mas importante para que el gobierno municipal sea bueno, tener buen
alcalde, buen consejo municipal, o buen comité de vigilancia? Cual de los tres es
mas podersoso aquí? Los tres trabajan juntos acá o hay conflictos?
_____________________________________________________________________
_____________________________________________________________________
_____________________________________________________________________
26. En el caso de conflicto entre el municipio y la prefectura, quién se impone? Ha
sucedido esto? Como fue?
__________________________________________________________________
__________________________________________________________________
__________________________________________________________________
27. De qué manera ha impactado el cambio de gobierno en el funcionamiento del
municipio? Ud. tiene más o menos apoyo que antes? De donde?
__________________________________________________________________
__________________________________________________________________

Appendix 5: Interview Questionnaires and Guides
354
__________________________________________________________________
IV EL REGIMEN PARTIDARIO LOCAL
28. Quienes son las personas en las listas locales del partido? Qué actividades tienen?
(Cuál es su rol en la sociedad local?)
_________________________________________________________________
_________________________________________________________________
29. Como fueron escogidos ellos? [Procedimiento: titulares y suplentes] Hubo
consulta popular? o entre las bases del partido? Cuando y como? A qué sector
dentro del partido local representan?
__________________________________________________________________
__________________________________________________________________
__________________________________________________________________
__________________________________________________________________
30. Qué sector del electorado local se suponía que votaría por ellos? Fue así?____
__________________________________________________________________
__________________________________________________________________
31. El jefe local del partido como llegó a serlo? Cómo ascendió la escalera local del
partido? [énfasis en desempeño local vs. lo que quiere el partido nacional]
__________________________________________________________________

Appendix 5: Interview Questionnaires and Guides
355
__________________________________________________________________
__________________________________________________________________
32. Cómo es la relación entre los partidos gobernantes y los empresarios/terratenientes/
comerciantes/profesionales locales? Estos ultimos aportan mucho dinero a los
partidos? A cuales? Como lo hacen?
__________________________________________________________________
__________________________________________________________________
__________________________________________________________________
__________________________________________________________________
V. OBSERVACIONES _____________________________________________________________________ _____________________________________________________________________ _____________________________________________________________________ _____________________________________________________________________ _____________________________________________________________________ _____________________________________________________________________ _____________________________________________________________________
_____________________________________________________________________ _____________________________________________________________________

Appendix 5: Interview Questionnaires and Guides
356
GUÍA DE ENTREVISTAS
ALCALDE, CONCEJAL Y COMITÉ DE VIGILANCIA
4. Concejales
• # Concejales
• de qué partido?
• de qué localidad?
• qué profesión/ocupación anterior?
5. Lugar y significación de entrevista (1a sección, 2a sección, etc.)
6. Participación de la comunidad
• a quién se le ocurrió?
• cómo se priorizó?
• cómo se comunicó a la gente?
• cómo se fijó la contraparte? cuánto es?
18. PDM
• quién hizo el PDM?
• cómo se hizo? que metodología?
23. Elecciones limpias
• "antes" = 20-30 años atrás
25. Los que mandan
• ejemplo de los madereros del Beni
26. Cuántas secretarias hay? Cuántos choferes?
33. Me puede recomendar cuales OTB's, barrios u otros serían especialmente
interesantes para visitar y charlar?

Appendix 5: Interview Questionnaires and Guides
357
34. Tiene algún estudio, diagnóstico o folleto de información sobre el municipio? Me lo
puede mostrar/regalar?
ORGANIZACIONES TERRITORIALES DE BASE
8. Momentos claves (ejs.)
• sublevación indígena
• Reforma Agraria
11. Quién tiene la representación de la OTB?
37. Elecciones limpias
• "antes" = 20-30 años atrás
39. Los que mandan
• ejemplo de los madereros del Beni

Appendix 5: Interview Questionnaires and Guides
358
GUÍA DE ENTREVISTA
INFORMANTE CLAVE
1. Tiene buenas relaciones con la alcaldía? La HAM facilita u obstaculiza su trabajo?
Como apoya la alcaldía a su sector? Que proyectos hay?
2. Cómo se relacionan Uds. con otros organismos e instituciones locales (FF.AA.,
ONG's, OTB's, etc.)?
3. La HAM sirve a todo el municipio de _________, o sólo a una parte/sector?
4. Su organización/empresa tributa aquí en el municipio? Cuanto tributa?
5. Como se podría aumentar los recursos propios del municipio?
6. Quién manda acá? Quién mandaba antes? Mediante qué mecanismos se articula su
poder? Cuando y porqué cambio?
7. Cuales son los conflictos sociales que hay acá?
8. Como califica Ud. el trabajo del alcalde? del Consejo Municipal? Como se podría
mejorar?
9. Qué porcentaje de la gente ha votado en la última elección? Porqué no votó más?
Como compara con elecciones pasadas (20-30 años atrás)?

Appendix 5: Interview Questionnaires and Guides
359
INFORMANTE CLAVE – 2da Ronda
Oficial Mayor Financiero/Administrativo
1. Han hecho un PDM en este municipio?
2. Como fue el proceso de hacer el POA en este municipio el año pasado?
3. Se cumplio con el POA a cabalidad? Porque no? Que factores intervinieron para
que no se ejecutara el POA completo? Existen fallas en el sistema de
presupuestacion y ejecucion?
4. Le falto plata al municipio para realizar todos los proyectos del POA? De donde
falto plata? [Coparticipacion, Fondos, TGN, ONG’s u otra institucion?]
5. De no haber suficientes fondos para ejecutar el POA entero, como decidieron cuales
proyectos se ejecutaban y cuales no? En que instancia de tomo esta decision? Hubo
consulta con las OTB’s? el CV?
Empresarios Locales
1. A Ud. le es más facil influenciar a los políticos locales, o a los nacionales mediante
la CEPB? Qué tipo de diálogo o presión ejerce Ud. sobre el municipio?

Appendix 5: Interview Questionnaires and Guides
360
BOLETA DE ENTREVISTA
JEFE LOCAL DEL PARTDO
I DATOS DE CONTROL
1. Entrevistador:______________ 2. Hora:___________ 3. Fecha:_____________
4. Persona(s) entrevistada(s), cargo y ocupación anterior:
_____________________________________________________________________
_____________________________________________________________________
_____________________________________________________________________
5. Lugar de entrevista: __________________________________________________
II El Regimen Partidario Local
6. Cómo se eligieron las listas locales del partido? [Procedimiento: titulares y
suplentes] Hubo consulta popular? entre las bases del partido? Cuando y cómo?
_____________________________________________________________________
_____________________________________________________________________
_____________________________________________________________________
_____________________________________________________________________
7. Quienes son estas personas? Qué actividad tienen? Cuál es su rol en la sociedad
local?
_____________________________________________________________________

Appendix 5: Interview Questionnaires and Guides
361
_____________________________________________________________________
_____________________________________________________________________
8. Porqué fueron elegidos ellos? Quién dentro del partido los apoyó? A qué sector
dentro del partido local representan? Estan asociados con algun sector nacional en
particular?
_____________________________________________________________________
_____________________________________________________________________
_____________________________________________________________________
_____________________________________________________________________
_____________________________________________________________________
9. Qué sector del electorado local se suponía que votaría por ellos? Fue así?_______
_____________________________________________________________________
_____________________________________________________________________
10. En caso de perder la elección, estos candidatos fueron cambiados, o entrarán de
nuevo en las listas en la próxima elección?
_____________________________________________________________________
_____________________________________________________________________
11. Cuál es su actividad económica? su profesión? (su papel en la sociedad local)?___
_____________________________________________________________________

Appendix 5: Interview Questionnaires and Guides
362
12. Cómo llegó Ud. a ser jefe local del partido? Cómo ascendió la escalera local del
partido? Podría ser derrocado? Cómo? [énfasis en desempeño local vs. lo que
quiere el partido nacional]
_____________________________________________________________________
_____________________________________________________________________
_____________________________________________________________________
13. Cuán fuerte es la relación entre el partido local y el nacional? Con qué frecuencia se
consultan decisiones al partido nacional? Qué tipo de decisiones? Son necesarias
estas consultas? Qué pasa si no se hacen?_______________________
_____________________________________________________________________
_____________________________________________________________________
_____________________________________________________________________
_____________________________________________________________________
14. Qué otro tipo de control tiene el partido nacional sobre el local? Cómo se ejerce?
_____________________________________________________________________
_____________________________________________________________________
15. Cómo es la relación entre su partido y los empresarios/terratenientes/comerciantes/
profesionales locales?
_____________________________________________________________________
_____________________________________________________________________
Appendix 5: Interview Questionnaires and Guides
363
16. Los empresarios locales aportan mucho dinero al partido? Como lo hacen?_____
_____________________________________________________________________
_____________________________________________________________________
17. El partido consulta a los empresarios locales antes de fijar listas? antes de eligir
políticas? A las OTB's? A alguna otra institución?
_____________________________________________________________________
_____________________________________________________________________
_____________________________________________________________________
18. Ud. tiene el apoyo del partido local? nacional? Cómo se expresa este apoyo?____
_____________________________________________________________________
_____________________________________________________________________
_____________________________________________________________________
_____________________________________________________________________
III OBSERVACIONES _____________________________________________________________________ _____________________________________________________________________ _____________________________________________________________________ _____________________________________________________________________

Appendix 5: Interview Questionnaires and Guides
364
JEFE DEL PARTIDO NACIONAL
1. Cómo es la estructura orgánica de su partido? Como es que surgen las expresiones
locales del partido? Existen oficiales locales, o todo es dirigido desde la prefectura o
desde La Paz? [enfasis en la estructura Local y Deptal. vs. Nacional]
2. Cómo son compuestas las listas locales de su partido? De donde saca su partido
candidatos municipales? Qué tipo de gente es?
3. Qué influencia tiene la estructura central de su partido en la selección de candidatos,
y qué influencia tiene la estructura local? Quien pesa más?
4. Que papel juega la plata (contribuciones al partido, personas o grupos pudientes) en
este proceso?
5. Cómo son escogidos los lideres locales del partido? De donde vienen? Que tipo de
gente son? [énfasis en desempeño local vs. vínculos con el partido nacional]
6. El partido central tiene cómo sancionar a candidatos o lideres locales que se
desmarcan políticamente o éticamente? Cuales son los mecanismos?
7. El partido tiene líneas fuertes para la administración municipal, o más bien permite
que los municipios busquen el éxito de su propia manera? (hay un "paquete" de
medidas que todo municipio debe implementar?)
8. Como se resuelven las pugnas políticas locales? El partido nacional o departamental
interviene en ellas? Con qué frecuencia se consultan decisiones al partido nacional?
Qué tipo de decisiones? Son necesarias estas consultas? Qué le pasa al partido local
si no las hace?
9. Existe algún otro tipo de control del partido nacional sobre el local? Cómo se
ejerce? [ideológicos, económicos, burocráticos?]
Interview List
365
Interview List
Atocha
Gladys Armata de Mejía, municipal council president (MNR), interview, Atocha, 23
April 1997.
Roberto Ávila Callo, municipal councilman (UCS), interview, Atocha, 22 April 1997.
Wilfredo Chiri and Fermín Leán, Federation of Cooperativist Miners president and
secretary, interview, Atocha, 23 April 1997.
Fr. José Dessart, parish priest, interview, Atocha, 25 April 1997.
Severo García Cándia, oversight committee member, interview, Atocha, 23 April 1997.
Fernando Hernández, Social Investment Fund departmental director, interview and site
visits, Atocha, 21-22 April 1997.
Raúl Mamani Villca, oversight committee president, interview, Siete Suyos, 22 April
1997.
Pablo Victorio Ayala, mayor, interview, Ánimas, 22 April 1997.
Community and Grass-Roots Organizations
Atocha: Severo García Cándia, neighborhood council ex-president, interview, Atocha,
23 April 1997.
Chorolque: Albino García Choque, Juan Bonifacio Onofre, Esteban Marcha Cachambre
and Ivan Marca, miners’ cooperative welfare officer, oversight officer, oversight
officer and member, interview, Chorolque, 23 April 1997.
Villa Solano: Gerónimo Ayala Hernández, community officer, interview, Chorolque, 23
April 1997.
Baures
Hugo Ayllón Parada, Cattlemen’s Association president, interview, Baures, 2 May 1997.
Conrad Bruckner, cattle rancher, interview, Baures, 4 May 1997.
Elwin Bruckner, prefect, interview, Baures, 1 May 1997.
Grover Martínez Franco, mayor, interview, Baures, 2 May 1997.
Hugo Melgar Barbery and Erland Ayllón Parada, municipal council president (MIR) and
member (independent, ex-MNR), interview, Baures, 2 May 1997.
Dimitri Ojopi, oversight committee president, interview, Baures, 2 May 1997.
Juan Oni Antelo, municipal councilman (MNR), interview, Baures, 2 May 1997.

Interview List
366
Srs. Pilar and Teresa and Oscar Velázquez, CETHA (adult education center officers),
interview, Baures, 4 May 1997.
Ginger Yapiz, Social Investment Fund departmental director, interview and site visits,
Baures, 1 May 1997.
Community and Grass-Roots Organizations
Baures: Oscar Durán, neighborhood council president, interview, Baures, 2 May 1997.
El Cairo: Manuel Chipeno Valdivieso, community leader, interview, El Cairo, 3 May
1997.
Jasiakiri: Juan Jahnsen, community leader, interview, El Cairo, 3 May 1997.
Tujuré: Gustavo Chonono Churipui, community leader, interview, El Cairo, 3 May
1997.
Charagua
Florencio Antuni Sánchez (a), oversight committee president, interview, Charagua, 1
April 1997.
Florencio Antuni Sánchez (b), oversight committee president, interview, Charagua, 30
October 1997.
Wilfredo Anzoátegui Vaca, hospital director, interview, Charagua, 30 October 1997.
Oscar Hugo Aramayo Caballero, district director of education, interview, Charagua, 4
April 1997.
José Durán, Social Investment Fund finance director, interview, 3 October 1997.
Nelson Egüez Gutiérrez, MNR chief, interview, Charagua, 30 October 1997.
Edgar Gutiérrez Hurtado (a), ADN chief, interview, Charagua, 28 October 1997.
Edgar Gutiérrez Hurtado (b), district officer, interview, Charagua, 28 October 1997.
Juan Carlos Gutiérrez, Cattle Ranchers’ Association of the Cordillera president,
interview, Charagua, 1 April 1997.
Rolando Gutiérrez, municipal councilman (MNR), interview, Charagua, 2 April 1997.
Dante Hurtado Salse, oversight committee secretary, interview, Charagua, 30 October
1997.
Fernando Muñoz Franco, Social Investment Fund departmental director, interview,
Santa Cruz, 31 March 1997.
Eulogio Núñez, CIPCA director (NGO) and municipal adviser, interview, Charagua, 2
April 1997.
Rosario Pantoja de Cuéllar, education center director, interview, Charagua, 4 April 1997.

Interview List
367
Pedro Fidel Ribera Caballero, member of the directorate of AGACOR, interview,
Charagua, 30 October 1997.
Fr. Luis Roma, parish priest, interview, Charagua, 29 October 1997.
Fr. Gabriel Sequier (Tianou Pirou), parish priest, interview, Izozo, 3 April 1997.
Luis Saucedo Tapia (a), mayor, interview, Santa Cruz, 31 March 1997.
Luis Saucedo Tapia (b), mayor, interview, Charagua, 1 April 1997.
Luis Saucedo Tapia (c), mayor, interview, Charagua, 27 October 1997.
Julián Segundo Chipipi, municipal councilman (MNR), interview, Charagua, 2 April
1997.
Crispín Solano Menacho, municipal councilman (MBL) and ex-oversight committee
president, interview, Charagua, 28 October 1997.
Abelardo Vargas Portales, municipal council president (ADN), interview, Charagua, 1
April 1997.
Abelardo Vargas Portales and Abilio Vaca, municipal council president and councilman
(ADN and MBL) respectively, interview, Charagua, 28 October 1997.
Roberto Vargas, chief financial officer, interview, Charagua, 30 October 1997.
Lt.Col. Fair Eduardo Villaroel, army garrison commander, interview, Charagua, 2 April
1997.
Community and Grass-Roots Organizations
Acae: Israel Romero Macuendí and Florencio Altamirano, community leader and
community member, interview, Acae, 2 April 1997.
La Brecha: Francisco Chávez Flores, Delcio Moreno Candia, Mario Arreaga, Andrés
Chávez Flores, Vicente Moreno, and Licelio Cuéllar Martínez, community leader, aid
to the capitanía, hospital administrator, nursing assistant, school association president
and Alto Izozo district deputy, interview, La Brecha, 3 April 1997.
La Brecha: Francisco Chávez, Alberto Rodríguez and Ignacio Álvarez, community
leader, adviser to the capitanía grande, and community member, interview, La Brecha,
28 October 1997.
Charagua: Walter García Juárez and Jorge Cortez Romero, community association
president and community member, interview, Charagua, 3 April 1997.
Charagua: Omar Quiroga Antelo, neighborhood council president, interview, Charagua,
30 October 1997.

Interview List
368
Charagua Station: Abelino Sánchez Ramírez, neighborhood council vice-president,
interview, Charagua Station, 30 October 1997.
Copere Brecha: Leoncio Pabaroa and Javier Yupico, interim community leader and ex-
leader, interview, Copere Brecha, 29 October 1997.
El Espino: Pablo Carrillo and Marcial Arumbari, community leader and officer,
interview, El Espino, 4 April 1997.
El Espino: Paul Carrillo, Ricardo Melgar and Marcial Arumbari, community leader,
community member, and community officer, interview, El Espino, 31 October 1997.
Isiporenda: Hilda Ibáñez vda. de Castro and Vidal Durán Sala, community leader and
adviser, interview, Isiporenda, 29 October 1997.
Kapiwasuti: Demetrio Caurey and Florencio Altamirano, president of the community
irrigation committee and infrastructure officer, interview, Kapiwasuti, 2 April 1997.
Rancho Nuevo: Luis García and Hipólito Sirari Ena, community founder/adviser to the
capitanía, and community leader, interview, Rancho Nuevo, 28 October 1997.
Taputamí: Josué Aiduare and Florencio Aiduare, community leaders, interview,
Taputamí, 2 April 1997.
Yapiroa: Pablo Diego Vaca and David Segundo, community leader and adviser,
interview, Yapiroa, 3 April 1997.
Desaguadero
Luis González, Social Investment Fund departmental director, interview, Desaguadero,
22 March 1997.
Alfredo Bravo Mujica and Mario Cerda Escalante, municipal councilmen (MNR and
ADN respectively), interview, Desaguadero, 24 March 1997.
Rosendo Mamani Quispe, mayor, interview, Desaguadero, 25 March 1997.
Juan Nina Quispe, oversight committee vice-president and neighborhood council
president, interview, Desaguadero, 25 March 1997.
Unnamed, primary and secondary school directors, and various members of the school
association, interview, Desaguadero, 24 March 1997.
Community and Grass-Roots Organizations
Azafranal: Augusto Ibáñez Ayoroc, Lucio Quispe and Leonardo Saiga Torres, school
principal, school advisor, and primary school director, interview, Azafranal, 26 March
1997.

Interview List
369
Azafranal: Dionisio López, unnamed and unnamed, community leader and two officers,
interview, Desaguadero, 25 March 1997.
Comunidad San Pedro: Faustino Mamani Chura and Seferino Torres, water committee
president and secretary, interview, Desaguadero, 25 March 1997.
Desaguadero (neighborhood council): Pastor Huaywa Nino, water committee vice-
president, interview, Desaguadero, 25 March 1997.
Huancollo: Constantino Aruquipa and unnamed, school association president and
member, interview, Desaguadero, 25 March 1997.
San Pedro Okorani: Nicolás Condori Laura, Cresóstomo Ticona and Felipe Apaza
Callisaya, community leader, general officer and school officer, interview, San Pedro
Okorani, 26 March 1997.
Titijumi: Justo José Apaza, community leader, interview, Desaguadero, 25 March 1997.
Vitunkani: Francisco Quispe Huanca, Venturo Quispe, Juan Quispe Fernández and
Mario Quispe, community leader, justice officer, education officer, and community
member, interview, Vitunkani, 26 March 1997.
Yanal: Pascual Fernández, Eulogio Limachi and unnamed, community leader, school
association president and community education officer, interview, Desaguadero, 25
March 1997.
Guayaramerín
Alberto Albert, municipal technical advisor and ex-municipal council president,
interview, Guayaramerín, 20 October 1997.
Fr. Fernando Bendoraitis, health NGO director, interview, Guayaramerín, 19 October
1997.
Zacarías Catalayud, oversight committee vice-president, interview, Guayaramerín, 20
October 1997.
Fr. Julio Corredor, parish priest, interview, Guayaramerín, 19 October 1997.
Orlando del Río, oversight committee secretary, interview, Guayaramerín, 5 June 1997.
[AG]
Pedro Noel Herrera Delgado, departmental forest inspector, interview, Guayaramerín, 21
October 1997.
Sr. Ana López, NGO director, interview, Guayaramerín, 22 October 1997.
Carlos Luna, chief officer, interview, Guayaramerín, 5 June 1997. [AG]
Elias Mesquita Coimbra, mayor, interview, Guayaramerín, 20 October 1997.

Interview List
370
Iván Nincevic Landívar, municipal council president (ADN) and telephone cooperative
president, interview, Guayaramerín, 20 October 1997.
Carmelo Parada Zarco, chief magistrate, interview, Guayaramerín, 21 October 1997.
Adrián “Gigi” Rivera, electricity cooperative president, money-lender and hotel owner,
interview, Guayaramerín, 21 October 1997.
Erasmo Roca, municipal councilman (ADN), interview, Guayaramerín, 6 June 1997.
[AG]
Manlio Roca, port (customs) manager, ex-mayor and ex-MP, interview, Guayaramerín,
21 October 1997.
Ruth Roca, Zacarías Catalayud, Orlando del Río and José Guali, oversight committee
president, vice-president, secretary and member, interview, Guayaramerín, 5 June
1997. [AG]
Elío Simoni Casangeli, Chamber of Industry and Commerce secretary, interview,
Guayaramerín, 21 October 1997.
Gabriel Sosa Salvatierra, hospital director, interview, Guayaramerín, 22 October 1997.
Hernán “Cacho” Vargas Rivera, agro-industrialist, TV station owner and ADN chief,
interview, Guayaramerín, 21 October 1997.
Community and Grass-Roots Organizations
1o de Mayo: Dionisia Cuéllar Pérez, Emilse Choquere and Santiago Méndez, community
officers, interview, 1o de Mayo, 23 October 1997.
Cachuela Esperanza: Angélica Méndez de Languideiz, María Doris Soleto de Otubo and
Rodolfo Otubo Sánchez, community officer and oversight committee member,
community education officer, and community member, interview, Cachuela
Esperanza, 6 June 1997. [AG]
Guayaramerín: Rubén Darío Melgar Añez, neighborhood council president, interview,
Guayaramerín, 21 October 1997.
Porongo
Benedicto Bonilla Rojas, oversight committee president, interview, Porongo, 7 April
1997.
Felix Domínguez Parada, district director of education, interview, Porongo, 7 April
1997.
Fernando Muñoz Franco, Social Investment Fund departmental director, interview,
Santa Cruz, 5 April 1997.

Interview List
371
Hernán Gutiérrez Viveros and Rómulo Oyola Morales, chief administrative officer and
ex-mayor, and technical officer, interview, Porongo, 8 April 1997.
Martha Oyola Morales, Women’s Civic Committee president, interview, Porongo, 7
April 1997.
Silvio Rojas Aguilera, Ricardo Larachi and José Mario Bejarano Saucedo, mayor,
municipal council president (MIR) and municipal councilman (ADN), interview,
Porongo, 7 April 1997.
Roberto Saavedra Gutiérrez, municipal councilman (ADN), interview, Porongo, 10
April 1997.
Roberto Suárez, district doctor, interview, Porongo, 9 April 1997.
Community and Grass-Roots Organizations
Las Cruces: Walter Céspedes Montalván, community leader, interview, Las Cruces, 9
April 1997.
Nueva Palestina: Clemente Cerezo Vargas, community leader, interview, Nueva
Palestina, 10 April 1997.
Porongo: Aida Velazco Susano, neighborhood council president, interview, Porongo, 9
April 1997.
San Simón: Agrián Amador, community leader, interview, Terebinto, 10 April 1997.
Terebinto: Vicente Roca Menacho and Alejandro García Gutiérrez, community leader
and oversight committee member, and peasant’s union leader, interview, Terebinto, 10
April 1997.
Villa Guadalupe: Cecilia Bonilla, school association president, interview, Villa
Guadalupe, 8 April 1997.
Sipe Sipe [all AG]
Rogelio Durán, mayor and ex-municipal council president, interview, Sipe Sipe, 27 May
1997.
Justo Mercado Chávez, oversight committee president, interview, Sipe Sipe, 27 May
1997.
Alfredo Taja, municipal councilman and NGO head, interview, Quillacollo, 28 May
1997.

Interview List
372
Community and Grass-Roots Organizations
Mallco Rancho: Guillermo Saavedra Crespo, César Árnez Mondragón, Eduardo
Céspedes and Fernando Montán Árnez, community president, vice-president, officer,
and oversight committee vice-president, interview, Mallco Rancho, 28 May 1997.
Parotani: Demetrio Orellana, community leader, interview, Parotani, 27 May 1997.
Siquisiquía: Eduardo Ala, Celso Cuba and Andrés Cuba, community leader, spokesman
and officer, interview, Siquisiquía, 29 May 1997.
Urinsaya: Amadeo Cartajira, community leader, interview, Urinsaya, 29 May 1997.
Sucre
Alejandro Arancibia and Gladys Campos, district director of health and health district
manager, interview, Sucre, 15 April 1997.
Fernando Beltrán, FANCESA (cement company) general manager, interview, Sucre, 18
April 1997.
Juan José Bonifaz, general advisor to the prefect, interview, Sucre, 15 April 1997.
David Borda, Social Investment Fund departmental director, interview, Sucre, 14 April
1997.
Raimundo Candia, municipal general secretary (i.e. chief officer), interview, Sucre, 15
April 1997.
Raimundo Candia, municipal general secretary (in lieu of mayor), interview, Sucre, 17
April 1997.
Gregorio Corso, municipal education officer, interview, Sucre, 15 April 1997.
Jaime Gallo Garabinto, municipal councilman (MIR), interview, Sucre, 15 April 1997.
Samuel Montellano Aparicio, district director of education, interview, Sucre, 14 April
1997.
Sixto Rosas Venegas and Carlos Cors, oversight committee president and vice-president,
interview, Sucre, 16 April 1997.
Roxana Sarmiento, municipal planning and coordination officer, interview, Sucre, 15
April 1997.
René Subieta, municipal chief technical officer, interview, Sucre, 14 April 1997.
Juan Torrico, NGO director, interview, Sucre, 16 April 1997.
Alfredo Yáñez and Juan Carlos Sobut, Chamber of Commerce directors, interview,
Sucre, 16 April 1997.

Interview List
373
Community and Grass-Roots Organizations
Chuqui-Chuquí: Claudio Torres, community leader, interview, Chuqui-Chuquí, 18 April
1997.
Mojotoro: Juan Velabaruta, Esteban Copa, Felipe Sapana and Sabanio Fernández
Alanoca, community leader, community, ex-leader, and officer, interview, Mojotoro,
18 April 1997.
Potolo: Walter Encinas, community leader, interview, Potolo, 19 April 1997.
Sucre: Jorge Chaira Piuca and Marcial Javier Pérez, neighborhood council president and
education officer, interview, Sucre, 17 April 1997.
Sucre: Javier Tango Aramayo, neighborhood council president, interview, Sucre, 16
April 1997.
Viacha
Reynaldo Aguilar, district director of health, interview, Viacha, 10 October 1997.
Celestino Arauz, sub-prefecture general secretary (disputed), interview, Viacha, 9
October 1997.
Juan Carlos Blanco, CBN bottling plant director, interview, Viacha, 16 October 1997.
Edwin Callisaya, mayor, interview, Viacha, 18 March 1997.
José Luis Claros, CBN production supervisor, interview, Viacha, 21 March 1997.
Donato Cuéllar Cusi, Agapito Yujra, Manuel Colque and Carmelo Quispe, municipal
councilmen (all UCS), interview, Viacha, 15 October 1997.
Lt.Col. Adolfo Dávila Chacón, 1st Division, GADA 231 commander (local army
garrison), interview, Viacha, 19 March 1997.
Luis González, Social Investment Fund departmental director, interview and site visits,
Viacha, 17 March 1997.
Fr. Justino Limachi, parish priest, interview, Viacha, 16 October 1997.
Gladys Lozano, sub-prefect, interview, Viacha, 17 March 1997.
Maria Luisa Lucuy, district director of education, interview, Viacha, 15 October 1997.
Oscar Alfonso Magnani Meyta and Franklin Carlo Megillanes, district director of
education and education technician, interview, Viacha, 21 March 1997.
Rolando Marín Ibáñez, chief financial officer, interview, Viacha, 17 March 1997.
Max Mercado Mozo, federation of neighborhood councils (2) president, interview,
Viacha, 11 October 1997.

Interview List
374
Carlos Núñez, Sociedad Boliviana de Cementos (SOBOCE) financial director, interview,
Viacha, 19 March 1997.
Tomás Palacios Rodríguez, Condepa chief, interview, Viacha, 15 October 1997.
Luis Paz, Incerpaz CEO, interview, Viacha, 15 October 1997.
Huber Quintela Alarcón (a), municipal council president, interview, Viacha, 10 October
1997.
Huber Quintela Alarcón (b), MNR chief, interview, Viacha, 16 October 1997.
Huber Quintela Alarcón and Esteban Ticona, municipal councilmen (MNR and
Condepa), interview, Viacha, 18 March 1997.
Remigio Quispe Mendoza, Walter Patzi Paty and Nemesio Mamani Fernández,
oversight committee (1) president, federation of neighborhood councils (1) president
and federation officer respectively, interview, Viacha, 18 March 1997.
Jorge Rada, chief financial officer, interview, Viacha, 15 October 1997.
Edgar Robles, mayor, interview, Viacha, 10 October 1997.
Antonio Soto, MIR chief, interview, Viacha, 10 October 1997.
Esteban Ticona, municipal councilman, interview, Viacha, 9 October 1997.
Hipólito Tovar, Alejandro Yujra Laura and Rony Morales Quispe, oversight committee
(2) president, vice-president and officer, interview, Viacha, 19 May 1997.
Hipólito Tovar and Rony Morales Quispe, oversight committee (2) president and officer,
interview and site visits, Viacha, 21 May 1997.
Community and Grass-Roots Organizations
Canton Chama: Severo Guarachi Ramos, community officer, interview, Viacha, 17 May
1997.
District Five: Alicia Rodríguez, women’s leader, interview, Viacha, 17 May 1997.
District Six: Gerónimo Colque Velarde, community officer, interview, Viacha, 17 May
1997.
Názacara: Juan Laurel Hinojosa, Dona Francisca Plata de Maldonado, Julio Choque
Huanca and Jaime Gómez, community coordinator, community leader, education
officer and school director, interview, Názacara, 14 October 1997.
Rosapata: Marcelino Chuy Quenta, Cecilio Plata Flores, Teodoro Casita Ticona and
Daniel Mamani Churra, community leader, community education officer, school
teacher and school teacher, interview, Rosapata, 14 October 1997.

Interview List
375
Santa Ana de Machaqa: Francisco Juliano Paz, community officer, interview, Viacha, 18
March 1997.
Santa Ana de Machaqa: José Quezo Cusi, Lorenzo Julián and Olga Cusi de Julián,
community leader, teacher and electoral notary, and Plan Internacional liaison,
interview, Santa Ana de Machaqa, 23 March 1997.
Titik’ana Tacaca: Genaro Mamani Chiri, Gumercindo Vito Guarachi, Saturnino Tola
Mamani, and Doroteo Callisaya Mamani, community leader, district officer,
representative to the Federation of Ayllus and indigenous communities of Ingavi
Province (FACOPI), and community officer, interview, Titik’ana Takaka, 20 March
1997.
Viacha: Simon Canavi Rojas, community officer, interview, Viacha, 17 May 1997.
Villa Santiago de Chacoma: Eulogio Choque and Valentín Atahuichi Callisaya, cantonal
officer and community construction officer, interview, Villa Santiago de Chacoma, 11
October 1997.
National
Gonzalo Aguirre, congressional representative (MBL), interview, La Paz, 30 September
1997.
Joaquín Aramburo, Social Investment Fund regional director, interview, La Paz, 25
February 1997.
Eduardo Araujo, Social Investment Fund director of project implementation, interview,
La Paz, 18 February 1997.
Rodolfo Araujo, coordination secretary, Ministry of the Presidency, interview, La Paz,
25 February 1997.
Rubén Ardalla, officer, Democratic Development and Citizen’s Participation, interview,
La Paz, 21 February 1997.
Percy Bacareza, information officer, National Secretariat of Rural Development,
Ministry of Human Development, interview, La Paz, 2 October 1997.
Mauricio Balcázar, director of Encuestas y Estudios (polling company) and ex-minister
of communications, interview, La Paz, 13 october 1997.
Amparo Ballivian, World Bank economist, interview, La Paz, 18 February 1997.
Erika Brockmann, senator (MIR), interview, La Paz, 6 October 1997.
Fernando Cajías, ex-prefect (La Paz), interview, La Paz, 25 February 1997.
Ricardo Calla, researcher, interview, La Paz, 7 March 1997.

Interview List
376
Juan Carlos Franco, Social Investment Fund regional director, interview, La Paz, 28
February 1997.
Manuel Contreras, Catholic University Public Policy Program director, interview, La
Paz, 5 March 1997.
Jorge Dockweiler, municipal councilman (La Paz), interview, La Paz, 5 November 1997.
Luis González, Social Investment Fund departmental director, interview, La Paz, 5
March 1997.
Armando Godínez, anthropologist, numerous conversations, La Paz, February - May and
September – November 1997.
George Gray-Molina, UDAPSO sub-director, interview, La Paz, 17 February 1997.
Paulino Guarachi, sub-secretary of rural development, Ministry of Human Development,
interview, La Paz, 6 March 1997.
Enrique Ipiña, ex-minister of human development and ex-secretary of education,
interview, La Paz, 26 February 1997.
Mauricio Lea Plaza, director of participative planning, Ministry of Human Development,
interview, La Paz, 29 September 1997.
Alberto Leytón, director of public investment, Ministry of Economic Development,
interview, La Paz, 6 May 1997.
Alberto Leytón, sub-secretary of public investment, Ministry of Economic Development,
interview, La Paz, 23 September 1997.
Eduardo Mac Lean, municipal adviser (La Paz), interview, La Paz, 21 February 1997.
Fernando Medina, sub-secretary of popular participation, Ministry of Human
Development, interview, La Paz, 5 May 1997.
Fernando Medina, sub-secretary of popular participation, Ministry of Human
Development, interview, La Paz, 25 September 1997.
Javier Medina, officer, Secretariat of Rural Development, interview, La Paz, 6 March
1997.
Carlos Hugo Molina, secretary of popular participation, interview, La Paz, 10 March
1997.
Rodney Pereira, UDAPE researcher and universiity professor, interview, La Paz, 25
February 1997.
Javier Reyes, director of public investment, Ministry of Economic Development,
interview, La Paz, 5 November 1997.

Interview List
377
Gonzalo Rojas, director for investment and analysis, Secretariat of Popular Participation,
interview, La Paz, 27 February 1997.
Freddy Teodovitch, senator, interview, La Paz, 6 November 1997.
Carlos Toranzo, economist, ILDIS (research foundation), interview, La Paz, 3 March
1997.
Enrique Toro, ADN national chief, interview, La Paz, 16 October 1997.
Javier Torres Goitia, sub-secretary of health, interview, La Paz, 13 October 1997.
David Tuchschneider, World Bank rural development officer, interview, La Paz, 14
February 1997.
David Tuchschneider, World Bank rural development officer, interview, La Paz, 3 May
1997.
Miguel Urioste, congressional representative and MBL party leader, interview, La Paz, 3
October 1997.
Jorge Urquidi, general adviser to the prefect, interview, La Paz, 13 October 1997.
N.B. [AG] denotes interviews conducted by Armando Godínez, anthropologist and
assistant researcher.

Bibliography
.
378
Bibliography
Albó, X. 1990. Los Guaraní-Chiriguano: La Comunidad Hoy. La Paz: CIPCA.
Albó, X., A. Godínez, K. Libermann and F. Pifarré. 1990. Para Comprender Las
Culturas Rurales en Bolivia. 2d ed. La Paz: MEC/CIPCA/UNICEF.
Alchian, A. and H. Demsetz. 1972. “Production, Information Costs and Economic
Organization.” American Economic Review, 62:777-95.
Alesina, A. and N. Roubini. 1992. “Political Cycles in OECD Economies.” Review of
Economic Studies, LIX:663-88.
Alt, J. E. and K. A. Shepsle. (eds.). 1990. Perspectives on Positive Political Economy.
New York: Cambridge University Press.
Andersson, A., B. Harsman, and J. Quigley. (eds.). 1997. “Government for the Future:
Unification, Fragmentation and Regionalism.” Contributions to Economic Analysis,
238. Amsterdam: Elsevier.
Antezana E., L. 1979. Proceso y Sentencia a la Reforma Agraria en Bolivia. La Paz:
Los Amigos del Libro.
Arce, T. and P. Rossell. (eds.). 1995. Hacia Una Propuesta Indígena de
Descentralización del Estado. (CPIB/CIDDEBENI) La Paz: Artes Gráficas Latina.
Ardaya, R. 1996. La Construcción Municipal de Bolivia. La Paz: Editora Ateneo.
Atkinson, A. B. and J.E. Stiglitz. 1980. Lectures on Public Economics. London:
McGraw-Hill.
Austen-Smith, D. and J. Banks. 1989. “Electoral Accountability and Incumbency.” In P.
Ordeshook (ed.), Models of Strategic Choice in Politics. Ann Arbor: Michigan
University Press.
Axelrod, R. 1984. The Evolution of Cooperation. New York: Basic Books.
Bardhan, P. 1996. “The Economics of Decentralisation.” Berkeley: Manuscript.
2000. “The Nature of Institutional Impediments to Economic Development.” In M.
Olson and S. Kahkonen (eds.), A Not-So-Dismal-Science: A Broader View of
Economies and Societies. New York: Oxford University Press.
2001. “Notes on Decentralization.” Berkeley: Manuscript.
Bardhan, P. and D. Mookherjee. 1998. “Expenditure Decentralization and the Delivery
of Public Services in Developing Countries.” Working Paper No. C98-104.
Berkeley: Center for International and Development Economics Research.

Bibliography
.
379
1999. “Relative Capture of Local and Central Governments: An Essay in the Political
Economy of Decentralization.” Berkeley: Manuscript.
Becker, G. 1983. “A Theory of Competition Among Pressure Groups For Political
Influence.” Quarterly Journal of Economics, 98:329-47.
Bennett, R. J. (ed.). 1990. Decentralization, Local Governments and Markets: Towards a
Post-Welfare Agenda. Oxford: Clarendon Press.
Bentley, A. F. 1907. The Process of Government. Chicago: University of Chicago Press.
Ben-Zion, U. and Z. Eytan. 1974. “On Money, Votes, and Policy in a Democratic
Society.” Public Choice, 17:1-10.
Bergstrom, T. and R. Goodman, 1973. “Private Demand for Public Goods.” American
Economic Review, 63:280-96.
Besley, T. and A. Case. 1995a. “Does Electoral Accountability Affect Economic Policy
Choices? Evidence from Gubernatorial Term Limits.” Quarterly Journal of
Economics, 110:769-98.
1995b. “Incumbent Behavior: Vote-Seeking, Tax-Setting, and Yardstick
Competition.” American Economic Review, 85:25-45.
Besley, T. and S. Coate. 1991. “Public Provision of Private Goods and the Redistribution
of Income.” American Economic Review, 81:979-84.
1995. “Efficient Policy Choice in a Representative Democracy: A Dynamic Analysis.”
Working Paper: 95/10. Philadelphia: Center for Analytic Research in Economics and
Social Science (CARESS), University of Pennsylvania.
1997. “An Economic Model of Representative Democracy.” Quarterly Journal of
Economics, 112:85-114.
1999. “Centralized versus Decentralized Provision of Local Public Goods: A Political
Economy Analysis.” NBER Working Paper 7084. Cambridge, MA: National
Bureau of Economic Research.
Bewley, T. 1981. “A Critique of Tiebout’s Theory of Local Public Expenditure.”
Econometrica, 49:713-39.
Bird, R. 1994. “Decentralizing Infrastructure: For Good or Ill?” Policy Research
Working Paper 1258. Washington DC: World Bank.
Black, D. 1948. “On the Rationale of Group Decision Making.” Journal of Political
Economy, 56:23-34.
Bibliography
.
380
Blanchard, O. and A. Shleifer. 2000. “Federalism with and without Political
Centralization: China versus Russia.” NBER Working Paper 7616. Cambridge,
MA: National Bureau of Economic Research.
Bolton, P. and J. Farrell. 1990. “Decentralization, Duplication and Delay.” Journal of
Political Economy, 98:803-26.
Boone, P. and J.P. Faguet. 1998. “Multilateral Aid, Politics and Poverty: Past Failures
and Future Challenges”, chapter 2 in R. Grant and J. Nijman (eds.). The Global
Crisis in Foreign Aid, Syracuse: Syracuse University Press, 11-26.
Brady, H. E., S. Verba, and K. L. Schlozman. 1995. “Beyond SES: A Resource Model
of Political Participation.” American Political Science Review, 89:271-94.
Brennan, G. and J. M. Buchanan. 1984. “Voter Choice: Evaluating Political
Alternatives.” American Behavioral Scientist, 28:185-201.
Breton, A. and G. Galeotti. 1985. “Is Proportional Representation Always the Best
Electoral Rule?” Public Finance, 40:1-16.
Brett, E. A. 1993a. “Participation Why & When? The Costs and Benefits of Democratic
Processes.” London School of Economics: Manuscript.
1993b. “Voluntary Agencies as Development Organizations: Theorizing the Problem
of Efficiency and Accountability.” Development and Change, 24: 269-303.
1995a. “Adjustment Policy and Institutional Reform in Uganda.” In E. A. Brett, J.
Munene, J. Katorobo and P. Langseth (eds.), Uganda: Landmarks in Rebuilding a
Nation. Kampala: Fountain Press.
1995b. “Creating the Basis for Democratic Transition in Uganda, The Problem of
Governance.” In E. A. Brett, J. Munene, J. Katorobo and P. Langseth (eds.),
Uganda: Landmarks in Rebuilding a Nation. Kampala: Fountain Press.
Buchanan, J. M. And R. D. Tollison. (eds.). 1984. The Theory of Public Choice – II.
Ann Arbor: University of Michigan Press.
Buhlens, C. 1994. In Medina, J. (ed.), Arakuarenda: Un Centro Intercultural de
Capacitación Para el Desarrollo Guaraní. Arakuarenda/FIS: La Paz.
Burns, D., R. Hambleton and P. Hogget. 1994. The Politics of Decentralization:
Revitalizing Local Gvernment. London: Macmillan.
Cajías de la Vega, F. 1996. Competencias del Ejecutivo Municipal, del Consejo
Municipal y de los Comites de Vigilancia. La Paz: ILDIS - Friedrich Ebert Steifung.

Bibliography
.
381
Calderón G. F. and R. Laserna. 1995. Paradojas de la Modernidad. La Paz: CERES -
Fundación Milenio.
Campbell, T. 2001. The Quiet Revolution: The Rise of Political Participation and
Leading Cities with Decentralization in Latin America and the Caribbean.
Pittsburgh: University of Pittsburgh Press.
Cebula, R. J. 1979. The Determinants of Human Migration. Lexington, MA: Lexington
Books.
Cebula, R. J. and M. Z. Kafoglis. 1986. “A Note on the Tiebout-Tullock Hypothesis:
The Period 1975-1980.” Public Choice, 48:65-9.
Cheema, G. S. and D. A. Rondinelli. (eds.). 1983. Decentralization and Development:
Policy Implementation in Developing Countries. Beverly Hills: Sage Publications.
Clague, C. 1997a. “The New Institutional Economics and Economic Development.” In
C. Clague (ed.), Institutions and Economic Development: Growth and Governance
in Less-Developed and Post-Socialist Countries. Baltimore: Johns Hopkins
University Press.
1997b. “The New Institutional Economics and Institutional Reform.” In C. Clague
(ed.), Institutions and Economic Development: Growth and Governance in Less-
Developed and Post-Socialist Countries. Baltimore: Johns Hopkins University Press.
Coase, R. 1937. “The Nature of the Firm.” Economica, 4:386-405.
1960. “The Problem of Social Cost.” Journal of Law and Economics, 3:1-44.
Coleman, J. 1990. Foundations of Social Theory. Cambridge, MA: Harvard University
Press.
Condorcet, M. de. 1785. Essai sur l’Application de l’Analyse à la Probabilité des
Décisions rendues à la Pluraliste des Voix. Paris: 1785.
Conyers, D. 1984. “Decentralization and Development: A Review of the Literature.”
Public Administration and Development, 4: 197-97.
Cooter, R. D. 2000. “Law from Order: Economic Development and the Jurisprudence of
Social Norms.” In M. Olson and S. Kahkonen (eds.), A Not-So-Dismal-Science: A
Broader View of Economies and Societies. New York: Oxford University Press.
Corte Nacional Electoral (Dirección de Informática). Estadística de Votación Absoluta:
Elecciones Municipales de 1993 y 1995. Database. La Paz.
Crespo, A. 1981. Los Aramayo de Chichas: Tres Generaciones de Mineros Bolivianos.
Barcelona: Editorial Blume.

Bibliography
.
382
Crook, R. C. and J. Manor. 1994. “Enhancing Participation and Institutional
Performance: Democratic Decentralization in South Asia and West Africa.” London:
Overseas Development Administration.
Crook, R.C. and A.S. Sverrisson. 1999. “To What Extent Can Decentralized Forms of
Government Enhance the Development of Pro-Poor Policies and Improve Poverty-
Alleviation Outcomes?” Manuscript.
Davis O. A., M. H. DeGroot and M. J. Hinich. 1972. “Social Preference Orderings and
Majority Rule.” Econometrica, 40:147-57.
De Mello, L. 2000. “Can Fiscal Decentralization Strengthen Social Capital?” IMF
Working Paper WP/00/129. Washington, DC: International Monetary Fund.
Dahl, R. 1971. Polyarchy: Participation and Opposition. New Haven: Yale University
Press.
1989. Democracy and Its Critics. New Haven: Yale.
Dillinger, W. and S. B. Webb. 1999. “Decentralization and Fiscal Management in
Colombia.” Policy Research Working Paper 2122. Washington, DC: World Bank.
Dixit, A. 1995. “Common Agency and Incentives in Government Bureaucracies.”
Princeton: Manuscript.
Downs, A. 1957. An Economic Theory of Democracy. New York: Harper and Row.
Dryzek, J. S. 1996. “Political Inclusion and the Dynamics of Decentralization.”
American Political Science Review, 90:475-87.
Dunkerley, J. 1984. Rebellion in the Veins: Political Struggle in Bolivia 1952-82.
London: Verso.
1990. “Political Transition and Economic Stabilization: Bolivia 1982-1989.” London:
Institute of Latin American Studies.
Estache, A. (ed.). 1995. “Decentralizing Infrastructure: Advantages and Limitations.”
World Bank Discussion Paper 290. Washington, DC: World Bank..
Estache, A. and S. Sinha. 1995. “Does Decentralization Increase Spending on Public
Infrastructure?” Policy Research Working Paper 1457. Washington, DC: World
Bank.
Faguet, J.P. 2000. “Decentralization and Local Government Performance: Improving
Public Service Provision in Bolivia”, Revista de Economía del Rosario, 3(1): 127-
176.

Bibliography
.
383
Faguet, J.P. 2001. “Does Decentralization Increase Responsiveness to Local Needs?
Evidence from Bolivia.” World Bank Policy Research Working Paper No. 2516.
Faguet, J.P. 2002. “Designing Effective Social Funds for a Decentralized Context.”
World Bank Social Protection Discussion Paper.
Finer, S. E. 1980. The Changing British Party System 1945-1979. Washington, DC:
American Enterprise Institute for Public Policy Research.
1997. The History of Government from the Earliest Times. Oxford: Oxford University
Press.
Fisman, R. and R. Gatti. 2000 . “Decentralization and Corruption: Evidence across
Countries.” Working Paper No. 2290. Washington, DC: World Bank.
Galasso, E. and M. Ravallion. 2000. “Distributional Outcomes of a Decentralized
Welfare Program.” Washington, DC: Manuscript.
Gibbons, R. 1992. A Primer in Game Theory. Hemel Hempstead: Harvester Wheatsheaf.
Giddens, A. 1971. Capitalism and Modern Social Theory. Cambridge: Cambridge
University Press.
Girishankar, N. 1998. “Reforming Institutions for Service Delivery: A Framework for
Development Assistance with an Application to the Health, Nutrition, and
Population Portfolio.” Working Paper No. 2039. Washington, DC: World Bank.
Gonzales-Arana, G. 1992. El Proceso de Descentralisación Administrativa en Bolivia.
La Paz: Los Amigos del Libro.
Goodin, R. E. “Institutionalizing the Public Interest: The Defense of Deadlock and
Beyond.” American Political Science Review, 90:331-43.
Gray, G. and C. H. Molina. 1997. “Popular Participation and Decentralization in Bolivia:
Building Accountability From the Grass Roots.” La Paz: Manuscript.
Greene, W. 1997. Econometric Analysis. Upper Saddle River: Prentice Hall.
Grupo DRU, Unidad de Investigación y Analisis, Secretaría Nacional de Participación
Popular. 1996. Participación Popular: Avances y Obstáculos. G. Rojas. (ed.). La
Paz: CID.
Hanson, R. L. and J. T. Hartman. 1994. “Do Welfare Magnets Attract?” Madison:
Institute for Research on Poverty, University of Wisconsin at Madison.
Hart, O. 1995. Firms, Contracts and Financial Structure. New York: Oxford University
Press.

Bibliography
.
384
Hartmann, F. 1998. “Land Reform and Social Capital, Their Roles in Social and
Economic Development: A Case Study of Rural Bolivia.” M.Sc. dissertation.
London School of Economics.
Healey, K. 1987. Caciques y Patrones: Una Experiencia de Desarrollo Rural en el Sud
de Bolivia. 3d ed. Cochabamba: CERES.
Heckman, J. and J. Snyder. 1997. “Linear Probability Models of the Demand for
Attributes With An Empirical Application to Estimating the Preferences of
Legislators.” RAND Journal of Economics, 28:S142-89.
Hegel, G. W. F. 1996. Philosophy of Right. trans. S.W. Dyde. Amherst: Prometheus
Books.
Hirschman, A. O. 1970. Exit, Voice and Loyalty. Cambridge, MA: Harvard University
Press.
Hobbes, T. 1996. Leviathan. R. Tuck (ed.). Cambridge: Cambridge University Press.
Hotelling, H. 1929. “Stability in Competition.” Economic Journal, 39:41-57.
Hoy. “Injertos Tramposos en ‘Participación Popular’.” 19 January 1994.
Humplick, F. and A. Moini-Araghi. 1996. “Decentralized Structures for Providing
Roads: A Cross-Country Comparison.” Policy Research Working Paper 1658.
Washington, DC: World Bank.
Huther, J. and A. Shah. 1998. “Applying a Simple Measure of Good Governance to the
Debate on Fiscal Decentralization.” Policy Research Working Paper 1894.
Washington, DC: World Bank.
Inman, R. P. 1979. “The Fiscal Performance of Local Governments: An Interpretative
Review.” In P. Mieszkowski and M. Straszheim (eds.), Current Issues in Urban
Economics. Baltimore: Johns Hopkins University Press.
Inman, R. P. and D. L. Rubinfeld. 1997. “Rethinking Federalism.” Journal of Economic
Perspectives, 11:43-64.
Instituto Nacional de Estadística. 1992. Censo Nacional de Población y Vivenda. La Paz:
INE.
Jackson, J. E. 1991. A User’s Guide to Principal Components. New York: John Wiley &
Sons.
Kramer, G. H. 1973. “On a Class of Equilibrium Conditions for Majority Rule.”
Econometrica, 41:285-97.

Bibliography
.
385
King, G., R. Keohane and S. Verba. 1994. Designing Social Inquiry: Scientific Inquiry in
Qualitative Research. Princeton: Princeton University Press.
Klein, H. 1982. Bolivia - The Evolution of a Multi-ethnic Society. Oxford: Oxford
University Press.
1993. Historia de Bolivia. La Paz: Libreria-Editorial Juventud.
La Razon. “La Declaratoria de Guerra del Primer Mandatario.” 27 January 1994.
La Razon. “Participación Popular: Se Democratiza la Corrupción?.” 6 March 1994.
Lazarte, J. 1990. Bolivia: Certeza e Incertidumbres de la Democracia. Cochabamba:
CERES.
Lichbach, M. 1994. “What Makes Rational Peasants Revolutionary? Dilemma, Paradox,
and Irony in Peasant Collective Action.” World Politics, 46:383-418.
Lowery, D. and V. Gray. 1998. “The Dominance of Institutions in Interest
Representation: A Test of Seven Explanations.” American Journal of Political
Science, 42:231-55.
Maddala, G. S. 1977. Econometrics. New York, London: McGraw-Hill.
Madison, J., A. Hamilton and J. Jay. 1961. The Federalist Papers. New York: New
American Library.
Malloy J. M. and R. S. Thorn. (eds.). 1971. Beyond the Revolution: Bolivia since 1952.
Pittsburgh: University of Pittsburgh Press.
Manor, J. 1997. Lecture given at “Technical Consultation on Decentralization for Rural
Development.” Rome, 16-18 December 1997.
1999. The Political Economy of Democratic Decentralization. Washington, DC: The
World Bank
Medina, J. (ed.). 1994. Arakuarenda: Un Centro Intercultural de Capacitación Para el
Desarrollo Guaraní. Arakuarenda/FIS: La Paz.
Migdal, J. S., A. Kohli and V. Shue. 1994. State Power and Social Forces. Cambridge:
Cambridge University Press.
Ministerio de la Presidencia. 1997. Comportamiento Electoral de la Población Boliviana
1993-1997. La Paz: W Producciones SRL.
Mill, J.S. 1993.Utilitarianism; On Liberty; Considerations on Representative
Government; Remarks on Bentham's Philosophy. G. Williams (ed.). London:
Everyman.

Bibliography
.
386
Moe, T. M. 1984. “The New Economics of Organization.” American Journal of Political
Science, 28: 739-77.
1989. “The Politics of Bureaucratic Structure.” In J. E. Chubb and P. E. Petersen
(eds.), Can the Government Govern?. Washington, DC: The Brookings Institution.
1995. “The Politics of Structural Choice: Toward a Theory of Public Bureaucracy.” In
O.E.Williamson (ed.), Organizational Theory: From Chester Barnard to the Present
and Beyond. Expanded Edition. New York: Oxford University Press.
Molina Monasterios, F. 1997. Historia de la Paticipación Popular. La Paz: Ministerio
de Desarrollo Humano - Secretaría Nacional de Participación Popular.
Montesquieu, Baron de (C de Secondat). 1989. The Spirit of the Laws. trans. A. M.
Cohler, B. C. Miller and H. Stone. Cambridge: Cambridge University Press.
Mueller, D. 1989. Public Choice II. Cambridge: Cambridge University Press.
Musgrave, R. A. 1959. The Theory of Public Finance. New York: McGraw-Hill.
Narayan, D. and K. Ebbe. 1997. “Design of Social Funds – Participation, Demand
Orientation and Local Organizational Capacity.” Discussion Paper No. 375.
Washington, DC: World Bank.
Narayan, D. and L. Pritchett. 1997. “Cents and Sociability: Household Income and
Social Capital in Rural Tanzania.” Policy Research Working Paper 1796.
Washington, DC: World Bank.
Nickson, R. A. 1995. Local government in Latin America. Boulder: L. Rienner.
Niemi, R. G. 1969. “Majority Decision-Making with Partial Unidimensionality.”
American Political Science Review, 63:488-97.
Niskanen, W. A. Jr. 1971. Bureaucracy and Representative Government. Chicago:
Aldine-Atherton.
North, D. C. 1990. Institutions, Institutional Change and Economic Performance.
Cambridge: Cambridge University Press.
1994. “Economic Performance Through Time.” American Economic Review, 84:359-
68.
Oates, W. 1972. Fiscal Federalism. New York: Harcourt Brace.
Oliver, J. E. 1999. “The Effects of Metropolitan Economic Segregation on Local Civic
Participation.” American Journal of Political Science, 43:186-212.
Olson, M. 1965. The Logic of Collective Action. Cambridge, MA: Harvard University
Press.

Bibliography
.
387
1982. The Rise and Decline of Nations. New Haven: Yale University Press.
1997. “The New Institutional Economics and Economic Development.” In C. Clague
(ed.), Institutions and Economic Development: Growth and Governance in Less-
Developed and Post-Socialist Countries. Baltimore: Johns Hopkins University Press.
2000a. “Big Bills Left on the Sidewalk: Why Some Nations Are Rich, and Others
Poor.” In M. Olson and S. Kahkonen (eds.), A Not-So-Dismal-Science: A Broader
View of Economies and Societies. New York: Oxford University Press.
2000b. Power and Prosperity: Outgrowing Communist and Capitalist Dictatorships.
New York: Basic Books.
Olson, M. and S. Kahkonen. 2000. “Introduction: The Broader View.” In M. Olson and
S. Kahkonen (eds.), A Not-So-Dismal-Science: A Broader View of Economies and
Societies. New York: Oxford University Press.
Ostrom, E., L. Schroeder and S. Wynne. 1993. Institutional Incentives and Sustainable
Development: Infrastructure Policies in Perspective. Boulder: Westview Press.
Pagaran, L. N. 1999. “The Social Fund, the Local Development Fund, and
Decentralization: The Case of Cambodia.” Manuscript.
Palda, K. F. and K. S. Palda. 1985. “Ceilings on Campaign Spending: Hypothesis and
Partial Test With Canadian Data.” Public Choice, 45:313-31.
Pande, R. 1999. “Minority Representation and Policy Choices: The Significance of
Legislator Identity.” Development Economics Discussion Paper No.16. London:
STICERD, London School of Economics.
Parker, A. 1995. “Decentralization: The Way Forward for Rural Development?” Policy
Research Working Paper 1475. Washington, DC: World Bank.
Persson, T. and G. Tabellini. 1996. “Federal Fiscal Constitutions: Risk Sharing and
Redistribution.” Journal of Political Economy,104:979-1009.
1998. “Political Economics and Public Finance.” Manuscript prepared for the
Handbook of Public Economics, Vol. III.
Persson, T., G. Roland and G. Tabellini. 1997. “Separation of Powers and Political
Accountability.” Working Paper No.136. Munich: Center for Economic Studies,
University of Munich.
Pifarré, F. 1989. Los Guaraní-Chiriguano: Historia de un Pueblo. La Paz: CIPCA.
Piketty, T. 1994. “Information Aggregation Through Voting and Vote-Trading.”
Cambridge, MA: Manuscript.

Bibliography
.
388
1995. “Voting as Communicating.” Cambridge, MA: Manuscript.
Piketty, T. and D. Spector. 1995. “Rational Debate Leads to One-Dimensional Conflict”.
Manuscript.
Piriou-Sall, S. 1998. “Decentralization and Rural Development: A Review of Evidence.”
Washington, DC: Manuscript.
Pommerehne, W.W. and F. Schneider. 1978. “Fiscal Illusion, Political Institutions, and
Local Public Spending.” Kyklos, 31:381-408.
Poole, K. T. and T. Romer. 1985. “Patterns of Political Action Committee Contributions
to the 1980 Campaigns for the United States House of Representatives.” Public
Choice, 47:63-111.
Presencia. “Arrogancia Insultante.” 27 February 1994.
Presencia. “Los vecinos viacheños marchan hoy para que se vaya su Alcalde.” 22 March
1997.
Prud’homme, R. 1995. “On the Dangers of Decentralization.” World Bank Research
Observer, 10:210-26
Putnam, R. D. 1993. Making Democracy Work: Civic Traditions in Modern Italy.
Princeton: Princeton University Press.
2000. Bowling Alone: The Collapse and Revival of American Community. New York:
Simon & Schuster.
Reflejos de la Semana. Issue 368. “Participación Popular: Se Cierne La Tormenta.”
14-21 January 1994.
Rejas S. J. 1992. El Campesinado y su Insercion en el Mercado. Cuzco: Centro de
Estudios Regionales Andinos “Bartolome de las Casas”.
Riker, W. H. and P. C. Ordeshook. 1973. An Introduction to Positive Political Theory.
Englewood Cliffs: Prentice Hall.
Roca, J. L. 1990. Fisonomía del Regionalismo Boliviano. La Paz: Los Amigos del Libro.
Rodriguez O., G. 1993. Poder Central y Proyecto Regional: Cochabamba y Santa Cruz
en los Siglos XIX y XX. La Paz: IDAES – ILDIS.
Rojas, G. And L. Verdesoto. 1997. La Participación Popular como Reforma de la
Política: Evidencia de una Cultura Democrática Boliviana. La Paz: Muela de
Diablo.

Bibliography
.
389
Rondinelli, D. A. 1981. “Government Decentralization in Comparative Perspective:
Theory and Practice in Developing Countries.” International Review of
Administrative Sciences, 47:133-45.
1990. “Decentralization, Territorial Power and the State: A Critical Response.”
Development and Change, 21:491-500.
Rondinelli, D. A., G. S. Cheema and J. Nellis. 1983. “Decentralization in Developing
Countries: A Review of Recent Experience.” World Bank Staff Working Paper
No.581. Washington, DC: World Bank.
Rondinelli, D. A., J. S. McCullough and R. W. Johnson. 1989. “Analysing
Decentralization Policies in Developing Countries: A Political Economy
Framework.” Development and Change, 20:57-87.
Rousseau, J. J. 1964. The First and Second Discourses. R. D. Masters (ed.). trans.
R. D. and J. R. Masters. New York: St. Martin’s Press.
1978. On the Social Contract. R. D. Masters (ed.). trans. J. R. Masters. New York: St.
Martin’s Press.
Rubinfeld, D. 1987. “The Economics of the Local Public Sector.” In Auerbach, A. and
M. Feldstein (eds.), Handbook of Public Economics. Oxford: North-Holland.
Rubinfeld, D., P. Shapiro and J. Roberts. 1987. “Tiebout Bias and the Demand for Local
Public Schooling.” Review of Economics and Statistics, 69:426-37.
Ruiz, F. and B. Giussani. 1997. “La Descentralización y el Financiamiento de la
Provisión de Servicios de Educación y Salud en Bolivia.” La Paz: Manuscript.
Samoff, J. 1990. “Decentralization: The Politics of Interventionism.” Development and
Change, 21:513-30.
Schlesinger, J. A. 1984. “On the Theory of Party Organization.” The Journal of Politics,
46:369-400.
Schumpeter, J. A. 1950. Capitalism, Socialism and Democracy. 3d ed. New York:
Harper and Row.
Seabright, P. 1996. "Accountability and Decentralisation in Government: An Incomplete
Contracts Model.” European Economic Review, 40:61-89.
Secretaría Nacional de Inversión Pública y Financiamento Externo. 1997. Censo
Municipal. La Paz.

Bibliography
.
390
Secretaría Nacional de Participación Popular, Ministerio de Desarrollo Sostenible y
Medio Ambiente, 1994. Ley de Participación Popular, Reglamento de las
Organizaciones Territoriales de Base. La Paz.
1997. Matriz Resumen de las Auditorías SAYCO Practicadas en Gobiernos
Municipales Categoría "C" (Pob. Mayor a 15,000 y Menor a 50,000 Hab.)
Efectuados a la Fecha. La Paz.
Selbin, E. 1993. Modern Latin American Revolutions. Boulder: Westview Press.
Sen, A. 1995. “Rationality and Social Choice.” American Economic Review, 85: 1-24.
Shah, A. 1994. “The Reform of Inter-Governmental Fiscal Relations in Developing and
Emerging Market Economies.” Policy and Research Series Paper 23. Washington
DC: World Bank.
1998a. “Fiscal Federalism and Macroeconomic Governance: For Better or for
Worse?” Policy Research Working Paper 2005. Washington DC: World Bank.
1998b. “Balance, Accountability and Responsiveness: Lessons about
Decentralization.” Policy Research Working Paper 2021. Washington DC: World
Bank.
Shepsle, K. A. 1979. “Institutional Arrangements and Equilibrium in Multidimensional
Voting Models.” American Journal of Political Science, 23:27-59.
1986. “Institutional Equilibrium and Equilibrium Institutions.” In H. Weisberg (ed.),
Political Science: The Science of Politics. New York: Agathon Press.
Simon, H. 1957. Administrative Behavior. 2d ed. New York: Macmillan.
Slater, D. 1989. “Territorial Power and the Peripheral State: The Issue of
Decentralization.” Development and Change, 20:501-31.
Smith, B.C. 1985. Decentralization: The Territorial Dimension of the State. London:
George Allen & Unwin.
Smoke, P. 2001. “Fiscal Decentralization in Developing Countries: A Review of Current
Concepts and Practice.” Democracy, Governance and Human Rights Programme
Paper No. 2. Geneva: UNRISD.
Tanzi, V. 1995. “Fiscal Federalism and Decentralization: A Review of Some Efficiency
and Macroeconomic Aspects.” Annual World Bank Conference on Development
Economics. Washington, DC: World Bank.

Bibliography
.
391
Tarrow, S. 1996. “Making Social Science Work Across Space and Time: A Critical
Reflection on Robert Putnam’s Making Democracy Work.” American Political
Science Review, 90:389-97.
Tendler, J. 1997. Good Government in the Tropics. Baltimore: Johns Hopkins University
Press.
Ticona Alejo, E. and X. Albó. 1997. Jesús de Machaqa: La Marka Rebelde 3. La Lucha
Por el Poder Comunal. La Paz: CIPCA/CEDOIN.
Ticona Alejo, E., G. Rojas and X. Albó. 1995. Votos y Wiphalas: Campesinos y Pueblos
Originarios en Democracia. La Paz: Fundación Milenio - CIPCA.
Tiebout, C. M. 1956. “A Pure Theory of Local Expenditures.” Journal of Political
Economy, 64:416-24.
Tocqueville, A. de. 1969. Democracy in America. J. P. Mayer (ed.). trans. G. Lawrence.
Garden City: Anchor Books.
Toranzo, C. F. 1994. Reflexiones sobre la Descentralización. La Paz: ILDIS-PROADE.
Toranzo, C. F. and J. L. Exeni (eds.). 1994. Las IPDS (Instituciones Privadas de
Desarrollo Social) y la Descentralización: Una Relación Necesaria. La Paz:
NOVIB-Bolivia and ILDIS.
Treisman, D. 1999. “Political Decentralization and Economic Reform: A Game-
Theoretic Analysis.” American Journal of Political Science, 43: 488-517.
Truman, D. 1951. The Governmental Process: Political Interests and Public Opinion.
New York: Knopf.
Tuchschneider, D. 1996. “Una Visión desde la Planificación Participativa Municipal.” In
Grupo DRU, UIA-SNPP. Participación Popular: Avances y Obstáculos. G. Rojas.
(ed.). La Paz: CID.
Tullock, G. 1965. The Politics of Bureaucracy. Washington, DC: Public Affairs Press.
Unidad de Comunicación, Secretaría Nacional de Participación Popular. 1995. Debate
Nacional sobre la Ley de Participación Popular. La Paz: Secretaría Nacional de
Participación Popular.
United Nations Development Program (UNDP). 1993. Informe Sobre Desarrollo
Humano 1993. Madrid: CIDEAL.
van Zyl, J., T. Barbosa, A. N. Parker and L. Sonn. 1995. “Decentralized Rural
Development and Enhanced Community Participation: A Case Study from

Bibliography
.
392
Northeast Brazil.” Policy Research Working Paper 1498. Washington, DC: World
Bank.
Varian, H. 1992. Microeconomic Analysis 3d ed. New York: W.W.Norton & Co., Inc.
Verba, S., K. Lehman, H. Brady and N. H. Nie. 1993. “Citizen Activity: Who
Participates? What do They Say?” American Political Science Review, 87: 303-18.
Verba, S., K. Schlozman and H. Brady. 1996. Voice and Equality. Cambridge, MA:
Harvard University Press.
Vieira, P. 1967. “Toward a Theory of Decentralization: A Comparative View of Forty-
Five Countries.” Ph.D. dissertation. University of Southern California, Los Angeles.
In Rondinelli, D., G. S. Cheema and J. Nellis. 1983. “Decentralization in Developing
Countries: A Review of Recent Experience.” World Bank Staff Working Paper No.
581. Washington DC: World Bank.
Warren, D. M. 1991. “Using Indigenous Knowledge in Agricultural Development.”
Discussion Paper No. 127. Washington, DC: World Bank.
Weingast, B. R. 1993. “Constitutions as Governance Structures.” Journal of Institutional
and Theoretical Economics, 149:286-311.
1995. “The Economic Role of Political Institutions: Market-Preserving Federalism and
Economic Development.” Journal of Law, Economics, & Organization, 11:1-31.
Wildasin, D. E. 1998. “Fiscal Aspects of Evolving Federations: Issues for Policy and
Research.” Policy Research Working Paper 1884. Washington, DC: World Bank.
Williamson, O. E. 1994. “Institutions and Economic Organization: The Governance
Perspective.” Annual World Bank Conference on Development Economics.
Washington, DC: World Bank.
1995a. “Chester Barnard and the Incipient Science of Organization.” In
O.E.Williamson (ed.), Organizational Theory: From Chester Barnard to the Present
and Beyond. Expanded Edition. New York: Oxford University Press.
1995b. “Transaction Cost Economics and Organization Theory.” In O.E.Williamson
(ed.), Organizational Theory: From Chester Barnard to the Present and Beyond.
Expanded Edition. New York: Oxford University Press.
2000. “Economic Institutions and Development: A View from the Bottom.” In M.
Olson and S. Kahkonen (eds.), A Not-So-Dismal-Science: A Broader View of
Economies and Societies. New York: Oxford University Press.

Bibliography
.
393
Wilson, J. Q. 1961. “The Economy of Patronage.” Journal of Political Economy,
69:369-80.
1973. Political Organizations. New York: Basic Books.
Wolman, H. 1990. “Decentralization: What It Is and Why We Should Care.” In Bennett,
R. J. (ed.), Decentralization, Local Governments and Markets: Towards a Post-
Welfare Agenda. Oxford: Clarendon Press.
World Bank. 1987. “Bolivia: Emergency Social Fund Project.” Staff Appraisal Report.
Washington, DC: World Bank.
World Bank. 1991. “Bolivia: Second Structural Adjustment Credit.” Staff Appraisal
Report. Washington, DC: World Bank.
World Bank. 1993. “Bolivia: Education Reform Project.” Staff Appraisal Report.
Washington, DC: World Bank.
World Bank. 1993. “Bolivia: Social Investment Fund Project.” Staff Appraisal Report.
Washington, DC: World Bank.
World Bank. 1994a. World Development Report: Infrastructure for Development. New
York: Oxford University Press.
World Bank. 1994b. “Bolivia: Integrated Child Development Project.” Staff Appraisal
Report. Washington, DC: World Bank.
World Bank. 1995. “Colombia Local Government Capacity: Beyond Technical
Assistance.” World Bank Report 14085-C. Washington, DC: World Bank.
World Bank. 1997. World Development Report: The State in a Changing World. New
York: Oxford University Press.
World Bank. 1999. “Decentralization and Accountability of the Public Sector.”
Proceedings of the Annual World Bank Conference on Development in Latin
America and the Caribbean. Washington, DC: World Bank.
World Bank. 1999/2000. World Development Report: Entering the 21st Century. New
York: Oxford University Press.
World Bank. 2000. “Decentralization Toolkit.” Manuscript.