december 28, 2011 company: olympus corporation ...olympus corporation (7733) financial results for...
TRANSCRIPT

December 28, 2011 News Release
Company: Olympus Corporation Representative Director, President and CEO: Shuichi Takayama
(Code 7733, First Section, Tokyo Stock Exchange) Contact: Akihiro Nambu, Manager, Public Relations and IR Office
(Corrections) Notice Concerning Partial Corrections to “Consolidated Financial Results (Kessan Tanshin) for the Fiscal Year Ended March 31, 2009”
Olympus Corporation (the “Company”) has proceeded with operations to correct consolidated financial results (kessan tanshin) of past fiscal years as announced in “Notice Concerning Filing of the Amendments to the Past Securities Reports and Partial Corrections to Past Financial Results (Kessan Tanshin) and That for the First Quarter of the Fiscal Year Ending March 2012,” a timely disclosure of the Company as prescribed by the Tokyo Stock Exchange dated December 15, 2011. The Company has now completed the operations to correct “Consolidated Financial Results (Kessan Tanshin) for the Fiscal Year Ended March 31, 2009” dated May 12, 2009, and it accordingly announces the details of the corrections. Because corrections have been made in numerous locations, two copies of the full document are attached: the version before corrections and the version after corrections. The places in the document where corrections were made are underlined.
END

1
(After Correction)
Consolidated Financial Results for the Fiscal Year Ended March 31, 2009
May 12, 2009
Company Name: Olympus Corporation Code Number: 7733 (URL: http://www.olympus.co.jp/) Stock Exchange Listing: First Section of Tokyo Stock Exchange Representative: Tsuyoshi Kikukawa, President and Representative Director Contact: Hironobu Kawamata, General Manager, Accounting Division Phone: 03-3340-2111 Scheduled date to General Meeting of Shareholders: June 26, 2009 Scheduled date to submit the Securities Report: June 26, 2009 Scheduled date to commence dividend payments: –
(Figures are rounded off to the nearest million yen)
1. Consolidated Financial Results for the Fiscal Year Ended March 31, 2009 (From April 1, 2008 to March 31, 2009)
(1) Consolidated Results of Operations (% indicate changes from the previous fiscal year) Net sales Operating income Ordinary income Net income
Fiscal year ended (¥ million) % (¥ million) % (¥ million) % (¥ million) %
March 31, 2009 980,803 (13.1) 42,722 (62.1) 25,679 (73.6) (50,561) –
March 31, 2008 1,128,875 6.3 112,826 14.3 97,312 24.2 54,625 16.3
Net income per
share Fully diluted net income per share
Return on equity Ratio of ordinary
income to total assets Ratio of operating income to net sales
Fiscal year ended (¥) (¥) % % %
March 31, 2009 (188.85) – (30.2) 2.3 4.4
March 31, 2008 202.11 202.07 24.4 8.8 10.0
Note: Equity in earnings (losses) of affiliated companies: Fiscal year ended March 31, 2009: ¥ (1,704) million Fiscal year ended March 31, 2008: ¥ (2,766) million
(2) Consolidated Financial Position Total assets Net assets Equity ratio Net assets per share
As of (¥ million) (¥ million) % (¥)
March 31, 2009 1,038,253 110,907 10.0 387.31
March 31, 2008 1,217,172 244,281 19.1 861.58
Note: Equity as of March 31, 2009: ¥103,487 million March 31, 2008: ¥232,833 million
(3) Consolidated Cash Flows
Cash flows from
operating activities Cash flows from
investing activities Cash flows from
financing activities Cash and cash equivalents
at end of year Fiscal year ended (¥ million) (¥ million) (¥ million) (¥ million)March 31, 2009 36,864 (15,964) (3,751) 132,720
March 31, 2008 88,204 (274,104) 134,401 119,842

Olympus Corporation (7733) Financial Results for the Fiscal Year Ended March 31, 2009
2
2. Dividends
Cash dividends per share Total amount of cash dividends
Payout ratio Ratio of
dividends to net assets
(Record date) First
quarter Second quarter
Third quarter
Year-end Annual (Annual) (Consolidated) (Consolidated)
Fiscal year ended (¥) (¥) (¥) (¥) (¥) (¥) % %March 31, 2008 – 20.00 – 20.00 40.00 10,810 19.8 4.8
March 31, 2009 – 20.00 – 0.00 20.00 5,345 – 3.2
Fiscal year ending March 31, 2010 (Forecast)
– 15.00 – 15.00 30.00 20.0
3. Forecast of Consolidated Financial Results for the Fiscal Year Ending March 31, 2010 (From April 1, 2009 to March 31, 2010) (% indicate changes from the previous fiscal year)
Net sales Operating income Ordinary income Net income
Net income per share
(¥ million) % (¥ million) % (¥ million) % (¥ million) % (¥)
Six months 420,000 – 15,000 – 5,500 – 33,000 – 123.51
Full year 900,000 (8.2) 59,000 38.1 40,000 55.8 40,000 – 149.70
4. Others (1) Changes in significant subsidiaries during period under review (changes in specified subsidiaries resulting
in the changes in scope of consolidation): No (2) Changes in accounting policies, procedures, methods of presentation for preparing the consolidated
financial statements (changes described in the section of “Changes in Important Items That Form the Basis for Preparing the Consolidated Financial Statements”)
1) Changes due to revisions to accounting standards, and other regulations: Yes 2) Changes due to other reasons: No Note: For details, refer to “Changes in Important Items That Form the Basis for Preparing the Consolidated Financial
Statements” on p. 24.
(3) Total number of issued shares (common stock) 1) Total number of issued shares at the end of the fiscal year (including treasury stock)
As of March 31, 2009 271,283,608 shares
As of March 31, 2008 271,283,608 shares
2) Total number of treasury shares at the end of the fiscal year As of March 31, 2009 4,089,222 shares
As of March 31, 2008 1,044,440 shares Note: Please refer to p. 31 (“Per-Share Data”) for the number of shares that are used as the basis for the calculation of net
income per share (consolidated).

Olympus Corporation (7733) Financial Results for the Fiscal Year Ended March 31, 2009
3
Reference: Summary of Non-Consolidated Financial Results
Financial results for the Fiscal Year ended March 31, 2009 (From April 1, 2008 to March 31, 2009)
(1) Non-Consolidated Results of Operations (% indicates changes from the previous fiscal year)
Net sales Operating income Ordinary income Net income
Fiscal year ended (¥ million) % (¥ million) % (¥ million) % (¥ million) %March 31, 2009 105,115 (7.7) (12,345) – 5,701 (84.8) (63,545) –
March 31, 2008 113,871 7.3 (5,515) – 37,517 374.9 31,163 427.5
Net income per share Fully diluted net income
per share Fiscal year ended (¥) (¥)March 31, 2009 (237.35) –
March 31, 2008 115.30 –
(2) Non-Consolidated Financial Position Total assets Net assets Equity ratio Net assets per share
As of (¥ million) (¥ million) % (¥)March 31, 2009 572,078 35,132 6.1 131.49
March 31, 2008 639,752 113,149 17.7 418.70
Note: Equity as of March 31, 2009: ¥35,132 million March 31, 2008: ¥113,149 million
* Proper use of the forecast of financial results, and other special matters The forward-looking statements, including forecast of financial results, contained in these materials include predictions based on future assumptions, projections and plans made at the time these materials were announced. Actual business results may differ substantially from the forecast due to certain risks and uncertain factors relating to movements in the global economy, competitive conditions and foreign exchange rates, among others. Please refer to p. 7-8 for matters relating to the forecast of financial results.

Olympus Corporation (7733) Financial Results for the Fiscal Year Ended March 31, 2009
4
1. Results of Operations
(1) Analysis of Business Results
(Review of Operations)
Analysis of the overall operations (Millions of yen)
Net sales Operating income Ordinary income Net income (loss) Net income (loss)
per share
Fiscal year ended March 31, 2009 980,803 42,722 25,679 (50,561) ¥(188.85)
Fiscal year ended March 31, 2008 1,128,875 112,826 97,312 54,625 ¥202.11
Increase (Decrease) Ratio (%) (13.1) (62.1) (73.6) – –
Comparison Table of Average Exchange Rate (Yen) Current fiscal year Previous fiscal year
Against the U.S. dollar 100.54 114.28
Against the euro 143.48 161.53
In the Japanese economy during the fiscal year under review, exports, capital investments and consumer
spending deteriorated sharply and the yen appreciated rapidly as the global financial crisis assumed serious
proportions. Although the world economy continued to expand mainly in the emerging countries during the
first half-year, business conditions mainly in Europe, North America and Asia generally slowed down rapidly
in the second half-year as a result of the financial crisis and the weakened real economy, showing clearer
signs of the worldwide recession.
Amid this adverse business environment, the Olympus Group endeavored to strengthen its organizational
capabilities to implement valid strategies in accordance with its “’06 Corporate Strategic Plan” that it
formulated as the medium-term business plan in 2006 by, for example, bolstering the global sales structure in
the surgical field of its Medical Systems Business with a view to generating a synergistic effect from Gyrus, a
British medical treatment equipment company, that it acquired in February 2008. In addition, in February
2009, the Olympus Group decided to assign its analyzer business to Beckman Coulter Inc. of the U.S. in July
2009.
While the Olympus Group’s Medical Systems Business remained robust, the consolidated net sales decreased
¥148,072 million (13.1% year-on-year) to ¥980,803 million due to the worldwide business slowdown and
sharp appreciation of the yen during the second half-year. Operating income decreased (62.1% year-on-year)
to ¥42,722 million due to the adverse influences of exchange rate movements, reduced revenue from the
Imaging Systems Business, costs of the business merger with Gyrus, and increased depreciation expenses
associated with other consolidated subsidiaries. Ordinary income decreased (73.6% year-on-year) to ¥25,679
million primarily due to the deterioration in operating income. The Olympus Group ended the year with a
consolidated net loss of ¥50,561 million (in contrast to a net income of ¥54,625 million for the previous fiscal
year) as it recorded an extraordinary losses aggregating ¥46,096 million including a loss of ¥16,192 million
on valuation of investment securities due to the heavily fallen market values and, with respect to shares of
subsidiaries ¥20,518 million on one-time amortization of goodwill related to the subsidiaries as a result of the
recording of a loss on valuation of investment securities in subsidiaries and affiliates, and income taxes
aggregating ¥32,525 million.

Olympus Corporation (7733) Financial Results for the Fiscal Year Ended March 31, 2009
5
During the fiscal year under review, the Olympus Group invested ¥70,010 million on research and
development, and spent ¥55,632 million on capital investments.
Analysis of the performance by segment
(Millions of yen)
Net sales Operating income (loss)
Previous fiscal year
Current fiscal year
Increase (Decrease) ratio
(%)
Previous fiscal year
Current fiscal year
Increase (Decrease) ratio
(%)
Imaging Systems 320,589 224,460 (30.0) 33,086 (5,131) –
Medical Systems 353,269 383,828 8.7 98,420 75,434 (23.4)
Life Science 131,446 118,819 (9.6) 6,990 4,760 (31.9)
Information & Communication
254,312 188,954 (25.7) 3,001 907 (69.8)
Others 69,259 64,742 (6.5) 1,120 (6,219) –
Subtotal 1,128,875 980,803 (13.1) 142,617 69,751 (51.1)
Elimination or unallocation
– – – (29,791) (27,029) –
Consolidated total 1,128,875 980,803 (13.1) 112,826 42,722 (62.1)
Note: Businesses are segmented by adding similarities of sales market to the business established based on line of products.
Imaging Systems Business
In the Imaging Systems Business, the Olympus Group registered consolidated net sales of ¥224,460 million
(down 30.0 % year-on-year) and an operating loss of ¥5,131 million (in contrast to an operating income of
¥33,086 million in the previous fiscal year).
In the digital camera field, sales of compact camera, the “μ TOUGH” Series, boasting three major features of
water/dust resistance, shock/load resistance and low-temperature movement, remained robust. In addition,
Olympus launched new single-lens reflex models “E-30” and “E-620” equipped with the art filter feature that
makes creative photographic expressions possible. However, sales declined mainly because fewer units were
sold in step with the weakening market demand which was affected by the adverse influences of exchange
rate movements and global economic downturn.
In the recorder field, the “Voice-Trek V” Series whose connectable design enabling direct connection to
personal computers proved popular and sold favorably during the first half-year, but sales declined amid the
global economic downturn in the second half-year.
The Olympus Group made serious efforts to reduce its selling, general and administrative expenses and
inventories, but registered an operating loss as it was unable to fully make up for the reduced sales of digital
cameras which resulted from the declined sales volume and unit sales prices due to the worldwide slowdown
in consumer spending.
Medical Systems Business
Consolidated net sales in the Medical Systems Business amounted to ¥383,828 million (8.7% increase over
the previous fiscal year), while operating income amounted to ¥75,434 million (23.4% decrease over the
previous fiscal year).
In the medical endoscope field, high-definition videoscopes sold steadily both at home and abroad.
However, overall sales for the medical endoscope field fell off due to the adverse influences of
exchange rate movements.
In the field of surgical and endotherapy products, sales of “VISERA Pro System,” an integrated

Olympus Corporation (7733) Financial Results for the Fiscal Year Ended March 31, 2009
6
endoscope video system which can be used to support endoscopic surgeries, pancreatico-biliary
therapeutic devices such as guide wires, and gastric catheters which supply nourishment directly to the
stomach, expanded in Japan. In overseas markets, an integrated endoscopic surgical system and
sampling treatment services such as biopsy forceps sold well primarily in North America. In addition,
sales of Gyrus, a British medical treatment equipment company that Olympus acquired in February
2008, contributed to the consolidated sales. Hence, sales for the field of surgical and endotherapy
products as a whole expanded.
Operating income decreased due to the increased depreciation expenses associated with the business
integration with Gyrus and the adverse influences of exchange rate movements.
Life Science Business
Consolidated net sales for the Life Science Business was ¥118,819 million (9.6% decrease over the previous
fiscal year), while operating income amounted to ¥4,760 million (31.9% decrease compared to the previous
fiscal year).
In the micro-imaging (microscopes) field, biological microscopes for teaching practice purposes in
Japan and the “FLUOVIEW” Series of confocal scanning laser microscopes in the U.S. sold favorably,
but sales for the micro-imaging field as a whole decreased primarily because sales of industrial
microscopes dropped sharply as auto- and semiconductor-related industries put restraints on capital
investments with the worsening economy.
In the diagnostic systems (clinical laboratory test) field, sales of small and medium-sized clinical
chemistry analyzer expanded mainly in Europe and North America, and sales of transfusion test
reagents and expendables grew robustly also in Europe and North America. However, sales for the field
as a whole fell off as sales in Japan continued to lag.
Operating income for the Life Science Business as a whole decreased mainly due to the appreciating
yen and reduced sales in the micro-imaging field.
Information & Communication Business
Consolidated net sales for the Information & Communication Business was ¥188,954 million (25.7%
decrease over the previous fiscal year), while operating income showed ¥907 million (69.8% decrease over
the previous fiscal year).
In the mobile field, sales of mobile phones fell off primarily because mobile phone owners’ upgrade
cycle got longer in the wake of telecommunications carriers’ revisions of price plans and market
demand for mobile phones decreased due to the slowdown in consumer spending in the wake of the
deflationary spiral.
For operating income, gross profit rate improved as Olympus raised the proportion of more profitable directly
managed stores and controlled discounts on mobile telephone terminals in the mobile phone sales business.
Moreover, cost reductions in the automobile aftermarket business were implemented. However, due to a
decreased gain on sales of stocks on small business development business of which we promoted in the
previous fiscal year, operating income resulted in a decline during the fiscal year.
Others
Consolidated net sales for other businesses was ¥64,742 million (6.5% decrease over the previous fiscal year)
and operating loss was ¥6,219 million (in contrast to an operating income of ¥1,120 million for the
previous fiscal year).
In the non-destructive testing equipment field, ultrasonographic inspection systems equipped with phased-
array features sold briskly, but sales of industrial endoscopes decreased as manufacturing sectors put the

Olympus Corporation (7733) Financial Results for the Fiscal Year Ended March 31, 2009
7
brakes on investments amid the worldwide economic downturn, and sales for the non-destructive testing
equipment field as a whole decreased as well.
Sales for the information equipment field increases as Olympus launched new models of high-speed inkjet
printers in collaboration with RISO KAGAKU CORPORATION and sales of the existing lineups of printers
also grew.
In the biomedical materials field, sales of “OSferion,” an artificial bone replacement material, grew as it came
within coverage of medical insurance for bone marrow transplants in Japan and was also offered for sale in
Europe and China.
Olympus registered an operating loss due to the increased costs associated with amortization of goodwill of
the subsidiaries that had been consolidated during the previous fiscal year and with structural reform
including portfolio reexamination at ITX Corporation.
(Forecast for the Fiscal Year Ending March 31, 2010)
Forecast for the overall business and analysis of its preconditions
With no positive sign of business recovery in sight at home or abroad, the Japanese economy is expected to
remain sluggish in the foreseeable future. Elsewhere in the world, there is a certain amount of hope for
positive outcomes of fiscal and monetary measures including the U.S. government’s actions aimed at
bringing about financial stability, but there are also concerns there will be a prolonged recession and even a
further business downswing.
Amid these adverse conditions, we, the Olympus Group, will continuously move ahead with a structural
reform and build a corporate structure whereby we can secure profits even in the most testing of business
environments.
In the Imaging Systems Business, we will focus our energy on developing and marketing unique and high-
value added products such as a digital single-lens camera with interchangeable lenses that can be dramatically
reduced in size and weight by way of the Micro Four Thirds System standard which takes advantages of the
superiority of entirely digital designing.
In the Medical Systems Business, we will globally bolster the surgical field where we expanded our business
platform by acquiring Gyrus, and will seek to expand our earnings by simultaneously focusing our energy on
endotherapy products.
We will also strive to optimize our manufacturing cost structure and deal with changes in exchange rates by
building a global manufacturing system.
In addition, we will endeavor to implement an optimal business portfolio and resource allocation, and
develop related businesses in the medical/health and imaging/information fields.

Olympus Corporation (7733) Financial Results for the Fiscal Year Ended March 31, 2009
8
The forecast for the fiscal year ending March 31, 2010 is as follows.
(Millions of yen)
Net sales Operating
income Ordinary income
Net income (loss)
Net income (loss) per share
Fiscal year ending March 31, 2010 900,000 59,000 40,000 40,000 ¥149.70
Fiscal year ended March 31, 2009 980,803 42,722 25,679 (50,561) ¥ (188.85)
Increase (Decrease) ratio (%) (8.2) 38.1 55.8 – –
In addition to the impact of strong yen compare to the previous fiscal year, we expect to see our sales to be
decreased mainly due to a plan to assign the Olympus Group’s analyzer business to the Beckman Coulter
Group effective July 1, 2009. At the same time, we forecast that Imaging Systems Business and Life Science
Business will be the drivers to boost the operating income and Information & Communication Business and
the other businesses should also improve operating income, ordinary income and net income owing to an
improved profitability as a result of structural reform. The exchange rates forming the basis of our forecast
for the next fiscal year are: US$1 = ¥95 and €1 = ¥120.
Forecast by segment and analysis of preconditions (Millions of yen)
Net sales Operating income (loss)
Fiscal year ended
March 31, 2009
Fiscal year ended
March 31, 2010
Increase (Decrease) ratio (%)
Fiscal year ended
March 31, 2009
Fiscal year ended
March 31, 2010
Increase (Decrease)
Imaging Systems 224,460 196,000 (12.7) (5,131) 3,000 8,131
Medical Systems 383,828 364,000 (5.2) 75,434 75,000 (434)
Life Science 118,819 73,500 (38.1) 4,760 3,000 (1,760)
Information & Communication
188,954 197,500 4.5 907 5,000 4,093
Others 64,742 69,000 6.6 (6,219) (1,000) 5,219
Subtotal 980,803 900,000 (8.2) 69,751 85,000 15,249
Elimination or unallocation
– – – (27,029) (26,000) 1,029
Consolidated total 980,803 900,000 (8.2) 42,722 59,000 16,278
Note: Businesses are segmented by adding similar sales markets to businesses established based on the product lines.
In the Life Science Business, the Company expects a decline in profits due to strong yen effects and the
transfer of the analyzer business, among others. Contrastingly, the Medical Systems Business is projected to
secure operating income at roughly the same level as the previous fiscal year, despite said strong yen effects,
as a result of expanded sales of endoscopes and surgical products, which feature observation using
specialized light spectra, as well as Gyrus products. Our Imaging Systems Business is expected to return to
profitability thanks not only to the introduction of the Micro Four Thirds System in new products but also to
effects from reductions in cost of sales and selling, general and administrative expenses, among others. The
Information & Communication Business and other businesses are expected to witness significant
improvements in revenue and expenses attributable to better profitability as a result of business structural
reforms.

Olympus Corporation (7733) Financial Results for the Fiscal Year Ended March 31, 2009
9
(2) Financial Position
(Analysis of the Status of Assets, Liabilities, Net Assets, and Cash Flows in the Current Fiscal Year)
Analysis of assets, liabilities and net assets
(Millions of yen)
As of March 31, 2008 As of March 31, 2009 Increase (Decrease) Increase (Decrease)
Ratio (%)
Total assets 1,217,172 1,038,253 (178,919) (14.7)
Net assets 244,281 110,907 (133,374) (54.6)
Equity ratio 19.1% 10.0% (9.1%) –
As of the end of the consolidated fiscal year under review, total assets decreased ¥178,919 million year-on-
year to ¥1,038,253 million, primarily as a result of decrease of ¥33,297 million in notes and accounts
receivable, ¥77,523 million in intangible fixed assets attributable to amortization of goodwill and customer
related assets, and ¥79,832 million in investments and other assets.
Total liabilities decreased ¥45,545 million year-on-year to ¥927,346 million, primarily as a result of
decreases of ¥16,998 million in notes and accounts payable, and ¥16,875 million in accrued expenses.
Net assets decreased ¥133,374 million year-on-year to ¥110,907 million, primarily due to decrease of
¥63,161 million in retained earnings, the acquisition of ¥9,998 million worth of treasury stock as a means of
returning profits to shareholders, and ¥55,945 million in valuation and translation adjustments arising from
fluctuations in exchange rates and stock prices. As a result of the foregoing, equity ratio declined from 19.1%
as of the end of the previous consolidated fiscal year to 10.0%.
Analysis of cash flows
(Millions of yen)
Fiscal year ended March 31, 2008
Fiscal year ended March 31, 2009
Increase (Decrease)
Cash flows from operating activities 88,204 36,864 (51,340)
Cash flows from investing activities (274,104) (15,964) 258,140
Cash flows from financing activities 134,401 (3,751) (138,152)
Cash and cash equivalents at end of year 119,842 132,720 12,878
“Cash flows from operating activities” increased by ¥36,864 million mainly due to ¥44,594 million in
depreciation and amortization and ¥37,881 million in the amortization of goodwill, among others.
Contrastingly, decreasing factors mainly included a ¥20,383 million loss before provision for income taxes
and a ¥14,340 million decrease in accounts payable.
“Cash flows from investing activities” decreased by ¥15,964 million mainly due to purchases of property,
plant and equipment totaling ¥43,829 million as well as ¥21,379 million in additional acquisitions of
consolidated subsidiaries. Contrastingly, increasing factors mainly included ¥3,440 million in withdrawals
from time deposits, and ¥3,687 million from the sales and redemption of investment securities.
“Cash flows from financing activities” decreased by ¥3,751 million mainly due to a ¥218,220 million net
decrease in short-term borrowings, ¥33,603 million in repayments of long-term debt, a ¥10,240 million
expenditure on acquisition of treasury stock and ¥10,749 million in dividends paid.
As a result, cash and cash equivalents at the end of the current fiscal year reached ¥132,720 million, an
increase of ¥12,878 million compared to the end of the previous fiscal year.
Olympus Corporation (7733) Financial Results for the Fiscal Year Ended March 31, 2009
10
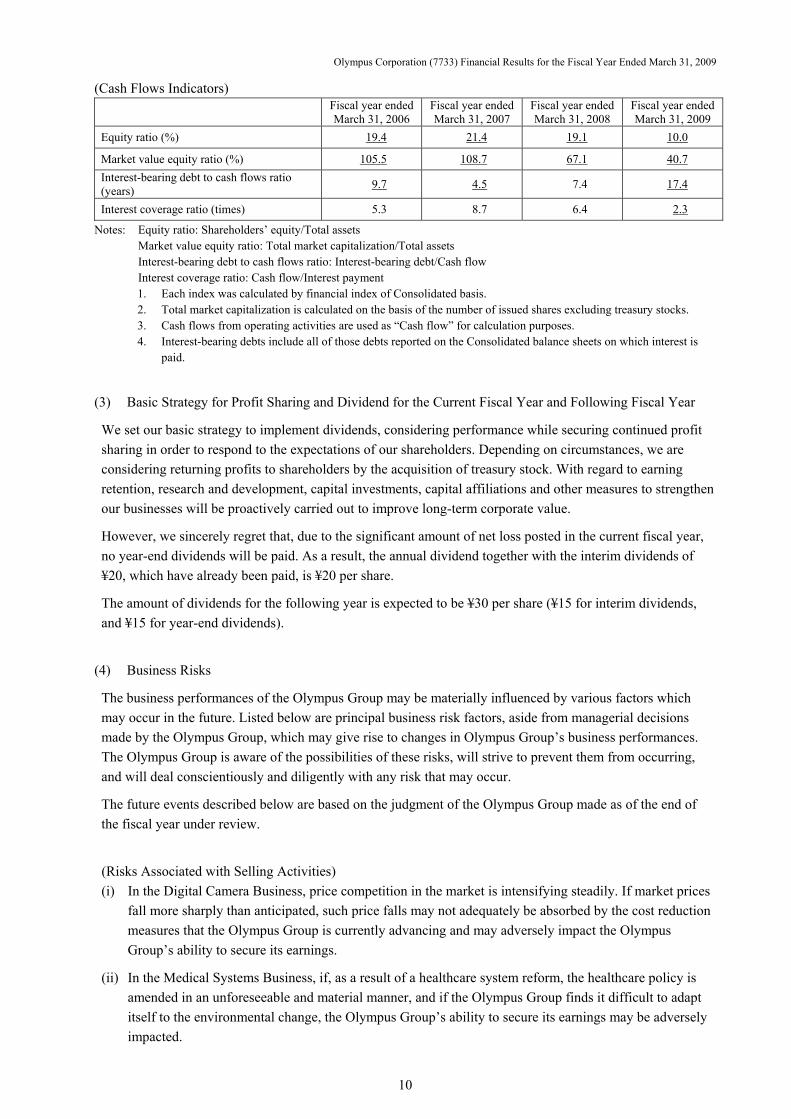
(Cash Flows Indicators) Fiscal year ended
March 31, 2006Fiscal year ended March 31, 2007
Fiscal year ended March 31, 2008
Fiscal year ended March 31, 2009
Equity ratio (%) 19.4 21.4 19.1 10.0
Market value equity ratio (%) 105.5 108.7 67.1 40.7
Interest-bearing debt to cash flows ratio (years)
9.7 4.5 7.4 17.4
Interest coverage ratio (times) 5.3 8.7 6.4 2.3
Notes: Equity ratio: Shareholders’ equity/Total assets Market value equity ratio: Total market capitalization/Total assets Interest-bearing debt to cash flows ratio: Interest-bearing debt/Cash flow Interest coverage ratio: Cash flow/Interest payment 1. Each index was calculated by financial index of Consolidated basis. 2. Total market capitalization is calculated on the basis of the number of issued shares excluding treasury stocks. 3. Cash flows from operating activities are used as “Cash flow” for calculation purposes. 4. Interest-bearing debts include all of those debts reported on the Consolidated balance sheets on which interest is
paid.
(3) Basic Strategy for Profit Sharing and Dividend for the Current Fiscal Year and Following Fiscal Year
We set our basic strategy to implement dividends, considering performance while securing continued profit
sharing in order to respond to the expectations of our shareholders. Depending on circumstances, we are
considering returning profits to shareholders by the acquisition of treasury stock. With regard to earning
retention, research and development, capital investments, capital affiliations and other measures to strengthen
our businesses will be proactively carried out to improve long-term corporate value.
However, we sincerely regret that, due to the significant amount of net loss posted in the current fiscal year,
no year-end dividends will be paid. As a result, the annual dividend together with the interim dividends of
¥20, which have already been paid, is ¥20 per share.
The amount of dividends for the following year is expected to be ¥30 per share (¥15 for interim dividends,
and ¥15 for year-end dividends).
(4) Business Risks
The business performances of the Olympus Group may be materially influenced by various factors which
may occur in the future. Listed below are principal business risk factors, aside from managerial decisions
made by the Olympus Group, which may give rise to changes in Olympus Group’s business performances.
The Olympus Group is aware of the possibilities of these risks, will strive to prevent them from occurring,
and will deal conscientiously and diligently with any risk that may occur.
The future events described below are based on the judgment of the Olympus Group made as of the end of
the fiscal year under review.
(Risks Associated with Selling Activities)
(i) In the Digital Camera Business, price competition in the market is intensifying steadily. If market prices
fall more sharply than anticipated, such price falls may not adequately be absorbed by the cost reduction
measures that the Olympus Group is currently advancing and may adversely impact the Olympus
Group’s ability to secure its earnings.
(ii) In the Medical Systems Business, if, as a result of a healthcare system reform, the healthcare policy is
amended in an unforeseeable and material manner, and if the Olympus Group finds it difficult to adapt
itself to the environmental change, the Olympus Group’s ability to secure its earnings may be adversely
impacted.

Olympus Corporation (7733) Financial Results for the Fiscal Year Ended March 31, 2009
11
(iii) In the Micro-Imaging (Microscopes) Business, system provision to research activities funded by national
budgets of countries accounts for a high proportion of earnings of the Olympus Group. Therefore, if such
national budgets are curtailed in the wake of unfavorable macroeconomic fluctuations, the Olympus
Group’s ability to secure its earnings may be adversely impacted.
(Risks Associated with Production/Development Activities)
(i) In the Imaging Systems Business, core production bases center on China. Therefore, depending upon
how sharply the Chinese yuan is revalued, operating costs may increase substantially, and the Olympus
Group’s ability to secure its earnings may be adversely impacted. Also, depending upon how serious or
unstable the state of affairs including anti-Japanese activities may grow or how badly public safety may
deteriorate in China, the Olympus Group’s production activities may be adversely impacted.
(ii) The Olympus Group relies on certain specific suppliers to consistently develop and produce those
products and parts which it cannot develop or produce internally. Hence, if the Group is subjected to
constraints on procurement of such products and parts according to the said suppliers’ convenience, the
Olympus Group’s ability to produce and supply them may be adversely impacted.
(iii) The Olympus Group and its outsourcees manufacture their products in accordance with the exacting
quality standard. However, if any product deficiency occurs, not only substantial costs including those of
a recall would be incurred but also the market’s confidence in the Olympus Group would be undermined,
and the Olympus Group’s ability to secure its earnings may be adversely impacted.
(iv) The Olympus Group is continuing to advance development of digital products by adopting state-of-the-
art Opto-Digital Technology. However, if technological progress occurs so fast and market changes
cannot be predicted adequately, that the Group is unable to develop new products adequately meeting
customers’ needs in a timely manner, the Olympus Group’s ability to secure its earnings may be
adversely impacted.
(v) The Olympus Group, in conducting R&D and production activities, uses various intellectual property
rights, and believes that the Group lawfully owns or is licensed to use such rights. However, if any third
party asserts that the Group has unknowingly infringed any of these intellectual property rights and if
any litigation occurs, the Olympus Group’s ability to secure its earnings may be adversely impacted.
(Risks Associated with Stock-Investing Activities)
As stock prices are determined on the basis of market principle, the Olympus Group may not be able to
realize anticipated earnings depending upon the movements of the market economy.
(Risks Associated with Business Collaborations and Corporate Acquisitions)
(i) The Olympus Group has built long-term strategic partnerships with advanced enterprises in the industry
on technologies and product development. If the Group can no longer maintain such partnerships due to
occurrence of a financial or any other business-related problem or change of its goals, the business
activities of the Group may be adversely impacted.
(ii) The Olympus Group may acquire or take an equity stake in a business enterprise in order to expand its
business. If the Group is unable to integrate the acquired business in line with the Group’s management
strategy or utilize management resources in an efficient manner as to the existing business or the
acquired business, the Group’s business may be adversely impacted or its business performances and
financial position may be adversely impacted due to impairment of goodwill or such like.

Olympus Corporation (7733) Financial Results for the Fiscal Year Ended March 31, 2009
12
(Other Comprehensive Risks)
The Olympus Group operates business globally. If any natural disaster, disease, war, or terrorist attack occurs
in any of the countries of regions in which the Group operates, or if interest rates rise or exchange rates
fluctuate beyond its expectations, the Olympus Group’s ability to secure its earnings may be adversely
impacted.

Olympus Corporation (7733) Financial Results for the Fiscal Year Ended March 31, 2009
13
2. Status of the Corporate Group
The Company, 204 subsidiaries and 29 affiliated companies are engaged mainly in the manufacture and sales
of products in Imaging, Medical, Life Science, Information & Communication, others and Holding
companies and Financial Investment etc. related to the each business.
Described below are business of the corporate group, roles of each business and relations to business
segments.
Segmentation Main products and business Principal consolidated subsidiaries
(Consolidated subsidiaries)
Imaging Systems
Digital cameras, Voice recorders
Olympus Imaging Corp., Olympus Opto-Technology Co., Ltd., Olympus Imaging America Inc., Olympus Imaging Europa GmbH, Olympus Hong Kong and China Limited, Olympus Korea Co., Ltd., Olympus Imaging China Co., Ltd., Olympus (Shenzhen) Industrial Ltd., Olympus Imaging Singapore Pte. Ltd.
(Consolidated subsidiaries)
Medical Systems Medical endoscopes, Surgical endoscopes, Endo Therapy products, Ultrasound endoscopes
Olympus Medical Systems Corp., KS Olympus Co., Ltd., Aizu Olympus Co., Ltd., Aomori Olympus Co., Ltd., Shirakawa Olympus Co., Ltd., Olympus America Inc., Olympus Medical Systems Europa GmbH, KeyMed (Medical & Industrial Equipment) Ltd., Gyrus ACMI, Inc., Olympus Winter & Ibe GmbH, Olympus Singapore Pte. Ltd.
Olympus Corporation (Consolidated subsidiaries)
Life Science Blood analyzer (clinical chemistry analyzer), Biological microscopes, Industrial microscopes
KS Olympus Co., Ltd., Mishima Olympus Co., Ltd., Olympus America Inc., Olympus Life Science Europa GmbH, Olympus Life Science Research Europa GmbH, Olympus Singapore Pte. Ltd.
(Consolidated subsidiaries)
Information & Communication
Sales of mobile terminals including mobile handsets, Mobile resolution, Mobile content services, development and sales of business package software, sales of network infrastructure systems, sales of semiconductor devices and electric equipment
IT Telecom, Inc., ITX E-Globaledge Corporation, Soliste Corporation, Broadleaf Co., Ltd.
Olympus Corporation (Consolidated subsidiaries)
Others
Industrial endoscopes, Non-destructive testing equipment, Printers, Bar code data processing equipment, System development, etc.
Okaya Olympus Co., Ltd., Olympus Terumo Biomaterials Corp., Olympus Systems Co., Ltd., Ai-medic Co., Ltd., Atlux Corporation, Nippon Outsourcing Corporation, KeyMed (Medical & Industrial Equipment) Ltd., Olympus NDT Canada Inc., Olympus NDT Corporation, Olympus Technologies Singapore Pte. Ltd.
Olympus Corporation (Consolidated subsidiaries)
Common Holding Companies, Financial investment
Olympus Leasing Co., Ltd., ITX Corporation, Olympus Corporation of the Americas, Olympus Europa Holding GmbH, Olympus KeyMed Group Limited, Olympus UK (Holding) Ltd., Olympus Finance Hong Kong Ltd., Olympus (China) Co., Ltd.
Note: Effective April 1, 2009, ITX Corporation merged with its subsidiary IT Telecom, Inc., with the former as surviving company. For details on the merger, please refer to “4. Consolidated Financial Statements (Important Subsequent Event)”.

Olympus Corporation (7733) Financial Results for the Fiscal Year Ended March 31, 2009
14
3. Operating Policy (1) Basic Operating Policies
We, at the Olympus Group, refer to the concept of assimilating, as members, with society, sharing values
with other members of society, and making people’s lives healthy and happy by proposing new values
through business activities as “Social IN,” and identify the concept as the leading motive lying behind all our
activities.
Based on this concept of “Social IN,” we will endeavor to be a “value-creating enterprise” capable of
continuing to create, and provide in a timely manner, new values truly needed by society by drawing upon the
source of Opto-Digital Technology (optical technology, digital imaging technology and micro-processing
technology) as our core competence. We are convinced that such endeavors will help all of our stakeholders
including customers, shareholders, business partners, employees, communities and society feel more satisfied
than ever.
(2) Targeted Operating Benchmarks
The Olympus Group strives to improve its corporate quality and financial standing by identifying
“maximization of corporate value” as its management goal. The fiscal year ended March 31, 2009 was
supposed to be the year in which we would have formulated our next basic management plan that would have
started in the fiscal year ending March 31, 2010. However, as the business environment surrounding the
Olympus Group is changing rapidly in the wake of the worldwide recession and as we need to implement
urgent measures to improve our earnings structure, we have decided to postpone formulation of the next basic
management plan.
In order to establish a stable earnings base for the fiscal year ending March 31, 2010, we will tackle the
challenge of reforming our earnings structure by identifying the issues of enhancement of corporate quality
and streamlining of management as our top priorities.
(3) Medium/Long-Term Management Strategy and Issues That Olympus Group Should Address
The basic strategy that the Olympus Group will adopt in developing its business is as follows:
In the Imaging Systems Business, we will build a corporate structure capable of continuously securing
earnings by focusing our energy on high-value added products such as compact cameras with a water/dust
resistance feature and proposing to users a digital single-lens camera with interchangeable lenses that can be
dramatically reduced in size and weight by way of the Micro Four Thirds System standard which takes
advantages of the superiority of entirely digital designing. In the Medical Systems Business, we will offer a
“safe, dependable and efficient” means of healthcare, contribute to society by improving patients’ quality of
life, reducing medical costs and bolstering the surgical field in an effort to steadily expand profits. At the
same time, we will seek to optimize our manufacturing cost structure and deal with exchange rate fluctuations
by building a global development/manufacturing structure. In addition, we will endeavor to implement an
optimal business portfolio and resource allocation, and develop related businesses in the medical/health and
imaging/information fields.

Olympus Corporation (7733) Financial Results for the Fiscal Year Ended March 31, 2009
15
4. Consolidated Financial Statements (1) Consolidated Balance Sheets
(Millions of yen)
As of March 31, 2008 As of March 31, 2009
ASSETS
Current assets
Cash and time deposits 123,281 136,877
Notes and accounts receivable 193,555 160,258
Lease receivables and lease investment assets - 11,880
Securities 3 199
Inventories 110,379 -
Merchandise and finished goods - 58,683
Work in process - 21,230
Raw materials and supplies - 15,627
Deferred income taxes 36,719 35,583
Other current assets 47,032 36,614
Allowance for doubtful accounts (3,780) (4,594)
Total current assets 507,189 472,357
Fixed assets
Property, plant and equipment
Buildings and structures 125,968 144,199
Accumulated depreciation (64,917) (67,417)
Buildings and structures, net 61,051 76,782
Machinery and equipment 57,228 60,585
Accumulated depreciation (39,397) (44,259)
Machinery and equipment, net 17,831 16,326
Tools, furniture and fixtures 154,347 161,287
Accumulated depreciation (111,724) (118,693)
Tools, furniture and fixtures, net 42,623 42,594
Land 21,273 19,839
Lease assets - 6,819
Accumulated depreciation - (3,307)
Lease assets, net - 3,512
Construction in progress 6,398 3,391
Net property, plant and equipment 149,176 162,444
Intangible fixed assets
Goodwill 227,759 170,252
Others 103,526 83,510
Total intangible fixed assets 331,285 253,762
Investments and other assets
Investment securities 94,006 62,589
Long-term loans receivable 3,277 3,811
Deferred income taxes 10,230 17,909
Investment fund assets 67,816 8,458
Other assets 54,608 63,204
Allowance for doubtful accounts (415) (6,281)
Total investments and other assets 229,522 149,690
Total fixed assets 709,983 565,896
Total assets 1,217,172 1,038,253

Olympus Corporation (7733) Financial Results for the Fiscal Year Ended March 31, 2009
16
(Millions of yen)
As of March 31, 2008 As of March 31, 2009
LIABILITIES
Current liabilities
Notes and accounts payable 83,602 66,604
Short-term borrowings 338,787 97,068
Current maturities of bonds 35,201 20,300
Other payable 58,453 55,102
Accrued expenses 82,467 65,592
Income taxes payable 14,271 15,600
Provision for product warranties 10,141 8,875
Other reserves 133 61
Other current liabilities 21,817 19,899
Total current liabilities 644,872 349,101
Non-current liabilities
Long-term bonds, less current maturities 105,397 130,200
Long-term borrowings, less current maturities 177,371 395,271
Deferred income taxes 30,488 28,068
Severance and retirement allowance 10,317 18,744
Severance and retirement allowance for directors and corporate auditors
122 130
Provision for loss on guarantees 452 -
Other non-current liabilities 3,872 5,832
Total non-current liabilities 328,019 578,245
Total liabilities 972,891 927,346
NET ASSETS
Shareholders’ equity
Common stock 48,332 48,332
Capital surplus 73,049 73,049
Retained earnings 115,285 52,124
Treasury stock, at cost (2,634) (12,874)
Total shareholders’ equity 234,032 160,631
Valuation and translation adjustments
Net unrealized holding gains (losses) on available-for-sale securities, net of taxes
5,334 (2,311)
Net unrealized gains (losses) on hedging derivatives, net of taxes
34 (1,330)
Foreign currency translation adjustments (6,567) (53,503)
Total valuation and translation adjustments (1,199) (57,144)
Minority interests 11,448 7,420
Total net assets 244,281 110,907
Total liabilities and net assets 1,217,172 1,038,253

Olympus Corporation (7733) Financial Results for the Fiscal Year Ended March 31, 2009
17
(2) Consolidated Statements of Income
(Millions of yen)
Fiscal year ended March 31, 2008
Fiscal year ended March 31, 2009
Net sales 1,128,875 980,803
Costs of sales 619,371 519,523
Gross profit 509,504 461,280
Selling, general and administrative expenses 396,678 418,558
Operating income 112,826 42,722
Non-operating income
Interest income 3,202 2,420
Dividends income 955 1,007
Royalty income 125 352
Foreign currency exchange gain, net 457 5,009
Others 4,269 2,803
Total non-operating income 9,008 11,591
Non-operating expenses
Interest expenses 13,905 16,192
Net loss of investment in affiliated companies carried on the equity method
1,224 1,704
Others 9,393 10,738
Total non-operating expenses 24,522 28,634
Ordinary income 97,312 25,679
Extraordinary income
Gain on sales of investment securities in subsidiaries and affiliates
312 -
Gain on sales of property, plant and equipment 1,478 -
Net gains due to decrease in equity interest in subsidiaries
1,909 -
Gain on transfer of business 300 -
Gain on sales of investment securities 112 34
Total extraordinary income 4,111 34
Extraordinary losses
Impairment loss on fixed assets 1,093 1,815
Loss on sales of investment securities - 1,053
Loss on valuation of investment securities 2,211 16,192
Amortization of goodwill - 20,518
Loss on funds invested 6,941 1,755
Provision of allowance for doubtful accounts - 4,763
Total extraordinary losses 10,245 46,096
Income (loss) before provision for income taxes 91,179 (20,383)
Income taxes, current 38,952 32,511
Income taxes, deferred (2,203) 14
Total 36,749 32,525
Minority interest in losses of consolidated subsidiaries (195) (2,347)
Net income (loss) 54,625 (50,561)

Olympus Corporation (7733) Financial Results for the Fiscal Year Ended March 31, 2009
18
(3) Consolidated Statement of Changes in Net Assets (Millions of yen)
Fiscal year ended March 31, 2008
Fiscal year ended March 31, 2009
Shareholders’ equity Common stock
Net assets at March 31, 2008 48,332 48,332Changes during the year
Net changes during the year - -
Balance at March 31, 2009 48,332 48,332
Capital surplus Net assets at March 31, 2008 73,049 73,049Changes during the year
Net changes during the year - -
Balance at March 31, 2009 73,049 73,049
Retained earnings Net assets at March 31, 2008 71,933 115,285Effect of changes in accounting policies applied to foreign subsidiaries
- 1,567
Changes during the year Cash dividends paid (11,893) (10,749)Increase in retained earnings due to exclusion of subsidiaries from consolidation
387 -
Net income (loss) 54,625 (50,561)Adjustment on projected benefit obligation of the consolidated subsidiary in the UK
(465) -
Adjustment on projected benefit obligation of the consolidated subsidiary in the United States
697 (3,418)
Net changes during the year 43,351 (64,728)
Balance at March 31, 2009 115,285 52,124
Treasury stock, at cost Net assets at March 31, 2008 (2,264) (2,634)Changes during the year
Acquisition of treasury stock (370) (10,240)
Net changes during the year (370) (10,240)
Balance at March 31, 2009 (2,634) (12,874)
Total shareholders’ equity Net assets at March 31, 2008 191,050 234,032Effect of changes in accounting policies applied to foreign subsidiaries
- 1,567
Changes during the year Cash dividends paid (11,893) (10,749)Increase in retained earnings due to exclusion of subsidiaries from consolidation
387 -
Net income (loss) 54,625 (50,561)Adjustment on projected benefit obligation of the consolidated subsidiary in the UK
(465) -
Adjustment on projected benefit obligation of the consolidated subsidiary in the United States
697 (3,418)
Acquisition of treasury stock (370) (10,240)
Net changes during the year 42,981 (74,968)
Balance at March 31, 2009 234,032 160,631

Olympus Corporation (7733) Financial Results for the Fiscal Year Ended March 31, 2009
19
(Millions of yen)
Fiscal year ended March 31, 2008
Fiscal year ended March 31, 2009
Valuation and translation adjustments Net unrealized holding gains (losses) on available-for-sale securities, net of taxes
Net assets at March 31, 2008 15,347 5,334Changes during the year
Net changes in items other than shareholders’ equity (10,013) (7,645)
Net changes during the year (10,013) (7,645)
Balance at March 31, 2009 5,334 (2,311)
Net unrealized gains (losses) on hedging derivatives, net of taxes Net assets at March 31, 2008 (184) 34Changes during the year
Net changes in items other than shareholders’ equity 218 (1,364)
Net changes during the year 218 (1,364)
Balance at March 31, 2009 34 (1,330)
Foreign currency translation adjustments Net assets at March 31, 2008 8,077 (6,567)Changes during the year
Net changes in items other than shareholders’ equity (14,644) (46,936)
Net changes during the year (14,644) (46,936)
Balance at March 31, 2009 (6,567) (53,503)
Total valuation and translation adjustments Net assets at March 31, 2008 23,240 (1,199)Changes during the year
Net changes in items other than shareholders’ equity (24,439) (55,945)
Net changes during the year (24,439) (55,945)
Balance at March 31, 2009 (1,199) (57,144)
Minority interests Net assets at March 31, 2008 10,661 11,448Changes during the year
Net changes in items other than shareholders’ equity 787 (4,028)
Net changes during the year 787 (4,028)
Balance at March 31, 2009 11,448 7,420
Total net assets Net assets at March 31, 2008 224,951 244,281Effect of changes in accounting policies applied to foreign subsidiaries
- 1,567
Changes during the year Cash dividends paid (11,893) (10,749)Increase in retained earnings due to exclusion of subsidiaries from consolidation
387 -
Net income (loss) 54,625 (50,561)Adjustment on projected benefit obligation of the consolidated subsidiary in the UK
(465) -
Adjustment on projected benefit obligation of the consolidated subsidiary in the United States
697 (3,418)
Acquisition of treasury stock (370) (10,240)Net changes in items other than shareholders’ equity (23,652) (59,973)
Net changes during the year 19,329 (134,941)
Balance at March 31, 2009 244,281 110,907

Olympus Corporation (7733) Financial Results for the Fiscal Year Ended March 31, 2009
20
(4) Consolidated Statements of Cash Flows
(Millions of yen)
Fiscal year ended March 31, 2008
Fiscal year ended March 31, 2009
Cash flows from operating activities Income (loss) before provision for income taxes 91,179 (20,383)Depreciation and amortization 37,497 44,594Impairment loss on fixed assets 1,093 1,815Amortization of goodwill 7,899 37,881Increase (decrease) in severance and retirement allowance 893 9,003Decrease (increase) in prepaid pension cost (8,757) (8,853)Increase (decrease) in provision for product warranties 1,504 366Interest and dividend income (4,157) (3,427)Interest expense 13,905 16,192Net loss (gain) of investment in affiliated companies carried on the equity method
1,224 1,704
Net losses (gains) due to decrease in equity interest in subsidiaries (1,909) -Loss (gain) on sale of investment securities in subsidiaries and affiliates
(312) -
Loss (gain) valuation of investment securities 2,211 16,192Decrease (increase) in accounts receivable (3,959) 16,794Decrease (increase) in inventories (14,316) 6,528Increase (decrease) in accounts payable (9,230) (14,340)Increase (decrease) in other payable 15,932 (5,669)Increase (decrease) in accrued expense (31) (12,618)Loss on funds invested 6,941 1,755Increase (decrease) in allowance for doubtful accounts on funds - 4,763Other 2,325 (1,315)Sub-total 139,931 90,982Interest and dividend received 4,114 3,439Interest payments (13,864) (16,139)Outflow of money from funds - (4,763)Payment of fund related expenses (802) -Income taxes paid (41,175) (36,655)Net cash provided by operating activities 88,204 36,864

Olympus Corporation (7733) Financial Results for the Fiscal Year Ended March 31, 2009
21
(Millions of yen)
Fiscal year ended March 31, 2008
Fiscal year ended March 31, 2009
Cash flows from investing activities Deposits in time deposits (3,956) (5,626)Withdrawals from time deposits 6,775 3,440Sales of securities 2,357 -Purchase of property, plant and equipment, etc. (47,953) -Purchase of property, plant and equipment - (43,829)Sales of property, plant and equipment 2,306 -Purchases of intangible fixed assets - (5,617)Purchases of investment securities (12,885) (5,332)Sales and redemption of investment securities 7,293 3,687Payments for acquisition of new consolidated subsidiaries related to changes in scope of consolidation
(202,627) (128)
Net decrease from sales of investment in subsidiaries related to changes in scope of consolidation
- (123)
Net increase from sales of investment in subsidiaries related to changes in scope of consolidation
197 -
Payments for additional acquisition of consolidated subsidiaries (8) -Payments for acquisition of new consolidated subsidiaries - (21,379)Proceeds from sales of investment in consolidated subsidiaries 608 -Payments for loans receivable (9,912) (1,531)Proceeds from loans receivable 1,544 3,073Money transfer of funds (47,804) (19,012)Collection of fund assets invested 30,000 76,615Other (39) (203)Net cash used in investing activities (274,104) (15,964)
Cash flows from financing activities Increase (decrease) in short-term borrowings 152,797 (218,220)Proceeds from long-term debt 37,097 259,719Repayments of long-term debt (45,064) (33,603)Proceeds from issuance of bonds 100 45,166Redemption of bonds (94) (35,199)Stock issue to minority shareholders 1,917 147Expenditure on acquisition of treasury stock - (10,240)Dividends paid (11,893) (10,749)Dividends paid to minority shareholders (88) (114)Other (371) (658)Net cash provided by (used in) financing activities 134,401 (3,751)
Effect of exchange rate changes on cash and cash equivalents (4,405) (4,435)Net increase (decrease) in cash and cash equivalents (55,904) 12,714Cash and cash equivalents at beginning of year 174,802 119,842Net increase in cash and cash equivalents associated with newly consolidated subsidiaries
1,181 -
Net decrease in cash and cash equivalents associated with exclusion from scope of consolidation
(237) (6)
Increase in cash and cash equivalents resulting from merger with unconsolidated subsidiaries
- 170
Cash and cash equivalents at end of year 119,842 132,720

Olympus Corporation (7733) Financial Results for the Fiscal Year Ended March 31, 2009
22
(5) Notes on Premise of Going Concern
No items to report.
(6) Important Items That Form the Basis for Preparing the Consolidated Financial Statements
Fiscal year ended March 31, 2008
(April 1, 2007 - March 31, 2008)
Fiscal year ended March 31, 2009
(April 1, 2008 - March 31, 2009)
1. Scope of consolidation 1. Scope of consolidation 1) Number of consolidated subsidiaries: 216
Included in these are the following 11 fund companies determined to be used as consolidated subsidiaries to segregate hidden losses on financial assets, derivative transactions, etc., and to be substantially controlled by the Company.
● SG Bond Plus Fund
● PS Global Investable Markets-O
● Central Forest Corporation
● TEAO Limited
● Neo Strategic Venture, L. P.
● Class Fund IT Ventures
● Quick Progress Co. Ltd
● Global Targets SPC-Sub Fund H Segregated Portfolio
● Dynamic Dragons II,SPC-Sub Fund H Segregated Portfolio
● Easterside Investments Limited
● Twenty-First Century Global Fixed Income Fund Limited
Olympus Digital System Design Corp. and other 6 companies are newly established subsidiaries during the fiscal year ended March 31, 2008.
Gyrus Group PLC and other 26 companies have been included into consolidation through equity participation carried out during the fiscal year.
Olympus Moscow Limited Liability Company and other 3 companies have switched from non-consolidated subsidiaries accounted for under the equity method to consolidated subsidiaries effective from the fiscal year ended March 31, 2008, due to gains in materiality.
Atlux Humanage, Inc. and other 1 company have been excluded from consolidated subsidiaries due to sale of shares during the fiscal year.
Moranet Inc and other 5 companies have been excluded from consolidated subsidiaries due to merger with other consolidated subsidiaries during the fiscal year.
AOI Technologies Inc. and other 5 companies have been excluded from consolidated subsidiaries due to liquidation during the fiscal year.
Olympus Microsystems America, Inc. and other one have been excluded from consolidated subsidiaries due to decrease in materiality.
1) Number of consolidated subsidiaries: 194
Included in these are the following 5 fund companies determined to be used as consolidated subsidiaries to segregate hidden losses on financial assets, derivative transactions, etc., and to be substantially controlled by the Company.
● SG Bond Plus Fund
● Central Forest Corporation
● Creative Dragons SPC-Sub Fund E
● Easterside Investments Limited
● Twenty-First Century Global Fixed Income Fund Limited
Olympus UK Loan Notes Limited and other 1 company are newly established subsidiaries during the fiscal year ended March 31, 2009.
Pulsecho Inc. has been included into consolidation through equity participation carried out during the fiscal year.
Makewave Japan Co., Ltd. has been included into consolidation due to additional acquisition of shares during the fiscal year.
ITX Capital Innovation Co., Ltd. and other 10 companies have been excluded from consolidated subsidiaries due to sale of shares during the fiscal year.
Olympus NDT NW, Inc. and other 4 companies have been excluded from consolidated subsidiaries due to merger with other consolidated subsidiaries during the fiscal year.
Recycle Institute Ltd. and other 2 companies have been excluded from consolidated subsidiaries due to liquidation during the fiscal year.
LA PLANTA CO., LTD. has been excluded from consolidated subsidiaries due to decrease in materiality.

Olympus Corporation (7733) Financial Results for the Fiscal Year Ended March 31, 2009
23
Fiscal year ended March 31, 2008
(April 1, 2007 - March 31, 2008)
Fiscal year ended March 31, 2009
(April 1, 2008 - March 31, 2009) 2) Name of non-consolidated subsidiaries
Non-consolidated subsidiaries are as follows:
FEED CORPORATION
Radio Cafe, Inc.
S.T. SIX Co., Ltd., and other 11 companies
Reason of excluding from the scope of consolidation
The 14 non-consolidated subsidiaries are all small and not material when measured by the impact of total amounts of assets, net sales, net income, and retained earnings (based on the Company’s ownership percentage) of those companies on consolidated financial statements. They have therefore been excluded from the scope of consolidation.
2) Name of non-consolidated subsidiaries
Non-consolidated subsidiaries are as follows:
FEED CORPORATION
Radio Cafe, Inc.
LA PLANTA CO., LTD., and other 7 companies
Reason of excluding from the scope of consolidation
The ten non-consolidated subsidiaries are all small and not material when measured by the impact of total amounts of assets, net sales, net income, and retained earnings (based on the Company’s ownership percentage) of those companies on consolidated financial statements. They have therefore been excluded from the scope of consolidation.
2. Application of the Equity Method 2. Application of the Equity Method
1) Non-consolidated subsidiaries accounted for under the equity method: 2
FEED CORPORATION
Radio Cafe, Inc.
FEED CORPORATION became an equity participation company during the fiscal year.
Beijing Beizhao Olympus Optical Co., Ltd. has been excluded from non-consolidated subsidiaries accounted for under the equity method due to liquidation during the fiscal year.
Olympus Moscow Limited Liability Company has switched from a non-consolidated subsidiary accounted for under the equity method to a consolidated subsidiary effective from the fiscal year ended March 31, 2008, due to gains in materiality.
1) Non-consolidated subsidiaries accounted for under the equity method: 2
FEED CORPORATION
Radio Cafe, Inc.
2) Affiliated companies accounted for under the equity method: 13
ORTEK Corporation
Adachi Co., Ltd.
Olympus Cytori Inc., and other 10 companies
Media Hanshin Co., Ltd. became an equity participation company during the fiscal year.
ADLINK Japan Inc. was newly established during the fiscal year.
Cablenet Saitama Co., Ltd and other 3 companies have been excluded from affiliated companies accounted for under the equity method due to sale of shares.
2) Affiliated companies accounted for under the equity method: 18
ORTEK Corporation
Adachi Co., Ltd.
Olympus Cytori Inc., and other 15 companies
ITX Capital Innovation Co., Ltd. and other 5companies have switched from consolidated subsidiaries to affiliated companies accounted for under the equity method due to partial sale of shares during the fiscal year.
Resect Medical, Inc. has been excluded from affiliated companies accounted for under the equity method due to sale of shares during the fiscal year.
3) S.T. SIX Co., Ltd. and other 11 non-consolidated subsidiaries and 5 affiliated companies have not been accounted for under the equity method because the impact of all those companies on consolidated net income and retained earnings is not material.
3) LA PLANTA CO., LTD. and other 7 non-consolidated subsidiaries and 11 affiliated companies have not been accounted for under the equity method because the impact of all those companies on consolidated net income and retained earnings is not material.

Olympus Corporation (7733) Financial Results for the Fiscal Year Ended March 31, 2009
24
(7) Changes in Important Items That Form the Basis for Preparing the Consolidated Financial Statements
Fiscal year ended March 31, 2008
(April 1, 2007 - March 31, 2008)
Fiscal year ended March 31, 2009
(April 1, 2008 - March 31, 2009)
1. Method of depreciation of fixed assets 1. Inventories
Beginning from the fiscal year ended March 31, 2008, pursuant to the amendments to the Corporation Tax Law (the Law on Partial Amendments to the Income Tax Law [March 30, 2007, Law No. 6] and the Cabinet Order on Partial Amendments to the Order for Enforcement of the Corporation Tax Law [March 30, 2007, Cabinet Order No. 83]), the method of depreciation of fixed assets acquired on or after April 1, 2007 has been changed to the method based on the provisions of the revised Corporation Tax Law. This had immaterial effect on profit and loss in the fiscal year.
Before the change, inventories held for sale in the ordinary course of business were stated mainly using the lower-of-cost -or-market method per First-in First-out method. However, because the “Accounting Standard for Measurement of Inventories” (ASBJ Statement No. 9, published July 5, 2006) has been applied from the current fiscal year, the First-in First-out cost method is now mainly employed (for the value stated in the balance sheet, the book value is written down based on the decreased profitability). The impact from this change on profit and loss is immaterial.
2. Application of “Practical Solution on Unification of Accounting Policies Applied to Foreign Subsidiaries for Consolidated Financial Statements”
From the current fiscal year, the consolidated financial statements conform to the “Practical Solution on Unification of Accounting Policies Applied to Foreign Subsidiaries for Consolidated Financial Statements” (PITF No. 18, May 17, 2006), and necessary amendments were made. The impact from this change on profit and loss is immaterial.
3. Application of Accounting Standard for Lease Transactions
Before the change, the accounting treatment for finance lease transactions not involving the transfer of ownership followed the method for operating lease transactions, but now after the application of the “Accounting Standard for Lease Transactions” (ASBJ Statement No. 13 [Business Accounting Council Committee No. 1, June 17, 1993; revised March 30, 2007]) and the “Guidance on Accounting Standard for Lease Transactions” (ASBJ Guidance No. 16 [The Japanese Institute of Certified Public Accountants (JICPA) Accounting Standard Committee, January 18, 1994; revised March 30, 2007]) that begin from the current fiscal year, the accounting treatment for those transactions follows the method for ordinary purchase and sales transactions. Depreciation of finance lease assets not involving the transfer of ownership is calculated on the straight-line method over the lease period as the useful period and assuming no residual value. The accounting treatment for finance lease transactions not involving the transfer of ownership whose transaction commenced before the first fiscal year in which the Accounting Standard for Lease Transactions is applied follows the same method as for ordinary operating lease transactions. The impact from this change on profit and loss is immaterial.
Olympus Corporation (7733) Financial Results for the Fiscal Year Ended March 31, 2009
25
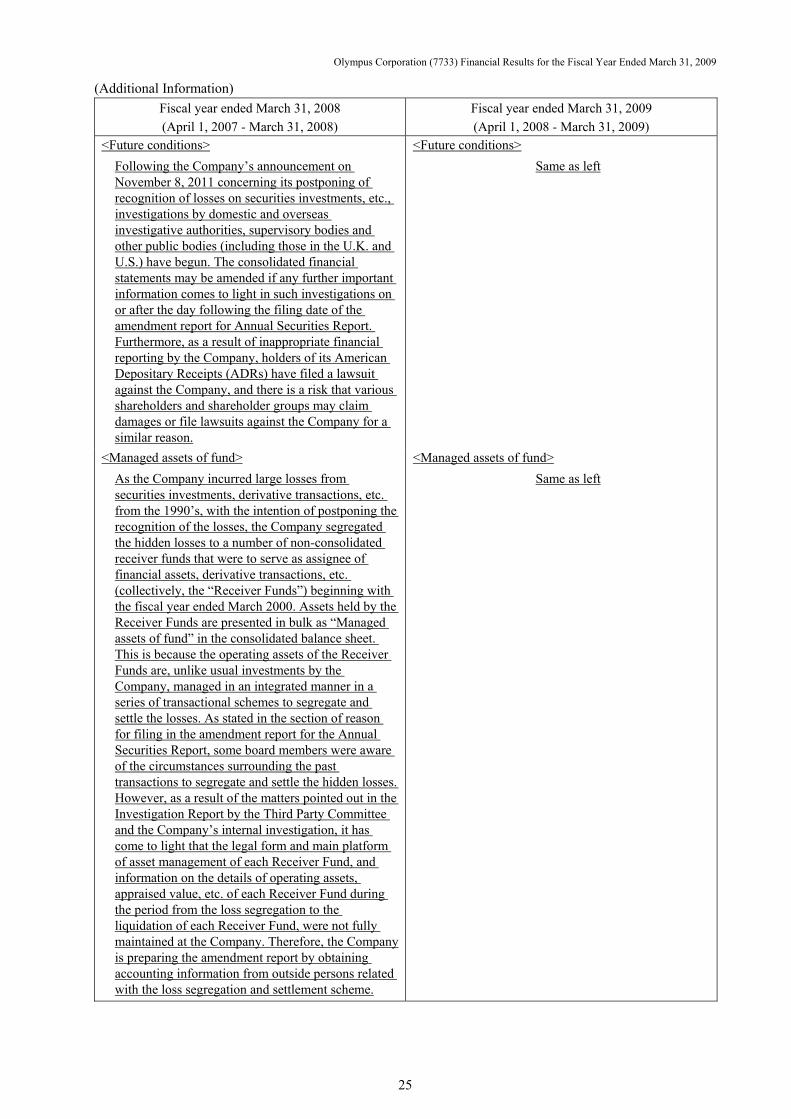
(Additional Information)
Fiscal year ended March 31, 2008
(April 1, 2007 - March 31, 2008)
Fiscal year ended March 31, 2009
(April 1, 2008 - March 31, 2009) <Future conditions>
Following the Company’s announcement on November 8, 2011 concerning its postponing of recognition of losses on securities investments, etc., investigations by domestic and overseas investigative authorities, supervisory bodies and other public bodies (including those in the U.K. and U.S.) have begun. The consolidated financial statements may be amended if any further important information comes to light in such investigations on or after the day following the filing date of the amendment report for Annual Securities Report. Furthermore, as a result of inappropriate financial reporting by the Company, holders of its American Depositary Receipts (ADRs) have filed a lawsuit against the Company, and there is a risk that various shareholders and shareholder groups may claim damages or file lawsuits against the Company for a similar reason.
<Future conditions>
Same as left
<Managed assets of fund>
As the Company incurred large losses from securities investments, derivative transactions, etc. from the 1990’s, with the intention of postponing the recognition of the losses, the Company segregated the hidden losses to a number of non-consolidated receiver funds that were to serve as assignee of financial assets, derivative transactions, etc. (collectively, the “Receiver Funds”) beginning with the fiscal year ended March 2000. Assets held by the Receiver Funds are presented in bulk as “Managed assets of fund” in the consolidated balance sheet. This is because the operating assets of the Receiver Funds are, unlike usual investments by the Company, managed in an integrated manner in a series of transactional schemes to segregate and settle the losses. As stated in the section of reason for filing in the amendment report for the Annual Securities Report, some board members were aware of the circumstances surrounding the past transactions to segregate and settle the hidden losses. However, as a result of the matters pointed out in the Investigation Report by the Third Party Committee and the Company’s internal investigation, it has come to light that the legal form and main platform of asset management of each Receiver Fund, and information on the details of operating assets, appraised value, etc. of each Receiver Fund during the period from the loss segregation to the liquidation of each Receiver Fund, were not fully maintained at the Company. Therefore, the Company is preparing the amendment report by obtaining accounting information from outside persons related with the loss segregation and settlement scheme.
<Managed assets of fund>
Same as left

Olympus Corporation (7733) Financial Results for the Fiscal Year Ended March 31, 2009
26
Fiscal year ended March 31, 2008
(April 1, 2007 - March 31, 2008)
Fiscal year ended March 31, 2009
(April 1, 2008 - March 31, 2009) <Participation in equity of Gyrus Group PLC, etc.>
Concerning Gyrus Group PLC, in which the Company participated in equity during the current fiscal year, because the allocation of funds for the acquisition cost is incomplete as of the end of the current fiscal year, a provisional accounting treatment is effectuated based on available information deemed as rational. Also, there is the possibility of additional payments due to certain clauses in the purchasing agreement such as an employee incentive plan.
<Investment in Gyrus Group Limited>
Concerning investments such as the equity participation in Gyrus Group Limited (formerly Gyrus Group PLC) during the previous fiscal year, because the amount to be expended in fees, etc. has been finalized and the allocation of funds for the acquisition cost is complete, a provisional accounting treatment has been determined.

Olympus Corporation (7733) Financial Results for the Fiscal Year Ended March 31, 2009
27
(8) Notes Regarding the Consolidated Financial Statements
Notes
(Omission of disclosure)
Notes related to lease transactions, related party information, deferred tax accounting, securities, derivative
transactions, retirement benefits, stock options, and business combinations are omitted, because the necessity
of their disclosure in financial results are regarded as immaterial.
However, the aforementioned notes will be included in the securities report scheduled to be submitted on
June 26, 2009, and will be available on the Electronic Disclosure for Investors’ Network (EDINET), an
electronic disclosure system with respect to disclosed documents such as annual securities reports submitted
pursuant to the Financial Instruments and Exchange Law.
(Consolidated Statements of Income) (Millions of yen)
Fiscal year ended March 31, 2008
(April 1, 2007 - March 31, 2008)
Fiscal year ended March 31, 2009
(April 1, 2008 - March 31, 2009)
*2. Major items and amounts of selling, general and administrative expenses are as follows:
*2. Major items and amounts of selling, general and administrative expenses are as follows:
Advertising and promotion expenses 58,658 Advertising and promotion expenses 53,058
Provision of allowance for doubtful accounts
480 Provision of allowance for doubtful accounts
2,309
Salaries and allowance 104,921 Salaries and allowance 113,920
Bonuses 28,111 Bonuses 19,349
Severance and retirement expenses 3,098 Severance and retirement expenses 5,397
Provision of severance and retirement allowance for directors and corporate auditors
49 Provision of severance and retirement allowance for directors and corporate auditors
62
Amortization of goodwill 7,899 Amortization of goodwill 17,363
Experiment and research expenses 38,552 Experiment and research expenses 45,927
Depreciation 22,682 Depreciation 31,437
*3. Research and development expenses included in general and administrative expenses and production cost for the current fiscal year are ¥65,928 million.
*3. Research and development expenses included in general and administrative expenses and production cost for the current fiscal year are ¥70,010 million.

Olympus Corporation (7733) Financial Results for the Fiscal Year Ended March 31, 2009
28
(Segment Information)
a. Segment information by type of business Fiscal year ended March 31, 2008 (from April 1, 2007 to March 31, 2008) (Millions of yen)
Imaging Systems
Medical Systems
Life Science
Information & Communication
Others Total Elimination
or Unallocation
Consolidated
I. Net sales and operating income or loss Sales
(1) Sales to outside customers 320,589 353,269 131,446 254,312 69,259 1,128,875 – 1,128,875
(2) Internal sales of transfer among segments
347 85 219 – 574 1,225 (1,225) –
Total 320,936 353,354 131,665 254,312 69,833 1,130,100 (1,225) 1,128,875
Operating expenses 287,850 254,934 124,675 251,311 68,713 987,483 28,566 1,016,049
Operating income (or operating loss) 33,086 98,420 6,990 3,001 1,120 142,617 (29,791) 112,826
II. Assets, depreciation cost, and capital expenditure Assets 147,293 520,190 94,916 128,949 97,356 988,704 228,469 1,217,172
Depreciation cost 8,748 10,778 5,943 2,470 4,334 32,273 5,224 37,497
Capital expenditure 10,638 16,536 7,792 3,191 4,476 42,633 7,437 50,070
Fiscal year ended March 31, 2009 (from April 1, 2008 to March 31, 2009) (Millions of yen)
Imaging Systems
Medical Systems
Life Science
Information & Communication
Others Total Elimination
or Unallocation
Consolidated
I. Net sales and operating income or loss Sales
(1) Sales to outside customers 224,460 383,828 118,819 188,954 64,742 980,803 – 980,803
(2) Internal sales of transfer among segments
133 64 189 – 492 878 (878) –
Total 224,593 383,892 119,008 188,954 65,234 981,681 (878) 980,803
Operating expenses 229,724 308,458 114,248 188,047 71,453 911,930 26,151 938,081
Operating income (or operating loss) (5,131) 75,434 4,760 907 (6,219) 69,751 (27,029) 42,722
II. Assets, depreciation cost, and capital expenditure Assets 119,492 456,693 82,609 99,205 74,100 832,099 206,154 1,038,253
Depreciation cost 8,465 19,250 5,265 2,655 3,921 39,556 5,038 44,594
Capital expenditure 8,580 21,974 4,466 2,988 4,871 42,879 12,753 55,632
Notes: 1. Method of segmentation of business during the fiscal year
Business established based on product line are segmented taking into consideration similarities in sales markets. 2. The main products for each business are as follows:
(1) Imaging Systems: Digital cameras, Voice recorders (2) Medical Systems: Medical endoscopes, Surgical endoscopes, Endo Therapy products, Ultrasound
endoscopes (3) Life Science: Blood analyzer (clinical chemistry analyzer), Biological microscopes, Industrial
microscopes (4) Information & Communication: Sales of mobile terminals including mobile handsets, Mobile solution, Mobile content
services, Development and sales of business package software, Sales of network infrastructure systems, Sales of semiconductor devices and electric equipment
(5) Others: Industrial endoscopes, Non-destructive testing equipment, Printers, Bar code data processing equipment, System development, etc.
3. Among the operating expenses, the amount of unallocatable operating expenses recorded in the section of Elimination or Unallocation was ¥29,791 million for the previous consolidated fiscal year, and ¥27,029 million for the current consolidated fiscal year, most of which consisted of expenses related to the corporate center of the parent company (management departments such as the Administrative Department) and the Research & Development Center.
4. Among the assets, the amount of unallocatable assets recorded in the section of Elimination or Unallocation was ¥228,468 million for the previous consolidated fiscal year, and ¥206,154 million for the current consolidated fiscal year, most of which consisted of the surplus operating fund at the parent company (cash and securities), long-term investment fund (investment securities), and assets related to the corporate center of the parent company (management departments such as the Administrative Department) and the Research & Development Center.
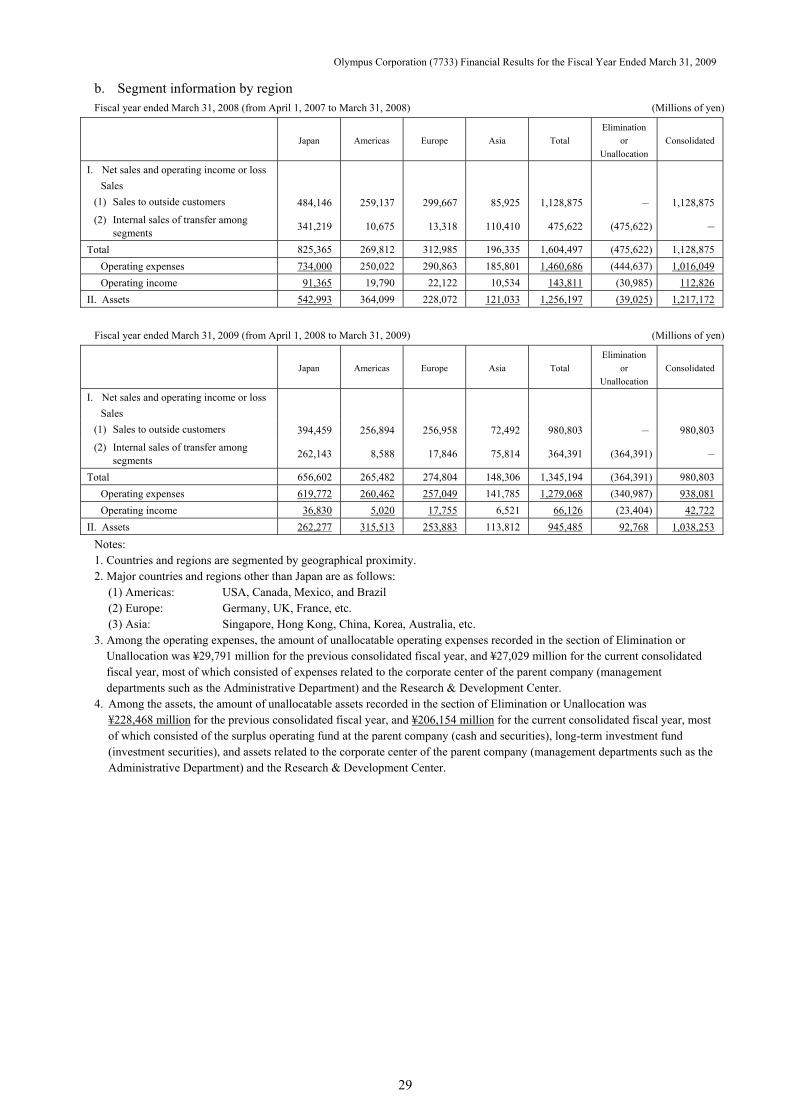
Olympus Corporation (7733) Financial Results for the Fiscal Year Ended March 31, 2009
29
b. Segment information by region Fiscal year ended March 31, 2008 (from April 1, 2007 to March 31, 2008) (Millions of yen)
Japan Americas Europe Asia Total
Elimination
or
Unallocation
Consolidated
I. Net sales and operating income or loss
Sales
(1) Sales to outside customers 484,146 259,137 299,667 85,925 1,128,875 – 1,128,875
(2) Internal sales of transfer among segments
341,219 10,675 13,318 110,410 475,622 (475,622) –
Total 825,365 269,812 312,985 196,335 1,604,497 (475,622) 1,128,875
Operating expenses 734,000 250,022 290,863 185,801 1,460,686 (444,637) 1,016,049
Operating income 91,365 19,790 22,122 10,534 143,811 (30,985) 112,826
II. Assets 542,993 364,099 228,072 121,033 1,256,197 (39,025) 1,217,172
Fiscal year ended March 31, 2009 (from April 1, 2008 to March 31, 2009) (Millions of yen)
Japan Americas Europe Asia Total
Elimination
or
Unallocation
Consolidated
I. Net sales and operating income or loss
Sales
(1) Sales to outside customers 394,459 256,894 256,958 72,492 980,803 – 980,803
(2) Internal sales of transfer among segments
262,143 8,588 17,846 75,814 364,391 (364,391) –
Total 656,602 265,482 274,804 148,306 1,345,194 (364,391) 980,803
Operating expenses 619,772 260,462 257,049 141,785 1,279,068 (340,987) 938,081
Operating income 36,830 5,020 17,755 6,521 66,126 (23,404) 42,722
II. Assets 262,277 315,513 253,883 113,812 945,485 92,768 1,038,253
Notes: 1. Countries and regions are segmented by geographical proximity. 2. Major countries and regions other than Japan are as follows:
(1) Americas: USA, Canada, Mexico, and Brazil (2) Europe: Germany, UK, France, etc. (3) Asia: Singapore, Hong Kong, China, Korea, Australia, etc.
3. Among the operating expenses, the amount of unallocatable operating expenses recorded in the section of Elimination or Unallocation was ¥29,791 million for the previous consolidated fiscal year, and ¥27,029 million for the current consolidated fiscal year, most of which consisted of expenses related to the corporate center of the parent company (management departments such as the Administrative Department) and the Research & Development Center.
4. Among the assets, the amount of unallocatable assets recorded in the section of Elimination or Unallocation was ¥228,468 million for the previous consolidated fiscal year, and ¥206,154 million for the current consolidated fiscal year, most of which consisted of the surplus operating fund at the parent company (cash and securities), long-term investment fund (investment securities), and assets related to the corporate center of the parent company (management departments such as the Administrative Department) and the Research & Development Center.

Olympus Corporation (7733) Financial Results for the Fiscal Year Ended March 31, 2009
30
c. Overseas sales Fiscal year ended March 31, 2008 (from April 1, 2007 to March 31, 2008) (Millions of yen)
North America
Europe Asia Others Total
I. Overseas sales 240,254 303,110 138,873 26,411 708,648II. Consolidated sales 1,128,875III. Percentage of overseas sales in
consolidated sales (%) 21.3 26.9 12.3 2.3 62.8
Fiscal year ended March 31, 2009 (from April 1, 2008 to March 31, 2009) (Millions of yen)
North America
Europe Asia Others Total
I. Overseas sales 237,656 257,894 114,152 23,840 633,542II. Consolidated sales 980,803III. Percentage of overseas sales in
consolidated sales (%) 24.2 26.4 11.6 2.4 64.6
Notes: 1. Overseas sales refer to the sales of the Company and its consolidated subsidiaries in countries or regions other than Japan. 2. Regions are segmented by geographical proximity. 3. Major countries and regions other than Japan are as follows:
(1) North America: USA, Canada (2) Europe: Germany, UK, France, etc. (3) Asia: Singapore, Hong Kong, China, Korea, Australia, etc. (4) Others: Central and South America, Africa, etc.
d. Production, orders and sales
Businesses are segmented by adding similar sales markets to business established based on product lines.
Purchasing performance is recorded in addition to production performance for some consolidated subsidiaries,
because they engage in the sales and services of equipments.
(1) Production Performance
Segment Name by Type of Business Amount (Millions of yen) Comparison vs. Previous Fiscal Year
(%)
Imaging Systems 239,547 (24.8)
Medical Systems 366,016 4.1
Life Science 109,697 (2.8)
Information & Communication – –
Others 47,228 (1.9)
Total 762,488 (8.3)
Notes: 1. Amounts are calculated based on the sales price. 2. Amounts do not include consumption tax. (2) Purchasing Performance
Segment Name by Type of Business Amount (Millions of yen) Comparison vs. Previous Fiscal Year
(%)
Imaging Systems – –
Medical Systems – –
Life Science – –
Information & Communication 149,695 (27.7)
Others 24,492 (2.7)
Total 174,187 (25.0)
Note: Amounts do not include consumption tax.

Olympus Corporation (7733) Financial Results for the Fiscal Year Ended March 31, 2009
31
(3) Orders Received
As we have mainly adopted a make-to-stock production system, the description of the situation of accepting orders has been omitted. (4) Sales Performance
Segment Name by Type of Business Amount (Millions of yen) Comparison vs. Previous Fiscal Year
(%)
Imaging Systems 224,460 (30.0)
Medical Systems 383,828 8.7
Life Science 118,819 (9.6)
Information & Communication 188,954 (25.7)
Others 64,742 (6.5)
Total 980,803 (13.1)
Note: Amounts do not include consumption tax.
(Per-Share Data)
Fiscal year ended March 31, 2008
(from April 1, 2007 to March 31, 2008)
Fiscal year ended March 31, 2009
(from April 1, 2008 to March 31, 2009)
Net assets per share ¥861.58 Net assets per share ¥387.31
Net income per share ¥202.11 Net loss per share ¥(188.85)
Fully diluted net income per share ¥202.07
Although potential shares exist, the fully diluted net income per share is not described here due to the net loss per share resulting from dilution.
Note: The basis for calculating net income per share, net loss per share, and fully diluted net income per share is as follows:
(Million of yen)
Fiscal year ended March 31, 2008
(from April 1, 2007 to March 31, 2008)
Fiscal year ended March 31, 2009
(from April 1, 2008 to March 31, 2009)
Net income (loss) 54,625 (50,561)
Amount that does not belong to ordinary shareholder
– –
Net income (loss) concerning common stock
54,625 (50,561)
Average number of shares during the year
270,271,738 shares 267,725,706 shares
Main components of the net income adjustment used for calculating the fully diluted net income per share
Adjustment for potential shares issued by consolidated subsidiaries
(11) –
Net income adjustment (11) –
Amount of increase of common stock
– –
Outline of the residual securities excluded from the calculation of the fully diluted net income per share because they have no dilutive effects.
There are share options as residual securities held by consolidated subsidiaries.
Same as left.

Olympus Corporation (7733) Financial Results for the Fiscal Year Ended March 31, 2009
32
(Important Subsequent Event)
Fiscal year ended March 31, 2008 (From April 1, 2007 to March 31, 2008)
Olympus Corporation, at a meeting of its Board of Directors on May 8, 2008, resolved to repurchase of its
own shares in order to increase shareholders’ returns and to implement more flexible capital policies in
accordance with changes of business environment under Article 156 of the Company Law as applied pursuant
to Article 165, Paragraph 3 of the Company Law as follows.
Resolution at a meeting of its Board of Directors regarding repurchase of own shares
1. Class of shares: Common stock
2. Total number of shares to be repurchased: Up to 3.5 million shares
3. Total cost of repurchase: Up to ¥10,000 million
4. Period of repurchase: From May 9, 2008 to June 20, 2008
5. Method of repurchase: Purchase in the market through a trust bank
The Company’s own shares acquired on the Tokyo Stock Exchange between May 9, 2008, and June 20, 2008,
amount to 2,958,000 shares of common stock at ¥9,998 million.
Fiscal year ended March 31, 2009 (From April 1, 2008 to March 31, 2009)
(Notification concerning Olympus Corporation making Iwaken Co., Ltd. its Wholly-Owned Subsidiary
through a Share Exchange)
The Board of Directors of Olympus Corporation (the “Company”) resolved to make Iwaken Co., Ltd.
(“Iwaken”) its wholly-owned subsidiary through a share exchange (the “Share Exchange”) with a scheduled
date of June 1, 2009, and entered into a basic agreement with Iwaken (the “Basic Agreement”) on April 10,
2009.
The Company plans to implement the Share Exchange without obtaining approval at General Meeting of
Shareholders in accordance with “simplified share exchange” (kan-i kabushiki kokan) procedures pursuant to
Article 796, Paragraph 3 of the Company Law of Japan.
1. Purpose of a Share Exchange
The Olympus Group has been focusing on steadily increasing profits in its Medical Systems Business, the
core product of which is endoscopes for medical use, while contributing to society by supplying “safe,
reliable and efficient” medical procedures.
In the midst of the substantial changes that are occurring in the environment surrounding medical treatment
as a result of recent reforms in the healthcare system, the Olympus Group and Iwaken have developed a close
partnership centering around the sale of Olympus Group products and Olympus Group Services.
The Company and Iwaken have entered into the Basic Agreement on the basis of their shared conclusion that
integration on both a capital and an operational level is the most appropriate way to enable both companies to
provide services of an even higher quality to medical institutions, research organizations and other customers.
2. Summary of the Share Exchange
(1) Schedule of the Share Exchange
April 10, 2009 Sign of the Basic Agreement between the Company and Iwaken
April 24, 2009 Meeting of the Board of Directors
(Resolution to approve the sign of the agreement pertaining to the Share
Exchange (the “Share Exchange Agreement”))
April 24, 2009 Sign of the Share Exchange Agreement between the Company and Iwaken
End of May, 2009 Extraordinary Meeting of Shareholders of Iwaken
(Resolution to approve the Share Exchange) (scheduled)
June 1, 2009 Effective date of the Share Exchange (scheduled)

Olympus Corporation (7733) Financial Results for the Fiscal Year Ended March 31, 2009
33
(2) Allocation of Shares in the Share Exchange
Name of Company
Olympus Corporation
(Parent Company after the Share Exchange)
Iwaken Co., Ltd.
(Wholly-Owned Subsidiary after the Share Exchange)
Allocation of Shares in the Share Exchange 1 8.7
Notes: 1. Share Exchange Ratio
In the Share Exchange, the Company will allocate and deliver 8.7 shares of common stock in exchange for one share of common stock of Iwaken.
2. Number of Shares to be Delivered through the Share Exchange 2,784,000 shares of common stock The Company will deliver common shares from its treasury stock to shareholders of Iwaken in the Share Exchange, and will not issue any new shares.
(3) Basis of Calculation of the Share Exchange Ratio
a. Basis of Calculation
In order to ensure the fairness and appropriateness of the calculation of the share exchange ratio in the Share
Exchange, the Company decided to ask a third party for its opinion as a specialist, and appointed ABeam
M&A Consulting Ltd. (“ABeam M&A Consulting”) as such third party.
When calculating the share value of the Company shares, ABeam M&A Consulting employed the market
price method, because the Company is a listed Company. ABeam M&A Consulting calculated the share
value of the Company in accordance with the market price method with reference to share prices during (i)
the past one-month period (from March 10, 2009 to April 9, 2009) and (ii) the past three-month period (from
January 13, 2009 to April 9, 2009).
When calculating the share value of Iwaken shares, ABeam M&A Consulting employed the discounted
cash flow method (the “DCF method”), because Iwaken is an unlisted company. The synergies that the
Company expects will arise as a result of Iwaken joining the Olympus Group were included in the future
profit plans which formed the basis of the analysis in accordance with the DCF method.
Based on the calculations of the respective share values of the Company and Iwaken in accordance with each
of the methods described above and on the basis that one share of the Company represents a value of one, the
share exchange ratio in the Share Exchange has been calculated by ABeam M&A Consulting as follows:
Range of the Share Exchange Ratio Valuation Between 6.03 and 11.58
The Company and Iwaken decided to use the share exchange ratio set forth above in the Share Exchange
based on the aforementioned calculations by ABeam M&A Consulting and as a result of thorough
discussions between the two companies. The share exchange ratio is subject to change upon consultation
between the Company and Iwaken in the event of a material change in any of the numerous factors upon
which calculations were based.
b. Relationship with the Appraiser
The appraiser, ABeam M&A Consulting, is not a related party of the Company or Iwaken.
3. Description of Iwaken Co., Ltd. (As of March 31, 2008)
Business Description Sales of medical appliances, physical and chemical instruments and
optical devices; repair services in connection with same
Head Office 6-4, Hongo 3-chome, Bunkyo-ku, Tokyo
Name and Title of Representative Seiji Iwasaki, Representative Director and President
Paid-in Capital ¥16 million
Net Assets ¥3,203 million (non-consolidated)
Total Assets ¥8,042 million (non-consolidated)

Olympus Corporation (7733) Financial Results for the Fiscal Year Ended March 31, 2009
34
(Merger of Consolidated Subsidiaries)
ITX Corporation, a consolidated subsidiary of the Company, resolved, at a meeting of its Board of Directors
held on December 16, 2008, to merge with its subsidiary IT Telecom, Inc. where ITX Corporation was the
surviving company and IT Telecom, Inc. was the absorbed company. The merger agreement was executed on
the same date. With respect to ITX Corporation, the merger was a simplified merger in accordance with
Article 796, Paragraph 3 of the Company Law and, with respect to IT Telecom, Inc., same was a short-form
merger in accordance with Article 784, Paragraph 1 of said Law. Therefore, a General Meeting of
Shareholders was not held for the approval of the merger. The merger took effect on April 1, 2009.
1. Names, etc. of companies subject to merger (1) Names of companies subject to merger
Merging company ITX Corporation (consolidated subsidiary of the Company) Merged company IT Telecom, Inc. (consolidated subsidiary of the Company)
(2) Description of business of merged company
Sales of mobile phones, etc. and broadband and other communications service provider
(3) Legal form of merger
Absorption-type merger where ITX Corporation is the surviving company and IT Telecom, Inc. is the absorbed company
(4) Name of entity after the merger
ITX Corporation
(5) Overview of transactions including the purpose
The purpose of the merger is to accelerate the advancement of business and strengthen the information and telecommunication service business as the core competency by concentrating managerial resources and integrating information and communication service functions fostered through various assets, resources and know-how over many years of the ITX Group.
2. Overview of accounting treatment
The “common control transactions” accounting treatment will be applied in accordance with the “Accounting
Standard Relating to Business Combinations” (Business Accounting Council) and the “Guidance on
Accounting Standard for Business Combinations and Accounting Standard for Business Divestitures” (ASBJ
Guidance No. 10). Consequently, this accounting treatment has no affect on the consolidated financial
statements.

Olympus Corporation (7733) Financial Results for the Fiscal Year Ended March 31, 2009
35
5. Non-Consolidated Financial Statements (1) Non-Consolidated Balance Sheets
(Millions of yen)
As of March 31, 2008 As of March 31, 2009
ASSETS
Current assets
Cash and time deposits 24,369 17,830
Notes receivable 755 517
Accounts receivable 21,972 19,940
Finished goods 4,659 4,323
Work in process 5,593 6,812
Raw materials and supplies 512 496
Short-term loans receivable from subsidiaries and affiliates
220,731 11,766
Other receivable 13,807 9,500
Income taxes receivable 468 -
Deferred income taxes 9,740 9,393
Suspense payments of funds - 17,731
Other current assets 2,126 2,821
Allowance for doubtful accounts (1,878) (436)
Total current assets 302,854 100,693
Fixed assets
Property, plant and equipment
Buildings 39,967 54,246
Accumulated depreciation (26,764) (28,040)
Buildings, net 13,203 26,206
Structures 3,115 3,325
Accumulated depreciation (2,097) (2,251)
Structures, net 1,018 1,074
Machinery and equipment 14,115 14,418
Accumulated depreciation (10,661) (11,353)
Machinery and equipment, net 3,454 3,065
Vehicles 62 60
Accumulated depreciation (53) (54)
Vehicles, net 9 6
Tools, furniture and fixtures 20,584 22,070
Accumulated depreciation (15,065) (16,577)
Tools, furniture and fixtures, net 5,519 5,493
Land 10,136 10,136
Lease assets - 530
Accumulated depreciation - (56)
Lease assets, net - 474
Construction in progress 4,126 799
Net property, plant and equipment 37,465 47,253

Olympus Corporation (7733) Financial Results for the Fiscal Year Ended March 31, 2009
36
(Millions of yen)
As of March 31, 2008 As of March 31, 2009
Intangible fixed assets
Goodwill 427 320
Patent right 2,464 2,205
Software 4,505 1,852
Software in progress 504 -
Lease assets - 113
Right of using facilities 65 64
Total intangible fixed assets 7,965 4,554
Investments and other assets Investment securities 66,510 44,238 Investment securities in subsidiaries and affiliates 148,610 332,111 Investments in capital of subsidiaries and affiliates 15,036 15,036 Long-term loans receivable 58 59 Long-term loans receivable from employees 129 99 Long-term loans receivable from subsidiaries and affiliates 3,861 8,198
Prepaid pension cost 6,188 8,236 Long-term prepaid expenses 4 2 Deferred income taxes 1,006 6,093 Investments in affiliates 46,869 8,458 Long-term accounts receivable-other - 4,763 Investment in progress 1,303 - Other assets 3,737 3,782 Allowance for doubtful accounts (1,842) (11,497)
Total investments and other assets 291,469 419,579
Total fixed assets 336,899 471,386
Total assets 639,752 572,078
LIABILITIES
Current liabilities
Notes payable 291 256
Accounts payable 9,145 9,497
Short-term borrowings 191,305 1,305
Current maturities of bonds 35,000 20,000
Current maturities of long-term borrowings 20,000 -
Lease liabilities - 138
Other payable 12,908 18,950
Accrued expenses 17,071 12,889
Income taxes payable 214 3,510
Advances received 142 278
Deposits received 69,109 38,581
Provision for product warranties 52 76
Other current liabilities 3 268
Total current liabilities 355,239 105,748

Olympus Corporation (7733) Financial Results for the Fiscal Year Ended March 31, 2009
37
(Millions of yen)
As of March 31, 2008 As of March 31, 2009
Non-current liabilities
Long-term bonds, less current maturities 105,000 130,000
Long-term borrowings, less current maturities 65,000 300,000
Long-term deposits received, less current maturities 732 751
Lease liabilities - 447
Provision for loss on guarantees 632 -
Total non-current liabilities 171,364 431,198
Total liabilities 526,603 536,946
NET ASSETS
Shareholders’ equity
Common stock 48,332 48,332
Capital surplus
Legal capital surplus 73,027 73,027
Other capital surplus 22 22
Total capital surplus 73,049 73,049
Retained earnings
Legal reserve 6,626 6,626
Other retained earnings
Reserve for product development 4,000 4,000
Reserve for special depreciation 537 238
Reserve for advanced depreciation 2,744 2,567
General reserve 59,069 59,069
Retained earnings carried forward (71,019) (144,838)
Total retained earnings 1,957 (72,338)
Treasury stock, at cost (2,634) (12,874)
Total shareholders’ equity 120,704 36,169
Valuation and translation adjustments
Net unrealized holding gains (losses) on available-for-sale securities, net of taxes
5,616 (878)
Net unrealized gains (losses) on hedging derivatives, net of taxes
(13,171) (160)
Total valuation and translation adjustments (7,555) (1,037)
Total net assets 113,149 35,132
Total liabilities and net assets 639,752 572,078

Olympus Corporation (7733) Financial Results for the Fiscal Year Ended March 31, 2009
38
(2) Non-Consolidated Statements of Income
(Millions of yen)
Fiscal year ended March 31, 2008
Fiscal year ended March 31, 2009
Net sales
Net sales of finished goods 83,929 76,427
Service revenue 29,942 28,688
Total net sales 113,871 105,115
Costs of sales
Cost of finished goods sold
Beginning finished goods 4,784 4,659
Cost of products manufactured 54,554 53,770
Total 59,338 58,429
Transfer to other account 993 1,303
Ending finished goods 4,659 4,323
Cost of finished goods sold 53,686 52,803
Cost of service 4,613 5,555
Total cost of sales 58,299 58,358
Gross profit 55,572 46,757
Selling, general and administrative expenses 61,087 59,102
Operating loss (5,515) (12,345)
Non-operating income
Interest income 460 917
Interest on securities 262 170
Dividends income 50,610 29,652
Foreign currency exchange gain 118 -
Others 863 570
Total non-operating income 52,313 31,309
Non-operating expenses
Interest expenses 1,651 4,805
Interest on bonds 1,781 2,187
Amortization of bond issuance cost - 209
Foreign currency exchange loss - 710
Provision of allowance for doubtful accounts 3,206 3,220
Others 2,645 2,132
Total non-operating expenses 9,282 13,264
Ordinary income 37,517 5,701
Extraordinary income
Gain on sales of fixed assets 395 -
Gain on sales of investment securities 66 34
Gain on sales of investment securities in subsidiaries and affiliates
- 1,752
Reversal of provision for loss on guarantees - 632
Total extraordinary income 461 2,418

Olympus Corporation (7733) Financial Results for the Fiscal Year Ended March 31, 2009
39
(Millions of yen)
Fiscal year ended March 31, 2008
Fiscal year ended March 31, 2009
Extraordinary losses
Loss on valuation of investment securities 2,802 13,127
Loss on valuation of investment securities in subsidiaries and affiliates
4,023 46,671
Provision of allowance for doubtful accounts - 4,763
Loss on valuation of investments in affiliates 4,291 1,755
Total extraordinary losses 11,116 66,316
Income (loss) before provision for income taxes 26,861 (58,198)
Income taxes, current (3,924) 5,850
Income taxes for prior periods 1,049 -
Income taxes, deferred (1,426) (502)
Total (4,301) 5,348
Net income (loss) 31,163 (63,545)

Olympus Corporation (7733) Financial Results for the Fiscal Year Ended March 31, 2009
40
(3) Non-Consolidated Statement of Changes in Net Assets
(Millions of yen)
Fiscal year ended March 31, 2008
Fiscal year ended March 31, 2009
Shareholders’ equity
Common stock
Net assets at March 31, 2008 48,331 48,332
Changes during the year
Net changes during the year - -
Balance at March 31, 2009 48,332 48,332
Capital surplus
Legal capital surplus
Net assets at March 31, 2008 73,027 73,027
Changes during the year
Net changes during the year - -
Balance at March 31, 2009 73,027 73,027
Other capital surplus
Net assets at March 31, 2008 22 22
Changes during the year
Net changes during the year - -
Balance at March 31, 2009 22 22
Retained earnings
Legal reserve
Net assets at March 31, 2008 6,626 6,626
Changes during the year
Net changes during the year - -
Balance at March 31, 2009 6,626 6,626
Other retained earnings
Net assets at March 31, 2008 (23,938) (4,669)
Changes during the year
Cash dividends paid (11,893) (10,749)
Net income (loss) 31,163 (63,545)
Net changes during the year 19,270 (74,295)
Balance at March 31, 2009 (4,669) (78,964)
Treasury stock, at cost
Net assets at March 31, 2008 (2,264) (2,634)
Changes during the year
Acquisition of treasury stock (370) (10,240)
Net changes during the year (370) (10,240)
Balance at March 31, 2009 (2,634) (12,874)
Total shareholders’ equity
Net assets at March 31, 2008 101,803 120,704
Changes during the year
Cash dividends paid (11,893) (10,749)
Net income (loss) 31,163 (63,545)
Acquisition of treasury stock (370) (10,240)
Net changes during the year 18,900 (84,535)
Balance at March 31, 2009 120,704 36,169

Olympus Corporation (7733) Financial Results for the Fiscal Year Ended March 31, 2009
41
(Millions of yen)
Fiscal year ended March 31, 2008
Fiscal year ended March 31, 2009
Valuation and translation adjustments
Net unrealized holding gains (losses) on available-for-sale securities, net of taxes
Net assets at March 31, 2008 13,285 5,616
Changes during the year
Net changes in items other than shareholders’ equity (7,669) (6,493)
Net changes during the year (7,669) (6,493)
Balance at March 31, 2009 5,616 (878)
Net unrealized gains (losses) on hedging derivatives, net of taxes
Net assets at March 31, 2008 (5) (13,171)
Changes during the year
Net changes in items other than shareholders’ equity (13,165) 13,011
Net changes during the year (13,165) 13,011
Balance at March 31, 2009 (13,171) (160)
Total valuation and translation adjustments
Net assets at March 31, 2008 13,279 (7,555)
Changes during the year
Net changes in items other than shareholders’ equity (20,834) 6,518
Net changes during the year (20,834) 6,518
Balance at March 31, 2009 (7,555) (1,037)
Total net assets
Net assets at March 31, 2008 115,083 113,149
Changes during the year
Cash dividends paid (11,893) (10,749)
Net income (loss) 31,163 (63,545)
Acquisition of treasury stock (370) (10,240)
Net changes in items other than shareholders’ equity (20,834) 6,518
Net changes during the year (1,934) (78,017)
Balance at March 31, 2009 113,149 35,132

Olympus Corporation (7733) Financial Results for the Fiscal Year Ended March 31, 2009
42
Marginal notes for Non-Consolidated Statement of Changes in Net Assets
Fiscal year ended March 31, 2008 Note: 1. Breakdown of other retained earnings
(Millions of yen)
Reserve for
product development
Reserve for special
depreciation
Reserve for advanced
depreciation
General reserve
Retained earnings carried forward
Total
Net assets at March 31, 2007 4,000 944 2,624 79,068 (110,577) (23,938)
Changes during the year
Cash dividends paid (11,893) (11,893)
Reversal of reserve for special
depreciation (408) 408 -
Provision of reserve for advanced
depreciation 294 (294) -
Reversal of reserve for advanced
depreciation (174) 174 -
Reversal of general reserve (20,000) 20,000 -
Net income (loss) 31,163 31,163
Net changes during the year - (408) 120 (20,000) 39,558 19,270
Balance at March 31, 2008 4,000 537 2,744 59,069 (71,019) (4,669)
Note: 2. Net assets at March 31, 2007 is truncated to the nearest million yen, and balance at March 31, 2008 and
Changes during the year are rounded off to the nearest million yen. As dividends were already paid in accordance with the procedures based on the resolution by the general shareholders’ meeting and the Board of Directors, the amount of retained earnings carried forward was determined after subtracting the dividends.
Fiscal year ended March 31, 2009 Note: Breakdown of other retained earnings
(Millions of yen)
Reserve for
product development
Reserve for special
depreciation
Reserve for advanced
depreciation
General reserve
Retained earnings carried forward
Total
Net assets at March 31, 2008 4,000 537 2,744 59,069 (71,019) (4,669)
Changes during the year
Cash dividends paid (10,749) (10,749)
Reversal of reserve for special
depreciation (299) 299 -
Reversal of reserve for advanced
depreciation (177) 177 -
Net income (loss) (63,545) (63,545)
Net changes during the year - (299) (177) - (73,819) (74,295)
Balance at March 31, 2009 4,000 238 2,567 59,069 (144,838) (78,964)
As dividends were already paid in accordance with the procedures based on the resolution by the general shareholders’ meeting and the Board of Directors, the amount of retained earnings carried forward was determined after subtracting the dividends.
(4) Notes on Premise of Going Concern
No items to report.

1
(Before Correction)
Consolidated Financial Results for the Fiscal Year Ended March 31, 2009
May 12, 2009
Company Name: Olympus Corporation Code Number: 7733 (URL: http://www.olympus.co.jp/) Stock Exchange Listing: First Section of Tokyo Stock Exchange Representative: Tsuyoshi Kikukawa, President and Representative Director Contact: Hironobu Kawamata, General Manager, Accounting Division Phone: 03-3340-2111 Scheduled date to General Meeting of Shareholders: June 26, 2009 Scheduled date to submit the Securities Report: June 26, 2009 Scheduled date to commence dividend payments: –
(Figures are rounded off to the nearest million yen)
1. Consolidated Financial Results for the Fiscal Year Ended March 31, 2009 (From April 1, 2008 to March 31, 2009)
(1) Consolidated Results of Operations (% indicate changes from the previous fiscal year) Net sales Operating income Ordinary income Net income
Fiscal year ended (¥ million) % (¥ million) % (¥ million) % (¥ million) %
March 31, 2009 980,803 (13.1) 34,587 (69.3) 18,390 (80.2) (114,810) –
March 31, 2008 1,128,875 6.3 112,623 14.1 93,085 22.1 57,969 21.3
Net income per
share Fully diluted net income per share
Return on equity Ratio of ordinary
income to total assets Ratio of operating income to net sales
Fiscal year ended (¥) (¥) % % %
March 31, 2009 (428.83) – (44.4) 1.5 3.5
March 31, 2008 214.48 214.44 16.8 7.6 10.0
Note: Equity in earnings (losses) of affiliated companies: Fiscal year ended March 31, 2009: ¥ (1,704) million Fiscal year ended March 31, 2008: ¥ (2,766) million
(2) Consolidated Financial Position Total assets Net assets Equity ratio Net assets per share
As of (¥ million) (¥ million) % (¥)
March 31, 2009 1,106,318 168,784 14.6 603.92
March 31, 2008 1,358,349 367,876 26.2 1,318.65
Note: Equity as of March 31, 2009: ¥161,364 million March 31, 2008: ¥356,351 million
(3) Consolidated Cash Flows
Cash flows from
operating activities Cash flows from
investing activities Cash flows from
financing activities Cash and cash equivalents
at end of year Fiscal year ended (¥ million) (¥ million) (¥ million) (¥ million)March 31, 2009 41,628 (20,728) (3,751) 132,720
March 31, 2008 89,006 (304,303) 164,401 119,842

Olympus Corporation (7733) Financial Results for the Fiscal Year Ended March 31, 2009
2
2. Dividends
Cash dividends per share Total amount of cash dividends
Payout ratio Ratio of
dividends to net assets
(Record date) First
quarter Second quarter
Third quarter
Year-end Annual (Annual) (Consolidated) (Consolidated)
Fiscal year ended (¥) (¥) (¥) (¥) (¥) (¥) % %March 31, 2008 – 20.00 – 20.00 40.00 10,810 18.6 3.1
March 31, 2009 – 20.00 – 0.00 20.00 5,345 – 2.1
Fiscal year ending March 31, 2010 (Forecast)
– 15.00 – 15.00 30.00 20.0
3. Forecast of Consolidated Financial Results for the Fiscal Year Ending March 31, 2010 (From April 1, 2009 to March 31, 2010) (% indicate changes from the previous fiscal year)
Net sales Operating income Ordinary income Net income
Net income per share
(¥ million) % (¥ million) % (¥ million) % (¥ million) % (¥)
Six months 420,000 (21.6) 15,000 (53.3) 5,500 (71.9) 33,000 815.9 123.51
Full year 900,000 (8.2) 59,000 70.6 40,000 117.5 40,000 – 149.70
4. Others (1) Changes in significant subsidiaries during period under review (changes in specified subsidiaries resulting
in the changes in scope of consolidation): No (2) Changes in accounting policies, procedures, methods of presentation for preparing the consolidated
financial statements (changes described in the section of “Changes in Important Items That Form the Basis for Preparing the Consolidated Financial Statements”)
1) Changes due to revisions to accounting standards, and other regulations: Yes 2) Changes due to other reasons: No Note: For details, refer to “Changes in Important Items That Form the Basis for Preparing the Consolidated Financial
Statements” on p. 24.
(3) Total number of issued shares (common stock) 1) Total number of issued shares at the end of the fiscal year (including treasury stock)
As of March 31, 2009 271,283,608 shares
As of March 31, 2008 271,283,608 shares
2) Total number of treasury shares at the end of the fiscal year As of March 31, 2009 4,089,222 shares
As of March 31, 2008 1,044,440 shares Note: Please refer to p. 30 (“Per-Share Data”) for the number of shares that are used as the basis for the calculation of net
income per share (consolidated).

Olympus Corporation (7733) Financial Results for the Fiscal Year Ended March 31, 2009
3
Reference: Summary of Non-Consolidated Financial Results
Financial results for the Fiscal Year ended March 31, 2009 (From April 1, 2008 to March 31, 2009)
(1) Non-Consolidated Results of Operations (% indicates changes from the previous fiscal year)
Net sales Operating income Ordinary income Net income
Fiscal year ended (¥ million) % (¥ million) % (¥ million) % (¥ million) %March 31, 2009 105,115 (7.7) (12,345) – 5,556 (85.5) (136,227) –
March 31, 2008 113,871 7.3 (5,515) – 38,264 410.0 41,308 414.0
Net income per share Fully diluted net income
per share Fiscal year ended (¥) (¥)March 31, 2009 (508.83) –
March 31, 2008 152.84 –
(2) Non-Consolidated Financial Position Total assets Net assets Equity ratio Net assets per share
As of (¥ million) (¥ million) % (¥)March 31, 2009 627,610 93,999 15.0 351.80
March 31, 2008 788,853 244,568 31.0 905.01
Note: Equity as of March 31, 2009: ¥93,999 million March 31, 2008: ¥244,568 million
* Proper use of the forecast of financial results, and other special matters The forward-looking statements, including forecast of financial results, contained in these materials include predictions based on future assumptions, projections and plans made at the time these materials were announced. Actual business results may differ substantially from the forecast due to certain risks and uncertain factors relating to movements in the global economy, competitive conditions and foreign exchange rates, among others. Please refer to p. 7-8 for matters relating to the forecast of financial results.

Olympus Corporation (7733) Financial Results for the Fiscal Year Ended March 31, 2009
4
1. Results of Operations
(1) Analysis of Business Results
(Review of Operations)
Analysis of the overall operations (Millions of yen)
Net sales Operating income Ordinary income Net income (loss) Net income (loss)
per share
Fiscal year ended March 31, 2009 980,803 34,587 18,390 (114,810) ¥(428.83)
Fiscal year ended March 31, 2008 1,128,875 112,623 93,085 57,969 ¥214.48
Increase (Decrease) Ratio (%) (13.1) (69.3) (80.2) – –
Comparison Table of Average Exchange Rate (Yen) Current fiscal year Previous fiscal year
Against the U.S. dollar 100.54 114.28
Against the euro 143.48 161.53
In the Japanese economy during the fiscal year under review, exports, capital investments and consumer
spending deteriorated sharply and the yen appreciated rapidly as the global financial crisis assumed serious
proportions. Although the world economy continued to expand mainly in the emerging countries during the
first half-year, business conditions mainly in Europe, North America and Asia generally slowed down rapidly
in the second half-year as a result of the financial crisis and the weakened real economy, showing clearer
signs of the worldwide recession.
Amid this adverse business environment, the Olympus Group endeavored to strengthen its organizational
capabilities to implement valid strategies in accordance with its “’06 Corporate Strategic Plan” that it
formulated as the medium-term business plan in 2006 by, for example, bolstering the global sales structure in
the surgical field of its Medical Systems Business with a view to generating a synergistic effect from Gyrus, a
British medical treatment equipment company, that it acquired in February 2008. In addition, in February
2009, the Olympus Group decided to assign its analyzer business to Beckman Coulter Inc. of the U.S. in July
2009.
While the Olympus Group’s Medical Systems Business remained robust, the consolidated net sales decreased
¥148,072 million (13.1% year-on-year) to ¥980,803 million due to the worldwide business slowdown and
sharp appreciation of the yen during the second half-year. Operating income decreased (69.3% year-on-year)
to ¥34,587 million due to the adverse influences of exchange rate movements, reduced revenue from the
Imaging Systems Business, costs of the business merger with Gyrus, and increased depreciation expenses
associated with other consolidated subsidiaries. Ordinary income decreased (80.2% year-on-year) to ¥18,390
million primarily due to the deterioration in operating income. The Olympus Group ended the year with a
consolidated net loss of ¥114,810 million (in contrast to a net income of ¥57,969 million for the previous
fiscal year) as it recorded an extraordinary losses aggregating ¥110,382 million including a loss of ¥15,797
million on valuation of investment securities due to the heavily fallen market values and, with respect to
shares of subsidiaries ¥76,201 million on one-time amortization of goodwill related to the subsidiaries as a
result of the recording of a loss on valuation of investment securities in subsidiaries and affiliates, and income
taxes aggregating ¥25,870 million.
The yen appreciated far more sharply against both the U.S. dollar and the euro than it had during the previous
fiscal year, and the yen stood on average at ¥100.54 against the U.S. dollar and ¥143.48 against the euro
during the fiscal year under review, which caused net sales and operating income to drop by ¥81,900 million
and ¥24,900 million, respectively, year-on-year.

Olympus Corporation (7733) Financial Results for the Fiscal Year Ended March 31, 2009
5
During the fiscal year under review, the Olympus Group invested ¥70,010 million on research and
development, and spent ¥55,632 million on capital investments.
Analysis of the performance by segment
(Millions of yen)
Net sales Operating income (loss)
Previous fiscal year
Current fiscal year
Increase (Decrease) ratio
(%)
Previous fiscal year
Current fiscal year
Increase (Decrease) ratio
(%)
Imaging Systems 320,589 224,460 (30.0) 33,086 (5,131) –
Medical Systems 353,269 383,828 8.7 98,420 75,043 (23.8)
Life Science 131,446 118,819 (9.6) 6,990 4,760 (31.9)
Information & Communication
254,312 188,954 (25.7) 3,001 907 (69.8)
Others 69,259 64,742 (6.5) 917 (13,963) –
Subtotal 1,128,875 980,803 (13.1) 142,414 61,616 (56.7)
Elimination or unallocation
– – – (29,791) (27,029) –
Consolidated total 1,128,875 980,803 (13.1) 112,623 34,587 (69.3)
Note: Businesses are segmented by adding similarities of sales market to the business established based on line of products.
Imaging Systems Business
In the Imaging Systems Business, the Olympus Group registered consolidated net sales of ¥224,460 million
(down 30.0 % year-on-year) and an operating loss of ¥5,131 million (in contrast to an operating income of
¥33,086 million in the previous fiscal year).
In the digital camera field, sales of compact camera, the “μ TOUGH” Series, boasting three major features of
water/dust resistance, shock/load resistance and low-temperature movement, remained robust. In addition,
Olympus launched new single-lens reflex models “E-30” and “E-620” equipped with the art filter feature that
makes creative photographic expressions possible. However, sales declined mainly because fewer units were
sold in step with the weakening market demand which was affected by the adverse influences of exchange
rate movements and global economic downturn.
In the recorder field, the “Voice-Trek V” Series whose connectable design enabling direct connection to
personal computers proved popular and sold favorably during the first half-year, but sales declined amid the
global economic downturn in the second half-year.
The Olympus Group made serious efforts to reduce its selling, general and administrative expenses and
inventories, but registered an operating loss as it was unable to fully make up for the reduced sales of digital
cameras which resulted from the declined sales volume and unit sales prices due to the worldwide slowdown
in consumer spending.
Medical Systems Business
Consolidated net sales in the Medical Systems Business amounted to ¥383,828 million (8.7% increase over
the previous fiscal year), while operating income amounted to ¥75,043 million (23.8% decrease over the
previous fiscal year).
In the medical endoscope field, high-definition videoscopes sold steadily both at home and abroad.
However, overall sales for the medical endoscope field fell off due to the adverse influences of
exchange rate movements.
In the field of surgical and endotherapy products, sales of “VISERA Pro System,” an integrated

Olympus Corporation (7733) Financial Results for the Fiscal Year Ended March 31, 2009
6
endoscope video system which can be used to support endoscopic surgeries, pancreatico-biliary
therapeutic devices such as guide wires, and gastric catheters which supply nourishment directly to the
stomach, expanded in Japan. In overseas markets, an integrated endoscopic surgical system and
sampling treatment services such as biopsy forceps sold well primarily in North America. In addition,
sales of Gyrus, a British medical treatment equipment company that Olympus acquired in February
2008, contributed to the consolidated sales. Hence, sales for the field of surgical and endotherapy
products as a whole expanded.
Operating income decreased due to the increased depreciation expenses associated with the business
integration with Gyrus and the adverse influences of exchange rate movements.
Life Science Business
Consolidated net sales for the Life Science Business was ¥118,819 million (9.6% decrease over the previous
fiscal year), while operating income amounted to ¥4,760 million (31.9% decrease compared to the previous
fiscal year).
In the micro-imaging (microscopes) field, biological microscopes for teaching practice purposes in
Japan and the “FLUOVIEW” Series of confocal scanning laser microscopes in the U.S. sold favorably,
but sales for the micro-imaging field as a whole decreased primarily because sales of industrial
microscopes dropped sharply as auto- and semiconductor-related industries put restraints on capital
investments with the worsening economy.
In the diagnostic systems (clinical laboratory test) field, sales of small and medium-sized clinical
chemistry analyzer expanded mainly in Europe and North America, and sales of transfusion test
reagents and expendables grew robustly also in Europe and North America. However, sales for the field
as a whole fell off as sales in Japan continued to lag.
Operating income for the Life Science Business as a whole decreased mainly due to the appreciating
yen and reduced sales in the micro-imaging field.
Information & Communication Business
Consolidated net sales for the Information & Communication Business was ¥188,954 million (25.7%
decrease over the previous fiscal year), while operating income showed ¥907 million (69.8% decrease over
the previous fiscal year).
In the mobile field, sales of mobile phones fell off primarily because mobile phone owners’ upgrade
cycle got longer in the wake of telecommunications carriers’ revisions of price plans and market
demand for mobile phones decreased due to the slowdown in consumer spending in the wake of the
deflationary spiral.
For operating income, gross profit rate improved as Olympus raised the proportion of more profitable directly
managed stores and controlled discounts on mobile telephone terminals in the mobile phone sales business.
Moreover, cost reductions in the automobile aftermarket business were implemented. However, due to a
decreased gain on sales of stocks on small business development business of which we promoted in the
previous fiscal year, operating income resulted in a decline during the fiscal year.
Others
Consolidated net sales for other businesses was ¥64,742 million (6.5% decrease over the previous fiscal year)
and operating loss was ¥13,963 million (in contrast to an operating income of ¥917 million for the
previous fiscal year).
In the non-destructive testing equipment field, ultrasonographic inspection systems equipped with phased-
array features sold briskly, but sales of industrial endoscopes decreased as manufacturing sectors put the

Olympus Corporation (7733) Financial Results for the Fiscal Year Ended March 31, 2009
7
brakes on investments amid the worldwide economic downturn, and sales for the non-destructive testing
equipment field as a whole decreased as well.
Sales for the information equipment field increases as Olympus launched new models of high-speed inkjet
printers in collaboration with RISO KAGAKU CORPORATION and sales of the existing lineups of printers
also grew.
In the biomedical materials field, sales of “OSferion,” an artificial bone replacement material, grew as it came
within coverage of medical insurance for bone marrow transplants in Japan and was also offered for sale in
Europe and China.
Olympus registered an operating loss due to the increased costs associated with amortization of goodwill of
the subsidiaries that had been consolidated during the previous fiscal year and with structural reform
including portfolio reexamination at ITX Corporation.
(Forecast for the Fiscal Year Ending March 31, 2010)
Forecast for the overall business and analysis of its preconditions
With no positive sign of business recovery in sight at home or abroad, the Japanese economy is expected to
remain sluggish in the foreseeable future. Elsewhere in the world, there is a certain amount of hope for
positive outcomes of fiscal and monetary measures including the U.S. government’s actions aimed at
bringing about financial stability, but there are also concerns there will be a prolonged recession and even a
further business downswing.
Amid these adverse conditions, we, the Olympus Group, will continuously move ahead with a structural
reform and build a corporate structure whereby we can secure profits even in the most testing of business
environments.
In the Imaging Systems Business, we will focus our energy on developing and marketing unique and high-
value added products such as a digital single-lens camera with interchangeable lenses that can be dramatically
reduced in size and weight by way of the Micro Four Thirds System standard which takes advantages of the
superiority of entirely digital designing.
In the Medical Systems Business, we will globally bolster the surgical field where we expanded our business
platform by acquiring Gyrus, and will seek to expand our earnings by simultaneously focusing our energy on
endotherapy products.
We will also strive to optimize our manufacturing cost structure and deal with changes in exchange rates by
building a global manufacturing system.
In addition, we will endeavor to implement an optimal business portfolio and resource allocation, and
develop related businesses in the medical/health and imaging/information fields.

Olympus Corporation (7733) Financial Results for the Fiscal Year Ended March 31, 2009
8
The forecast for the fiscal year ending March 31, 2010 is as follows.
(Millions of yen)
Net sales Operating
income Ordinary income
Net income (loss)
Net income (loss) per share
Fiscal year ending March 31, 2010 900,000 59,000 40,000 40,000 ¥149.70
Fiscal year ended March 31, 2009 980,803 34,587 18,390 (114,810) ¥ (428.83)
Increase (Decrease) ratio (%) (8.2) 70.6 117.5 – –
In addition to the impact of strong yen compare to the previous fiscal year, we expect to see our sales to be
decreased mainly due to a plan to assign the Olympus Group’s analyzer business to the Beckman Coulter
Group effective July 1, 2009. At the same time, we forecast that Imaging Systems Business and Life Science
Business will be the drivers to boost the operating income and Information & Communication Business and
the other businesses should also improve operating income, ordinary income and net income owing to an
improved profitability as a result of structural reform. The exchange rates forming the basis of our forecast
for the next fiscal year are: US$1 = ¥95 and €1 = ¥120.
Forecast by segment and analysis of preconditions (Millions of yen)
Net sales Operating income (loss)
Fiscal year ended
March 31, 2009
Fiscal year ended
March 31, 2010
Increase (Decrease) ratio (%)
Fiscal year ended
March 31, 2009
Fiscal year ended
March 31, 2010
Increase (Decrease)
Imaging Systems 224,460 196,000 (12.7) (5,131) 3,000 8,131
Medical Systems 383,828 364,000 (5.2) 75,043 75,000 (43)
Life Science 118,819 73,500 (38.1) 4,760 3,000 (1,760)
Information & Communication
188,954 197,500 4.5 907 5,000 4,093
Others 64,742 69,000 6.6 (13,963) (1,000) 12,963
Subtotal 980,803 900,000 (8.2) 61,616 85,000 23,384
Elimination or unallocation
– – – (27,029) (26,000) 1,029
Consolidated total 980,803 900,000 (8.2) 34,587 59,000 24,413
Note: Businesses are segmented by adding similar sales markets to businesses established based on the product lines.
In the Life Science Business, the Company expects a decline in profits due to strong yen effects and the
transfer of the analyzer business, among others. Contrastingly, the Medical Systems Business is projected to
secure operating income at roughly the same level as the previous fiscal year, despite said strong yen effects,
as a result of expanded sales of endoscopes and surgical products, which feature observation using
specialized light spectra, as well as Gyrus products. Our Imaging Systems Business is expected to return to
profitability thanks not only to the introduction of the Micro Four Thirds System in new products but also to
effects from reductions in cost of sales and selling, general and administrative expenses, among others. The
Information & Communication Business and other businesses are expected to witness significant
improvements in revenue and expenses attributable to better profitability as a result of business structural
reforms.

Olympus Corporation (7733) Financial Results for the Fiscal Year Ended March 31, 2009
9
(2) Financial Position
(Analysis of the Status of Assets, Liabilities, Net Assets, and Cash Flows in the Current Fiscal Year)
Analysis of assets, liabilities and net assets
(Millions of yen)
As of March 31, 2008 As of March 31, 2009 Increase (Decrease) Increase (Decrease)
Ratio (%)
Total assets 1,358,349 1,106,318 (252,031) (18.6)
Net assets 367,876 168,784 (199,092) (54.1)
Equity ratio 26.2% 14.6% (11.6%) –
As of the end of the consolidated fiscal year under review, total assets decreased ¥252,031 million year-on-
year to ¥1,106,318 million, primarily as a result of decrease of ¥21,404 million in cash and time deposits,
¥33,297 million in notes and accounts receivable, ¥139,410 million in intangible fixed assets attributable to
amortization of goodwill and customer related assets, and ¥57,160 million in investments and other assets.
Total liabilities decreased ¥52,939 million year-on-year to ¥937,534 million, primarily as a result of
decreases of ¥16,998 million in notes and accounts payable, and ¥21,083 million in accounts payable-other.
Net assets decreased ¥199,092 million year-on-year to ¥168,784 million, primarily due to decrease of
¥127,410 million in retained earnings, the acquisition of ¥9,998 million worth of treasury stock as a means of
returning profits to shareholders, and ¥57,337 million in valuation and translation adjustments arising from
fluctuations in exchange rates and stock prices. As a result of the foregoing, equity ratio declined from 26.2%
as of the end of the previous consolidated fiscal year to 14.6%.
Analysis of cash flows
(Millions of yen)
Fiscal year ended March 31, 2008
Fiscal year ended March 31, 2009
Increase (Decrease)
Cash flows from operating activities 89,006 41,628 (47,378)
Cash flows from investing activities (304,303) (20,728) 283,575
Cash flows from financing activities 164,401 (3,751) (168,152)
Cash and cash equivalents at end of year 119,842 132,720 12,878
“Cash flows from operating activities” increased by ¥41,628 million mainly due to ¥44,804 million in
depreciation and amortization and ¥101,459 million in the amortization of goodwill, among others.
Contrastingly, decreasing factors mainly included a ¥91,301 million loss before provision for income taxes
and a ¥14,340 million decrease in accounts payable.
“Cash flows from investing activities” decreased by ¥20,728 million mainly due to purchases of property,
plant and equipment totaling ¥43,829 million as well as ¥40,390 million in additional acquisitions of
consolidated subsidiaries. Contrastingly, increasing factors mainly included ¥38,440 million in withdrawals
from time deposits, and ¥40,538 million from the sales and redemption of investment securities.
“Cash flows from financing activities” decreased by ¥3,751 million mainly due to a ¥218,220 million net
decrease in short-term borrowings, ¥33,603 million in repayments of long-term debt, a ¥10,240 million
expenditure on acquisition of treasury stock and ¥10,749 million in dividends paid.
As a result, cash and cash equivalents at the end of the current fiscal year reached ¥132,720 million, an
increase of ¥12,878 million compared to the end of the previous fiscal year.

Olympus Corporation (7733) Financial Results for the Fiscal Year Ended March 31, 2009
10
(Cash Flows Indicators) Fiscal year ended
March 31, 2006Fiscal year ended March 31, 2007
Fiscal year ended March 31, 2008
Fiscal year ended March 31, 2009
Equity ratio (%) 29.8 30.6 26.2 14.6
Market value equity ratio (%) 95.9 99.8 60.1 38.2
Interest-bearing debt to cash flows ratio (years)
9.1 4.3 7.4 15.9
Interest coverage ratio (times) 5.3 8.7 6.4 2.6
Notes: Equity ratio: Shareholders’ equity/Total assets Market value equity ratio: Total market capitalization/Total assets Interest-bearing debt to cash flows ratio: Interest-bearing debt/Cash flow Interest coverage ratio: Cash flow/Interest payment 1. Each index was calculated by financial index of Consolidated basis. 2. Total market capitalization is calculated on the basis of the number of issued shares excluding treasury stocks. 3. Cash flows from operating activities are used as “Cash flow” for calculation purposes. 4. Interest-bearing debts include all of those debts reported on the Consolidated balance sheets on which interest is
paid.
(3) Basic Strategy for Profit Sharing and Dividend for the Current Fiscal Year and Following Fiscal Year
We set our basic strategy to implement dividends, considering performance while securing continued profit
sharing in order to respond to the expectations of our shareholders. Depending on circumstances, we are
considering returning profits to shareholders by the acquisition of treasury stock. With regard to earning
retention, research and development, capital investments, capital affiliations and other measures to strengthen
our businesses will be proactively carried out to improve long-term corporate value.
However, we sincerely regret that, due to the significant amount of net loss posted in the current fiscal year,
no year-end dividends will be paid. As a result, the annual dividend together with the interim dividends of
¥20, which have already been paid, is ¥20 per share.
The amount of dividends for the following year is expected to be ¥30 per share (¥15 for interim dividends,
and ¥15 for year-end dividends).
(4) Business Risks
The business performances of the Olympus Group may be materially influenced by various factors which
may occur in the future. Listed below are principal business risk factors, aside from managerial decisions
made by the Olympus Group, which may give rise to changes in Olympus Group’s business performances.
The Olympus Group is aware of the possibilities of these risks, will strive to prevent them from occurring,
and will deal conscientiously and diligently with any risk that may occur.
The future events described below are based on the judgment of the Olympus Group made as of the end of
the fiscal year under review.
(Risks Associated with Selling Activities)
(i) In the Digital Camera Business, price competition in the market is intensifying steadily. If market prices
fall more sharply than anticipated, such price falls may not adequately be absorbed by the cost reduction
measures that the Olympus Group is currently advancing and may adversely impact the Olympus
Group’s ability to secure its earnings.
(ii) In the Medical Systems Business, if, as a result of a healthcare system reform, the healthcare policy is
amended in an unforeseeable and material manner, and if the Olympus Group finds it difficult to adapt
itself to the environmental change, the Olympus Group’s ability to secure its earnings may be adversely
impacted.

Olympus Corporation (7733) Financial Results for the Fiscal Year Ended March 31, 2009
11
(iii) In the Micro-Imaging (Microscopes) Business, system provision to research activities funded by national
budgets of countries accounts for a high proportion of earnings of the Olympus Group. Therefore, if such
national budgets are curtailed in the wake of unfavorable macroeconomic fluctuations, the Olympus
Group’s ability to secure its earnings may be adversely impacted.
(Risks Associated with Production/Development Activities)
(i) In the Imaging Systems Business, core production bases center on China. Therefore, depending upon
how sharply the Chinese yuan is revalued, operating costs may increase substantially, and the Olympus
Group’s ability to secure its earnings may be adversely impacted. Also, depending upon how serious or
unstable the state of affairs including anti-Japanese activities may grow or how badly public safety may
deteriorate in China, the Olympus Group’s production activities may be adversely impacted.
(ii) The Olympus Group relies on certain specific suppliers to consistently develop and produce those
products and parts which it cannot develop or produce internally. Hence, if the Group is subjected to
constraints on procurement of such products and parts according to the said suppliers’ convenience, the
Olympus Group’s ability to produce and supply them may be adversely impacted.
(iii) The Olympus Group and its outsourcees manufacture their products in accordance with the exacting
quality standard. However, if any product deficiency occurs, not only substantial costs including those of
a recall would be incurred but also the market’s confidence in the Olympus Group would be undermined,
and the Olympus Group’s ability to secure its earnings may be adversely impacted.
(iv) The Olympus Group is continuing to advance development of digital products by adopting state-of-the-
art Opto-Digital Technology. However, if technological progress occurs so fast and market changes
cannot be predicted adequately, that the Group is unable to develop new products adequately meeting
customers’ needs in a timely manner, the Olympus Group’s ability to secure its earnings may be
adversely impacted.
(v) The Olympus Group, in conducting R&D and production activities, uses various intellectual property
rights, and believes that the Group lawfully owns or is licensed to use such rights. However, if any third
party asserts that the Group has unknowingly infringed any of these intellectual property rights and if
any litigation occurs, the Olympus Group’s ability to secure its earnings may be adversely impacted.
(Risks Associated with Stock-Investing Activities)
As stock prices are determined on the basis of market principle, the Olympus Group may not be able to
realize anticipated earnings depending upon the movements of the market economy.
(Risks Associated with Business Collaborations and Corporate Acquisitions)
(i) The Olympus Group has built long-term strategic partnerships with advanced enterprises in the industry
on technologies and product development. If the Group can no longer maintain such partnerships due to
occurrence of a financial or any other business-related problem or change of its goals, the business
activities of the Group may be adversely impacted.
(ii) The Olympus Group may acquire or take an equity stake in a business enterprise in order to expand its
business. If the Group is unable to integrate the acquired business in line with the Group’s management
strategy or utilize management resources in an efficient manner as to the existing business or the
acquired business, the Group’s business may be adversely impacted or its business performances and
financial position may be adversely impacted due to impairment of goodwill or such like.

Olympus Corporation (7733) Financial Results for the Fiscal Year Ended March 31, 2009
12
(Other Comprehensive Risks)
The Olympus Group operates business globally. If any natural disaster, disease, war, or terrorist attack occurs
in any of the countries of regions in which the Group operates, or if interest rates rise or exchange rates
fluctuate beyond its expectations, the Olympus Group’s ability to secure its earnings may be adversely
impacted.

Olympus Corporation (7733) Financial Results for the Fiscal Year Ended March 31, 2009
13
2. Status of the Corporate Group
The Company, 199 subsidiaries and 29 affiliated companies are engaged mainly in the manufacture and sales
of products in Imaging, Medical, Life Science, Information & Communication, others and Holding
companies and Financial Investment etc. related to the each business.
Described below are business of the corporate group, roles of each business and relations to business
segments.
Segmentation Main products and business Principal consolidated subsidiaries
(Consolidated subsidiaries)
Imaging Systems
Digital cameras, Voice recorders
Olympus Imaging Corp., Olympus Opto-Technology Co., Ltd., Olympus Imaging America Inc., Olympus Imaging Europa GmbH, Olympus Hong Kong and China Limited, Olympus Korea Co., Ltd., Olympus Imaging China Co., Ltd., Olympus (Shenzhen) Industrial Ltd., Olympus Imaging Singapore Pte. Ltd.
(Consolidated subsidiaries)
Medical Systems Medical endoscopes, Surgical endoscopes, Endo Therapy products, Ultrasound endoscopes
Olympus Medical Systems Corp., KS Olympus Co., Ltd., Aizu Olympus Co., Ltd., Aomori Olympus Co., Ltd., Shirakawa Olympus Co., Ltd., Olympus America Inc., Olympus Medical Systems Europa GmbH, KeyMed (Medical & Industrial Equipment) Ltd., Gyrus ACMI, Inc., Olympus Winter & Ibe GmbH, Olympus Singapore Pte. Ltd.
Olympus Corporation (Consolidated subsidiaries)
Life Science Blood analyzer (clinical chemistry analyzer), Biological microscopes, Industrial microscopes
KS Olympus Co., Ltd., Mishima Olympus Co., Ltd., Olympus America Inc., Olympus Life Science Europa GmbH, Olympus Life Science Research Europa GmbH, Olympus Singapore Pte. Ltd.
(Consolidated subsidiaries)
Information & Communication
Sales of mobile terminals including mobile handsets, Mobile resolution, Mobile content services, development and sales of business package software, sales of network infrastructure systems, sales of semiconductor devices and electric equipment
IT Telecom, Inc., ITX E-Globaledge Corporation, Soliste Corporation, Broadleaf Co., Ltd.
Olympus Corporation (Consolidated subsidiaries)
Others
Industrial endoscopes, Non-destructive testing equipment, Printers, Bar code data processing equipment, System development, etc.
Okaya Olympus Co., Ltd., Olympus Terumo Biomaterials Corp., Olympus Systems Co., Ltd., Ai-medic Co., Ltd., Atlux Corporation, Nippon Outsourcing Corporation, KeyMed (Medical & Industrial Equipment) Ltd., Olympus NDT Canada Inc., Olympus NDT Corporation, Olympus Technologies Singapore Pte. Ltd.
Olympus Corporation (Consolidated subsidiaries)
Common Holding Companies, Financial investment
Olympus Leasing Co., Ltd., ITX Corporation, Olympus Corporation of the Americas, Olympus Europa Holding GmbH, Olympus KeyMed Group Limited, Olympus UK (Holding) Ltd., Olympus Finance Hong Kong Ltd., Olympus (China) Co., Ltd.
Note: Effective April 1, 2009, ITX Corporation merged with its subsidiary IT Telecom, Inc., with the former as surviving company. For details on the merger, please refer to “4. Consolidated Financial Statements (Important Subsequent Event)”.

Olympus Corporation (7733) Financial Results for the Fiscal Year Ended March 31, 2009
14
3. Operating Policy (1) Basic Operating Policies
We, at the Olympus Group, refer to the concept of assimilating, as members, with society, sharing values
with other members of society, and making people’s lives healthy and happy by proposing new values
through business activities as “Social IN,” and identify the concept as the leading motive lying behind all our
activities.
Based on this concept of “Social IN,” we will endeavor to be a “value-creating enterprise” capable of
continuing to create, and provide in a timely manner, new values truly needed by society by drawing upon the
source of Opto-Digital Technology (optical technology, digital imaging technology and micro-processing
technology) as our core competence. We are convinced that such endeavors will help all of our stakeholders
including customers, shareholders, business partners, employees, communities and society feel more satisfied
than ever.
(2) Targeted Operating Benchmarks
The Olympus Group strives to improve its corporate quality and financial standing by identifying
“maximization of corporate value” as its management goal. The fiscal year ended March 31, 2009 was
supposed to be the year in which we would have formulated our next basic management plan that would have
started in the fiscal year ending March 31, 2010. However, as the business environment surrounding the
Olympus Group is changing rapidly in the wake of the worldwide recession and as we need to implement
urgent measures to improve our earnings structure, we have decided to postpone formulation of the next basic
management plan.
In order to establish a stable earnings base for the fiscal year ending March 31, 2010, we will tackle the
challenge of reforming our earnings structure by identifying the issues of enhancement of corporate quality
and streamlining of management as our top priorities.
(3) Medium/Long-Term Management Strategy and Issues That Olympus Group Should Address
The basic strategy that the Olympus Group will adopt in developing its business is as follows:
In the Imaging Systems Business, we will build a corporate structure capable of continuously securing
earnings by focusing our energy on high-value added products such as compact cameras with a water/dust
resistance feature and proposing to users a digital single-lens camera with interchangeable lenses that can be
dramatically reduced in size and weight by way of the Micro Four Thirds System standard which takes
advantages of the superiority of entirely digital designing. In the Medical Systems Business, we will offer a
“safe, dependable and efficient” means of healthcare, contribute to society by improving patients’ quality of
life, reducing medical costs and bolstering the surgical field in an effort to steadily expand profits. At the
same time, we will seek to optimize our manufacturing cost structure and deal with exchange rate fluctuations
by building a global development/manufacturing structure. In addition, we will endeavor to implement an
optimal business portfolio and resource allocation, and develop related businesses in the medical/health and
imaging/information fields.

Olympus Corporation (7733) Financial Results for the Fiscal Year Ended March 31, 2009
15
4. Consolidated Financial Statements (1) Consolidated Balance Sheets
(Millions of yen)
As of March 31, 2008 As of March 31, 2009
ASSETS
Current assets
Cash and time deposits 158,281 136,877
Notes and accounts receivable 193,555 160,258
Lease receivables and lease investment assets - 11,880
Securities 3 199
Inventories 110,824 -
Merchandise and finished goods - 58,683
Work in process - 21,230
Raw materials and supplies - 16,577
Deferred income taxes 36,719 36,843
Other current assets 47,032 36,614
Allowance for doubtful accounts (3,109) (4,394)
Total current assets 543,305 474,767
Fixed assets
Property, plant and equipment
Buildings and structures 126,260 144,413
Accumulated depreciation (64,955) (67,473)
Buildings and structures, net 61,305 76,940
Machinery and equipment 57,839 61,194
Accumulated depreciation (39,489) (44,410)
Machinery and equipment, net 18,350 16,784
Tools, furniture and fixtures 154,492 161,429
Accumulated depreciation (111,800) (118,799)
Tools, furniture and fixtures, net 42,692 42,630
Land 21,291 19,856
Lease assets - 6,819
Accumulated depreciation - (3,307)
Lease assets, net - 3,512
Construction in progress 6,398 3,391
Net property, plant and equipment 150,036 163,113
Intangible fixed assets
Goodwill 299,800 180,540
Others 104,230 84,080
Total intangible fixed assets 404,030 264,620
Investments and other assets
Investment securities 193,843 127,144
Long-term loans receivable 3,277 3,811
Deferred income taxes 9,665 15,661
Other assets 54,608 58,440
Allowance for doubtful accounts (415) (1,238)
Total investments and other assets 260,978 203,818
Total fixed assets 815,044 631,551
Total assets 1,358,349 1,106,318

Olympus Corporation (7733) Financial Results for the Fiscal Year Ended March 31, 2009
16
(Millions of yen)
As of March 31, 2008 As of March 31, 2009
LIABILITIES
Current liabilities
Notes and accounts payable 83,602 66,604
Short-term borrowings 338,787 97,068
Current maturities of bonds 35,201 20,300
Other payable 76,185 55,102
Accrued expenses 82,467 65,592
Income taxes payable 14,121 8,404
Provision for product warranties 10,141 8,875
Other reserves 133 61
Other current liabilities 21,817 19,899
Total current liabilities 662,454 341,905
Non-current liabilities
Long-term bonds, less current maturities 105,397 130,200
Long-term borrowings, less current maturities 177,371 412,656
Deferred income taxes 30,488 28,068
Severance and retirement allowance 10,317 18,744
Severance and retirement allowance for directors and corporate auditors
122 130
Provision for loss on guarantees 452 -
Other non-current liabilities 3,872 5,831
Total non-current liabilities 328,019 595,629
Total liabilities 990,473 937,534
NET ASSETS
Shareholders’ equity
Common stock 48,332 48,332
Capital surplus 73,049 73,049
Retained earnings 237,817 110,407
Treasury stock, at cost (2,634) (12,874)
Total shareholders’ equity 356,564 218,914
Valuation and translation adjustments
Net unrealized holding gains (losses) on available-for-sale securities, net of taxes
6,320 (1,457)
Net unrealized gains (losses) on hedging derivatives, net of taxes
34 (1,330)
Foreign currency translation adjustments (6,567) (54,763)
Total valuation and translation adjustments (213) (57,550)
Minority interests 11,525 7,420
Total net assets 367,876 168,784
Total liabilities and net assets 1,358,349 1,106,318

Olympus Corporation (7733) Financial Results for the Fiscal Year Ended March 31, 2009
17
(2) Consolidated Statements of Income
(Millions of yen)
Fiscal year ended March 31, 2008
Fiscal year ended March 31, 2009
Net sales 1,128,875 980,803
Costs of sales 619,396 519,580
Gross profit 509,479 461,223
Selling, general and administrative expenses 396,856 426,636
Operating income 112,623 34,587
Non-operating income
Interest income 3,202 2,420
Dividends income 955 1,007
Royalty income 125 352
Foreign currency exchange gain, net 457 5,009
Others 4,244 2,834
Total non-operating income 8,983 11,622
Non-operating expenses
Interest expenses 13,905 16,192
Net loss of investment in affiliated companies carried on the equity method
2,766 1,704
Loss on interest in investments in partnership 2,893 -
Others 8,957 9,923
Total non-operating expenses 28,521 27,819
Ordinary income 93,085 18,390
Extraordinary income
Gain on sales of investment securities in subsidiaries and affiliates
312 -
Gain on sales of property, plant and equipment 1,478 -
Net gains due to decrease in equity interest in subsidiaries
1,909 -
Gain on transfer of business 300 -
Gain on sales of investment securities 112 691
Total extraordinary income 4,111 691
Extraordinary losses
Impairment loss on fixed assets 1,093 1,815
Loss on sales of investment securities - 1,053
Loss on valuation of investment securities 1,491 15,797
Amortization of goodwill - 76,201
Loss on prior period adjustment - 15,516
Total extraordinary losses 2,584 110,382
Income (loss) before provision for income taxes 94,612 (91,301)
Income taxes, current 38,952 25,465
Income taxes, deferred (2,192) 405
Total 36,760 25,870
Minority interest in losses of consolidated subsidiaries (117) (2,361)
Net income (loss) 57,969 (114,810)

Olympus Corporation (7733) Financial Results for the Fiscal Year Ended March 31, 2009
18
(3) Consolidated Statement of Changes in Net Assets (Millions of yen)
Fiscal year ended March 31, 2008
Fiscal year ended March 31, 2009
Shareholders’ equity Common stock
Net assets at March 31, 2008 48,332 48,332Changes during the year
Net changes during the year - -
Balance at March 31, 2009 48,332 48,332
Capital surplus Net assets at March 31, 2008 73,049 73,049Changes during the year
Net changes during the year - -
Balance at March 31, 2009 73,049 73,049
Retained earnings Net assets at March 31, 2008 191,122 237,817Effect of changes in accounting policies applied to foreign subsidiaries
- 1,567
Changes during the year Cash dividends paid (11,893) (10,749)Increase in retained earnings due to exclusion of subsidiaries from consolidation
387 -
Net income (loss) 57,969 (114,810)Adjustment on projected benefit obligation of the consolidated subsidiary in the UK
(465) -
Adjustment on projected benefit obligation of the consolidated subsidiary in the United States
697 (3,418)
Net changes during the year 46,695 (128,977)
Balance at March 31, 2009 237,817 110,407
Treasury stock, at cost Net assets at March 31, 2008 (2,264) (2,634)Changes during the year
Acquisition of treasury stock (370) (10,240)
Net changes during the year (370) (10,240)
Balance at March 31, 2009 (2,634) (12,874)
Total shareholders’ equity Net assets at March 31, 2008 310,239 356,564Effect of changes in accounting policies applied to foreign subsidiaries
- 1,567
Changes during the year Cash dividends paid (11,893) (10,749)Increase in retained earnings due to exclusion of subsidiaries from consolidation
387 -
Net income (loss) 57,969 (114,810)Adjustment on projected benefit obligation of the consolidated subsidiary in the UK
(465) -
Adjustment on projected benefit obligation of the consolidated subsidiary in the United States
697 (3,418)
Acquisition of treasury stock (370) (10,240)
Net changes during the year 46,325 (139,217)
Balance at March 31, 2009 356,564 218,914

Olympus Corporation (7733) Financial Results for the Fiscal Year Ended March 31, 2009
19
(Millions of yen)
Fiscal year ended March 31, 2008
Fiscal year ended March 31, 2009
Valuation and translation adjustments Net unrealized holding gains (losses) on available-for-sale securities, net of taxes
Net assets at March 31, 2008 16,078 6,320Changes during the year
Net changes in items other than shareholders’ equity (9,758) (7,777)
Net changes during the year (9,758) (7,777)
Balance at March 31, 2009 6,320 (1,457)
Net unrealized gains (losses) on hedging derivatives, net of taxes Net assets at March 31, 2008 (184) 34Changes during the year
Net changes in items other than shareholders’ equity 218 (1,364)
Net changes during the year 218 (1,364)
Balance at March 31, 2009 34 (1,330)
Foreign currency translation adjustments Net assets at March 31, 2008 8,077 (6,567)Changes during the year
Net changes in items other than shareholders’ equity (14,644) (48,196)
Net changes during the year (14,644) (48,196)
Balance at March 31, 2009 (6,567) (54,763)
Total valuation and translation adjustments Net assets at March 31, 2008 23,971 (213)Changes during the year
Net changes in items other than shareholders’ equity (24,184) (57,337)
Net changes during the year (24,184) (57,337)
Balance at March 31, 2009 (213) (57,550)
Minority interests Net assets at March 31, 2008 10,661 11,525Changes during the year
Net changes in items other than shareholders’ equity 864 (4,105)
Net changes during the year 864 (4,105)
Balance at March 31, 2009 11,525 7,420
Total net assets Net assets at March 31, 2008 344,871 367,876Effect of changes in accounting policies applied to foreign subsidiaries
- 1,567
Changes during the year Cash dividends paid (11,893) (10,749)Increase in retained earnings due to exclusion of subsidiaries from consolidation
387 -
Net income (loss) 57,969 (114,810)Adjustment on projected benefit obligation of the consolidated subsidiary in the UK
(465) -
Adjustment on projected benefit obligation of the consolidated subsidiary in the United States
697 (3,418)
Acquisition of treasury stock (370) (10,240)Net changes in items other than shareholders’ equity (23,320) (61,442)
Net changes during the year 23,005 (200,659)
Balance at March 31, 2009 367,876 168,784

Olympus Corporation (7733) Financial Results for the Fiscal Year Ended March 31, 2009
20
(4) Consolidated Statements of Cash Flows
(Millions of yen)
Fiscal year ended March 31, 2008
Fiscal year ended March 31, 2009
Cash flows from operating activities Income (loss) before provision for income taxes 94,612 (91,301)Depreciation and amortization 37,522 44,804Impairment loss on fixed assets 1,093 1,815Amortization of goodwill 8,077 101,459Increase (decrease) in severance and retirement allowance 893 9,003Decrease (increase) in prepaid pension cost (8,757) (8,853)Increase (decrease) in provision for product warranties 1,504 366Interest and dividend income (4,157) (3,427)Interest expense 13,905 16,192Net loss (gain) of investment in affiliated companies carried on the equity method
2,766 1,704
Net losses (gains) due to decrease in equity interest in subsidiaries (1,909) -Loss (gain) on prior period adjustment - 15,516Loss (gain) on sale of investment securities in subsidiaries and affiliates
(312) -
Loss (gain) valuation of investment securities 1,491 15,797Decrease (increase) in accounts receivable (3,959) 16,794Decrease (increase) in inventories (14,316) 6,022Increase (decrease) in accounts payable (9,230) (14,340)Increase (decrease) in other payable 15,932 (5,669)Increase (decrease) in accrued expense (31) (12,618)Other 4,807 (2,281)Sub-total 139,931 90,983Interest and dividend received 4,114 3,439Interest payments (13,864) (16,139)Income taxes paid (41,175) (36,655)Net cash provided by operating activities 89,006 41,628
Cash flows from investing activities Deposits in time deposits (38,956) (5,626)Withdrawals from time deposits 41,775 38,440Sales of securities 2,357 -Purchase of property, plant and equipment, etc. (47,953) -Purchase of property, plant and equipment - (43,829)Sales of property, plant and equipment 2,306 -Purchases of intangible fixed assets - (5,617)Purchases of investment securities (12,132) (5,332)Sales and redemption of investment securities 6,491 40,538Payments for acquisition of new consolidated subsidiaries related to changes in scope of consolidation
(232,234) (128)
Net decrease from sales of investment in subsidiaries related to changes in scope of consolidation
- (123)
Net increase from sales of investment in subsidiaries related to changes in scope of consolidation
197 -
Payments for additional acquisition of consolidated subsidiaries (18,355) -Payments for acquisition of new consolidated subsidiaries - (40,390)Proceeds from sales of investment in consolidated subsidiaries 608 -Payments for loans receivable (9,912) (1,531)Proceeds from loans receivable 1,544 3,073Other (39) (203)Net cash used in investing activities (304,303) (20,728)

Olympus Corporation (7733) Financial Results for the Fiscal Year Ended March 31, 2009
21
(Millions of yen)
Fiscal year ended March 31, 2008
Fiscal year ended March 31, 2009
Cash flows from financing activities Increase (decrease) in short-term borrowings 152,797 (218,220)Proceeds from long-term debt 37,097 259,719Repayments of long-term debt (15,064) (33,603)Proceeds from issuance of bonds 100 45,166Redemption of bonds (94) (35,199)Stock issue to minority shareholders 1,917 147Expenditure on acquisition of treasury stock - (10,240)Dividends paid (11,893) (10,749)Dividends paid to minority shareholders (88) (114)Other (371) (658)Net cash provided by (used in) financing activities 164,401 (3,751)
Effect of exchange rate changes on cash and cash equivalents (4,405) (4,435)Net increase (decrease) in cash and cash equivalents (55,301) 12,714Cash and cash equivalents at beginning of year 174,802 119,842Net increase in cash and cash equivalents associated with newly consolidated subsidiaries
578 -
Net decrease in cash and cash equivalents associated with exclusion from scope of consolidation
(237) (6)
Increase in cash and cash equivalents resulting from merger with unconsolidated subsidiaries
- 170
Cash and cash equivalents at end of year 119,842 132,720

Olympus Corporation (7733) Financial Results for the Fiscal Year Ended March 31, 2009
22
(5) Notes on Premise of Going Concern
No items to report.
(6) Important Items That Form the Basis for Preparing the Consolidated Financial Statements
Fiscal year ended March 31, 2008
(April 1, 2007 - March 31, 2008)
Fiscal year ended March 31, 2009
(April 1, 2008 - March 31, 2009)
1. Scope of consolidation 1. Scope of consolidation 1) Number of consolidated subsidiaries: 205
Olympus Digital System Design Corp. and other 6 companies are newly established subsidiaries during the fiscal year ended March 31, 2008.
Gyrus Group PLC and other 26 companies have been included into consolidation through equity participation carried out during the fiscal year.
Altis Co., Ltd. and other 2 companies have switched from affiliated companies accounted for under the equity method to consolidated subsidiaries due to additional acquisition of shares during the fiscal year.
Olympus Moscow Limited Liability Company has switched from a non-consolidated subsidiary accounted for under the equity method to a consolidated subsidiary effective from the fiscal year ended March 31, 2008, due to gains in materiality.
Atlux Humanage,Inc. and other 1 company have been excluded from consolidated subsidiaries due to sale of shares during the fiscal year.
Moranet Inc and other 5 companies have been excluded from consolidated subsidiaries due to merger with other consolidated subsidiaries during the fiscal year.
AOI Technologies Inc. and other 5 companies have been excluded from consolidated subsidiaries due to liquidation during the fiscal year.
Olympus Microsystems America, Inc. and other one have been excluded from consolidated subsidiaries due to decrease in materiality.
1) Number of consolidated subsidiaries: 189
Olympus UK Loan Notes Limited and other 1 company are newly established subsidiaries during the fiscal year ended March 31, 2009.
Pulsecho Inc. has been included into consolidation through equity participation carried out during the fiscal year.
Makewave Japan Co., Ltd. has been included into consolidation due to additional acquisition of shares during the fiscal year.
ITX Capital Innovation Co., Ltd. and other 10 companies have been excluded from consolidated subsidiaries due to sale of shares during the fiscal year.
Olympus NDT NW, Inc. and other 4 companies have been excluded from consolidated subsidiaries due to merger with other consolidated subsidiaries during the fiscal year.
Recycle Institute Ltd. and other 2 companies have been excluded from consolidated subsidiaries due to liquidation during the fiscal year.
LA PLANTA CO., LTD. has been excluded from consolidated subsidiaries due to decrease in materiality.
2) Name of non-consolidated subsidiaries
Non-consolidated subsidiaries are as follows:
FEED CORPORATION
Radio Cafe, Inc.
S.T. SIX Co., Ltd., and other 11 companies
Reason of excluding from the scope of consolidation
The 14 non-consolidated subsidiaries are all small and not material when measured by the impact of total amounts of assets, net sales, net income, and retained earnings (based on the Company’s ownership percentage) of those companies on consolidated financial statements. They have therefore been excluded from the scope of consolidation.
2) Name of non-consolidated subsidiaries
Non-consolidated subsidiaries are as follows:
FEED CORPORATION
Radio Cafe, Inc.
LA PLANTA CO., LTD., and other 7 companies
Reason of excluding from the scope of consolidation
The ten non-consolidated subsidiaries are all small and not material when measured by the impact of total amounts of assets, net sales, net income, and retained earnings (based on the Company’s ownership percentage) of those companies on consolidated financial statements. They have therefore been excluded from the scope of consolidation.

Olympus Corporation (7733) Financial Results for the Fiscal Year Ended March 31, 2009
23
Fiscal year ended March 31, 2008
(April 1, 2007 - March 31, 2008)
Fiscal year ended March 31, 2009
(April 1, 2008 - March 31, 2009)
2. Application of the Equity Method 2. Application of the Equity Method
1) Non-consolidated subsidiaries accounted for under the equity method: 2
FEED CORPORATION
Radio Cafe, Inc.
FEED CORPORATION became an equity participation company during the fiscal year.
G. C. New Vision Ventures, L.P. has been excluded from non-consolidated subsidiaries accounted for under the equity method due to dissolution during the fiscal year.
Beijing Beizhao Olympus Optical Co., Ltd. has been excluded from non-consolidated subsidiaries accounted for under the equity method due to liquidation during the fiscal year.
Olympus Moscow Limited Liability Company has switched from a non-consolidated subsidiary accounted for under the equity method to a consolidated subsidiary effective from the fiscal year ended March 31, 2008, due to gains in materiality.
1) Non-consolidated subsidiaries accounted for under the equity method: 2
FEED CORPORATION
Radio Cafe, Inc.
2) Affiliated companies accounted for under the equity method: 13
ORTEK Corporation
Adachi Co., Ltd.
Olympus Cytori Inc., and other 10 companies
Media Hanshin Co., Ltd. became an equity participation company during the fiscal year.
ADLINK Japan Inc. was newly established during the fiscal year.
Altis Co., Ltd. and other 2 companies have been excluded from affiliated companies accounted for under the equity method due to their shifting to consolidated subsidiaries during the fiscal year.
Cablenet Saitama Co., Ltd and other 3 companies have been excluded from affiliated companies accounted for under the equity method due to sale of shares.
2) Affiliated companies accounted for under the equity method: 18
ORTEK Corporation
Adachi Co., Ltd.
Olympus Cytori Inc., and other 15 companies
ITX Capital Innovation Co., Ltd. and other 5companies have switched from consolidated subsidiaries to affiliated companies accounted for under the equity method due to partial sale of shares during the fiscal year.
Resect Medical, Inc. has been excluded from affiliated companies accounted for under the equity method due to sale of shares during the fiscal year.
3) S.T. SIX Co., Ltd. and other 11 non-consolidated subsidiaries and 5 affiliated companies have not been accounted for under the equity method because the impact of all those companies on consolidated net income and retained earnings is not material.
3) LA PLANTA CO., LTD. and other 7 non-consolidated subsidiaries and 11 affiliated companies have not been accounted for under the equity method because the impact of all those companies on consolidated net income and retained earnings is not material.

Olympus Corporation (7733) Financial Results for the Fiscal Year Ended March 31, 2009
24
(7) Changes in Important Items That Form the Basis for Preparing the Consolidated Financial Statements
Fiscal year ended March 31, 2008
(April 1, 2007 - March 31, 2008)
Fiscal year ended March 31, 2009
(April 1, 2008 - March 31, 2009)
1. Method of depreciation of fixed assets 1. Inventories
Beginning from the fiscal year ended March 31, 2008, pursuant to the amendments to the Corporation Tax Law (the Law on Partial Amendments to the Income Tax Law [March 30, 2007, Law No. 6] and the Cabinet Order on Partial Amendments to the Order for Enforcement of the Corporation Tax Law [March 30, 2007, Cabinet Order No. 83]), the method of depreciation of fixed assets acquired on or after April 1, 2007 has been changed to the method based on the provisions of the revised Corporation Tax Law. This had immaterial effect on profit and loss in the fiscal year.
Before the change, inventories held for sale in the ordinary course of business were stated mainly using the lower-of-cost -or-market method per First-in First-out method. However, because the “Accounting Standard for Measurement of Inventories” (ASBJ Statement No. 9, published July 5, 2006) has been applied from the current fiscal year, the First-in First-out cost method is now mainly employed (for the value stated in the balance sheet, the book value is written down based on the decreased profitability). The impact from this change on profit and loss is immaterial.
2. Application of “Practical Solution on Unification of Accounting Policies Applied to Foreign Subsidiaries for Consolidated Financial Statements”
From the current fiscal year, the consolidated financial statements conform to the “Practical Solution on Unification of Accounting Policies Applied to Foreign Subsidiaries for Consolidated Financial Statements” (PITF No. 18, May 17, 2006), and necessary amendments were made. The impact from this change on profit and loss is immaterial.
3. Application of Accounting Standard for Lease Transactions
Before the change, the accounting treatment for finance lease transactions not involving the transfer of ownership followed the method for operating lease transactions, but now after the application of the “Accounting Standard for Lease Transactions” (ASBJ Statement No. 13 [Business Accounting Council Committee No. 1, June 17, 1993; revised March 30, 2007]) and the “Guidance on Accounting Standard for Lease Transactions” (ASBJ Guidance No. 16 [The Japanese Institute of Certified Public Accountants (JICPA) Accounting Standard Committee, January 18, 1994; revised March 30, 2007]) that begin from the current fiscal year, the accounting treatment for those transactions follows the method for ordinary purchase and sales transactions. Depreciation of finance lease assets not involving the transfer of ownership is calculated on the straight-line method over the lease period as the useful period and assuming no residual value. The accounting treatment for finance lease transactions not involving the transfer of ownership whose transaction commenced before the first fiscal year in which the Accounting Standard for Lease Transactions is applied follows the same method as for ordinary operating lease transactions. The impact from this change on profit and loss is immaterial.

Olympus Corporation (7733) Financial Results for the Fiscal Year Ended March 31, 2009
25
(Additional Information)
Fiscal year ended March 31, 2008
(April 1, 2007 - March 31, 2008)
Fiscal year ended March 31, 2009
(April 1, 2008 - March 31, 2009)
Concerning Gyrus Group PLC, in which the Company participated in equity during the current fiscal year, because the allocation of funds for the acquisition cost is incomplete as of the end of the current fiscal year, a provisional accounting treatment is effectuated based on available information deemed as rational. Also, there is the possibility of additional payments due to certain clauses in the purchasing agreement such as an employee incentive plan. For such payments, expenses at the time of occurrence or the revision of goodwill already recorded shall be factored into said treatment.
Concerning investments such as the equity participation in Gyrus Group Limited during the previous fiscal year, because the amount to be expended has been finalized and the allocation of funds for the acquisition cost is complete, a provisional accounting treatment has been determined and the amount of expenses is recorded in loss on prior period adjustment in the consolidated statement of income as an adjustment of the already recorded amount of goodwill.

Olympus Corporation (7733) Financial Results for the Fiscal Year Ended March 31, 2009
26
(8) Notes Regarding the Consolidated Financial Statements
Notes
(Omission of disclosure)
Notes related to lease transactions, related party information, deferred tax accounting, securities, derivative
transactions, retirement benefits, stock options, and business combinations are omitted, because the necessity
of their disclosure in financial results are regarded as immaterial.
However, the aforementioned notes will be included in the securities report scheduled to be submitted on
June 26, 2009, and will be available on the Electronic Disclosure for Investors’ Network (EDINET), an
electronic disclosure system with respect to disclosed documents such as annual securities reports submitted
pursuant to the Financial Instruments and Exchange Law.
(Consolidated Statements of Income) (Millions of yen)
Fiscal year ended March 31, 2008
(April 1, 2007 - March 31, 2008)
Fiscal year ended March 31, 2009
(April 1, 2008 - March 31, 2009)
1. Major items and amounts of selling, general and administrative expenses are as follows:
1. Major items and amounts of selling, general and administrative expenses are as follows:
Advertising and promotion expenses 58,658 Advertising and promotion expenses 53,058
Provision of allowance for doubtful accounts
480 Provision of allowance for doubtful accounts
2,309
Salaries and allowance 104,921 Salaries and allowance 113,920
Bonuses 28,111 Bonuses 19,349
Severance and retirement expenses 3,098 Severance and retirement expenses 5,397
Provision of severance and retirement allowance for directors and corporate auditors
49 Provision of severance and retirement allowance for directors and corporate auditors
62
Amortization of goodwill 8,077 Amortization of goodwill 25,258
Experiment and research expenses 38,552 Experiment and research expenses 45,927
Depreciation 22,682 Depreciation 31,590
2. Research and development expenses included in general and administrative expenses and production cost for the current fiscal year are ¥65,928 million.
2. Research and development expenses included in general and administrative expenses and production cost for the current fiscal year are ¥70,010 million.

Olympus Corporation (7733) Financial Results for the Fiscal Year Ended March 31, 2009
27
(Segment Information)
a. Segment information by type of business Fiscal year ended March 31, 2008 (from April 1, 2007 to March 31, 2008) (Millions of yen)
Imaging Systems
Medical Systems
Life Science
Information & Communication
Others Total Elimination
or Unallocation
Consolidated
I. Net sales and operating income or loss Sales
(1) Sales to outside customers 320,589 353,269 131,446 254,312 69,259 1,128,875 – 1,128,875
(2) Internal sales of transfer among segments
347 85 219 – 574 1,225 (1,225) –
Total 320,936 353,354 131,665 254,312 69,833 1,130,100 (1,225) 1,128,875
Operating expenses 287,850 254,934 124,675 251,311 68,916 987,686 28,566 1,016,252
Operating income (or operating loss) 33,086 98,420 6,990 3,001 917 142,414 (29,791) 112,623
II. Assets, depreciation cost, and capital expenditure Assets 147,293 537,921 94,916 128,949 151,641 1,060,720 297,629 1,358,349
Depreciation cost 8,748 10,778 5,943 2,470 4,359 32,298 5,224 37,522
Capital expenditure 10,638 16,536 7,792 3,191 4,476 42,633 7,437 50,070
Fiscal year ended March 31, 2009 (from April 1, 2008 to March 31, 2009) (Millions of yen)
Imaging Systems
Medical Systems
Life Science
Information & Communication
Others Total Elimination
or Unallocation
Consolidated
I. Net sales and operating income or loss Sales
(1) Sales to outside customers 224,460 383,828 118,819 188,954 64,742 980,803 – 980,803
(2) Internal sales of transfer among segments
133 64 189 – 492 878 (878) –
Total 224,593 383,892 119,008 188,954 65,234 981,681 (878) 980,803
Operating expenses 229,724 308,849 114,248 188,047 79,197 920,065 26,151 946,216
Operating income (or operating loss) (5,131) 75,043 4,760 907 (13,963) 61,616 (27,029) 34,587
II. Assets, depreciation cost, and capital expenditure Assets 119,492 462,211 82,609 99,205 82,999 846,516 259,802 1,106,318
Depreciation cost 8,465 19,250 5,265 2,655 4,131 39,766 5,038 44,804
Capital expenditure 8,580 21,974 4,466 2,988 4,871 42,879 12,753 55,632
Notes: 1. Method of segmentation of business during the fiscal year
Business established based on product line are segmented taking into consideration similarities in sales markets. 2. The main products for each business are as follows:
(1) Imaging Systems: Digital cameras, Voice recorders (2) Medical Systems: Medical endoscopes, Surgical endoscopes, Endo Therapy products, Ultrasound
endoscopes (3) Life Science: Blood analyzer (clinical chemistry analyzer), Biological microscopes, Industrial
microscopes (4) Information & Communication: Sales of mobile terminals including mobile handsets, Mobile solution, Mobile content
services, Development and sales of business package software, Sales of network infrastructure systems, Sales of semiconductor devices and electric equipment
(5) Others: Industrial endoscopes, Non-destructive testing equipment, Printers, Bar code data processing equipment, System development, etc.
3. Among the operating expenses, the amount of unallocatable operating expenses recorded in the section of Elimination or Unallocation was ¥29,791 million for the previous consolidated fiscal year, and ¥27,029 million for the current consolidated fiscal year, most of which consisted of expenses related to the corporate center of the parent company (management departments such as the Administrative Department) and the Research & Development Center.
4. Among the assets, the amount of unallocatable assets recorded in the section of Elimination or Unallocation was ¥297,629 million for the previous consolidated fiscal year, and ¥259,802 million for the current consolidated fiscal year, most of which consisted of the surplus operating fund at the parent company (cash and securities), long-term investment fund (investment securities), and assets related to the corporate center of the parent company (management departments such as the Administrative Department) and the Research & Development Center.

Olympus Corporation (7733) Financial Results for the Fiscal Year Ended March 31, 2009
28
b. Segment information by region Fiscal year ended March 31, 2008 (from April 1, 2007 to March 31, 2008) (Millions of yen)
Japan Americas Europe Asia Total
Elimination
or
Unallocation
Consolidated
I. Net sales and operating income or loss
Sales
(1) Sales to outside customers 484,146 259,137 299,667 85,925 1,128,875 – 1,128,875
(2) Internal sales of transfer among segments
341,219 10,675 13,318 110,410 475,622 (475,622) –
Total 825,365 269,812 312,985 196,335 1,604,497 (475,622) 1,128,875
Operating expenses 734,203 250,022 290,863 185,801 1,460,889 (444,637) 1,016,252
Operating income 91,162 19,790 22,122 10,534 143,608 (30,985) 112,623
II. Assets 615,009 364,099 228,072 121,033 1,328,213 30,136 1,358,349
Fiscal year ended March 31, 2009 (from April 1, 2008 to March 31, 2009) (Millions of yen)
Japan Americas Europe Asia Total
Elimination
or
Unallocation
Consolidated
I. Net sales and operating income or loss
Sales
(1) Sales to outside customers 394,459 256,894 256,958 72,492 980,803 – 980,803
(2) Internal sales of transfer among segments
262,143 8,588 17,846 75,814 364,391 (364,391) –
Total 656,602 265,482 274,804 148,306 1,345,194 (364,391) 980,803
Operating expenses 627,516 260,810 257,092 141,785 1,287,203 (340,987) 946,216
Operating income 29,086 4,672 17,712 6,521 57,991 (23,404) 34,587
II. Assets 271,176 320,479 254,435 113,812 959,902 146,416 1,106,318
Notes: 1. Countries and regions are segmented by geographical proximity. 2. Major countries and regions other than Japan are as follows:
(1) Americas: USA, Canada, Mexico, and Brazil (2) Europe: Germany, UK, France, etc. (3) Asia: Singapore, Hong Kong, China, Korea, Australia, etc.
3. Among the operating expenses, the amount of unallocatable operating expenses recorded in the section of Elimination or Unallocation was ¥29,791 million for the previous consolidated fiscal year, and ¥27,029 million for the current consolidated fiscal year, most of which consisted of expenses related to the corporate center of the parent company (management departments such as the Administrative Department) and the Research & Development Center.
4. Among the assets, the amount of unallocatable assets recorded in the section of Elimination or Unallocation was ¥297,629 million for the previous consolidated fiscal year, and ¥259,802 million for the current consolidated fiscal year, most of which consisted of the surplus operating fund at the parent company (cash and securities), long-term investment fund (investment securities), and assets related to the corporate center of the parent company (management departments such as the Administrative Department) and the Research & Development Center.

Olympus Corporation (7733) Financial Results for the Fiscal Year Ended March 31, 2009
29
c. Overseas sales Fiscal year ended March 31, 2008 (from April 1, 2007 to March 31, 2008) (Millions of yen)
North America
Europe Asia Others Total
I. Overseas sales 240,254 303,110 138,873 26,411 708,648II. Consolidated sales 1,128,875III. Percentage of overseas sales in
consolidated sales (%) 21.3 26.9 12.3 2.3 62.8
Fiscal year ended March 31, 2009 (from April 1, 2008 to March 31, 2009) (Millions of yen)
North America
Europe Asia Others Total
I. Overseas sales 237,656 257,894 114,152 23,840 633,542II. Consolidated sales 980,803III. Percentage of overseas sales in
consolidated sales (%) 24.2 26.4 11.6 2.4 64.6
Notes: 1. Overseas sales refer to the sales of the Company and its consolidated subsidiaries in countries or regions other than Japan. 2. Regions are segmented by geographical proximity. 3. Major countries and regions other than Japan are as follows:
(1) North America: USA, Canada (2) Europe: Germany, UK, France, etc. (3) Asia: Singapore, Hong Kong, China, Korea, Australia, etc. (4) Others: Central and South America, Africa, etc.
d. Production, orders and sales
Businesses are segmented by adding similar sales markets to business established based on product lines.
Purchasing performance is recorded in addition to production performance for some consolidated subsidiaries,
because they engage in the sales and services of equipments.
(1) Production Performance
Segment Name by Type of Business Amount (Millions of yen) Comparison vs. Previous Fiscal Year
(%)
Imaging Systems 239,547 (24.8)
Medical Systems 366,016 4.1
Life Science 109,697 (2.8)
Information & Communication – –
Others 47,228 (1.9)
Total 762,488 (8.3)
Notes: 1. Amounts are calculated based on the sales price. 2. Amounts do not include consumption tax. (2) Purchasing Performance
Segment Name by Type of Business Amount (Millions of yen) Comparison vs. Previous Fiscal Year
(%)
Imaging Systems – –
Medical Systems – –
Life Science – –
Information & Communication 149,695 (27.7)
Others 24,492 (2.7)
Total 174,187 (25.0)
Note: Amounts do not include consumption tax.

Olympus Corporation (7733) Financial Results for the Fiscal Year Ended March 31, 2009
30
(3) Orders Received
As we have mainly adopted a make-to-stock production system, the description of the situation of accepting orders has been omitted. (4) Sales Performance
Segment Name by Type of Business Amount (Millions of yen) Comparison vs. Previous Fiscal Year
(%)
Imaging Systems 224,460 (30.0)
Medical Systems 383,828 8.7
Life Science 118,819 (9.6)
Information & Communication 188,954 (25.7)
Others 64,742 (6.5)
Total 980,803 (13.1)
Note: Amounts do not include consumption tax.
(Per-Share Data)
Fiscal year ended March 31, 2008
(from April 1, 2007 to March 31, 2008)
Fiscal year ended March 31, 2009
(from April 1, 2008 to March 31, 2009)
Net assets per share ¥1,318.65 Net assets per share ¥603.92
Net income per share ¥214.48 Net loss per share ¥(428.83)
Fully diluted net income per share ¥214.44
Although potential shares exist, the fully diluted net income per share is not described here due to the net loss per share resulting from dilution.
Note: The basis for calculating net income per share, net loss per share, and fully diluted net income per share is as follows:
(Million of yen)
Fiscal year ended March 31, 2008
(from April 1, 2007 to March 31, 2008)
Fiscal year ended March 31, 2009
(from April 1, 2008 to March 31, 2009)
Net income (loss) 57,969 (114,810)
Amount that does not belong to ordinary shareholder
– –
Net income (loss) concerning common stock
57,969 (114,810)
Average number of shares during the year
270,271,738 shares 267,725,706 shares
Main components of the net income adjustment used for calculating the fully diluted net income per share
Adjustment for potential shares issued by consolidated subsidiaries
(11) –
Net income adjustment (11) –
Amount of increase of common stock
– –
Outline of the residual securities excluded from the calculation of the fully diluted net income per share because they have no dilutive effects.
There are share options as residual securities held by consolidated subsidiaries.
Same as left.

Olympus Corporation (7733) Financial Results for the Fiscal Year Ended March 31, 2009
31
(Important Subsequent Event)
Fiscal year ended March 31, 2008 (From April 1, 2007 to March 31, 2008)
Olympus Corporation, at a meeting of its Board of Directors on May 8, 2008, resolved to repurchase of its
own shares in order to increase shareholders’ returns and to implement more flexible capital policies in
accordance with changes of business environment under Article 156 of the Company Law as applied pursuant
to Article 165, Paragraph 3 of the Company Law as follows.
Resolution at a meeting of its Board of Directors regarding repurchase of own shares
1. Class of shares: Common stock
2. Total number of shares to be repurchased: Up to 3.5 million shares
3. Total cost of repurchase: Up to ¥10,000 million
4. Period of repurchase: From May 9, 2008 to June 20, 2008
5. Method of repurchase: Purchase in the market through a trust bank
The Company’s own shares acquired on the Tokyo Stock Exchange between May 9, 2008, and June 20, 2008,
amount to 2,958,000 shares of common stock at ¥9,998 million.
Fiscal year ended March 31, 2009 (From April 1, 2008 to March 31, 2009)
(Notification concerning Olympus Corporation making Iwaken Co., Ltd. its Wholly-Owned Subsidiary
through a Share Exchange)
The Board of Directors of Olympus Corporation (the “Company”) resolved to make Iwaken Co., Ltd.
(“Iwaken”) its wholly-owned subsidiary through a share exchange (the “Share Exchange”) with a scheduled
date of June 1, 2009, and entered into a basic agreement with Iwaken (the “Basic Agreement”) on April 10,
2009.
The Company plans to implement the Share Exchange without obtaining approval at General Meeting of
Shareholders in accordance with “simplified share exchange” (kan-i kabushiki kokan) procedures pursuant to
Article 796, Paragraph 3 of the Company Law of Japan.
1. Purpose of a Share Exchange
The Olympus Group has been focusing on steadily increasing profits in its Medical Systems Business, the
core product of which is endoscopes for medical use, while contributing to society by supplying “safe,
reliable and efficient” medical procedures.
In the midst of the substantial changes that are occurring in the environment surrounding medical treatment
as a result of recent reforms in the healthcare system, the Olympus Group and Iwaken have developed a close
partnership centering around the sale of Olympus Group products and Olympus Group Services.
The Company and Iwaken have entered into the Basic Agreement on the basis of their shared conclusion that
integration on both a capital and an operational level is the most appropriate way to enable both companies to
provide services of an even higher quality to medical institutions, research organizations and other customers.
2. Summary of the Share Exchange
(1) Schedule of the Share Exchange
April 10, 2009 Sign of the Basic Agreement between the Company and Iwaken
April 24, 2009 Meeting of the Board of Directors
(Resolution to approve the sign of the agreement pertaining to the Share
Exchange (the “Share Exchange Agreement”))
April 24, 2009 Sign of the Share Exchange Agreement between the Company and Iwaken
End of May, 2009 Extraordinary Meeting of Shareholders of Iwaken
(Resolution to approve the Share Exchange) (scheduled)
June 1, 2009 Effective date of the Share Exchange (scheduled)
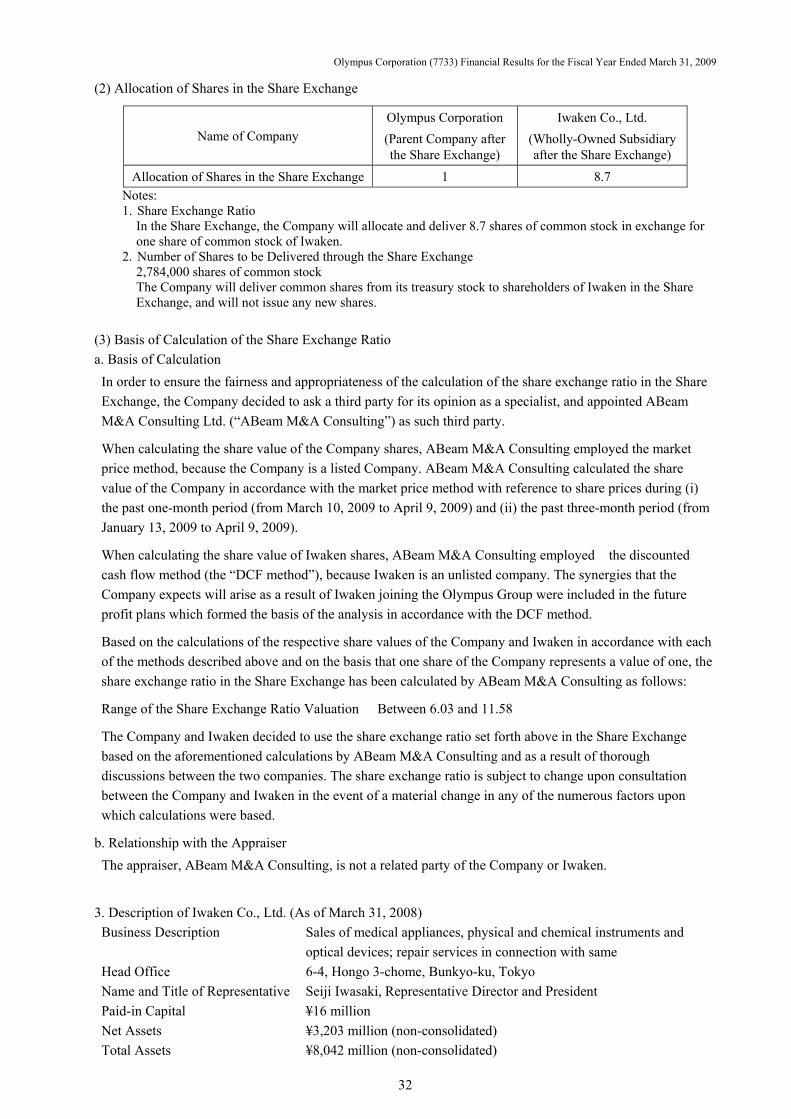
Olympus Corporation (7733) Financial Results for the Fiscal Year Ended March 31, 2009
32
(2) Allocation of Shares in the Share Exchange
Name of Company
Olympus Corporation
(Parent Company after the Share Exchange)
Iwaken Co., Ltd.
(Wholly-Owned Subsidiary after the Share Exchange)
Allocation of Shares in the Share Exchange 1 8.7
Notes: 1. Share Exchange Ratio
In the Share Exchange, the Company will allocate and deliver 8.7 shares of common stock in exchange for one share of common stock of Iwaken.
2. Number of Shares to be Delivered through the Share Exchange 2,784,000 shares of common stock The Company will deliver common shares from its treasury stock to shareholders of Iwaken in the Share Exchange, and will not issue any new shares.
(3) Basis of Calculation of the Share Exchange Ratio
a. Basis of Calculation
In order to ensure the fairness and appropriateness of the calculation of the share exchange ratio in the Share
Exchange, the Company decided to ask a third party for its opinion as a specialist, and appointed ABeam
M&A Consulting Ltd. (“ABeam M&A Consulting”) as such third party.
When calculating the share value of the Company shares, ABeam M&A Consulting employed the market
price method, because the Company is a listed Company. ABeam M&A Consulting calculated the share
value of the Company in accordance with the market price method with reference to share prices during (i)
the past one-month period (from March 10, 2009 to April 9, 2009) and (ii) the past three-month period (from
January 13, 2009 to April 9, 2009).
When calculating the share value of Iwaken shares, ABeam M&A Consulting employed the discounted
cash flow method (the “DCF method”), because Iwaken is an unlisted company. The synergies that the
Company expects will arise as a result of Iwaken joining the Olympus Group were included in the future
profit plans which formed the basis of the analysis in accordance with the DCF method.
Based on the calculations of the respective share values of the Company and Iwaken in accordance with each
of the methods described above and on the basis that one share of the Company represents a value of one, the
share exchange ratio in the Share Exchange has been calculated by ABeam M&A Consulting as follows:
Range of the Share Exchange Ratio Valuation Between 6.03 and 11.58
The Company and Iwaken decided to use the share exchange ratio set forth above in the Share Exchange
based on the aforementioned calculations by ABeam M&A Consulting and as a result of thorough
discussions between the two companies. The share exchange ratio is subject to change upon consultation
between the Company and Iwaken in the event of a material change in any of the numerous factors upon
which calculations were based.
b. Relationship with the Appraiser
The appraiser, ABeam M&A Consulting, is not a related party of the Company or Iwaken.
3. Description of Iwaken Co., Ltd. (As of March 31, 2008)
Business Description Sales of medical appliances, physical and chemical instruments and
optical devices; repair services in connection with same
Head Office 6-4, Hongo 3-chome, Bunkyo-ku, Tokyo
Name and Title of Representative Seiji Iwasaki, Representative Director and President
Paid-in Capital ¥16 million
Net Assets ¥3,203 million (non-consolidated)
Total Assets ¥8,042 million (non-consolidated)

Olympus Corporation (7733) Financial Results for the Fiscal Year Ended March 31, 2009
33
(Merger of Consolidated Subsidiaries)
ITX Corporation, a consolidated subsidiary of the Company, resolved, at a meeting of its Board of Directors
held on December 16, 2008, to merge with its subsidiary IT Telecom, Inc. where ITX Corporation was the
surviving company and IT Telecom, Inc. was the absorbed company. The merger agreement was executed on
the same date. With respect to ITX Corporation, the merger was a simplified merger in accordance with
Article 796, Paragraph 3 of the Company Law and, with respect to IT Telecom, Inc., same was a short-form
merger in accordance with Article 784, Paragraph 1 of said Law. Therefore, a General Meeting of
Shareholders was not held for the approval of the merger. The merger took effect on April 1, 2009.
1. Names, etc. of companies subject to merger (1) Names of companies subject to merger
Merging company ITX Corporation (consolidated subsidiary of the Company) Merged company IT Telecom, Inc. (consolidated subsidiary of the Company)
(2) Description of business of merged company
Sales of mobile phones, etc. and broadband and other communications service provider
(3) Legal form of merger
Absorption-type merger where ITX Corporation is the surviving company and IT Telecom, Inc. is the absorbed company
(4) Name of entity after the merger
ITX Corporation
(5) Overview of transactions including the purpose
The purpose of the merger is to accelerate the advancement of business and strengthen the information and telecommunication service business as the core competency by concentrating managerial resources and integrating information and communication service functions fostered through various assets, resources and know-how over many years of the ITX Group.
2. Overview of accounting treatment
The “common control transactions” accounting treatment will be applied in accordance with the “Accounting
Standard Relating to Business Combinations” (Business Accounting Council) and the “Guidance on
Accounting Standard for Business Combinations and Accounting Standard for Business Divestitures” (ASBJ
Guidance No. 10). Consequently, this accounting treatment has no affect on the consolidated financial
statements.

Olympus Corporation (7733) Financial Results for the Fiscal Year Ended March 31, 2009
34
5. Non-Consolidated Financial Statements (1) Non-Consolidated Balance Sheets
(Millions of yen)
As of March 31, 2008 As of March 31, 2009
ASSETS
Current assets
Cash and time deposits 59,369 17,830
Notes receivable 755 517
Accounts receivable 21,972 19,940
Finished goods 4,659 4,323
Work in process 5,593 6,812
Raw materials and supplies 512 496
Short-term loans receivable from subsidiaries and affiliates
220,731 11,766
Other receivable 13,807 9,500
Income taxes receivable 568 3,469
Deferred income taxes 9,740 9,393
Other current assets 2,126 2,821
Allowance for doubtful accounts (28) (236)
Total current assets 339,804 86,631
Fixed assets
Property, plant and equipment
Buildings 39,967 54,246
Accumulated depreciation (26,764) (28,040)
Buildings, net 13,203 26,206
Structures 3,115 3,325
Accumulated depreciation (2,097) (2,251)
Structures, net 1,018 1,074
Machinery and equipment 14,115 14,418
Accumulated depreciation (10,661) (11,353)
Machinery and equipment, net 3,454 3,065
Vehicles 62 60
Accumulated depreciation (53) (54)
Vehicles, net 9 6
Tools, furniture and fixtures 20,584 22,070
Accumulated depreciation (15,065) (16,577)
Tools, furniture and fixtures, net 5,519 5,493
Land 10,136 10,136
Lease assets - 530
Accumulated depreciation - (56)
Lease assets, net - 474
Construction in progress 4,126 799
Net property, plant and equipment 37,465 47,253
Intangible fixed assets
Goodwill 427 320
Patent right 2,464 2,205
Software 4,505 1,852
Software in progress 504 -
Lease assets - 113
Right of using facilities 65 64
Total intangible fixed assets 7,965 4,554

Olympus Corporation (7733) Financial Results for the Fiscal Year Ended March 31, 2009
35
(Millions of yen)
As of March 31, 2008 As of March 31, 2009
Investments and other assets Investment securities 144,967 105,878 Investment securities in subsidiaries and affiliates 210,114 346,170 Investments in capital of subsidiaries and affiliates 15,036 15,036 Long-term loans receivable 58 59 Long-term loans receivable from employees 129 99 Long-term loans receivable from subsidiaries and affiliates 3,861 8,198
Prepaid pension cost 6,188 8,236 Long-term prepaid expenses 4 2 Deferred income taxes 497 5,105 Investment in progress 19,034 - Other assets 3,737 3,782 Allowance for doubtful accounts (6) (3,393)
Total investments and other assets 403,619 489,172
Total fixed assets 449,049 540,979
Total assets 788,853 627,610
LIABILITIES
Current liabilities
Notes payable 291 256
Accounts payable 9,145 9,497
Short-term borrowings 191,305 1,305
Current maturities of bonds 35,000 20,000
Current maturities of long-term borrowings 20,000 -
Lease liabilities - 138
Other payable 30,639 18,950
Accrued expenses 17,071 12,889
Income taxes payable 164 175
Advances received 142 278
Deposits received 69,109 38,581
Provision for product warranties 52 76
Other current liabilities 3 268
Total current liabilities 372,921 102,413
Non-current liabilities
Long-term bonds, less current maturities 105,000 130,000
Long-term borrowings, less current maturities 65,000 300,000
Long-term deposits received, less current maturities 732 751
Lease liabilities - 447
Provision for loss on guarantees 632 -
Total non-current liabilities 171,364 431,198
Total liabilities 544,285 533,611
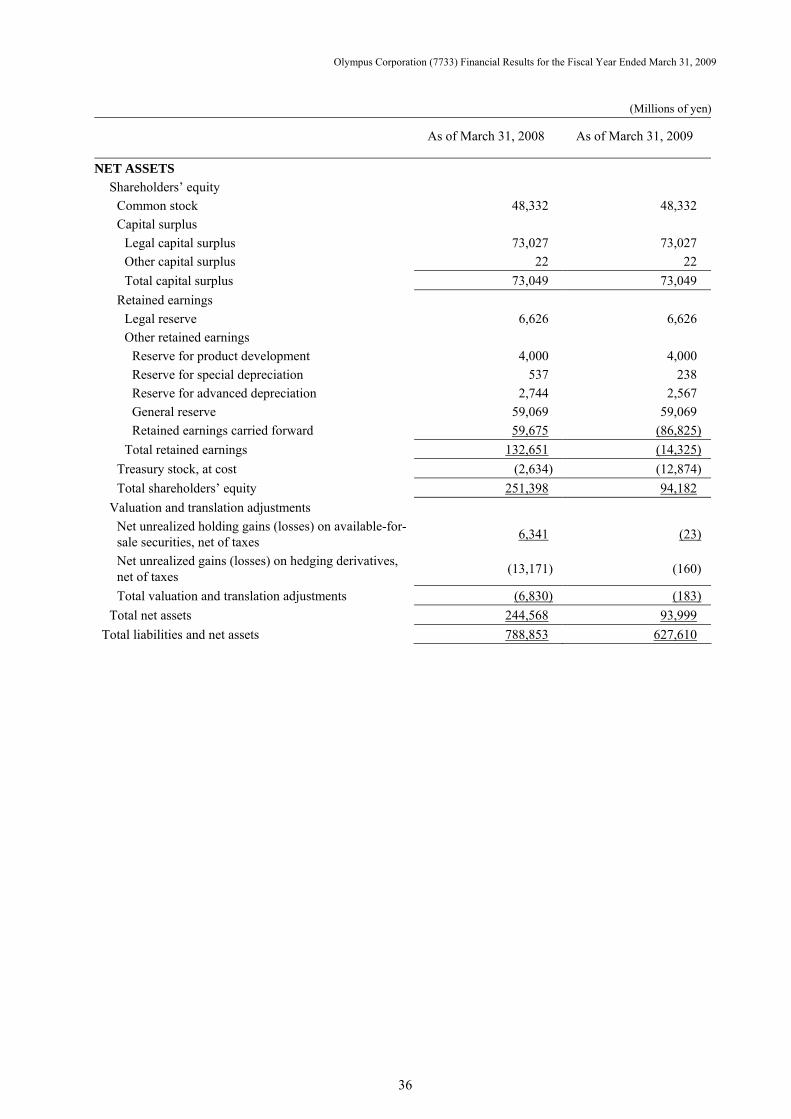
Olympus Corporation (7733) Financial Results for the Fiscal Year Ended March 31, 2009
36
(Millions of yen)
As of March 31, 2008 As of March 31, 2009
NET ASSETS
Shareholders’ equity
Common stock 48,332 48,332
Capital surplus
Legal capital surplus 73,027 73,027
Other capital surplus 22 22
Total capital surplus 73,049 73,049
Retained earnings
Legal reserve 6,626 6,626
Other retained earnings
Reserve for product development 4,000 4,000
Reserve for special depreciation 537 238
Reserve for advanced depreciation 2,744 2,567
General reserve 59,069 59,069
Retained earnings carried forward 59,675 (86,825)
Total retained earnings 132,651 (14,325)
Treasury stock, at cost (2,634) (12,874)
Total shareholders’ equity 251,398 94,182
Valuation and translation adjustments
Net unrealized holding gains (losses) on available-for-sale securities, net of taxes
6,341 (23)
Net unrealized gains (losses) on hedging derivatives, net of taxes
(13,171) (160)
Total valuation and translation adjustments (6,830) (183)
Total net assets 244,568 93,999
Total liabilities and net assets 788,853 627,610

Olympus Corporation (7733) Financial Results for the Fiscal Year Ended March 31, 2009
37
(2) Non-Consolidated Statements of Income
(Millions of yen)
Fiscal year ended March 31, 2008
Fiscal year ended March 31, 2009
Net sales
Net sales of finished goods 83,929 76,427
Service revenue 29,942 28,688
Total net sales 113,871 105,115
Costs of sales
Cost of finished goods sold
Beginning finished goods 4,784 4,659
Cost of products manufactured 54,554 53,770
Total 59,338 58,429
Transfer to other account 993 1,303
Ending finished goods 4,659 4,323
Cost of finished goods sold 53,686 52,803
Cost of service 4,613 5,555
Total cost of sales 58,299 58,358
Gross profit 55,572 46,757
Selling, general and administrative expenses 61,087 59,102
Operating loss (5,515) (12,345)
Non-operating income
Interest income 460 917
Interest on securities 262 170
Dividends income 50,610 29,652
Foreign currency exchange gain 118 -
Others 863 570
Total non-operating income 52,313 31,309
Non-operating expenses
Interest expenses 1,651 4,805
Interest on bonds 1,781 2,187
Amortization of bond issuance cost - 209
Foreign currency exchange loss - 710
Loss on interest in investments in partnership 2,533 -
Provision of allowance for doubtful accounts - 3,365
Others 2,569 2,132
Total non-operating expenses 8,534 13,408
Ordinary income 38,264 5,556
Extraordinary income
Gain on sales of fixed assets 395 -
Gain on sales of investment securities 66 691
Gain on sales of investment securities in subsidiaries and affiliates
- 1,752
Reversal of provision for loss on guarantees - 632
Total extraordinary income 461 3,075

Olympus Corporation (7733) Financial Results for the Fiscal Year Ended March 31, 2009
38
(Millions of yen)
Fiscal year ended March 31, 2008
Fiscal year ended March 31, 2009
Extraordinary losses
Loss on valuation of investment securities 1,014 13,115
Loss on valuation of investment securities in subsidiaries and affiliates
693 117,143
Loss on prior period adjustment - 15,516
Total extraordinary losses 1,707 145,774
Income (loss) before provision for income taxes 37,018 (137,143)
Income taxes, current (3,924) (804)
Income taxes for prior periods 1,049 -
Income taxes, deferred (1,415) (112)
Total (4,290) (916)
Net income (loss) 41,308 (136,227)

Olympus Corporation (7733) Financial Results for the Fiscal Year Ended March 31, 2009
39
(3) Non-Consolidated Statement of Changes in Net Assets
(Millions of yen)
Fiscal year ended March 31, 2008
Fiscal year ended March 31, 2009
Shareholders’ equity
Common stock
Net assets at March 31, 2008 48,331 48,332
Changes during the year
Net changes during the year - -
Balance at March 31, 2009 48,332 48,332
Capital surplus
Legal capital surplus
Net assets at March 31, 2008 73,027 73,027
Changes during the year
Net changes during the year - -
Balance at March 31, 2009 73,027 73,027
Other capital surplus
Net assets at March 31, 2008 22 22
Changes during the year
Net changes during the year - -
Balance at March 31, 2009 22 22
Retained earnings
Legal reserve
Net assets at March 31, 2008 6,626 6,626
Changes during the year
Net changes during the year - -
Balance at March 31, 2009 6,626 6,626
Other retained earnings
Net assets at March 31, 2008 96,610 126,025
Changes during the year
Cash dividends paid (11,893) (10,749)
Net income (loss) 41,308 (136,227)
Net changes during the year 29,415 (146,976)
Balance at March 31, 2009 126,025 (20,951)
Treasury stock, at cost
Net assets at March 31, 2008 (2,264) (2,634)
Changes during the year
Acquisition of treasury stock (370) (10,240)
Net changes during the year (370) (10,240)
Balance at March 31, 2009 (2,634) (12,874)
Total shareholders’ equity
Net assets at March 31, 2008 222,353 251,398
Changes during the year
Cash dividends paid (11,893) (10,749)
Net income (loss) 41,308 (136,227)
Acquisition of treasury stock (370) (10,240)
Net changes during the year 29,045 (157,216)
Balance at March 31, 2009 251,398 94,182
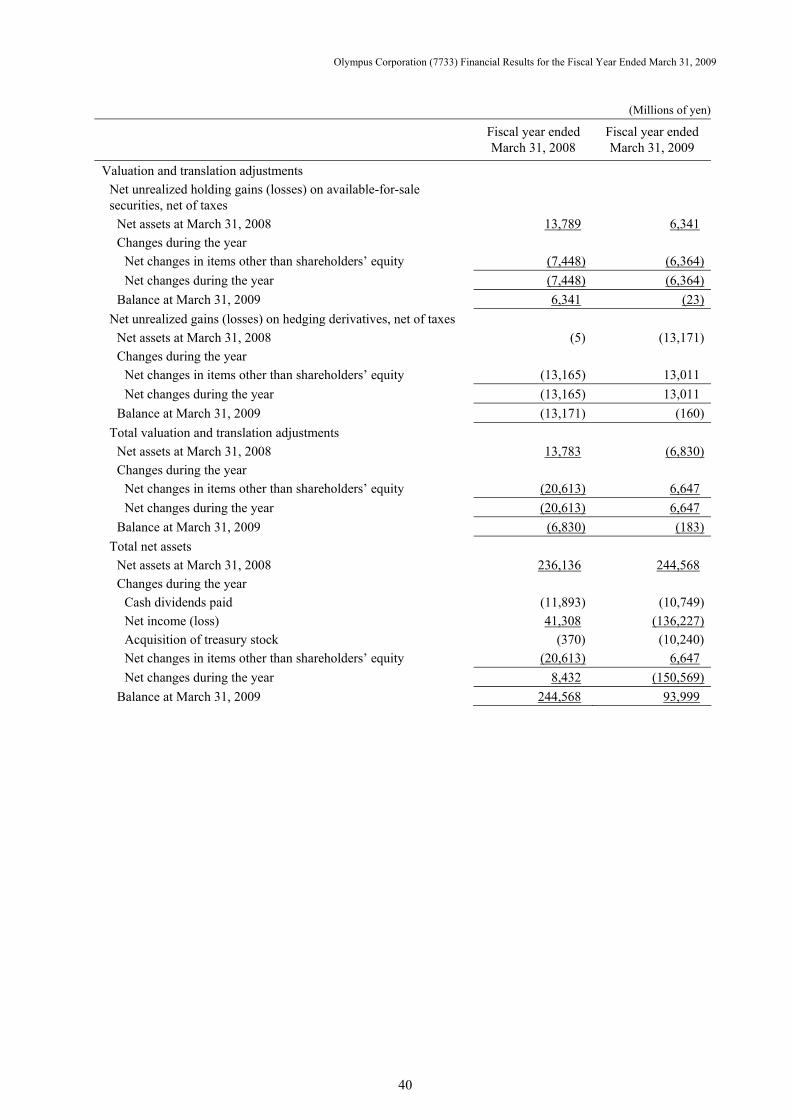
Olympus Corporation (7733) Financial Results for the Fiscal Year Ended March 31, 2009
40
(Millions of yen)
Fiscal year ended March 31, 2008
Fiscal year ended March 31, 2009
Valuation and translation adjustments
Net unrealized holding gains (losses) on available-for-sale securities, net of taxes
Net assets at March 31, 2008 13,789 6,341
Changes during the year
Net changes in items other than shareholders’ equity (7,448) (6,364)
Net changes during the year (7,448) (6,364)
Balance at March 31, 2009 6,341 (23)
Net unrealized gains (losses) on hedging derivatives, net of taxes
Net assets at March 31, 2008 (5) (13,171)
Changes during the year
Net changes in items other than shareholders’ equity (13,165) 13,011
Net changes during the year (13,165) 13,011
Balance at March 31, 2009 (13,171) (160)
Total valuation and translation adjustments
Net assets at March 31, 2008 13,783 (6,830)
Changes during the year
Net changes in items other than shareholders’ equity (20,613) 6,647
Net changes during the year (20,613) 6,647
Balance at March 31, 2009 (6,830) (183)
Total net assets
Net assets at March 31, 2008 236,136 244,568
Changes during the year
Cash dividends paid (11,893) (10,749)
Net income (loss) 41,308 (136,227)
Acquisition of treasury stock (370) (10,240)
Net changes in items other than shareholders’ equity (20,613) 6,647
Net changes during the year 8,432 (150,569)
Balance at March 31, 2009 244,568 93,999

Olympus Corporation (7733) Financial Results for the Fiscal Year Ended March 31, 2009
41
Marginal notes for Non-Consolidated Statement of Changes in Net Assets
Fiscal year ended March 31, 2008 Note: 1. Breakdown of other retained earnings
(Millions of yen)
Reserve for
product development
Reserve for special
depreciation
Reserve for advanced
depreciation
General reserve
Retained earnings carried forward
Total
Net assets at March 31, 2007 4,000 944 2,624 79,068 9,972 96,610
Changes during the year
Cash dividends paid (11,893) (11,893)
Reversal of reserve for special
depreciation (408) 408 -
Provision of reserve for advanced
depreciation 294 (294) -
Reversal of reserve for advanced
depreciation (174) 174 -
Reversal of general reserve (20,000) 20,000 -
Net income (loss) 41,308 41,308
Net changes during the year - (408) 120 (20,000) 49,703 29,415
Balance at March 31, 2008 4,000 537 2,744 59,069 59,675 126,025
Note: 2. Net assets at March 31, 2007 is truncated to the nearest million yen, and balance at March 31, 2008 and
Changes during the year are rounded off to the nearest million yen. Fiscal year ended March 31, 2009 Note: Breakdown of other retained earnings
(Millions of yen)
Reserve for
product development
Reserve for special
depreciation
Reserve for advanced
depreciation
General reserve
Retained earnings carried forward
Total
Net assets at March 31, 2008 4,000 537 2,744 59,069 59,675 126,025
Changes during the year
Cash dividends paid (10,749) (10,749)
Reversal of reserve for special
depreciation (299) 299 -
Reversal of reserve for advanced
depreciation (177) 177 -
Net income (loss) (136,227) (136,227)
Net changes during the year - (299) (177) - (146,500) (146,976)
Balance at March 31, 2009 4,000 238 2,567 59,069 (86,825) (20,951)
(4) Notes on Premise of Going Concern
No items to report.