december 2020 half year report and asx appendix 4d
TRANSCRIPT

ASX Release / 17 February 2021
Investor Relations Mr David Cotterell Manager Investor Relations +61 3 8660 1959 ASX: SBM Media Relations Mr Ben Wilson GRACosway +61 407 966 083 ADR: STBMY Authorised by Board of Directors St Barbara Limited Level 10, 432 St Kilda Road, Melbourne VIC 3004 T +61 3 8660 1900 F +61 3 8660 1999 ACN 009 165 066 Locked Bag 9, Collins Street East, Melbourne VIC 8003 W www.stbarbara.com.au
December 2020 Half Year Report and ASX Appendix 4D
St Barbara Ltd (ASX: SBM) reported a statutory profit after tax of A$37 million for the half year to 31 December 2020 (2019 comparative period: A$39 million profit), with underlying profit after tax1 of A$40 million (2019 comparative period: A$35 million).
Key highlights of the result are:
• Gold production of 162,660 ounces at a Group All-in Sustaining Cost1 of A$1,605 per ounce
• Consolidated EBITDA margin1 of 42%
• Net cash contribution1 of A$100 million for the half year
• $0.04 fully franked interim dividend declared today for the half year to 31 December 2020 to be paid on 24 March 2021
• Cash position of A$119 million2 and debt of A$1013 million at 31 December 2020
Mr Craig Jetson, Managing Director & CEO, said: “This financial result represents an encouraging recovery from the operational disappointments of the first quarter, with improving contributions from all three operations. Over consecutive halves, Atlantic Gold has delivered record production as continuous improvements in mill throughout generated early returns. St Barbara is in a strong financial position that affords us the opportunity to support growth projects across all three of our operating jurisdictions. In the coming months we will provide an update on the Sulphide Feasibility Study at Simberi, the Leonora Province Plan and submit Environmental Impact Statements for Atlantic Gold’s growth projects.”
Full details of the financial results are set out in the attached Interim Financial Report and Appendix 4D for the Half Year to 31 December 2020.
1 Non-IFRS measures, refer attached Interim Financial Report for the Half Year to 31 December 2020, pages 3 to 5. In addition,
EBITDA margin = Group EBITDA as a % of Revenue 2 Balance comprises A$119 M cash 3 C$100 M (Canadian Tranche) drawn down under the syndicated facility and excludes A$11 M lease liabilities (from AASB 16).
St Barbara Limited
Presentation on the December 2020 Half Year Financial Report and webcast
Mr Craig Jetson, Managing Director & CEO, and Mr Garth Campbell-Cowan, Chief Financial Officer, will brief analysts and institutional investors on the half year financial results at 11:00 am Australian Eastern Daylight Time (UTC + 11 hours) on Wednesday 17 February 2021. Analysts and institutional investors Analysts and institutional investors can register for the briefing at: https://s1.c-conf.com/diamondpass/10012223-l3kozu.html Shareholders and media A live audio webcast of the briefing will be available on St Barbara’s website at stbarbara.com.au/investors/webcast/ or by clicking here. The audio webcast is ‘listen only’ and does not enable questions. The audio webcast will subsequently be made available on the website.
Appendix 4D
Half Year Report
ST BARBARA LIMITED
ABN or equivalent company reference
Half yearly (tick)
Preliminary final (tick)
Half year/financial year ended (‘current period’)
36 009 165 066 31 December 2020
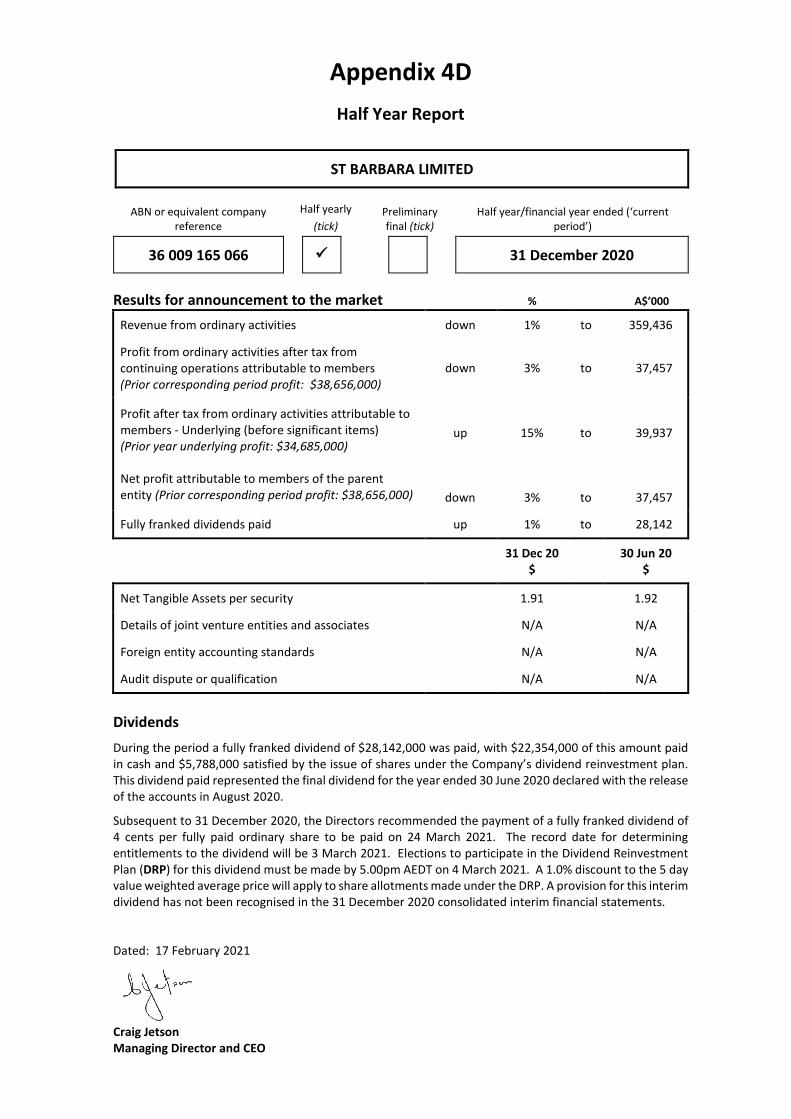
Results for announcement to the market % A$’000
Revenue from ordinary activities down 1% to 359,436
Profit from ordinary activities after tax from continuing operations attributable to members (Prior corresponding period profit: $38,656,000)
down 3% to 37,457
Profit after tax from ordinary activities attributable to members - Underlying (before significant items) (Prior year underlying profit: $34,685,000) Net profit attributable to members of the parent entity (Prior corresponding period profit: $38,656,000)
up
down
15%
3%
to
to
39,937
37,457
Fully franked dividends paid up 1% to 28,142
31 Dec 20 $
30 Jun 20 $
Net Tangible Assets per security 1.91 1.92
Details of joint venture entities and associates N/A N/A
Foreign entity accounting standards N/A N/A
Audit dispute or qualification N/A N/A
Dividends During the period a fully franked dividend of $28,142,000 was paid, with $22,354,000 of this amount paid in cash and $5,788,000 satisfied by the issue of shares under the Company’s dividend reinvestment plan. This dividend paid represented the final dividend for the year ended 30 June 2020 declared with the release of the accounts in August 2020.
Subsequent to 31 December 2020, the Directors recommended the payment of a fully franked dividend of 4 cents per fully paid ordinary share to be paid on 24 March 2021. The record date for determining entitlements to the dividend will be 3 March 2021. Elections to participate in the Dividend Reinvestment Plan (DRP) for this dividend must be made by 5.00pm AEDT on 4 March 2021. A 1.0% discount to the 5 day value weighted average price will apply to share allotments made under the DRP. A provision for this interim dividend has not been recognised in the 31 December 2020 consolidated interim financial statements.
Dated: 17 February 2021 Craig Jetson Managing Director and CEO

Interim Financial Report for the half year ended 31 December 2020

ST BARBARA LIMITED Directors’ Report 2021 Interim Financial Report
Page 2
Contents
Directors’ Report
Page
Directors 2 Principal activities 2 Overview of group results 3 Overview of operating results 4 Discussion and analysis of Leonora operations 5 Discussion and analysis of Simberi operations 6 Discussion and analysis of Atlantic Gold operations 7 Discussion and analysis of the condensed consolidated statement of profit or loss
8
Discussion and analysis of the condensed consolidated statement of cash flows
9
Discussion and analysis of the condensed consolidated balance sheet
10
Auditor’s independence 10 Events occurring after the end of the financial period 10 Rounding of amounts 10
Auditor’s Independence declaration 11
Financial Report 12
Directors’ declaration 23
Independent auditor’s report 24
Directors’ Report
Directors
The Directors present their report on the “St Barbara Group”, consisting of St Barbara Limited and the entities it controlled at the end of, or during, the half year ended 31 December 2020.
The following persons were Directors of St Barbara Limited at any time during the period and up to the date of this report:
• T C NetscherNon-Executive Chairman
• C A Jetson Managing Director and CEO
• S G Dean Non-Executive Director
• K J GleesonNon-Executive Director
• S E LoaderNon-Executive Director
• D E J MoroneyNon-Executive Director
Principal activities
During the period, the principal activities of the Group were mining and the sale of gold, mineral exploration and development. There were no significant changes in the nature of activities of the Group during the period.
Dividends
Dividends paid, or determined to be paid, by the Company to members during the period ended 31 December 2020 are set out in Note 4 to the financial statements.
ST BARBARA LIMITED Directors’ Report 2021 Interim Financial Report
Page 3
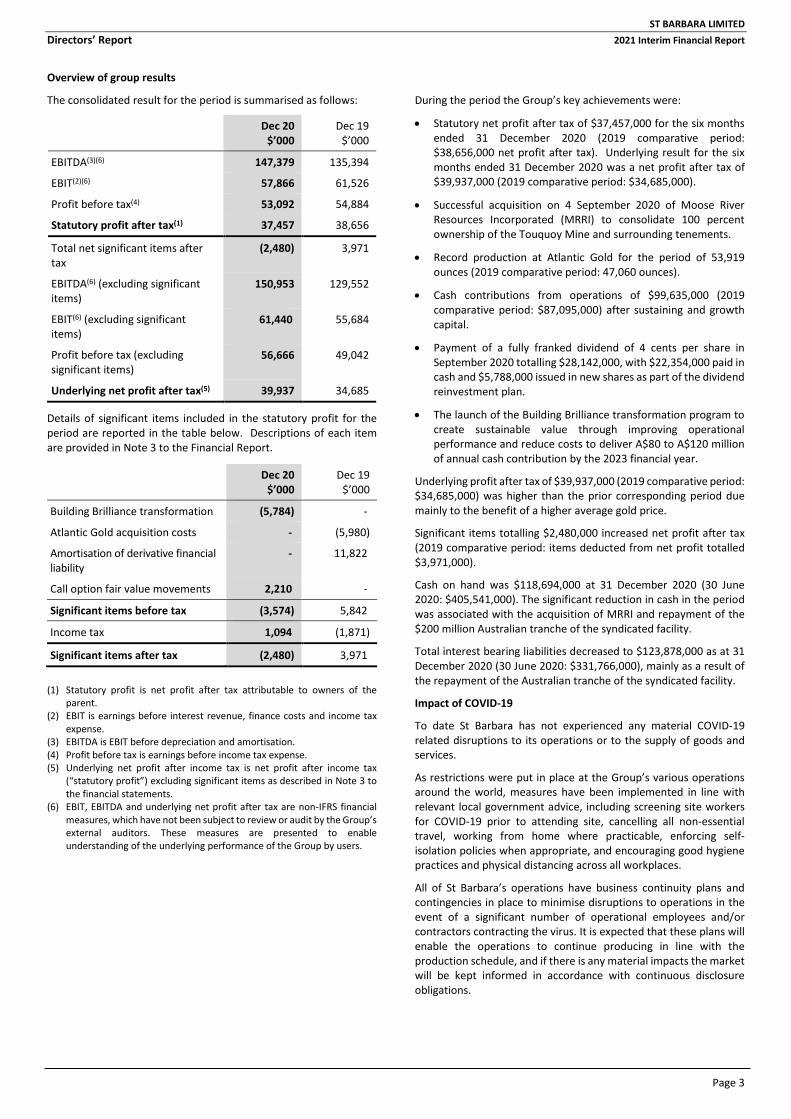
Overview of group results
The consolidated result for the period is summarised as follows:
Dec 20 $’000
Dec 19 $’000
EBITDA(3)(6) 147,379 135,394
EBIT(2)(6) 57,866 61,526
Profit before tax(4) 53,092 54,884
Statutory profit after tax(1) 37,457 38,656
Total net significant items after tax
(2,480) 3,971
EBITDA(6) (excluding significant items)
150,953 129,552
EBIT(6) (excluding significant items)
61,440 55,684
Profit before tax (excluding significant items)
56,666 49,042
Underlying net profit after tax(5) 39,937 34,685
Details of significant items included in the statutory profit for the period are reported in the table below. Descriptions of each item are provided in Note 3 to the Financial Report.
Dec 20 $’000
Dec 19 $’000
Building Brilliance transformation (5,784) -
Atlantic Gold acquisition costs - (5,980)
Amortisation of derivative financial liability
- 11,822
Call option fair value movements 2,210 -
Significant items before tax (3,574) 5,842
Income tax 1,094 (1,871)
Significant items after tax (2,480) 3,971
(1) Statutory profit is net profit after tax attributable to owners of theparent.
(2) EBIT is earnings before interest revenue, finance costs and income taxexpense.
(3) EBITDA is EBIT before depreciation and amortisation.(4) Profit before tax is earnings before income tax expense.(5) Underlying net profit after income tax is net profit after income tax
(“statutory profit”) excluding significant items as described in Note 3 tothe financial statements.
(6) EBIT, EBITDA and underlying net profit after tax are non-IFRS financialmeasures, which have not been subject to review or audit by the Group’sexternal auditors. These measures are presented to enableunderstanding of the underlying performance of the Group by users.
During the period the Group’s key achievements were:
• Statutory net profit after tax of $37,457,000 for the six monthsended 31 December 2020 (2019 comparative period:$38,656,000 net profit after tax). Underlying result for the sixmonths ended 31 December 2020 was a net profit after tax of$39,937,000 (2019 comparative period: $34,685,000).
• Successful acquisition on 4 September 2020 of Moose RiverResources Incorporated (MRRI) to consolidate 100 percentownership of the Touquoy Mine and surrounding tenements.
• Record production at Atlantic Gold for the period of 53,919ounces (2019 comparative period: 47,060 ounces).
• Cash contributions from operations of $99,635,000 (2019comparative period: $87,095,000) after sustaining and growthcapital.
• Payment of a fully franked dividend of 4 cents per share inSeptember 2020 totalling $28,142,000, with $22,354,000 paid incash and $5,788,000 issued in new shares as part of the dividendreinvestment plan.
• The launch of the Building Brilliance transformation program tocreate sustainable value through improving operationalperformance and reduce costs to deliver A$80 to A$120 millionof annual cash contribution by the 2023 financial year.
Underlying profit after tax of $39,937,000 (2019 comparative period: $34,685,000) was higher than the prior corresponding period due mainly to the benefit of a higher average gold price.
Significant items totalling $2,480,000 increased net profit after tax (2019 comparative period: items deducted from net profit totalled $3,971,000).
Cash on hand was $118,694,000 at 31 December 2020 (30 June 2020: $405,541,000). The significant reduction in cash in the period was associated with the acquisition of MRRI and repayment of the $200 million Australian tranche of the syndicated facility.
Total interest bearing liabilities decreased to $123,878,000 as at 31 December 2020 (30 June 2020: $331,766,000), mainly as a result of the repayment of the Australian tranche of the syndicated facility.
Impact of COVID-19
To date St Barbara has not experienced any material COVID-19 related disruptions to its operations or to the supply of goods and services.
As restrictions were put in place at the Group’s various operations around the world, measures have been implemented in line with relevant local government advice, including screening site workers for COVID-19 prior to attending site, cancelling all non-essential travel, working from home where practicable, enforcing self-isolation policies when appropriate, and encouraging good hygiene practices and physical distancing across all workplaces.
All of St Barbara’s operations have business continuity plans and contingencies in place to minimise disruptions to operations in the event of a significant number of operational employees and/or contractors contracting the virus. It is expected that these plans will enable the operations to continue producing in line with the production schedule, and if there is any material impacts the market will be kept informed in accordance with continuous disclosure obligations.

ST BARBARA LIMITED Directors’ Report 2021 Interim Financial Report
Page 4
Overview of operating results
The table below provides a summary of the profit before tax generated from St Barbara Group operations.
Leonora Simberi Atlantic Gold (3) Group $’000 2020 2019 2020 2019 2020 2019 2020 2019 Revenue 128,493 149,868 129,776 114,046 99,797 97,989 358,066 361,903 Mine operating costs (70,029) (73,299) (70,728) (77,972) (31,283) (28,633) (172,040) (179,904) Gross profit 58,464 76,569 59,048 36,074 68,514 69,356 186,026 181,999 Royalties (7,590) (6,713) (3,195) (2,859) (1,993) (1,696) (12,778) (11,268) EBITDA 50,874 69,856 55,853 33,215 66,521 67,660 173,248 170,731 Depreciation and amortisation(2) (33,491) (29,244) (9,147) (10,845) (45,649) (32,821) (88,287) (72,910) Profit from operations(1) 17,383 40,612 46,706 22,370 20,872 34,839 84,961 97,821
(1) Excludes impairment, corporate costs, exploration expenses, interest and tax and is non-IFRS financial information, which has not been subject to review oraudit by the Group’s external auditors.
(2) Depreciation and amortisation of Atlantic Gold includes amortisation of mineral rights for the period of $37,470,000 (2019 comparative period: $26,698,000). (3) Atlantic Gold was acquired with effect from 19 July 2019.
The table below provides a summary of the cash contribution from St Barbara cash generating units.
Leonora Simberi Atlantic Gold Group $’000 2020 2019 2020 2019 2020 2019 2020 2019 Operating cash contribution 50,506 64,702 55,898 35,196 61,208 61,026 167,612 160,924 Capital - sustaining (36,971) (28,154) (4,286) (2,932) (10,526) (4,927) (51,783) (36,013) Cash Contribution (1) 13,535 36,548 51,612 32,264 50,682 56,099 115,829 124,911 Growth capital – Gwalia Extension Project (676) (23,553) - - - - (676) (23,553) Other growth capital(2) (10,078) (3,461) (1,932) (2,527) (3,508) (8,275) (15,518) (14,263) Cash contribution after growth capital 2,781 9,534 49,680 29,737 47,174 47,824 99,635 87,095
(1) Cash contribution is non-IFRS financial information, which has not been subject to review or audit by the Group’s external auditors. This measure is providedto enable an understanding of the cash generating performance of the operations. This amount excludes corporate royalties paid and growth capital.
(2) Growth expenditure relates mainly to additional ventilation and cooling capital at Gwalia, expenditure on the sulphides project at Simberi and capitalised near mine drilling and studies expenditure at Atlantic Gold.
Operating profit before tax Net profit before tax of $53,092,000 (2019 comparative period: $54,884,000) for the period was impacted by a lower contribution from Gwalia, partly offset by a higher average gold price.
Total production for the Group in the period was 162,661 ounces of gold (2019 comparative period: 181,728 ounces), and gold sales amounted to 165,921 ounces (2019: 178,016 ounces) at an average gold price of A$2,145 per ounce (2019: A$1,961 per ounce). The lower production result in the period was attributable to Leonora and Simberi, partly offset by record production from Atlantic Gold.
Consolidated AISC for the Group was $1,605 per ounce in the period (2019 comparative period: $1,391 per ounce), reflecting the impact of higher unit cash costs due mainly to lower production at Gwalia and Simberi, together with increased sustaining capital expenditure at all three operations.
The increase in the depreciation and amortisation for the Group compared to the prior comparative period reflects the additional charges related to capital at Gwalia associated with the extension project, assets from the purchase of MRRI and increased mineral rights associated with finalising the purchase price allocation for the acquisition of Atlantic Gold.
Operating cash contribution During the period the Group produced net cash contribution from operations after growth capital of $99,635,000 (2019 comparative period: $87,095,000). Higher operating cash contribution of $167,612,000 (2019 comparative period: $160,924,000) was reduced by increased sustaining capital expenditure in the period. The substantial completion of the Gwalia Extension Project in the prior financial year meant there was lower growth capital in the period.
The higher sustaining capital at Gwalia was associated with increased mine development and further advancement of Gwalia ventilation and underground cooling. Capital expenditure at Simberi in the period was mainly to improve the mining fleet, while at Atlantic Gold expenditure was incurred on the next lift of the tailings storage facility and to improve aspects of the mining fleet and processing plant.

ST BARBARA LIMITED Directors’ Report 2021 Interim Financial Report
Page 5
Analysis of Leonora operations
Total gold sales revenue from the Gwalia mine in the period amounted to $128,302,000 (2019 comparative period: $149,665,000), which was generated from gold sales of 64,336 ounces (2019 comparative period: 78,548 ounces) at an average achieved gold price of A$1,994 per ounce (2019 comparative period: A$1,905 per ounce).
A summary of production performance for the period ended 31 December 2020 is provided in the table below.
Details of production performance
Gwalia
Six months to 31 December 2020 2019
Underground ore mined (kt) 242 317
Grade (g/t) 8.2 7.9
Ore milled (kt) 274 347
Grade (g/t) 7.6 7.4
Recovery (%) 97 98
Gold production (oz) 64,823 80,175
Gold sales (oz) 64,336 78,548
Cash cost(1) (A$/oz) 1,220 1,067
All-In Sustaining Cost (AISC)(2) (A$/oz) 1,933 1,513
(1) Cash operating costs are mine operating costs including governmentroyalties, and after by-product credits. This is a non-IFRS financialmeasure which has not been subject to review or audit by the Group’sexternal auditors. It is presented to provide meaningful information toassist management, investors and analysts in understanding the resultsof the operations. Cash operating costs are calculated according tocommon mining industry practice using The Gold Institute (USA)Production Cost Standard (1999 revision).
(2) AISC is a non IFRS financial measure which has not been subject to review or audit by the Group’s external auditors. It is presented to provide ameaningful measure by which to access the total sustaining cash cost of production. It is calculated in accordance with the World Gold Council’sGuidance Note on Non-GAAP Metrics – All-In Sustaining Costs and All-In Costs (June 2013).
Gwalia reported significantly lower mined volume of ore in the period, with gold production of 64,823 ounces (2019 comparative period: 80,175 ounces). Underground ore mined in the period was 242,000 tonnes (2019 comparative period: 317,000 tonnes), with substantially lower than planned ore mined in the September quarter. The first quarter was impacted by a seismic event that caused a fall of ground resulting in closure of the decline and rehabilitation of a 30 metre lateral section. In addition, there was planned prioritisation of mine development in the period to prepare the mine for production in the second half of the financial year.
Ore mined and milled grades were marginally higher than the prior corresponding period at 8.2 and 7.6 grams per tonne respectively (2019 comparative period: 7.9 grams per tonne and 7.4 grams per tonne respectively). The Gwalia mill continued to perform well in the period at an average recovery of 97 percent (2019 comparative period: 98 percent).
Gwalia unit cash costs for the period were $1,220 per ounce (2019 comparative period: $1,067 per ounce), with the higher unit costs predominantly due to lower production driven by reduced mining tonnes. The unit AISC for Gwalia was $1,933 per ounce for the period, which was higher than the $1,513 per ounce reported in the prior corresponding period. The higher AISC for the period reflected the impact of lower production ounces and increased sustaining capital expenditure. Total operating cash expenditure at Gwalia in the period totalled $79,084,000 (2019 comparative period: $85,546,000).
In the period, Gwalia generated net cash flows, after sustaining capital expenditure, of $13,535,000 (2019 comparative period: $36,548,000). The result for the period was impacted by the materially lower production and gold sales. In the current period, Gwalia incurred sustaining capital expenditure of $36,971,000 (2019 comparative period: $28,154,000). The higher level of sustaining capital was mainly attributable to increased mine development expenditure.
Growth capital in the period was significantly lower than the prior corresponding period due to the fact that the Extension Project was substantially completed in the prior financial year. Growth capital in the current period of $10,078,000 (2019 comparative period: $3,461,000) was mainly for additional ventilation and underground cooling to support future mining. Expenditure related to the Extension Project was $676,000 in the period (2019 comparative period: $23,553,000).

ST BARBARA LIMITED Directors’ Report 2021 Interim Financial Report
Page 6
Analysis of Simberi operations
Total gold sales revenue from Simberi in the period was $127,813,000 (2019 comparative period: $113,490,000), generated from gold sales of 49,502 ounces (2019 comparative period: 52,575 ounces) at an average achieved gold price of A$2,582 per ounce (2019: A$2,159 per ounce).
A summary of production performance at Simberi for the period ended 31 December 2020 is set out in the table below.
Details of production performance
Simberi Six months to 31 December 2020 2019
Open pit ore mined (kt) 1,343 1,275
Grade (g/t) 1.32 1.06
Ore milled (kt) 1,499 1,668
Grade (g/t) 1.30 1.14
Recovery (%) 70 83
Gold production (oz) 43,918 50,131
Gold sales (oz) 49,502 52,575
Cash cost(1) (A$/oz) 1,640 1,561
All-In Sustaining Cost (AISC)(2) (A$/oz) 1,863 1,717
(1) Cash operating costs are mine operating costs including governmentroyalties, and after by-product credits. This is a non-IFRS financialmeasure which has not been subject to review or audit by the Group’sexternal auditors. It is presented to provide meaningful information toassist management, investors and analysts in understanding the resultsof the operations. Cash operating costs are calculated according tocommon mining industry practice using The Gold Institute (USA)Production Cost Standard (1999 revision).
(2) AISC is a non-IFRS financial measure which has not been subject toreview or audit by the Group’s external auditors. It is presented toprovide a meaningful measure by which to assess the total sustainingcash cost of operation. It is calculated in accordance with the World GoldCouncil’s Guidance Note on Non-GAAP Metrics – All-In Sustaining Costsand All-In Costs (June 2013).
Simberi production for the period was 43,918 ounces (2019 comparative period: 50,131 ounces). The result for the period was significantly impacted by lower recovery from processing transitional oxide to sulphide ore.
Total material moved in the period was 4,971,000 tonnes (2019 comparative period: 6,144,000 tonnes), which included total ore mined of 1,343,000 tonnes at an average grade of 1.32 grams per tonne (2019 comparative period: 1,275,000 tonnes at 1.06 grams per tonne). Material movement in the period was impacted by lower truck fleet availability, which is being addressed through a fleet improvement program that includes purchasing additional fleet.
Ore milled decreased to 1,499,000 tonnes in the period (2019 comparative period: 1,668,000 tonnes), with mill throughput impacted by unscheduled maintenance of the semi-autogenous grinding (SAG) mill, scrubber circuit and aerial rope conveyer (RopeCon). The Simberi mill recovery decreased to 70 percent in the period (2019 comparative period: 83 percent), mainly as a result of processing transitional oxide to sulphide material.
Simberi unit cash costs for the period were higher than the prior corresponding period at $1,640 per ounce (2019 comparative period: $1,561 per ounce), predominately due to lower production. The unit AISC was $1,863 per ounce for the period (2019 comparative period: $1,717 per ounce), which reflected the higher unit cash costs and increased sustaining capital. Total operating cash expenditure at Simberi during the period was $72,026,000 (2019 comparative period: $78,255,000).
In the period Simberi generated net cash flows, after sustaining capital expenditure, of $51,612,000 (2019 comparative period: net cash flows of $32,264,000). The higher net cash flows was due to the materially higher average gold price realised in the period. Capital expenditure in the period was $6,218,000 (2019 comparative period: $5,459,000), comprising sustaining capital of $4,286,000 (2019 comparative period: $2,932,000) and growth capital of $1,932,000 (2019 comparative period: $2,527,000). Growth capital represented sulphide drilling below the Sorowar pit and feasibility study expenditure.
ST BARBARA LIMITED Directors’ Report 2021 Interim Financial Report
Page 7
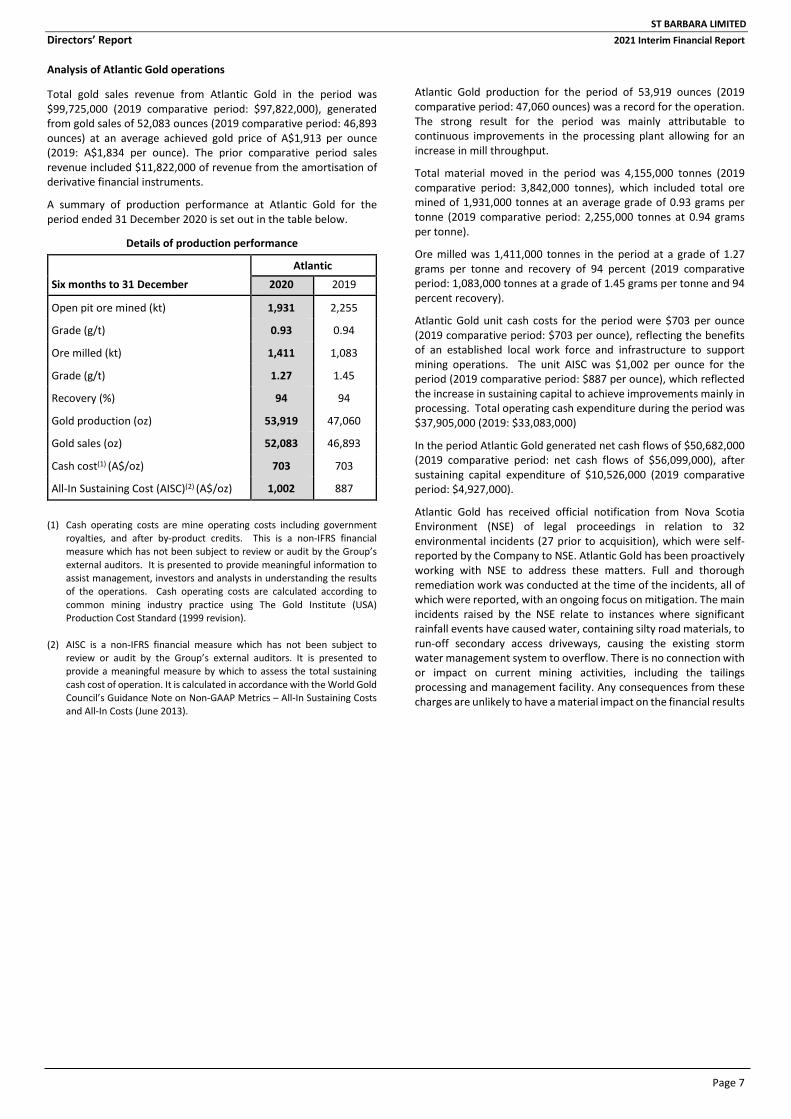
Analysis of Atlantic Gold operations
Total gold sales revenue from Atlantic Gold in the period was $99,725,000 (2019 comparative period: $97,822,000), generated from gold sales of 52,083 ounces (2019 comparative period: 46,893 ounces) at an average achieved gold price of A$1,913 per ounce (2019: A$1,834 per ounce). The prior comparative period sales revenue included $11,822,000 of revenue from the amortisation of derivative financial instruments.
A summary of production performance at Atlantic Gold for the period ended 31 December 2020 is set out in the table below.
Details of production performance
Atlantic Six months to 31 December 2020 2019
Open pit ore mined (kt) 1,931 2,255
Grade (g/t) 0.93 0.94
Ore milled (kt) 1,411 1,083
Grade (g/t) 1.27 1.45
Recovery (%) 94 94
Gold production (oz) 53,919 47,060
Gold sales (oz) 52,083 46,893
Cash cost(1) (A$/oz) 703 703
All-In Sustaining Cost (AISC)(2) (A$/oz) 1,002 887
(1) Cash operating costs are mine operating costs including governmentroyalties, and after by-product credits. This is a non-IFRS financialmeasure which has not been subject to review or audit by the Group’sexternal auditors. It is presented to provide meaningful information toassist management, investors and analysts in understanding the resultsof the operations. Cash operating costs are calculated according tocommon mining industry practice using The Gold Institute (USA)Production Cost Standard (1999 revision).
(2) AISC is a non-IFRS financial measure which has not been subject toreview or audit by the Group’s external auditors. It is presented toprovide a meaningful measure by which to assess the total sustainingcash cost of operation. It is calculated in accordance with the World GoldCouncil’s Guidance Note on Non-GAAP Metrics – All-In Sustaining Costsand All-In Costs (June 2013).
Atlantic Gold production for the period of 53,919 ounces (2019 comparative period: 47,060 ounces) was a record for the operation. The strong result for the period was mainly attributable to continuous improvements in the processing plant allowing for an increase in mill throughput.
Total material moved in the period was 4,155,000 tonnes (2019 comparative period: 3,842,000 tonnes), which included total ore mined of 1,931,000 tonnes at an average grade of 0.93 grams per tonne (2019 comparative period: 2,255,000 tonnes at 0.94 grams per tonne).
Ore milled was 1,411,000 tonnes in the period at a grade of 1.27 grams per tonne and recovery of 94 percent (2019 comparative period: 1,083,000 tonnes at a grade of 1.45 grams per tonne and 94 percent recovery).
Atlantic Gold unit cash costs for the period were $703 per ounce (2019 comparative period: $703 per ounce), reflecting the benefits of an established local work force and infrastructure to support mining operations. The unit AISC was $1,002 per ounce for the period (2019 comparative period: $887 per ounce), which reflected the increase in sustaining capital to achieve improvements mainly in processing. Total operating cash expenditure during the period was $37,905,000 (2019: $33,083,000)
In the period Atlantic Gold generated net cash flows of $50,682,000 (2019 comparative period: net cash flows of $56,099,000), after sustaining capital expenditure of $10,526,000 (2019 comparative period: $4,927,000).
Atlantic Gold has received official notification from Nova Scotia Environment (NSE) of legal proceedings in relation to 32 environmental incidents (27 prior to acquisition), which were self-reported by the Company to NSE. Atlantic Gold has been proactively working with NSE to address these matters. Full and thorough remediation work was conducted at the time of the incidents, all of which were reported, with an ongoing focus on mitigation. The main incidents raised by the NSE relate to instances where significant rainfall events have caused water, containing silty road materials, to run-off secondary access driveways, causing the existing storm water management system to overflow. There is no connection with or impact on current mining activities, including the tailings processing and management facility. Any consequences from these charges are unlikely to have a material impact on the financial results
ST BARBARA LIMITED Directors’ Report 2021 Interim Financial Report
Page 8
Discussion and analysis of the condensed consolidated statement of profit or loss Revenue
Total revenue was lower than the prior comparative period at $358,066,000 (2019 comparative period: $361,903,000) mainly due to lower gold sales from Leonora and Simberi, partially offset by a higher average gold price of A$2,145 per ounce (2019 comparative period: A$1,961 per ounce). The prior comparative period revenue included $11,822,000 of gold sales revenue associated with the amortisation of derivative financial instruments acquired with Atlantic Gold.
Mine operating costs
Mine operating costs were $172,040,000 in the period (2019 comparative period: $179,904,000), with the lower operating costs mainly attributable to lower production at Leonora and Simberi.
Other revenue and income
Interest revenue was $401,000 (2019 comparative period: $1,396,000), representing interest earned on cash and deposits held to maturity during the period. The lower interest revenue was the result of a reduction in cash reserves following the acquisition of MRRI and repayment of the syndicated facility early in the period. Other income of $969,000 (2019 comparative period: $11,000) related to royalty income.
Exploration
Total exploration expenditure during the period amounted to $20,416,000 (2019 comparative period: $26,722,000). Exploration expenditure expensed in the profit or loss statement in the period amounted to $15,310,000 (2019 comparative period: $14,354,000).
Exploration activities during the period focused on investigating highly prospective near mine targets at Simberi, regional exploration in Leonora and Australia and resource drilling near mine areas at Atlantic Gold and in the surrounding highly prospective Nova Scotia region.
Corporate costs and expenses associated with acquisition.
Corporate costs for the period of $14,427,000 (2019 comparative period: $10,571,000) comprised mainly expenses relating to the corporate office, compliance costs and business development activities.
Royalties
Royalty expenses for the period were $12,778,000 (2019 comparative period: $11,268,000). Royalties paid in Western Australia are 2.5% of gold revenues, plus a corporate royalty of 1.5% of gold revenues. Royalties paid in Papua New Guinea are 2.5% of gold revenues earned from the Simberi mine. Royalties paid in Canada (Nova Scotia) are 1% of gold revenues plus a 1% corporate royalty on gold revenues. Royalties are calculated on gold sales at the relevant spot gold prices.
Depreciation and amortisation
Depreciation and amortisation of fixed assets, mine properties and mineral rights for the period amounted to $89,513,000 (2019 comparative period: $73,868,000). The Atlantic Gold depreciation and amortisation for the period of $45,649,000 (2019 comparative period: $32,821,000) included amortisation of mineral rights acquired of $37,470,000 (2019 comparative period: $26,698,000). The Atlantic Gold depreciation and amortisation is based on the fair value of the assets acquired, including from the acquisition of MRRI.
Other expenses
Other expenditure of $7,011,000 (2019 comparative period: $3,820,000) included costs related to share based payments, expenses for other Group projects and expenses in relation to the Building Brilliance transformation program of $5,784,000 (2019 comparative period: $Nil).
Net finance costs
Finance costs in the period decreased to $5,175,000 (2019 comparative period: $8,038,000) and comprised interest paid of $2,507,000 (2019 comparative period: $3,275,000), borrowing costs associated with establishing the syndicated facility and integrating the Atlantic Gold facility of $2,503,000 (2019 comparative period: $3,430,000)). Net foreign currency loss
A net foreign exchange gain of $8,260,000 was recognised for the period (2019 comparative period: loss of $623,000), which related mainly to foreign exchange movements on US dollar and Canadian dollar cash balances and US dollar denominated intercompany loans.
Income tax
An income tax expense of $15,635,000 was recognised for the period (2019 comparative period: $16,228,000), which comprised an income tax expense of $1,521,000 in relation to Australia, $13,603,000 for the PNG operations and $511,000 associated with the Canadian operations. The lower income tax expense was mainly due to the reduced profitability in Australia.
ST BARBARA LIMITED Directors’ Report 2021 Interim Financial Report
Page 9
Discussion and analysis of the condensed consolidated statement of cash flow
Operating activities
Cash flows from operating activities for the period were higher at $93,538,000 (2019 comparative period: $64,860,000). The higher cash flows from operating activities in the period was driven by significantly lower income tax payments and reduced payments to suppliers, partially offset by lower gold revenue.
Receipts from customers in the period were $350,135,000 (2019 comparative period: $352,036,000), reflecting the impact of lower gold sales but substantially offset by a higher average realised gold price.
Payments to suppliers and employees were $220,156,000 (2019 comparative period: $234,674,000), with the lower expenditure due to lower production at Leonora and Simberi.
Payments for exploration expensed in the period amounted to $15,310,000 (2019 comparative period: $14,354,000), which related to exploration activities mainly in Australia and Canada.
Net interest paid was $2,108,000 (2019 comparative period: $2,057,000) and borrowing costs of $2,503,000 (2019 comparative period: $3,430,000), related to the syndicated facility.
Income tax payments totalled $16,520,000 (2019 comparative period: $32,661,000). Income tax payments in the period included PAYG instalments for the period of $7,784,000 and an amount of $8,736,000 relating to the prior financial year provision for tax payable.
Investing activities
Net cash flows used in investing activities in the period amounted to $137,399,000 (2019 comparative period: $835,241,000). Investing activities in the period included the acquisition of MRRI for $60,383,000. Expenditure for development of mine properties amounted to $49,267,000 in the period (2019 comparative period: $50,682,000). In the prior corresponding period investing activities included the acquisition of Atlantic Gold for $779,857,000.
The higher expenditure on the purchase of plant and equipment of $19,466,000 (2019 comparative period: $9,802,000), was mainly attributable to Atlantic Gold sustaining capital.
Exploration expenditure capitalised during the period totalled $5,106,000 (2019 comparative period: $12,368,000), which related to Atlantic Gold resource development drilling and Simberi Sulphide drilling.
Investing expenditure during the period was in the following major areas:
• Underground mine development and infrastructure at Gwalia:$33,073,000 (2019 comparative period: $26,213,000).
• Gwalia Extension Project: $676,000 (2019 comparative period:$23,553,000).
• Gwalia ventilation and cooling extension: $10,078,000 (2019comparative period: $497,000).
• Purchase of property, plant and equipment at Gwalia:$3,898,000 (2019 comparative period: $1,943,000); Simberi:$4,286,000 (2019 comparative period: $2,932,000); and AtlanticGold: $10,526,000 (2019 comparative period: $4,927,000).
• Simberi growth: $1,932,000 (2019 comparative period:$2,527,000).
• Atlantic Gold growth: $3,508,000 (2019 comparative period:$8,275,000).
During the period the Company invested a further $3,235,000 in Catalyst Metals Limited equity (2019 comparative period: new investments $Nil).
Financing activities
Net cash flows related to financing activities in the period were a net outflow of $238,197,000 (2019 comparative period: net outflow of $26,390,000).
The main movements in financing cash flows in the period included:
• Dividend of 4 cents per share totalling $22,354,000 in cash payments (2019 comparative period: $19,023,000) representingthe final dividend in respect of the prior financial year.
• Lease payments totalling $6,665,000 (2019 comparative period:$17,307,000), comprising mainly payments for right-of-useassets.
• Repayment of $200,000,000 (2019 comparative period: drawdown of $7,540,000) related to the Australian tranche of the syndicated facility.
• Payment to Linden Gold Alliance of $9,178,000 (2019comparative period: $Nil), representing the first draw downunder a loan facility established in the period associated with atoll treatment agreement at Gwalia.
ST BARBARA LIMITED Directors’ Report 2021 Interim Financial Report
Page 10
Discussion and analysis of the condensed consolidated statement of balance sheet
Net assets and total equity
The Group’s net assets and total equity decreased during the period by $4,700,000 to $1,344,277,000 mainly due to movements in the foreign currency translation reserve.
Total current assets decreased by $269,495,000 during the period to $242,710,000 as at 31 December 2020 (30 June 2020: $512,205,000) due mainly to the reduction in cash related to the acquisition of MRRI and repayment of the syndicated facility.
Total non-current assets increased during the period to $1,698,832,000 at 31 December 2020 (30 June 2020: $1,662,808,000) mainly as a result of the acquisition of MRRI.
Current liabilities decreased to $108,127,000 (30 June 2020: $115,744,000) as a result of the reduction in trade payables and tax liability.
Derivative financial liabilities totalling $33,594,000 (30 June 2020: $37,448,000) represents the fair value of gold call options as at 31 December 2020.
A current provision for tax payable of $7,874,000 was recognised at 31 December 2020 (30 June 2020: $10,893,000), representing tax payable in PNG and Canada.
Non-current liabilities decreased to $489,138,000 (30 June 2020: $710,292,000), due to the repayment of the Australian tranche of the syndicated facility. Non-current interest bearing borrowings include the Canadian tranche of the facility with a balance of $101,372,000. Deferred tax liability of $306,569,000 (30 June 2020: $303,584,000) includes an amount associated with mineral rights acquired at Atlantic Gold and MRRI.
Debt management and liquidity
The available cash balance at 31 December 2020 was $118,694,000 (30 June 2020: $405,541,000).
Total interest bearing liabilities decreased to $123,878,000 as at 31 December 2020 (30 June 2020: $331,766,000), comprising $22,506,000 in lease liabilities arising from AASB 16 Leases and the syndicated facility balance of $101,372,000. The Australian tranche of the syndicated facility amounting to $200,000,000 remained undrawn as at 31 December 2020.
The AUD/USD exchange rate as at 31 December 2020 was 0.7696 (30 June 2020: 0.6904).
The AUD/CAD exchange rate as at 31 December 2020 was 0.9797 (30 June 2020: 0.9351).
Auditor’s independence
A copy of the Auditor’s Independence Declaration required under section 307C of the Corporations Act 2001 is set out on page 11 and forms part of this Directors’ Report.
Events occurring after the end of the financial period
Except as noted below, the Directors are not aware of any matter or circumstance that has arisen since the end of the reporting period that, in their opinion, has significantly affected or may significantly affect in future periods the Company’s operations, the results of those operations or the state of affairs:
• Subsequent to the period end, the Directors have declared aninterim fully franked dividend of 4 cents per ordinary share to bepaid on 24 March 2021. A provision for this dividend has notbeen recognised in the 31 December 2020 financial statements.
Rounding of amounts
St Barbara Limited is a Company of the kind referred to in ASIC Corporations (Rounding in the Financial/Directors’ Report) Instrument 2016/191 issued by the Australian Securities and Investment Commission (ASIC). As a result, amounts in this Directors’ Report and the accompanying Financial Report have been rounded to the nearest thousand dollars, except where otherwise indicated.
This report is made in accordance with a resolution of Directors.
For and on behalf of the Board
Dated at Melbourne this 17th day of February 2021.
Craig Jetson Managing Director and CEO

PricewaterhouseCoopers, ABN 52 780 433 757 2 Riverside Quay, SOUTHBANK VIC 3006, GPO Box 1331, MELBOURNE VIC 3001 T: 61 3 8603 1000, F: 61 3 8603 1999, www.pwc.com.au
Liability limited by a scheme approved under Professional Standards Legislation.
Auditor’s Independence Declaration As lead auditor for the review of St Barbara Limited for the half-year ended 31 December 2020, I declare that to the best of my knowledge and belief, there have been:
(a) no contraventions of the auditor independence requirements of the Corporations Act 2001 in relation tothe review; and
(b) no contraventions of any applicable code of professional conduct in relation to the review.
This declaration is in respect of St Barbara Limited and the entities it controlled during the period.
John O'Donoghue Melbourne Partner PricewaterhouseCoopers
17 February 2021
Page 11
ST BARBARA LIMITED 2021 Interim Financial Report
Page 12
Interim Financial Report
Contents
Financial Statements Page
About this report 12 Condensed consolidated statement of profit or loss and other comprehensive income
13
Condensed consolidated balance sheet 14 Condensed consolidated statement of changes in equity
15
Condensed consolidated statement of cash flows 16
Notes to the financial statements A. Key results1 Segment information 17 2 Tax 18 3 Significant items 19 4 Dividends 19 5 Interest bearing borrowings and finance costs 20
B. Other disclosures 6 Contributed equity 21 7 Financial assets and fair value of financial assets 21 8 Events occurring after the balance sheet date 21 9 Contingencies 21 10 Business combinations 22 11 Basis of preparation 23
Signed reports Directors’ declaration 23 Independent auditor’s report 24
ASX information Corporate directory 26
About this report
St Barbara Limited (the “Company”) is a company limited by shares incorporated in Australia whose shares are publicly traded on the Australian Stock Exchange. The consolidated financial statements of the Company as at and for the six months ended 31 December 2020 comprise the Company and its subsidiaries (together referred to as the “Group”). The Group is a for-profit entity primarily involved in mining and sale of gold, mineral exploration and development.
This general purpose financial report for the half year reporting period ended 31 December 2020 has been prepared in accordance with Accounting Standard AASB 134 Interim Financial Reporting and the Corporations Act 2001.
This consolidated half year financial report does not include all the notes of the type normally included in the annual financial report. Accordingly, this report is to be read in conjunction with the audited annual financial report for the year ended 30 June 2020.
The consolidated financial report has been presented in Australian dollars and all values are rounded to the nearest thousand dollars ($000) as specified in the ASIC Corporations Instrument 2016/191 unless otherwise stated.
The comparative amounts for Profit or Loss items are for the six months ended 31 December 2020, and for Balance Sheet items balances are as at 30 June 2020.
The Board of Directors approved the consolidated half year financial report on 17 February 2021.
The AUD:USD exchange rate as at 31 December 2020 was 0.7696 (30 June 2020: 0.6904).
ST BARBARA LIMITED 2021 Interim Financial Report
Page 13
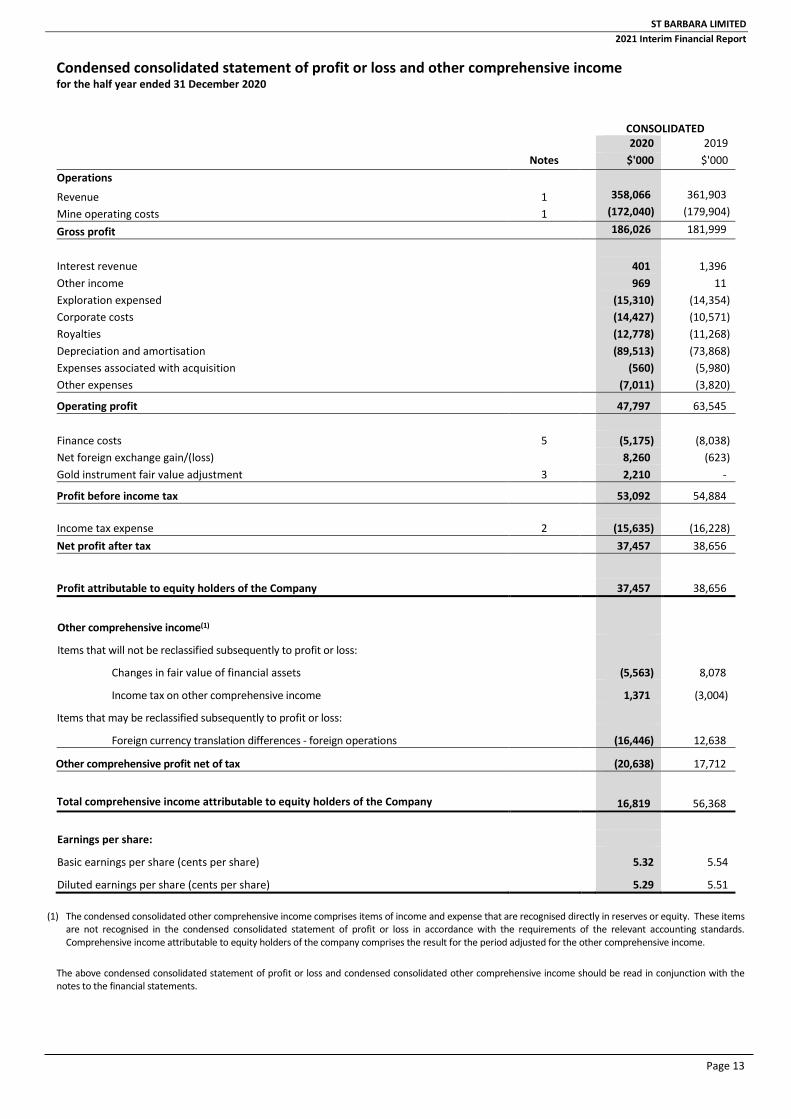
Condensed consolidated statement of profit or loss and other comprehensive income for the half year ended 31 December 2020
CONSOLIDATED 2020 2019
Notes $'000 $'000 Operations
Revenue 1 358,066 361,903
Mine operating costs 1 (172,040) (179,904)
Gross profit 186,026 181,999
Interest revenue 401 1,396 Other income 969 11 Exploration expensed (15,310) (14,354) Corporate costs (14,427) (10,571) Royalties (12,778) (11,268) Depreciation and amortisation (89,513) (73,868) Expenses associated with acquisition (560) (5,980) Other expenses (7,011) (3,820)
Operating profit 47,797 63,545
Finance costs 5 (5,175) (8,038) Net foreign exchange gain/(loss) 8,260 (623) Gold instrument fair value adjustment 3 2,210 -
Profit before income tax 53,092 54,884
Income tax expense 2 (15,635) (16,228) Net profit after tax 37,457 38,656
Profit attributable to equity holders of the Company 37,457 38,656
Other comprehensive income(1)
Items that will not be reclassified subsequently to profit or loss:
Changes in fair value of financial assets (5,563) 8,078
Income tax on other comprehensive income 1,371 (3,004)
Items that may be reclassified subsequently to profit or loss:
Foreign currency translation differences - foreign operations (16,446) 12,638
Other comprehensive profit net of tax (20,638) 17,712
Total comprehensive income attributable to equity holders of the Company 16,819 56,368
Earnings per share:
Basic earnings per share (cents per share) 5.32 5.54
Diluted earnings per share (cents per share) 5.29 5.51
(1) The condensed consolidated other comprehensive income comprises items of income and expense that are recognised directly in reserves or equity. These items are not recognised in the condensed consolidated statement of profit or loss in accordance with the requirements of the relevant accounting standards.Comprehensive income attributable to equity holders of the company comprises the result for the period adjusted for the other comprehensive income.
The above condensed consolidated statement of profit or loss and condensed consolidated other comprehensive income should be read in conjunction with the notes to the financial statements.
ST BARBARA LIMITED 2021 Interim Financial Report
Page 14
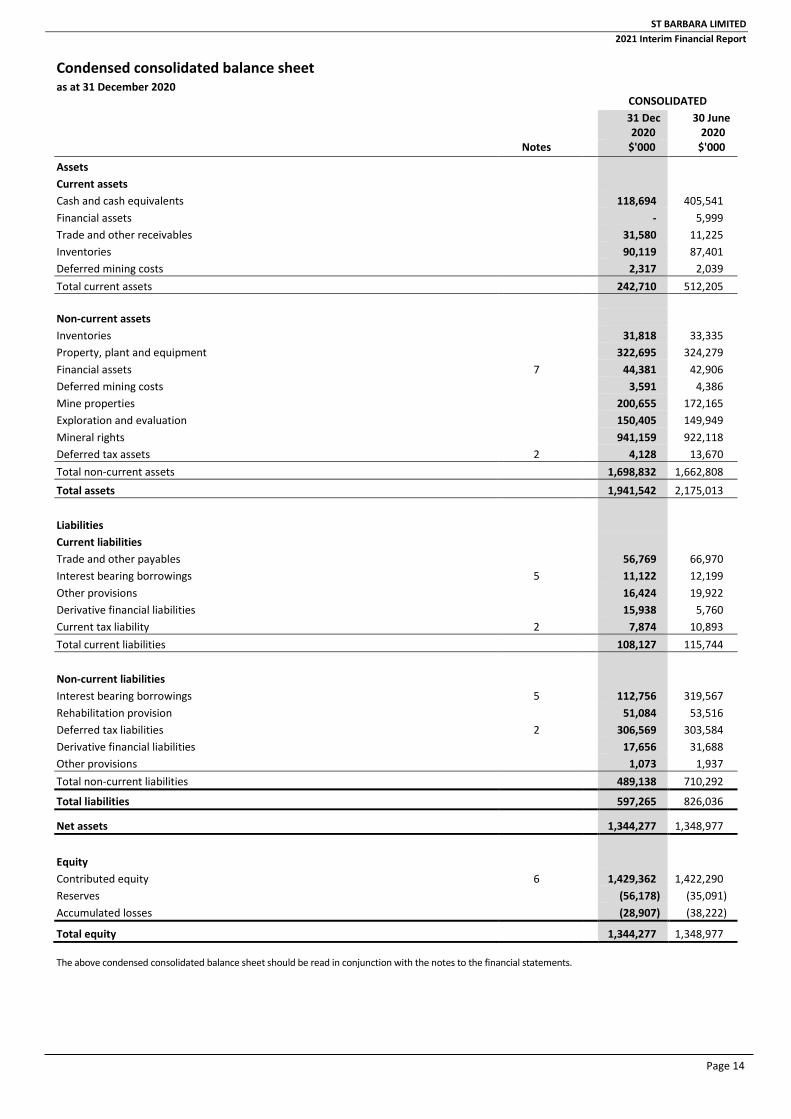
Condensed consolidated balance sheet as at 31 December 2020
CONSOLIDATED 31 Dec 2020
30 June 2020
Notes $'000 $'000
Assets Current assets Cash and cash equivalents 118,694 405,541 Financial assets - 5,999Trade and other receivables 31,580 11,225 Inventories 90,119 87,401 Deferred mining costs 2,317 2,039 Total current assets 242,710 512,205
Non-current assets Inventories 31,818 33,335 Property, plant and equipment 322,695 324,279 Financial assets 7 44,381 42,906 Deferred mining costs 3,591 4,386 Mine properties 200,655 172,165 Exploration and evaluation 150,405 149,949 Mineral rights 941,159 922,118 Deferred tax assets 2 4,128 13,670 Total non-current assets 1,698,832 1,662,808 Total assets 1,941,542 2,175,013
Liabilities Current liabilities Trade and other payables 56,769 66,970 Interest bearing borrowings 5 11,122 12,199 Other provisions 16,424 19,922 Derivative financial liabilities 15,938 5,760 Current tax liability 2 7,874 10,893 Total current liabilities 108,127 115,744
Non-current liabilities Interest bearing borrowings 5 112,756 319,567 Rehabilitation provision 51,084 53,516 Deferred tax liabilities 2 306,569 303,584 Derivative financial liabilities 17,656 31,688 Other provisions 1,073 1,937 Total non-current liabilities 489,138 710,292
Total liabilities 597,265 826,036
Net assets 1,344,277 1,348,977
Equity Contributed equity 6 1,429,362 1,422,290 Reserves (56,178) (35,091) Accumulated losses (28,907) (38,222)
Total equity 1,344,277 1,348,977
The above condensed consolidated balance sheet should be read in conjunction with the notes to the financial statements.
ST BARBARA LIMITED 2021 Interim Financial Report
Page 15
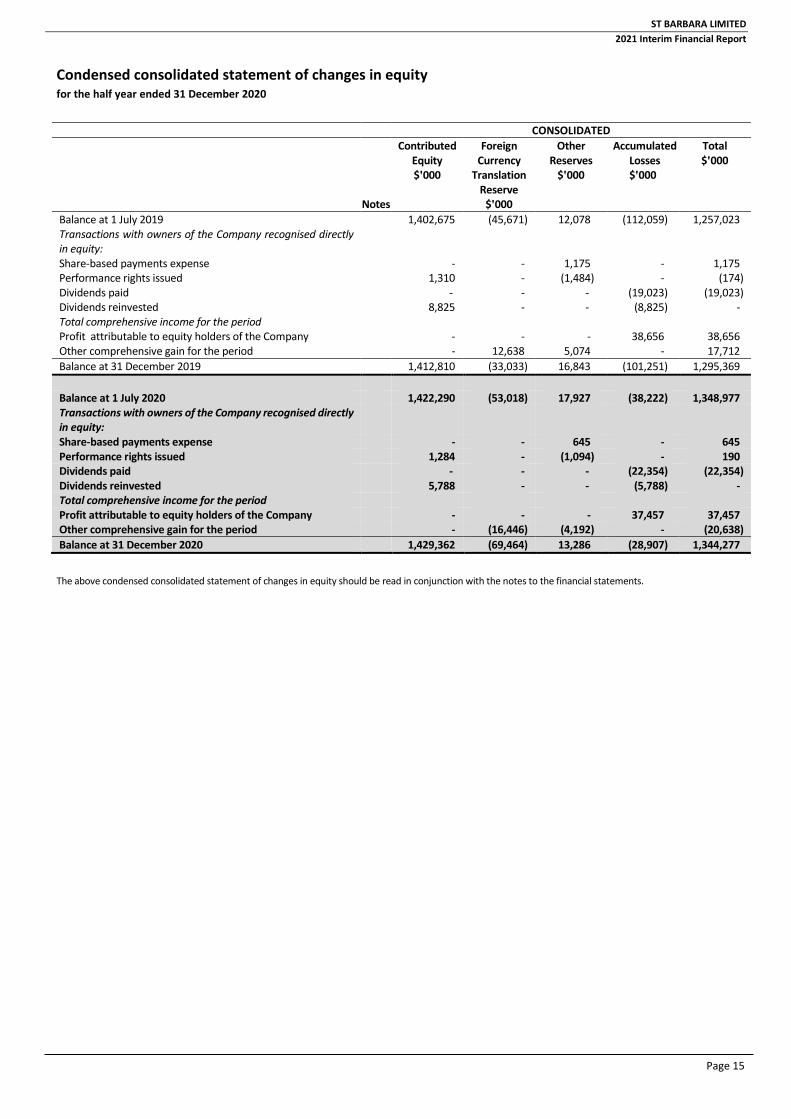
Condensed consolidated statement of changes in equity for the half year ended 31 December 2020
The above condensed consolidated statement of changes in equity should be read in conjunction with the notes to the financial statements.
CONSOLIDATED
Notes
Contributed Equity $'000
Foreign Currency
Translation Reserve
$'000
Other Reserves
$'000
Accumulated Losses $'000
Total $'000
Balance at 1 July 2019 1,402,675 (45,671) 12,078 (112,059) 1,257,023 Transactions with owners of the Company recognised directly in equity: Share-based payments expense - - 1,175 - 1,175Performance rights issued 1,310 - (1,484) - (174) Dividends paid - - - (19,023) (19,023)Dividends reinvested 8,825 - - (8,825) - Total comprehensive income for the period Profit attributable to equity holders of the Company - - - 38,656 38,656 Other comprehensive gain for the period - 12,638 5,074 - 17,712Balance at 31 December 2019 1,412,810 (33,033) 16,843 (101,251) 1,295,369
Balance at 1 July 2020 1,422,290 (53,018) 17,927 (38,222) 1,348,977 Transactions with owners of the Company recognised directly in equity: Share-based payments expense - - 645 - 645Performance rights issued 1,284 - (1,094) - 190Dividends paid - - - (22,354) (22,354) Dividends reinvested 5,788 - - (5,788) - Total comprehensive income for the period Profit attributable to equity holders of the Company - - - 37,457 37,457 Other comprehensive gain for the period - (16,446) (4,192) - (20,638) Balance at 31 December 2020 1,429,362 (69,464) 13,286 (28,907) 1,344,277
ST BARBARA LIMITED Notes to the Interim Financial Report 2021 Interim Financial Report
Page 16
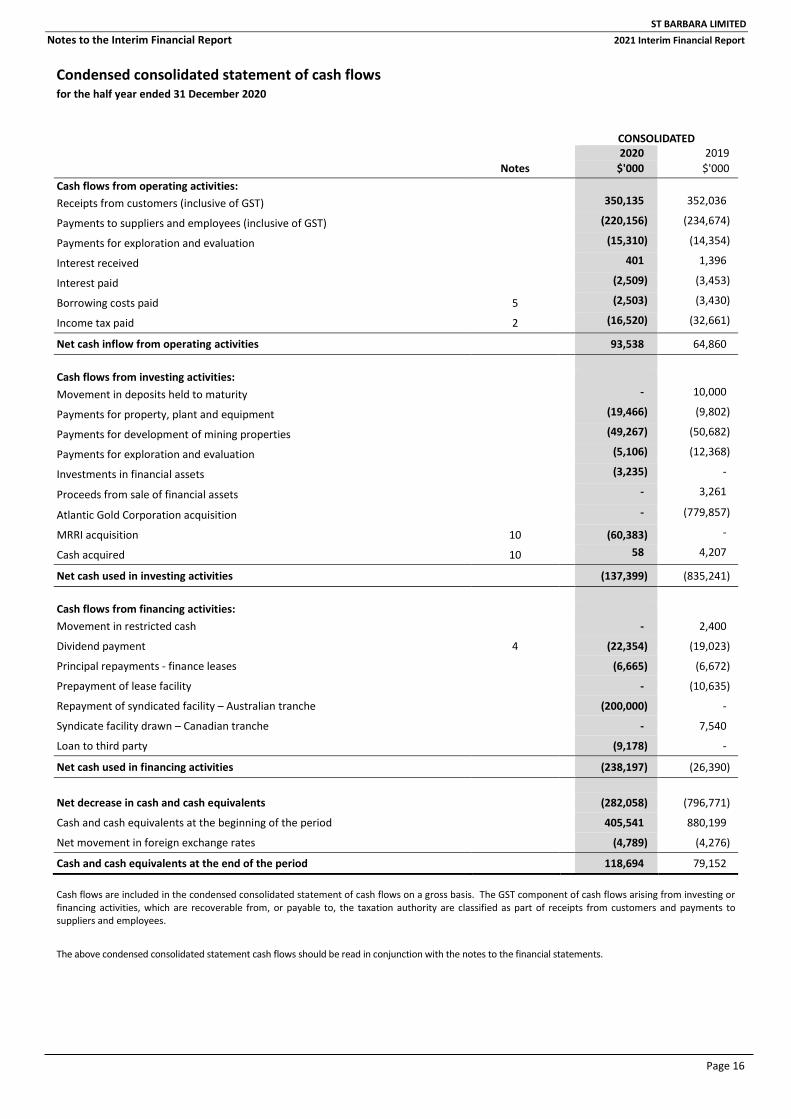
Condensed consolidated statement of cash flows for the half year ended 31 December 2020
CONSOLIDATED 2020 2019
Notes $'000 $'000 Cash flows from operating activities: Receipts from customers (inclusive of GST) 350,135 352,036
Payments to suppliers and employees (inclusive of GST) (220,156) (234,674)
Payments for exploration and evaluation (15,310) (14,354)
Interest received 401 1,396
Interest paid (2,509) (3,453)
Borrowing costs paid 5 (2,503) (3,430)
Income tax paid 2 (16,520) (32,661)
Net cash inflow from operating activities 93,538 64,860
Cash flows from investing activities: Movement in deposits held to maturity - 10,000
Payments for property, plant and equipment (19,466) (9,802)
Payments for development of mining properties (49,267) (50,682)
Payments for exploration and evaluation (5,106) (12,368)
Investments in financial assets (3,235) -
Proceeds from sale of financial assets - 3,261
Atlantic Gold Corporation acquisition - (779,857)
MRRI acquisition 10 (60,383) -
Cash acquired 10 58 4,207
Net cash used in investing activities (137,399) (835,241)
Cash flows from financing activities: Movement in restricted cash - 2,400
Dividend payment 4 (22,354) (19,023)
Principal repayments - finance leases (6,665) (6,672)
Prepayment of lease facility - (10,635)
Repayment of syndicated facility – Australian tranche (200,000) -
Syndicate facility drawn – Canadian tranche - 7,540
Loan to third party (9,178) -
Net cash used in financing activities (238,197) (26,390)
Net decrease in cash and cash equivalents (282,058) (796,771)
Cash and cash equivalents at the beginning of the period 405,541 880,199
Net movement in foreign exchange rates (4,789) (4,276)
Cash and cash equivalents at the end of the period 118,694 79,152
Cash flows are included in the condensed consolidated statement of cash flows on a gross basis. The GST component of cash flows arising from investing or financing activities, which are recoverable from, or payable to, the taxation authority are classified as part of receipts from customers and payments to suppliers and employees.
The above condensed consolidated statement cash flows should be read in conjunction with the notes to the financial statements.
ST BARBARA LIMITED Notes to the Interim Financial Report 2021 Interim Financial Report
Page 17
A. Key results
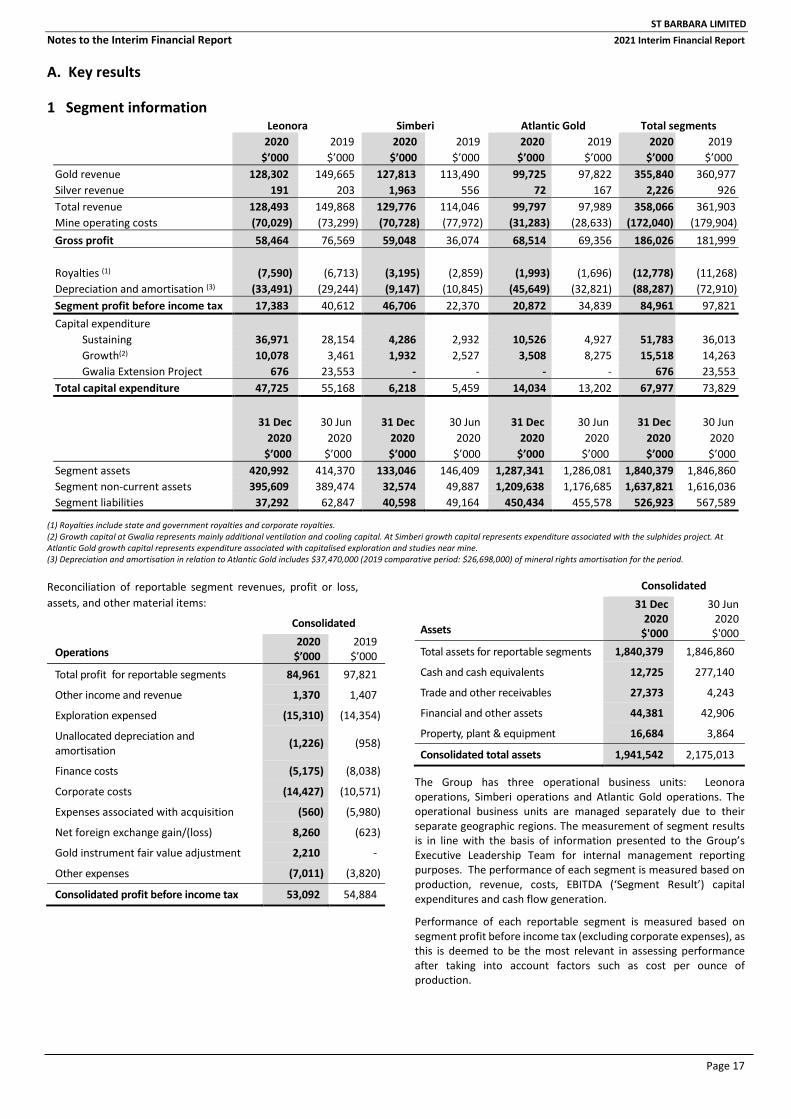
1 Segment information Leonora Simberi Atlantic Gold Total segments
2020 $’000
2019 $’000
2020 $’000
2019 $’000
2020 $’000
2019 $’000
2020 $’000
2019 $’000
Gold revenue 128,302 149,665 127,813 113,490 99,725 97,822 355,840 360,977 Silver revenue 191 203 1,963 556 72 167 2,226 926 Total revenue 128,493 149,868 129,776 114,046 99,797 97,989 358,066 361,903 Mine operating costs (70,029) (73,299) (70,728) (77,972) (31,283) (28,633) (172,040) (179,904) Gross profit 58,464 76,569 59,048 36,074 68,514 69,356 186,026 181,999
Royalties (1) (7,590) (6,713) (3,195) (2,859) (1,993) (1,696) (12,778) (11,268) Depreciation and amortisation (3) (33,491) (29,244) (9,147) (10,845) (45,649) (32,821) (88,287) (72,910) Segment profit before income tax 17,383 40,612 46,706 22,370 20,872 34,839 84,961 97,821 Capital expenditure Sustaining 36,971 28,154 4,286 2,932 10,526 4,927 51,783 36,013 Growth(2) 10,078 3,461 1,932 2,527 3,508 8,275 15,518 14,263 Gwalia Extension Project 676 23,553 - - - - 676 23,553 Total capital expenditure 47,725 55,168 6,218 5,459 14,034 13,202 67,977 73,829
31 Dec 2020
$’000
30 Jun 2020
$’000
31 Dec 2020 $’000
30 Jun 2020
$’000
31 Dec 2020
$’000
30 Jun 2020
$’000
31 Dec 2020 $’000
30 Jun 2020 $’000
Segment assets 420,992 414,370 133,046 146,409 1,287,341 1,286,081 1,840,379 1,846,860 Segment non-current assets 395,609 389,474 32,574 49,887 1,209,638 1,176,685 1,637,821 1,616,036 Segment liabilities 37,292 62,847 40,598 49,164 450,434 455,578 526,923 567,589
(1) Royalties include state and government royalties and corporate royalties.(2) Growth capital at Gwalia represents mainly additional ventilation and cooling capital. At Simberi growth capital represents expenditure associated with the sulphides project. At Atlantic Gold growth capital represents expenditure associated with capitalised exploration and studies near mine. (3) Depreciation and amortisation in relation to Atlantic Gold includes $37,470,000 (2019 comparative period: $26,698,000) of mineral rights amortisation for the period.
Reconciliation of reportable segment revenues, profit or loss, assets, and other material items:
Consolidated
Operations 2020
$’000 2019
$’000 Total profit for reportable segments 84,961 97,821
Other income and revenue 1,370 1,407
Exploration expensed (15,310) (14,354)
Unallocated depreciation and amortisation (1,226) (958)
Finance costs (5,175) (8,038)
Corporate costs (14,427) (10,571)
Expenses associated with acquisition (560) (5,980)
Net foreign exchange gain/(loss) 8,260 (623)
Gold instrument fair value adjustment 2,210 -
Other expenses (7,011) (3,820)
Consolidated profit before income tax 53,092 54,884
Consolidated
Assets
31 Dec 2020
$'000
30 Jun 2020
$'000 Total assets for reportable segments 1,840,379 1,846,860
Cash and cash equivalents 12,725 277,140
Trade and other receivables 27,373 4,243
Financial and other assets 44,381 42,906
Property, plant & equipment 16,684 3,864
Consolidated total assets 1,941,542 2,175,013
The Group has three operational business units: Leonora operations, Simberi operations and Atlantic Gold operations. The operational business units are managed separately due to their separate geographic regions. The measurement of segment results is in line with the basis of information presented to the Group’s Executive Leadership Team for internal management reporting purposes. The performance of each segment is measured based on production, revenue, costs, EBITDA (‘Segment Result’) capital expenditures and cash flow generation.
Performance of each reportable segment is measured based on segment profit before income tax (excluding corporate expenses), as this is deemed to be the most relevant in assessing performance after taking into account factors such as cost per ounce of production.
ST BARBARA LIMITED Notes to the Interim Financial Report 2021 Interim Financial Report
Page 18
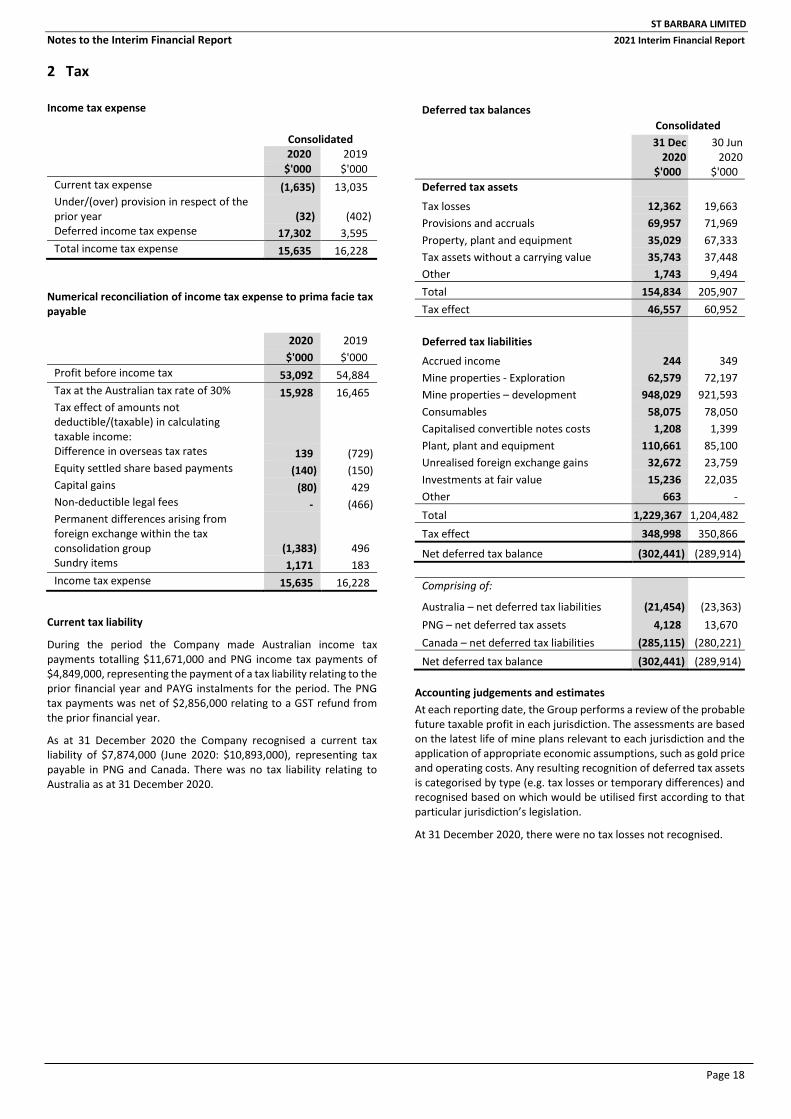
2 Tax
Income tax expense
Consolidated 2020 2019
$'000 $'000 Current tax expense (1,635) 13,035 Under/(over) provision in respect of the prior year (32) (402)Deferred income tax expense 17,302 3,595Total income tax expense 15,635 16,228
Numerical reconciliation of income tax expense to prima facie tax payable
2020 2019 $'000 $'000
Profit before income tax 53,092 54,884 Tax at the Australian tax rate of 30% 15,928 16,465 Tax effect of amounts not deductible/(taxable) in calculating taxable income: Difference in overseas tax rates 139 (729) Equity settled share based payments (140) (150)Capital gains (80) 429Non-deductible legal fees - (466)Permanent differences arising from foreign exchange within the tax consolidation group (1,383) 496 Sundry items 1,171 183 Income tax expense 15,635 16,228
Current tax liability
During the period the Company made Australian income tax payments totalling $11,671,000 and PNG income tax payments of $4,849,000, representing the payment of a tax liability relating to the prior financial year and PAYG instalments for the period. The PNG tax payments was net of $2,856,000 relating to a GST refund from the prior financial year.
As at 31 December 2020 the Company recognised a current tax liability of $7,874,000 (June 2020: $10,893,000), representing tax payable in PNG and Canada. There was no tax liability relating to Australia as at 31 December 2020.
Deferred tax balances Consolidated 31 Dec
2020 30 Jun
2020 $'000 $'000
Deferred tax assets
Tax losses 12,362 19,663 Provisions and accruals 69,957 71,969 Property, plant and equipment 35,029 67,333 Tax assets without a carrying value 35,743 37,448 Other 1,743 9,494 Total 154,834 205,907 Tax effect 46,557 60,952
Deferred tax liabilities
Accrued income 244 349 Mine properties - Exploration 62,579 72,197 Mine properties – development 948,029 921,593 Consumables 58,075 78,050 Capitalised convertible notes costs 1,208 1,399 Plant, plant and equipment 110,661 85,100 Unrealised foreign exchange gains 32,672 23,759 Investments at fair value 15,236 22,035 Other 663 - Total 1,229,367 1,204,482 Tax effect 348,998 350,866
Net deferred tax balance (302,441) (289,914)
Comprising of:
Australia – net deferred tax liabilities (21,454) (23,363) PNG – net deferred tax assets 4,128 13,670 Canada – net deferred tax liabilities (285,115) (280,221) Net deferred tax balance (302,441) (289,914)
Accounting judgements and estimates At each reporting date, the Group performs a review of the probable future taxable profit in each jurisdiction. The assessments are based on the latest life of mine plans relevant to each jurisdiction and the application of appropriate economic assumptions, such as gold price and operating costs. Any resulting recognition of deferred tax assets is categorised by type (e.g. tax losses or temporary differences) and recognised based on which would be utilised first according to that particular jurisdiction’s legislation.
At 31 December 2020, there were no tax losses not recognised.

ST BARBARA LIMITED Notes to the Interim Financial Report 2021 Interim Financial Report
Page 19
3 Significant items
Significant items are those items where their nature or amount is considered material to the financial report. Such items included within the consolidated results for the period are detailed below.
Consolidated 2020 2019 $'000 $'000
Building brilliance transformation(1) (5,784) - Atlantic Gold acquisition costs - (5,980) Amortisation of derivative financial liability - 11,822 Call option fair value movements(2) 2,210 -
Total significant items – pre tax (3,574) 5,842
Tax Effect Tax effect of above significant items 1,094 (1,871)
Total significant items – post tax (2,480) 3,971
4 Dividends
Consolidated 2020 2019 $'000 $'000
Ordinary shares: Final dividend for the year ended 30 June 2020 of 4 cents per share fully franked – paid (Jun 2019: 4 cents per share)
28,142 27,848
Total dividends provided for or paid 28,142 27,848
Dividends paid in cash or satisfied by the issue of shares under the dividend reinvestment plan during the period were as follows: Paid in cash 22,354 19,023 DRP – satisfied by issue of shares 5,788 8,825 Total dividends provided for or paid 28,142 27,848
Interim dividend for the 31 December 2020 period of 4 cents per share fully franked (Dec 2019: 4 cents per share) 28,214 27,966
(1) Building brilliance transformation
Building Brilliance transformation program was established during the period to create sustainable value through improving operational performance and reduce costs. The costs incurred to manage the Building Brilliance program of works are included within other expenses.
(2) Call option fair value movements
The gold call options were entered into as part of the Atlantic Gold hedge restructure and do not qualify for hedge accounting. This is on the basis that the sold call options do not protect against downside risk. Therefore, movements in the fair value of the call options are recognised in profit and loss. Gold instrument fair value adjustments in the period was a gain of $2,210,000.
Dividend Reinvestment Plan
The Company’s Dividend Reinvestment Plan (DRP) continues to be available to eligible shareholders, whereby holders of ordinary shares may elect to have all or parts of their dividend entitlements satisfied by the issue of new ordinary shares instead of receiving cash.
DRP shares in relation to the 2020 final dividend were issued at a 1.0% discount to the 5 day volume weighted average price.
Interim Dividend
Subsequent to the 31 December 2020 half year reporting date, the Directors recommended the payment of an interim dividend of 4 cents per fully paid ordinary share fully franked. The aggregate amount of the proposed dividend is expected to be paid on 24 March 2021 out of retained earnings at 31 December 2020, and has not been recognised as a liability at the end of the period.

ST BARBARA LIMITED Notes to the Interim Financial Report 2021 Interim Financial Report
Page 20
5 Interest bearing liabilities and finance costs
Interest bearing liabilities Consolidated
31 Dec 2020
30 Jun 2020
$'000 $'000 Current Secured Lease liabilities – right of use assets 11,122 12,199
Non-current Secured Lease liabilities – right of use assets 11,384 15,378 Syndicated facility – Canadian tranche 101,372 304,189 Total non-current 112,756 319,567 Total interest bearing liabilities 123,878 331,766
Profit before income tax includes the following specific expenses:
Consolidated 2020 2019 $'000 $'000
Finance Costs Interest paid/payable 2,045 2,425 Borrowing costs 2,503 3,430 Finance lease interest 462 850 Provisions: unwinding of discount 165 1,333
5,175 8,038
Borrowings
Borrowings are initially recognised at fair value, net of transaction costs incurred. Borrowings are subsequently measured at amortised cost. Any difference between the proceeds (net of transaction costs) and the redemption amount is recognised in the consolidated statement of profit or loss over the period of the borrowings using the effective interest method. Fees paid on the establishment of loan facilities, which are not incremental costs relating to the actual draw down of the facility, are recognised as prepayments and amortised on a straight line basis over the term of the facility.
Syndicated facility
In July 2019, the Group executed a three year $200,000,000 syndicated revolving corporate debt facility. The acquisition of Atlantic Gold included a syndicated facility with a balance of CAD$100,000,000. The facility was restructured in December 2019 to combine the A$200,000,000 facility with the C$100,000,000 debt facility. As at the 31 December 2020 reporting date the Australian tranche is undrawn, with the Canadian tranche fully drawn. The syndicated facility is secured by the Group’s Australian and Canadian assets and has a maturity date of 23 July 2022.
ST BARBARA LIMITED Notes to the Interim Financial Report 2021 Interim Financial Report
Page 21
B. Other disclosures
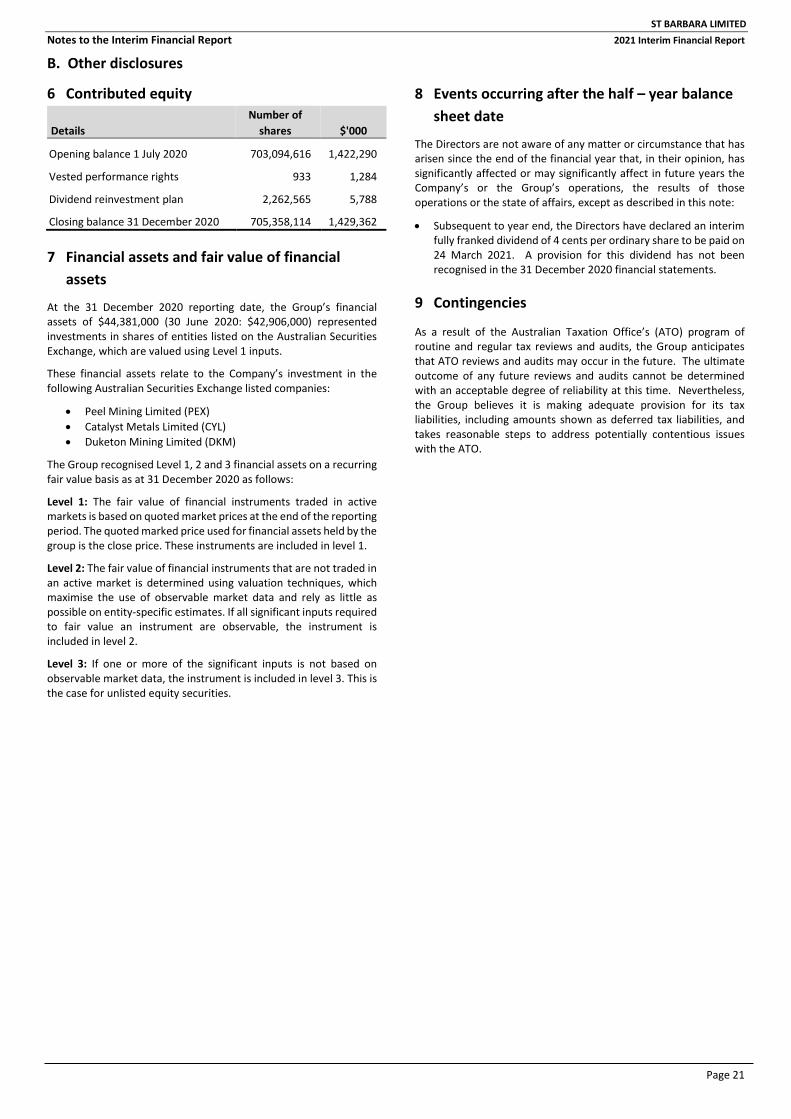
6 Contributed equity
Details Number of
shares $'000
Opening balance 1 July 2020 703,094,616 1,422,290
Vested performance rights 933 1,284
Dividend reinvestment plan 2,262,565 5,788
Closing balance 31 December 2020 705,358,114 1,429,362
7 Financial assets and fair value of financial assets
At the 31 December 2020 reporting date, the Group’s financial assets of $44,381,000 (30 June 2020: $42,906,000) represented investments in shares of entities listed on the Australian Securities Exchange, which are valued using Level 1 inputs.
These financial assets relate to the Company’s investment in the following Australian Securities Exchange listed companies:
• Peel Mining Limited (PEX)• Catalyst Metals Limited (CYL)• Duketon Mining Limited (DKM)
The Group recognised Level 1, 2 and 3 financial assets on a recurring fair value basis as at 31 December 2020 as follows:
Level 1: The fair value of financial instruments traded in active markets is based on quoted market prices at the end of the reporting period. The quoted marked price used for financial assets held by the group is the close price. These instruments are included in level 1.
Level 2: The fair value of financial instruments that are not traded in an active market is determined using valuation techniques, which maximise the use of observable market data and rely as little as possible on entity-specific estimates. If all significant inputs required to fair value an instrument are observable, the instrument is included in level 2.
Level 3: If one or more of the significant inputs is not based on observable market data, the instrument is included in level 3. This is the case for unlisted equity securities.
8 Events occurring after the half – year balance sheet date
The Directors are not aware of any matter or circumstance that has arisen since the end of the financial year that, in their opinion, has significantly affected or may significantly affect in future years the Company’s or the Group’s operations, the results of those operations or the state of affairs, except as described in this note:
• Subsequent to year end, the Directors have declared an interimfully franked dividend of 4 cents per ordinary share to be paid on 24 March 2021. A provision for this dividend has not beenrecognised in the 31 December 2020 financial statements.
9 Contingencies
As a result of the Australian Taxation Office’s (ATO) program of routine and regular tax reviews and audits, the Group anticipates that ATO reviews and audits may occur in the future. The ultimate outcome of any future reviews and audits cannot be determined with an acceptable degree of reliability at this time. Nevertheless, the Group believes it is making adequate provision for its tax liabilities, including amounts shown as deferred tax liabilities, and takes reasonable steps to address potentially contentious issues with the ATO.
ST BARBARA LIMITED Notes to the Interim Financial Report 2021 Interim Financial Report
Page 22
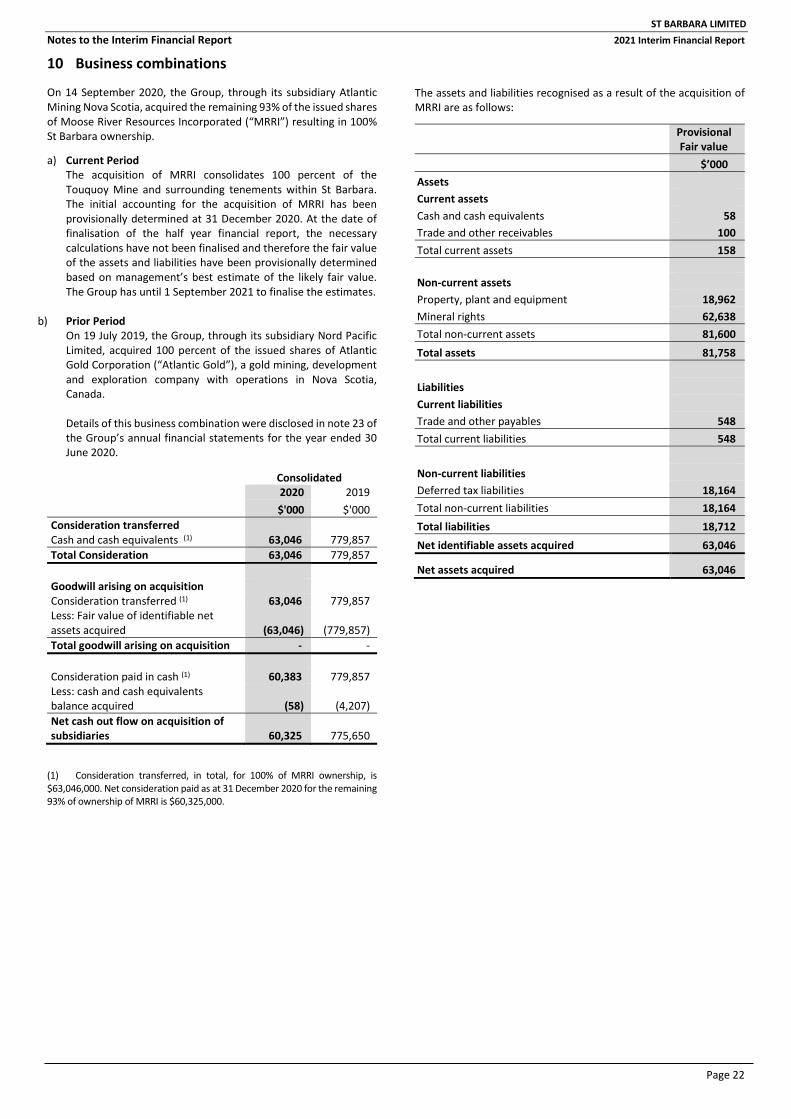
10 Business combinations
On 14 September 2020, the Group, through its subsidiary Atlantic Mining Nova Scotia, acquired the remaining 93% of the issued shares of Moose River Resources Incorporated (“MRRI”) resulting in 100% St Barbara ownership.
a) Current PeriodThe acquisition of MRRI consolidates 100 percent of theTouquoy Mine and surrounding tenements within St Barbara.The initial accounting for the acquisition of MRRI has beenprovisionally determined at 31 December 2020. At the date offinalisation of the half year financial report, the necessarycalculations have not been finalised and therefore the fair valueof the assets and liabilities have been provisionally determinedbased on management’s best estimate of the likely fair value.The Group has until 1 September 2021 to finalise the estimates.
b) Prior PeriodOn 19 July 2019, the Group, through its subsidiary Nord PacificLimited, acquired 100 percent of the issued shares of AtlanticGold Corporation (“Atlantic Gold”), a gold mining, developmentand exploration company with operations in Nova Scotia,Canada.
Details of this business combination were disclosed in note 23 ofthe Group’s annual financial statements for the year ended 30June 2020.
Consolidated 2020 2019 $'000 $'000
Consideration transferred Cash and cash equivalents (1) 63,046 779,857 Total Consideration 63,046 779,857
Goodwill arising on acquisition Consideration transferred (1) 63,046 779,857 Less: Fair value of identifiable net assets acquired (63,046) (779,857) Total goodwill arising on acquisition - -
Consideration paid in cash (1) 60,383 779,857 Less: cash and cash equivalents balance acquired (58) (4,207) Net cash out flow on acquisition of subsidiaries 60,325 775,650
(1) Consideration transferred, in total, for 100% of MRRI ownership, is$63,046,000. Net consideration paid as at 31 December 2020 for the remaining 93% of ownership of MRRI is $60,325,000.
The assets and liabilities recognised as a result of the acquisition of MRRI are as follows:
Provisional Fair value
$’000 Assets Current assets Cash and cash equivalents 58 Trade and other receivables 100 Total current assets 158
Non-current assets Property, plant and equipment 18,962 Mineral rights 62,638 Total non-current assets 81,600 Total assets 81,758
Liabilities Current liabilities Trade and other payables 548 Total current liabilities 548
Non-current liabilities Deferred tax liabilities 18,164 Total non-current liabilities 18,164 Total liabilities 18,712 Net identifiable assets acquired 63,046
Net assets acquired 63,046
ST BARBARA LIMITED Notes to the Interim Financial Report 2021 Interim Financial Report
Page 23
11 Basis of preparation
Significant accounting policies
The accounting policies applied by the Group in this consolidated half year financial report are the same as those applied by the Group in its consolidated financial report as at and for the year ended 30 June 2020. These accounting policies are consistent with Australian Accounting Standards.
The Group has adopted all of the new and revised Standards and Interpretations issued by the AASB that are relevant to its operations and effective for the current half-year report. Accounting policies are applied consistently by each entity in the Group.
Critical accounting judgement and estimates
The preparation of the half year financial report requires management to make judgements, estimates and assumptions that affect the application of accounting policies and the reported amounts of assets and liabilities, income and expenses. Actual results may differ from these estimates.
In preparing this consolidated half year financial report, the significant estimates and judgements made by management in applying the Group’s accounting policies and the key sources of estimation uncertainty were the same as those that applied to the most recent annual financial report.
Directors’ declaration
In the Directors’ opinion:
(a) the financial statements and notes set out on pages 12 to22 are in accordance with the Corporations Act 2001,including:
i) complying with Australian Accounting Standard AASB 134 Interim Financial Reporting and the Corporations Act 2001; and
ii) giving a true and fair view of the Group's financialposition as at 31 December 2020 and of itsperformance for the six month period ended on thatdate; and
(b) there are reasonable grounds to believe that the Companywill be able to pay its debts as and when they become due and payable.
This declaration is made in accordance with a resolution of the Directors.
Craig Jetson
Managing Director and CEO
Melbourne 17 February 2021
PricewaterhouseCoopers, ABN 52 780 433 757 2 Riverside Quay, SOUTHBANK VIC 3006, GPO Box 1331, MELBOURNE VIC 3001 T: 61 3 8603 1000, F: 61 3 8603 1999, www.pwc.com.au
Liability limited by a scheme approved under Professional Standards Legislation.
Independent auditor's review report to the members of St Barbara Limited
Report on the half-year financial report
Conclusion We have reviewed the half-year financial report of St Barbara Limited (the Company) and the entities it controlled during the half-year (together the Group), which comprises the condensed consolidated balance sheet as at 31 December 2020, the condensed consolidated statement of changes in equity, condensed consolidated statement of cash flows and condensed consolidated statement of profit or loss and other comprehensive income for the half-year ended on that date, significant accounting policies and explanatory notes and the directors' declaration.
Based on our review, which is not an audit, we have not become aware of any matter that makes us believe that the accompanying half-year financial report of St Barbara Limited does not comply with the Corporations Act 2001 including:
1. giving a true and fair view of the Group's financial position as at 31 December 2020 and of its performancefor the half-year ended on that date;
2. complying with Accounting Standard AASB 134 Interim Financial Reporting and the CorporationsRegulations 2001.
Basis for conclusion We conducted our review in accordance with ASRE 2410 Review of a Financial Report Performed by the Independent Auditor of the Entity (ASRE 2410). Our responsibilities are further described in the Auditor’s responsibilities for the review of the half-year financial report section of our report.
We are independent of the Group in accordance with the auditor independence requirements of the Corporations Act 2001 and the ethical requirements of the Accounting Professional & Ethical Standards Board’s APES 110 Code of Ethics for Professional Accountants (including Independence Standards) (the Code) that are relevant to our audit of the annual financial report in Australia. We have also fulfilled our other ethical responsibilities in accordance with the Code.
Responsibility of management for the half-year financial report Management is responsible for the preparation of the half-year financial report that gives a true and fair view in accordance with Australian Accounting Standards and the Corporations Act 2001 and for such internal control as management determines is necessary to enable the preparation of the half-year financial report that gives a true and fair view and is free from material misstatement whether due to fraud or error.
Page 24
Auditor's responsibility for the review of the half-year financial report Our responsibility is to express a conclusion on the half-year financial report based on our review. ASRE 2410 requires us to conclude whether we have become aware of any matter that makes us believe that the half-year financial report is not in accordance with the Corporations Act 2001 including giving a true and fair view of the Group's financial position as at 31 December 2020 and of its performance for the half-year ended on that date, and complying with Accounting Standard AASB 134 Interim Financial Reporting and the Corporations Regulations 2001.
A review of a half-year financial report consists of making enquiries, primarily of persons responsible for financial and accounting matters, and applying analytical and other review procedures. A review is substantially less in scope than an audit conducted in accordance with Australian Auditing Standards and consequently does not enable us to obtain assurance that we would become aware of all significant matters that might be identified in an audit. Accordingly, we do not express an audit opinion.
PricewaterhouseCoopers
John O'Donoghue Melbourne Partner 17 February 2021
Page 25

ST BARBARA LIMITED 2020 Interim Financial Report
Page 26
Corporate Directory
BOARD OF DIRECTORS T C Netscher Non-Executive Chairman C A Jetson Managing Director & CEO S G Dean Non-Executive Director K J Gleeson Non-Executive Director S E Loader Non-Executive Director D E J Moroney Non-Executive Director
SHARE REGISTRY Computershare Investment Services Pty Ltd GPO Box 2975 Melbourne Victoria 3001 Australia
Telephone (within Australia): 1300 653 935 Telephone (international): +61 3 9415 4356 Facsimile: +61 3 9473 2500
COMPANY SECRETARY S Standish
AUDITOR PricewaterhouseCoopers 2 Riverside Quay Southbank Victoria 3006 Australia
REGISTERED OFFICE Level 10, 432 St Kilda Road Melbourne Victoria 3004 Australia
Telephone: +61 3 8660 1900 Facsimile: +61 3 8660 1999 Email: [email protected] Website: www.stbarbara.com.au
STOCK EXCHANGE LISTING Shares in St Barbara Limited are quoted on the Australian Securities Exchange Ticker Symbol: SBM