december 2018 - cib w117 · e. witt, phd h. visser associate professor tut - tallinn university of...
TRANSCRIPT


Journal for the Advancement of Performance
Information and Value Vol.10 I.2 December 2018
© K S M , I n c | 1
Copyright © 2018 by Kashiwagi Solution Model, Inc (KSM Inc). All rights reserved. Printed in the
United States of America. No portion of this publication may be reproduced in any manner without the
written permission of the author(s) and/or publishing house (KSM Inc).
Journal for the Advancement of Performance Information and Value
ISSN 2169-0464 (Online)
ISSN 2169-0472 (CD-ROM)
ISSN 1941-191X (Print)
Copyright 2018 by KSM, Inc.
Edited and reviewed by David G. Krassa
Cover Art designed by Kyle Hartwick
Published and distributed by:
Kashiwagi Solution Model Inc.
2251 N 32nd St #5
Mesa, AZ 85213
For information, please email W117 staff at [email protected].
The views expressed in this report are based solely on the independent research performed by the
author(s). This publication does not necessarily represent the views of CIB.

Journal for the Advancement of Performance
Information and Value Vol.10 I.2 December 2018
© K S M , I n c | 2
Editorial Board Editor
Dean T. Kashiwagi, PhD, P.E., IFMA
Fellow, Fulbright Scholar
Co-Chair, W117 Performance Measurement
in Construction
Director, Performance Based Studies
Research Group
Adjunct Professor, SKEMA Business School
United States of America
Co-Editor
S. Santema, PhD, I.R.
Co-Chair, W117 Performance Measurement
in Construction
Director, Scenter
Adjunct Professor, Architecture and the Built
Environment - Delft University of
Technology
Netherlands
Secretariat
Jacob Kashiwagi, PhD
Research Director, Performance Based
Studies Research Group
United States of America
Journal Coordinator
David G. Krassa, MS
Project Manager, Kashiwagi Solution Model
Inc
United States of America
Academic Researchers
A. Lee, PhD A. Robinson Fayek, PhD Professor
University of Huddersfield School of Art, Design
and Architecture
United Kingdom
Professor
Hole School of Construction Engineering,
Department of Civil and Environmental
Engineering
Canada
Aderemi Adeyemi, PhD Ahmad Hadavi, PhD, MBA Associate Professor
University of Botswana
Botswana
Associate Director, Clinical Professor
Northwestern University
United States of America
Ahmed A. Alofi, PhD Alfredo Rivera, PhD
Vice Dean
Yanbu, Taibah University - Engineering College
Saudi Arabia
Director
Leadership Society of Arizona
United States of America
Anthony Perrenoud, PhD Ashok Kumar Assistant Professor
University of Oklahoma
United States of America
Project Assistant
CSIR- Central Building Research Institute
India
Avi Wiezel, PhD B. Gledson, PhD, MCIOB, MAPM, SFHEA Assistant Dean for Facilities
Arizona State University
USA
Senior Lecturer, Programme Leader
Northumbria University
United Kingdom
B. Kameswara Rao, PhD Baabak Ashuri, PhD, DBIA, CCP, DRMP Professor
CBRI - Central Building Research Institute
Structural Engineering Division
India
Director of Economics of the Sustainable Built
Environment Lab
Georgia Institute of Technology
United States of America

Journal for the Advancement of Performance
Information and Value Vol.10 I.2 December 2018
© K S M , I n c | 3
Academic Researchers (cont’d)
Bon-Gang Hwang, PhD Brian Lines, PhD Assistant Professor
National University of Singapore - School of
Design and Environment
Singapore
Assistant Professor
University of Kansas
United States of America
Brian Stone Charles Egbu Assistant Professor
Western Illinois University
United States of America
Dean of the School of Built Environment and
Architecture
London South Bank University
London
Charles Zulanas, MS Chia Fah Choy Director
Leadership Society of Arizona
United States of America
Associate Professor, Head of Programme
Universiti Tunku Abdul Rahman
Malaysia
D.A. Couse David J. Greenwood, PhD Secondary Liason CIB General Secretariat
NRC - National Research Council
Canada
Professor
Northumbria University - Faculty of Engineering
and Environment
United Kingdom
Dhaval Gajjar, PhD E. Chinyio Associate Professor
Clemson University
United States
Course Leader
University of Wolverhamption
E. Witt, PhD H. Visser Associate Professor
TUT - Tallinn University of Technology -
Department of Civil Engineering and Architecture
- School of Engineering
Estonia
Senior Lecturer
University of South Africa - Graduate School of
Business Leadership (Unisa SBL)
South-Africa
I. Zavrski, PhD, MSc. Eng. Ir. W.J.P. Bakens, PhD Professor
University of Zagreb - Faculty of Civil
Engineering
Croatia
Liason CIB General Secretariat
CIB - The International Council for Research and
innovation in Building and Construction
Netherlands
Ir. Z. Hamid, PhD Ir.Dr. R. Hassan Chief Executive Officer of CREAM Certification
Services (CCS)
Construction Research Institute of Malaysia
Malaysia
Professor / Specialist Consultant
Construction Research Institute of Malaysia
Malaysia
Isaac Kashiwagi, MS Ivica Zavrski, PhD Researcher
Delft University of Technology
United States of America
Professor
University of Zagreb
Croatia
J. Gelder J. Mbachu Program Director
University of South Australia - School of Natural
& Built Environments
Australia
Associate Professor
Massey University

Journal for the Advancement of Performance
Information and Value Vol.10 I.2 December 2018
© K S M , I n c | 4
Academic Researchers (cont’d)
Jake Gunnoe, PhD Joseph Kashiwagi, MS Director
Leadership Society of Arizona
United States of America
Researcher
SKEMA Business School
United States of America
Kenneth Sullivan, PhD L. Thomas JD, PdD Associate Professor
Arizona State University
United States of America
Director of Construction Management Program at
Stevens Institute of Technology. Academic Unit
Head at James Madison University, United States
of America
Luis Otavio Cocito de Araujo, PhD Majed Alzara, PhD Associate Professor
Universidade Federal do Rio de Janeiro
Brazil
Vice Dean
Al Jouf University - Engineering College
Saudi Arabia
Malik Khalfan Mohammed Algahtany, PhD Associate Professor
RMIT University
Australia
Assistant Professor, Engineering College
Northern Border University
Saudi Arabia
N.H. Bertelsen N.M. Almeida Senior Researcher
SBi - Danish Building Research Institute
Denmark
Lecturer
IST–ID
Portugal
Nguyen Le, MS Niels Bertelsen Researcher
Arizona State University
United States of America
Senior Researcher
Danish Building Research Institute
P-C. Liao, PhD Pin-Chao Liao Associate Professor
Tsinghua University - School of Civil
Engineering - Institute of International
China-PR
Assistant Professor
Tsinghua University
United States of America
Ruveyda Komurlu, PhD Saud Almutairi, PhD Associate Professor
Kocaeli University
Turkey
Vice Dean of Uinzah Engineering
Qassim University
Saudi Arabia
Shiviah Raviraj Sunil Kumar Professor
S.J. College of Engineering
India
Assistant Professor
S.J. College of Engineering
India
T. Fei Deng T. Häkkinen, PhD PhD Student
University College London
London
Senior Principal Research Scientist
Finland
T. Maqsood, PhD Tarja Häkkinen Associate Professor
RMIT University - School of Property,
Construction & Project Management
Australia
Senior Principal Research Scientist
VTT Technical Research Centre of Finland
Finland

Journal for the Advancement of Performance
Information and Value Vol.10 I.2 December 2018
© K S M , I n c | 5
Academic Researchers (cont’d)
Tsunemi Watanabe Vincent Cotoron, MSc Professor
Kochi University of Technology
Japan
Researcher
Polytechnic University of the Philippines
Philippines
William Badger, PhD William Verdini Professor Emeritus, School of Engineering
Arizona State University
United States of America
Emeritus College Dean
Arizona State University
United States of America
Y. Sandanayake, PhD Yasir Alhammadi, PhD, FMP Head of Department
University of Moratuwa - Department of Building
Economics, Faculty of Architecture
Sri-Lanka
Head of Civil Engineering Department, Vice
Dean of Enginnering College
Prince Sattam bin Abdulaziz University
Saudi Arabia
Yutian Chen, MS Researcher
Arizona State University
United States of America

Journal for the Advancement of Performance
Information and Value Vol.10 I.2 December 2018
© K S M , I n c | 6
Industry Professionals
A. Fung Andrew Bills, MS Deputy Director of Housing
Hong Kong Housing Authority
China- Hong Kong
Project Engineer
Hensel Phelps Construction
United States of America
Arnulfo Castillo Babak Memarian, PhD Capital Program Manager
Kamehameha Schools
United States of America
Director
Exposure Control Technologies Research at
CPWR
United States of America
Erik Mars Feng Min Chen Best Value Expert
Mars Inkoopadvies
Netherlands
Researcher
Arizona State University
United States
Jeffory Meyer John Morrison Sr. Planning Architect | Design & Construction
Division
General Services Administration
United States of America
Pre-Construction Services
CMSWillowbrook
United States of America
Jolanda Lempers Jorn Verweij Best Value Expert
Best Value Verkoop
Netherlands
Director
Decision Free Solutions
Netherlands
Pascal Evertz Pawel Zejer Best Value Expert
Buyers United
Netherlands
Senior Project Manager
URS Corporation, an AECOM Company
Poland
Richard Freese Ruslan Hassan Director of Public Works
City of Rochester Minnesota
United States of America
Professor/Specialist Consultant
Construction Research Institute of Malaysia
(CREAM)
Malaysia
Steve Hagar Teena Ziegler Procurement/Facilities Administrator
Oklahoma Housing Finance Agency
United States of America
Chief Procurement Officer
Arizona Department of Environmental Quality
United States of America

Journal for the Advancement of Performance
Information and Value Vol.10 I.2 December 2018
© K S M , I n c | 7
Table of Contents
Title Author(s) Page
W117 Research Roadmap Report: Creating
Information Workers through Performance
Information
W117 Editorial Board
& Contributors 10
Risk Factors and Potential Solutions for the
Construction Industry in China
Yutian Chen,
Oswald Chong 35
The Best Value Approach in Facility
Management: A Case on Cleaning-Related
Services
Violette Krouwel 49
Current Approaches and Models of
Complexity Research Isaac Kashiwagi 61
Current BIM Practices Amongst MEP
Contractors and Suggestions for Improvement
Chara Farquharson
Jake Gunnoe
Alfredo O. Rivera
78
Construction Portfolio Performance
Management Using Key Performance
Indicators
Mohsen Shahandashti,
Baabak Ashuri
Ali Touran
Reza Masoumi
Edward Minchin
87
Case Study of a Local Government
Organization’s IT Project Implementation
Dean T. Kashiwagi,
Jacob S. Kashiwagi 104
Top Construction Delay Factors for Kenya Yue Choong KOG 120

Journal for the Advancement of Performance
Information and Value Vol.10 I.2 December 2018
© K S M , I n c | 8
Letter from the Editor July 2018
Fellow Visionaries:
Happy Holidays from Dr. Dean! This year marked the first year after retiring and
separating from Arizona State University (ASU). No one could have predicted the
movement of the CIB Working Commission 117 (W117) and our journal from
being sponsored and funded by the College of Engineering at ASU, to being
privately sponsored by Kashiwagi Solution Model Inc (KSM). The journal papers
receive continuous exposure and reads on the partnering ResearchGate platform.
W117 is making a significant move to innovate and increase the speed of change
in procurement, project management, risk management and the utilization of
performance information to create transparency. W117 is increasing the innovation
by aligning visionary stakeholders in the supply chain and utilizing them to help
change the current paradigm. The approach being used by W117 is to use the
Information Measurement Theory (IMT) as the foundation for the research. It
assumes most stakeholders in the supply chain have the following characteristics:
1. Operations are based on decision making, management, direction and control.
2. Processes are ineffective and inefficient.
3. Poor project performance.
The research agenda for the next five years includes:
1. Changing the structure of W117. Research will be recursive as the actions of all
the participants in the W117 structure will be actively participating in the
research.
2. Forming an international board of experts in the Best Value Approach (BVA).
This board will run tests, document the tests with peer reviewed papers, and
become reviewers for other BVA papers.
3. Forming PBSRG education satellite sites that are facilitated by BVA
International Board members to proliferate the BVA.
4. Implementing the BVA into, both a private and public organization in the
United States to replace management, direction and control in the delivery of
services by identifying and utilizing expertise.
5. Assisting the Kingdom of Saudi Arabia by implementing an Information Based
Continuous Improvement (IBCI) system which uses accurate and timely
performance information to optimize their classification system.
6. A research effort to change the project management model from the
management, direction and control approach to the utilization of expertise and
transparency. This effort is integrating the BVA test projects, the IBCI project,
and a research effort at the SKEMA Project Management School to define the
Project Management Model of the Future.

Journal for the Advancement of Performance
Information and Value Vol.10 I.2 December 2018
© K S M , I n c | 9
7. Use a new component of W117, Leadership Society of Arizona (LSA), to test
and implement IMT to prepare young students to operate in the age of
automation by minimizing thinking, data collection and decision making. This
education overcomes the paradox of how to understand reality without knowing
anything. These programs produce information workers (IW) who use the
language of dominant metrics to understand the present and future conditions
of reality.
I encourage journal readers to dream of innovation. This next year (2019) will
produce results which will dwarf the results previously discovered in the use of
performance information. Happy holidays to everyone!
Dr. Dean
Professor Dean T. Kashiwagi
P.E., PhD, Fulbright Scholar, IFMA Fellow
W117 Journal Editor
Dean T. Kashiwagi
Editor
Jacob S. Kashiwagi
Secretariat David G. Krassa
Publication Coordinator
Connect with us:
LinkedIn PBSRG LSA Web

Journal for the Advancement of Performance
Information and Value Vol.10 I.2 December 2018
© K S M , I n c | 10
W117 Performance Information in Construction:
2018 Research Roadmap Report
Foreword
The CIB Working Commission W117, “Performance Measurement in Construction,” is one of the more
innovative and productive research-based commissions in CIB. It focuses on the utilization of performance
metrics in the delivery of construction services. The home for W117 is the Performance Based Studies
Research Group (PBSRG) at Mesa, Arizona, where W117 and PBSRG hold their annual Best Value
Conference in conjunction with KSM Inc. From its start in 2009, W117 was led by Prof. Dean Kashiwagi
(PBSRG), and his group of innovators (Dr. Jacob Kashiwagi, Dr. Jake Gunnoe, and Dr. Alfredo Rivera) and
co-coordinator, Professor Charles Egbu, (Glasgow Caledonian University). In 2016, W117 was joined by
Co-Coordinator Prof. Sicco Santema, (University of Technology, Delft, Netherlands) the visionary who led
to the proliferation of the W117 technology in the Netherlands.
W117 aims to change construction procurement and stakeholder organizations worldwide through the use of
the information-based Best Value Approach (BVA). As such, it differs from most CIB Commissions that are
more science driven, while W117 is more concept and impact driven. It has been one of the most successful
CIB Commissions in bridging the gap between the construction industry practice and academic research. It
has been prolific in publishing and running research tests with industry partners. W117 and PBSRG have
published over 384+ papers and generated licensed technology (61 licenses from Skysong Innovations, the
licensing body of Arizona State University for intellectual property rights). It is the most licensed technology
from the most innovative university in the U.S. (as rated by U.S. News and World Report (2016-2018).
W117 is responsible for the development and continuous testing of the following technologies:
1. Best Value Approach (BVA).
2. Best Value (BV) Intellectual Property (IP) technology.
3. Performance Information Procurement System (PIPS).
4. Performance Information Risk Management System (PIRMS).
5. Information Measurement Theory (IMT) and Kashiwagi Solution Model (KSM) and related models such
as Spectrum of Observation.
6. Industry Structure model.
7. A new project management model based on IMT.
8. definitions of Risk, Expert and movement of Project Management by management, direction and control
(MDC) to Project Management by simplicity, alignment of expertise, language of metrics and
transparency.
9. A new risk management model that focuses on the risk that the expert vendor does not control.
The activities of WII7 are responsible for the following impacts of the Best Value Approach (BVA) concepts
on the delivery of construction:
1. Rijkswaterstaat, the largest user of construction services in the Netherlands, won the 2012 Dutch
Sourcing Award (DSA) for the successful completion of a $1B infrastructure project called “fast-track
projects” using BV-PIPS.
2. NEVI, the Dutch procurement professional organization, has licensed the Best Value technology from
ASU and has identified the approach as a mainstream approach to the delivery of services, educating
and certifying procurement professionals in the delivery of construction and other services.
3. Dutch visionary and author Sicco Santema, and his protégé Jeroen Van de Rijt, published a Best Value
Procurement (BVP) book, using Dutch test cases to show the BVA technology was compliant with
European Tender Law (12,000 books sold). Other books (in Dutch) were also published for the
contractor community.
W117 Performance Information in Construction: 2018 Research Roadmap Report
~ 11 ~
4. RISNET, a Dutch risk management association, licensed the Best Value Approach in order to increase
the use of the risk-based project management in the construction industry.
5. W117 BVA certification system was developed, which certifies competence of BV professional
practitioners.
6. W117 introduced the BVA into Canada, resulting in $3M research grants for the delivery of construction
services in 25 different universities and government organizations.
7. W117/PBSRG Best Value signed a sole source agreement with the National Association of State
Procurement Officials (NASPO) and their subsidiary, the Western States Contracting Association
(WSCA), to allow all states to utilize the W117/PBSRG technical expertise by “sole source.” This has
led to tests in 33 different states.
8. Introduction of BV into Malaysia in 2012, into the Project Management Master’s Program, led by Dr.
Fah Choy Chia at Universiti Tunku Abdul Rahman (UTAR).
9. Introduction of BV into India in 2014 resulting in the noted engineering school, SJCE, adopting the
curriculum into their engineering school.
10. Introduction of BVA into Norway in 2014, through the FIR, the construction engineering association.
FIR translated the Dutch book into Norwegian, going public on June 20, 2016, during a three-day event
to include the first certification of Best Value professionals in Norway. The first BVA testing occurred
in 2016 (award made in 2017), with five additional tests scheduled in 2017. The first large BVA
certification testing sponsored by W117, occurred in 2017 in Trondheim, Norway. Earlier individual
certifications occurred in 2014 and 2016.
11. Introduction of BV into Poland with a three-day conference in Krakow in March 2016, with the
publication of the translated Dutch Best Value Procurement (BVP) book into Polish. The first W117
sponsored certification training occurred in April 6, 7th 2017 with the licensed Polish BV Foundation.
The next BVA CIB sponsored training will be in October 2017.
12. Introduction activities in Switzerland, Denmark, Finland, Hungary, Germany and Saudi Arabia in 2015
and 2016.
These research efforts have led to the following future research and development opportunities:
1. Development of the language of metrics in the delivery of construction services.
2. The development of a new risk management and project management models.
3. Opportunity to test the sustainability of innovation in traditional environments.
4. Opportunities to test the innovative concepts in different countries.
5. Opportunity to identify and test the sustainability of testing new theoretical concepts in the industry
without the traditional extensive academic research literature search and investigations.
W117 has successfully utilized the CIB Platform to impact the construction industry performance worldwide
with the information based academic research. Its drive to make a difference is to be applauded and this
Research Roadmap (for consultation) is one more example of its high quality and high impact deliverables.
Dr. Wim Bakens Secretary General for CIB
July 2017

W117 Performance Information in Construction: 2018 Research Roadmap Report
~ 12 ~
Towards a CIB W117 Research Roadmap
In 2005, the CIB Program Committee organized TG61 “Benchmarking Construction
Performance Data,” for the purpose of identifying the performance of the construction
industry based on performance information or metrics. TG61 produced a report based on a
comprehensive literature research on the use of performance metrics in the construction
industry. It identified a lack of impactful research based on actual industry research tests
(Egbu et. al., 2006). As a recommendation of TG61, the CIB Program Committee
established a Working Commission, W117, on the Use of Performance Information in
Construction in 2009, and appointed Dean Kashiwagi (PBSRG) and Charles Egbu
(Glasgow Caledonian University) as co-chairs. In 2016, Charles Egbu was replaced by
Sicco Santema (Delft University of Technology).
W117 Objectives and Scope
The objectives and scope of W117 is to document and explore the potential use of
performance information to improve the state of all stakeholders and their organizations in
the construction/services industry supply chain. It also includes to change the research
vehicle and working commission structure to assist W117 to increase the success of
implementing performance information in the construction industry. This includes:
1. To establish W117/PBSRG as the worldwide center of excellence in both the
construction and other services industries and in academic research in the documenting
of case study tests, doing theoretical, prototype testing, and implementation research
and the testing of performance information to create transparency and the mitigation of
risk in the construction and other industries.
2. To identify collaborators who could assist the W117 in documentation, testing and
research of the use and implementation of performance information in the industry.
3. To improve the supply chain performance and the performance of all stakeholders in
the construction industry through research and testing.
4. To advocate the use of performance metrics in the acquisition and delivering of
construction work and other services.
5. To advocate for new approaches to performance metrics that improves the construction
industry performance.
6. To study different countries and cultures to identify how the use of performance metrics
can improve the performance of construction and other services in their respective
countries.
7. To document the use, research and testing of performance metrics in the delivery of
services in the Journal for the Advancement of Performance Information & Value.
8. To quickly and accurately get the W117 research results to the industry and stimulate
even more research in the area of performance metrics by utilizing the W117 journal.
9. To apply different approaches of research to validate outcomes from different angles.
Approaches include literature search, discussion among the industry and academic
researchers, and analyzing the opinions of individuals interviewed on the concept of
using deductive logic and common sense and hypothesis testing. All of which are
validated by immediate testing in practice.

W117 Performance Information in Construction: 2018 Research Roadmap Report
~ 13 ~
10. To analyze the success of W117 in creating theoretical concepts, testing the concepts,
implementing the concepts into the industry, and documenting the implementation of
the test results.
11. If the speed of implementation of performance information is not meeting W117
expectations, the W117 objective will include to change the W117 approach by
modifying the mechanism/structure that W117 is currently operating with.
12. The changing of the W117 research structure could be to go private instead of
depending on the university to lead and support the W117 operations. This would be a
test to change not only the concepts that are being implemented into the industry but
applying the same concepts to the W117 research structure. This would be identifying
the performance information concept a recursive concept.
W117 Work Program
The W117 Work Program includes:
1. Conduct research on the use of performance information in the construction industry
to develop state of the art practices that increase construction performance and value,
minimize risk and resolve longstanding issues in the construction industry.
2. Test all visionary information concepts in academic research/industry tests. The use of
research/industry test results to validate W117 concepts to change the way research is
perceived by the industry.
3. Publishing a CIB preferred journal to document the use and impact of performance
information in the construction industry and quickly disseminate to the industry and
research community by using open source journal platforms such as Research Gate.
4. Hold annual CIB W117 meeting, to discuss the latest results of research in the use of
performance information in construction.
5. Do CIB W117 webinars, podcasts and post presentations on YouTube to proliferate the
exposure of the use of performance information concepts in the construction industry.
6. Attend and participate in international conferences to stimulate expert discussion on
the use of performance metrics in the construction industry.
7. Partner with different research groups and industry experts to proliferate research on
the use of performance metrics.
8. Educate and run academic/research tests in different countries to the use of
performance metrics in the delivery of construction.
9. Hold W117 meetings to assist different countries in implementing performance metrics
in the delivering of construction services.
10. Hold meetings with industry stakeholders to help bridge the gap between academic
research and industry practices and encourage the industry to sponsor academic
research testing on their own projects.
11. Generate research funding to do research in the use of performance metrics in the
construction industry.
12. Create partnerships with active research groups and the CIB to self-fund CIB W117
activities and research and can be self-sustainable without CIB funding.
13. Use the developed information concepts of the Best Value Approach (BVA)
intellectual property (IP) to modify the structure and research areas of W117.

W117 Performance Information in Construction: 2018 Research Roadmap Report
~ 14 ~
Concluding Invitation
The W117 commission is a leader in innovation. It is the first commission to have a very focused
goal of implementing academic research/industry testing to impact the construction industry. The
research is constantly evolving and impacting the direction, scope and speed of evolution of
performance metrics, transparency, mitigation of risk and the improvement of the supply chain
stakeholders. However, this is not the only thrust and value of W117. The W117 is looking to
change the definition of successful and impactful research from traditional academic/industry
research. It will change what is recognized as valuable and impactful research. This Research
Roadmap is the latest document, as of June 2018, and will be continually changed in the coming
years. W117 welcomes all other working commissions and industry visionaries to join in the effort
towards improving the construction industry.
W117 Supporters & Staff
December 2018

W117 Performance Information in Construction: 2018 Research Roadmap Report
~ 15 ~
W117 Roadmap Architects
Dean Kashiwagi, PhD, P.E.
Fulbright Scholar, IFMA Fellow
W117 Co-chair, Editor of the W117 Journal
Director | Performance Based Studies Research Group
Director | KSM Inc.
Sicco Santema, PhD, MSc Law, MSc
W117 Co-chair
Director | Scenter, a consulting firm to the
construction industry
Professor of Marketing and Supply
Management | Delft University of Technology
Jacob Kashiwagi, PhD
W117 Journal Coordinator
Research Director | Performance Based
Studies Research Group
Chairman of the Board | Leadership Society
of Arizona
Alfredo Rivera, PhD
W117 Roadmap Contributor
Co-Director | Leadership Society of Arizona
Jake Gunnoe, PhD
W117 Roadmap Contributor
Co-Director | Leadership Society of Arizona
Joseph Kashiwagi, MS
W117 Roadmap Contributor
Program Manager | KSM Inc.
Isaac Kashiwagi, MS
W117 Roadmap Contributor
Program Manager | KSM Inc.
Administrative Assistance
David G. Krassa,
W117 Project Manager and Administrator
Under the authority of CIB:
Dr. Wim Bakens (Secretary General)
The CIB Board

W117 Performance Information in Construction: 2018 Research Roadmap Report
~ 16 ~
Introduction
The CIB Secretariat has created a CIB Roadmap (see Figure 1) that will assist the working
commissions to create their own roadmaps, to become successful, sustainable, focused on a
strategic plan and assist the improvement of the worldwide construction industry, see Figure 1.
The CIB research roadmaps provide authoritative guidance and support for national and
international research bodies and funding agencies.
Figure 1: CIB Research Roadmap.
As Figure 1 indicates, creating a CIB 117 Research Roadmap requires the following questions to
be addressed:
1. Conceptual Framework:
What are we talking about? This question includes the typical: What are the issues, how
are these interrelated, what influences all of this, who are the stakeholders, what are the
relevant areas of expertise, what are the characteristics of relevant systems, processes,
and technologies? This is addressed in the Conceptual Framework section.
2. State of the Art:
Where are we today? This question includes: State of technology, best practices,
international variations, perceived problems and the world’s leading centers of
expertise. The state of the art is elaborated in the section State of the Art in the
Utilization of Performance Information.
3. Future Scenario:
Where do we want to be in five years? The stakeholders’ vision is described in section
Future Scenario: Where Do We Want to Be in Five Years?
4. Development Strategy:
This section includes: what is needed in terms of knowledge, information, tools,
concepts and applications to enable the respective systems, processes and technologies
to be developed over time? These subjects will be described in the section Development
Strategy.

W117 Performance Information in Construction: 2018 Research Roadmap Report
~ 17 ~
5. Research Contribution:
In section Research Contribution, we describe how W117 research contributes to the
development strategy and what the requirements for research are in order to make that
contribution.
6. Research Agenda:
Section Research Agenda concludes with the agenda for W117 research worldwide.
That will include areas of science and technology development, required sequences of
development, priorities, international cooperation within the research community,
cooperation between research and practice.
Conceptual Framework
W117 Research Technology: The Use of Performance Metrics in the Construction Industry
The conceptual framework for TG 61 and W117 was created (2005) by co-chair Dean Kashiwagi
(PBSRG) and supported by Charles Egbu (Glasgow Caledonian University) and later, Professor
Sicco Santema (Delft University of Technology). Professor Dean Kashiwagi is a researcher in the
area of performance metrics, the language of metrics and the use of metrics to simplify and
improve the construction industry performance. He has had research test responsibilities for more
than 25 years. His expertise is defined by 335 publications, over 2,000 research tests and delivery
of $6.6B of services. He also has been involved with education and research testing in 13 countries
(United States, Canada, Finland, Botswana, Democratic Republic of the Congo, Netherlands,
Malaysia, India, Norway, Poland, Vietnam and China) and 34 states in the United States. This led
him to being named as an original co-chair of W117 and resulted in the conceptual framework for
W117 research. Professor Charles Egbu gave W117 tremendous support in exposing the
performance information technology in the UK academic conferences. Professor Sicco Santema
has been the latest visionary to support the worldwide effort.
Co-chair, Dean Kashiwagi, has gone through multiple cycles of finding new researchers in the area
of utilizing performance metrics for the improvement of construction services. The cycles were
needed because many of the participating researchers, after a certain time period, did not sustain
or receive enough funding in the W117 research area to stay active in this narrow field of W117
research. Dr. Dean has been successful in recruiting new W117 members within the same area of
expertise to replace those who moved on to other research areas. The new members are being
recruited not only from academia but also from industry, many who are running research tests in
different countries. The research tests are continually improving and developing the technology of
performance metrics (Best Value Approach, language of metrics logic called Information
Measurement Theory, procurement, project management and risk management processes).
Worldwide construction research was mainly focusing on the documentation of problems. This
included the documentation of Key Performance Indexes or KPIs. However, the research
community has failed to show how the KPIs increased the performance of construction services.
For example, many industries use KPIs but do not know how to apply the metrics to improve

W117 Performance Information in Construction: 2018 Research Roadmap Report
~ 18 ~
construction performance. Each country also has their own perception of the cause of the
construction industry non-performance.
In 1993, ASU/PBSRG identified a potential solution. It had the following unique characteristics:
• Based on deductive logic identified as Information Measurement Theory.
• Simplification of the environment and creation of transparency.
• Identification of industry experts who could immediately test the hypothesis.
• PBSRG maintains a high level of control over the industry tests.
Issues in the Construction Industry Worldwide
Worldwide, the construction industry has had performance issues for the past 30 years. It appears
to be a low performing industry; clients are unhappy and construction projects do not finish on
time or on budget and construction companies finish projects at a loss. Over the last 30 years the
assertions were validated by numerous landmark studies. The first major study was a breakthrough
study conducted in 1994 by Sir Michael Latham (1994), who identified how significant non-
performance was attributing to the continued failings within construction in the United Kingdom.
He was one of the first researchers to expose that construction non-performance has been existent
for the past 30 years. Interestingly, Peter Goff, of the International Project Management
Association (IPMA), shares a similar argument by identifying that, despite the hundreds of
millions of dollars invested by private enterprises and government to increase education and
training of project managers, there has been no major increase in performance to back up its
validity (Goff, 2014). In all, Latham identified current business practices of management, direction
and control as the causes of an inefficient environment, and non-performance on construction
projects (1994).
Due to the continuous efforts of resolving construction non-performance, the industry was still not
improving. In 1997, the United Kingdom commissioned John Egan to develop a task force to
perform another study on the performance of the industry. Like the first study, Egan identified a
lack of leadership in business practices and integration of standard processes and teams (Egan,
1998). Although both studies have motivated industry and academia to improve the industry
performance, the construction industry has seen minimal improvements moving into the 2000’s to
present day (Chikuni & Hendrik, 2012; Oyedele et al., 2012; Georgy et al., 2005; Bernstein, 2003).
The construction industry has continued to struggle in the 2000s, though some improvement has
been documented. The UK, from 2000 to 2011, saw an increase in customer satisfaction from 63%
to 80%, but its projects were still only completing on time 45%, and met budgets 63% of the time
(UK, 2011). In the U.S., productivity has decreased by 0.8% annually (Adrian, 2001). Construction
companies have the second highest failure and bankruptcy rate of 95% (Associated General
Contractors, 2006). Over 90% of transportation construction jobs are over budget, and almost 50%
of time is wasted on job sites (Lepatner, 2007).
According to a recent Construction Industry Institute (CII) study published in 2015, 2.5% of
projects are defined as successful (scope, cost, schedule, and business), 30% of projects completed
within 10% of planned cost and schedule, 25 to 50% is wasted due to coordinating labor on a
W117 Performance Information in Construction: 2018 Research Roadmap Report
~ 19 ~
project, and management inefficiency costs owners between $15.6 and $36 billion per year
(Lepatner, 2007; PWC, 2009; Yun, 2013).
In 2008, TG61 did a comprehensive literature review of all research efforts worldwide to identify:
1. Research groups who identified the issue of construction nonperformance and ran
academic/industry research tests to confirm their hypothesis.
2. Research groups who ran repeated academic/industry research tests to validate their
hypothesis to increase construction performance.
The study filtered through more than 15 million articles and reviewed more than 4,500 articles.
The study found only 16 articles with documented performance results. The Best Value Approach
(BVA) was one of three construction methods found in those articles, and the Best Value Approach
was found in 75% (12 of 16) of the articles (Egbu, et al., 2008; Michael, et. al., 2008). The BVA
was identified as the only research concept with repeated performance metrics.
For the past five years, W117 has been attempting to identify all construction delivery systems
with documented performance information. W117 has sifted through hundreds of papers, websites,
and personal industry contacts, and found similar results to the first study. Thus far, the only
approach with documented performance is the BVA and PIPS. (Thomas, and Napolitan, 1995;
Odeh, and Battaineh, 2002; Hsieh et al., 2004; Assaf, and Al-Hejji, 2006; Arain, and Pheng, 2006;
Lo et al., 2006; Sambasivan, and Soon, 2007; Al-Kharashi, and Skitmore, 2009; Mahamid, et al.,
2011; PBSRG, 2016)
In one promising study, Sanvido and Konchar identified that the design-build approach was
significantly better. However, five years later, a follow-up and more comprehensive study
identified that there was no significant evidence that one approach was better to any of the other
approaches (Leicht, 2015; Konchar, 1998).
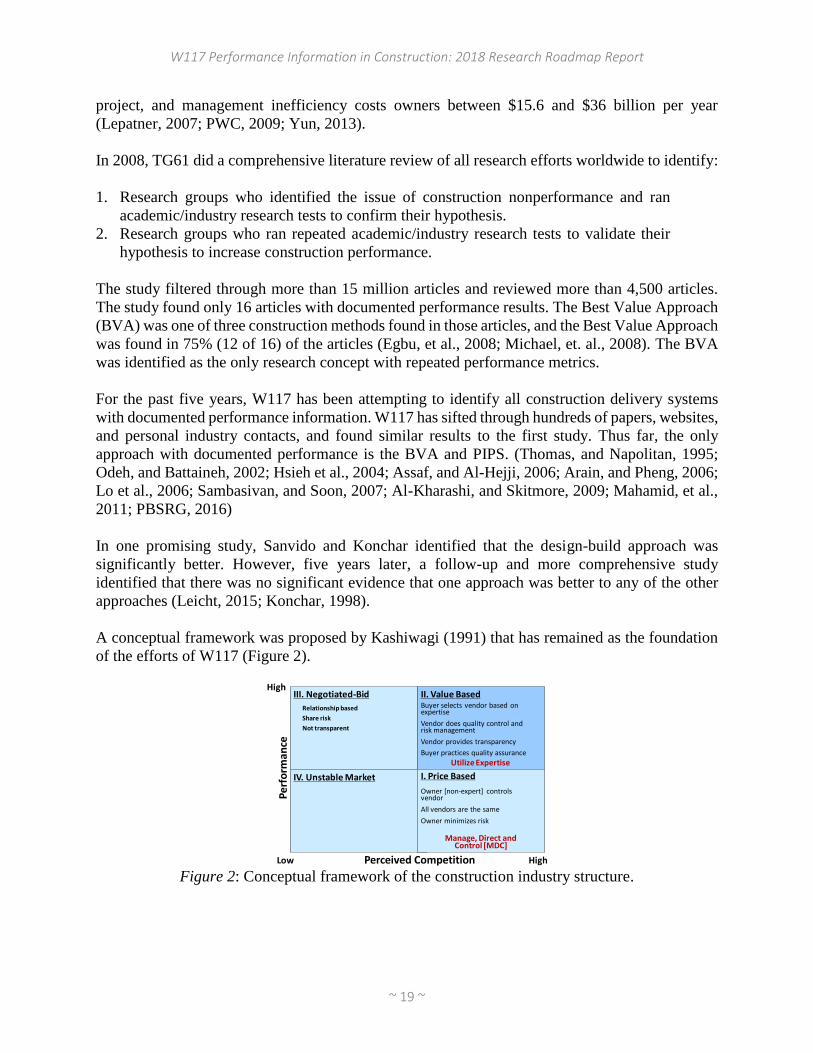
A conceptual framework was proposed by Kashiwagi (1991) that has remained as the foundation
of the efforts of W117 (Figure 2).
Figure 2: Conceptual framework of the construction industry structure.
High
I. Price Based
II. Value Based
IV. Unstable Market
III. Negotiated-Bid
Owner [non-expert] controls vendor
All vendors are the same
Owner minimizes risk
Buyer selects vendor based on expertise
Vendor does quality control and risk management
Vendor provides transparency
Buyer practices quality assurance
Perceived Competition
Pe
rfo
rma
nce
Low
High
Relationship based
Share risk
Not transparent
Utilize Expertise
Manage, Direct and Control [MDC]

W117 Performance Information in Construction: 2018 Research Roadmap Report
~ 20 ~
The Construction Industry Structure identifies the following:
1. Poor performance is caused by owners using management, direction and control
(MDC) to minimize the risk of construction nonperformance.
2. Risk is caused by non-expert stakeholders and not contractors (over 90% of all project
cost and time deviation (US Army Medical Command study, State of Minnesota study
and Rijkswaterstaat fast track projects)).
3. Risk cannot be transferred by means of contracts.
4. When MDC is utilized to mitigate risk; risk, cost and nonperformance increases.
5. High-performing construction is delivered by utilizing construction expertise instead
of MDC.
W117 has proposed the following to the construction management research community and the
construction industry based on research test results (Kashiwagi J., 2013; Kashiwagi, D., 2016;
PBSRG, 2016):
1. The owner or buyer of construction is one of the biggest sources of risk in the delivery
of nonperforming construction.
2. Management, direction and control (MDC) by the owner to minimize the risk of
construction nonperformance is a major source of nonperforming construction.
3. The lack of utilization of construction expertise by the owners of construction is a
resulting problem.
4. The lack of the quantification of construction problems using performance metrics has
resulted in the construction nonperformance being a stubborn and lingering problem.
5. There is confusion in the construction industry on the source of construction
nonperformance.
W117 conceptualizes the current problem of construction nonperformance with the following
characteristics:
1. The construction academic researchers and industry sees the industry as being too
complex and has difficulty simplifying the problem and potential solutions.
2. Because of the lack of understanding of the construction industry non-performance, it
is very difficult to identify the problem, devise a system/approach to solve the problem,
and run tests to validate the proposal.
3. The industry perceives that the problem is a technical problem and is therefore looking
for technical solutions such as BIM to solve their problems. W117 research has
identified the problem as a non-technical problem, and more related to the supply chain
and humanistic characteristics of the supply chain stakeholders.
W117 proposes to solve the problem by using:
1. Deductive logic, natural laws, transparency and simple concepts.
2. Utilizing expertise to lower cost and improve quality.
3. Creating transparency by creating simplicity using the language of metrics.

W117 Performance Information in Construction: 2018 Research Roadmap Report
~ 21 ~
4. Creating simplicity by changing the definition of risk as what an expert does not
control, changing the project management and risk management model (utilizing a
weekly risk report (WRR) and Director’s Report.
W117 research test results over the past twenty years has validated the following concepts:
1. When transparency is created, there a very few disagreements between stakeholders.
2. When an expert has a plan that includes the functions of all stakeholders, the
stakeholders do much better in minimizing the risk that they would normally maximize.
3. When performance metrics are used, there is minimal discussion on someone’s level
of expertise.
4. An expert who knows what they are doing should always have a lower price than a
non-expert. Therefore, the objective is to hire an expert who can lower project costs.
A study was performed, identifying that the Best Value PIPS was the only delivery system with
the concept of no-control or minimizing management, direction, and control (Kashiwagi J., 2013).
This research also documented the potential impact that implementing the concept of no-control
could have on the delivery of construction services (Kashiwagi J., 2013). The study involved 31
construction and non-construction services, among 5 different major buyers in the U.S., comparing
the performance of the project when delivered with the Best Value no-control concept and with
the traditional management, direction and control techniques (see Table 1). It found the following:
• Cost of services decreased on average by 31%.
• Suppliers were able to offer the buyer 38.5% more value, totaling up to $72.76M.
• The average customer satisfaction of the service being provided increased by 4.59 points on a
1-10 scale (134% greater than the traditional customer satisfaction rating).
Table 1: Traditional Model vs. Best Value Model.
Overall Comparison Criteria Traditional Best Value
# of Outsourced Services 31 31
Cost of Services $274,480,342 $189,001,943.00
Added Value - $72,762,248.60
Average Customer Satisfaction 3.43 8.02
State of the Art in the Utilization of Performance Information
PBSRG, Kashiwagi Solution Model (KSM) Inc. and W117 have been developing the use of
performance information in the construction industry for the past 26 years. However, the center of
research and development has been PBSRG under the leadership of Dr. Dean Kashiwagi. As
documented in the TG61 and WC117 documents, it is the IP and constant development of the BVA
IP which makes W117 research unique.

W117 Performance Information in Construction: 2018 Research Roadmap Report
~ 22 ~
The state-of-the-art practices, which is the most licensed intellectual property (IP) technology
developed at Arizona State University (licensed by Skysong Innovations, the licensing arm of
ASU) include:
1. Using the Best Value Approach (BVA) to deliver construction services which results
in a very high level of performance. This includes the use of the Performance
Information Procurement System (PIPS) and the use of the Performance Information
Risk Management System (PIRMS). PIPS has three major phases: Selection,
Clarification and Execution. PIRMS uses the low-bid award system as the selection
phase, but the clarification and execution phases are identical.
2. The use of the language of metrics to create transparency. The language of metrics
minimizes misunderstandings through unified coding.
3. The identification that risk is caused by non-expert stakeholders. Risk cannot be passed.
Risk must be mitigated. Performance metrics are used to explain risk to non-experts,
thus leading to risk mitigation.
4. The use of Information Measurement Theory (IMT) and the Kashiwagi Solution Model
(KSM) to understand human nature, predict future human behavior and utilize these
technologies in the selection and alignment of human resources in construction
services.
5. The optimization of construction resources using a structure that assists in the
optimization of expertise by creating an environment of transparency.
6. Continuous learning from tests and new versions of the methodology. The cycle of
learning keeps speeding up as more countries and academics/practitioners are joining
the effort.
The W117 sponsored journal “Advancement of Performance Information and Value” captures the
latest developments in the use of performance information in the construction and other industries.
W117 also keeps a database of published papers in the area of performance information. The W117
committee members are constantly experimenting by using the BVA in new environments
(including different industries and countries).
The technology of the Best Value Approach (BVA) is licensed by Arizona State University to 61
organizations and is used by supply chain stakeholders (owners, designers/engineers, facility
managers, contractors, subcontractors and material suppliers) and academic researchers.
The BVA has led to a new project management model, a new risk management approach (risk can
only be mitigated and not transferred) and a new definition of an “expert” who uses a leadership
approach (no influence, minimized decision making, and creating transparency) to optimize the
supply chain results. The implementation of these concepts has been challenging. These concepts
require more and increased accurate test results and documentation. What may be challenging to
construction industry stakeholders is the concept that the BVA IP technology is recursive and
defines itself.
The CIB W117 “Performance Information in Construction” working commission, is led by the
creator and founder of the BVA (Dr. Dean Kashiwagi) and includes the worldwide experts in both
academic research and construction industry practice in the area of using performance metrics in
construction projects. W117 is constantly looking for new countries and contributors (both in

W117 Performance Information in Construction: 2018 Research Roadmap Report
~ 23 ~
practice and in academia) who understand the Information Measurement Theory (IMT) and urge
them to participate with W117.
The case of the Netherlands adoption of the BVA took the last ten years. These years included the
usage of BVA by Rijkswaterstaat on the $1B U.S. fast track road construction projects, the
acceptance of BVA by NEVI (Dutch professional procurement group) and the publishing of the
first Dutch Best Value Procurement (BVP) book (by Jeroen van de Rijt and Sicco Santema). This
book showed that the methodology was compliant with the European Tender Law. Up to 2016,
the book is in its third edition and more than 12,000 copies of that book have been sold in the
Netherlands. As an example of continuous development, the fourth edition of the book will be
published in 2017, adopting all the latest insights.
In the Netherlands the widespread application of BVP has resulted in the following challenges:
1. Ensuring that the new paradigm is being understood by new practitioners.
2. To ensure proper documentation.
3. To ensure that the contractors/vendors understand the BVA.
4. How to educate the supply chain fast enough to keep up with the demand of Best Value
services.
W117 is now faced with the challenge of how to proliferate the BVA in the other European
countries. Currently BVA has been moved into Norway and Poland, having the Dutch Best Value
Procurement (BVP) book translated into Norwegian and Polish. The BVP label may have set the
BVA effort back due to the misunderstanding of the value of the performance metrics that defines
the expert vendor’s own performance. The BVA has also been exposed to Switzerland, Denmark,
Finland and Germany.
The proliferation into other European countries is through the Dutch and European professional
engineering groups (in construction) who have observed that their expertise is not being utilized
by owners. The Dutch Rijkswaterstaat organization is also exposing the BVA to other
infrastructure organizations of other European countries. Also, other consultant organizations
exposed to the BVA in the Netherlands and licensed through ASU, are moving it to other European
countries where they do business.
Future Scenario of W117: The Next Five Years (2018 – 2023)
The worldwide competitive marketplace is moving toward automation and information systems.
The major user of automation is the country of China. Once the user of low-cost labor, the
inconsistent results caused by people have forced China to become the world’s foremost user of
automation. This type of competition is forcing the optimization of supply chains (lower costs and
higher performance). W117 has been the leader in the documentation of performance information
research and how to utilize the performance information to increase project performance in the
CIB.

W117 Performance Information in Construction: 2018 Research Roadmap Report
~ 24 ~
Dr. Dean Kashiwagi (co-chair) has identified a very aggressive course of the next five years of
W117 to address the following:
1. Make the current academic/industry research structure more efficient and effective.
2. Create a research structure that takes the information to the industry through a more effective
website, presentations and satellite sites.
3. Create transparency through easy and fast access of information.
4. Change the education/training path to the industry by exposing the information environment
to the future generation before they enter the industry.
5. Change the supply chain to take advantage of a more automated risk management and project
management model utilizing the theoretical definitions of experts, risk, risk mitigation and
project management. Although these concepts were previously identified by W117 research,
implementation in the industry has been challenging.
This approach automates the W117 structure and automate the BVA IP technology to make the
performance information usage much more successful. By solving both problems by using
performance information, W117 will propose that the performance information or BVA IP is
recursive, and information is recursive in nature. The data which when analyzed normally identify
the equation, will actually be used to replace the equation and thinking and decision making that
goes along with the analysis.
W117 Development Strategy
The traditional academic research model for the past 25 years has been where academic research
analyzes industry practices and publishes the analysis in academic journals (see Figure 3). The
research normally takes 4 – 10 years to create the journal publication. University professors
normally participate in a funded system such as the National Science Foundation (NSF),
Department of Transportation and other federal grant programs, Construction Industry Institute
(CII) or smaller institutes such as the Design Build Institute of America (DBIA), Associate General
Contractors (AGC) or other funding group. Researchers then propose on needs of the industry and
must continually find and receive grant opportunities to sustain their research. The traditional
research professor’s success depends on the ability to accomplish the following:
1. Get involved with the granting organizations.
2. Write proposals in the area of industry interest.
3. Be successful in winning a couple of grants.
4. Be promoted to academic administration positions such as director of research, department
chair, or dean of the college and manage other young researchers.

W117 Performance Information in Construction: 2018 Research Roadmap Report
~ 25 ~
Figure 3a: Traditional Academic Research Model
Academic researchers rarely get the opportunity to become experts in solving industry problems.
They cannot drill down into problems and become industry experts. This role is normally left to
industry consultants who have the experience to solve industry issues. Academics attempt to
differentiate between research and consultation. They have created silos (see Figure 3b) and have
concluded that research is more valuable than consultation.
Figure 3b: Traditional Academic Research Model (Silo-Based).
Dr. Dean Kashiwagi (founding co-chair) of TG61 and W117 was one of those individuals who
was a research/industry expert (25 years, $17.6M funding, 2,000 tests delivering $6.6B of
construction and other services, 9 different countries, and 62 intellectual property (IP) licenses (the
most licensed IP developed at ASU), and 360 refereed journal papers, books, and conference
presentations). He aligned his expertise with the Performance Based Studies Research Group
(PBSRG) at Arizona State University, the W117, and the IP of Information Measurement Theory
(IMT), the Best Value Approach (BVA) and the Performance Information Procurement System
(PIPS).
However, the inefficiencies of the academic research community (high overhead of university
grants, the bureaucratic assignments of the university administration and complex rules of research
engagement) encouraged Dr. Kashiwagi to move the research center PBSRG to the private sector
to create a more dynamic research model which was more effective and efficient. Dr. Kashiwagi
Research Industry Practices
Universities
Industry
Delivery of Services
Project Data Academic Publications
are rarely implemented in Industry (CII and CIB)

W117 Performance Information in Construction: 2018 Research Roadmap Report
~ 26 ~
moved the financial support of PBSRG and leading W117 to KSM (a research consulting
organization). It is the first Working Commission in the CIB that is being led by a private sector
researcher and research group that has a foundation of concepts that were developed under the
umbrella of the CIB. To make this model successful, W117 is attempting to make the following
changes:
1. Create a new structure where W117 researchers have full access to the IP and can educate and
train others (see Figure 4).
2. Form an international board of industry experts for BVA IP certification to proliferate and
development of the technology of performance information (see Figure 5).
3. Increase exposure into more countries by presentations, website, and publications through the
creation of an international board of experts in using performance information and the BVA
(Figure 5).
4. Increase the number of W117/PBSRG satellite sites that proliferate the technology through
licensed and certified educators (see Figure 6).
5. Utilize Arizona State University intellectual property (IP) licensing to maintain successful
implementation of the IP technology transfer.
6. Combine “research” and “consultation” to do a mixed methods approach which assumes that
the construction industry after 60 years of research and practice, have not understood the major
source of the problems in construction, risk and project management (see Figure 7).
7. Minimize the time to publish industry test findings and to immediately “put the information
on the street” using free access, public website platform (W117 Journal and Research Gate
open platform website) (Figure 8).
8. Test the BVA IP concepts on K-12 (high school students) to prove that the information concept
is recursive and can not only be used to solve the industry problems, but also optimize the
future generation of professionals’ comfort level with automation and information systems (see
Figure 4, 9).
9. Implement the testing of BVA IP technology concepts into K-12 grades high school students
to prepare the next generation for an information based and fully automated systems
environment (Leadership Society of Arizona (LSA)). Implementation of the W117 IP
Concepts (see Figure 9).
Figure 4: W117 Research Pipeline.

W117 Performance Information in Construction: 2018 Research Roadmap Report
~ 27 ~
Figure 5: International W117 BVA Board.
Figure 6: Licensing and Distribution Pipeline.
Figure 7: W117 New Research Environment
Utilizing Actual Industry Testing.
Figure 8: W117 and Research Gate Performance.
Figure 9: Changing the Education Training Model.

W117 Performance Information in Construction: 2018 Research Roadmap Report
~ 28 ~
W117 research has identified the following challenges in the implementation of BVA concepts:
1. In the Netherlands, the W117 research activity led to the Best Value IP becoming the
mainstream procurement approach. It led to multiple Best Value Procurement (BVP)
publications and papers. However, the implementation of the BVA clarification phase and the
Weekly Risk Report (WRR) have not met expectations.
2. The Best Value Procurement hybrids have become an issue.
3. The concepts of minimized thinking and decision making in the delivery of services has shown
to be difficult to implement.
W117 Research Contribution
As a result of the Dutch experience with the BVA, the following concepts will be redefined,
simplified, implemented/tested and retaught to the industry:
1. Move the emphasis from using the BVA technology (performance information) in the
procurement function to the project management function (see Figure 10).
2. Semi-automate the procurement function by removing need to think or process and make
decisions (see Figure 10).
3. Change the project management model from a management model to a leadership model.
Remove management, direction and control from the current project management model (see
Figure 11).
4. Redefine risk in simple terms that were previously identified in the Information Measurement
Theory (IMT) (see Figure 12).
5. Redefine the definition of an expert to concur with the BVA definition (see Figure 13).
6. Minimize risk and cost by using performance information instead of competition and MDC
and negotiation (see Figure 14).
7. Redefine performance information to “machine language” definition (countable and
observable or can be verified by robotics) (see Figure 15).
Figure 10: BVP to BVA. Figure 11: Traditional PM Model vs. New PM Model.

W117 Performance Information in Construction: 2018 Research Roadmap Report
~ 29 ~
Figure 12: Risk Transfer vs. Risk Mitigation.
Figure 13: Non-Expert vs. Expert.
Figure 14: Maximization vs. Minimization of Risk and
Cost.
Figure 15: Traditional vs. New Definition of
Performance.
W117 will link the past/traditional approaches (procurement, project management and risk) with
the future approaches (automation, minimized human thinking and decision making and
identification and utilization of expertise and metrics which are observable and countable). W117
is the only organization that has published work on BVA development and has the expertise to
link the past BVA concepts to the future concepts that align with automation and information
systems. W117 was organized around the expertise of its founder Dean Kashiwagi. As successful
as W117 has been in identifying performance, improving performance, and documenting
performance, W117 has perceived that a part of the problem in getting to change the industry may
be the academic research model itself.
The new W117 research structure eliminates the bureaucracy and limitations that slow down the
academic model. In the traditional academic model, research institutions collect data from industry
projects, but the data is never applied to industry solutions (see Figure 3). Instead, institutions use
the data to write publications with the goal of gaining more research funding. This process involves
lengthy review stages and publication restrictions. The goal of the academic-centric model is to
receive recognition from highly-praised academic sources.
The new W117 Industry-Centered model subverts the traditional publication process (see Figure
3a). Research data is taken directly from applied projects where it is rapidly published online and

W117 Performance Information in Construction: 2018 Research Roadmap Report
~ 30 ~
shared with industry stakeholders. This model creates a transparent flow of information between
researchers, educators, and industry leaders. This model accomplishes more than publications, its
goal is to improve industry performance.
This model achieves the following:
1. Minimizes time to publish research findings on the street using W117 journal and free access,
public website platform (see Figure 7).
2. Form international board for BVA certification to proliferate the technology and increase
exposure to more countries by presentations, website, and publications (see Figure 5).
3. Increases the number of W117/PBSRG satellite sites that proliferate and maintain technology
performance through Arizona State University intellectual property (IP) licensing (see Figure
6).
4. Implements the BVA technology into the education cycle to prepare the younger generation
for information based and fully automated systems (see Figure 9).
Accelerate the Change in the Industry Supply Chain Structure to Overcome Industry
Challenges
The W117 information technology research implements critical changes in the supply chain
structure that can increase project performance. The change in the supply structure has the
following facets:
1. Semi-automate the procurement function and transition to a project management focused
model (see Figure 10).
2. Redefine project management focus from a management model to a leadership model.
3. Redefine risk management (see Figure 12).
4. Clarify the definition of an expert (see Figure 13).
5. Minimize risk and cost by using performance information instead of competition and MDC
and negotiation (see Figure 14).
6. Redefine performance information to “machine language” (countable and observable or can
be verified by robotics) (see Figure 15).
The newest BVA model will be created by semi-automating the procurement model and putting
emphasis on the project management model which will also be a semi-automated model using the
Weekly Risk Report (WRR) in the BVA model. The WRR will be the structure for the new,
leadership-based project management.
The previously identified terms “expert”, “risk”, and “risk mitigation” will be documented in
publications. Experts are defined by personnel who minimize their thinking, decision making and
can see into the future from the beginning to the end of a project (see Figure 12).
Valid performance information minimizes thinking and decision making. If performance
information must be analyzed, BVA does not define it as useful performance information.
W117 Performance Information in Construction: 2018 Research Roadmap Report
~ 31 ~
W117 Research Agenda
The five-year agenda for the W117 will include the following:
1. Change the structure of W117 (see Figure 4). Take the leadership and operation participants
from a university platform to a private sector platform. Create a structure of international
experts who are vested in the theoretical area of performance information and the Best Value
Approach (BVA). Use the information approach to optimize W117.
2. Have the private organization based W117 identify experts, researchers and university
participation.
3. Move primary focus of W117 and research to project management instead of procurement.
Identify a project management platform to change the traditional management, direction and
control (MDC) PM approach to a leadership-based PM approach that aligns and uses
information systems.
4. Increase the number of publications and decrease the time to publish the performance
information technology. Make all publications from the W117 journal to the open platform
Research Gate (see Figure 8). Continue to double the reads, citations, and research followers.
5. Redefine the terms information, transparency, expert, risk and risk mitigation.
6. Increase the number of presentations of the information based intellectual property worldwide
by industry experts.
7. Move into other industries such as services and education to implement the concepts of
performance information to optimize the industries.

W117 Performance Information in Construction: 2018 Research Roadmap Report
~ 32 ~
References
Adrian, J. 2001, ‘Improving Construction Productivity’, Construction Productivity Newsletter, vol.12, no. 6.
AGC 2005/2006, Associated General Contractors of America, Available from: <http://www.agc.org/inde x.ww>. (7
March 2007).
Al-Kharashi, A., and Skitmore, M. (2009). Causes of delays in Saudi Arabian public sector construction projects.
Construction Management and Economics, 27(1), 3-23.
Arain, F. M., Pheng, L. S., and Assaf, S. A. (2006). Contractors’ views of the potential causes of inconsistencies
between design and construction in Saudi Arabia. Journal of performance of constructed facilities, 20(1), 74-83.
Chicago.
Assaf, S. A., and Al-Hejji, S. (2006). Causes of delay in large construction projects. International journal of project
management, 24(4), 349-357.
Bernstein, HM. 2003, ‘Measuring Productivity: An Industry Challenge’, Civil Engineering—ASCE vol. 7, no. 12,
pp. 46-53.
Chikuni, A & Hendrik P 2012, ‘The Impact of Procurement Systems on the Outcome of Public Projects’, Presented
at RICS COBRA 2012, Las Vegas, NV.
Egan, SJ 1998, ‘Rethinking Construction: The Report of the Construction Task Force to the Deputy Prime Minister,
John Prescott, on the scope for improving the quality and efficiency of UK construction.’, The Department of
Trade and Industry, London.
Egbu, C., Carey, B., Sullivan, K & Kashiwagi, D. 2008, Identification of the Use and Impact of Performance
Information Within the Construction Industry Rep, The International Council for Research and Innovation in
Building and Construction, AZ.
Georgy, ME., Change, L & Lei Z 2005, ‘Engineering Performance in the US Industrial Sector’, Cost Engineering,
vol. 47, no. 1.
Goff, S. (2014). “IPMA Education and Training Board Series: Closing the Gap between PM Training and PM
Performance: Part 2: Closing the Gap.” PM World Journal, Vol 3(7).
Hsieh, T. Y., Lu, S. T., & Wu, C. H. (2004). Statistical analysis of causes for change orders in metropolitan public
works. International Journal of Project Management, 22(8), 679-686.
Kashiwagi, D. (2016). 2016 Best Value Approach, Tempe, AZ: KSM Inc., 2016.
Kashiwagi, J. (2013). Dissertation. “Factors of Success in Performance Information Procurement System /
Performance Information Risk Management System.” Delft University, Netherlands.
Konchar, M., & Sanvido, V., 1998, Comparison of U. S. project delivery systems, Journal of Construction
Engineering and Management, Nov/Dec 1998, pg 435- 444.
Latham, M., 1994, Constructing the team, HMSO, London.
Leicht, R. M., Molenaar, K. R., Messner, J. I., Franz, B. W., and Esmaeili, B. 2015. Maximizing Success in
Integrated Projects: An Owner’s Guide. Version 0.9, May. Available at http://bim.psu.edu/delivery.
Lepatner, B.B. 2007, Broken Buildings, Busted Budgets, The University of Chicago Press, Chicago.
Lo, T. Y., Fung, I. W., & Tung, K. C. (2006). Construction delays in Hong Kong civil engineering projects. Journal
of Construction Engineering and Management, 132(6), 636-649.
Mahamid, I., Bruland, A., & Dmaidi, N. (2011). Causes of delay in road construction projects. Journal of
Management in Engineering, 28(3), 300-310.
Michael, J., Sullivan, K. and Kashiwagi, D.T. (2008) "Leadership Based Project Management Model Tested on
Food Services at Arizona State University" 4th Scientific Conference on Project Management (SCPM) & 1st
International Project Management Association (IPMA) / Mediterranean Network (MedNet) Conference on PM
Advances, Training & Certification in the Mediterranean, Chios Island, Greece, pp.234-238 (May 29, 2008).
Odeh, A., and Battaineh, H. (2002). “Causes of Construction Delay: Traditional Contracts” International Journal of
Project Management, Vol. 21 (1), 67-73.
Oyedele, L.O., Regan, M., von Meding, Arinola, J., Olawale, K., Spillane, J. & Konanahalli, A., ‘Strategies for
Reducing Construction Waste to Landfill in the UK’, Presented at RICS COBRA 2012, (10-13 September
2012).
PBSRG. (2016). Worldwide Construction Performance Database. Performance Based Studies Research Group
Internal Research Documentation, Arizona State University, Unpublished Raw Data.
PBSRG.com. "Performance Based Studies Research Group." Best Value Procurement & Risk Minimization «.
Performance Based Studies Research Group, n.d. Web. Adrian, J. 2001, ‘Improving Construction Productivity’,
Construction Productivity Newsletter, vol.12, no. 6.

W117 Performance Information in Construction: 2018 Research Roadmap Report
~ 33 ~
PricewaterhouseCoopers (PwC). (2009). “Need to know: Delivering capital project value in the downturn.”
Retrieved from https://www.pwc.com/co/es/energia-mineria-y-servicios-publicos/assets/need-to-know-eum-
capital-projects.pdf. Accessed September 16, 2015.
Sambasivan, M., & Soon, Y. W. (2007). Causes and effects of delays in Malaysian construction industry.
International Journal of project management, 25(5), 517-526.
Thomas, H. R., & Napolitan, C. L. (1995). Quantitative effects of construction changes on labor productivity.
Journal of construction engineering and management, 121(3), 290-296.
UK Construction Industry KPIs - Industry Performance Report 2011, '2011 Industry Performance Report, Based on
the UK Construction Industry Key Performance Indicators', pp. 1-30.
Yun, S. (2013). The impact of the business-project interface on capital project performance. The University of Texas
at Austin. Retrieved from http://repositories.lib.utexas.edu/handle/2152/22 804.

Journal for the Advancement of Performance
Information and Value Vol.10 I.2 December 2018
© K S M , I n c | 34
Risk Factors and Potential Solutions for the Construction
Industry in China
Yutian Chen (MS) and Oswald Chong (PhD)
Arizona State University
Tempe, AZ, USA
The Chinese construction industry (CCI) has grown to be one of the largest in the world within
the last 10 years. The size of the CCI is on par with many developed nations, despite it being a
developing country. Despite its rapid growth, the productivity and profitability of the CCI is low
compared to similar sized construction industries. In addition to the low efficiency of the CCI,
the minimal documented performance information collected, shows projects being completed
over budget, over the scheduled time, with poor quality of work. A literature research was
performed on other developing countries similar to the CCI, to identify if there were any solutions
that had been proven to improve the productivity and performance of a construction industry. It
was found that Vietnam, The Kingdom of Saudi Arabia and India were the closest to China with
enough documentation on their construction industry. Both countries identified the Best value
Approach (BVA) as the only solution with documented performance showing it could solve the
issues developing countries face with their construction industry. This paper proposes that more
research should be performed looking into the ability of the CCI to implement the BVA.
Keywords: Literature search, Risk, Best Value, China, International.
Introduction
China Construction Industry
In the last 10 years the Chinese economy has been the fastest growing, and one of the largest in
the world. Recent statistics have shown China’s gross domestic product (GDP) increased from
$4.6 billion in 2008 to $12.2 billion in 2017, making China the second largest economy in the
world (Liu et al., 2012; Trading Economics, 2017). Compared to developed countries, it has
surpassed their growth by more than 4 times in many cases. Table 1 shows the difference
between China’s GDP growth and the developed countries. China’s GDP has grown 144% in the
last 10 years. Compared to other developed countries, the GDP growth of China is three times
that of South Korea and six times the U.S. Meanwhile, some developed countries’ GDP
decreased. For instance, the GDP of Japan and Canada respectively dropped 20.3% and 17%
from 2007 to 2017 which were the highest decreases in GDP of developed countries. France’s
GDP also dropped 15.3% at the same time. As a developing country, Russia’s GDP dropped
42% for last 10 years (Trading Economics, 2017), which is another strong evidence that China’s
economy is becoming stronger and contributing more to the international economic stage.

Risk Factors and Potential Solutions for the Construction Industry in China
~ 35 ~
Table 1: GDP Growth Comparison of Developed Countries vs. China. Country GDP growth in last 10 years (2007-2017)
China 144%
South Korea 41%
U.S. 27%
Australia 23%
U.K. -8.40%
France -15.70%
Canada -17%
Japan -20.30%
Russia -42%
When compared to developing countries, China still has the fastest growing GDP. Table 2 shows
the comparison between China’s GDP growth and other developing countries. The next fastest
growing countries are Vietnam (GDP growth is 107%) and India (GDP growth is 91%) (Trading
Economics, 2017).
Table 2: GDP Growth Comparison of Developing Countries and China. Country GDP growth in last 10 years (2007-2017)
China 144%
Vietnam 107%
Mongolia 99%
India 91%
Indonesia 83%
Saudi Arabia 76%
Philippines 75%
Thailand 74%
Oman 33%
Bahrain 24%
Turkey 15%
Along with this economic growth, the Chinese construction industry (CCI) has also grown to be
one of the largest in the world (Cook, 2013). China has done this by spending the most amount
on construction compared to other developed and developing countries on average (ENR, 2005).
The CCI’s contribution to the overall GDP increased from 3.8% in 1978 to 6.7% in 2016 (Liu et
al., 2012; Chinese Construction Statistical Analysis, 2016)). The size of the CCI is on par with many
developed nations, despite it being a developing country. Table 3 shows the ratio of construction
GDP over Annual GDP from different countries including developed countries and developing
countries. The average ratio of construction GDP among countries is 3.2%, which the U.S.
construction industry’s contribution to the GDP is 3.5% and Australia is 2.1%. The only Asian
country which has a construction industry that contributes to the GDP comparable to the CCI is
Japan. However, Japan being a developed country, it uses its construction industry as a control
mechanism and support for its overall economy. When looking at Japan’s overall GDP and its
construction GDP, it can be observed that when the overall GDP went up, the construction GDP
went down at the same time. The same is true for the opposite, when the overall GDP went
down, the construction GDP would increase. For Japan they use construction to boost their
economy in times of economic decline.
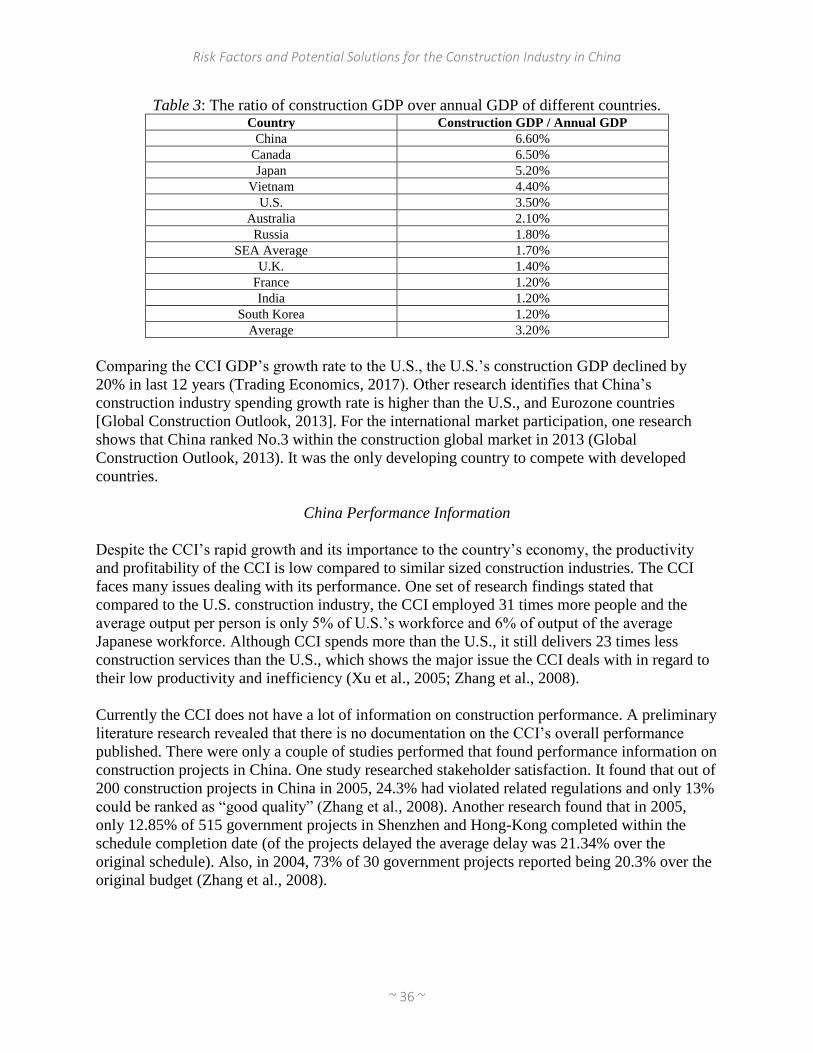
Risk Factors and Potential Solutions for the Construction Industry in China
~ 36 ~
Table 3: The ratio of construction GDP over annual GDP of different countries. Country Construction GDP / Annual GDP
China 6.60%
Canada 6.50%
Japan 5.20%
Vietnam 4.40%
U.S. 3.50%
Australia 2.10%
Russia 1.80%
SEA Average 1.70%
U.K. 1.40%
France 1.20%
India 1.20%
South Korea 1.20%
Average 3.20%
Comparing the CCI GDP’s growth rate to the U.S., the U.S.’s construction GDP declined by
20% in last 12 years (Trading Economics, 2017). Other research identifies that China’s
construction industry spending growth rate is higher than the U.S., and Eurozone countries
[Global Construction Outlook, 2013]. For the international market participation, one research
shows that China ranked No.3 within the construction global market in 2013 (Global
Construction Outlook, 2013). It was the only developing country to compete with developed
countries.
China Performance Information
Despite the CCI’s rapid growth and its importance to the country’s economy, the productivity
and profitability of the CCI is low compared to similar sized construction industries. The CCI
faces many issues dealing with its performance. One set of research findings stated that
compared to the U.S. construction industry, the CCI employed 31 times more people and the
average output per person is only 5% of U.S.’s workforce and 6% of output of the average
Japanese workforce. Although CCI spends more than the U.S., it still delivers 23 times less
construction services than the U.S., which shows the major issue the CCI deals with in regard to
their low productivity and inefficiency (Xu et al., 2005; Zhang et al., 2008).
Currently the CCI does not have a lot of information on construction performance. A preliminary
literature research revealed that there is no documentation on the CCI’s overall performance
published. There were only a couple of studies performed that found performance information on
construction projects in China. One study researched stakeholder satisfaction. It found that out of
200 construction projects in China in 2005, 24.3% had violated related regulations and only 13%
could be ranked as “good quality” (Zhang et al., 2008). Another research found that in 2005,
only 12.85% of 515 government projects in Shenzhen and Hong-Kong completed within the
schedule completion date (of the projects delayed the average delay was 21.34% over the
original schedule). Also, in 2004, 73% of 30 government projects reported being 20.3% over the
original budget (Zhang et al., 2008).

Risk Factors and Potential Solutions for the Construction Industry in China
~ 37 ~
Research identified that the CCI has the following characteristics, which includes:
1. Important component for China. CCI is a large component of country’s GDP.
2. Productivity and Efficiency is poor.
3. Large international market share.
4. Perceived performance issues, but little documentation of actual performance and quality.
Proposal
The CCI can improve its performance and efficiency through utilizing the advancements in
construction delivery methods, developed by other countries. Worldwide there has been an effort
to identify higher performing practices in risk management, project management, and
procurement. There are many developing countries, where the construction industry has had
rapid growth and also has been a major part of their development and are facing the same issues
as China. This aim of this research is to identify the countries that the construction industry is
most like the CCI and identify ways in which they have found could improve performance and
productivity.
Methodology
To find ways to develop and improve the CCI the following steps will be followed:
1. Perform an analysis on developing countries and their construction industries (GDP,
Construction GDP, Corruption Index, Construction GDP Growth, any other dominant
information) to identify which countries are most like China and the CCI.
2. Perform literature research on construction best practices and solutions identified by
developing countries similar to China and the CCI.
3. Identify solutions which solutions could improve the CCI.
Analysis on Developing Countries Similar to China and CCI
The analysis performed, collected the following information on major developing countries in
Asia:
1. Corruption Index.
2. Construction GDP.
3. Construction GDP growth.
4. Available information on the countries.
The researcher identified 2 websites to research the construction GDP and corruption index of
the major developing countries in Asia. The first website was the only source available that
documented the desired information. The second source was used as a verification source.

Risk Factors and Potential Solutions for the Construction Industry in China
~ 38 ~
Two sources were used:
1. TradingEconomics (Trading Economics, 2017)
2. Corruption Perceptions Index 2017 (Transparency International, 2017)).
Table 4 shows the major developing countries and their information. The corruption index score
of the developing countries were looked at first. The corruption index score goes from 46 to 33.
The lower the corruption score, the more corruption that the country experiences. Corruption
score being defined as: Corruption Perceptions Index (CPI). Any developing country within 5-10
points of China’s score was considered.
Table 4: Corruption Index of Developing Countries. Rank Country Score Construction GDP ($) Construction GDP (%)
62 Saudi Arabia 46 $8.64B 4.8%
64 Oman 45 $5.94B 8.9%
70 Bahrain 43 $0.59B 1.8%
75 Turkey 41 $8.08B 0.9%
79 China 40 $844B 7.5%
79 India 40 $35.7B 8.0%
87 Mongolia 38 $0.22B 2.1%
90 Indonesia 37 $19.21B 2.1%
101 Philippines 35 $4.3B 6.2%
101 Thailand 35 $2.27B 2.5%
113 Vietnam 33 $1.29B 4.4%
Second, the construction GDP of the considered countries was then looked at. Construction GDP
is defined as the amount charged by construction companies to customers for the value of work
(produced during the reporting period) excluding VAT and payments to sub-contractors (Office
for National Statistics, 2016). China’s construction GDP was $844B, no other country could
compare with China’s construction GDP. The country with the next highest construction GDP
was India at $36B. The researcher noted that the magnitude of China’s construction GDP makes
the country unique from other developing countries. However, to identify countries similar to
China, the percent the construction GDP contributed to the overall GDP was considered. China’s
construction GDP contributes 7.5% to the overall GDP. Any developing Asian country that their
construction GDP contributes more than 4% to the overall GDP was considered.
This narrowed the countries similar to China to only 6 countries (see Table 5). Third, the next
factor that was looked at was the construction GDP increase over the last 7 years. Table 5 shows
the construction GDP increase for the 6 countries. One of the issues China faces is that although
their construction industry is one of the largest in the world, it is relatively young (Zhang et al.,
2008). Many issues arise when an industry grows too quickly. Looking at the growth of the CCI
over the last 7 years it has increased by 172%. The only country that had a comparable growth
was the Philippines that increased its construction GDP by 150%.

Risk Factors and Potential Solutions for the Construction Industry in China
~ 39 ~
Table 5: Construction GDP Growth of Developing Countries.
Country Construction
GDP ($)
Construction GDP /
Annual GDP
Construction GDP
Increase (2010 – 2017)
Saudi Arabia $8.64B 4.80% 38%
Oman $5.94B 8.90% 74%
China $844B 7.50% 172%
India $35.7B 8% 14%
Philippines $4.3B 6.20% 150%
Vietnam $1.29B 4.40% 40%
After this analysis, the 6 countries remained as similar to China and the CCI (see Table 6). The
fourth and last step was to perform a literature search on these countries to identify which
countries had enough information on their construction industry to provide potential solutions to
the CCI. The search included 4 major research databases (ASCE Library, Science Direct, Taylor
and Francis Online, Emerald Insights), and more than 3200 articles were reviewed to identify
any information on the construction industries in any of the six countries listed in Table 5. Table
6 shows the result of the literature research.
Table 6: Analysis to Identify Previous Work of
Construction Industry in Developing Countries. Country Reference of Construction Industry
Saudi Arabia 45
Oman 1
China 46
Philippines 0
Vietnam 50
India 25
The only two countries that had information published and research performed on their
construction industries was Saudi Arabia, Vietnam and India. Even though the other two
countries (Oman and Philippines) characteristics were more similar to China’s, they were not
developed enough to be able to perform research on their construction industry.
Literature Research on Vietnam, Saudi Arabia and India Identified a Solution to
Improving the Construction Industry
Almost 100 papers and publications were found on the Kingdom of Saudi Arabia, Vietnam and
India construction industries (KSACI, VCI and ICI). These papers reviewed the issues, risks, and
solutions that the countries have found to be able to improve their construction industries’. The
literature research into these three construction industries found that all the countries also
currently suffer from low performing construction services and are seeking for ways to improve
them. The literature did not identify many solutions that can help improve construction
performance. However, there was one potential solution identified called the Best Value
Approach (BVA). BVA was identified by all three countries as a solution that could potentially
work in improving construction efficiency and performance. The solution met all the
requirements and constraints of the VCI, KSACI, and ICI (Nihas, 2013; Le, 2017).

Risk Factors and Potential Solutions for the Construction Industry in China
~ 40 ~
The BVA was identified as the only solution that had documented performance information
validating its ability to improve construction performance. It was found that KSACI had five
Ph.D. candidates all performing research on the BVA (Alzara, 2016; Alofi, 2017; Alhammadi,
2017; Almutairi, 2017; Alghatani, 2018). In reviewing papers available on an on-line community
called Research Gate it was found that the BVA Saudi Arabian articles had more than 1852
reads, showing the interest in the KSACI community (Research Gate, 2018). Vietnam also had a
Ph.D. candidate that is performing research on its implementation of the BVA (Le, 2017). India
had a master’s student perform preliminary research on its potential implementation of the BVA.
All findings from the author was published on the same online community (ResearchGate) and
has 4,124 reads. What is significant about this is that compared to related research, the next
highest number of reads has been seen to reach around 400. This also shows a significant interest
in the Indian community. From the literature research it was identified that five major studies had
been performed identifying the BVA to be the only model with the potential to help developing
countries overcome their construction issues. These studies included the following:
1. CIB TG 61 Worldwide solutions to non-performance (Egbu et al., 2008; Rivera, 2017).
2. PBSRG Project Management Systems Comparison (Rivera, 2017; PBSRG, 2018).
3. Improving Infrastructure Projects in Sub-Saharan Africa (Monteng, 2016).
4. Saudi Arabian Classification System research (Alzara, 2016; Alofi, 2017; Alhammadi, 2017;
Almutairi, 2017; Alghatani, 2018).
5. Preliminary analysis of implementing the BVA in India (Nihas, 2013)
CIB TG 61 Worldwide solutions to non-performance
A monumental research effort was performed in 2008 (Egbu et al., 2008), by Task Group (TG61)
of the International Council for Building (CIB), which is now CIB Working Commission W117.
The research effort investigated innovative construction techniques and systems that used
performance metrics to increase quality and performance of services. The study involved 15
million articles and investigated 4,500 of them to ensure a complete search was made. The result
of the effort identified that only 16 articles had documented that the method had increased
performance and efficiency. It also discovered that there was only one method that had repeated
testing to prove that the results could be replicated and that was the Best Value Approach (BVA)
(at the time BVA was known as the Performance Information Procurement System (PIPS) /
Performance Information Risk Management System (PIRMS)). The study found that 12 out of
the 16 (75%) articles found, were written on the BVA.
PBSRG Project Management Systems Comparison
In 2016, The Performance Based Studies Research Group (PBSRG), performed an analysis of all
the major project management (PM) systems. This effort was headed by Dr. Alfredo Rivera who
wanted to identify the highest performing project management method. This study performed a
literature search on all the top PM systems, including: Lean, Six Sigma, Waterfall, Agile, etc.
The effort involved a literature search of 10,503 articles, from which the researchers reviewed
more than 800 of them. The results of the study found that although many of the PM models had
numerous anecdotal testimonies that the model increased quality, decreased time, and decreased
cost, there was minimal documented evidence showing that the models had impacted the

Risk Factors and Potential Solutions for the Construction Industry in China
~ 41 ~
performance of projects. The only PM model that had repeated testing and documented
improvement of project performance was the Best Value Approach (BVA).
Improving Infrastructure Projects in Sub-Saharan Africa
In 2016, Dr. Emmanuel Moteng performed research through the SKEMA business school
located in Lille, France, to identify if the BVA could improve project performance and efficiency
in Sub-Saharan African countries, specifically the Democratic Republic of Congo (DRC). The
DRC was currently engaged in an effort to try and create a hydro-electric dam in its country that
would have the potential to create energy for almost all of Africa. The project had multiple issues
that was causing delays and increased costs. The study analyzed the BVA to see if its approach
could handle the causes of failure and constraint of the under developed African countries.
Dr. Moteng through a literature research identified different factors of current project delivery
systems and factors of the BVA. He then identified the constraints of the DRC and compared the
current delivery methods to the BVA in which was more suited to the conditions of the DRC.
The results are showed in Table 7. Dr. Moteng discovered that the current practices were failing
because they required more management, communication, decision making, and owner expertise,
which Sub Saharan African countries do not have the capability of supplying.
Table 7: Link between research questions, propositions and methods.
To identify how Dr. Moteng’s research is related to the CCI, Table 7 was modified from Dr.
Moteng’s original version to include a column that identified the CCI conditions. The DRC and
CCI conditions matched up perfectly, showing that the BVA could not only help the DRC, but
also the CCI as well.
Saudi Arabian Classification System Research
From 2016-2017 multiple Saudi researchers at Arizona State University performed their
dissertation research efforts on identifying ways to improve the Kingdom of Saudi Arabia’s
construction industry (KSACI) and contractor classification system. Their studies showed that
the KSACI had been delivering poor performing construction services for more than the last 10

Risk Factors and Potential Solutions for the Construction Industry in China
~ 42 ~
years. The research also discovered that the current contractor classification system (CCS) also
was not able to ensure that the government was receiving high performing construction services.
Dr. Saud Almutairi performed a literature searching 80 countries to identifying all of the CCSs
being used. Out of the 80 countries he found that only 8 countries used a CCS. He also
discovered that none of the CCSs had a way to continually track contractor performance over
time. The only system that had showed a capability to regulate the performance of contractors
over time was the BVA. From this research the KSACI used the BVA principles to help reshape
the Kingdom of Saudi Arabi’s CCS.
Preliminary Analysis of Implementing the BVA in India
In 2013, Syed Nihas performed research at Arizona State University as part of his Master’s
Thesis, to identify the state of the construction industry in India and identify if the BVA could be
implemented despite how diametrically opposed its characteristics are compared to the
traditional culture of India. Syed Nihas, through a literature research and survey of 136 number
of contractors in India, identified the construction industry possesses characteristics that are
similar to those of DRC, Saudi Arabia and Vietnam such as the industry is owner-centric, uses of
management, direction, and control approach to risk, silo thinking, and increase of decision
making (Nihas, 2013).
He identified that in order to implement the BVA the following structure would need to be setup:
1. Identify visionaries in the construction industry that want to run testing on the BVA to
identify impact (visionaries include owners, educators, stakeholders in the supply chain).
2. The representatives must be identified through education and presentations. Visionaries are
susceptible to deductive, simple, 30K foot, supply chain approach.
3. Identify a local university that can set up a research hub to sustain research effort of
conducting tests and documenting results.
4. Industry representatives and educators must work together.
5. Run small tests, document and publish results in journals.
6. The tests must be presented to the industry.
7. Repeat the cycle.
Since his study, over 8 presentations have been given to Indian construction industry leaders on
how to deliver services more successfully. An engineering university has been potentially
identified as the post to set up BVA research and testing, but it is currently being developed.
Literature Research Conclusion
The Best Value Approach was the only solution that Vietnam, Kingdom of Saudi Arabia and
India identified as a method that could help improve their construction industry performance.
The major studies and references that these countries found to support this conclusion involved
researching thousands of papers and analyzing delivery, project management, and contractor
classification systems. The only solution that both countries identified as a potential solution to
their issues have been the Best Value Approach (BVA).

Risk Factors and Potential Solutions for the Construction Industry in China
~ 43 ~
Best Value Approach
The “Best Value Approach” is licensed by Arizona State University’s intellectual property (IP)
licensing arm, AzTech. The BVA is the most licensed IP (60 licenses over 25 years) developed
at the most innovative university in the U.S. (identified as the most innovative university for the
past four years) by the U.S. News and World Report (ASU News, 2018). It has been tested over
2,000 times delivering over $6.6B of services in ten different countries (PBSRG, 2018).
The Best Value Approach was developed by Dr. Dean Kashiwagi at Arizona State University in
1991 for his dissertation research. Over the last 27 years the Performance Based Studies
Research Group, has been testing the BVA continually and documenting its results. The testing
has led to modifications in the BVA that have improved project results and made it easier to
implement.
The BVA utilizes performance information to identify expertise through a competitive process,
then allows expert vendors to plan a project from beginning to end and create transparency by
using a simplified milestone schedule to track project time and cost deviations. The entire
process minimizes the professionals’ thinking and decision making, allowing the expert vendors
to minimize cost by 5 – 30%, and minimizing vendor caused time and cost deviations to under
1% (PBSRG, 2018).
The BVA has three main phases (selection, clarification, and execution) (see Figure 1). It can
also perform a pre-qualification phase, but it is optional. The three phases cover the main project
delivery activities, such as, procurement, negotiations, contract creation, project management,
and risk management. This enables the BVA to help in the entire project delivery process.
What makes the BVA unique is that it is the only project delivery method that minimizes the
need for the owner to have any technical expertise or responsibility for the project, while still
ensuring the vendor is accountable for delivering a high performing product. It does this through
creating a structure that can first select the contractor with the highest level of expertise. It then
requires the expert to perform the work without any management from the owner/buyer.
However, it also requires the vendor to justify their schedule, cost, and how they will do the
work, in a way that the owner/buyer can understand and approves of.
Figure 1: PIPS Phases.
Selection Clarification ExecutionEducate[Prequlification]
Award Contract
All Vendors One Vendor
Differential in
capability/expertise
[using nontechnical
performance metrics]
Technical
review of scope
and vendor plan
Weekly tracking
of project
deviation.
Education
of vendors

Risk Factors and Potential Solutions for the Construction Industry in China
~ 44 ~
There have been many professionals that have expressed concerns with the system and do not
believe that a vendor can be given control of a project and deliver high quality services and think
in the best interest of the owner/buyer. However, the results of the BVA has identified that it not
only improves performance, but also increases the value the owner/buyer receives. A research
study was performed on the Best Value Approach by Dr. Jacob Kashiwagi at Delft University of
Technology, out of the Netherlands (Kashiwagi, 2013). The research involved 5 different major
buyers in the United States (Arizona State University, State of Idaho, University of Idaho,
Schering Plough (now MERCK), and the State of Oklahoma), and involved 31 projects (30
different types of services). The study documented the results of the projects when the service
was delivered using traditional models. The results of the service were also documented when it
was delivered through the BVA. The study found the following (see Table 8):
1. Cost of services decreased on average by 31%.
2. Suppliers were able to offer the buyer 38.5% more value, totaling up to $72.76M.
3. Average customer satisfaction of services provided increased by 4.59 points on a 1-10 scale
(134% greater than the traditional customer satisfaction rating).
Table 8: BVA Project Delivery Results Compared to Traditional Model Results. Overall Comparison
Criteria Traditional BVA
# of Outsourced Services 31
Cost of Services $274,480,342 $189,001,943
Added Value - $72,762,248
Average Customer Satisfaction 3.43 8.02
The BVA has the following characteristics:
1. Automation: minimizes all thinking and decision making by the professional representing the
owner.
2. Simplicity: uses the language of metrics to communicate.
3. Transparency: uses only observable metrics to minimize any decision making.
4. Minimizes communications to three submittals of two pages each, a cost proposal and an
interview.
5. Utilizes a rating system that rewards the level of expertise, risk mitigation and value added if
claims of performance are supported by observable performance metrics. If thinking and
decision making is required, a neutral rating is given.
6. The Best Value expert vendor writes the contract.
The BVA is comprised of four phases (Figure 1). These phases achieve the following:
1. Prioritize the competitive vendors based on five selection criteria: level of expertise,
identification and mitigation of risk, value added, cost and interview.
2. Take the best value vendor (highest level of expertise and lowest price) into a clarification
phase where the expert vendor shows a plan from beginning to end, simplifies the plan with
milestones based on observable metrics and includes all stakeholder actions in the plan.
3. Vendor creates a Weekly Risk Report (WRR) that tracks the project time and cost deviation.
It becomes the major component of the contract.

Risk Factors and Potential Solutions for the Construction Industry in China
~ 45 ~
4. Expert vendor writes the contract that includes the terms and conditions of the owner.
5. The owner signs the contract and the expert vendor executes the service.
Testing of the BVA over 25 years has resulted in the following:
1. Minimized vendor caused project deviations to less than 1%.
2. Confirmed that 90% of all project risk are caused by the owner’s professionals and that the
expert must mitigate the risk that they do not control.
3. 100% of all projects with a clarification period and WRR are successful.
4. Professional PM only need to do 10% of the work of traditional systems and still achieve
better results.
The BVA is a system that has a proven past performance of improving project efficiency and
performance. The BVA could improve the performance of the CCI and help it to develop to
become more productive and efficient.
Key Difference Between China and Other Developing Countries
During this research there was only one major difference found between China and its similar
developing countries (Vietnam, Saudi Arabia, and India), as well as almost every developing
country identified. The difference is the high government participation in the construction
industry. In the CCI there is little or no separation between government and construction
enterprises. Most contractors and vendors are owned by the government. The dynamics of this
structure creates a construction industry that is less transparent, and performance based, and
more relationship based than most other countries. One of the relationship-based characteristics
in the CCI is known as “Guanxi” (good relations). Research studies have shown that guanxi is
perceived from project stakeholders as the most important criterion determining the success rate
of a project. Some engineers determine if their project is successful simply by if they have good
relations/guanxi among the stakeholders, regardless if the project was delayed, over budget, and
low quality. (Wang, X. and Huang, J., 2006). To make the situation worse, China’s state-owned
construction enterprises are large and inefficient, many have administrative processes and
technology that are outdated and not competitive. Most of them have an equity debt ratio of 75%
(He, 2000), which is very high for construction enterprises, and some are likely to declare
bankruptcy, even if no competition is posed by foreign enterprises. On the other hand, many non-
state-owned constructions enterprises are higher performing. Currently the privately-owned
consulting firms are smaller compared to the government consulting firms, but the total output of
the private sector has surpassed that of the state-owned enterprises since 1989 (Xu et al., 2005).
Conclusion
In the last 10 years the Chinese construction industry (CCI) has become one of the largest in the
world. It rivals many developed countries’ construction industries. It has become one of the most
important aspects of China’s economy. However, its rapid growth has also created issues in

Risk Factors and Potential Solutions for the Construction Industry in China
~ 46 ~
productivity and performance. It has also had a difficult time documenting its performance and
issues.
To help the CCI identify possible solutions to its issues, this research performed an analysis and
literature research on other developing countries that were similar to the CCI to see if there were
any solutions that had been proven to improve the productivity and performance of a
construction industry. After analyzing the major developing countries in Asia (Corruption Index,
Construction GDP, % Construction GDP contributes to overall GDP, and Available
Information), there were only three countries that were found to be similar to the CCI: Vietnam,
The Kingdom of Saudi Arabia and India.
All three countries identified that the Best Value Approach was the only proven method that had
performance documentation validating its ability to improve performance and productivity. In
researching on the BVA, four major studies were found identifying the following:
1. BVA was the only construction method with repeated documentation showing high
performing results.
2. BVA was the highest performing and most documented project management model.
3. BVA has the right factors enabling developing countries to implement the method.
4. BVA impacts every major step in project delivery (procurement, negotiation, contract
creation, and project management).
The BVA has been implemented in 10 different countries and research has shown that it is able
to deliver services for 30% cheaper and deliver almost 40% more value.
Although the BVA seems to be a viable solution, the research did recognize that China has one
major difference than other developing countries: the government’s involvement in both the
buying and delivering of construction services. Due to the government being both the buyer and
the contractor in many cases, it has created an environment where in many cases relationships
(Guanxi) is more important to success than the cost, time, and quality of a project.
Further research will be done analyzing if the CCI would be able to implement the BVA and
improve construction performance and productivity.
References
Alhammadi, Y., Kashiwagi, Dean, Badger, William, & Sullivan, Kenneth. (2017). Developing and Evaluation the
Implementation of Construction Management Research in the Saudi Construction Industry, ProQuest
Dissertations and Theses.
Almutairi, S. (2017). Assessment and Develop the Saudi’s Contractors Classification System. ProQuest
Dissertations and Theses.
Alofi, A., Kashiwagi, Dean, Kashiwagi, Jacob, & Sullivan, Kenneth. (2017). Improving the Saudi Arabia
Procurement System: Perception and Development of the Construction Industry, ProQuest Dissertations and
Theses.
Alzara, M. (2016). Measuring the construction performance in Saudi Arabia and proposing new procurement model
based on BV PIPS (a university case study). ProQuest Dissertations and Theses.
ASU News. (2018). ASU ranked most innovative school in US for the fourth straight time. ASU Now: Access,
Excellence, Impact. Web. 10 October 2018. Retrieved from https://asunow.asu.edu/20180909-asu-news-ranked-
most-innovative-US-school-fourth-time
Risk Factors and Potential Solutions for the Construction Industry in China
~ 47 ~
Chinese Construction Statistical Analysis. (2016). Statistical Analysis of construction industry development on
2016 . China Construction Industry Association: Ministry of Housing and Urban-Rural Development Program
Finance and Foreign Affairs Division.
Cook, D. J. (2013). Cleaning Up China's Corrupt Construction Industry: E-Procurement Technology and the 'Tender
and Bidding Law'.
Egbu, C., Carey, B., Sullivan, K & Kashiwagi, D. (2008). Identification of the Use and Impact of Performance
Information Within the Construction Industry Rep, The International Council for Research and Innovation in
Building and Construction, AZ.
Global Construction Outlook. (2013). Global Construction Outlook Executive Outlook: Fourth-quarter 2013
He, Z. F. (2000). “The status quo of education development in construction sector.” Construction Economy, 213(7),
24–27 (in Chinese).
Kashiwagi, D. (1991). Development of a Performance Based Design/Procurement System for Nonstructural Facility
System. Dissertation in Partial Fulfillment of the Requirements for the Degree Doctor of Philosophy, Arizona
State University.
Kashiwagi, D. (2016). 2016 Best Value Approach. Tempe, AZ: Arizona State University.
Kashiwagi, D. (2017). How to Know Everything Without Knowing Anything. Kashiwagi Solution Model Inc. Mesa,
Az. Publisher: KSM Inc.
Kashiwagi, D. (2018). “How to Know Everything Without Knowing Anything Vol.2”, Performance Based Studies
Research Group, Mesa, AZ. Publisher: KSM Inc., 2018.
Kashiwagi, D. (2018a). How FMs can Change the Project Management in Organization, International Facilities
Management Association, World Workplace Conference 2018.
Kashiwagi, D., & Kashiwagi, I. (2014). The Best Value ICT Industry. Journal for the Advancement of Performance
Information & Value, 6(1).
Kashiwagi, D.T., Savicky, J. and Kashiwagi, A. (2002) "Analysis of the Performance of 'Best Value' Procurement in
the State of Hawaii" ASC Proceedings of the 38th Annual Conference Virginia Polytechnic Institute and State
University - Blacksburg, Virginia, pp. 373-380 (April 11, 2002).
Kashiwagi, J. (2013). Dissertation. “Factors of Success in Performance Information Procurement System /
Performance Information Risk Management System.” Delft University, Netherlands.
Le, N. (2017). Vietnam Construction Industry Performance Issues and Potential Solutions. Journal for the
Advancement of Performance Information and Value. Retrieved from
https://www.researchgate.net/publication/323295381_Vietnam_Construction_Industry_Performance_Issues_an
d_Potential_Solutions
Liu, Y. S., Zhao, X. F., & Liao, Y. P. (2012). Market structure, ownership structure, and performance of China’s
construction industry. Journal of Construction Engineering and Management, 139(7), 852-857.
Monteng, E. (2016). Improving Infrastructure Projects Development in Sub-Saharan Africa: Towards a Best Value
Approach. Dissertation, Ph.D., SKEMA Business School, Lille, France.
Nihas, S. (2013). Dissertation, M.S. “Implementation of the Best Value Approach in India.” Arizona State
University.
Office for National Statistics. (2016). Output in the construction industry: Feb 2016. Web. 15 April 2016. Retrieved
from
https://www.ons.gov.uk/businessindustryandtrade/constructionindustry/bulletins/constructionoutputingreatbritai
n/feb2016.
PBSRG. (2018). Performance Based Studies Research Group Internal Research Documentation, Arizona State
University, Unpublished Raw Data.
Rivera, A. (2017). Dissertation, Ph.D. “Shifting from Management to Leadership: A Procurement Model Adaptation
to Project Management.” Arizona State University.
Trading Economics. (2017). Eurozone Q3 GDP Growth Weakest in 4 Years. TradingEconomics.com. Web. 10
October 2018. Retrieved from https://tradingeconomics.com/
Transparency International. (2017). Transparency International. Corruption Perceptions Index. Web. 10 October
2018. Retrieved from https://www.transparency.org/research/cpi/overview
Tulacz, G. (2005). World Construction Spending Nears $4 Trillion for 2004. January 3-10, 254(1):12-13.
Xu, T., Tiong, R. L., Chew, D. A., & Smith, N. J. (2005). Development model for competitive construction industry
in the People’s Republic of China. Journal of construction engineering and management, 131(7), 844-853.
Zhang, W., Cao, D., & Wang, G. (2008). The construction industry in China: Its bidding system and use of
performance information. Journal for the Advancement of Performance Information & Value, 1(1).

Journal for the Advancement of Performance
Information and Value Vol.10 I.2 December 2018
© K S M , I n c | 48
The Best Value Approach in Facility Management:
A Case on Cleaning-Related Services
Violette Krouwel
Senior Consultant Procurement, VGM Facility Experts
Netherlands
Since Best Value was first introduced in the Netherlands in 2005 several tender procedures have
been conducted following this approach, however, most documented cases have been within
construction. As there is a lack of documented cases of the BVA in areas outside of construction
in the Netherlands, this researches focus is to further test, explore and confirm the claims
associated with the Best Value Approach and its applicability in the Facility Management (FM)
industry. Using case study research, the Best Value Approach (BVA) was used to procure
cleaning-related services for the Facility Management department of an organization in the energy
sector. The research findings confirmed the applicability of the BVA in the FM industry through
the successful identification of an FM expert supplier as the best value for the lowest cost. The
results additionally confirmed the BVA to being more efficient, improve supplier risk migration
measures and give a clearer view of the accepted project scope.
Keywords: Best Value Approach, Facility Management.
Introduction
Up until 2000 tender procedures in the Netherlands were mainly price based. Strict specifications
with the aim of achieving the best quality for the lowest price were the standard (see figure 1).
However, goals were not achieved and clients as well as suppliers were dissatisfied. Over the
years the paradigm shifted with a focus on quality and the search for the best expertise instead of
contracting suppliers with the lowest price. This new way of thinking was the first step towards a
value-based structure.
Figure 1: Industry Structure (Kashiwagi, 2014a).

The Best Value Approach in Facility Management: A Case on Cleaning-Related Services
~ 49 ~
Between 2005 and 2010 projects following a value-based structure were executed using the Best
Value Approach (Kashiwagi, 2017) in the Netherlands (mainly) the construction industry. After
the Best Value Approach (BVA) was applied by Rijkswaterstaat in 2008 (Van de Rijt, Witteveen,
Vis & Santema, 2011) and the successes of the projects were publicly shared, the Best Value
Approach has begun to extend to other sectors including information technology (D. Kashiwagi
& I. Kashiwagi, 2014), travel, and services (Bos, D. Kashiwagi, and I. Kashiwagi, 2015). With
claims of performance including:
1. Selection of the Best Value for the lowest cost.
2. Reduced cost of project.
3. Improved customer satisfaction.
4. Enforcement of supplier planning and risk mitigation.
Since the Rijskwaterstaat project results were shared, there has been little documentation in
respect to the performance of Best Value within the Netherlands. Most documented claims stem
from the United Sates, which is where Best Value was initially started.
Objective and Methodology
As less is known about the application of Best Value in the Netherlands there is a need to validate
the performance of the BVA and explore the applicability of it in the Netherlands. The purpose of
this paper is to fill this gap by investigating an analyzing the application of a Best Value project.
To meet this research objective, a case study has been performed to identify, understand and
analyze the results of a facility management project. The following methodology was followed:
1. Identify and test BVA on a project within the Netherlands.
2. Analyze the results in comparison to previous BVA claims of performance.
Case Study
The client organization
The client is an organization with 3,500 employees who supply energy to approximately 2
million companies and households every day. The client’s head office is in the Netherlands and
the organization is in several other countries in (West-)Europe. The Facility Management (FM)
department of the organization offers support to employees to ensure they make an optimal
contribution to the organization’s mission. To achieve this, the FM department works together
with multiple partners, including a partner for cleaning services, sanitary supplies and window
cleaning, as well as other partners for waste management, pest control, snow and ice control and
indoor greenery. The FM department wishes to integrate related services with the aim of
intensifying the collaboration with a small number of suppliers. The integration of all cleaning-
related services followed the four phases of Best Value as shown in figure 2.

The Best Value Approach in Facility Management: A Case on Cleaning-Related Services
~ 50 ~
Figure 2: Phases of Best Value
Preparation
The Beginning
The idea of applying the Best Value approach within projects of the FM department arose during
2017. The former contract with the supplier providing cleaning services, sanitary supplies and
window cleaning would end in September 2018 and had to be tendered. However, the FM
department strived for a renewed contract based on mutual goals for the organization itself and
the supplier as well as more opportunities to innovate and develop the facility services. The
original way of tendering within the client’s organization did not meet the ambitions of the FM
department. The Best Value Approach was proposed as a potential solution due to its claims to
improve quality and innovation through the utilization of expertise (Kashiwagi, 2017).
Training of the Project Team
As the organization’s different types of locations (head office vs. bio-energy plants) and the
geographical spreading over the Netherlands were a challenge to keep everyone involved, a
project team was formed with representation from the entire organization. Throughout the entire
project the project team was trained in Best Value through the following core periods:
• At the start of the project the main principles of Best Value were explained, and examples of
successes and pitfalls were shared;
• In the preparation phase the knowledge on Best Value was refreshed while drafting the
project goals;
• In the evaluation phase the project team was trained on how to evaluate the received tenders
according to the Best Value Approach. An independent consultant was used to ensure the
Best Value philosophy was kept intact;
• In the first meeting of the pre-award phase expectations about the BVA were managed
between the organization and the selected supplier;
• During the execution phase, no specific training was provided; however, the engaged project
team of the organization received thorough training and on the side of the supplier a Best
Value expert is involved as well.
Preparation AssessmentClarification/
Pre-awardExecution

The Best Value Approach in Facility Management: A Case on Cleaning-Related Services
~ 51 ~
Project goals
The project goals were defined as follows:
The supplier is responsible for the cleaning and supplementary services for the
organization’s locations and thereby will realize the following objectives based on the
Best Value Approach:
1. Supplier delivers added value and at least meets the objectives, mission and culture
values of the organization and the DNA of the FM department.
2. Supplier ensures optimal coordination and coordination of the services with
employees, visitors, contract partners of the organization, suppliers and other
stakeholders.
3. With a high-quality, hospitable and proactive service, supplier optimally matches the
processes of the organization and the intended identity and diversity of the locations.
4. Supplier will realize satisfied employees, visitors, suppliers, contract partners and
other stakeholders, together with facility contract partners, thereby achieving a service
and experience level of at least 7 (scale 1-10).
5. Supplier guarantees maximum continuity, (re)connection with staff, employee
satisfaction, reliability and professionalism of the entire service for the organization.
6. Supplier draws up an efficiency proposal from the TCO concept every year.
7. Supplier realizes maximum transparency regarding the realization of the services in
communication and reporting tools, which can also be used for external and internal
communication by the organization.
8. Supplier ensures that CSR, circularity and innovation form an explicit part of the
service provision and reporting.
9. Supplier realizes with waste management (office waste) the highest possible
application of the waste fraction (in accordance with the waste hierarchy from the
prevailing LAP), where the applications increase as much as possible in the hierarchy
during the contract period.
10. Supplier takes, within the mandate of the organization, initiatives to reduce waste, to
separate waste into recyclable raw materials and to apply waste at a high level in the
waste hierarchy.
Assessment
Preselection
The tender followed the negotiated procedure with prior call for competition (2014/24/EU,
Article 47). The pre-selection took place during October till December of 2017. Nine suppliers
submitted a request to participate. Evaluation took place based on the criteria of vision on
corporate social responsibility (CSR) and vision on bonding and retention of personnel (see table
1).

The Best Value Approach in Facility Management: A Case on Cleaning-Related Services
~ 52 ~
Table 1: Sub-criteria Pre-Selection. Sub criteria Weighing (%) Maximum points
Vision on CSR 50% 500
Vision on bonding and retention of personnel 50% 500
Total 100% 1.000
Two pages could be used for each vision document. The following evaluation method was used:
• 100%: the supplier has described a complete and clear answer to the client organization’s
request. The answer is formulated SMART and provide concrete examples from its own
practice (reference projects). The answer is innovative and shows added value. The answer
shows ambition and commitment (result responsibility);
• 80%: the supplier has defined a complete answer and connects to the client organization’s
request. The answer is SMART described and provided with concrete examples from its own
practice (reference projects).
• 50%: the supplier has defined a complete answer and sufficiently matches the client
organization’s request. The answer is partly SMART and/ or partly provided with concrete
examples from its own practice.
• 20%: the supplier has given an incomplete answer and/ or insufficiently matches the client
organization’s request.
• 0%: the supplier has given no or no applicable answer. The answer does not match the client
organization’s request.
The requests were evaluated by the evaluation committee as stated in the table 2. The suppliers
ranked 1 to 5 (A, B, D, E, F) were admitted to the award procedure.
Table 2: Evaluation of requests. Sub criteria A B C D E F G H I
Vision on CSR 500 500 250 500 400 400 250 400 400
Vision on bonding and retention of personnel 250 250 250 400 400 500 250 250 250
Total 750 750 500 900 800 900 500 650 650
Award
In January 2018 the award procedure started following the Best Value Approach. A maximum
price was set at € 1.1 million based on the budget and actual costs of 2015-2017. The criteria
regarding quality were set as stated in table 3. The evaluation committee assessed all offers
resulting in the evaluation as shown in the table 4.
Table 3: Sub criteria award phase. Sub criteria Weighing (%) Maximum value
Project capability plan 20% - € 220,000
Project capability plan regarding waste management, CSR and circularity 15% - € 165,000
Risk mitigation plan 15% - € 165,000
Value-added plan 15% - € 165,000
Interview key figure 1 5% - € 55,000
Interview key figure 2 5% - € 55,000
Total 100% - € 825,000

The Best Value Approach in Facility Management: A Case on Cleaning-Related Services
~ 53 ~
Table 4: Scorings matrix award procedure. Sub criteria A B D E F
Project capability plan 8 8 6 6 6
Project capability plan regarding waste
management, CSR and circularity
6 6 6 8 10
Risk mitigation plan 6 4 6 6 6
Value-added plan 4 4 6 6 8
Total - € 27,500 € 55,500 €0 - € 82,500 - €247,500
The five selected suppliers were invited to the interviews with two key personnel. The interviews
were held by the Facility Manager of the client’s organization. The project manager fulfilled the
role of process manager. Table 5 shows the evaluation of the interviews.
Table 5: Scorings matrix interviews. Interviews A B D E F
Interview key personnel 1 6 6 10 4 8
Interview key personnel 2 6 4 10 6 10
Total € 0 € 27,500 - € 110,000 € 27,500 - € 82,500
After the interviews were held the award procedure was finalized. Supplier F was ranked first and
admitted to the pre-award phase. Supplier F offered the best value for the lowest cost with the
highest score of all suppliers on the quality criteria and the lowest price. Table 6 shows the final
evaluation.
Table 6: Total scoring matrix. Supplier A B D E F
Value of the quality criteria € -27.500 € 82.500 € -110,000 € -55,000 € -330,000
Price € 1,097,747 € 1,050,611 € 1.092,587 € 1.049,964 € 1.014,149
Evaluation price € 1,070,247 € 1,133,111 € 982,587 € 994,964 € 684,149
Clarification/Pre-award
The goal of the pre-award phase is elaboration of the plans by the supplier to create a more
complete dossier on the implementation and organization of the services. This phase included the
following:
• Kick-off meeting;
• Period of clarification and completion of the dossier. Weekly consultations took place
between the client’s organization and the supplier to monitor the progress;
• Pre-award meeting: presentation of the concept plans;
• Award meeting: presentation and approval of the final plans.
In this phase a project team and a project board were created. The project team cooperated
intensively with the supplier and consulted weekly to further substantiate the documents and
content. The project board joined the decision points (kick-off, pre-award and award meeting). In
addition, for specific topics other project members were involved.

The Best Value Approach in Facility Management: A Case on Cleaning-Related Services
~ 54 ~
At the end of the phase, the following plans were delivered by the supplier:
• Organization of the services (on an operational and a tactical level) at the location of the
organization;
• Implementation of sustainability and innovation in the services at the client’s organization;
• Monitoring and reporting on Key Performance Indicators (KPI’s);
• A reporting tool on waste management (per waste fraction);
• Approach to improve circularity in the supply chain;
• Communication including an escalation plan;
• Bonding and retainment of personnel;
• The final agreement, in accordance with the conditions of the client’s organization.
The contract was awarded, and execution phase begun in September 2018.
Analysis of BVA Implementation
Defining the project goal
During the preparation phase the main principles of BVA was discussed with the project team to
define the project goal. As several goals are important for the client’s organization and the scope
of the project was wide, it was hard to define one project goal. Specifically, one project goal that
would be readable and understandable, hence multiple project goals were drafted.
In the ‘project capability plan’ suppliers were required to meet each project goal individually.
During the evaluation of the tender with suppliers, the supplier’s expressed that this was a
challenge. As the project group created a lot of project goals and the space in the tender is limited
for suppliers (maximum of 2 A4 pages), it was hard to support each goal with enough metrics.
Even though it did not affect the result of the tender, in a future Best Value project it is
recommended to always aim to define one project goal. This also forces the client to focus on the
most important issues.
Additional ‘project capability plan’ regarding waste management, CSR and circularity
It was important that the focus of the client’s organization on CSR and related topics was clearly
reflected in the tender. Particularly In the area of waste management, the FM department had the
assumption that reduction of the residual waste and separation of other waste streams could be
improved. However, the project team was mostly interested in what opportunities the suppliers
recognized.
It was decided to introduce an additional ‘project capability plan’. First of all, in line with the
desire of the client’s organization to have a clear focus on CSR, the additional ‘project capability
plan’ confirmed its importance to the market. Secondly, the additional ‘project capability plan’
made sure suppliers were given enough space to distinguish themselves on these topics in the
tender procedure. The project team supported this idea. In the additional ‘project capability plan
on waste management, CSR and circularity’ suppliers could support with metrics how they would
realize project goals 8, 9 and 10.

The Best Value Approach in Facility Management: A Case on Cleaning-Related Services
~ 55 ~
The additional ‘project capability plan’ is not standard in the Best Value Approach. It was a
concern that this modification would raise questions among the suppliers and make it a look like
a ‘hybrid form’ of Best Value. In the Q&A’s during the tender no questions were asked on this
topic and the received tenders matched with the client’s requirements.
It was notable that the received additional ‘project capability plans’ were partly comparable.
Several suppliers collaborated with the same subcontractor on waste management and thus
produced a similar plan. Understandable, because only a few players are active in this market in
the Netherlands. The main difference between the plans was in the relevant metrics. The scores
achieved with the various plans were therefore only slightly different.
Although the plans were partly comparable, the added value of these plans remained. The plans
provided insight into the ambition of the suppliers and new developments in the market. The
specific translation of the goals for use at the client’s organization was innovative and showed the
project team which supplier shared the DNA of the FM department.
Chosen procedure
Applying the Best Value Approach in a public tender procedure following Directive 2014/24/EU
may lead to some (legal) difficulties. Van de Rijt and Santema (2012, p. 156) identify the pre-
award phase to be difficult to integrate in a public tender procedure due to the necessary
communications in this phase taking place before formally awarding the contract. Although
Directive 2014/24/EU doesn’t explicitly forbid negotiation or clarification during the regular
(open and restricted) procedures (2014/24/EU, Article 27 and 28), jurisdiction (C-599/10, 2012
and C-336/12, 2013) states that any form of negotiation is contrary to the principles of equal
treatment and transparency (2014/24/EU, cons. 1). By all means, the Best Value Approach
doesn’t intend to negotiate with suppliers during the pre-award phase; however, the elaboration
of the plans can be seen as a change of the submitted offer.
For entities, as the client in this case, operating in the water, energy, transport and postal services
sectors Directive 2014/25/EU applies to tender procedures. This directive includes the
‘negotiated procedure with prior call for competition’ (Directive 2014/25/EU, Article 47) as
common procedure, which leaves more room for communication (‘negotiations’) during the
tender procedure and makes it (from a legal perspective) easier to include the pre-award phase of
the Best Value Approach before awarding the contract. It is not uncommon for entities following
Directive 2014/25/EU to use the ‘negotiated procedure with prior call for competition’ for the
Best Value Approach (i.e. other organizations within the energy, water and transport sector also
applies this procedure).
Following the ‘negotiated procedure with prior call for competition’ implies the following:
• A preselection took place, which is not standard in the Best Value Approach;
• Three standstill periods were included in the procedure: the first after the preselection, the
second after the decision which supplier was allowed to the pre-award phase, and the third
(and only formal one according to Aanbestedingswet 2012, 2016) after the successful
completion of the pre-award phase.

The Best Value Approach in Facility Management: A Case on Cleaning-Related Services
~ 56 ~
Although the Best Value Approach aims at the market to filter itself in a tender procedure (Van
de Rijt and Santema, 2013, p. 59), it was useful to preselect the suppliers given the size of the
current market for cleaning and related services. Nine suppliers submitted a request to participate
and eventually five suppliers were selected who all connected in some way to the vision of the
client’s organization. In hindsight it the client may have preferred to have selected three suppliers
instead of five, mainly because of the time investment during the interviews, both for the project
team and the suppliers. However, in advance, the project team was afraid that if only three
suppliers were selected, one could potentially pull out of the procedure, making the competition
too limited. Given the fact it was an interesting assignment and organization to service, this risk
was minimal and worth taking. In the future it is recommended to use a preselection, depending
on the size of the market. Unfortunately, little is known about which selection criteria are best
suited to the Best Value approach and comply to Aanbestedingswet 2012 (2016) and Directive
2014/24/EU (2014) law on public procurement. Further research and publications on this topic
can be useful.
After consultation with several lawyers it was decided to include three standstill periods in the
tender procedure. In Aanbestedingswet 2012 (2016, article 2.127) only the standstill period after
the proposed award of the contract is mandatory. The standstill period after the preselection is not
mandatory, but generally recognized (ECLI:NL:RBNHO:2014:611) implying if a supplier does
not make objection during this period, it forfeits its rights. Although this is not the first time it has
been done, the standstill period after the admission of the supplier ranked first to the pre-award
phase was completely voluntarily. The allowance to the pre-award phase is the most important
decision during the procedure and with the greatest consequence to the participating suppliers
(i.e. rejected for the rest of the procedure or pre-awarded the contract). Therefore, it was decided
to add this standstill period to provide all suppliers with the motivation for the evaluation of the
received tenders at an early stage. Moreover, the risk of an objection after successful completion
of the pre-award phase was minimized. Each standstill period took 20 calendar days which meant
a total delay of (non-mandatory standstill periods of) 40 days before finalizing the contract. On
the entire project this means starting on time is even more necessary to achieve your planning. It
may be considered to shorten the non-mandatory standstill periods to, for example, 10 days. This
way, suppliers get the opportunity to object and, if desired and necessary, the standstill period can
always be extended. There is a lot of jurisdiction about the minimum length of standstill periods,
though the term of 10 days seems generally accepted.
The financial value of the value-added plan
Part of the Best Value Approach is the value-added plan the suppliers draft during the tender
procedure. The value-added plan provides the opportunity for suppliers to add options to their
services the client itself has not thought of. These value-added options can be services out of
scope or possibilities from a new perspective. During the pre-award phase or later during the
contract term the client decides whether it will use the value-added options or not.
According to Directive 2014/24/EU (art. 89, 2014) it is forbidden to make substantial
modifications to the contract during its term. If the conditions as stated in this article are not met,
a modification of the contract is not allowed, and a new tender procedure must be conducted. The
valued-added options described by suppliers in their tender generally do not meet those
conditions, implying this could lead to termination of the awarded contract.

The Best Value Approach in Facility Management: A Case on Cleaning-Related Services
~ 57 ~
Specifically, Article 89, sub 2 (ii) (2014) state that a contract may be modified if the value of the
modification remains below 10% of the initial contract value. Based on this article the following
was included in the tender document regarding the costs of the value-added plan:
• The maximum price applies to all fixed activities, the fixed activities based on the annual
volume and the start-up and implementation costs. The maximum price does not include the
value-added plan; the total costs for the value-added plan (i.e. the costs of all options added
up) may not exceed 10% of the suppliers offered price.
There are different views regarding the costs of the value-added plan. According to the original
Best Value Approach the maximum price only applies to the realization of the project goals; the
possible costs of the value-added plan are not limited. However, in practice, a lot of tenders
contain in some way a maximum price for the value-added plan. The idea behind this is that
without a limitation on costs, options are offered that the exceed the client’s budget.
In this project the maximum of 10% of the offered price by the supplier was only added for legal
reasons. By including the described condition, the value-added options of the suppliers can be
applied during the contract term. The application will then not lead to a substantial modification
of the financial value of the contract with a mandatory termination of the contract as a result.
The inclusion of this condition had no effect on the results. It is recommend adding this condition
more often in future projects; although it should always be determined how big the financial
scope of the value-added options in a project can be and if this condition might have a restrictive
influence on the tender.
Conclusion and Results
The project was awarded with the following results:
• Ambitious claims substantiated with performance metrics by the awarded supplier, for
example a net promoter score (NPS) of a 7.5 (scale 1-10) with projected growth to an 8.0 in
year 2;
• Clear control by the awarded supplier of all services within scope (window cleaning, pest
control etc.) and facility chain partners with the aim to reduce disruptions and calamities;
• Full transparency in the calculation and a fixed profit percentage;
• Savings of 7.8% in relation to the budget.
To demonstrate the impact of the Best Value Approach a short survey was held in the project
group (3 team members). The results of the survey are shown in table 7. The project group
concludes the Best Value Approach is efficient, forces the supplier to minimize risks and
improves the possibility to clarify the offers in comparison to a more ‘traditional’ approach.

The Best Value Approach in Facility Management: A Case on Cleaning-Related Services
~ 58 ~
Table 7: Impact of Best Value Approach for the FM department. Survey on a scale of 1-10, with
10 being very satisfied and 1 being very dissatisfied (n=3). ‘Traditional’
approach
Best Value
approach
Overall satisfaction with the process and the contracting of the supplier 7.0 8.0
The process is simple and easy to implement 6.0 7.2
The process is efficient (minimizes costs, time and effort) 6.3 7.7
The process leads to the best performing and cheapest supplier 6.0 6.7
The process minimizes the risk for the client’s organization 6.0 7.3
The process forces the supplier to plan, identify and minimize risks
before the project starts 5.7 8.2
Overall satisfaction with the possibilities to clarify the offers 5.7 7.7
In answering the papers objective, the Best Value Approach was found to have been implemented
successfully with the capability to identify an FM expert supplier as the best value for the lowest
cost. Additionally, some of the BVA claims were confirmed with results showing the BVA to
being more efficient, improve supplier risk mitigation measures and give a clearer view of the
accepted project scope.
References
Aanbestedingswet 2012 (2016). Staatsblad van het Koninkrijk der Nederlanden.
Bos, A., Kashiwagi, D., & Kashiwagi, I. (2015). Changes Required to Sustain a Best Value
Environment. Journal for the Advancement of Performance Information & Value, 7(1).
Directive 2014/24/EU (2014). Official Journal of the European Union.
Directive 2014/25/ EU (2014). Official Journal of the European Union.
Judgment of the court of 29 March 2012, SAG ELV Slovensko a.s. and Others v Úrad pre
verejné obstarávanie, C-599/10, ECLI:EU:C:2012:191.
Judgment of the court of 10 October 2013, Ministeriet for Forskning, Innovation og
Videregående Uddannelser v Manova A/S, C-336/12, ECLI:EU:C:2013:647.
Kashiwagi, D., & Kashiwagi, I. (2014). The Best Value ICT Industry. Journal for the
Advancement of Performance Information & Value, 6(1).
Kashiwagi, D. (2017). How to Know Everything Without Knowing Anything. Kashiwagi
Solution Model Inc. Mesa, Az. Publisher: KSM Inc.
Rijt, J. van der and Santema, S. (2013). Prestatie inkoop. Graphicom International: p. 59.
Rijt, J.van der and Santema, S. (2012). The Best Value Approach in the Netherlands: A
Reflection on Past, Present and Future. Journal for the Advancement of Performance
Information and Value, 4 (2), 147-160.

The Best Value Approach in Facility Management: A Case on Cleaning-Related Services
~ 59 ~
Annex I – interview questions
Introduction/ general questions
1. Could you introduce yourself and indicate which role you will fulfill in this project?
a. Why are you delegated for this interview?
b. What will be your role in the daily implementation of this project?
2. You have submitted an offer including the project capability plan, risk mitigation plan and value-added plan. Were
you involved in the preparation of your offer and in what way?
a. How long will you stay involved in this project?
b. How will the continuity of your team be guaranteed?
3. Which experience do you have in similar projects in the past and what was the result?
a. In what way are these projects similar to this project?
b. How successful were those projects?
c. How did you measure your performance?
4. Could you describe the intentions of this project? What are the most important goals in your opinion?
a. Is everything included in your offer needed to realize the project goals? Please provide an example.
b. On a scale of 1-10, how comfortable/ satisfied are you with your submitted offer? Why?
5. The client’s first project goal is to connect the provided services to the client’s DNA and cultural values.
a. How will you realize this?
b. Based on which competencies do you select personnel for this project?
6. This project follows the Best Value Approach, which differs from a traditional tender procedure. The client wishes
to create a more sustainable partnership.
a. How do you see the cooperation between the client and the supplier and what does that mean for the
provided services?
b. What do you expect from the client regarding the provided services?
7. Can you explain the most important assumptions you made when creating the plan?
a. What happens if these assumptions turn out to be incorrect?
Questions regarding the project capability plan
8. What results do you promise and what is that based on?
a. When is the service successful in your opinion?
b. How do you measure the success?
9. The scope of the project concerns more services than cleaning.
a. How are the other services included in your offer?
b. How do you manage the subcontractors?
10. CSR is an important part of the client’s vision.
a. How do you include CSR in your services?
11. Waste management is also part of the scope.
a. How did you include this in the project capability plan?
b. Please provide examples.
12. How do you manage the transfer of staff and how do train them to provide your service concept?
Questions regarding the risk mitigation plan
13. How did you create the risk mitigation plan, what do you consider to be the biggest risks for this project and how
do you control them?
14. What do you suggest in the case of non-performance from your side?
a. What do you suggest if we as a client cause risks or do not follow the contract?
Questions regarding the value-added plan
15. In your opinion, which service adds the most value to the client?
Closing question
16. Did we forget anything to ask and do you have any questions for us?

Journal for the Advancement of Performance
Information and Value Vol.10 I.2 December 2018
© K S M , I n c | 60
An Exploratory Literature Review and Analysis of Project
Complexity Models
Isaac Kashiwagi (Msc)
Delft University of Technology
Delft, Netherlands
The Information Communications Technology (ICT) industry has been experiencing
challenges in project performance for years. Similarly, complexity has been identified as a
primary contributor to the challenges in project performance for years. As project complexity
is a long-standing issue to ICT performance, an analysis is needed to identify the existing state
of research within project complexity and future research necessary to progress the field of
research. This study, through literature research, analyzes 19 existing complexity models,
including their definitions, factors, and tools of measurement. Findings identify a theoretical
definition to project complexity, a general list of 33 factors used to measure complexity and
identifies the current research within project complexity to be at a theoretical and conceptual
state which has not yet reached a sustained and lasting practical level to the industry. It is
proposed that future research into the perception perspective on ICT project complexity may
provide novel insights into ICT project complexity.
Keywords: ICT Industry, project complexity, performance, complexity factors.
Introduction
The Information Communications Technology (ICT) industry has had perceived performance
issues for years. Performance issues have been identified as early as in 1968 when in The North
Atlantic Treaty Organization (NATO) software engineering conference, the so called “software
crisis” was addressed (NATO Science Committee, 1969). The crisis was due to the number of
software projects failing to be finished on time, on budget, and which did not meet the correct
specifications. At that time, based on the NATO conference findings, the proposed causes of
failure included the complexity of systems and the suppliers’ lack of expertise.
These causes were addressed to be related to the technology and demands of the clients
surpassing supplier’s available solutions. Due to this demand, suppliers offered solutions which
were never tested, and accepted projects which had never been done before on such a large scale.
In this state, it was a concern that clients may lose confidence in the industry. The only
consensus of the attendees of the conference to these problems was that the solution was
unknown. However, guidance was given to continue to improve on current techniques and not to
work outside the present state of technology (NATO Science Committee, 1969).
Since 1969, technology has advanced significantly and the methods and theories to deliver ICT
projects with it. Rivera and Kashiwagi (2016) identify multiple methodologies such as rapid
application development and agile methodology that have been refined over the years to address
the challenges encountered in ICT projects. Even with all these advancements within the ICT
industry throughout the years, the “software crisis” may not have been resolved. A study

An Exploratory Literature Review and Analysis of Project Complexity Models
~ 61 ~
published by the Standish group (1994) reestablished the issue when it identified that 83.8% of
ICT projects failed to be completed on time and on budget, and that projects which were
completed by the largest American companies had only 42% of their original features and
functions. Recent research of the Standish Group (2016) reported that globally more than 70% of
projects failed to be completed on time, on budget and with a satisfactory result.
The ICT industry is a critical element to all industries as it is integrated into all industries from
healthcare to construction due to the growing dependencies for technology in day to day
activities. For instance, the United States government has experienced ICT performance issues
ranging from the Census Bureau (US Department of Commerce, 2011), online healthcare
(Costello & Mcclaim, 2013), payroll systems (Chiang, 2013), and Airforce operations (Institute
for Defense Analysis, 2011). Other countries such as United Kingdom (Public Administration
Committee, 2011), the Netherlands (The House of Representatives of the Netherlands, 2014),
Australia (Legislative Assembly of the Northern Territory, 2014) have shown a similar
integration into various industries and the impact performance issues on a governmental level.
The Standish Group (2016) studied eight of the major sectors including telecom, government,
financial, retail, manufacturing, banking, services and healthcare and discovered little
differential, with reported performance (on time, on budget, meeting client expectations) of 24 –
34%.
Research has investigated the factors of project performance including Nasir and Sahibuddin
(2011), Wateridge (1995) and Fortune and White (2006), all of which concluded that there is no
broad consensus among researchers and practitioners in a standard set of factors. However,
similar to the NATO conference in 1968, they share a common awareness of the importance of
project complexity.
Bullock and Cliff (2004) describe how project complexity is unavoidable with progress and may
be caused by the transition from relatively isolated small-scale elements to much larger
interconnected systems. The impact of these increasing complex systems has been recurrently
identified as growing obstacles. Whittaker (1999) identified that key users misunderstanding the
project’s complexity to be one of major causes of low project performance. Dijk’s (2009)
research in project performance ranked the underestimation of complexity as number one of the
top five causes of content driven issues. A literature review conducted by Bullock and Cliff
(2004) showed the industries acknowledgement of the importance of project complexity,
identifying over 26 academic institutions, 12 Global ICT companies and 22 large non-ICT
companies that have research centers within the field of project complexity which aim to better
understand it’s causes and methods to control it.
As research into factors of ICT project complexity continues, it can be seen to be incorporated
with the applicable industry solutions to improve ICT project performance (Kashiwagi and
Kashiwagi, 2014) including agile project management, the minimization of project size and the
Best Value Approach. All three approaches differ in how to improve performance, but all three
approaches similarly identified an importance in the reduction of complexity as focuses to their
solution.

An Exploratory Literature Review and Analysis of Project Complexity Models
~ 62 ~
Research Questions and Methodology
Project complexity has been identified as a leading cause to performance issues as early as 1969.
Literature has shown that the ICT industry is still experiencing performance issues due to
complexity. The purpose of this paper is to clarify and understand project complexity and
identify further research necessary to progress the field of study. The research seeks to answer
the following questions:
1. How can project complexity be defined?
2. What factors does the industry use to measure project complexity?
3. What is the current state of project complexity research?
To answer these research questions an exploratory literature study has been performed to
identify, understand and analyze the existing complexity models that have been developed.
Research Method
In the literature study for project complexity, “project complexity” + “complexity models” +
“complexity factors” were used as the core keywords. The main search engines that were used
include Engineering Village, Emerald Insight, Pro Quest and Google Scholar. Engineering
Village is comprised of 12 engineering literature and patent databases. In total, the database is
comprised of more than 16 million records from over 68 countries and 1,000 publishers. Emerald
Insight focuses on research in the practice and management of business. Emerald Insight
manages a portfolio of nearly 300 journals, more than 2,500 books and over 450 teaching cases.
Pro Quest also focuses on research into business management but extends their database to
include dissertations, news, and latest working papers. Google Scholar is a broad search across
many disciplines and sources: articles, theses, books, abstracts and court opinions, from
academic publishers, professional societies, online repositories, universities and other web sites.
Google Scholar ranks search results according to where it was published, who it was written by
and how recently it was cited. The selected databases range, saturation and overlap of
publications from different sources and fields ensure a sufficient search was performed to
identify current research done within the area of project complexity.
Publication Selection
Following the search with the identified keywords, 4 steps or filters were used:
1. The publications had to be available in full text English.
2. Each of the keywords were researched in each of the databases, 500 publications per
database for project complexity were reviewed.
3. The publications’ abstracts were reviewed and filtered based on the relation to project
complexity models.
4. Publications for project complexity publications were fully reviewed and filtered based on
the contribution of a unique project complexity model which included a list of complexity
factors.

An Exploratory Literature Review and Analysis of Project Complexity Models
~ 63 ~
After the review of 2,000 publications’ abstracts [see Table 1], 213 were identified to have
abstracts related to project complexity. After the full publications were carefully read and
reviewed, 18 publications were identified to contribute with an original piece or whole of a
complexity model (directly related). From those publications, 1 more was identified through the
references used in those papers. In total, literature identified 19 publications that each presented
an original aspect to modeling complexity, of which 18 were taken from academic journals and
conferences such as, Kybernetes, Project Management Institute, Wiley Interscience, Elsvier,
Sciencedirect, Procedia Engineering, and System of Systems Engineering.
The literature findings for project complexity confirmed that complexity was not solely limited
to the ICT industry but as an industry wide issue (see Table 2), of the 19 publications only 1 was
specifically limited the study to the ICT industry. Most research publications included projects
from multiple different industries and countries. The publications identified did not address an
issue with forming and applying their models for multiple industries. In addition to this, no
location seemed more common than another in their research into complexity. Due to the lack of
research done specifically within the ICT industry, the project complexity research was
expanded to all industries for the purpose of identifying an overall general clarification of project
complexity.
Table 1: Summary of Literature Search. Literature Search Total Engineering Village Emerald ABI/Inform Google Scholar
Searched 2000 500 500 500 500 Related 213 57 73 11 55 Directly 18 14 1 0 3
Reference 1
Final 19
Table 2: Demographics of Literature Results Publication Year Project Complexity
2016 - 2017 5
2011 - 2015 7
2006-2010 4
2001-2005 2
1969-2000 1
Industry #
General 7
*One or more specific industry cited 12
Construction 8
ICT 5
Other (Organizational, Industrial, Aerospace,
Biopharmaceutical, R&D, product development) 5
Location #
General 10
*Specific Location(s) 9
Asia 4
Europe 6
Americas 3
Australia 2
Africa 0
*Publication could be in one or more of the subcategories

An Exploratory Literature Review and Analysis of Project Complexity Models
~ 64 ~
Data Structure
As publications from project complexity literature were identified they were documented in
excel, forming a master database, which was used to create an overall factor list. The master
database stored two central Excel sheets which comprised the raw data which was easily
accessible for all calculations and analysis necessary for the study. An example of the data
structure is available in Appendix A: Tables A1 and A2.
Each of the 19 publications relating to project complexity were listed in an Excel sheet (Table
A1: Complexity Models) as its own row with the columns of data listing all critical pieces of
information gained from the publication including:
1. Demographics of the study such as year of publication, source database, source type, location
and industry.
2. Key information of the complexity model including: the research method used to create a
complexity model (survey, interview, case study, etc), quantity of participants in the study,
number of factors identified by model, definition of complexity, results of the model (tools,
relation to performance, etc.), special notes or unique qualities of study.
In a separate Excel sheet (Table A2: Complexity Factors), all project complexity factors found
were listed as a separate row and each column a classification of that factor including the
reference source, area being measured, and the overall complexity factor it is grouped in.
Analysis and Findings
Defining Project Complexity
There are multiple theories that attempt to define project complexity. However, literature shows
that there is no generally accepted definition (Vidal and Marle, 2008). Examples of the wide
range of theories include:
1. Baccarini (1987) identified a definition to complexity with an objective and subjective
component, listed respectively: (1) Consisting of many varied interrelated parts and (2)
Complicated, involved and intricate.
2. Nan Tie and Bolluijt (2014) define complexity as subjective “a measure of the difficulty of
delivering a specific project in a specific organization from the perspective of the project
manager”.
3. Turner and Cochrane (1993) define complexity as something which can be viewed as both
subjective or objective “the degree of whether the goals and methods of achieving them are
well defined”.
Schlindwein and Ison (2004) explore the history and epistemology of complexity, grouping the
existing definitions into two components: descriptive and perceived complexity. The descriptive
component is an absolute measure that depends on the object itself and is the same measurement

An Exploratory Literature Review and Analysis of Project Complexity Models
~ 65 ~
regardless of the observer, while the perceived component of complexity is dependent on the
observer.
The descriptive component (DC) is centered on the measurement of various aspects of the
conditions of the system. For example, Baccarini (1996) focused on the quantity, variation and
the interdependence of conditions. Jones and Deckro (1993), Williams (1999), Shenhar and Divir
(1993) and Turner and Cochran (1993) incorporate the dynamic and uncertainty of conditions in
terms of their predictability, erratic nature and completeness.
The perceived component (PC) has two methods to measuring complexity (PC1 and PC2). The
first perceived method (PC1) is very similar to the descriptive component. While the descriptive
component is intended to use an objective method to measure the value of the condition, the PC1
uses the observers’ perceived value of the condition as the means of measurement. A secondary
perceived method (PC2) aims to measure the understanding of the observer. This component
similarly uses the perception of the observer however, it differs from PC1 as it is not measuring
the value of the conditions but the observer’s understanding of that condition.
When analyzing the application of PC1 and DC in research models measuring complexity there
seems to be little differential. Both descriptive and perceived components use the observers’
perceived value of the condition as the means of measurement while using both descriptive and
perceived conditions interchangeably. For instance, Vidal, Marle, and Bocquet (2011a, 2011b),
Dao, Kermanshachi, Shane and Anderson (2016), Abdou, Yong, and Othman (2016) use the
perception of the observer to measure the value of the conditions but use both descriptive
conditions such as cost and duration; and perceived conditions such as team cooperation and
level of difficulty in obtaining permits. Theoretically PC2 has been defined, but none of the 19
models have applied the PC2 to modelling complexity.
Literature has shown various differing theoretical definitions to view complexity. Based on the
literature, the author defines a new definition which includes both components of Schlindwein
and Ison (perceived and descriptive) however, based on the application of these components in
existing models, they are regrouped into two new components of ‘perception’ and ‘conditions’.
Our definition includes the descriptive component but separates the component of perceived into
two subcomponents (PC1 and PC2). The first dimension of ‘perception’ is based on PC2 which
aims to measure the observer’s understanding of the project conditions and future project
conditions. The second complexity dimension of ‘conditions’, is based on both the DC and PC1
definitions (Schlindwein and Ison 2004), which aim to measure the value of project conditions
through both objective measurements (Baccarini, 1996) and the observers perceived
measurement of the conditions (Tie & Bolluijt 2014). For this research the definition’s two
components are defined as follows:
1. Perception (based on (PC2)): Understanding of project conditions and how to perform the
project.
2. Conditions (based on (PC1) and (DC)): Project conditions which are present, whether
understood or not understood by the observer.

An Exploratory Literature Review and Analysis of Project Complexity Models
~ 66 ~
Project Complexity Factors
Analysis of the 19 complexity models identified a list of complexity factors. In total the analysis
identified 604 different factors of complexity. To analyze these factors properly the following
two rounds were performed in order to identify “project complexity factors”.
The first round was to exclude all duplicates and factors that were not directly related to the
project. The factors that relate to the environment or company are excluded in this research.
Although these factors may indirectly impact project complexity, it was this research’s key focus
to narrow the scope in order to provide greater insight into factors directly relating to the project.
Each factor was analyzed to identify how it was cited in the literature and tagged it with the area
being mentioned in the factor. The areas identified include the supplier, project management,
relationship, project scope, stakeholders and technology. The areas used were dictated by the
citing of the area in the literature provided with the factor. Some definitions were explained in
detail, others were defined by the factor title itself.
In total 580 factors were identified to be unique (24 duplicates), 67 factors were identified that
relate to the organization and 54 factors relate to the environment. Table 3 summarizes the
distribution of the areas being measured. After this filter 459 factors of complexity were
remaining.
Table 3: Frequency of Factors by Area
System Area % Frequency # Frequency
Project Scope 26.6% 152
Technology 19.0% 112
Organization 11.6% 67
Stakeholder 11.2% 65
Supplier 10.9% 63
Environment 9.3% 54
Project Management 6.2% 36
Relationship 5.3% 31
The second round required a more in-depth analysis than the first round. To do this, the factors
were grouped into larger, broader overall factors. After fully reviewing all remaining factors the
analysis identified 33 general project complexity factors, see Table 4.

An Exploratory Literature Review and Analysis of Project Complexity Models
~ 67 ~
Table 4: Overview of Factors of Complexity # General Project Complexity Factor Definition
1 Project Team Experience The project’s team past experience and familiarity with the components of
the project including stakeholders, company, project team, similar type of
project, country, etc.
2 Project Team Capability The project team’s skills, resources, qualifications, training and education.
3 Team cooperation The cooperation, communication and shared vision amongst team
members regarding the implementation of the project.
4 Variety of Team Capability The diversity of skills, resources, qualifications, training and education
within the team.
5 Size of team The quantity of supplier team members and positions.
6 Team Location The physical geographical location of the supplier’s project team
members.
7 Project Management Tool The utilization of a structured method and tool for project management.
8 Planning and Scheduling The planning and scheduling of activities, deliverables, and tasks
necessary for the completion of the project.
9 Change Order Management The management of changes to the scope of work of the project.
10 Risk Management The identification and mitigation of risk on a project.
11 Stakeholder Management The relationship maintained with stakeholders of the project in the
management of their expectations and objectives.
12 Stakeholder Support The commitment, cooperation, awareness and priority given to the project
by stakeholders.
13 Stakeholder Relationship Appropriate authority and accountability between client and supplier in
determining the necessary roles and responsibilities between entities.
14 Amount of work The largeness of scope in terms of outputs including: man hours,
components and deliverables.
15 Interdependence of work The interaction and interdependence between stakeholders (client and
supplier) during the implementation of a project.
16 Clear goal /objective/ requirement The projects outcome is defined and understood by all stakeholders in
meeting the goals, objectives and requirements.
17 Variety of work The diversity of the different types of components, resources to be
manipulated, tasks and actions to be performed on a project.
18 Project Cost The size of the project budget or capital investment.
19 Project Duration The length of the project's planned duration to complete the project.
20 Information Uncertainty The information uncertainty in the project caused by unknown existing
and future conditions.
21 Feasibility A client’s creation of scope with unrealistic expectations regarding the
quality, necessary resources or outcome of a project.
22 Aligned goals/requirements The project's alignment with the business goals and interests of the
client’s organization.
23 Number of stakeholders The quantity of stakeholders involved in the project including: investors,
departments, sub vendors, units, etc.
24 Availability of Stakeholder Resources Availability of people, material and resources necessary due to sharing.
25 Different Views of stakeholders The projects stakeholder’s different opinions and agendas that may lead to
conflict.
26 Stakeholder Knowledge The project’s stakeholder’s technical knowledge and/or experience.
27 Location of Stakeholders The physical geographical location of project stakeholders.
28 Technology Interdependence The integration between technology, technology including: hardware,
software, processes or methods used.
29 Innovative Technology The newness or novelty of the technology, technology including:
hardware, software, processes or methods used.
30 Changing technology The technology is continuously changing, technology including:
hardware, software, processes or methods used.
31 Variety of technology The diversity of the technology, technology including: hardware,
software, processes or methods used.
32 Difficult Technology The difficulty of the technology, technology including: hardware,
software, processes or methods used.
33 Quantity of decisions The number of decisions to be made regarding the projects plan of
implementation or outcome.

An Exploratory Literature Review and Analysis of Project Complexity Models
~ 68 ~
State of Project Complexity Research
The existing literature has progressed the field of complexity, establishing a foundation of
knowledge upon which lessons learned of what is required to further progress the field can be
addressed.
Of the 19 models (see appendix B for full list of complexity models), the identified factors were
developed in two stages within each publication. Stage 1 involved the initial identification of
factors and stage 2, which was conducted in 11 of the studies, verified the importance of the
developed list of factors with a secondary method. Table 5 summarizes the methods of stages 1
and 2 including the number of studies that used each method, the number of studies that reported
the quantity of participants/papers, and the total quantity of reported participants/papers.
It is important to note that 1 of the models came from industry publications (Global Alliance for
Project Performance Standards (GAPPS), 2005) and 18 came from academic journal and
conference publications. It can be observed that the standard for scientific research varies
between publications and that publications due to their focus may not have given the full details
of their research. For example, Antoniadis, Edum-Fotwe and Thorpe’s (2011) model identified
16 factors which were identified to be developed from personal experience as the factors were
not clear as to how they were developed which could have been done through a scientific
process. However, the factors were verified through multiple case studies.
Table 5: Methods of Factors’ Development Study’s Method of
Factor Development
# Studies
(19 total)
# Studies that
Reported Quantity Total Quantity
Literature Analysis 10 8 > 530 Papers
Workshops 3 1 100 participants
Survey 2 2 91 responses
Expert Panel 2 2 58 participants
Personal Experience 1 - -
Case study 1 1 17 projects
Validation of Factors
No verification 8 - -
Survey 6 4 452 responses
Case study 4 4 32 projects
Workshops 1 1 10 participants
The first stage of developing the factors of the existing models was based on asking or
interpreting what factors one or multiple individuals thought were linked to project complexity.
The opinion of the individual was collected either by published papers, case study interviews, in
person workshops or surveys. Of the 19 models that identified project factors, 8 of these were
not supported through a secondary method and only 4 of the 19 models were applied to a
collective total of 32 projects. The models are primarily based upon opinion of practitioners as
they have been applied on few projects.
Vidal et al. (2011a) also notes that since the participants were not asked to think of how to
measure the identified factors, many are too conceptual or unfeasible to measure on the average
project due to their difficulty and technical skill required to perform the calculations. Vidal

An Exploratory Literature Review and Analysis of Project Complexity Models
~ 69 ~
indicates that without a simple definition and user-friendly method to measure each factor it has
proven difficult to use them on practical level. There is a need for the development of factors
with both a standard definition and feasible method of measurement.
Based on the identified factors, 13 of the 19 models created measurement tools to evaluate the
level of complexity of a project. There were three different types of tools created. The tools,
descriptions of each and studies that produced the tool are reflected in Table 6. As a summary,
the three tools identified include:
1. Prioritized list – List of prioritized factors based upon frequency, group consensus and
personal judgement.
2. Measurement tool – A software and/or equation that scores a project based upon a set of
predetermined weighted factors of a project.
3. Correlation analysis – Analyzes the importance and relation between specific factors of a
project.
Through the existing studies there has been research to support that factors of complexity are
correlated (Qureshi, 2015) and hold differing weighting of importance to complexity (Dao et al.,
2016; GAPPS, 2005; Abdou et al., 2016). However, literature has not provided a proven standard
weighting or correlation of factors that that has shown to be accurate through repeated testing.
Inaccurate weighting of the correlation and factor have caused inaccuracy in measuring
complexity (Vidal et al., 2011a).
Table 6: Tools to Measure Project Complexity. Type of
Definition Represented study Definition Represented Study
Prioritized
Lists
List of factors based upon frequency and group
consensus. (in the studies)
Vidal et al. (2011a, 2011b); Dao et al. (2016);
Bakhshi, Ireland and Gorod (2016); Azim et al.
(2010); Bosch-Rekveldt et al. (2010); He, Luo,
Wang, Li and Zhao (2012); Xia and Chan
(2012); Kermanshachia, Dao, Shane and
Anderson (2016)
Measurement
tool
Weighting system used to score projects on
complexity scale from 0 to 1. Vidal et al. (2011a, 2011b)
PCAM tool - calculates a complexity score.
Determined by a weighting system that was
determined off of participant’s survey results.
Dao et al. (2016)
CIFTER - projects are given points based upon
a defined list of factors and weights.
Global Alliance for Project Performance
Standards (2015)
Correlation
Analysis
Relation between complexity factors Qureshi and Kang (2015)
Grouping of related complexity factors Abdou et al. (2016)
Contextual complexity, inherent complexity Tie and Bolluijt (2014)
Product vs project success, Computed vs
perceived complexity Ribbers and Schoo (2002)
In regard to improving performance, 3 of the measurement tools have shown supporting
evidence that there is a relation between performance and complexity however, the method and
results may require further support as 2 studies showed correlation with performance based

An Exploratory Literature Review and Analysis of Project Complexity Models
~ 70 ~
solely on the perception of participants not the actual project results (*). The other study was
based on the amount of time required to complete individual tasks, but the study did not consider
overall project time or other key factors of success such as cost and customer satisfaction (see
Table 7).
Table 7: Models’ Relation to performance.
Study Industry Definition of Performance Method of measurement
*Tatikonda
and Rosenthal
(2000)
Product development
Time, cost, functional
performance and
objectives
Survey was used to measure
complexity factors and
performance. Analysis was
performed on results.
Antoniadis,
Edum-Fotwe,
Thorpe (2011)
Construction Completion of tasks on
time
Performance vs complexity was
tracked over a period of 10 months
for 5 projects. Analysis was
compared over relation over time.
*Floricel,
Michela, and
Piperca (2016)
Biopharmaceutical,
information and
communication systems,
energy and transportation
infrastructure
Time, cost, functional
requirements
Survey was used to measure
complexity factors and
performance. Analysis was
performed on results.
The existing project complexity models have not provided dominant evidence to claim reduction
to project complexity using a standardized model. This gap in literature has made it difficult to
identify a complexity model as adding more value or use than another. Research in project
complexity appears to still be at a very theoretical and conceptual state and has not yet reached a
sustained and lasting practical level to the industry. In addition to this, as research into project
complexity is a long-standing issue, it is observed that the industry is having difficulties shifting
from the theoretical to the practical state.
Conclusions
The focus of this paper was to further investigate project complexity by answering the research
questions of R1, how can project complexity be defined, R2 what factors define ICT project
complexity and R3 what is the current state of project complexity research? In response to R1,
project complexity was found to have no unified definition. Based on literature a new definition
of complexity was proposed with the components of perception and conditions. In response to
R2, 604 cited factors of complexity were grouped into 33 overall factors of project complexity.
In response to R3, it was found that the research into project complexity appears to be at a very
theoretical state and has not yet reached a sustained and lasting practical level to the industry. As
research into project complexity is a long-standing issue, it is observed that the industry is having
a difficult time moving from the theoretical to practical state.
Reflections
The study attempts to be complete in understanding existing project complexity models,
however, there are potential limitations due to the small sample size of defined models that exist
and the wide range of applicability of ICT services. The data collected was from various sectors

An Exploratory Literature Review and Analysis of Project Complexity Models
~ 71 ~
(construction, ICT, healthcare and manufacturing), types of projects (end user management,
infrastructure management, application management), countries, and project sizes. In addition to
this, the research could have been extended to other research methods such as surveying,
interviews, and case studies. However, these limitations were expected when approaching such a
long standing and unresolved issue such as project complexity. In order to understand the wide
breath of knowledge that has already been performed, the method used was identified as the most
optimal. There have already been various studies which have used surveys, case studies, and
interviews; a literature search would give access to the largest collection of data with minimal
resources required. In addition to this, the literature search has identified that most studies have
not shown dominant differentiation in terms of complexity between industries, countries or
sectors. The selected methodology was a prime factor in arriving at the main contribution of this
paper, which is the identification that the existing research in creating a project complexity
model is still in a theoretical state and has not shown sufficient evidence of applicability in terms
of performance or repeatability. The findings may be a small sample size (19 models) but due to
the consensus and similarities between the models they can be used as a microcosm of the
existing complexity models. This can be used in future research to examine if the direction of
research being performed to examine complexity is accurate.
With the findings of this research the author feels it necessary to reexamine how complexity is
being defined and measured. So far, ICT project complexity models are only studied from a
condition (value) perspective. There is a gap in complexity research with respect to the
perception (understanding) of the observer. Further research into the effect of the perception
perspective on ICT project complexity may provide novel insights to complexity.

An Exploratory Literature Review and Analysis of Project Complexity Models
~ 72 ~
References
Abdou, S. M., Yong, K., & Othman, M. (2016). Project Complexity Influence on Project management performance–
The Malaysian perspective. In MATEC Web of Conferences (Vol. 66, p. 00065). EDP Sciences.
Antoniadis, D. N., Edum-Fotwe, F. T., & Thorpe, A. (2011). Socio-organo complexity and project performance.
International Journal of Project Management, 29(7), 808-816.
Azim, S., Gale, A., Lawlor-Wright, T., Kirkham, R., Khan, A., & Alam, M. (2010). The importance of soft skills in
complex projects. International Journal of Managing Projects in Business, 3(3), 387-401.
Baccarini, D. (1996). The concept of project complexity—a review. International Journal of Project Management,
14(4), 201-204.
Baccarini, D., Salm, G., & Love, P. E. (2004). Management of risks in information technology projects. Industrial
Management & Data Systems, 104(4), 286-295.
Bakhshi, J., Ireland, V., & Gorod, A. (2016). Clarifying the project complexity construct: Past, present and future.
International Journal of Project Management, 34(7), 1199-1213.
Bosch-Rekveldt, M., Jongkind, Y., Mooi, H., Bakker, H., & Verbraeck, A. (2011). Grasping project complexity in
large engineering projects: The TOE (Technical, Organizational and Environmental) framework.
International Journal of Project Management, 29(6), 728-739.
Brockmann, C., & Girmscheid, G. (2008). The inherent complexity of large-scale engineering projects. Project
perspectives.
Bullock, S., & Cliff, D. (2004). Complexity and emergent behavior in ICT systems.
Chiang, J. (2013) 21st Century Project. California State Controller's Office. http://www.sco.ca.gov/21century.html
Cilliers, P. (1998). Complexity Postmodernism: Understanding Complex Systems, London: Roudedge.
Complexity [Def. 1]. (n.d.). Merriam-Webster Online. In Merriam-Webster. Retrieved November 2, 2016, from
https://www.merriam-webster.com/dictionary/complexity.
Costello, T., Mcclaim, E. (2013, October) Obamacare glitches: Gov't contract for troubled site has swelled; GOP
targets Sebelius. NBC News. http://www.nbcnews.com/news/other/obamacare-glitches-govt-contract-
troubled-site-has-swelled-gop-targets-f8C11419179
Dao, B., Kermanshachi, S., Shane, J., & Anderson, S. (2016). Project Complexity Assessment and Management
Tool. Procedia Engineering, 145, 491-496.
Dijk, A. J. V. (2009). Success and failure factors in ICT projects: a Dutch perspective (Doctoral dissertation,
Middlesex University).
Dorsey, P. (2000) Top 10 reasons why systems projects fail. Dulcian Inc.
Floricel, S., Michela, J. L., & Piperca, S. (2016). Complexity, uncertainty-reduction strategies, and project
performance. International Journal of Project Management.
Fortune J, White D (2006). Framing of Project Critical Success Factors by a Systems Model. Int. J. Proj. Manage.,
24(1): 53-65
Geraldi, J., Maylor, H., & Williams, T. (2011). Now, let's make it really complex (complicated) A systematic review
of the complexities of projects. International Journal of Operations & Production Management, 31(9), 966-
990.
Global Alliance for Project Performance Standards (2005) A Framework for Performance Based Competency
Standards for Global Level 1 and 2 Project Managers.
He, Q. H., Luo, L., Wang, J., Li, Y. K., & Zhao, L. (2012, September). Using Analytic Network Process to analyze
influencing factors of project complexity. In Management Science and Engineering (ICMSE), 2012
International Conference on (pp. 1781-1786). IEEE.
Institute for Defense Analysis (2011) Assessment of DoD Enterprise Resource Planning Business Systems.
Alexandria, Virginia: Ketrick, P., Bailey, J., Cunningham, M., Odell, L., Douglas, G., Floyd, D., Insolia, A.
Iván Tarride, M. (2013). The complexity of measuring complexity. Kybernetes, 42(2), 174-184.
Jacucci, E., Hanseth, O., & Lyytinen, K. (2006). Introduction: Taking complexity seriously in IS research.
Information Technology & People, 19(1), 5-11.
Jones, C. (2006). Social and technical reasons for software project failures. CrossTalk, 19(6), 4-9.
Jones, RE and Deckro, RF, The social psychology of project management con¯ict. European Journal of Operational
Research, 1993, 64, 216±228.
Kashiwagi, D., & Kashiwagi, I. (2014). The Best Value ICT Industry. Journal for the Advancement of Performance
Information & Value, 6(1).
Kermanshachi, S., Dao, B., Shane, J., & Anderson, S. (2016). Project Complexity Indicators and Management
Strategies–A Delphi Study. Procedia Engineering, 145, 587-594.

An Exploratory Literature Review and Analysis of Project Complexity Models
~ 73 ~
Legislative Assembly of the Northern Territory. (2014) Management of ICT Projects by Government Agencies.
Northern Territory, Australia. National Library of Australia Cataloguing-in-Publication Data
Maylor, H., Vidgen, R., & Carver, S. (2008). Managerial complexity in project‐based operations: A grounded model
and its implications for practice. Project Management Journal, 39(S1), S15-S26.
Nasir, M. H. N., & Sahibuddin, S. (2011). Critical success factors for software projects: A comparative study.
Scientific research and essays, 6(10), 2174-2186.
Nato Science Committee. (1969) 1968 Nato Software Engineering Conference. Garmisch, Germany: Editors Naur,
P., Randell, B.
Public Administration Committee. (2011). Government and IT—“a recipe for rip-offs”: Time for a new approach.
Twelfth Report of Session, 12.
Qureshi, S. M., & Kang, C. (2015). Analysing the organizational factors of project complexity using structural
equation modelling. International Journal of Project Management, 33(1), 165-176.
Ribbers, P. M., & Schoo, K. C. (2002, January). Designing complex software implementation programs. In System
Sciences, 2002. HICSS. Proceedings of the 35th Annual Hawaii International Conference on (pp. 3391-
3401). IEEE.
Rivera, A., Le, N., Kashiwagi, J., & Kashiwagi, D. (2016). Identifying the Global Performance of the Construction
Industry. Journal for the Advancement of Performance Information & Value, 8(2).
Rolstadås, A., Rolstadås, A., Schiefloe, P. M., & Schiefloe, P. M. (2017). Modelling project complexity.
International Journal of Managing Projects in Business, 10(2), 295-314.
Sauer, C., Cuthbertson, C. (2003) The State of IT Project Management in the UK 2002-2003. Computer Weekly,
2003, London (82 page report).
Schlindwein, S. L., & Ison, R. (2004). Human knowing and perceived complexity: implications for systems practice.
Emergence: Complexity and Organization, 6(3), 27-32.
Shenhar, A. J., & Dvir, D. (1995, January). Managing technology projects: a contingent exploratory approach. In
System Sciences, 1995. Proceedings of the Twenty-Eighth Hawaii International Conference on (Vol. 3, pp.
494-503). IEEE.
Standish Group. (1994). CHAOS Manifesto 1994 Boston, MA: The Standish Group International, Inc.
Standish Group. (2016). The Winning Hand. The Standish Group International, Inc.
Tatikonda, M. V., & Rosenthal, S. R. (2000). Technology novelty, project complexity, and product development
project execution success: a deeper look at task uncertainty in product innovation. IEEE Transactions on
engineering management, 47(1), 74-87.
Taylor, A. (2000). IT projects: sink or swim. The computer bulletin, 42(1), 24-26.
The House of Representatives of the Netherlands (2014) Conclusions and recommendations of the Dutch temporary
committee on government ICT projects.
Tie, B. N., & Bolluijt, J. (2014, June). Measuring project complexity. In System of Systems Engineering (SOSE),
2014 9th International Conference on (pp. 248-253). IEEE.
Turner, J. R., & Cochrane, R. A. (1993). Goals-and-methods matrix: coping with projects with ill defined goals
and/or methods of achieving them. International Journal of project management, 11(2), 93-102.
US Department of Commerce. (2011). Census 2010: final report to congress. (Final Report No. OIG-11-030-I).
Washington, D.C.: U.S. OIG Office of Audit and Evaluation.
Vidal, L. A., & Marle, F. (2008). Understanding project complexity: implications on project management.
Kybernetes, 37(8), 1094-1110.
"Vidal, L. A., Marle, F., & Bocquet, J. C. (2011a). Measuring project complexity using the Analytic Hierarchy
Process. International Journal of Project Management, 29(6), 718-727.
Vidal, L. A., Marle, F., & Bocquet, J. C. (2011b). Using a Delphi process and the Analytic Hierarchy Process (AHP)
to evaluate the complexity of projects. Expert systems with applications, 38(5), 5388-5405."
Wateridge J (1995). IT projects: A Basis for Success. Int. J. Proj. Manage., 13(3): 169-172
Whittaker, B. (1999). What went wrong? Unsuccessful information technology projects. Information Management
& Computer Security, 7(1), 23-30.
Williams, T. M. (1999). The need for new paradigms for complex projects. International journal of project
management, 17(5), 269-273.
Xia, B., & Chan, A. P. (2012). Measuring complexity for building projects: a Delphi study. Engineering,
Construction and Architectural Management, 19(1), 7-24.

An Exploratory Literature Review and Analysis of Project Complexity Models
~ 74 ~
Appendix A: Literature Database Design
Table A1: Data Structure Complexity Models
Table A2: Data Structure Complexity Factors
# Year Database Source Type Industry Location Research Methods
501 2012 Engineering Village Conference General GeneralLiterature analysis
Survey
502 2015 Engineering Village JournalTextile, IT,
Automboile, R&D
Europe, Asia and
Middle-America
Literature analysis
Survey
505 2016 Engineering Village JournalGeneral (ICT
included)China Literature analysis
507 2016 Engineering Village Conference Construction GeneralLiterature analysis
Survey
## of Factors Total Quantity
Definition of
Performance
Method of
measurement
Type of
measurement tool
Represented Study
Definition
50128
> 17 papers
N/A respondentsPrioritized Lists
50238
> 18 papers
150 PMs
Correlation
Analysis
Relation between
complexity factors
505 127 420 papers Prioritized Lists
50719
> 22 papers
101 PM respondents
Correlation
Analysis
Grouping of related
complexity factors
# Complexity Factor Complexity Overall Factor Area
512 Ambiguity of performance criteria Clear goal /objective/ requirement Project Scope
505 Availability of people, material and of any resources due to sharing Availability of Stakeholder Resources Stakeholder
512 Changes of construction works Change Order Management Project Management
511 Clarity of goals Clear goal /objective/ requirement Project Scope
505 Clients with unrealistic goals 7 14 6 Feasability Project Scope
510 Constraints Feasability Project Scope
516 Cost Project Cost Project Scope
509 Demand of creativity Innovative Technology Technology
501 Dependence of relationship among tasks (G5) Interdependence of work Project Scope
512 Geological condition 65 Location of Stakeholders Stakeholder
511 Goal alignment Aligned goals/requirements Project Scope
521 Impact of the magnitude of change orders on project execution. Change Order Management Project Management
516 Integration Interdependence of work Project Scope
502 Largeness of capital investment Project Cost Project Scope
509 Largeness of scope (number of components, etc.) Amount of work Project Scope
511 Newness of technology Innovative Technology Technology
505 Number of activities Amount of work Project Scope
511 Number of goals Amount of work Project Scope

An Exploratory Literature Review and Analysis of Project Complexity Models
~ 75 ~
Appendix B: Complexity Models
# Reference Industry Location Research Methods
1 He, Luo, Wang, Li and Zhao (2012) General General Literature analysis
Survey
2 Qureshi, Sheheryar Mohsin, and
ChangWook Kang (2015)
Textile, IT,
Automobile, R&D
Europe, Asia
and Middle-
America
Literature analysis
Survey
3 Bakhshi, Ireland and Gorod (1999) General (ICT included) China Literature analysis
4 Saed, Yong, Othman (2016) Construction General Literature analysis
Survey
5 Ludovic, Vidal and Franck Marle (2008) General (ICT included) Europe Literature analysis
6 Harvey Maylor (2008) General (ICT included) General workshops
7 Marian Bosch -Rekveldta (2010) Construction General Literature analysis
Case study
8 Bo Xia, Albert P.C. Chan (2012) Construction General Expert panel
9 Dao (2016) Construction United States Workshop
No verification
10 Antoniadis, Edum-Fotwe, Thorpe (2011) Construction Norway
Personal
Experience
Case study
11 Floricel, Michela, and Piperca (2016)
biopharmaceutical,
ICT, energy and
transportation
infrastructure
North/Latin
America
Europe
Africa
Australia
Case study project
Survey
12 Nan Tie and Bolluijt (2014) General General Literature analysis
Survey
13 Vidal et al. (2011a, 2011b) Entertainment Industry General Expert panel
Case study
14 Tatikonda and Rosenthal (2000) Product development General Literature
Survey
15 Ribbers and Schoo (2002) IT Europe Literature analysis
Case study
16 Global Alliance for Project Performance
Standards (GAPPS) General Malaysia Workshops
17 Kermanshachia (2016) Construction Europe Literature Search
Workshop
18 Azim (2010) aerospace Europe Survey
19 Geraldi, Maylor, and Williams (2011)
Construction,
Information Systems,
product development,
R&D, organizational
projects
General Literature analysis

Journal for the Advancement of
Performance Information and Value Vol.10 I.2
December 2018
© K S M , I n c | 76
Current BIM Practices Amongst MEP Contractors and
Suggestions for Improvement
Chara Farquharson (MS)
Arizona State University
Tempe, AZ, USA
Jake A. Gunnoe (PhD) &
Alfredo O. Rivera (PhD)
Leadership Society of Arizona
Mesa, AZ, USA
The mechanical, electrical and plumbing (MEP) systems are three of the most important systems
within a building. These systems alone can account for 40-60% of the total construction costs for
commercial building projects (Second, Hanna, 2010). It is crucial that these systems function
adequately. With the technological advances within the construction industry, the push for
advanced technologies such as Building Information Modeling (BIM) has significantly increased.
This research provides a detailed literature review examining how BIM is now used in the
industry. BIM, a three-dimensional tool used to model a building and its components, is
commonly used during the planning, design, construction and operation phases of a project. A
literature search suggests that specialty trades use BIM to increase collaboration between
stakeholders. Current literature suggests that according to the Best Value Approach (BVA),
upfront collaboration between clients and vendors lead to inefficiencies. BVA decreases
collaboration by creating a system in which clients can better utilize the expertise of high-
performance vendors, without enforcing project requirements and control measures. The authors
suggest that BIM usage may be more effective if paired with BVA; doing so will simplify
communication from MEP experts and minimize risk caused by collaboration.
Keywords: Delivery of services, Best Value Approach, BIM.
Introduction
The construction industry is experiencing issues of low-performance. There have been various
potential solutions which shown signs of success. Information Technology (IT) has significantly
affected the construction industry in recent years. Modern tools, such as Building Information
Modeling (BIM), are becoming the new standard within the industry, and will more than likely
replace 2D design development. Specialty contractors have steadily adopted BIM software
hoping to increase efficiency. As of 2009, over 50% of architects, engineers and contractors were
using BIM technologies (McGraw Hill, 2013), a 250% increase in a two-year span. Defining
BIM, poses its own set of challenges. Logan, Jackson and Hainsworth (2014) define BIM as “the
creation of cross-disciplinary, coordinated 3D models, incorporating 3D objects that can be
presented across synchronized 2D drawings”. According to the team, the key to BIM’s success
lies within the user’s ability to understand and connect information. Given that BIM is a
specialized technology and relatively new, it is common for companies to hire BIM specialists to
model the building and its components digitally (NBS, 2016). These are often recent graduates
with advanced technological skills, but little to no real-world problem-solving skills. This
typically results in building design and constructability flaws. BIM expertise is directly linked to
experience. It is essential for BIM modelers to have prior industry experience.
Current BIM Practices Amongst MEP Contractors and Suggestions for Improvement
~ 77 ~
Most research on BIM focuses on general contractors opposed to the specialty trades
(mechanical, electrical, plumbing [MEP]). This creates a disconnect between the two and leaves
a level of uncertainty how BIM is being used. Given the fickle nature of the construction
industry, defining BIM and how it is being used within the industry is still unclear.
Best Value Approach
The “Best Value Approach” (BVA) is a supply chain management model licensed by Arizona
State University’s (ASU) licensing arm Skysong Technologies. The BVA is the most licensed
intellectual property (60 licenses over 20 years) developed at ASU (identified as the most
innovative university for the past four years by the U.S. News and World Report. Arizona State
University, 2018; U.S. News, 2018). This research has been tested over 2,000 times delivering
over $6.6B of services in ten different countries (Kashiwagi, 2017; Rivera, 2017; PBSRG, 2018).
The BVA is not a process-centered solution but requires a change in paradigm. The primary
function of BVA is the utilization the expertise. This goal has three major components:
1. Identifying experts through a competitive process using performance metrics.
2. Allowing expert vendors to define the scope of work, create the risk mitigation plan, and plan
the project from beginning to the end.
3. Create transparency by using a simplified milestone schedule to track project time and cost
deviations known as the Weekly Risk Report (WRR) and Director’s Report (DR).
The entire process minimizes the professionals’ thinking and decision making in the entire
supply chain, allowing the expert vendors to minimize cost by 5–30%, and minimize their caused
time and cost deviations to under 1% (Kashiwagi, 2018a).
This process is contrary to the price-based approach that clients have used for decades to deliver
professional services. The Industry Structure (Figure 1) highlights the identification and
utilization of expertise (Quadrant II) as the most efficient and effective approach (lower cost and
higher quality and value) (Rivera, 2017; PBSRG, 2018, Kashiwagi, 2018). Since the BVA is not
a process-centered solution, it is compatible with other construction processes and techniques
such as Indefinite Delivery/Indefinite Quantity (IDIQ), Design-Bid-Build (DBB), Design-Build
(DB), and Job Order Contracting (JOC) (Kashiwagi, 2016).

Current BIM Practices Amongst MEP Contractors and Suggestions for Improvement
~ 78 ~
Figure 1: Industry Structure.
Kashiwagi (2018) proposes that a price-based environment leads clients to manage, direct, and
control (MDC) expert vendors. When MDC is present, the vendors’ expertise is minimized, and
instead, they are required to meet the demands of the client. Kashiwagi proposes that client
demands arise from minimum requirements, contract enforcement, litigation, increased
communication, and collaboration.
Research Objective and Methodology
BIM is a relatively new software widely used in the construction industry. This research aims to
understand how companies use the technology and how it can integrate with other solutions such
as the Best Value Approach. This paper focuses on current BIM practices used by commercial
MEP contractors and how the BVA can complement BIM.
To meet the research objective, a literature review has been performed to identify, understand
and analyze BIM and the BVA. The methodology conisists of hte following:
1. Identify the existing practices and potential issues of BIM.
2. Investigate the feasibility of using the BVA to address common BIM issues.
3. Investigate the compatibility of BIM and BVA through previous documented cases.
Literature Review
BIM Utilization Amongst Trades
The MEP sector of the construction industry is essential to a project’s overall success. BIM was
introduced as a tool to assist in providing more efficiency within a project. MEP contractors are
some of the highest adopters of BIM (Young, Jones & Bernstein, 2008). The Engineering News
Record reported that 41% of trade contractors used BIM on 50% or more of their projects
(2016). A study by Hanna, Boodai & Asmar (2013) found that 60% of MEP contractors were
using BIM, 70% of electrical contractors in the U.S. were using BIM, and 51% of mechanical
contractors were using BIM on projects. The study also revealed varying degrees of BIM
High
I. Price Based
II. Best Value Approach
IV. Unstable Market
III. Negotiated-Bid
Buyer directs vendors
All vendors are the same
Lowest price wins
Minimum standards
No accountability
Low performance is acceptable
Identify and utilize expertise
Transparency
Language of metrics
Value of expertise increases
Lower cost and high quality
Perceived Competition
Per
form
an
ce
Low
High
Minimized competition
Long term
Relationship based
Vendor selected based on performance
Utilize Expertise (No Thinking)
Manage, Direct and Control (Influence)

Current BIM Practices Amongst MEP Contractors and Suggestions for Improvement
~ 79 ~
implementation, which could create inconsistencies between trades. BIM use was higher in
larger companies as compared to smaller ones. The team also measured the level of expertise of
BIM users and found that 59% considered themselves to be experts in BIM, while 41%
considered themselves as beginners. Figure 1 illustrates the relationship between BIM experts
compared to those considered as novice-users.
MEP systems coordination involves establishing critical locations for components of systems in
overfilled spaces not only to avoid obstructions but also to meet the necessary design,
construction, and operations criteria. The process of MEP systems coordination provides
opportunities to improve on project performance by an integrated approach (Tatum & Korman,
1999). There are, however, some areas of improvement in current practice that still exists today.
In Tatum and Korman’s study, the team sought to shorten and reduce the cost during design and
coordination phases. They also sought to develop and implement a tool which would assist in the
coordination of design input between MEP trades on complex projects.
Figure 1: A Comparison of BIM Levels of Expertise (Hanna, Boodai & Asmar, 2013).
Multiple software tools exist today, which are used in combination with BIM during both
preconstruction and construction phases (Kensek, 2014). Typical modeling software includes
Revit, AutoCAD and Autosprink VR, illustrated in Figure 2 below. BIM is typically depicted as
the solution to team collaboration and coordination within the industry. However, according to
Dossick and Neff (2010), this is not enough in creating project collaboration as MEP detailers
were not only uncertain about the digital information they received, but they also felt the need to
rely upon formal means of communication, separating them from those who contained the
necessary information. Additionally, the general contractor typically takes the lead on MEP
project collaboration and coordination; however, most MEP contractors believe their specialty
trades should take the lead during the modeling coordination process. According to Khanzode
(2008), for BIM technologies to reach its full potential, an integrated approach is required. It is a
vital element because it promotes collaboration between owner, architect, engineer, and key
trades. This is not possible with the traditional Design-Bid-Build delivery method given key
personnel cannot partake in the process early on given the contractual constraints.

Current BIM Practices Amongst MEP Contractors and Suggestions for Improvement
~ 80 ~
Figure 2: BIM Software Utilized by MEP Contractors (2013).
According to Kensek (2014), some common uses of BIM include, but not limited to:
• Project scheduling
• Construction sequencing
• Constructability analysis
• Quantity take-off
• Estimating and cost planning
• Visual presentations
• Clash detection
Clash detection is a method of identifying and inspecting interference in a three-dimensional
project model. It is perhaps one of the most mentioned uses of BIM within MEP contracting.
While clash detection was shown to produce the most value amongst MEP trades (Hanna,
Boodai, Asmar, 2013), it can also create multiple issues. When a large number of clashes are
detected, it is more challenging to decipher results; this makes it harder to find high-risk clashes
(Kensek, 2014). Prior to BIM technologies, clash detections transpired on the construction job
site. It also involved overlapping two-dimensional drawings to examine clashes. This method
was deemed ineffective and costly (ACD, 2012).
Collaboration and Project Performance
According to the BVA, performance increases when management, direction, and control (MDC)
is minimized. Kashiwagi (2018) asserts that collaboration leads to MDC. When parties
collaborate, the primary goal is knowledge transfer. If parties disagree, the only option is
management and enforcement. Other researchers support this idea, proposing that collaboration
increases the complexity of projects (Norton Rose Fulbright, 2017).
BVA minimizes collaboration and MDC by encourage expert vendor participation in project pre-
planning stages. Before a project begins, the vendor will define the scope of work, create a risk
mitigation plan, and create a detailed milestone schedule. Next, the client can clarify the
vendor’s plan by asking questions. This permits the vendor to plan the project without being
controlled by the vendor.

Current BIM Practices Amongst MEP Contractors and Suggestions for Improvement
~ 81 ~
Through the duration of the project, BVA requires vendors to maintain a Weekly Risk Report
(WRR) and a Director’s Report (DR). These documents provide high-level, non-technical
performance metrics regarding risks, schedule, and cost deviation. The WRR summarizes
performance of individual projects while the DR compiles information from multiple WRRs
from different contractors and projects. Clients and other stakeholders can view these documents
to gain a clear understanding of the current conditions of the project.
Kashiwagi (2018), proposes that WRR/DR increase performance and cost savings because it
reduces time and resources spent on administration and communication. On the other hand, any
efforts that increase collaboration require more people, communication, clarification, and
administration.
Integrating BIM and the Best Value Approach
The critical function of BVA is to ensure that clients utilize vendor expertise throughout the
duration of the project (procurement and delivery). BVA minimizes the need for collaboration
because it increases transparency along the supply chain. This allows non-expert clients to
understand the performance and end deliverables of complex projects.
MEP trades depend on BIM because it is a simple modeling tool that allows non-experts to see
the deliverables of MEP projects and estimate how they might impact other components of
construction. As technology progresses, BIM (and other similar software) will become more
advanced and ubiquitous in the MEP industry (NBS, 2016). This technology can improve the
efficiency of expert vendors and reduce communication among stakeholders. Risk may occur
when non-expert clients use this technology to manage, direct, and control expert vendors.
The BVA creates an environment that eliminates any MDC of expert vendors. By first
implementing BVA, MEP vendors can use BIM more efficiently without incurring additional
project risk. This will enable BIM to achieve the following:
• Create more transparency between clients and vendors.
• Allow MEP vendors to improve pre-planning and projections.
• Allow MEP to improve information management on project sites.
• Pave the way for system-automation and more advanced technology.
BVA Case Studies
The BVA has been tested through over 2,000 industry-based case studies. The authors have
selected several case studies that showcase how BVA decreases collaboration but maintains
high-performance.
US Army Medical Command
The United States Army Medical Command (MEDCOM) is a hospital construction organization
that that struggled with poor project performance. MEDCOM manages the construction,

Current BIM Practices Amongst MEP Contractors and Suggestions for Improvement
~ 82 ~
maintenance, and repair/renewal of over 26 medical facilities in the United States, servicing over
5 million soldiers (active, retired, and their relatives) and civilian employees (U.S. Army
Medical Department 2008).
From 2005 to 2012, MEDCOM implemented the BVA on 600+ projects (Kashiwagi et al., 2009,
Rivera, 2017). In that time, MEDCOM managed each project with an individual WRR, and
compiled the data using a DR. In 2009, the MEDCOM group increased their performance:
instead of 25% of projects delivered on time and 25% of projects deliver on budget, 40% were
on time and 67% were on budget (Kashiwagi, et al., 2009)
Large Environmental State Agency
The State Agency is one of the largest environmental regulators in the United States (over 400
employees) that manages various water, air and waste contaminants and pollutions in the State’s
environment. Over the last decade, the State Agency has had difficulty with performing their
environmental professional services and has become increasingly dissatisfied. The major
difficulties upper management identified was the following (Rivera, 2017):
1. Unable to identify performance and value of vendors (environmental experts).
2. Vendors were not meeting the quality expectations of the State Agency.
3. Management requirement of the vendors was too high.
4. Inability to spend all available resources.
The State Agency identified that the biggest impact was coming from its $7 milllion department,
Waste (WD). The WD was responsible for over 50 sites and 10 seprate vendors on the indefinite
delivery indefinite quantity contract.
From 2015 to 2017, the State Agency tested the BVA in the WD on 194 projects [$21M budget],
with 8 internal project managers. To minimize collaboration and confusion, upper management
required each of their project managers to manage their projects using the WRR. Each week it
was compiled into a DR and upper management would clear up any confusion in a weekly
project management meeting. Overall, the results reported were:
• Cut the procurement cost by $95K in the first year.
• Client could spend 100% of its budget (minimized risk of not receiving funding from
governor’s office).
• All projects were delivered on time and on budget.
• PMs received 36% more work from vendors.
• PMs work capacity increased by 71%.
• Minimized late invoices from 15 to 0, and reduced invoice discrepancies from 37% to 19%.
• Acceptance of the BVA by vendors increased on average by 23%.
• State Agency customer satisfaction increased by 28%.

Current BIM Practices Amongst MEP Contractors and Suggestions for Improvement
~ 83 ~
Additional Case Studies
Besides the case studies discussed above, the authors have identified additional studies that also
suggest that BVA improves performance while minimizing collaboration (Rivera, 2017; PBSRG,
2018; Kashiwagi, 2018):
1. State of Minnesota testing on 400+ projects (2006-2010) show the vendor caused less than
1% of project cost and time deviation.
2. Dutch fast track projects (2009-2013) show that non-expert owner stakeholders caused over
90% of time and cost deviations.
3. State of Hawaii testing on 96+ projects (1998-2001) showed that vendors caused less than
1% of the risk on maintenance projects
Research Findings and Conclusion
The most common usage of BIM among MEP projects is for project planning and estimation.
However, these activities create more collaboration, such as clients using BIM as a method to
communicate and manage vendors. The BVA reduces these issues by leveraging vendors’
expertise. The authors have identified multiple longitudinal cases which validate the potential
impact of the BVA to BIM.
While BIM may be a very effective analysis and pre-planning tool for MEP specialists, it cannot
increase the expertise of non-experts. Collaboration creates an environment in which non-experts
share their opinions and tell expert vendors what to do, thus devaluing expertise. The Best Value
Approach (BVA), proposes that project performance increases when clients can utilize the
expertise of vendors. This system minimizes collaboration, communication, and management of
vendors. BVA can offer a simple solution that allows MEP specialties to use BIM without the
need of collaboration. Under this system, BIM can create more transparency, improve pre-
planning, improve information management, and allow for more technological advancements.
The authors propose that when experts use BIM, it will improve project performance. When non-
experts use BIM, it will increase risk. The authors recommend additional research to test the
usage of BIM in a Best Value environment.
Current BIM Practices Amongst MEP Contractors and Suggestions for Improvement
~ 84 ~
References
Association of Construction and Development. (2012). Clash Detection in BIM Modeling. Association of
Construction and Development. Retrieved from:
http://www.associationofconstructionanddevelopment.org/articles/view.php?article_id=10780
Dossick, C., Neff, G. (2010). Organizational Divisions in BIM-Enabled Commercial Construction. Journal of
Construction Engineering and Management.
Hanna, A., Boodai, F., Asmar, M.E. (2013). State of Practice of Building Information Modeling in Mechanical and
Electrical Construction Industries. Journal of Construction Engineering and Management.
Jones, S., Laquidara-Carr, D. (2016). New Survery Reveals How GCs, CMs andSubs Engage with BIM. Troy, MI:
Engineering News Record. Retrieved from: http://www.enr.com/articles/39935-new-survey-reveals-how-gcs-
cms-and-subs-engage-with-bim
Kashiwagi, D. (2016). 2016 Best Value Approach. Tempe, AZ: Arizona State University.
Kashiwagi, D. (2018). “How to Know Everything Without Knowing Anything Vol.2”, Performance Based Studies
Research Group, Mesa, AZ. Publisher: KSM Inc., 2018.
Kashiwagi, D. (2018a). How FMs can Change the Project Management in Organization, International Facilities
Management Association, World Workplace Conference 2018.
Kashiwagi, J. S., Malhotra, N., Luna, E., Kashiwagi, D. T., & Sullivan, K. T. (2009). Creating organizational
change: Minimizing client generated construction inefficiencies at the US army medical command. In
Construction Research Congress 2009: Building a Sustainable Future (pp. 370-379).
Kensek, K.M., (2014) Building Information Modeling. New York, NY: Routledge.
Khanzode, A. (2008). Benefits and Lessons Learned of Implementing Building Virtual Design and Construction
(VDC) Technologies for Coordination of Mechanical, Electrical, and Plumbing (MEP) Systems on a Large
Healthcare Project. Journal of Information Technology in Construction.
Logan, S., Jackson, Q., Hainsworth, J. (2014). Building Information Modeling (BIM). Melbourne, Australia:
Aurecon Group. Retrieved from: http://www.aurecongroup.com
McGraw Hill (2013). Green BIM: How Building Information Modeling is Contributing to Design and Construction.
SmartMarket Report. Retrieved from:
https://www.construction.com/market_research/freereport/greenbim/MHC_GreenBIM_SmartMarket_Report_2
010.pdf
NBS, (2016). “National BIM Report 2016”. National Building Specifications. April 14, 2016
PBSRG. (2018). Performance Based Studies Research Group Internal Research Documentation, Arizona State
University, Unpublished Raw Data.
Rivera, A. (2017). Dissertation, Ph.D. “Shifting from Management to Leadership: A Procurement Model Adaptation
to Project Management.” Arizona State University.
Sullivan, K., Lines B., Stone, B., Stewart, B., Warren, H. (2012). Change Management Principles: Best Value
Implementation Case Study. Tempe, AZ: Arizona State University.
Young, N.W., Jones, S.A, Bernstein, H.M. (2008) Building Information Modeling (BIM) – Transformaing Design
and Construction to Achieve Greater Industry Productivity. SmartMarket Report.

Journal for the Advancement of Performance Information and Value Vol.10 I.2
December 2018
© K S M , I n c | 85
Construction Portfolio Performance Management Using Key
Performance Indicators
Mohsen Shahandashti (PhD, P.E.)
University of Texas - Arlington
Arlington, Texas, United States
Baabak Ashuri (PhD, DBIA)
Georgia Institute of Technology
Atlanta, Georgia, United States
Ali Touran (PhD, P.E.)
Reza Masoumi (PhD)
Northeastern University
Boston, Massachusetts, United States
Edward Minchin (PhD, P.E.)
University of Florida
Gainesville, Florida, United States
The purpose of this study is to determine the relative importance of key results areas (KRAs) and
develop key performance indicators (KPIs) for construction portfolio performance management.
The research methodology consists of the following steps: (1) Designing and conducting a fact-
finding survey of owners and contractors to determine the relative importance of KRAs; (2)
Designing and conducting structured interviews to develop KPIs; and (3) Assessing the usefulness
of the results. Unlike the literature that has consistently highlighted the importance of risk
management for construction portfolio performance management, risk management is not among
top five KRAs (schedule, cost, cash flow, change management and safety) identified in the survey.
This represents the significant gap in how research community and industry look at portfolio
performance management. When it comes to dashboard development, contractors and owners
have different KRAs within their dashboard for portfolio management. The limited knowledge
about the relative importance of KRAs is one of the most important barriers towards managing
project portfolios. This study is the first attempt to critically examine the literature and practice of
construction portfolio performance management in order to highlight noteworthy differences
between KRAs studied by the research community and implemented by the industry.
Keywords: Construction portfolio performance, Key performance indicator, Key results area.
Introduction
The practice of managing multiple projects in the construction industry is increasing in
popularity. This growth allows organizations to maximize the use of their limited resources.
Portfolio management (or program management) enables executives to focus on long-term
strategic goals and address enterprise-level needs. Managing portfolios of small- to mid-sized
projects provides unique benefits and opportunities in several management areas, such as
strategic planning and risk management (Masoumi and Touran 2016; Ashuri and Tavakolan
2015; Ashuri and Tavakolan 2012; El-Adaway and Kandil 2009; Touran 2009; Veshosky 1994).
However, the benefits of managing projects at the portfolio level come with challenges that
should be addressed appropriately to take full advantage of the potential opportunities and
achieve companies’ strategic goals. The limited knowledge about the relative importance of key
results areas (KRAs) is the most important barrier towards managing project portfolios. In
addition, key performance indicators (KPIs) should be identified and used within proper
dashboards to support the management of a portfolio of construction projects. These key
performance indicators are selected from key results areas that show the importance of key

Construction Portfolio Performance Management Using Key Performance Indicators
~ 86 ~
results areas. The identification of top KRAs and development of KPIs pave the way to develop
effective dashboards for KRAs.
Most research studies on construction portfolio management have focused on the areas of risk
management, financial management, and resource management. In the area of risk management
for multiple construction projects, Kangari and Riggs (1988) investigated the difficulties in the
practical application of the portfolio theory in construction. Touran (2009) developed a
mathematical model to evaluate how the increase in the confidence level in probabilistic risk
assessment of multiple construction projects impacts budgets. El-Adaway and Kandil (2009)
developed a technique for calculating the portfolio insurance premium. Masoumi and Touran
(2016) developed a framework to help organizations form their project portfolios considering the
organizational strategic goals and risk tolerance level. Ashuri et al. (2018a, b) developed a risk
management system for the Georgia Department of Transportation.
In the area of financial management for multiple construction projects, Kim and Liu (2007)
developed a cost-based project model that is suitable for managing multiple construction
projects. Kishore et al. (2011) and Kaka and Lewis (2003) developed cash flow forecasting
models for a portfolio of construction projects. El-Abbasy et al. (2012), Elanouzi and Abido
(2011), and Elanouzi (2009) developed finance-based scheduling for multiple projects to
minimize cash flow deficit risk in financial management of construction project portfolios.
In resource management for multiple construction projects, Chen and Shahandashti (2009)
created hybrid genetic and simulated annealing algorithms for scheduling multiple construction
projects with multiple resource constraints. Genetic algorithm and simulated annealing have also
been individually developed for scheduling multiple construction projects with multiple resource
constraints (Tavakolan and Ashuri 2012a, b, c; Tavakolan et al. 2011a, b; Chen and Shahandashti
2008; Chen and Shahandashti 2007a, 2007b, 2007c). Cheng et al. (2006) focused on
organizational human resource planning for multiple projects. They created a team-based human
resource planning method that includes four phases: process reengineering, data preparation,
human resource allocation, and simulation. Resource management for multiple construction
projects is also briefly assessed in a few research studies that focus on construction program
management (Shehu and Akintoye 2010; Shehu and Akintoye 2009; Shehu and Akintoye 2008).
For example, Shehu and Akintoye (2008) list resource allocation and resource control as required
skills and competencies for managing multiple projects. Finally, Blomquist and Müller (2006)
conducted a study for the Project Management Institute (PMI) to determine the middle
managers’ roles and responsibilities in portfolio management. Although they identified several
roles and responsibilities of middle managers in successful companies, they did not focus on
portfolio performance management using KPIs in the context of the construction industry.
Despite the wide recognition of the critical role that construction performance management using
KPIs plays in success of construction projects (Kumaraswamy and Thorpe 1996; KPIs Working
Group 2000; Chan et al. 2004; Ramirez et al. 2004; Yu et al. 2007), only a few studies have
focused on construction portfolio performance management using KPIs (e.g., Suk et al. 2012;
Alvarado et al. 2004). Construction performance management refers to not only the process of
monitoring past performance but also the process of improvement of individuals and teams

Construction Portfolio Performance Management Using Key Performance Indicators
~ 87 ~
within a construction organization (Bernold and AbouRizk 2010). It includes measures of self-
measurement and value-added processes (Bernold and AbouRizk 2010).
Suk et al. (2012) created a performance dashboard for a pharmaceutical project benchmarking
program. They used a relative comparison method and weighted KPIs to generate an overall
performance score at the project and portfolio levels. The overall project performance was a
combined score of four performance categories: cost, schedule, quality, and dimension.
Alvarado et al. (2004) proposed a method to assess schedule performance and budget
performance for construction portfolios. They proposed a dashboard system for assessing the
performance of portfolios. They also displayed weighted schedule performance and budget
performance for a portfolio of construction projects. The earned value was the basis for
weighting.
Therefore, past research efforts in the area of construction portfolio management mostly focused
on financial management, risk management, and resource management with emphasis on
portfolio prioritization tools and techniques, and not on the performance management. In the rare
studies focused on construction performance management, the developed methodologies are
either too complex for industry application or too specific to an industry sector or a performance
area. Most importantly, these studies do not provide any insights into the relative importance of
KRAs for construction portfolio performance management. Overall, the limited knowledge about
the relative importance of KRAs inhibits our capabilities to develop effective dashboards where
KRAs are necessary. The emphasis of the research is to focus on the projects that are already
selected and assigned to a specific portfolio and strive for identifying KRAs and developing
KPIs that are applicable to current industry practice.
The objective of this study is to determine the relative importance of KRAs for construction
portfolio performance management and develop KPIs to measure construction portfolio
performance in KRAs. In the context of this research, a portfolio is defined as a group of related
or unrelated projects and programs managed by a single individual. This definition was arrived at
after discussions within the research team including representatives from nine owners and eight
contractor organizations. Survey and interview results are discussed after the research
methodology is described in the next section. KPIs are developed after the survey and interview
results are analyzed. The usefulness of the results is assessed before conclusions are provided.
The usefulness of findings of this study was assessed through a survey that was distributed
among industry experts. The reviewers were asked to rate the usefulness of the results on a scale
of 1 (not useful) to 10 (very useful).
Research Methodology
The research methodology consists of the following steps: (1) Designing and conducting a fact-
finding survey of capital project owners and contractors to determine the relevant importance of
KRAs; (2) Designing and conducting structured interviews with selected firms to develop KPIs;
and (3) Assessing the usefulness of the results.

Construction Portfolio Performance Management Using Key Performance Indicators
~ 88 ~
Following a thorough literature and background review, the research team including both
academic and industry members (nine owners and eight contractors) investigated and discussed
the gaps in knowledge. The research team identified assessing the relative significance of KRAs
as one of the main limitations of the current literature in construction portfolio performance
management.
The identified gap in knowledge was used as the focus of developing survey questions. The
survey questionnaire research method was used to review state-of-practice with respect to
portfolio management in the U.S. construction industry. Considering the objectives of this study
a survey questionnaire was designed to understand differences in portfolio performance
management practices as utilized by owners and contractors of major capital projects in the U.S.
Within each section, the survey respondents were required to identify, and rate statements based
on their importance and expand responses if it was deemed appropriate. The main goal of the
authors in the survey design was to achieve a sufficient level of rigor. Thus, every attempt was
made to avoid general arguments and include well-explained statements that had grounds in the
academic or professional portfolio management literature.
The industry members of the research team examined the adequacy and overall reasonableness
of survey questions. In addition, the developed survey was pilot tested by five industry
professionals who are knowledgeable about portfolio management. Based on the feedback from
these individuals, minor modifications were made to the survey terminology or statements with
the potential to deviate the respondents from the survey objectives. The final survey was
distributed in an online format through e-mail to experts in the U.S. construction industry.
The online survey was conducted using SelectSurvey™. Every effort was made to increase the
rate of response. In addition to Construction Industry Institute (CII) members, the Construction
Management Association of America (CMAA) was contacted to reach their membership. Both
CII and CMAA members were contacted to get sector-independent results that are relevant to the
construction domain and not specific to only capital projects or general building. The CMAA
leadership helped to reach their membership and encouraged their members to respond to this
research effort. The team also contacted the members of the Construction Users Round Table
(CURT). In total, 306 emails were sent to individuals in 251 organizations. The research team
through follow-up emails contacted the recipients and encouraged them to respond.
The survey also served as the screening tool for selecting the potential firms for in-depth follow-
up interviews. The structured interview research method was employed to develop a set of
effective KPIs for construction portfolio management. The interviews engage the interviewees in
active conversation and enable documentation of intriguing arguments on various aspects of
implementing portfolio performance management in the U.S. construction industry, specifically
main KPIs used in the portfolio dashboards.
The goal of the interview process was to engage subject matter experts on identifying common
KPIs for managing the performance of the construction portfolio. The responses to the survey
were analyzed to identify firms with noteworthy practice in construction portfolio performance
management for conducting follow-up interviews. Willingness and cooperation of the firms,
diversity in the industry sector, and geographical location were also considered in selecting firms

Construction Portfolio Performance Management Using Key Performance Indicators
~ 89 ~
for an interview. The interview questions were prepared in collaboration with the industry
members of the research team. The developed interview template was pilot tested with three
subject matter experts with expertise in developing KPIs for construction portfolio. Based on the
feedback from these individuals, minor modifications were made to the interview questions to
enhance the clarity of questions and align them with the overall goal of the research.
Analysis of survey results
The research team developed and conducted an online survey with the purpose of determining
the relative importance of KRAs for construction portfolio performance management. Another
purpose of the survey was to help in screening and identifying the most appropriate firms for in-
depth face-to-face interviews to develop KPIs for construction portfolio performance
management. The response rate was about 45% of email recipients and 36% of organizations.
These rates compare favorably with similar data collection efforts using online survey tools
(Hamilton 2009; Nulty 2008). 139 individuals from 90 firms responded to the survey.
Descriptive information of the responding firms
Slightly over half of those responded to the survey (approximately 59%) categorized themselves
as owners. The roles of those responded to the survey can be categorized as project manager
(12.2%), program manager (10.1%), portfolio manager (12.2%), project director (11.5%), project
controls manager (9.4%), and others (44.6%). The roles of individuals as “others” participating
in the survey are typically related to the top managerial hierarchy in their firms/organizations.
The roles of individuals as “others” include director of capital project management, manager of
project management and controls, and engineering manager.
Figure 1 shows the percentage (number) of surveyed firms in each industry sector. More than
half of those surveyed are engaged in heavy industrial construction. Several of the organizations
surveyed are engaged in more than one sector of the construction industry; hence the percentages
sum to well over 100. Approximately 97% of those surveyed work for an organization where
people managing a group of projects.

Construction Portfolio Performance Management Using Key Performance Indicators
~ 90 ~
Figure 1: Percentage of Firms in Each Industry Sector.
Most organizations do not assign more than ten projects to one individual; 35.6% of
organizations assign less than six projects to an individual, and 18.4% of organizations assign
between 6 to 10 projects to a single manager. Almost half of those surveyed (46%) work for
organizations with portfolios of over $50 million. Only 8% of those surveyed work for
organizations with portfolios of less than $5 million. Over three-quarters of respondents (76.8%)
work for organizations where a typical project in a portfolio has a duration of longer than one
year, while about one-third (32.6%) have projects that are typically over two years in duration.
The relative importance of KRAs for construction portfolio performance management
Approximately 81% of respondents reported that their firms use metrics to measure and monitor
the performance of projects at the portfolio level. The performance of projects refers to the
performance in one of the following areas: schedule, cost, cash flow, procurement, resource
allocation, communication, quality, scope, change management, safety, and risk management.
Surprisingly, cost, schedule, cash flow, change management and safety are the top five areas in
which both contractors and owners use metrics for measuring the performance of projects at the
portfolio level (Figure 2). This represents the significant gap in how research community and
industry look at portfolio performance management. It should be noted that inherent risk (Kim
and Reinschmidt 2009) might be involved in the top five KRAs. For instance, risk analysis is
typically conducted in conjunction with scheduling and cost management. KPI category in
Figures 2, 3, and 4 refers to those metrics that show the performance of a company in achieving
business objectives. KPIs show how effectively a company achieves its key business objectives.
KPIs are different from project-level performance metrics, such as schedule and cost metrics.
KPIs, such as Return on Investment (ROI) and several new customers, are not project-level
metrics but company-level performance measures.

Construction Portfolio Performance Management Using Key Performance Indicators
~ 91 ~
Figure 2: Statistics on Metrics in Diverse Areas for Measuring Performance of Projects in a
Portfolio.
Figure 3 shows areas where firms need to improve metrics at the portfolio level. While the
schedule is the top area that contractors underlined the need to improve metrics, resource
management is the top area that owners highlighted the need for improvement.
Figure 3: Statistics on Areas that firms Need to Improve Metrics at the Portfolio Level.
Approximately 60% of those questioned reported that their company uses a dashboard or
scorecard to monitor the performance of portfolios. Cost and schedule are the top two areas for
which contractors and owners have metrics within their dashboards (Figure 4). Besides cost and
schedule, contractors chose change management as the third top area where they use metrics,
while owners chose safety and cash flow as the third and fourth top areas for the use of metrics.

Construction Portfolio Performance Management Using Key Performance Indicators
~ 92 ~
Figure 4: Statistics on Areas that Metrics Included in the Scorecard/Dashboard.
Analysis of interview results
The online survey data were analyzed for selecting a subset of surveyed firms for structured
interviews. The purpose of the interviews was to develop effective KPIs for construction
portfolio performance management. Therefore, 15 firms with construction portfolio performance
management were selected for structured interviews. Willingness and cooperation of the firms,
diversity in the industry sector, and geographical location were also considered in the selection
of the 15 firms. Based on the answers to six questions in the survey, a score of 0, 5 or 10 was
assigned to each response and the firms with a total score of 40 or higher (out of a possible 60)
were shortlisted for the structured interview. The shortlisted roster consisted of 32 firms. Finally,
15 firms were selected considering the success in portfolio management, willingness and
cooperation of the firms, diversity in the industry sector, and geographical location.
Descriptive information of the interviewees
Table 1 shows the breakdown of the interviewed firms based on industry sector. It also shows
whether they can be categorized as owners or contractors.

Construction Portfolio Performance Management Using Key Performance Indicators
~ 93 ~
Table 1: Breakdown of the interviewed firms. FIRMS Owner Contractor Government Non-Government Infrastructure Building Heavy Light
1 ✓
✓
✓
2 ✓
✓
✓
3 ✓
✓
✓
4 ✓
✓
✓
5 ✓
✓
✓
6 ✓
✓
✓
7 ✓
✓
✓
8 ✓
✓
✓
9 ✓
✓
✓
10 ✓
✓
✓ ✓ ✓ ✓
11 ✓
✓
✓ ✓ ✓
12 ✓
✓
✓
13 ✓
✓
✓ ✓
14 ✓
✓
✓
15 ✓
✓
✓
12 3 4 11 3 4 10 4
About half of the interviewees (7 out of 15) have more than 50 projects in their portfolios at top
level. This implies that interviewees belonged to larger firms in comparison to the average firm
that responded to the survey because the online survey (previous section) indicated that the most
common case was where the number of projects in the portfolio was “less than 6”. The majority
of firms (13 out of 15) have projects with typical durations above 12 months within their
portfolios. Figure 5 shows the number of firms using metrics in different areas for portfolio and
project management. As shown in Figure 5, there are at least three firms in each key result area
that facilitated the development of KPIs.
Figure 5: Number of Firms Using Metrics in Different Areas for Portfolio and Project
Management.

Construction Portfolio Performance Management Using Key Performance Indicators
~ 94 ~
KPIs for construction portfolio performance management
All the interviewed firms have some types of KPIs to measure portfolio management success.
Some of these KPIs (e.g., number of milestones completed) can be readily calculated by rolling
up project information to the portfolio level while others (e.g., bid amounts as a percentage of
engineering estimates) are more complicated. Parameters that roll up from the project level to the
portfolio level are safety indicators, average number of change orders, cost related metrics (e.g.,
cash flow target achievement rate, actual versus planned cost, annual and total portfolio budget,
return on investment, percentage of projects to be finished under the budget, percentage of on-
time payments to contractors, percentage of planned cost for the current year expenditure,
percentage of authorization for expenditure spent on completed projects), and schedule related
metrics (e.g., number of actual versus planned milestones achieved during a specific period,
percentage of projects completed on time). A few firms use more complicated KPIs that are
related to predictability, performance, competitiveness, productivity, and quality. It should be
noted that there is a concern by most firms that too many KPIs hinder decision-making. There is
a trade-off between the comprehensiveness and simplicity for managing a portfolio of
construction projects. Although more KPIs may provide more comprehensive awareness about
the status of construction portfolio in multiple dimensions, the complexity of having too much
information may hinder decision making considering the limited cognitive capabilities of
decision makers. Although information included in KPIs are important, the most important
information included in a few KPIs should be highlighted through prioritization of the KPIs.
Therefore, the number of KPIs should be limited to those that are absolutely required.
The fact-finding surveys and the follow-up interviews yielded a number of KPIs used by owners
and contractors for portfolio performance management. Table 2 presents the KPIs that are
recommended to help portfolio managers determine what to measure to improve performance in
each KRA.
Table 2: Recommended KPIs for KRAs at the Portfolio Level KRAs Suggested KPIs
Schedule • Number/ percept of milestones completed (or missed) vs. planned
• Number/ percent of projects on (or behind) schedule
• Total/ average days ahead of (or behind) schedule
• Schedule durations compared to benchmarks (average for portfolio)
• Number/ percent of projects with schedule durations longer (or shorter) than benchmarks
Cost/
Cash Flow
• Actual cost-to-date and revised forecast vs. planned (monthly and cumulative)
• Cost variation (monthly and cumulative) – at project and portfolio level
• Estimated completion cost vs. original/ current budget
• Number/ Percent projects within (or over) budget
• Total portfolio cost vs. budget
• Project cost estimates vs. benchmarks (average for portfolio)
• Number/ percept projects with costs higher (or lower) than benchmarks
Safety and
Environment
• Safety and environmental incidents (first aids, recordable injuries, days-away-from-work injuries, spills,
releases, etc.)
• Incident frequency rates
• 12-month rolling average of incident rates
• Number of environmental permits outstanding
• Near misses (a near miss is an event that could potentially result in damage, injury, or illness, but it did not.)
• Proactive safety activities (documented audits, job safety analyses, hazard identifications, etc.)

Construction Portfolio Performance Management Using Key Performance Indicators
~ 95 ~
Change
Mgmt./
Scope
• Number of requests for information (RFIs)
• Total number of scope changes
• Total cost of scope changes/ change orders
• Total changes as percent of original approved budget
• Total value or percentage of estimate omissions
Resource
Allocation
• Project team member turn-over
• Planned vs. actual engineering/ construction hours
• Planned vs. actual resources (human resources (full-time employees), equipment, etc.)
• Capital efficiency (value of projects managed) per project manager
• Percent utilization of resources (e.g., project team members, equipment)
Proc./Supply-
Chain
• Actual vs. planned number of purchase orders/ contracts issued
• Number/ percept of late deliveries
• Bid amounts as percentage of engineering estimates
• Locally-sourced (high value offshore, minority participation, etc.) as percentage of total procurement
Quality • Average project definition rating index (PDRI) score at project funding (or earlier stage gates) (as a
potential leading indicator of project quality)
• Number of defects (welds, test failures, etc.)
• Percentage of rework
• Number/ percent of projects completed with (or without) significant issues
• Number of deficiencies open for more than target resolution period
Risk Mgmt. • Summary/ status of known risk issues and mitigation plans
• Risks mitigation actions completed for the reporting period
• Risks eliminated (or unrealized) during the reporting period
• New or emerging risks identified during the reporting period
Client
Satisfaction,
Other
• Customer satisfaction index
• Training and development status
• Number (or Percentage) of projects in each project stage
• Overall portfolio performance index = Number of Successful Completed Projects ∗/Total Number of Projects Planned to be Completed
*Success is defined by meeting predetermined schedule, cost, safety, and operability targets
• Number or percent of projects in each project phase
The portfolio dashboard will have a limited number of simple, easy-to-understand, objective
KPIs but with enough underlying detail to allow portfolio managers to drill down to specific
projects. Portfolio managers need to carefully consider what KPIs actually measure as tracking a
single KPI may lead to the wrong conclusions. For example, measuring overall cost performance
by totaling actual cost versus planned (e.g., $200M actual cost versus $250M planned cost) for
the entire portfolio can be misleading even when the numbers appear to be comparable if a
number of projects are grossly overspending and others have not made progress at all. Using this
KPI in conjunction with one that measures the percentage of projects that are within +/- 10% of
their planned costs (e.g., 95% of projects within +/- 10% of their planned costs) would give a
much better picture of overall cost performance. In this case, two KPIs are better than one.
Another consideration is which KPIs to trend over time. Trending KPIs is typically used to
determine whether or not performance improvement actions have been effective.
There are various methods that firms use to communicate the performance of their portfolios. On
one end, there is a firm that merely reviews the performance in monthly meetings with the
director. On the other end, there are firms having established databases, written reports, and
dashboards for reporting and communicating the portfolio performance.

Construction Portfolio Performance Management Using Key Performance Indicators
~ 96 ~
Dashboards for construction portfolio performance management
A performance dashboard can be defined as “a multilayered application built on business
intelligence and data integration infrastructure that enables organizations to measure, monitor,
and manage performance more effectively” (Eckerson 2006). Dashboards could be used to
effectively communicate performance of portfolios of construction projects (Suk et al. 2012;
Alvarado et al. 2004).
While ten firms use some sort of dashboard to report project performance, five firms do not use
dashboard(s) to communicate portfolio performance in different management areas. Traffic light
dashboards are extremely popular and perceived critical by upper management in most
organizations. A number of companies use traffic light dashboards to report status in a variety of
areas, such as scope, schedule, and cost. The recommended approach is to tie colors to pre-
determined targets. The Red, Yellow and Green colors are generally used; Green = good, Yellow
= caution, and Red = bad conditions of different metrics.
Identifying what KPIs are shown on the dashboard is a critical and challenging task since there
are various groups and stakeholders in one organization that have an interest in the overall status
of a portfolio. The interviewed firms described an ideal dashboard with the following
characteristics: simplicity (too many metrics make the dashboard complicated); consistency in
format (standardization); data integration and interoperability; quantitative representation;
capability of drilling down to specific projects and problems; objective assessment of different
areas in a consistent manner across all projects in the portfolio; transparency; accessibility;
scalability (what layer of information should be provided to who, when, and how?); presentation
of an optimal level of KPIs; effectiveness and usefulness of performance information; and
monthly updating.
Another issue of importance was if the firms use different types of dashboards to report to
different managerial levels. Three firms responded that they do not use the same dashboard for
reporting to various management levels. One of these firms provides customized dashboards
based on the users’ needs at different managerial levels inside their firms while they also have
some standard reports. Another firm provides a specific report for the board of directors, but
other users have the same dashboards. One firm uses the same dashboards, but the access to the
information on the dashboard for each person is different. The metrics are the same; however,
the number of reports in each portfolio level varies.
Figure 6 represents schematic representation of a dashboard for construction portfolio
performance management. This dashboard evaluates project status in several areas, such as cost.
The Red, Yellow and Green method is used in the dashboard (Green = good, Yellow = caution,
Red = bad).

Construction Portfolio Performance Management Using Key Performance Indicators
~ 97 ~
Figure 6: Schematic Representation of a Dashboard for Construction Portfolio Performance
Management
Usefulness of the Findings for the Construction Industry
The usefulness of findings of this study was assessed through a survey that was distributed
among industry experts. The reviewers were asked to rate the usefulness of the results on a scale
of 1 (not useful) to 10 (very useful). A unipolar rating scale was used to assess the usefulness of
the findings by requesting the respondents to evaluate the presence and absence of the usefulness
quality on a scale of 1 (not useful) to 10 (very useful). The reviewers were also asked to include
any comments. The survey helped the research team rigorously evaluate the usefulness of the
findings. Overall, 12 industry experts responded to assess the usefulness of the findings. These
industry experts were affiliated with nine different organizations. It should be noted that the goal
was the solicitation of industry experts’ opinion on the usefulness of the findings (not the data
acquisition with statistical significance).
The findings were considered useful by most of the reviewers. The average rating given to the
usefulness of the findings was 7.2, and the lowest and highest ratings were 5 and 9, respectively.
The findings were considered very informative and well developed. More specifically, Table 2
was considered very helpful. In addition, most of the reviewers liked the KRAs and KPIs. A
reviewer indicated that in reality, “many times we do not have these basic metrics yet and much
of our effort is consumed in getting these items.” Hence, the metrics should be defined and
redefined. The other collected comments are summarized here: “too many KPIs are hard to use
in decision making and rolling up some KPIs could mask meaningful variances that need

Construction Portfolio Performance Management Using Key Performance Indicators
~ 98 ~
attention”, “trending some KPIs has been effective”, providing a common format for data
collection is a must”, and “PMs must own the data”.
Suggested Areas for Research and Development
The suggested areas for further research and development, collected from the survey and
interviews, are summarized as the following:
• Exploring effective portfolio data management.
• The gating process, budgeting process, and benefit analysis components.
• Studying front-end planning tools and applicable front-end metrics available to portfolio
managers in further details.
• Exploring Integrated Project Management Team Approach.
• Identifying different ways to select and create a portfolio from an upper management
perspective.
• Studying the workload assessment tool.
• Explaining the correlation between PDRI and portfolio performance metrics.
• Exploring the need for and studying the impact of expedited approvals and expedited
procurement on the smaller portfolio.
• Discussing engineering as a percentage of Total Installed Cost (TIC) issues.
• Standardizing data exchange between contractors and owners, specifically around data
required to manage the portfolio by owners.
Conclusions
Unlike the literature that has consistently highlighted the importance of risk management for
construction portfolio performance management, risk management is not among top five KRAs
(schedule, cost, cash flow, change management and safety) identified in the survey. This
represents the significant gap in how research community and industry look at portfolio
performance management. The risk management research results have not yet found its way into
the practice of portfolio management in the construction industry. These results also show the
research need to focus further on what found important in the construction industry.
The limited knowledge about the relative importance of KRAs is one of the most important
barriers towards managing project portfolios. This study contributes to the state of knowledge
and practice by examining the literature and practice of construction portfolio performance
management in order to highlight noteworthy differences between KRAs studied by the research
community and implemented by the industry. While schedule is the top area that contractors
underlined the need to improve metrics, resource management is the top area that owners
highlighted in need for improvement. Cost and schedule are the top two areas for which
contractors and owners have metrics within their dashboards. Besides cost and schedule,
contractors chose change management and procurement as the third and fourth top areas, while
owners chose safety and cash flow as the third and fourth top areas for the use of metrics. The
results of the survey and the structured interviews yielded several KPIs, presented in this paper,

Construction Portfolio Performance Management Using Key Performance Indicators
~ 99 ~
to help portfolio managers determine what to measure to improve performance in each KRA.
This research is subject to sample size limitation. Moreover, the usefulness has not been
observed; it has been evaluated based on the perception of industry experts.
Acknowledgments
This material is based upon work supported by the Construction Industry Institute (CII).

Construction Portfolio Performance Management Using Key Performance Indicators
~ 100 ~
References
Alvarado, C.M., Silverman, R.P., and Wilson, D.S. (2004). Assessing the performance of construction projects:
Implementing earned value management at the General Services Administration. Journal of Facilities
Management. 3(1), 92-105.
Ashuri, B., Moradi, A., Baek, M., Kingsley, G., An, H.Y., Zhang, L., Liang, Y., and Bahrami, S. (2018a).
“Enhancement of the Comprehensive Risk Assessment for Transportation Projects.” Georgia DOT
Research Project RP16-28, Georgia Department of Transportation, Atlanta, Georgia, September 2018.
Ashuri, B., Moradi, A., Baek, M., Kingsley, G., An, H.Y., Zhang, L., Liang, Y., and Bahrami, S. (2018b). “Risk
Mitigation Strategies to Enhance the Delivery of Highway Projects.” Georgia DOT Research Project RP16-
40, Georgia Department of Transportation, Atlanta, Georgia, September 2018.
Ashuri, B. and Tavakolan M. (2015). “Shuffled Frog-Leaping Model for Solving Time-Cost-Resource Optimization
(TCRO) Problems in Construction Project Planning.” ASCE Journal of Computing in Civil Engineering,
29(1), 04014026.
Ashuri, B. and Tavakolan, M. (2012). “A Fuzzy Enabled Hybrid Genetic Algorithm‐Particle Swarm Optimization
Approach to Solve Time‐Cost‐Resource Optimization (TCRO) Problems in Construction Project
Planning.” ASCE Journal of Construction Engineering and Management, 138(9), 1065–1074.
Bernold, L. E., & AbouRizk, S. M. (2010). Managing performance in construction. John Wiley & Sons.
Blomquist, T., and Müller, R. (2006). Middle managers in program and project portfolio management: Practices,
roles and responsibilities. Project Management Institute.
Chan, A. P. C., Scott, D., and Chan, A. P. L. (2004). Factors affecting the success of a construction project. Journal
of Construction Engineering and Management. 130(1), 153–155.
Chen, P.H., and Shahandashti, S.M. (2009). Hybrid of genetic algorithm and simulated annealing for multiple
project scheduling with multiple resource constraints. Automation in Construction. 18(4), 434-443.
Chen, P.H. and Shahandashti, M. (2008), Stochastic Scheduling with Multiple Resource Constraints Using A
Simulated Annealing-Based Algorithm, Proceedings of 25h International Symposium on Automation and
Robotics in Construction (ISARC 2008), 447-451, Vilnius, Lithuania, June 27-29.
Chen, P. H. and Shahandashti, M. (2007a), Modified Simulated Annealing Algorithm and Modified Two-Stage
Solution Finding Procedure for Optimizing Linear Scheduling Projects with Multiple Resource Constraints,
Proceedings of international symposium on automation and robotics in construction (ISARC 2007), 411-
416, India.
Chen, P. H. and Shahandashti, M. (2007b), Simulated Annealing Algorithm for Optimizing Multi-Project Linear
Scheduling with Multiple Resource Constraints, Proceedings of international symposium on automation
and robotics in construction (ISARC 2007), 429-434, India.
Chen, P. H. and Shahandashti, M. (2007c), Modified Simulated Annealing Algorithm for Optimizing Linear
Scheduling Projects with Multiple Resource Constraints, Proceeding of 5th international conference of
construction project management / 2nd international conference on construction engineering and
management, p. 151, Singapore.
Cheng, M.Y., Tsai, M.H., and Xiao, Z.W (2006). Construction management process reengineering: Organizational
human resource planning for multiple projects. Automation in Construction. 15(6), 785-799.
Eckerson W.W. (2006). Performance Dashboards. Measuring, Monitoring and Managing your Business. John
Wiley & Sons, New Jersey.
El-Abbasy, M. S., Zayed, T., and Elazouni, A. (2012). Finance-Based Scheduling for Multiple Projects with
Multimode Activities. Construction Research Congress 2012 Construction Challenges in a Flat World.
ASCE, 386-396.
El-Adaway, I. H., and Kandil, A. A. (2009). Construction risks: single versus portfolio insurance. Journal of
Management in Engineering. 26(1), 2-8.
Elazouni, A. (2009). Heuristic method for multi‐project finance‐based scheduling. Construction Management and
Economics. 27(2), 199-211.
Elazouni, A., and Abido, M. (2011). Multiobjective evolutionary finance-based scheduling: Individual projects
within a portfolio. Automation in Construction. 20(7), 755-766.
Hamilton, Michael Braun (2009). Online survey response rates and times. Ipathia Inc./SuperSurvey.
Kaka, A., and Lewis, J. (2003). Development of a company‐level dynamic cash flow forecasting model (DYCAFF).
Construction Management and Economics. 21(7), 693-705.

Construction Portfolio Performance Management Using Key Performance Indicators
~ 101 ~
KPIs Working Group. (2000). KPI report for the Minister for Construction. Department of the Environment.
Transport and the Regions, London.
Kim, C. S., and Liu, L. Y. (2007). Cost information model for managing multiple projects. Journal of Construction
Engineering and Management. 133(12), 966-974.
Kim, B. C., & Reinschmidt, K. F. (2009). Probabilistic forecasting of project duration using Bayesian inference and
the beta distribution. Journal of Construction Engineering and Management, 135(3), 178-186.
Kishore, V., Abraham, D. M., and Sinfield, J. V. (2011). Portfolio Cash Assessment Using Fuzzy Systems Theory.
Journal of Construction Engineering and Management. 137(5), 333-343.
Kumaraswamy, M.M., and Thorpe, A. (1996). Systematizing construction project evaluations. Journal of
Management in Engineering. 12(1), 34–39.
Masoumi, R., and Touran, A. (2016). A Framework to Form Balanced Project Portfolios. Construction Research
Congress. San Juan, Puerto Rico, 1772-1781.
Nulty, D.D. (2008). The adequacy of response rates to online and paper surveys: what can be done? Assessment and
Evaluation in Higher Education. 33(3), 301-314.
Ramirez, R. R., Alarcon, L. F. C., and Knights, P. (2004). Benchmarking system for evaluating management
practices in the construction industry. Journal of Management in Engineering. 20(3), 110–117.
Shehu, Z., and Akintoye, A. (2010). Major challenges to the successful implementation and practice of programme
management in the construction environment: A critical analysis. International Journal of Project
Management. 28(1), 26-39.
Shehu, Z., and Akintoye, A. (2009). Construction programme management theory and practice: Contextual and
pragmatic approach. International Journal of Project Management. 27 (7), 703–716.
Shehu, Z., and Akintoye, A. (2008). Construction programme management skills and competencies: a deeper
insight. The Built & Human Environment Review. 1, 1-17.
Suk, S.J., Hwang, B.G., Dai, J., Caldas, C.H., and Mulva, S.P. (2012). Performance Dashboard for a Pharmaceutical
Project Benchmarking Program. Journal of Construction Engineering and Management. ASCE, 138(7),
864-876.
Tavakolan, M. and Ashuri, B. (2012a). “Comparison of Evolutionary Algorithms in Non-Dominated Solutions of
Time-Cost-Resource Optimization Problem.” The 48th ASC Annual International Conference Proceedings,
Birmingham City University, April 11-14, 2012.
Tavakolan, M. and Ashuri, B. (2012b). “Development of Fuzzy Enabled Shuffled Frog Leaping Algorithm with
Activity Splitting Allowed in Construction Project Scheduling.” 2012 Construction Research Congress,
ASCE, Purdue University, West Lafayette, Indiana, May 21-23, 2012.
Tavakolan, M. and Ashuri, B. (2012c). “Stochastic Optimization of Construction Projects Planning with Genetic
Algorithm” 2012 Construction Research Congress, ASCE, Purdue University, West Lafayette, Indiana,
May 21-23, 2012.
Tavakolan, M., Ashuri, B., Chiara, N. (2011a). “Development of Scheduling with Hybrid Genetic Algorithm-
Particle Swarm Optimization.” 2011 CSCE Annual Conference, 3rd International/9th Construction
Specialty Conference, Ottawa, Canada, June 14-17, 2011.
Tavakolan, M., Ashuri, B., Chiara, N. (2011b). “Applying the Shuffled Frog-Leaping Algorithm to Improve
Scheduling of Construction Projects with Activity Splitting Allowed.” Int. Conference on Mgmt.
Innovation Sustainable Built Envir., Amsterdam, June 20-22, 2011.
Touran, A. (2009). Probabilistic Approach for Budgeting in Portfolio of Projects. Journal of Construction
Engineering and Management. 136(3), 361-366.
Veshosky, D. (1994). Portfolio Approach to Strategic Management of A/E Firms. Journal of Management in
Engineering. ASCE, 5(41), 41-47.
Yu, I., Kim, K., Jung, Y., and Chin, S. (2007). Comparable performance measurement system for construction
companies. Journal of Management in Engineering. 23(3), 131–139.

Journal for the Advancement of Performance
Information and Value Vol.10 I.2 December 2018
© K S M , I n c | 102
Case Study of a Local Government Organization’s IT
Project Implementation
Dean T. Kashiwagi (PhD) and Jacob S.
Kashiwagi (PhD)
Kashiwagi Solution Model
Mesa, AZ, USA
Alfredo O. Rivera (PhD)
Leadership Society of Arizona
Mesa, AZ, USA
The delivery of services to government groups have historically been unsatisfactory. Multiple
studies have identified these services as low performing. Studies have also found that information
communication technology services have been one of the worst performing services over the last
10 years. The Performance Based Studies Research Group (PBSRG) has been testing a delivery
model, called the Best Value Approach, for the last 20 years that can ensure government groups
receive high performing services. The major issue that the BVA approach encounters is it requires
the organization to change their normal way of delivering services. It requires the organization to
minimize their management, direction, and control of the vendors and instead, utilize their
expertise. This paper will review a case study with a local government organization (LGO) and
their issues with trying to apply the BVA to deliver their Peoplesoft software.
Keywords: Case study, Local government, Delivery of services, Procurement, Information
technology, Best Value Approach.
Introduction
Poor Performance of the Delivery of Services
The delivery performance of information technology (IT) services to government groups has
been poor (Institute for Defense Analysis, 2011; US Department of Commerce, 2011; US
Government Accountability office, 2008). According to a study performed by
PricewaterhouseCoopers, only 2.5% of projects in the world are defined as successful (scope,
cost and schedule), and an estimated $4 billion to $12 billion per year is spent to resolve disputes
and claims (Lepatner, 2007; PWC, 2009; Yun, 2013). More unsettling statistics include (MIT,
2003; HR Magazine, 2006; Lepatner, 2007; Yun, 2013):
1. Only 30% of projects are completed within 10% of planned cost & schedule.
2. There is approximately 25 to 50% waste in coordinating labor on an average project.
3. Management inefficiency costs owners between $15.6 and $36 billion per year.
4. Rework by contractors is estimated to add 2-20% of expenses to a contractor’s bottom line.
Information communication technology (ICT) services are one of the worst performing
industries. ICT projects across the world are under-performing. The industry is having difficulty
delivering services on-time, on-budget, with high customer satisfaction. Projects are evolving
into mega-projects, which include multiple stakeholders who cannot effectively work together. It
is common practice for the buyer and the buyer’s project managers tell the expert vendor what to
do from the start of the project. Due to the management, direction, and control of the buyer,

Case Study of a Local Government Organization’s IT Project Implementation
~ 103 ~
expert vendors are in a reactive environment and their expertise is devalued. This has led to poor
project performance globally, especially in the ICT industry.
Delivery of IT projects on time, on budget, and with satisfied customers has been estimated at
15-30% (De Marco, 1982; Dorsey, 2000; Grossman, 2003; IT-Cortex, 2014; Sauer &
Cuthbertson, 2003; Standish Group, 1995). The ICT Industry has a failure rate of 70% on all
projects based on the following survey reports:
1. The OASIG Study (1995).
2. Chaos Report (1995).
3. The KPMG Canada Survey (1997).
4. The Bull Survey (1998).
5. Robbins-Gioia, LLC (2001).
6. The Standish Group Chaos Reports (1995-2011).
McKinsey & Company analyzed over 5,400 projects and reported 50% of IT projects on average
are 45% over budget, 7% over time, 56% less value than predicted and 17% of projects end so
badly they can threaten the life of the company (McKinsey & Company, 2012). IT companies
cannot see what is happening during their projects and are unable to know when they are at risk.
The Business Harvard Review did an analysis of 1,471 IT projects and reported an average cost
overrun of 27%, of which 17% had a failure high enough to threaten the company’s existence,
with an average cost overrun of 200% and schedule overrun of 70% (Budzier & Flyvbergj,
2011). This lack of vision on projects reveals the complexity of the projects and the lack of
expertise by those involved. Venugopal and Suryparakasa’s survey of enterprise resource
planning (ERP) systems reported that 51% of ERP implementations were viewed as
unsuccessful, 46% of the participants noted that while their organization had an ERP system in
place, or was implementing a system, they did not feel their organization understood how to use
the system to improve the way they conduct business (Venugopal and Suryaprakasa, 2011).
The United States has also experienced a high failure rate with IT projects, reportedly spending
billions of dollars on projects which are incomplete, cancelled, or nonfunctional (Kashiwagi and
Kashiwagi, 2014). Notable projects include:
1. The United States Air Force attempt to automate and streamline their logistics operations by
consolidating and replacing over 200 separate legacy systems. This includes projects
cancelled after spending $1.1 billion, incomplete projects and non-functional projects
(Institute for Defense Analysis, 2011; Kanaracus, 2012; United States Senate Permanent
Subcommittee on Investigations, 2014).
2. State of California attempt to merge 13 separate payroll systems into a single system that
served 243,000 employees. It was cancelled after spending $254 million and the project was
determined to be nonfunctional (Chiang, 2013; Kanaracus, 2013).
3. The Census Bureau’s attempted to convert to handheld computers for 2010 census. It was
cancelled after spending up to $798 million, deeming the project as non-functional (Nagesh,
2008; US Department of Commerce, 2011).
4. The IRS continual attempts to update their system from legacy software. Projects cancelled
with over $4 billion spent (Hershey, 1996; Moseley, 2013; Thompson, 2012).
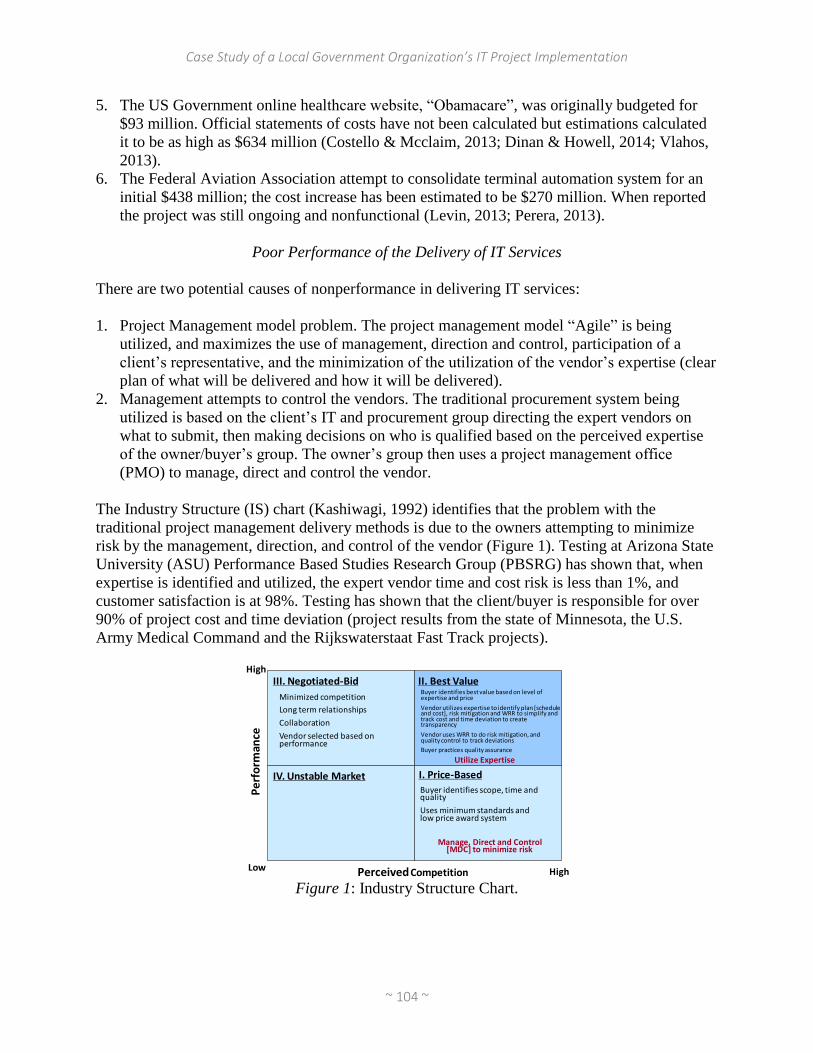
Case Study of a Local Government Organization’s IT Project Implementation
~ 104 ~
5. The US Government online healthcare website, “Obamacare”, was originally budgeted for
$93 million. Official statements of costs have not been calculated but estimations calculated
it to be as high as $634 million (Costello & Mcclaim, 2013; Dinan & Howell, 2014; Vlahos,
2013).
6. The Federal Aviation Association attempt to consolidate terminal automation system for an
initial $438 million; the cost increase has been estimated to be $270 million. When reported
the project was still ongoing and nonfunctional (Levin, 2013; Perera, 2013).
Poor Performance of the Delivery of IT Services
There are two potential causes of nonperformance in delivering IT services:
1. Project Management model problem. The project management model “Agile” is being
utilized, and maximizes the use of management, direction and control, participation of a
client’s representative, and the minimization of the utilization of the vendor’s expertise (clear
plan of what will be delivered and how it will be delivered).
2. Management attempts to control the vendors. The traditional procurement system being
utilized is based on the client’s IT and procurement group directing the expert vendors on
what to submit, then making decisions on who is qualified based on the perceived expertise
of the owner/buyer’s group. The owner’s group then uses a project management office
(PMO) to manage, direct and control the vendor.
The Industry Structure (IS) chart (Kashiwagi, 1992) identifies that the problem with the
traditional project management delivery methods is due to the owners attempting to minimize
risk by the management, direction, and control of the vendor (Figure 1). Testing at Arizona State
University (ASU) Performance Based Studies Research Group (PBSRG) has shown that, when
expertise is identified and utilized, the expert vendor time and cost risk is less than 1%, and
customer satisfaction is at 98%. Testing has shown that the client/buyer is responsible for over
90% of project cost and time deviation (project results from the state of Minnesota, the U.S.
Army Medical Command and the Rijkswaterstaat Fast Track projects).
Figure 1: Industry Structure Chart.
High
I. Price-Based
II. Best Value
IV. Unstable Market
III. Negotiated-Bid
Buyer identifies scope, time and quality
Uses minimum standards and low price award system
Buyer identifies best value based on level of expertise and price
Vendor utilizes expertise to identify plan [schedule and cost], risk mitigation and WRR to simplify and track cost and time deviation to create transparency
Vendor uses WRR to do risk mitigation, and quality control to track deviations
Buyer practices quality assurance
PerceivedCompetition
Pe
rfo
rman
ce
Low
High
Minimized competition
Long term relationships
Collaboration
Vendor selected based on performance
Utilize Expertise
Manage, Direct and Control [MDC] to minimize risk
Case Study of a Local Government Organization’s IT Project Implementation
~ 105 ~
The IS logic is supported by the 25 years of research testing at PBSRG. The results include:
1. 1,900 tests delivering $6.6B of services with 98% customer satisfaction (Duren and Doree,
2008).
2. Tests were run in 33 different states in the U.S. and 7 different countries.
3. 98% customer satisfaction, less than 1% vendor cost and time deviation.
The IS logic was also supported by the Schuberg Philis (SP) research study that showed that the
SP approach of eliminating management, direction and control in the delivery of IT services led
to the following results (Kashiwagi D. & Kashiwagi I., 2014):
1. Most successful IT vendor performance in the Netherlands.
2. 90% customer satisfaction and 99% would hire them again.
3. Continual increase in turnover or volume of work.
Performance Based Studies Research Group (PBSRG) at Arizona State University
The PBSRG was founded by Dr. Dean Kashiwagi in 1993 to identify the source of project
nonperformance, identify solutions and create processes which would minimize or eliminate the
poor performance. PBSRG used a unique approach to solving procurement and vendor
performance issues. They used the following concepts:
1. Identify and utilizing expertise increases value and minimizes project cost.
2. Experts have no risk. They can observe unique initial conditions and see in the future.
3. The biggest source of project cost and time deviation is the client.
4. Experts use a WRR to create transparency to mitigate risk. Risk mitigation happens before
the project begins.
5. When the client/buyer manages, directs and controls the vendor, the quality decreases.
6. Verbal or written communication is not efficient or effective in delivering performing
services.
PBSRG has the following performance history:
1. 24 years research duration.
2. $17.6 M research funding.
3. 1,900 tests implementing the Best Value Approach (BVA) to optimize the delivery of $6.6B
of services with 98% customer satisfaction.
4. Education and research testing in 12 countries and 33 states in the United States.
5. BVA education includes a theoretical Information Measurement Theory (IMT), the BVA in
procurement, a new risk management model, a new project management model, and a
metrics-based leadership model.
6. The most licensed technology developed at ASU with 52 licenses of intellectual property.

Case Study of a Local Government Organization’s IT Project Implementation
~ 106 ~
PBSRG had performed numerous projects delivering IT project services (CenturyLink, 2013;
Kashiwagi & Kashiwagi, 2014; Kashiwagi; 2014, PBSRG, 2017):
1. The delivery of tax software for the State of Oklahoma, which saved the state $19M (of a
$40M budget).
2. The delivery of IT services for the State of New Mexico.
3. The delivery of IT networking services for ASU.
4. The delivery of a management of license system for the State of Idaho.
5. The delivery of software systems and overall project management officer for Boise State
University (BSU).
6. The delivery of IT services for the City of Rochester Engineering Group.
7. The delivery of IT services for the Arizona Department of Environmental Quality to
automate their manual records system.
8. The delivery of a search engine development for the State of Utah.
Lessons learned include:
1. The success of the project is based on the client’s ability to follow the PBSRG model, which
was the BVA structure. BVA structure requires clients to identify and utilize expertise and to
not manage, direct, and control (MDC) the vendor as in the traditional approach. This
includes allowing the expert vendor to follow the approach from a vendor’s clarification
period to the final execution of the project. The vendor will track the time and cost deviation
of the project to final delivery.
2. The three projects that failed ended up in litigation, poor results and termination due to the
client/owner making decisions, trying to collaborate with the vendor and not forcing the
vendor to perform based on the BVA structure. In all cases, the results were dominantly clear
that the client was not an expert but was acting in the MDC role due to their inability to
understand how to utilize expertise to deliver a successful project. These owner
representatives claimed that they have the responsibility and expertise to personally deliver
the end-product even though they have no proof of previous successful delivery of projects.
They use their government position to overcome the observations of reality of the past 30
years. This included not following the BVA because they identify that their approach was
better with no rational explanation.
Case Study of the ERP Upgrade to the Existing Local Government Organization Peoplesoft
System
The Local Government Organization (LGO) Procurement Director knew that the traditional
procurement delivery system was fraught with problems. It had caused project extensions, a lack
of accountability, and the need to explain why projects were not delivered on time and on budget
at the LGO. The procurement director had heard about PBSRG and the BVA years earlier at the
California Association of Public Procurement Officers (CAPPO) conference in 2015, and
immediately understood the rationale behind the LGO’s problematic environment. The director
also understood how the BVA components of the simplistic logic, the utilization of expertise and
the use of transparency were created by the Weekly Risk Report (WRR). He kept in contact with
PBSRG.

Case Study of a Local Government Organization’s IT Project Implementation
~ 107 ~
In August 2016, the LGO Procurement Director reached out to the PBSRG. They attempted to
learn about the details of the BVA. However, the BVA was not implemented. In September
2016, the LGO published their request for proposal (RFP) for the procurement of an upgrade of
their Peoplesoft System in the areas of HR, finance and procurement. The client’s stakeholders
had spent roughly six months on rating the competitors in a traditional selection process of IT
vendors. A group of 10 procurement personnel made up a Contract Review Board (CRB) and 12
stakeholders were involved in the procurement.
The selection criteria and weights included:
1. Written Submittal (48%)
2. Oral/Interview (28%)
3. Best and Final Offer (including cost) (25%)
Each criterion was broken down even further, rated, and weighted. Five vendors responded to the
RFP. The five were shortlisted to three vendors. The CRB process was completed by Jan 2017.
Worried about potential problems, in November 2016, the Procurement Director was concerned
and contacted PBSRG, along with the IT Director and discussed how the BVA could be
integrated into the already running CRB process. The IT Director agreed with the approach and
asked the Procurement Director if he understood the approach. He quickly recognized the
approach would solve organizational problems that he wanted rectified. However, the IT
Director thought the Peoplesoft Upgrade project was too politically sensitive and requested it be
utilized on a different IT procurement. The Procurement Director succumbed to the political
pressure and continued to run the project using the CRB traditional procurement approach.
In Jan 2017, the process used by the CRB resulted in the following ratings and prioritization of
the vendors:
1. The highest prioritized vendor was the most expensive $8.9M.
2. The second rated vendor was the most inexpensive at $3.9M (gap of $5M or 56% from the
highest rated vendor).
3. The third rated vendor (who some thought was the most qualified) was the medium priced at
$7.8M (23.5% lower than the top prioritized vendor, and very close to the budget).
At this point, the three highest rated vendors had a range in costs of over 56.7% from the highest
performer and a range of 150% from the lowest costing vendor. The second ranked vendor was
the most economical. The total spread in rating points was less than 10% (not dominant enough
and usually caused by decision-making), but the cost deviation was $5M on an $8M budget.
By observation, the PBSRG Director identified the following:
1. The vendors’ understanding of the RFP was different.
2. Two competitors’ price was within 15% of each other, and the other vendor was half the cost.
3. The CRB members publicly stated that were unsure if the vendors were capable of
responding to all three areas of the RFP (financial, HR and procurement), but considered all
vendors were comparable.
4. The IT director also stated that all three vendors were capable of meeting the requirements.
Case Study of a Local Government Organization’s IT Project Implementation
~ 108 ~
By observation, there was no cost consistency among the vendors. The CRB created and
reviewed selection process would award to the highest ranked proposal (the most expensive
vendor). The relative difference in ratings was less than 7%. Because the three vendors were
shortlisted, the intent of the CRB was that the three vendors were similar or qualified. The
procurement director realized the risk, had been communicating with PBSRG to identify if this
type of situation could be simplified and that the procurement and execution risk could be
minimized.
LGO Contacts PBSRG and Requests Assistance on the Peoplesoft Project
In January 2017, the LGO CEO was concerned about the risk of the Peoplesoft Upgrade Project
and directed the Procurement Director to immediately seek assistance from PBSRG to mitigate
the risk. In early February 2017, the Procurement Director contacted PBSRG, and negotiated a
contract to assist on the subject project. Before a contract could be signed, and license procured
for the BVA, PBSRG began to assist the LGO on the subject project. Without changing any of
the terms of the RFP, but using the CRB’s latitude to do a second Best and Final Offer (BAFO),
the procurement Director directed PBSRG to do the following:
1. Use the second BAFO to educate the vendors in the BVA clarification period process and
contractor’s capability to use performance metrics and re-interview the contractor for a
second time (which was allowed under the second BAFO). The second interview would be
conducted in the BVA fashion, to identify the vendor’s capability to show their level of
expertise using metrics, ability to see into the future and differentiate the subject project and
see the project from beginning to the end.
2. Require a Level of Expertise submittal that addressed the subject project using the language
of metrics, showing their capability by using descriptive strings of metrics that would relate
their past experience with the subject project.
3. Educate the vendors on the “exact” requirement of the project (now) assuming that the
vendor was an expert, and that the vendor would have to have a detailed schedule, an easily
understood milestone schedule and a Weekly Risk Report (WRR) that the vendor used to
track all time and cost deviations throughout the project. The vendors were to be educated
not to include the cost or risk that the client would cause or contingency in their submitted
budget.
4. Their submitted schedule should include, not only the activities of the vendor, but all
activities of all stakeholders in the delivery of the project. This is a BVA which ensures that
the vendor is in control of the project, will attempt to simplify the schedule to create
transparency and attempt to mitigate the risk caused by the owner’s representatives due to
their lack of expertise.
5. Integrate these requirements into the second BAFO without changing the intent and
expectation of the client. The Procurement Director was searching for a methodology to
select a successful vendor that would deliver results of a best value environment.
The above concepts came from the BVA selection phase and the BVA clarification phase. The
BVA clarification phase would be normally utilized in the traditional approach’s negotiation
phase. These requirements are logical expectations of a client who hires an expert vendor. These

Case Study of a Local Government Organization’s IT Project Implementation
~ 109 ~
requirements are paradigm shifts that many procurement and client representatives expect from
vendors, but do not know how to put it in a contract. These requirements were not articulated by
the traditional CRB that created the RFP in the first BAFO. Therefore, the procurement Director,
directed the vendors to go through a second BAFO which incorporated the clarified BVA
requirements. In the second BAFO the vendors would be educated by the creator of the BVA and
be rated on how well they understood and could respond as expert IT vendors. The expectation
of an expert vendor being the capability to use performance metrics and the language of metrics,
preplan, to simplify, to create transparency and to track all time and cost deviations with a WRR.
By observation the traditional process had resulted in the following:
1. Six months of intensive effort of creating an RFP and implementing the RFP to shortlist the
number of vendors from five to three.
2. The range of the vendor’s proposed costs was 156%.
3. The range of the ratings between the top two vendors was 6 points out of 150 points or 4%.
4. The third rated vendor was 9.9 points behind the top prioritized vendor (less than 6.3%).
5. Six months of work done by a CRB made up of eleven members, has gone through setting up
the selection criteria, rating submittals, interviews, and a Best and Final Offer (BAFO) has
led to the prioritization of three vendors. The separation between the three vendors’ effort
had not separated the top three vendors.
6. The three vendors from top to bottom were $8.8M, $3.9M and $7.7M. The top-rated vendor
was $4.9M, 128% more expensive than the second rated vendor (BV team thought vendor 2
was the best qualified vendor).
Based on the submitters, the BV Expert saw the following weaknesses:
1. The range of costs for a specified 1,200 requirements was too large (128%).
2. The top-rated vendor was the most expensive.
3. The point differential of six points (4%) between the first and second place proposers was too
small to make up for 128% difference in cost.
The client/buyer still did not have any clear idea of:
1. How the vendors were planning on doing the work.
2. Did not know if the vendor’s project manager/vendors understood that the vendors were not
responsible for risk they did not control.
3. Did not know if the vendors could do the work.
4. Did not know why the pricing was so different.

Case Study of a Local Government Organization’s IT Project Implementation
~ 110 ~
Problem
The CRB had worked for six months and did not know any major differences between the three
vendors (who had a range of 128% cost differential) and had the following issues with all three
vendors not being able to do one of the major requirements (replace the functionality of the
current system). The CRB did not have the knowledge if any of the contractors could produce:
1. A detailed schedule with costs from beginning to end.
2. A milestone schedule with costs that simplified the deliverables.
3. A schedule that identified the risk that the vendor did not control (caused by other
stakeholders).
Proposed Solution
The CEO of the LGO requested the Procurement Director to bring the Best Value experts from
Arizona State University. The BV Experts would utilize expertise and transparency to ensure that
an expert vendor who can schedule from beginning to end and include the activities of all other
stakeholders in the schedule. The advantage of the BVA is:
1. The process is legally defendable.
2. Forces preplanning before award of the entire schedule.
3. Assists the client to mitigate risk (expert vendor creates transparency using a WRR to ensure
the cost and time deviation of risks that the vendor does not control are known before the
contract is signed).
4. Ensures that the best value vendor can perform from beginning to end.
5. The process is quick (less than 10% of the traditional process) and minimizes the decision
making of the client. The BVA requires vendors to show performance by using dominant
metrics that doesn’t force the client’s representatives to think or use personal bias to make
decisions. All parties are educated that if a client’s representative must think or make a
decision, the vendor will receive no added value in their scoring.
6. The process ensures that the best value vendor will clarify their complete approach before
award.
7. Best Value vendor will track the project time and cost deviation throughout the project.
Methodology to Transform Traditional Approach to Best Value Intent
Even though the client was late in the selection process of upgrading their Peoplesoft software,
the innovative procurement Director at LGO proposed that a second BAFO could be run. During
this period, the selection board and the PBSRG Director would:
1. Educate the vendors on the rest of the process, including the negotiation phase where the
client would not negotiate scope or price, and the vendor would have to clarify their proposal
with a detailed schedule from beginning to end, a simplified milestone schedule from

Case Study of a Local Government Organization’s IT Project Implementation
~ 111 ~
beginning to end, their risk mitigation, and have a weekly risk report that would track the
time and cost deviation of the project.
2. Allow them to not cost risk into their proposed price by resubmitting their price proposal.
3. Interview the expert project manager to determine if they were experts and could do the
clarification during the negotiation period.
4. Ensure that an expert vendor who can plan from beginning to end will be selected.
The BVA concepts, inserted in the second BAFO would allow the LGO to remove a vendor in
the negotiation period if it determined that the vendor could not:
1. Have a detailed schedule from beginning to end, that included all the activities of all
stakeholders in the delivery of the project.
2. Simplify the detailed schedule with milestones with non-technical metrics that anyone could
understand.
3. Identify and mitigate the risk that they could not control.
4. Use a WRR that would identify the cause of any risk that would result in cost or time project
deviation.
5. Control and manage the project by tracking time and cost deviation from the vendor created
detailed and milestone schedule.
Agile Project Management Approach
Most IT vendors use an approach called “Agile”. The Agile Approach identifies the project
duration and total cost but does not clearly identify the project milestones that will lead to project
delivery. Instead, the project team [including the vendor’s team members, the client’s CRB, the
procurement personal, the client’s project management office (PMO) and stakeholders] manage
the project in short “sprints”. The team ensures at the beginning and ending of each sprint (when
the plan for the next sprint is decided) that they maximize the following to reduce risk:
1. Discussion of all parties.
2. Consensus of all parties.
3. Documentation before and after each sprint.
The approach clearly identifies the major risk in delivering IT services. It minimizes preplanning
by the expert vendor, identification and mitigation of potential risk by the vendor, the creation of
a detailed schedule and simplified milestone schedule that includes all the activities of all project
stakeholders and the resulting transparency that minimizes the effort of all and allows vendors to
minimize the project costs. The traditional approach leads to the transfer or sharing of risk once
the project is not successfully completed. This agile way of working increases the responsibility
of the client PMO and minimizes the accountability of the vendor.
Senior CIO Stops BVA Implementation
The PBSRG Director visited the LGO to implement the BVA modifications to the second BAFO
requirement. The three competing vendors were briefed by the PBSRG Director in separate

Case Study of a Local Government Organization’s IT Project Implementation
~ 112 ~
presentations. The LGO was trying to get the vendors to explain their expectations. A major
objective of the presentations was attempting to help the vendors understand that the successful
bidder was including all stakeholders’ activities in their detailed and milestone schedule and that
they were going to track time and cost deviations. The resulting deviations caused by risk (risk is
what the vendor did not control) was the financial responsibility of the client and not the vendor,
negating the need to include the cost of risk or contingency costs in their bids. After briefing the
IT Director, the CRB and the legal team, the PBSRG Director briefed the newly hired CIO. The
new approach received resistance from some of the legal team. Interestingly, it was from the
more senior legal staff. They were uncomfortable with change. The younger legal expert, even
though he had less experience, quickly identified that the new system would address some of the
issues being observed on the majority of LGO projects which included:
1. Vendors not finishing what they were hired to do.
2. Vendors stating that they did exactly what they were told to do and were not responsible for
time and cost deviations.
3. Project cost was seemingly uncontrollable.
4. Legal position on most of these projects was not defendable.
5. Poor project performance.
The newly hired CIO did not understand the following documented industry practices and
results:
1. The performance of the delivery of services to government agencies was very poor.
2. The performance of the delivery of IT services was the worst of any major service.
3. The traditional approach of project management to manage, direct and control vendors was
structurally flawed.
It was obvious to the PBSRG Director that the new LGO CIO did not understand how to solve
the LGO procurement issues. Her statement that she was one “who got into the weeds” dictated
the future course of LGO would be the manage, direct and control (MDC) approach. Within a
month, the LGO Procurement Director contacted ASU and communicated that the LGO would
no longer need the assistance of PBSRG and their Best Value Approach (BVA).
Conclusion
The LGO attempt at solving their procurement problems addressed all the issues at government
agencies. The procurement approach of government agencies is structurally flawed. Despite the
documentation of poor performance over the past 30 years, agency procurement groups continue
to repeat the same flawed approach. The problems include:
1. Ignorance of management of the low level of performance of the delivery of services to
government.
2. Agencies believing that they are the “expert” in the services being delivered.
3. Problems caused by nonperformance of procurement personnel. The problems are caused by
the flaws of the structure of the traditional system.

Case Study of a Local Government Organization’s IT Project Implementation
~ 113 ~
4. Using management, direction and control (MDC) of vendors.
5. Agencies attempting to transfer risk to vendors.
6. Agencies use PMOs that use the agile approach to project management which increases
effort, communication, collaboration and documentation and discourages the leadership by
an expert.
7. Agencies increasing decision making, and managing, directing and controlling vendors to
minimize risk.
The LGO Procurement Director did not have the support of his organization to change and
improve the delivery of the IT services. Without the assistance of the Performance Based Studies
Research Group, the selection will be flawed, the LGO will try to negotiate the price down, and
there will be no complete schedule of all the stakeholder’s activities and a WRR to track the
project time and cost deviation by the vendor.

Case Study of a Local Government Organization’s IT Project Implementation
~ 114 ~
References
Al-ahmad, W., Al-Fagih, K. Khanfar, K., Alsmara, K., Abuleil, S., Abu-Salem, H. (2009) A taxonomy of an IT
project failure: root causes. International Management Review, 5 (1), 93-106.
Bradshaw, G. (2008). Establishing a first class project controls organization for managing large complex projects.
TC11-20
Brown, T. (2001). Modernisation or failure?. IT Development Projects in the UK Public Sector, 17(4), 363-381.
(project management)
Budzier, A. & Flyvbergj B. (2011). Why your IT project may be riskier than you think. Business Harvard Review,
89 (9), 601-603.
Bull Survey. (1998).State failure cause, IT Cortex, Accessed from http://www.it-cortex.com/Stat_Failure_Cause.htm.
Century Link (2013, September 17). ASU MSA Annual Review. Meeting Minutes. Retrieved September 17, 2013
from Arizona State University Annual Review.
Chaos Report. (1995). Standish groups chaos report, IT Cortex, Accessed from http://www.it-
cortex.com/Stat_Failure_Rate.htm#
Chiang, J. (2013) 21st Century Project. California State Controller's Office. http://www.sco.ca.gov/21century.html.
Clegg, C., Axtell, C., Damodaran, L., Farbey, B., Hull, R., Lloyd-Jones, R., Nicholls, J., Sell, R., & Tomlinson, C.
(1997). Information technology: a study of performance and the role of human and organizational factors.
Ergonomics, 40(9), 851-871.
Costello, T., Mcclaim, E. (2013, October) Obamacare glitches: Gov't contract for troubled site has swelled; GOP
targets Sebelius. NBC News. http://www.nbcnews.com/news/other/obamacare-glitches-govt-contract-
troubled-site-has-swelled-gop-targets-f8C11419179.
DeMarco, T. (1982). Controlling software projects: Management, measurement & estimation. New York, NY:
Yourdon Press.
Dinan, S., Howell, T. (2014, April) Price of fixing, upgrading Obamacare website rises to $121 million. Washinton
Times. http://www.washingtontimes.com/news/2014/apr/29/obamacare-website-fix-will-cost-feds-121-
million/?page=all.
Dorsey, P. (2000) Top 10 reasons why systems projects fail. Dulcian Inc.
Duren, J. and Doree, A. (2008) An evaluation of Performance Information Procurement System (PIPS), 3rd
international public procurement conference proceedings 28(30) pp 923-946.
European Services Strategy Unit. (2007). Cost overruns, delays and terminations: 105 outsourced public sector ICT
projects (Report No. 3). Duagh, Ireland: Whitfield, D.
Eye4Management. (“Government & ICT “, n.d.) http://www.eye4management.nl/transitiemanagement/ict-
samenwerkingsverbanden/overheid-verspilt-miljarden-aan-ict.
Gardner, D. J. (2000) How to avoid IT project failures. Consulting to Management, 11 (1), 21-23.
Geneca. (2011). “Doomed from the Start? Why a Majority of Business and IT Teams Anticipate Their Software
Development Projects will Fail. Winter 2010/2011 Industry Survey.
Giarte. (2014) Report Transformers Outsourcing Performance 2014. Amsterdam, Netherlands: n.d.
Giarte. (2014) Satisfaction across service providers. Amsterdam, Netherlands: n.d.
Glaser, J. (2004) Management’s role in IT project failures. Healthcare Financial Management, 58 (10), 90-92.
Government Accountability Office. (2008). OMB and Agencies Need to Improve Planning, Management, and
Oversight of Projects Totaling Billions of Dollars. (GAO Publication No. 08-105IT). Washington, D.C.:
U.S. Government Printing Office.
Grossman, I. (2003). Why so many IT Projects fail and how to find Success. Financial Executive, 19 (3), 28-29.
Henderson, P. (2006) Why Large Projects Fail. School of Electronics and Computer Science University of
Southampton.
Hershey, R. (1996, April) A technology overhaul of I.R.S. is called a fiasco. New York Times.
http://www.nytimes.com/1996/04/15/us/a-technological-overhaul-of-irs-is-called-a-fiasco.html.
HR Magazine (2006) Talent management: driver for organizational success. HR Magazine, 51 (6): S1, June 2006.
ISSN:1047-3149.
Institute for Defense Analysis (2011) Assessment of DoD Enterprise Resource Planning Business Systems.
Alexandria, Virginia: Ketrick, P., Bailey, J., Cunningham, M., Odell, L., Douglas, G., Floyd, D., Insolia, A.
IT Cortex, (2003). Failure rate, IT Cortex. Retrieved November 26, 2003, from the World Wide Web: http://www.it-
cortex.com/Stat_Failure_Rate.htm

Case Study of a Local Government Organization’s IT Project Implementation
~ 115 ~
Kanaracus, C. (2012, February) Air Force scraps massive ERP project after racking up $1B in costs. Computer
World.
http://www.computerworld.com/s/article/9233651/Air_Force_scraps_massive_ERP_project_after_racking_
up_1B_in_costs.
Kanaracus, C. (2013, February) California ends contract with SAP over troubled IT project. Computer
World.http://www.computerworld.com/s/article/9236662/California_ends_contract_with_SAP_over_troubl
ed_IT_project?taxonomyId=214&pageNumber=2.
Kappelman, L., McKeeman, R., Zhang, L. (2009) Early warning signs of IT project failure: the dangerous dozen.
The EPD Audit, Control and Security Newsletter, 40 (6), 17-25.
Kashiwagi, D. (2014). Best Value Standard. Performance Based Studies Research Group.
Kashiwagi, D. (2016). Best Value Approach. Performance Based Studies Research Group, Tempe, AZ. Publisher:
KSM Inc.
Kashiwagi, D. T. (1992). Development of a performance based design/procurement system for nonstructural facility
systems.
Kashiwagi, D., & Kashiwagi, I. (2014). The Best Value ICT Industry. Journal for the Advancement of Performance
Information & Value, 6(1).
Kashiwagi, D., & Kashiwagi, J. (2013). Dutch Best Value Effort. In RICS COBRA Conference (pp. 356-363).
Kashiwagi, D., Kashiwagi, J., Kashiwagi, I., & Sullivan, K. (2015). The Development of the Best Value Approach
in the State of Minnesota. Journal for the Advancement of Performance Information & Value, 7(1).
Kashiwagi, J., Sullivan, K. and Kashiwagi, D. (2009) Risk Management System Implemented at the US Army
Medical Command, Vol. 7 No.3, 2009 pp. 224-245.
Lepatner, B.B. (2007), Broken Buildings, Busted Budgets, The University of Chicago Press, Chicago.
Levin, A. (2013, May) Air-traffic upgrade over budget, facing delays: report. Bloomberg.
http://www.bloomberg.com/news/2013-05-31/air-traffic-upgrade-over-budget-facing-delays-report.html.
Mckinsey & Company. (2012). Delivering Large scale IT projects on time, on budget and on value. New York City,
NY: Bloch, M., Blumberg S, Laartz, J.
MIT Sloan School of Management (2003) Why leadership-development efforts fail. MIT Sloan Management
Review, 44 (3): 83, March 2003. ISSN: 0019-848X.
Moseley, J. (2013, November) Government computer failures are normal. American Thinker.
http://www.americanthinker.com/2013/11/government_computer_failures_are_normal.html.
PBSRG. (2017). Performance Based Studies Research Group Internal Research Documentation, Arizona State
University, Unpublished Raw Data
Perera, D. (2013, June) TRANCON air traffic control modernization faces prospect of more schedule, cost overruns.
Fierce Government IT. http://www.fiercegovernmentit.com/story/tracon-air-traffic-control-modernization-
faces-prospect-more-schedule-cost/2013-06-02.
PricewaterhouseCoopers (PwC). (2009). “Need to know: Delivering capital project value in the downturn.”
Retrieved from https://www.pwc.com/co/es/energia-mineria-y-servicios-publicos/assets/need-to-know-
eum-capital-projects.pdf. Accessed September 16, 2015.
Sauer, C., Cuthbertson, C. (2003) The State of IT Project Management in the UK 2002-2003. Computer Weekly,
2003, London (82 page report).
Savolainen, P., Ahonen, J. (2010) Software engineering projects may fail before they are started: Post-mortem. The
journal of systems and software, 83, 2175-2187.
Standish Group. (1994). CHAOS Manifesto 2011. Boston, MA: The Standish Group International, Inc.
Standish Group. (2011). CHAOS Manifesto 2011. Boston, MA: The Standish Group International, Inc.
Standish Group. (2013). CHAOS Manifesto 2013. Boston, MA: The Standish Group International, Inc.
Thompson, J. (2012, April) Fixing the IRS. Government Executive.
http://www.govexec.com/magazine/features/2012/04/fixing-irs/41637/.
US Department of Commerce. (2011). Census 2010: final report to congress. (Final Report No. OIG-11-030-I).
Washington, D.C.: U.S. OIG Office of Audit and Evaluation.
Van de Rijt, J., & Santema, S. (2012). The Best Value Approach in the Netherlands: A reflection on past, present
and future. Journal for the Advancement of Performance Information & Value, 4(2).
Venugopal, C., & Suryaprakasa Rao, K. (2011). Learning from a failed ERP implementation: a case study research.
International Journal of Managing Projects in Business, 4(4), 596-615.
Whittaker, B. (1999). What went wrong? Unsuccessful information technology projects. Information Management &
Computer Security, 7(1), 23-30.

Case Study of a Local Government Organization’s IT Project Implementation
~ 116 ~
Yun, S. (2013). The impact of the business-project interface on capital project performance. The University of Texas
at Austin. Retrieved from http://repositories.lib.utexas.edu/handle/2152/22 804
Attachment #1
Timeline of Events Between the LGO and the PBSRG at Arizona State University
Timeline:
7/28/2016 – LGO called PBSRG seeking additional information on BV PIPS.
7/28/2016 – PBSRG sent LGO references for the BVA.
7/29/2016 – Additional conversation over the phone occurred between PBSRG and LGO.
7/29/2016 - PBSRG sent contracting information to LGO.
7/29/2016 to 8/4/2016 – 30+ emails between LGO and PBSRG discussing contracting with
PBSRG and using the BVA.
8/4/2016 – Discussion with Deputy Administrative Officer of IT from LGO. LGO recognized
value in the BVA and additional value that could be added to ensure success on the
Peoplesoft project.
8/4/2016 – PBSRG sends LGO a draft schedule and SOW.
8/4/2016 to 8/11/2016 – Coordinating schedule for the Peoplesoft project and negotiating
contract.
8/11/2016 – LGO identifies that they are not going to be contracting with PBSRG, due to
political reason on the Peoplesoft project.
1/12/2017 – LGO approaches PBSRG identifying LGO would like to contract for support on the
Peoplesoft project and help in revamping the procurement process at LGO. LGO
personnel identified that the CEO authorized him to move forward with contracting with
PBSRG for the two efforts.
1/13/2017 – PBSRG Director sends LGO a SOW and pricing for support on the two efforts.
1/25/2017 – Conference with LGO, discussing PBSRG cost of service and scope of work. LGO
tells PBSRG that they are okay with the pricing, identifies they will sign a contract for
the Peoplesoft support, but will sign a contract for the procurement support in the fall to
identify the success of the BVA approach and when they can acquire more funding.
1/25/2017 to 1/31/2017 – PBSRG coordinating finalization of contract with LGO.
1/31/2017 – Teleconference with LGO finalizing schedule. LGO gives “go ahead” to schedule a
visit to educate internal team and help with the second BAFO. LGO asks PBSRG to draft
RFP addendum so that the Peoplesoft project can take advantage of the BVA selection
phase process.
1/31/2017 to 2/2/2017 – 10+ emails coordinating trip from LGO. LGO identified that the COO
authorized him to move forward with scheduling the PBSRG BVA Trip to LGO.
2/3/2017 – PBSRG sends LGO Peoplesoft RFP BV PIPS modification addendum and discusses
with LGO the Addendum over the phone.
2/6/2016 – PBSRG sends RFP addendum modified, with LGO suggestions.
2/8/2017 – LGO tells ASU contracting officer that he is accepting the proposal and requests to
proceed in preparing the contract agreement with ASU PBSRG.
2/8/2017 to 2/10/2017 – PBSRG visits LGO, briefs all three competing vendors on the second
BAFO and what will be required of the top prioritized vendor, briefs LGO IT Director,
project CRB, legal office and new CIO. CIO does not understand the problem with the

Case Study of a Local Government Organization’s IT Project Implementation
~ 117 ~
traditional procurement process, states that she is an expert in delivering services (with
great experience) and does not see the value being brought by PBSRG. PBSRG Director
delivers two complete sets of the BVA documentation that goes with the ASU license for
the BVA.
2/10/2017 – LGO gives PBSRG the scoring matrix for the Peoplesoft project for PBSRG to
review.
2/13/2017 – PBSRG prepares interviews for the second BAFO and the interview process.
2/14/2017 – LGO asks PBSRG for project milestones to be tied to payments. LGO identifies
request came from LGO’s COO. PBSRG sends LGO products that will be delivered.
2/14/2017 – PBSRG advising LGO on how to proceed and answer vendor questions on the BV
adjustments to the Peoplesoft project. PBSRG prepares for second BAFO interviews for
Peoplesoft project.
2/15/2017 – LGO identifies support needs to be placed on hold. LGO asks for costs already
incurred by PBSRG and a breakout cost of the rest of the deliverables.
2/17/2017 – PBSRG sends LGO current costs already incurred.
2/22/2017 – LGO discusses with PBSRG path forward. LGO to pay PBSRG for costs already
incurred due to work performed and pay for license due to PBSRG providing BVA
information. They later decide to not pay for license.
3/1/2017 – PBSRG sends invoice to LGO to pay for work already performed.
3/22/2017 – LGO sends email to PBSRG identifying LGO will not be utilizing ASU’s service
beyond the services already provided. PBSRG was dismissed before the second BAFO
could take place.

Journal for the Advancement of Performance Information and Value Vol.10 I.2
December 2018
© K S M , I n c | 118
Top Construction Delay Factors for Kenya
Yue Choong KOG, (PhD)
East West Engineering Consultants
Singapore
Thirteen studies to identify major delay factors for construction projects in Kenya have been
reported in the literature. Nine of these studies were based on self-administered questionnaire
survey of views of project participants and four studies were based on site records of actual
construction projects. Thirty-three of the more than forty construction delay factors reported in the
literature were identified as one of the top construction delay factors by the thirteen studies on
Kenya. This is illogical, misleading and confusing. A thorough review of these thirteen studies is
undertaken to identify top delay factors for construction projects in Kenya. With respect to the
construction delay factors identified, remedial measures to improve the schedule performance of
construction projects in Kenya are presented.
Keywords: Kenya, Delay factors, Survey.
Introduction
As in many other developing countries, government is the major construction client in Kenya
and the market for major projects tends to be dominated by foreign contractors because of
deficiencies in indigenous construction capacity. Kenya is regarded as the regional hub for trade
and finance in East Africa. In the last fifty years, construction projects had advanced to higher
levels of size, cost, time and intricacy of construction. Construction delay is a prevalent problem
for construction projects in Kenya. For example, the National Social Security Fund took five
years to complete as opposed to the original estimate of two years. The construction of Migori
District Headquarters commenced on 31 July 2009. It was initially planned to be completed in
two years but was completed only recently. There were frequent complains of under-priced
tender bids, the manner of tender evaluation and the technical qualification required in the
process. Corruption and unfair distribution of construction projects, procurement process that
often-caused unnecessary delay of payments and erratic change of prices of construction
materials were some of the challenges. The problems of unskilled engineers and draftsmen, and
quack contractors led to many cases of collapsed buildings in various parts of Kenya especially
the low-cost residential flats in Nairobi resulting in loss of properties and lives.
Schedule performance is one of the most important criteria in assessing construction project
success. Identifying the top delay factors is the first step in understanding the top factors
affecting schedule performance. Appropriate measures can then be implemented to address
issues related to the top delay factors to achieve good schedule performance. The problem of
delays in construction projects is a global phenomenon. This is evident from the large number of
studies to identify top construction delay factors. The type of contract in most of the studies
reported was a traditional one and not design and build contract. There were only 20 studies that
were based on analysis of the delays of construction projects. The other studies used
questionnaire surveys, mostly self-administered, of views of owners, contractors and consultants.

Top Construction Delay Factors for Kenya
~ 119 ~
A small number of studies relied on interviews or panel discussions of owners, contractors and
consultants. A self-administered survey questionnaire was sent to contractors, consultants and
owners (including civil servants in charge of construction projects). The questionnaire was
developed based on construction delay factors reported in the literature or open-ended interviews
with selected panels of contractors, consultants and owners. The top construction delay factors
were established by statistical analysis of the survey data.
In particular, there are thirteen studies to identify the top delay factors for construction projects
in Kenya reported in the literature. Some of these studies are confined to specific regions of
Kenya. All these studies were carried out after 1996. Nine of these studies were based on self-
administered questionnaire surveys of views of project participants and four studies were based
on site records of construction projects. Thirty-three of the more than forty construction delay
factors reported in the literature were identified as one of the major construction delay factors by
the thirteen studies on Kenya. Kenya is not a large country in its physical size, the wide diversity
of top construction delay factors identified is illogical and misleading. This has created confusion
among the practitioners of the construction industry in devising appropriate measures to improve
schedule performance of construction projects. This is a major problem and this state of affairs is
definitely not acceptable. A thorough review of these thirteen studies is undertaken in the present
study to identify the top major construction delay factors for construction projects in Kenya. The
methodology for the present study is the same as the methodology adopted in Kog (2017a,
2017b, 2017c, 2017d, 2018). The number of times each major construction delay factor
identified by the thirteen studies was counted. The top major construction delay factors were
those identified by the greatest number of studies. The rational is obvious. The major
construction delay factors must be factors identified by the greatest number of respondents in the
thirteen studies.
Standardization of Construction Delay Factors
One of the major difficulties in summarizing various construction delay factors identified is the
lack of standardization of the construction delay factors. Reclassifications as shown in Table 1
must be made.
Top Construction Delay Factors in Kenya
Table 2 tabulates the top construction delay factors identified by each of the thirteen studies. The
top construction factors are summarized in Table 2 under five categories, namely all project
participants related factor, owner related factors, contractor related factors, consultant-related
factors and other factors. Each construction delay factor is placed in the category linked to the
party which can exert the most influence, though may not be totally, on the effect of that factor.
The ‘other factors’ category is for delay factors that are beyond the control of the project
participants.
Delay factors ‘dispute over variations’ and ‘dispute over claims’ identified by Takukhaba (1999)
are not included in Table 2 because they are contractual problems that should be resolved
contractually. Delay factor ‘delayed shop drawing preparation’ identified by Takukhaba (1999)

Top Construction Delay Factors for Kenya
~ 120 ~
is not included in Table 2 because it is not clear whether the contractor or one of the consultants
is responsible for the preparation. Delay factors ‘operating environment’ and ‘infrastructure’
identified by Musa (1999) are not included in Table 2 because it is not clear what they mean.
Table 1: Standardization of construction delay factors. Reference Delay factor in reference Standardized construction delay factor
Mwawasi (2015) 1. ‘poor or inadequate specifications in
the contract’ and ‘inaccuracy of bill of
quantities’
2. ‘inadequate planning by the client’
3. ‘underestimation of project durations’
4. ‘poor resource planning by contractor’
1. ‘substandard contract’
2. ‘owner’s lack of experience/ incompetent
project team’
3. ‘ineffective planning and scheduling’
4. ‘late delivery/shortage of construction
materials or fuel’
Takukhaba
(1999)
1. ‘architect’s instructions’
2. ‘presence of rock’
3. ‘late payment to subcontractors’ and
‘late payment of wages to workers’
4. ‘poor workmanship’
1. ‘variation orders/changes of scope by owner
during construction’
2. ‘inadequate site investigation/ unforeseen
subsurface conditions’
3. ‘financing by contractor’
4. ‘rework due to construction defects’
Sebora (2015) 1. ‘proximity to borrow pit and quarry’ 1. ‘late delivery/shortage of construction
materials’
Mwandali (1996) 1. ‘slow project selection methods’ 1. ‘slow decisions making by owner’
Musa (1999) 1. ‘lack of capacity of contractor’
2. ‘quality of project management’
3. ‘organization of project team’
4. ‘inadequate resources’
5. ‘motivation of workers’
1. ‘inadequate contractor experience/
incompetence contractor’
2. ‘owner’s lack of experience/ incompetent
project team’
3. ‘lack of professionals/incompetent project
team’ of contractor
4. ‘late delivery/shortage of construction
materials or fuel’ and ‘equipment (or
operator) availability and failure’
5. ‘low productivity level of labors’
Table 2a: Summary of major construction delay factors from existing literature on Kenya, legend
and references. Legend
S = study is based on a survey of views of owners,
contractors and consultants.
P = study is based on actual construction projects.
I = open ended interviews. A = Building, road, water and sewer etc. projects.
B = Building projects. C = Civil engineering infrastructural projects such as
highway, water and sewer projects.
? = number of respondents not stated in the reference. @ = not able to check.
References
# Reference # Reference
1 Mwawasi (2015) 8 Kariungi (2014)
2 Seboru (2015) 9 Takukhaba (1988)
3 Takukhaba (1999) 10 Kagiri and Wainaina (2008)
4 Awuor (2015) 11 Kwatsima (2015)
5 Kahiga (2015) 12 Mwandali (1996)
6 Wambugu (2013) 13 Musa (1999)
7 Ondari and Gekara (2013)

Top Construction Delay Factors for Kenya
~ 121 ~
Table 2b: Summary of major construction delay factors from existing literature on Kenya. Reference 1 2 3 4 5 6 7 8 9 10 11 12 13
Methodology S S P S S S S S P S S P P
Number of respondents / construction projects 208 31 38 75 94 96 170 ? 86 @ 57 @ @
Type of construction project C C B B C C C C A C C C C
All project participants related factor
Communication problems/lack of adequate project
coordination X
Owner-related factors
Finance and payments of completed work by owner X X X X X X X X X
Variation orders/changes of scope by owner during
construction X X X X X
Contractor selection methods (negotiation, lowest
bidder) X
Slow decisions from owner x x
Owner’s lack of experience/incompetent project team X X X X
Excessive bureaucracy in project-owner organization X X X X
Late release of site/land acquisition problems/Delay or
non-payment of compensation to the communities X X
Unrealistic/optimistic deadline set by client X
Contractor-related factors
Inadequate contractor experience/incompetence
contractor X X X X X
Lack of technical professionals/incompetent project
team X X
Ineffective planning and scheduling X X X X X X X
Poor site management and supervision X X X X X
Poor site coordination X
Late delivery/shortage of construction materials or fuel X X X X X X X X
Financing by contractor X X X X X
Subcontractor problems X
Rework due to mistakes in construction/construction
defects X X X
Low productivity level of labors X
Shortage of labor X
Unqualified workforce/low skilled labor X
Equipment (or operator) availability and failure X X X X X
Consultant-related factors
Inadequate site investigation/unforeseen subsurface
conditions X X X
Mistakes and discrepancies in design documents by
consultants X
Delay in inspection and approval of works, approval of
shop drawings, materials, and documents submitted by
contractor
X
Late issuance of instructions, information or
drawings/Delay due to issuance of certificate X X
Poor contract management by consultants/Substandard
contract X X
Other factors
Inclement weather X X X X X
Rise in prices of materials X X
Lack of community buy-in X
Delays by utility agencies/relocation/inaccurate as-built
utility drawings X X X
Natural disaster/acts of God X
Government regulation and permit approval X
Top Construction Delay Factors for Kenya
~ 122 ~
Delay factors such as ‘owner interference’, ‘inaccurate estimating of construction materials
quantities/price’, ‘labor disputes/strikes/personal conflict among labors’, ‘lack of clarity in
project scope’, ‘corruption’, ‘lack of constructability reviews in design’, ‘staff recruitment
delay’, ‘economic conditions’, and ‘security/political situations/ border closures/segmentation’,
that are common among the major construction delay factors for other developing Asian, African
and Middle Eastern counties are found to be not significant by the thirteen studies.
The accuracy of findings of studies based on self-administered questionnaire surveys hinges on
the quality of the survey data. It is obvious that the concern to the quality of the survey data in
questionnaire survey studies varies. For example, despite the importance of the sample size in a
questionnaire survey, the number of respondents of the questionnaire survey was not even
mentioned in Seboru (2015), Kahiga (2015), Kariungi (2014), Ondari and Gekara (2013), and
Wambugu (2013). The number of years of working experience of respondents is crucial because
respondents’ views and perceptions are formed based on their working experience. According to
Kog and Loh (2012), views and perceptions of the survey respondents are affected by the
duration of working experience of respondents. Views of respondents with less than 15 years
were found to be not consistent with respondents with more than 15 years. This seems reasonable
considering that the construction period for a reasonably sized project will be around 3 years. A
respondent with 15 years working experience will have completed several projects equivalent to
about 5 reasonably sized construction projects that enable a broader and more incisive
understanding of the delay factors affecting the construction projects. On the other hand, a
respondent with less than 6 years of experience will only have completed one project. Some of
the construction delay factors identified by them are unique to the project they completed only
and not typical for the construction industry. This is evident from the fact that the top delay
factors identified by these studies are not among the top delay factors identified by the present
study. Therefore, validity and reliability of major construction delays for each study reported
must consider the profile of working experience of respondents. Of the nine studies of Kenya
using self-administered questionnaire survey, no information on the profile of working
experience of respondents was reported in Seboru (2015), Kahiga (2015), Kariungi (2014),
Ondari and Gekara (2013), and Wambugu (2013). This shows a lack of appreciation of the
importance of working experience to the quality of the survey data and the validity and reliability
of the top construction delay factors identified. There are only three out of the thirteen studies
using questionnaire survey that provided information of the profile of working experience of
respondents. Out of the 28 respondents of Mwawasi (2015), there were only 6 respondents
(21.4%) with more than 15 years working experience. When the minimum working experience is
reduced to 10 years, the respective proportions are: 8/28 (28.6%) in Mwawasi (2015), 11/57
(19.3%) in Kwatsima (2015) and 19/75 (25.3%) in Awuor (2015). There is no breakdown for the
number of respondents with more than 15 years working experience in Kwatsima (2015) and
Awuor (2015). It must be noted that the respondents in Awuor (2015) were school administrators
such as principals and chairmen of management board who were involved in school’s
construction projects. The low proportion of ‘experienced’ respondents common in these studies
again shows a lack of appreciation of the importance of working experience to the quality of the
survey data and the reliability of the top construction delay factors identified. Despite the above
criticisms, the studies summarized in Table 2 are not without values. The top construction delay
factors identified by combining the findings of the thirteen studies are more credible because of
the larger number of respondents.
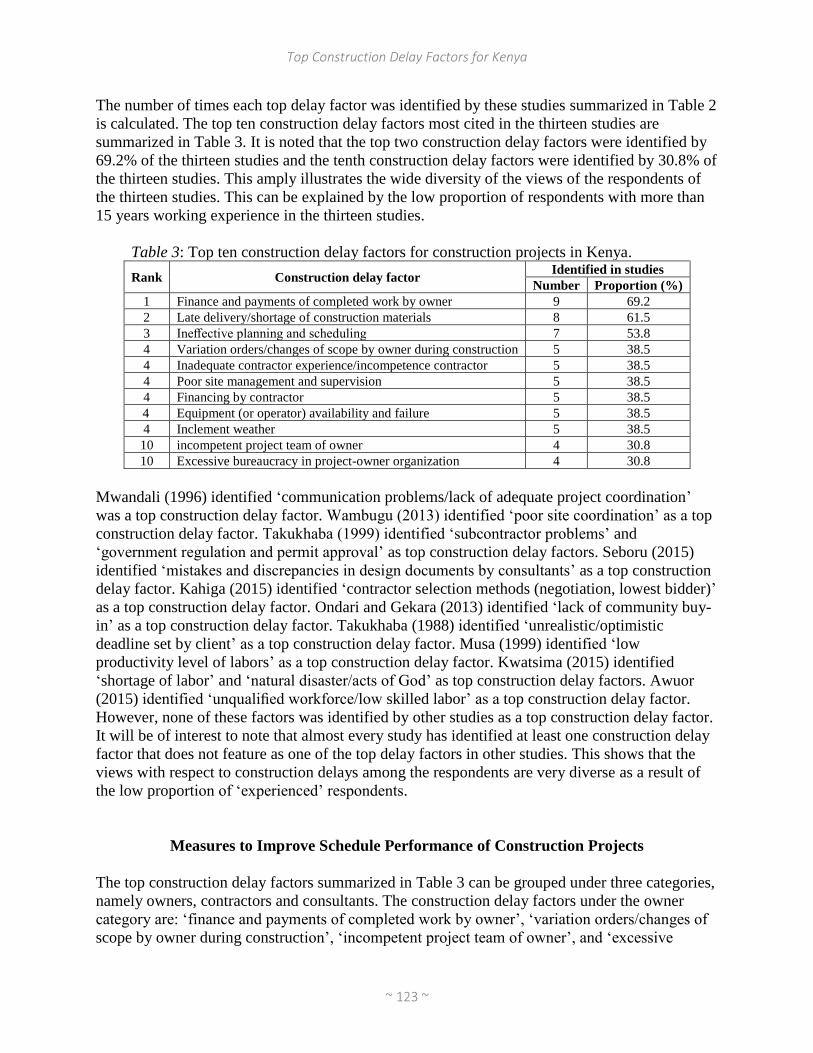
Top Construction Delay Factors for Kenya
~ 123 ~
The number of times each top delay factor was identified by these studies summarized in Table 2
is calculated. The top ten construction delay factors most cited in the thirteen studies are
summarized in Table 3. It is noted that the top two construction delay factors were identified by
69.2% of the thirteen studies and the tenth construction delay factors were identified by 30.8% of
the thirteen studies. This amply illustrates the wide diversity of the views of the respondents of
the thirteen studies. This can be explained by the low proportion of respondents with more than
15 years working experience in the thirteen studies.
Table 3: Top ten construction delay factors for construction projects in Kenya.
Rank Construction delay factor Identified in studies
Number Proportion (%)
1 Finance and payments of completed work by owner 9 69.2
2 Late delivery/shortage of construction materials 8 61.5
3 Ineffective planning and scheduling 7 53.8
4 Variation orders/changes of scope by owner during construction 5 38.5
4 Inadequate contractor experience/incompetence contractor 5 38.5
4 Poor site management and supervision 5 38.5
4 Financing by contractor 5 38.5
4 Equipment (or operator) availability and failure 5 38.5
4 Inclement weather 5 38.5
10 incompetent project team of owner 4 30.8
10 Excessive bureaucracy in project-owner organization 4 30.8
Mwandali (1996) identified ‘communication problems/lack of adequate project coordination’
was a top construction delay factor. Wambugu (2013) identified ‘poor site coordination’ as a top
construction delay factor. Takukhaba (1999) identified ‘subcontractor problems’ and
‘government regulation and permit approval’ as top construction delay factors. Seboru (2015)
identified ‘mistakes and discrepancies in design documents by consultants’ as a top construction
delay factor. Kahiga (2015) identified ‘contractor selection methods (negotiation, lowest bidder)’
as a top construction delay factor. Ondari and Gekara (2013) identified ‘lack of community buy-
in’ as a top construction delay factor. Takukhaba (1988) identified ‘unrealistic/optimistic
deadline set by client’ as a top construction delay factor. Musa (1999) identified ‘low
productivity level of labors’ as a top construction delay factor. Kwatsima (2015) identified
‘shortage of labor’ and ‘natural disaster/acts of God’ as top construction delay factors. Awuor
(2015) identified ‘unqualified workforce/low skilled labor’ as a top construction delay factor.
However, none of these factors was identified by other studies as a top construction delay factor.
It will be of interest to note that almost every study has identified at least one construction delay
factor that does not feature as one of the top delay factors in other studies. This shows that the
views with respect to construction delays among the respondents are very diverse as a result of
the low proportion of ‘experienced’ respondents.
Measures to Improve Schedule Performance of Construction Projects
The top construction delay factors summarized in Table 3 can be grouped under three categories,
namely owners, contractors and consultants. The construction delay factors under the owner
category are: ‘finance and payments of completed work by owner’, ‘variation orders/changes of
scope by owner during construction’, ‘incompetent project team of owner’, and ‘excessive

Top Construction Delay Factors for Kenya
~ 124 ~
bureaucracy in project-owner organization’. The root cause of slow progress payment to the
contractor may be attributed to the financial problem encountered by the owner. Financing of the
construction private sector projects depends on the financial strength of the owner/developer and
the general economic conditions, in particular the real estate sector, of the country. One measure
that can be implemented to address this issue is to require the owner/developer to submit all the
necessary financial documents for an exclusive bank account to be set up strictly for the project
only prior to the issuance of the permit to commence construction work for the project. In other
words, the owner/developer must secure all the financial arrangement prior to the
commencement of the construction project. The purpose is to ensure that the owner/developer
possess the financial capability to undertake such a development project. Similar administrative
measure may be set up for public sector construction projects. If the funding is from an overseas
aid agency, then all the necessary documentations required for the release of the fund must be
expeditiously forwarded to the funding agency so that monthly progress payment to the
contractor will not be delayed. If financing of the project is no longer a problem with the
measure discussed earlier, there is a strong need to professionalize the project management teams
of owners so that decisions and progress payments to the contractors can be made within the
stipulated period. The issue of excessive bureaucracy in project-owner organization can be
rectified by a truly professional project management team. Owners must be educated to
understand and reminded repeatedly that any delays in making decisions and progress payments
to contractors may lead eventually to construction delays. The costs of construction delays will
be more than any benefits that can be obtained from slow decision making and progress payment
to contractors.
Variation orders that affect schedule performance of the construction project must be kept to a
bare minimum to minimize construction delays whenever possible. One way is to allow more
time for the consultants to obtain all necessary government approval prior to calling tender for
the construction project to minimize the number of variation orders arising from government
requirements. There is no point to ‘fast track’ a construction project when the contract document
is not ready. In fact, some of the ‘fast track’ projects suffered lengthy construction delay worse
than that for normal projects. Some of the variation orders for building contracts can be
minimized by joint review by the design team during the working drawing stage to minimize any
discrepancies in the architectural, structural, mechanical, and electrical drawings that may lead to
variation orders. Once the construction contract commences, changes that affect critical activities
must be avoided whenever possible. The owners or engineers/architects must convene regular
project meetings to be attended by all consultants and contractor to achieve better
communication and co-ordination among project participants. It is also necessary to discuss
jointly among all project participants to resolve any issue that may arise that requires the
issuance of variation order so that the necessity for variation orders can be minimized.
The construction delay factors under the contractor category are: ‘late delivery/shortage of
construction materials’, ‘ineffective planning and scheduling’, ‘equipment (or operator)
availability and failure’, and ‘poor site management and supervision’. The non-compensable
construction delay factors such as ‘late delivery/shortage of construction materials’, ‘ineffective
planning and scheduling’, ‘equipment (or operator) availability and failure’, and ‘poor site
management and supervision’ identified by the present study are strong evidences that there is a
need to professionalize contractors in Kenya. One of the crucial steps is for contractors to

Top Construction Delay Factors for Kenya
~ 125 ~
employ technical professionals so that a competent project team will be involved in the project.
This is consistent with the findings of Kog et al. (1999) and Chua et al. (1999) that project
manager competency is one of the critical success factors in schedule performance. The aim is to
improve their planning and scheduling (including the ordering and delivery of construction
materials and procurement of equipment), site management and supervision, and site
coordination of the project. Most of the local contractors are family business and they are very
reluctant to trust technical professionals outside the family. More importantly, they fear that the
overheads of the contractor’s company will be increased resulting inevitably in higher tender
prices. This may lead to failure in securing any project in the cut-throat ‘destructive’ competition
in tender. Fortunately, with better educated second generation taking over the helm, there will be
increasingly a changing trend towards professionalizing the project team. The younger
contractors recognize that the benefits of a professional project team outweigh its costs. Despite
the existence of the classification system for contractors in Kenya, the schedule performance of
contractors needs to be improved further judging from the findings of the present study. Annual
review of the classification system of contractors is needed. The contractor’s classification
system has to be tightened by including feedbacks from owners and consultants on the schedule
performance of construction projects for the last 5 years when assessing the appropriate class of
the contractor during the annual review in addition to the current criteria. This requirement is
only for higher classes of contractors. Contractors with inadequate appropriate experience will
not be awarded the tender for any construction projects if the contractor classification is
administered correctly without political influence.
Many of the studies reported herein are related to road construction. Once it starts to rain, it is no
longer possible to carry out any works. It is not possible to control the weather. However, it is
possible to standardize the entitlement for extension of time for inclement weather. The average
numbers of raining days for the last 10 years for each month can be collected from the
Metrological Office and spelled out in the contract document. The extension of time will be
calculated based on the site record of raining days and the average numbers in the contract. This
measure is to prevent inconsistency in the granting of extension of time.
Conclusion
Good schedule performance can only be achieved by identifying the truly top construction delay
factors so that appropriate measures can be implemented to address issues related to the top
construction delay factors. A review of the thirteen studies to identify top construction delay
factors is performed in the present study. Top construction delay factors for construction projects
in Kenya identified by the present study include: ‘finance and payments of completed work by
owner’, ‘late delivery/shortage of construction materials’, ‘ineffective planning and scheduling’,
‘variation orders/changes of scope by owner during construction’, ‘inadequate contractor
experience/incompetence contractor’, ‘equipment (or operator) availability and failure’, ‘poor
site management and supervision’, ‘financing by contractor’, ‘inclement weather’, ‘incompetent
project team of owner’, and ‘excessive bureaucracy in project-owner organization’. Remedial
measures to address issues related to the top delay factors include requiring the owner to submit
all the necessary financial documents for an exclusive bank account to be set up strictly for the
construction project only. The current contractor classification system must be tightened by

Top Construction Delay Factors for Kenya
~ 126 ~
including the contractor’s schedule performance of past years during the annual review. There is
a strong need to professionalize the project team of owners and contractors. The construction
delay can be further minimized by improving communication by timely design review meetings
for owner and consultants, and regular project meetings for owner, consultants and contractor.
The practical implication for the construction industry in Kenya is the level of improvement in
the schedule performance of construction projects in Kenya will depend on the extent the various
remedial measures have been implemented rigorously.
References
Awuor, A. P. (2015). “Factors influencing implementation of construction projects in public
secondary schools in Kabondo division, Homabay county, Kenya.” thesis for the Master of
Arts Degree in Project Planning and Management, The University of Nairobi, Nairobi,
Kenya, 85p.
Chua, D. K. H., Kog, Y. C. & Loh, P. K. (1999). “Critical success factors for different project
objectives”, Journal of Construction Engineering and Management, American Society of
Civil Engineers, 125(3), 142-150
Kagiri, D., & Wainaina, G. (2008). “Time and cost overruns in power projects in Kenya: a case
study of Kenya Electricity Generating Company Limited.” Paper presented at the 4th
International Operations Research Society of Eastern Africa (ORSEA) Conference.
Kahiga, L. W. (2015). “Factors influencing completion of irrigation projects in Kenya: a case of
national irrigation board projects in Mount Kenya region”, thesis for the Master of Arts in
Project Planning and Management, The University of Nairobi, Nairobi, Kenya, 72p.
Kariungi, S. M. (2014). “Determinants of timely completion of projects in Kenya: a case of
Kenya Power and Lighting Company.” ABC Journal of Advanced Research, 3(2), 9-19
Kog Y. C., Chua, D. K. H., Loh, P. K. & Jaselski, E. J. (1999). “Key determinants for
construction schedule performance”, International Journal of Project Management, The
Journal of the International Project Management Association, 17(6), Pergamon, UK, 351-359
Kog, Y. C. & Loh, P. K. (2012). “Critical success factors for different components of
construction projects.” Journal of Construction Engineering and Management, American
Society of Civil Engineers, 138 (4), 1-9
Kog, Y. C. (2017a). “Major Delay factors for Construction Projects in Ghana”, Journal for the
Advancement of Performance Innovation and Value, 9(1), CIB Performance Based Studies
Research Group, Arizona State University, 96-105
Kog, Y. C. (2017b). “Major Delay factors for Construction Projects in Iran”, International
Journal of Construction Project Management, 9(2), Nova Science Publishers Inc., New
York, NY, USA, 83-97
Kog, Y. C. (2017c). “Major Delay factors for Construction Projects in Nigeria”, International
Journal of Architecture, Engineering and Construction, 6 (2), June, International Association
for Sustainable Development and Management (IASDM) and North China University of
Water Resources and Electric Power, Toronto, Ontario, Canada, 46-54
Kog, Y. C. (2017d). “Major construction delay factors of Jordan, UAE, Pakistan and Sri Lanka”,
International Journal of Architecture, Engineering and Construction, 6(4), December,
International Association for Sustainable Development and Management (IASDM) and

Top Construction Delay Factors for Kenya
~ 127 ~
North China University of Water Resources and Electric Power, Toronto, Ontario, Canada,
13-25
Kog, Y. C. (2018). “Major construction delay factors of Portugal, UK and US”, Practice
Periodical on Structural Design and Construction, 23(4), 04018024-1 to 04018024-8
https://doi.org/10.1061/(ASCE)SC.1943-5576.0000389, November, American Society of
Civil Engineers
Kwatsima, S. A. (2015). An investigation into the causes of delay in large civil engineering
projects in Kenya. Master of Science Degree in Construction Engineering and Management,
Jomo Kenyatta University of Agriculture and Technology, Juja, Kenya, 79p.
Musa, G. H. (1999). Determination of factors influencing projects delays in water projects in
Kenya: the case of government funded projects. Thesis for the Degree of Master of Business
Administration, University of Nairobi, Nairobi, Kenya
Mwandali, D. (1996). Analysis of major factors that affect projects management: a case of
Kenya railways projects. Thesis for the Degree of Master of Business Administration,
University of Nairobi, Nairobi, Kenya
Mwawasi, S. W. (2015). “Time And Cost Overruns In Road Construction Projects In Kenya
Under Kenya National Highways Authority.” Degree of Master of Business Administration,
School of Business, University of Nairobi, Nairobi, Kenya, 52p.
Okello, O. O. (2015). Determinants of delay in public sector building construction projects in
Kisumu city, Kenya, Degree of Master of Arts in Project Planning and Management thesis,
University of Nairobi, Nairobi, Kenya, 113p.
Ondari, P. O. & Gekara, J. M. (2013). “Factors influencing successful completion of roads
projects in Kenya.” International Journal of Social Sciences and Entrepreneurship, 1(5), 26-
48
Seboru, M.A. (2015). “An Investigation into Factors Causing Delays in Road Construction
Projects in Kenya.” American Journal of Civil Engineering, 3(3), 51-6, doi:
10.11648/j.ajce.20150303.11
Talukhaba, A. A. (1988). Time and cost performance of Construction Project. Master of Arts in
Building Management in the Department of Land Development, University of Nairobi,
Nairobi, Kenya, 229p.
Talukhaba, A. A. (1999). An investigation into factors causing construction project delays in
Kenya: case study of high rise building projects in Nairobi, Doctoral dissertation,
Department of Building Economics and Management, University of Nairobi, Nairobi, Kenya,
290p.
Wambugu, D. M. (2013). “Determinant of successful completion of rural electrification projects
in Kenya: A case study of Rural Electrification Authority.” International Journal of Social
Sciences and Entrepreneurship, 1(2), 549-560

Journal for the Advancement of Performance
Information and Value Vol.10 I.2 December 2018
© K S M , I n c | 128
Table of Contents
Title Author(s) Page
W117 Research Roadmap Report: Creating
Information Workers through Performance
Information
W117 Editorial Board
& Contributors 10
Risk Factors and Potential Solutions for the
Construction Industry in China
Yutian Chen,
Oswald Chong 34
The Best Value Approach in Facility
Management: A Case on Cleaning-Related
Services
Violette Krouwel 48
Current Approaches and Models of
Complexity Research Isaac Kashiwagi 60
Current BIM Practices Amongst MEP
Contractors and Suggestions for Improvement
Chara Farquharson
Jake Gunnoe
Alfredo O. Rivera
76
Construction Portfolio Performance
Management Using Key Performance
Indicators
Mohsen Shahandashti,
Baabak Ashuri
Ali Touran
Reza Masoumi
Edward Minchin
85
Case Study of a Local Government
Organization’s IT Project Implementation
Dean T. Kashiwagi,
Jacob S. Kashiwagi, 102
Top Construction Delay Factors for Kenya Yue Choong KOG 117