december 2018...6 our purpose we are committed to serving those linked to the land, helping to...
TRANSCRIPT
1
Strategy OverviewDecember 2018
2
Safe Harbor Statement & Disclosures
This presentation includes forward-looking comments subject to important risks and
uncertainties. It may also contain financial measures that are not in conformance with
accounting principles generally accepted in the United States of America (GAAP).
Refer to Deere’s reports filed on Forms 8-K (current), 10-Q (quarterly), and 10-K (annual) for
information on factors that could cause actual results to differ materially from information in this
presentation and for information reconciling financial measures to GAAP. Past performance may
not be representative of future results.
Guidance noted in the following slides was effective as of the company’s most recent earnings
release and earnings call (21 November 2018). Nothing in this presentation should be construed
as reaffirming or disaffirming such guidance.
This presentation is not an offer to sell or a solicitation of offers to buy any of Deere’s securities.

3
Table of Contents
Slide
John Deere Strategy 4
Macroeconomic Tailwinds 26
Appendix 31

4
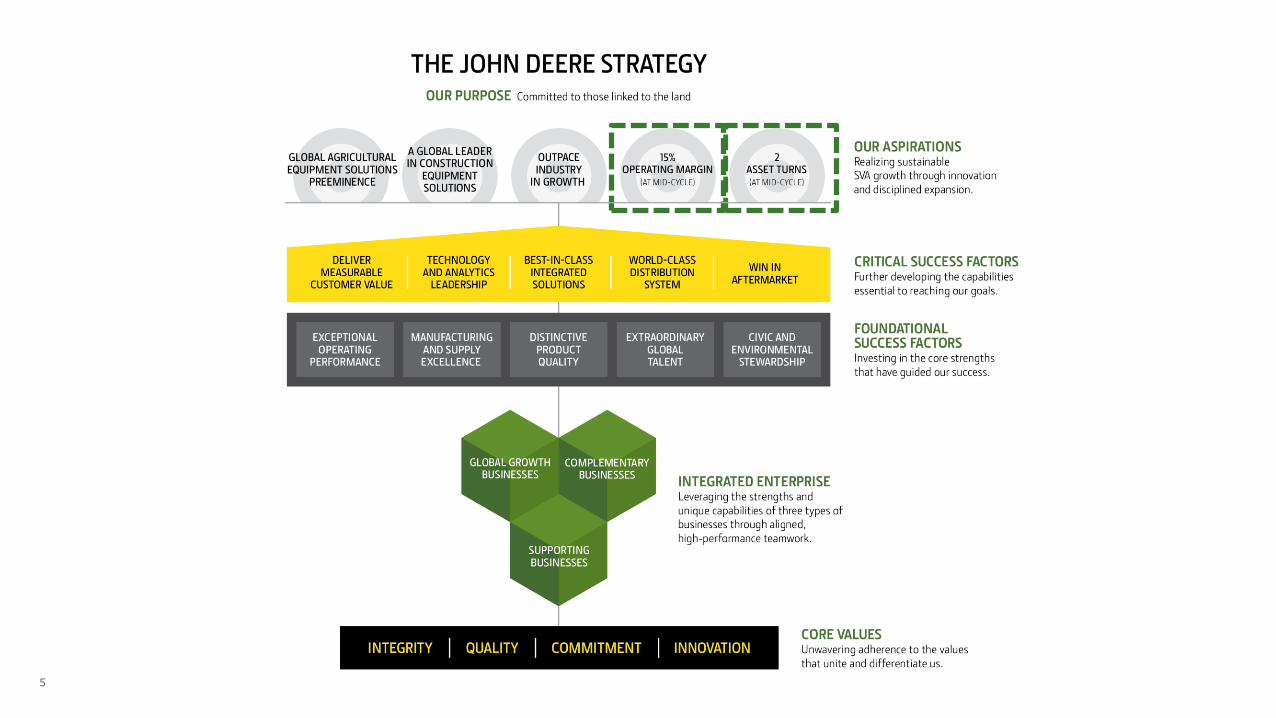
John Deere Strategy
5

6
Our Purpose
We are committed to serving those linked to the land,
helping to improve living standards for people everywhere.
– Our business aims to consistently deliver superior value to all stakeholders.
– Our purpose guides us as we continue the journey our founder began in 1837.
We believe that journey leads to a future that holds great promise and opportunity.

7
Long-Term Macroeconomic Tailwinds – Still Intact
Population growing in size and affluence– By 2050, world population will reach ~ 9.8 billion, up from ~ 7.6 billion today
– Large middle class emerging in China, India and other parts of Asia
Opportunity #1: Feeding the world– Agricultural output needs to increase roughly 50% over the first half of the century
– Natural resources under strain, especially water and land
Opportunity #2: Massive urbanization– Migration from rural areas creates need for infrastructure development
– By 2050, nearly 70% of the global population will live in urban areas, up from more than 55% today
Source: UN, May 2018

8
Our Aspirations
Realizing sustainable SVA growth through innovation and disciplined expansion

9
Sustainable SVA* growth is delivered by:– Distinctively serving our customers, employees and investors
– Extending and enhancing our solid financial and operating performance throughout the cycle
Our challenge:– To attract more customers to the John Deere Experience across our key geographies in a profitable
manner that meets local needs while leveraging anticipated tailwinds and our global scale
SVA Growth through Innovation and Disciplined Expansion
* Shareholder Value Added

10
Our Aspirations
Leading the world in premium agriculture equipment and precision solutions
Providing innovative construction and road-building equipment solutions with distinctive quality in key markets around the world
11
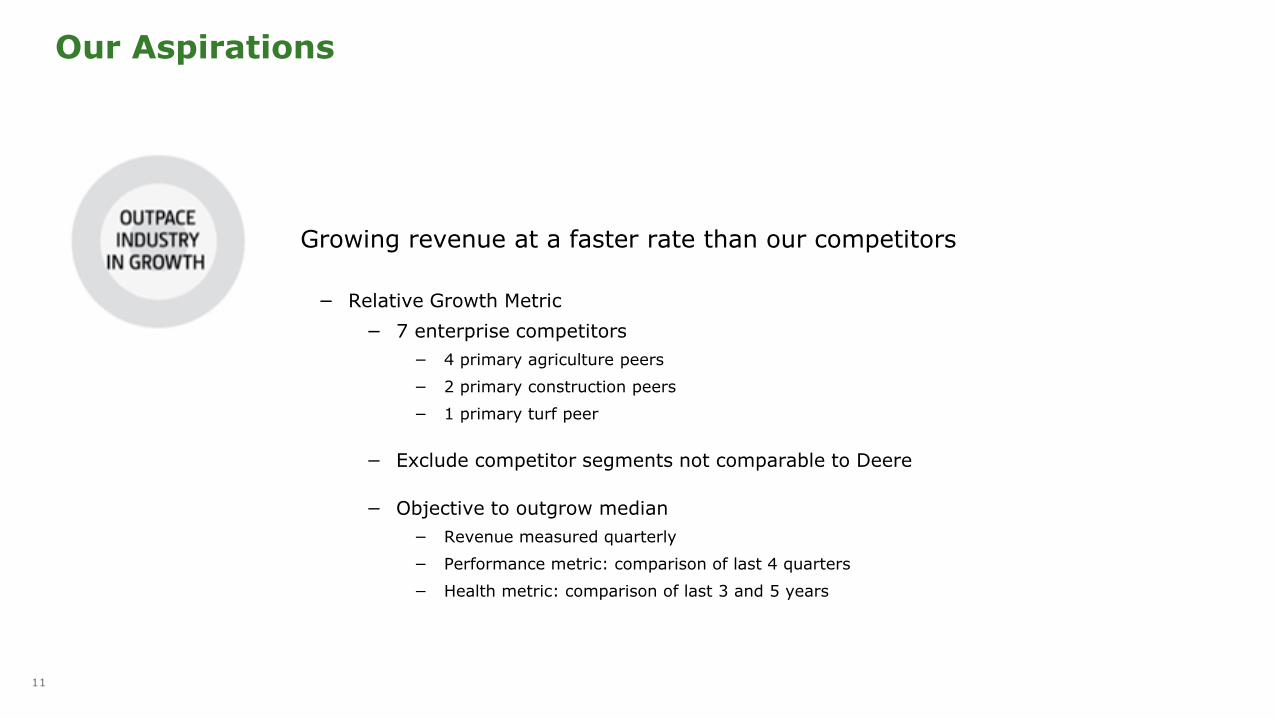
Our Aspirations
Growing revenue at a faster rate than our competitors
− Relative Growth Metric
− 7 enterprise competitors
− 4 primary agriculture peers
− 2 primary construction peers
− 1 primary turf peer
− Exclude competitor segments not comparable to Deere
− Objective to outgrow median
− Revenue measured quarterly
− Performance metric: comparison of last 4 quarters
− Health metric: comparison of last 3 and 5 years
12
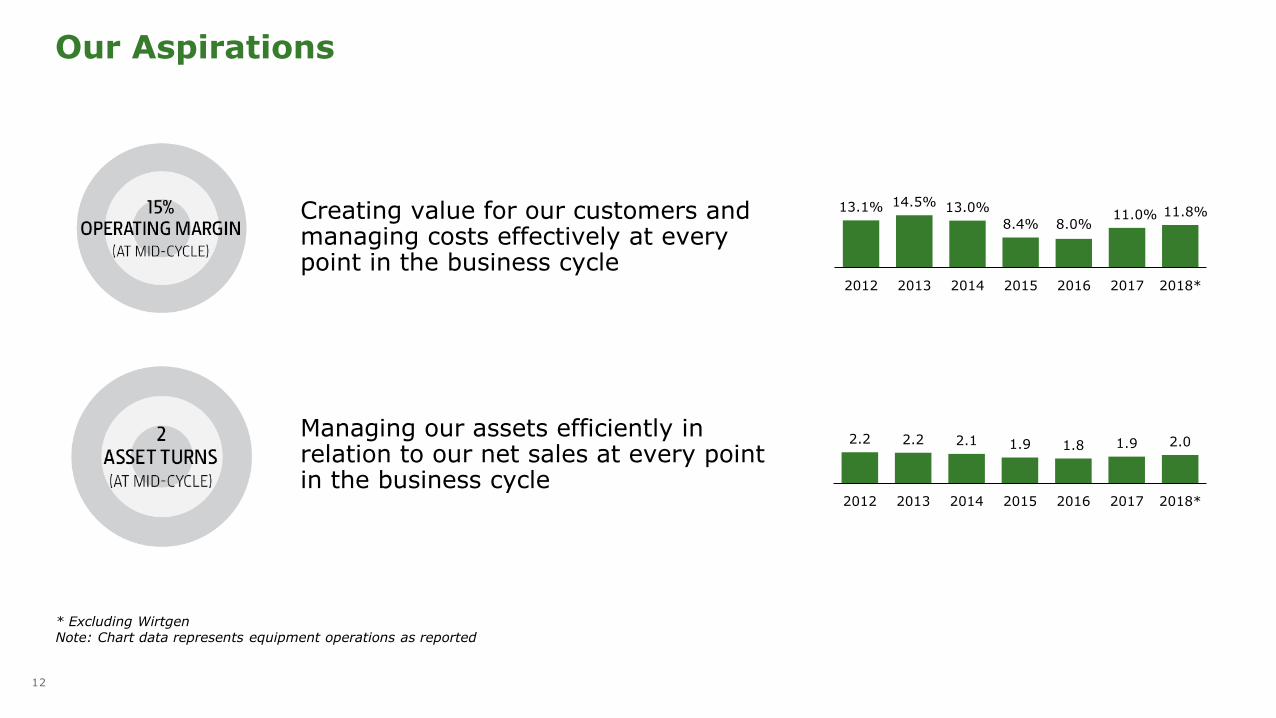
Our Aspirations
Creating value for our customers and managing costs effectively at every point in the business cycle
Managing our assets efficiently in relation to our net sales at every point in the business cycle
13.1% 14.5% 13.0%
8.4% 8.0%11.0% 11.8%
2012 2013 2014 2015 2016 2017 2018*
2.2 2.2 2.1 1.9 1.8 1.9 2.0
2012 2013 2014 2015 2016 2017 2018*
* Excluding WirtgenNote: Chart data represents equipment operations as reported
13
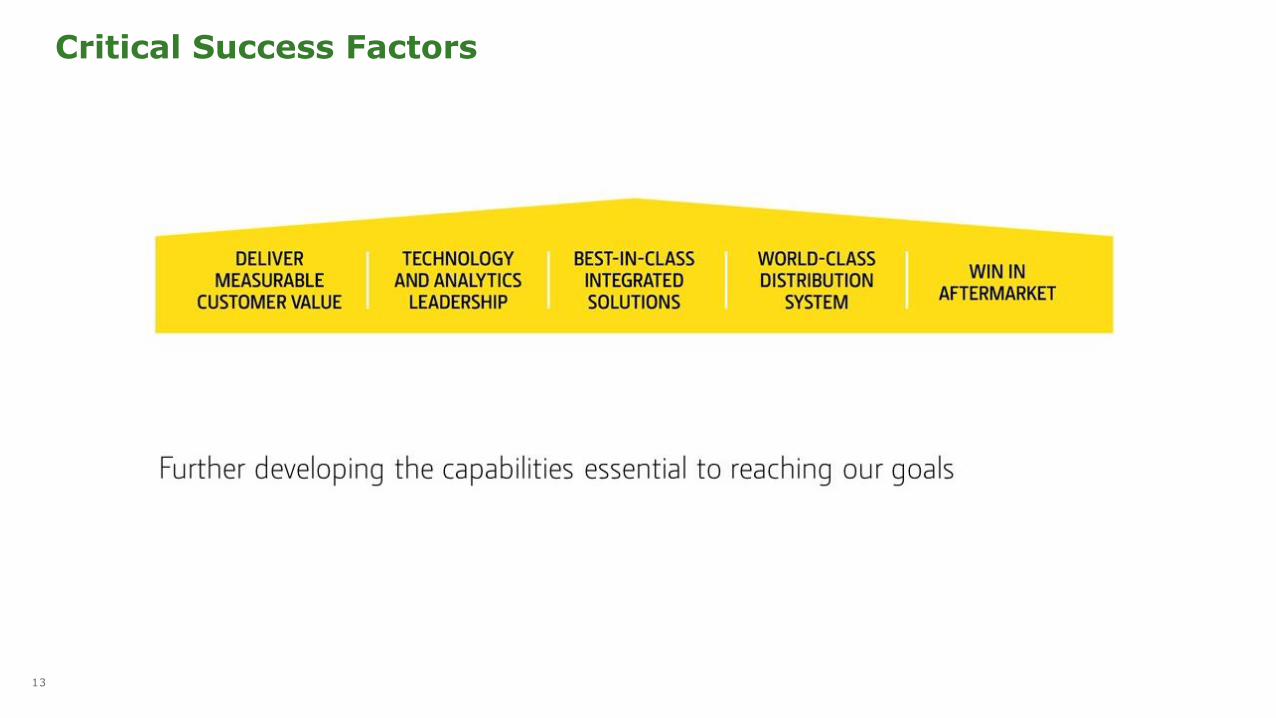
Critical Success Factors
14
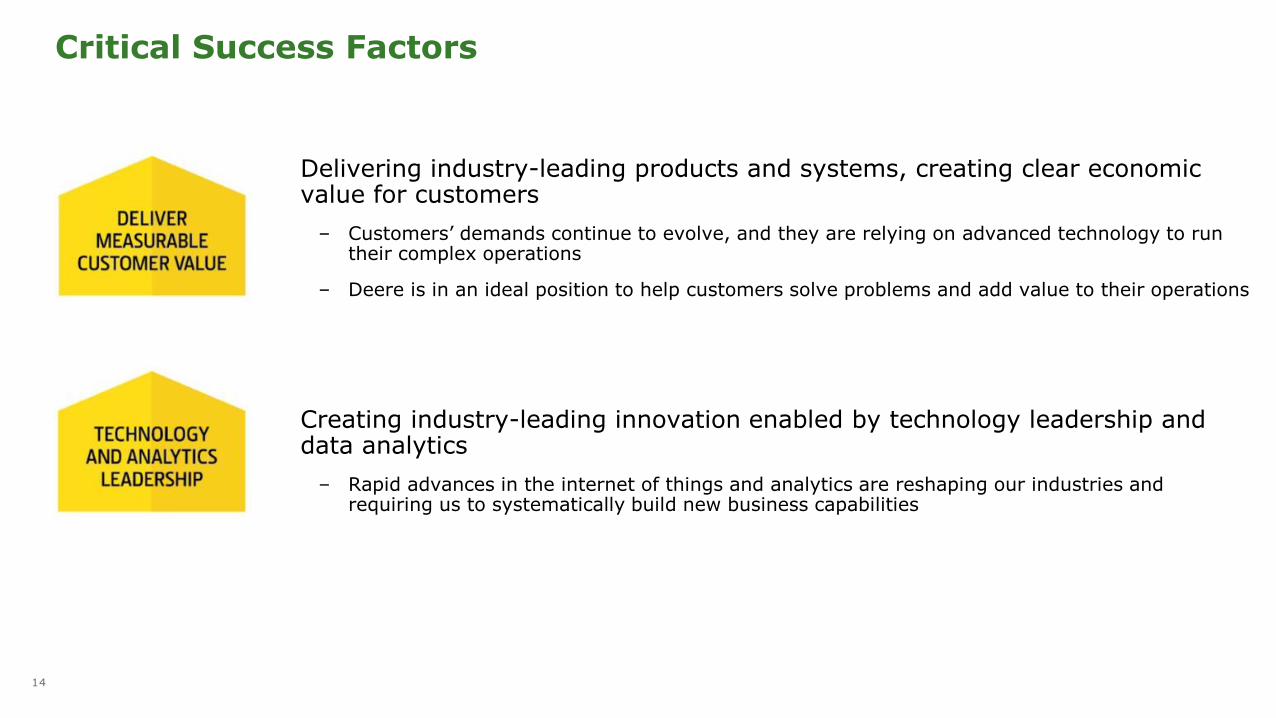
Critical Success Factors
Delivering industry-leading products and systems, creating clear economic value for customers
– Customers’ demands continue to evolve, and they are relying on advanced technology to run their complex operations
– Deere is in an ideal position to help customers solve problems and add value to their operations
Creating industry-leading innovation enabled by technology leadership and data analytics
– Rapid advances in the internet of things and analytics are reshaping our industries and requiring us to systematically build new business capabilities
15
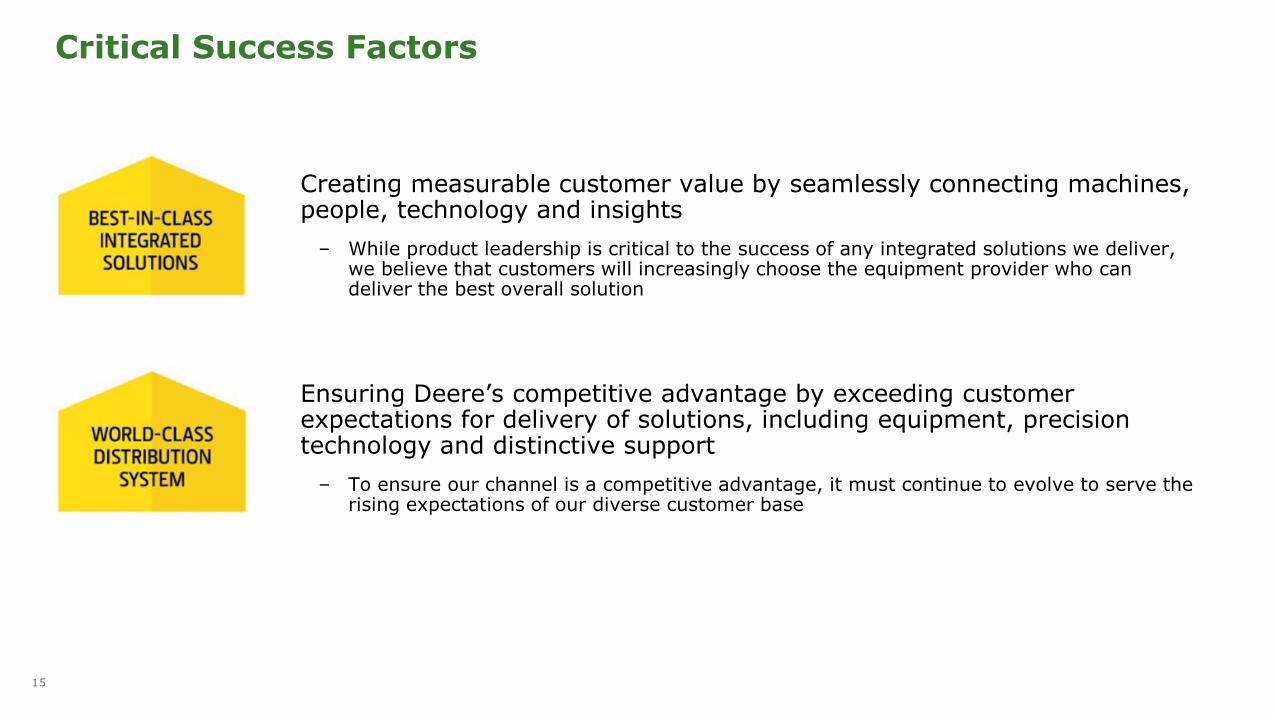
Critical Success Factors
Creating measurable customer value by seamlessly connecting machines, people, technology and insights
– While product leadership is critical to the success of any integrated solutions we deliver, we believe that customers will increasingly choose the equipment provider who can deliver the best overall solution
Ensuring Deere’s competitive advantage by exceeding customer expectations for delivery of solutions, including equipment, precision technology and distinctive support
– To ensure our channel is a competitive advantage, it must continue to evolve to serve the rising expectations of our diverse customer base
16
Achieving profitable growth of our aftermarket business by providing distinct value to our customers throughout the product lifecycle
– The aftermarket is a critical part of the business for Deere and our dealers in terms of profitability and delivering a distinctive customer experience through the product lifecycle
Critical Success Factors

17
Foundational Success Factors

18
Foundational Success Factors
Managing assets and operating margins to generate operating returns on assets greater than our cost of capital at all points in the business cycle
19
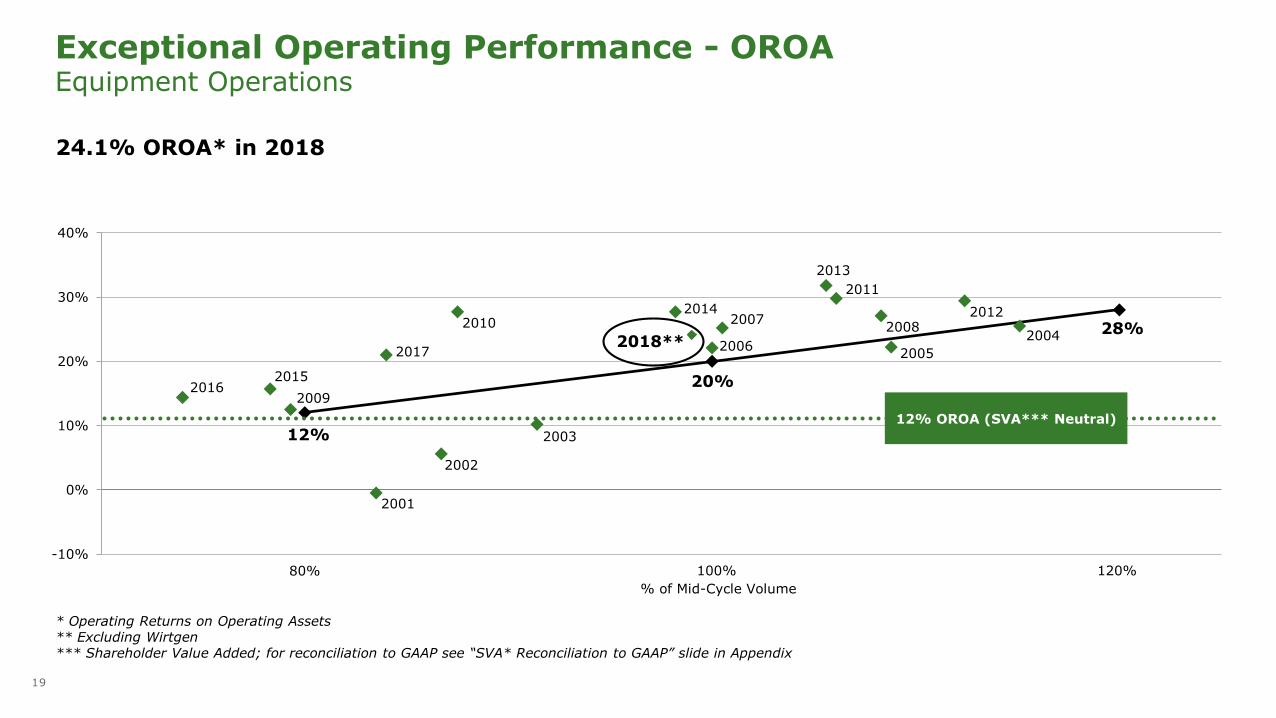
Exceptional Operating Performance - OROAEquipment Operations
* Operating Returns on Operating Assets** Excluding Wirtgen*** Shareholder Value Added; for reconciliation to GAAP see “SVA* Reconciliation to GAAP” slide in Appendix
24.1% OROA* in 2018
12%
20%
28%
2001
2002
2003
2004
20052006
20072008
2009
2010
2011
2012
2013
2014
20152016
2017
-10%
0%
10%
20%
30%
40%
2018**
12% OROA (SVA*** Neutral)
% of Mid-Cycle Volume
80% 100% 120%

20
Exceptional Operating Performance – SVAEquipment Operations
* Shareholder Value Added; for reconciliation to GAAP see “SVA* Reconciliation to GAAP” slide in Appendix** Excluding Wirtgen
$1.8 billion SVA* in 2018
-$2,000
-$1,000
$0
$1,000
$2,000
$3,000
$4,000
1994 1996 1998 2000 2002 2004 2006 2008 2010 2012 2014 2016 2018**
$ M
illions
Adoption of SVA Model
21
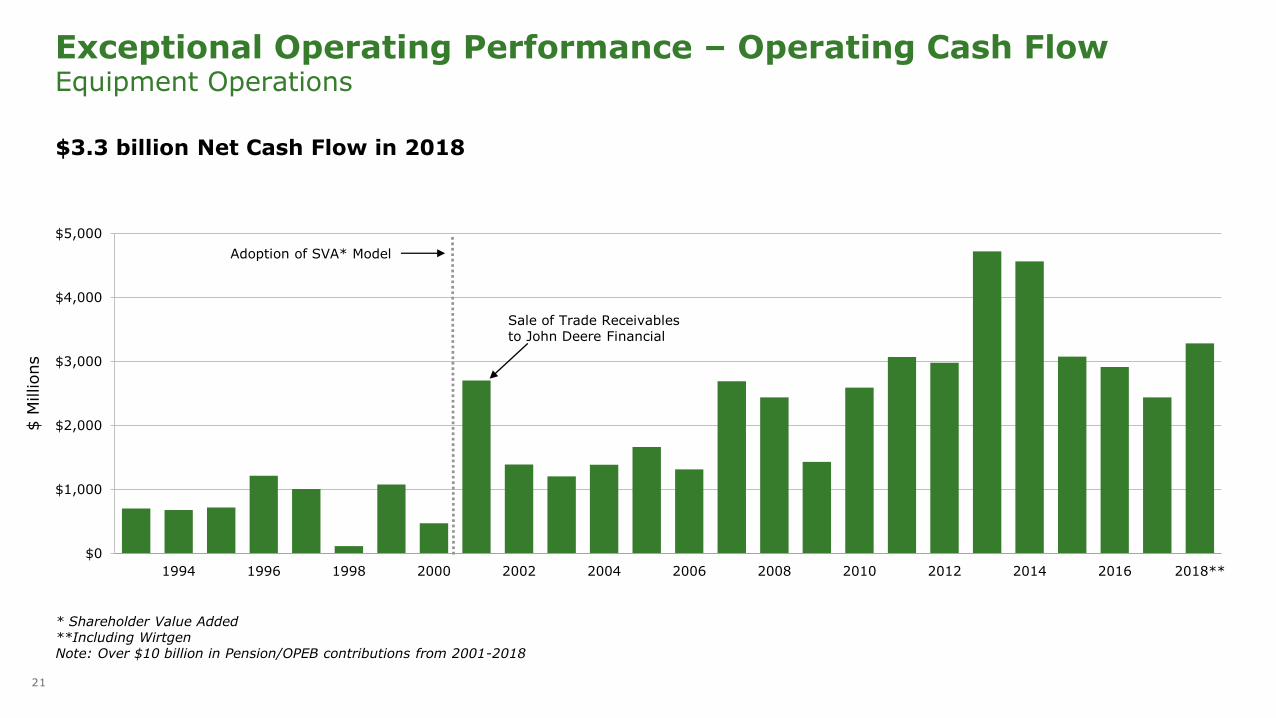
Exceptional Operating Performance – Operating Cash FlowEquipment Operations
* Shareholder Value Added**Including WirtgenNote: Over $10 billion in Pension/OPEB contributions from 2001-2018
$3.3 billion Net Cash Flow in 2018
$0
$1,000
$2,000
$3,000
$4,000
$5,000
1994 1996 1998 2000 2002 2004 2006 2008 2010 2012 2014 2016 2018**
$ M
illions
Sale of Trade Receivables to John Deere Financial
Adoption of SVA* Model

22
Foundational Success Factors
Establishing an efficient cost and asset structure, setting new industry standards for safety and efficiency, and meeting customers’ demand for distinctive product quality
Delivering customer-focused quality that defines, characterizes and supports the John Deere brand – clearly differentiating us from the competition

23
Foundational Success Factors
Attracting, developing and retaining the right mix of talent to meet current and projected business needs
Supporting higher living standards and a sustainable environment for people everywhere through our commitment to those linked to the land
24
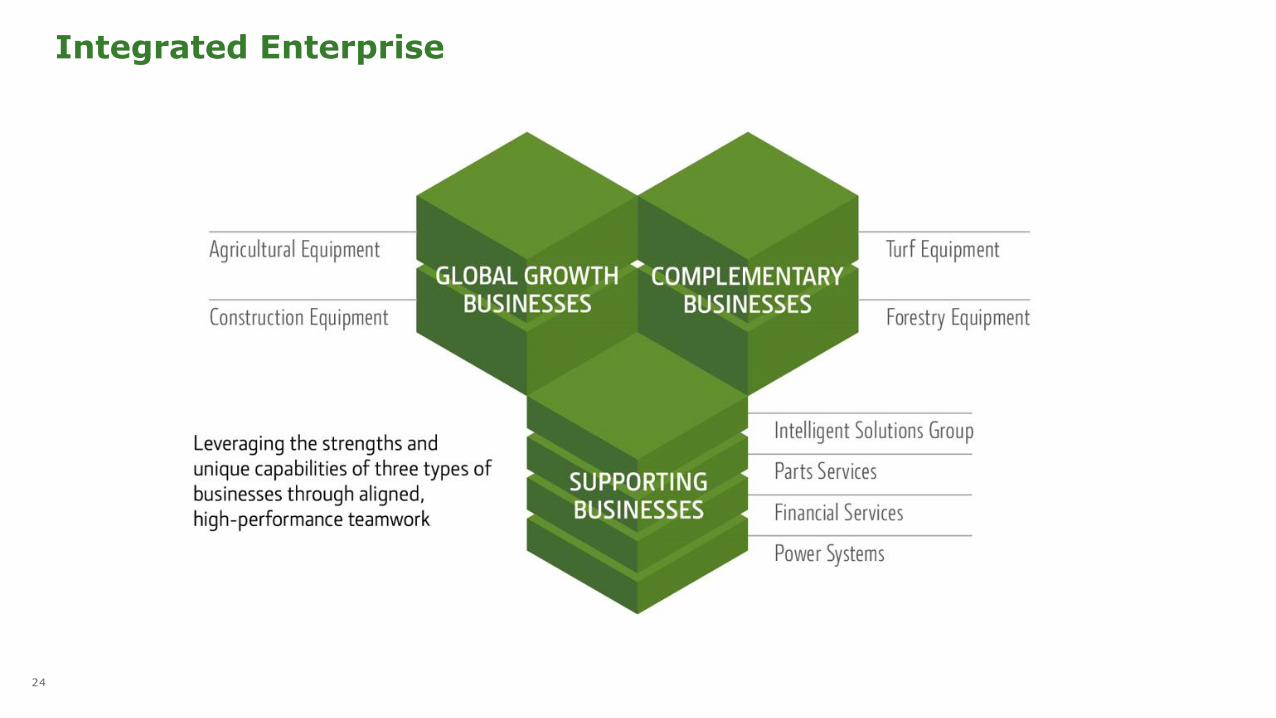
Integrated Enterprise

25
Core Values

26
Macroeconomic Tailwinds

27
Developing Economies Growing Faster
$0
$50
$100
$150
$200
1970 1990 2010 2030 2045
Real GDP
Developed Developing
$ T
rillio
ns*
* 2010$ base** Compound Annual Growth RateSource: IHS Global Insight, November 2018 (country aggregation defined by Global Insight; developing countries inclusive of emerging markets)
CAGR** 1970-2010 2010-2045
Developed 3.3% 1.6%
Developing 6.4% 4.0%
Total 4.0% 2.7%
While developed economies have always accounted for a larger share of GDP, their growth will slow significantly, relative to that of developing economies
28
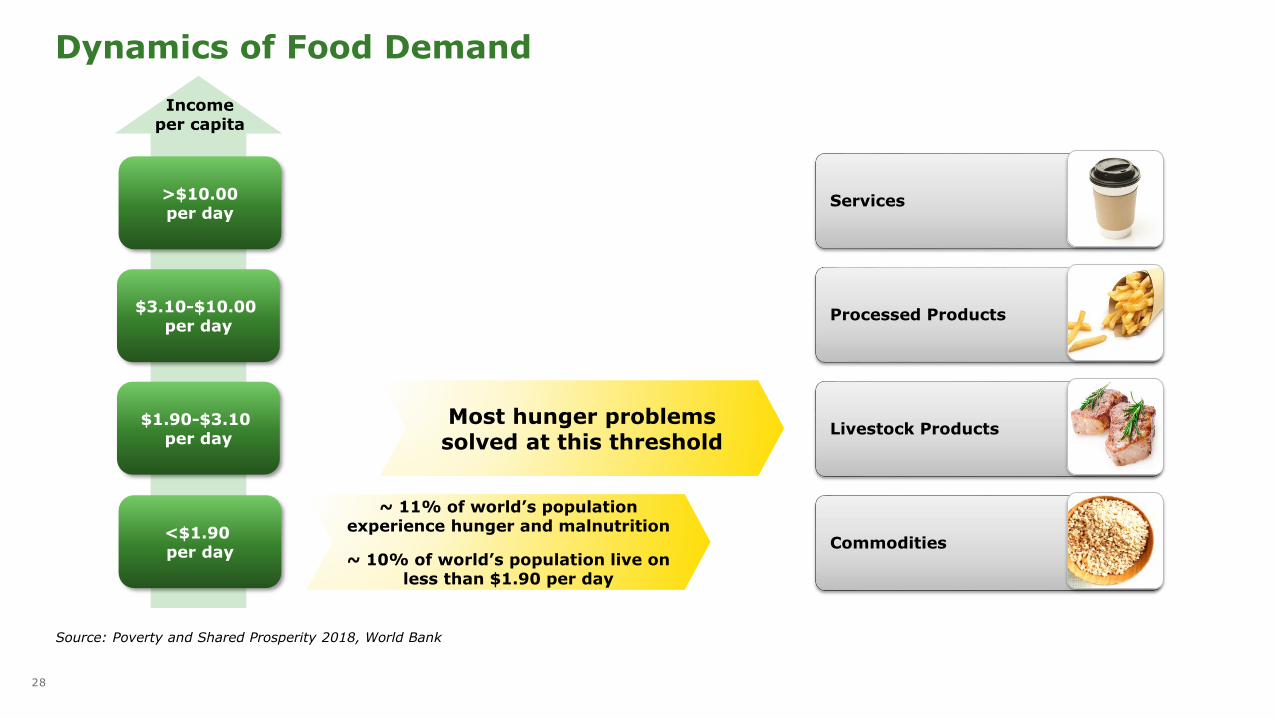
Source: Poverty and Shared Prosperity 2018, World Bank
Dynamics of Food Demand
>$10.00per day
Income per capita
~ 11% of world’s population experience hunger and malnutrition
~ 10% of world’s population live on less than $1.90 per day
$3.10-$10.00 per day
$1.90-$3.10 per day
<$1.90 per day
Services
Processed Products
Livestock Products
Commodities
Most hunger problems solved at this threshold
29
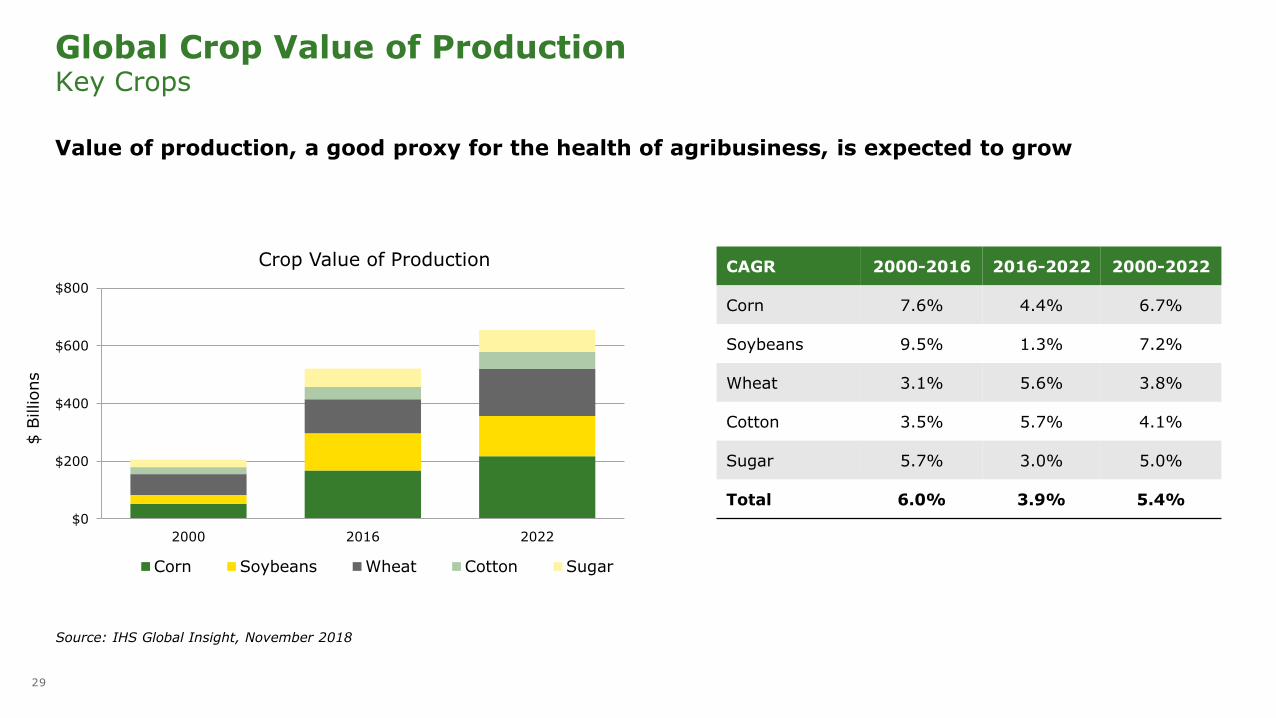
$0
$200
$400
$600
$800
2000 2016 2022
Corn Soybeans Wheat Cotton Sugar
$ B
illions
Source: IHS Global Insight, November 2018
Global Crop Value of ProductionKey Crops
Crop Value of Production CAGR 2000-2016 2016-2022 2000-2022
Corn 7.6% 4.4% 6.7%
Soybeans 9.5% 1.3% 7.2%
Wheat 3.1% 5.6% 3.8%
Cotton 3.5% 5.7% 4.1%
Sugar 5.7% 3.0% 5.0%
Total 6.0% 3.9% 5.4%
Value of production, a good proxy for the health of agribusiness, is expected to grow
30
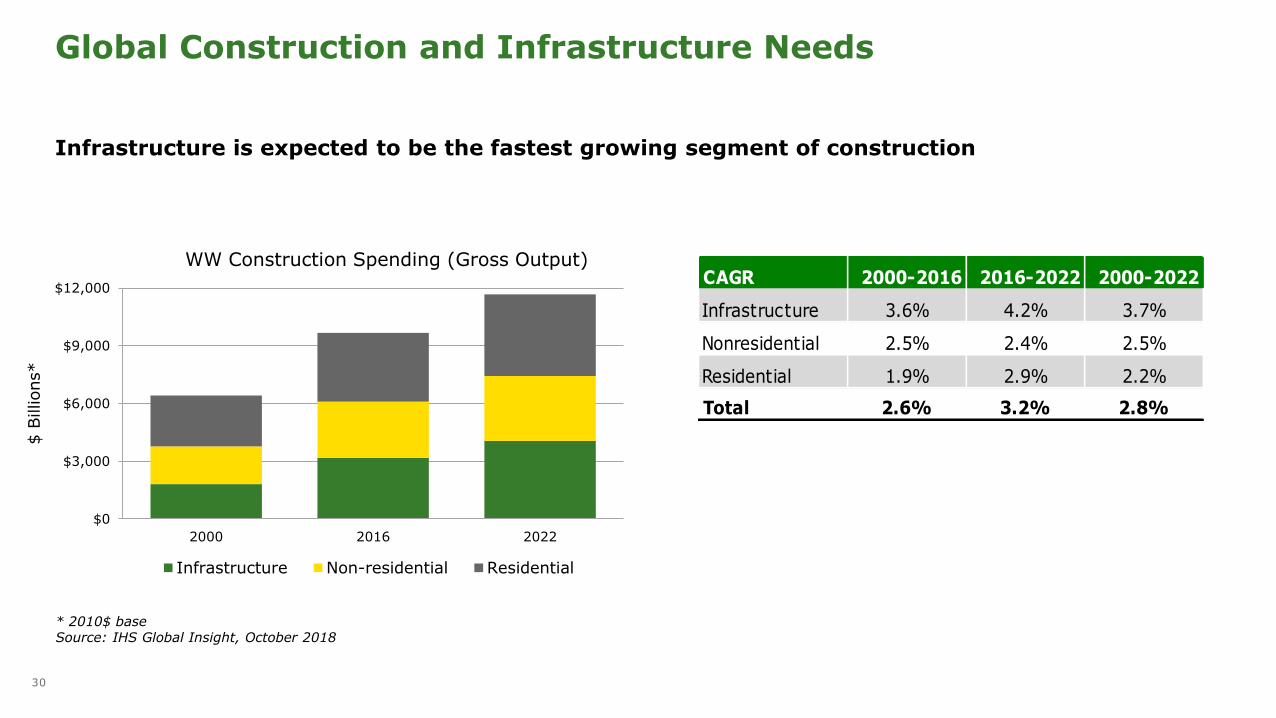
$0
$3,000
$6,000
$9,000
$12,000
2000 2016 2022
Infrastructure Non-residential Residential
$ B
illions*
Infrastructure is expected to be the fastest growing segment of construction
* 2010$ baseSource: IHS Global Insight, October 2018
Global Construction and Infrastructure Needs
WW Construction Spending (Gross Output)CAGR 2000-2016 2016-2022 2000-2022
Infrastructure 3.6% 4.2% 3.7%
Nonresidential 2.5% 2.4% 2.5%
Residential 1.9% 2.9% 2.2%
Total 2.6% 3.2% 2.8%

31
Appendix
32
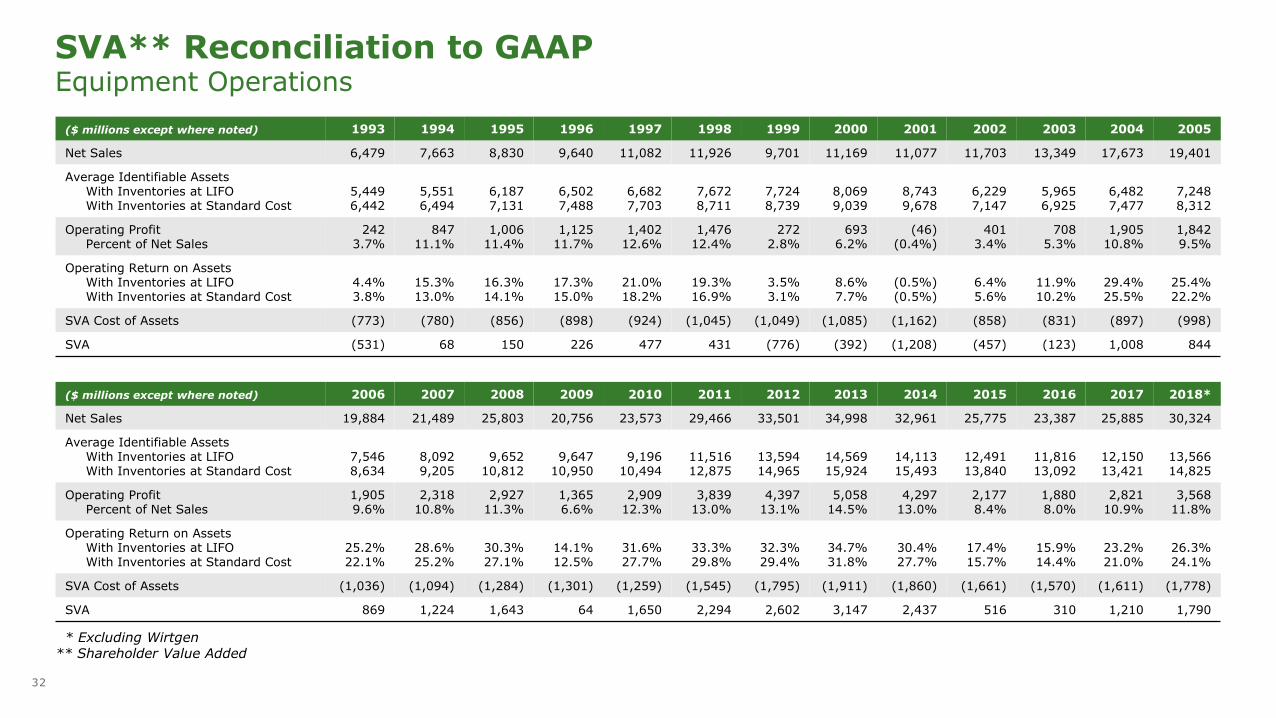
SVA** Reconciliation to GAAPEquipment Operations
* Excluding Wirtgen** Shareholder Value Added
($ millions except where noted) 1993 1994 1995 1996 1997 1998 1999 2000 2001 2002 2003 2004 2005
Net Sales 6,479 7,663 8,830 9,640 11,082 11,926 9,701 11,169 11,077 11,703 13,349 17,673 19,401
Average Identifiable AssetsWith Inventories at LIFOWith Inventories at Standard Cost
5,4496,442
5,5516,494
6,1877,131
6,5027,488
6,6827,703
7,6728,711
7,7248,739
8,0699,039
8,7439,678
6,2297,147
5,9656,925
6,4827,477
7,2488,312
Operating ProfitPercent of Net Sales
2423.7%
84711.1%
1,00611.4%
1,12511.7%
1,40212.6%
1,47612.4%
2722.8%
6936.2%
(46)(0.4%)
4013.4%
7085.3%
1,90510.8%
1,8429.5%
Operating Return on AssetsWith Inventories at LIFOWith Inventories at Standard Cost
4.4%3.8%
15.3%13.0%
16.3%14.1%
17.3%15.0%
21.0%18.2%
19.3%16.9%
3.5%3.1%
8.6%7.7%
(0.5%)(0.5%)
6.4%5.6%
11.9%10.2%
29.4%25.5%
25.4%22.2%
SVA Cost of Assets (773) (780) (856) (898) (924) (1,045) (1,049) (1,085) (1,162) (858) (831) (897) (998)
SVA (531) 68 150 226 477 431 (776) (392) (1,208) (457) (123) 1,008 844
($ millions except where noted) 2006 2007 2008 2009 2010 2011 2012 2013 2014 2015 2016 2017 2018*
Net Sales 19,884 21,489 25,803 20,756 23,573 29,466 33,501 34,998 32,961 25,775 23,387 25,885 30,324
Average Identifiable AssetsWith Inventories at LIFOWith Inventories at Standard Cost
7,5468,634
8,0929,205
9,65210,812
9,64710,950
9,19610,494
11,51612,875
13,59414,965
14,56915,924
14,11315,493
12,49113,840
11,81613,092
12,15013,421
13,56614,825
Operating ProfitPercent of Net Sales
1,9059.6%
2,31810.8%
2,92711.3%
1,3656.6%
2,90912.3%
3,83913.0%
4,39713.1%
5,05814.5%
4,29713.0%
2,1778.4%
1,8808.0%
2,82110.9%
3,56811.8%
Operating Return on AssetsWith Inventories at LIFOWith Inventories at Standard Cost
25.2%22.1%
28.6%25.2%
30.3%27.1%
14.1%12.5%
31.6%27.7%
33.3%29.8%
32.3%29.4%
34.7%31.8%
30.4%27.7%
17.4%15.7%
15.9%14.4%
23.2%21.0%
26.3%24.1%
SVA Cost of Assets (1,036) (1,094) (1,284) (1,301) (1,259) (1,545) (1,795) (1,911) (1,860) (1,661) (1,570) (1,611) (1,778)
SVA 869 1,224 1,643 64 1,650 2,294 2,602 3,147 2,437 516 310 1,210 1,790
