december 2016 suicide in the workplace · 1 suicide in the workplace workplace suicide is a tragic...
TRANSCRIPT

1
Suicide in the workplaceWorkplace suicide is a tragic phenomenon that has grown in recent years in the United States. This article uses Census of Fatal Occupational Injuries data to examine how the frequency of workplace suicides has changed over time and to analyze the distribution of workplace suicides among selected demographic groups and case categories. It introduces propensity ratios as a tool for measuring and comparing the proportional share of workplace suicides among groups.
Suicide in the workplace is a growing concern. According to the U.S. Bureau of Labor Statistics (BLS) Census of Fatal Occupational Injuries (CFOI), 282 workplace suicides occurred in 2013, the highest number recorded since the CFOI series began in 1992.
In “An analysis of workplace suicides, 1992–2001,” Stephen Pegula compared different ways of evaluating the prevalence of workplace suicide among various groups in the labor force. Using traditional incidence rates, he found that workplace suicide occurred most frequently among Whites, men, 35-to-44-year-olds, and wage and salary workers. However, applying relative risk ratios—that is, ratios that show “how much more or less likely a worker in a particular group is to suffer a workplace fatality compared with the average worker”—Pegula found that, although Whites and men still experienced the highest relative levels of workplace suicide, those over 54 years of age and the self-employed experienced the highest relative suicide risk.1 In his examination of occupational groups, Pegula found that, while managerial and professional specialty occupations had the highest counts for workplace suicides, relative risk was highest for farming, forestry, and fishing occupations. Among detailed occupations, police and detectives in public service had the highest relative risk of workplace suicide.
This article analyzes CFOI data and propensity ratios to describe trends in workplace suicide. It extends Pegula’s earlier work by examining the more recent 2011–13 period and expands his work by introducing propensity ratios as a complementary measure for analysis. This article begins with a broad look at how workplace suicides have increased over time. Next, it describes propensity ratios and shows how they are calculated. After that, CFOI data and propensity ratios are presented to compare the prevalence of workplace
Reginald [email protected]
Reginald Harris is an economist in the Branch of Occupational Safety and Health Statistics, Office of Field Operations, Atlanta Regional Office, U.S. Bureau of Labor Statistics.
December 2016

U.S. BUREAU OF LABOR STATISTICS MONTHLY LABOR REVIEW
2
suicide among different demographic groups, major occupational groups, and detailed occupations. Lastly, the article briefly discusses the relationship between military affiliation and workplace suicide risk.
Suicides over timeThe rise in workplace suicides is consistent with the rise in the overall number of suicides in the United States. The Centers for Disease Control and Prevention (CDC) reported that there were 41,149 total suicides in the United States in 2013, compared with 29,199 in 1999—an increase of about 41 percent. During this 15-year period, the number of suicides increased every year but one (2003). According to the CDC, the suicide rate was 10.48 (per 100,000) in 1999, dipped to 10.44 in 2000, and rose to 12.55 by 2013.2 Suicide was the tenth leading cause of all deaths in the United States in 2013, and occurred more than twice as frequently as homicide.3
However, suicides were less likely to occur at the workplace than homicides. Although workplace homicides have declined over time, they occurred about 43 percent more frequently than workplace suicides in 2013.
Workplace suicides have increased in recent years, even as the overall number of workplace fatalities have steadily declined. In 1992, 205 workplace suicides occurred, representing about 3 percent of the 6,217 total workplace fatalities. In 2013, 282 workplace suicides occurred, representing about 6 percent of the 4,585 total workplace fatalities. The fewest workplace suicides, 180, occurred in 2005. From 2007 to 2008, the number of workplace suicides increased by about 34 percent, from 196 to 263, and has remained elevated. (See figure 1.)
Workplace suicides are unique among workplace fatalities because, unlike other workplace fatalities, they occur intentionally and are often prompted by a variety of causal factors and circumstances that are not always easy to determine. Information about individual suicide cases is sometimes sparse, making it difficult for the CFOI to identify and classify such cases. Determining whether suicides are workplace related can be difficult as well. For example, suicides by employees who work from home may be particularly challenging to classify. If the suicide
U.S. BUREAU OF LABOR STATISTICS MONTHLY LABOR REVIEW
3
occurred in the home office, the motive may be entirely unrelated to work. If the suicide occurred somewhere in the home, but outside of the home office, there may be evidence that the suicide was related to business conditions or work.
For a workplace suicide to be included in the CFOI, at least one of the following criteria must be met: (1) the death arose from an injury at the decedent’s work premises while the decedent was there for work; (2) the death occurred away from the work premises, but the decedent was engaged in work activity (e.g., performing work at a client’s premises); or (3) the death was related to the decedent’s work status (e.g., a suicide at home that can be definitively linked back to work). Note that unintentional drug overdoses are not counted as suicides, but they are counted as another type of workplace fatality if they meet CFOI work relationship criteria. The CFOI applies a uniform set of rules to determine whether a fatality is to be considered a workplace fatality.4
CFOI annual counts of workplace suicides are available from 1992 to 2013 and are used for the trend analysis in this article. The detailed analysis of the current risks of workplace suicide is based on data from 2011 through 2013, because 2011 marks the first year that CFOI data were classified in accordance with the Occupational Injury and Illness Classification System (OIICS), version 2.01; the OIICS version 2.01 data are generally not comparable with data from the original OIICS.5
Suicide counts, rates, and propensity ratiosThe CFOI publishes workplace fatality counts by various characteristics, including gender, race, occupation, event, and state of incident. These counts provide an overall understanding of workplace risks and give insight into the circumstances surrounding workplace deaths. For example, if transportation accidents account for the greatest number of workplace fatalities and if heavy-truck drivers are involved in most of those accidents, then reducing transportation accidents by heavy-truck drivers might result in a significant reduction in the overall number of workplace fatalities.
CFOI also publishes fatal injury rates by demographic and case-characteristic categories. Expressed as a count per 100,000 full-time equivalent workers, based on Current Population Survey (CPS) estimates of hours worked,6 these rates are useful for understanding whether the workplace fatality count for a particular group is relatively high or low. For example, 20 work-related suicides for an occupation with more than 1,000,000 workers would be evaluated differently than the same number of suicides for an occupation with fewer than 10,000 workers. The absolute count of fatal work injuries is the same for both groups, but the corresponding relative incidence rates for the two are very different.
Propensity ratios can shed light on differences in the composition or distribution of types of cases for groups sorted by demographic and case-characteristic categories. For example, suppose that from 2011 to 2013, 20 workplace suicides were committed by workers in an occupation that had 100 total workplace fatalities. This would mean that, during a period where only about 6 percent of all workplace fatalities were suicides, 20 percent of the workplace fatalities for this particular occupation were suicides. The distributional share of suicides suffered may be of greater interest to researchers than the absolute count or incidence rate.
Because a propensity ratio is a straightforward calculation of CFOI counts, it is a convenient tool for analyzing hazards and making comparisons among groups. It does not replace the robust measures of fatal injury rates or

U.S. BUREAU OF LABOR STATISTICS MONTHLY LABOR REVIEW
4
relative risk ratios, but is a complementary tool that can lead to additional insights or fill gaps when other analytical tools are not suitable. For example, because hours-worked data related to military occupations are not available from the CPS, fatal injury rates for military occupations and relative risk ratios that require those rates cannot be calculated. But with propensity ratios, it is possible to make limited comparisons of military occupations with other major occupational groups.
A propensity ratio is calculated by dividing the percentage of an attribute occurring in a specific group by the percentage of the specific group in the population. The formula for calculating propensity ratios for workplace suicides follows:
(1)
Where:
P = Propensity ratio
Sx = Workplace suicides attributed to a group (x)
S = All workplace suicides
Fx = Workplace fatalities attributed to a group (x)
F = All workplace fatalities
Equation (1) can be rewritten in the following form, which adds an intuitive interpretation to the propensity ratio:
(2)
Propensity ratios higher than 1.00 indicate a higher propensity for an attribute; propensity ratios lower than 1.00 indicate a lower propensity an the attribute. A propensity ratio of 1.00 is neutral. For example, suicides in the private retail trade industry made up 9.0 percent of the total workplace suicides from 2011 to 2013, while, during the same period, only 5.8 percent of all workplace fatalities occurred in that industry. Dividing 9.0 by 5.8 yields a propensity ratio of 1.55. This ratio means that the proportion of workplace suicides in the private retail trade industry was 55 percent higher than the proportion of that industry's share of workplace fatalities. Interpreted differently, this ratio means that, compared with the rest of the workforce, private industry retail trade workers had a disproportionately higher share of workplace suicides.
Suicide counts and propensity ratios by gender
From 2011 to 2013, workplace suicides were much more likely to involve men than women. During that period, there were 781 workplace suicides, 732 (93.7 percent) of which involved men and 49 (6.3 percent) of which involved women. This compares with 13,906 workplace fatalities that occurred during this period, of which men accounting for 92.4 percent and women accounting for 7.6 percent.
U.S. BUREAU OF LABOR STATISTICS MONTHLY LABOR REVIEW
5
The propensity ratio of workplace suicide for men during this period was 1.01, which shows that the proportion of men whose death was attributable to workplace suicide was 1 percent higher than the proportion of men who suffered a workplace fatality of any kind. If a man died from a workplace injury, it was slightly more likely that the death occurred from suicide than from any other type of workplace injury. The propensity ratio of workplace suicide for women over this period was 0.83. Women suffered workplace suicide 17 percent less frequently than they suffered all other types of workplace fatalities. Thus, if a woman died from a workplace injury, it was less likely that her death was self-inflicted.
Suicide counts and propensity ratios by age group
Generally, the risk of suffering a workplace fatality increases with age. From 2011 to 2013, CFOI fatal injury rates tended to increase with each successive age group. The lone exception is the 18–19 age group; in 2013, the fatal injury rate for this group was higher than that for the next two age groups (20–24 and 25–34).7 But the propensity for workplace suicide has not followed this same pattern.
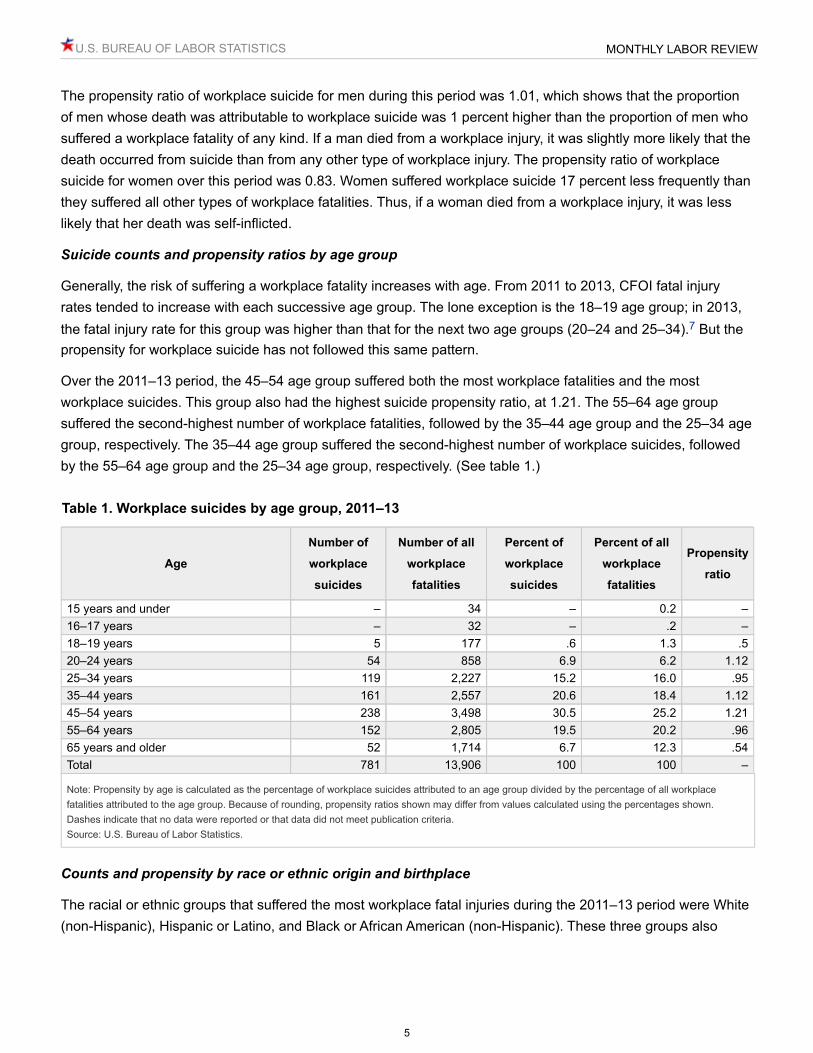
Over the 2011–13 period, the 45–54 age group suffered both the most workplace fatalities and the most workplace suicides. This group also had the highest suicide propensity ratio, at 1.21. The 55–64 age group suffered the second-highest number of workplace fatalities, followed by the 35–44 age group and the 25–34 age group, respectively. The 35–44 age group suffered the second-highest number of workplace suicides, followed by the 55–64 age group and the 25–34 age group, respectively. (See table 1.)
Note: Propensity by age is calculated as the percentage of workplace suicides attributed to an age group divided by the percentage of all workplace fatalities attributed to the age group. Because of rounding, propensity ratios shown may differ from values calculated using the percentages shown. Dashes indicate that no data were reported or that data did not meet publication criteria.Source: U.S. Bureau of Labor Statistics.
Counts and propensity by race or ethnic origin and birthplace
The racial or ethnic groups that suffered the most workplace fatal injuries during the 2011–13 period were White (non-Hispanic), Hispanic or Latino, and Black or African American (non-Hispanic). These three groups also
Age
Number of
workplace
suicides
Number of all
workplace
fatalities
Percent of
workplace
suicides
Percent of all
workplace
fatalities
Propensity
ratio
15 years and under – 34 – 0.2 –16–17 years – 32 – .2 –18–19 years 5 177 .6 1.3 .520–24 years 54 858 6.9 6.2 1.1225–34 years 119 2,227 15.2 16.0 .9535–44 years 161 2,557 20.6 18.4 1.1245–54 years 238 3,498 30.5 25.2 1.2155–64 years 152 2,805 19.5 20.2 .9665 years and older 52 1,714 6.7 12.3 .54Total 781 13,906 100 100 –
Table 1. Workplace suicides by age group, 2011–13

U.S. BUREAU OF LABOR STATISTICS MONTHLY LABOR REVIEW
6
suffered the most workplace suicides. From 2011 to 2013, White (non-Hispanic) victims incurred 9,625, or 69.2 percent, of all workplace fatalities and 597, or 76.4 percent, of all workplace suicides.
Although these three groups had the highest numbers of workplace suicide, they had the lowest propensity ratios for workplace suicide. The White (non-Hispanic) group had a propensity ratio of 1.10, and the Black or African-American (non-Hispanic) and Hispanic or Latino groups had propensity ratios of less than 1.00. The Asian (non-Hispanic) group accounted for a relatively low 2.8 percent of all workplace fatalities, but it accounted for 5.5 percent of workplace suicides, which meant the propensity ratio for the group was 1.95. The American-Indian or Alaska Native (non-Hispanic) group accounted for a small portion of workplace fatalities and workplace suicides, but had a propensity ratio of 1.57. Note that the multiple races (non-Hispanic) group had the highest propensity for workplace suicide. (See table 2.)
Note: Propensity by race or ethnic origin is calculated as the percentage of workplace suicides attributed to a racial or ethnic group divided by the percentage of all workplace fatalities attributed to the race or ethnic origin group. Because of rounding, propensity ratios shown may differ from values calculated using the percentages shown. Dashes indicate that no data were reported or that data did not meet publication criteria.Source: U.S. Bureau of Labor Statistics.
Examining the birthplace of victims of workplace suicide reveals that 144 workplace suicides were committed by foreign-born workers and 637 were committed by native-born workers. The propensity ratio for workplace suicide was 1.01 for foreign-born workers and 1.00 for native-born workers. Among foreign-born workers, workers born in Mexico suffered the greatest number of workplace suicides (24), but had the lowest propensity ratio (0.42). (See table 3.)
Race or ethnic origin
Number of
workplace
suicides
Number of all
workplace
fatalities
Percent of
workplace
suicides
Percent of all
workplace
fatalities
Propensity
ratio
White (non-Hispanic) 597 9,625 76.4 69.2 1.10Black or African American (non-Hispanic) 49 1,365 6.3 9.8 .64Hispanic or Latino 75 2,314 9.6 16.6 .58American Indian or Alaska Native (non-Hispanic) 9 102 1.2 .7 1.57
Asian (non-Hispanic) 43 393 5.5 2.8 1.95Native Hawaiian or Pacific Islander (non-Hispanic) – 17 – .1 –
Multiple races (non-Hispanic) 5 32 .6 .2 2.78Other races or not reported (non-Hispanic) – 58 – .4 –Total 781 13,906 100 100 –
Table 2. Workplace suicides by race or ethnic origin, 2011–13
Birthplace
Number of
workplace
suicides
Number of all
workplace
fatalities
Percent of
workplace
suicides
Percent of all
workplace
fatalities
Propensity
ratio
Native born 637 11,360 81.6 81.7 1.00
Table 3. Workplace suicides by birthplace, 2011–13
See footnotes at end of table.

U.S. BUREAU OF LABOR STATISTICS MONTHLY LABOR REVIEW
7
Note: Propensity by birthplace is calculated as the percentage of workplace suicides attributed to a birthplace divided by the percentage of all workplace fatalities attributed to the birthplace. Because of rounding, propensity ratios shown may differ from values calculated using the percentages shown. Dashes indicate that no data were reported or that data did not meet publication criteria. Data may not sum to 100 because of the omission of data that did not meet publication criteria.Source: U.S. Bureau of Labor Statistics.
Suicide counts and propensity ratios by work status and major occupational group
From 2011 to 2013, 78 percent of all workplace fatalities involved wage and salary workers; the remaining 22 percent involved self-employed workers. However, the propensity for workplace suicide was higher for the self-employed than it was for wage and salary earners. The self-employed had a propensity ratio of 1.33, while wage and salary workers had a propensity ratio of 0.91.
Among the major occupational groups during the 2011–13 period, management occupations had the most workplace suicides, followed by transportation and material moving occupations, then installation maintenance and repair occupations. During that period, 118 workplace suicides, or approximately 15 percent of all suicides, involved workers in management occupations; workers in these occupations accounted for approximately 9 percent of all workplace fatalities. Transportation and material moving occupations accounted for 90 workplace suicides, with a propensity ratio of 0.43. Note that the CFOI uses the Standard Occupational Classification system to classify occupations.8
None of the major occupational groups with the highest number of workplace suicides were among the major occupational groups with the highest propensities for workplace suicide. Legal occupations had the highest propensity ratio during this 2011–13 period, followed by computer and mathematical occupations, then military
Birthplace
Number of
workplace
suicides
Number of all
workplace
fatalities
Percent of
workplace
suicides
Percent of all
workplace
fatalities
Propensity
ratio
Foreign born 144 2,546 18.4 18.3 1.01Canada 4 44 .5 .3 1.62China 5 53 .6 .4 1.68Colombia 3 14 .4 .1 3.82Cuba 6 55 .8 .4 1.94Dominican Republic 5 54 .6 .4 1.65El Salvador 3 124 .4 .9 .43Germany 9 50 1.2 .4 3.20Guatemala 3 103 .4 .7 .52India 7 91 .9 .7 1.37Italy 4 15 .5 .1 4.75Korea (North and South) 11 50 1.4 .4 3.92Mexico 24 1,028 3.1 7.4 .42Philippines 6 43 .8 .3 2.48Poland 6 31 .8 .2 3.45United Kingdom 5 26 .6 .2 3.42
Total 781 13,906 100 100 –
Table 3. Workplace suicides by birthplace, 2011–13

U.S. BUREAU OF LABOR STATISTICS MONTHLY LABOR REVIEW
8
occupations. While legal occupations accounted for about 1.5 percent of workplace suicides, they represented a relatively low 0.3 percent of all workplace fatalities, with a propensity ratio of 5.62. (See table 4.)
Suicide counts and propensity ratios by detailed occupation
Among detailed occupations during the 2011–13 period, heavy and tractor-trailer truck drivers had the most workplace suicides, followed by first-line supervisors of retail sales workers and by police and sheriff’s patrol officers. Heavy and tractor-trailer truck drivers committed 46 workplace suicides, even as they accounted for 2,072 of all workplace fatalities; their propensity ratio was 0.40. First-line supervisors of retail sales workers committed 42 workplace suicides and had a propensity ratio of 2.61. Police and sheriff’s patrol officers incurred 20 workplace suicides and had a propensity ratio of 1.13.
The detailed occupations with the highest propensity for workplace suicide were medical scientists, except epidemiologists; personal financial advisors; and general dentists. Although each of these occupations accounted for less than 1 percent of workplace suicides, two of them—medical scientists, except epidemiologists; and personal financial advisors—had propensity ratios greater than 17. All of the workplace fatalities for those two occupations during the 2011–13 period were attributed to suicide. The occupation of general dentists also had few workplace suicides, but it had a propensity ratio of approximately 15, as all but one of the workplace fatalities for that occupation were due to suicides. (See table 4.)
Occupation (Standard Occupational Classification system)Number of
workplace suicides
Percent of
workplace suicides
Propensity
ratio
Management occupations 118 15.1 1.59Management occupations, excluding farmers, ranchers, and other agricultural managers 102 13.1 3.08
Chief executives 8 1 2.34General and operations managers 3 .4 1.72Marketing managers 3 .4 6.68Sales managers 4 .5 2.85Financial managers 4 .5 7.91Transportation, storage, and distribution managers 3 .4 3.14Farmers, ranchers, and other agricultural managers 16 2 .39Construction managers 11 1.4 3.26Food service managers 15 1.9 2.93Lodging managers 5 .6 4.05Medical and health services managers 4 .5 4.19Property, real estate, and community association managers 5 .6 1.37
Business and financial operations occupations 12 1.5 2.93Accountants and auditors 5 .6 7.42Personal financial advisors 3 .4 17.81
Computer and mathematical occupations 7 .9 4.99Architecture and engineering occupations 12 1.5 1.94
Mechanical engineers 3 .4 4.45Life, physical, and social science occupations 14 1.8 3.61
Table 4. Workplace suicides by occupation, 2011–13
See footnotes at end of table.

U.S. BUREAU OF LABOR STATISTICS MONTHLY LABOR REVIEW
9
Occupation (Standard Occupational Classification system)Number of
workplace suicides
Percent of
workplace suicides
Propensity
ratio
Medical scientists, except epidemiologists 5 .6 17.81Community and social services occupations 7 .9 1.52
Clergy 3 .4 1.91Legal occupations 12 1.5 5.62
Lawyers 11 1.4 5.76Education, training, and library occupations 11 1.4 2.39Arts, design, entertainment, sports, and media occupations 7 .9 .85Healthcare practitioners and technical occupations 28 3.6 3.06
Dentists, general 5 .6 14.84Surgeons 3 .4 7.63
Healthcare support occupations 7 .9 2.35Nursing assistants 3 .4 4.11
Protective service occupations 61 7.8 1.43First-line supervisors of police and detectives 3 .4 1.91Correctional officers and jailers 6 .8 4.64Detectives and criminal investigators 4 .5 3.56Police and sheriff's patrol officers 20 2.6 1.13Security guards 19 2.4 1.96
Food preparation and serving related occupations 15 1.9 1.55Chefs and head cooks 3 .4 3.56Waiters and waitresses 4 .5 2.46
Building and grounds cleaning and maintenance occupations 30 3.8 .69First-line supervisors of landscaping, lawn service, and groundskeeping workers 4 .5 .67
Janitors and cleaners, except maids and housekeeping cleaners 13 1.7 2.05
Landscaping and groundskeeping workers 8 1 .55Personal care and service occupations 16 2 1.55
First-line supervisors of personal service workers 3 .4 2.67Sales and related occupations 72 9.2 1.87
First-line supervisors of retail sales workers 42 5.4 2.61First-line supervisors of non-retail sales workers 6 .8 1.87Retail salespersons 12 1.5 2.48Sales representatives, wholesale and manufacturing, except technical and scientific products 3 .4 1.3
Office and administrative support occupations 27 3.5 1.89Postal service mail carriers 3 .4 1.01Stock clerks and order fillers 3 .4 1.48Secretaries and administrative assistants, except legal, medical, and executive 3 .4 4.45
Office clerks, general 4 .5 3.75Farming, fishing, and forestry occupations 14 1.8 .33
First-line supervisors of farming, fishing, and forestry workers 3 .4 1.44
Farmworkers and laborers, crop, nursery, and greenhouse 3 .4 .23Farmworkers, farm, ranch, and aquacultural animals 8 1 1
Table 4. Workplace suicides by occupation, 2011–13
See footnotes at end of table.

U.S. BUREAU OF LABOR STATISTICS MONTHLY LABOR REVIEW
10
Note: Propensity by occupation is calculated as the percentage of workplace suicides attributed to an occupation divided by the percentage of all workplace fatalities attributed to the occupation. Because of rounding, propensity ratios shown may differ from values calculated using the percentages shown. Totals for major categories may include subcategories not shown separately.Source: U.S. Bureau of Labor Statistics.
Military members and veterans
Resident military occupations had a higher propensity for workplace suicide than all but two civilian major occupational groups. There were 46 workplace suicides recorded for military occupations during the 2011–13 period. These occupations accounted for only about 1.3 percent of all workplace fatalities, but they represented about 5.9 percent of all workplace suicides, a propensity ratio of 4.60. The average annual number of workplace suicides over this time, a little more than 15, compared with an annual average of about 10 during the 1992–2010 period. Overall, the annual number of military workplace suicides ranged from a low of 5 in 1998 to a high of 20 in 2013.
Occupation (Standard Occupational Classification system)Number of
workplace suicides
Percent of
workplace suicides
Propensity
ratio
Construction and extraction occupations 44 5.6 .31First-line supervisors of construction trades and extraction workers 15 1.9 .77
Carpenters 6 .8 .6Construction laborers 7 .9 .2Electricians 3 .4 .27Plumbers, pipefitters, and steamfitters 4 .5 .98
Installation, maintenance, and repair occupations 78 10 1.3First-line supervisors of mechanics, installers, and repairers 15 1.9 3.22
Automotive body and related repairers 5 .6 5.56Automotive service technicians and mechanics 11 1.4 2.04Bus and truck mechanics and diesel engine specialists 5 .6 1.22Heating, air conditioning, and refrigeration mechanics and installers 5 .6 1.33
Telecommunications line installers and repairers 3 .4 1.44Maintenance and repair workers, general 16 2 1.39
Production occupations 53 6.8 1.44First-line supervisors of production and operating workers 18 2.3 3.68Welders, cutters, solderers, and brazers 3 .4 .41Water and wastewater treatment plant and system operators 3 .4 2.97
Transportation and material moving occupations 90 11.5 .43First-line supervisors of helpers, laborers, and material movers, hand 4 .5 3.56
Heavy and tractor-trailer truck drivers 46 5.9 .4Sailors and marine oilers 5 .6 2.97Industrial truck and tractor operators 5 .6 .96Laborers and freight, stock, and material movers, hand 18 2.3 1.08
Military occupations 46 5.9 4.6Total 781 100 –
Table 4. Workplace suicides by occupation, 2011–13

U.S. BUREAU OF LABOR STATISTICS MONTHLY LABOR REVIEW
11
From 1992 to 2013, there were 229 workplace suicides recorded for military occupations, accounting for approximately 12 percent of all workplace fatalities for this occupational group. There were 183 workplace suicides during the 1992–2010 period, about 11 percent of all workplace fatalities for this group, and 46 workplace suicides during the 2011–13 period, about 26 percent of all workplace fatalities for this group.
Note that CFOI data for the military occupations category record workplace fatalities for all members of the resident military regardless of their specific occupation. For example, a military pilot who died during a training mission in the United States would be counted in the military occupations category, rather than the pilot occupation category. Likewise, a military physician who committed suicide at work would be counted in the military occupations category, rather than the physician occupation category. (See table 5.)
Note: The military occupations category includes people identified as members of the resident armed forces, regardless of individual occupation.Source: U.S. Bureau of Labor Statistics.
Consistent with CFOI data, other analyses suggest higher risk of suicide, in general, for military members and veterans. According to the Surgeon General’s 2012 National Strategy for Suicide Prevention: Goals and Objectives for Action, active-duty servicemembers and veterans are at higher risk for suicidal behaviors than civilians.9 Analyzing CDC data, an article by the Center for Public Integrity asserts that veterans, which
Year
Number of workplace
suicides attributed to
military occupations
Percent of all workplace
suicides attributed to
military occupations
Percent of all military
occupations' workplace
fatalities attributed to suicide
1992 8 3.9 4.71993 6 2.7 4.91994 9 4.2 8.21995 16 7.2 11.11996 7 3.4 5.41997 10 4.6 10.51998 5 2.3 5.71999 9 4.1 11.12000 8 3.6 9.22001 15 6.5 13.52002 7 3.5 8.12003 8 3.7 12.92004 7 3.4 9.92005 6 3.3 12.52006 6 2.9 10.52007 14 7.1 21.92008 16 6.1 28.12009 9 3.4 12.02010 17 6.3 37.02011 10 4.0 17.52012 16 6.4 32.02013 20 7.1 28.2Total 229 4.6 12.2
Table 5. Workplace suicides of military occupations, by year, 1992–2013
U.S. BUREAU OF LABOR STATISTICS MONTHLY LABOR REVIEW
12
represent only 10 percent of the adult population, commit 18 to 20 percent of all suicides.10 Similarly, a Department of Veterans Affairs study of death certificate data from 21 states estimated that veterans committed 22.2 percent of all suicides in those states.11 Experiences during war, war-related afflictions (such as post-traumatic stress disorder), and other factors related to military service may increase the risk of suicide. Although the CFOI includes the resident military in its data, it does not track whether a decedent was a military veteran. Because a workplace suicide may be related to prior military service, military veteran status might be an insightful data element to collect in future iterations of CFOI.
Suicide counts and propensity ratios by industry
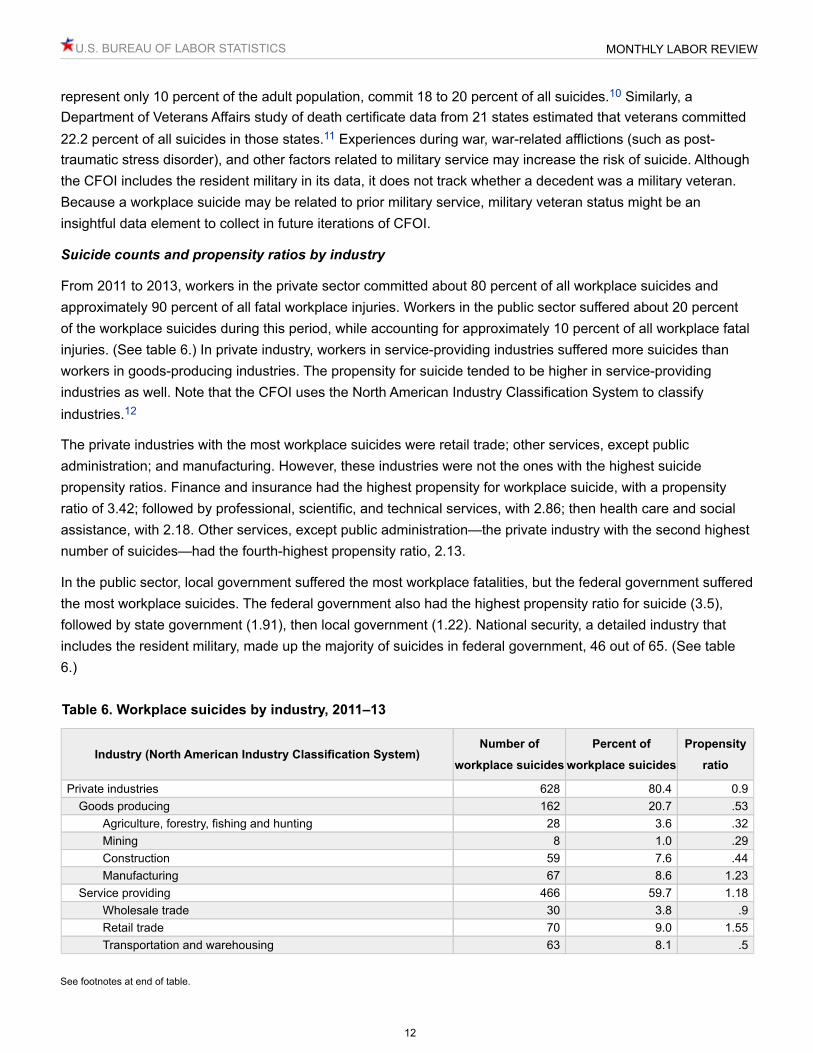
From 2011 to 2013, workers in the private sector committed about 80 percent of all workplace suicides and approximately 90 percent of all fatal workplace injuries. Workers in the public sector suffered about 20 percent of the workplace suicides during this period, while accounting for approximately 10 percent of all workplace fatal injuries. (See table 6.) In private industry, workers in service-providing industries suffered more suicides than workers in goods-producing industries. The propensity for suicide tended to be higher in service-providing industries as well. Note that the CFOI uses the North American Industry Classification System to classify industries.12
The private industries with the most workplace suicides were retail trade; other services, except public administration; and manufacturing. However, these industries were not the ones with the highest suicide propensity ratios. Finance and insurance had the highest propensity for workplace suicide, with a propensity ratio of 3.42; followed by professional, scientific, and technical services, with 2.86; then health care and social assistance, with 2.18. Other services, except public administration—the private industry with the second highest number of suicides—had the fourth-highest propensity ratio, 2.13.
In the public sector, local government suffered the most workplace fatalities, but the federal government suffered the most workplace suicides. The federal government also had the highest propensity ratio for suicide (3.5), followed by state government (1.91), then local government (1.22). National security, a detailed industry that includes the resident military, made up the majority of suicides in federal government, 46 out of 65. (See table 6.)
Industry (North American Industry Classification System)Number of
workplace suicides
Percent of
workplace suicides
Propensity
ratio
Private industries 628 80.4 0.9Goods producing 162 20.7 .53
Agriculture, forestry, fishing and hunting 28 3.6 .32Mining 8 1.0 .29Construction 59 7.6 .44Manufacturing 67 8.6 1.23
Service providing 466 59.7 1.18Wholesale trade 30 3.8 .9Retail trade 70 9.0 1.55Transportation and warehousing 63 8.1 .5
Table 6. Workplace suicides by industry, 2011–13
See footnotes at end of table.

U.S. BUREAU OF LABOR STATISTICS MONTHLY LABOR REVIEW
13
Note: Propensity by industry is calculated as the percentage of workplace suicides attributed to an industry divided by the percentage of all workplace fatalities attributed to the industry. Because of rounding, propensity ratios shown may differ from values calculated using the percentages shown. Totals for major categories may include subcategories not shown separately.Source: U.S. Bureau of Labor Statistics.
Industry (North American Industry Classification System)Number of
workplace suicides
Percent of
workplace suicides
Propensity
ratio
Utilities 3 .4 .62Information 16 2.0 2.06Finance and insurance 15 1.9 3.42Real estate and rental and leasing 21 2.7 1.95Professional, scientific, and technical services 35 4.5 2.86Administrative and support and waste management and remediation services 39 5.0 .66
Educational services 10 1.3 1.73Health care and social assistance 40 5.1 2.18Arts, entertainment, and recreation 13 1.7 .96Accommodation and food services 42 5.4 1.75Other services except public administration 68 8.7 2.13
Government 153 19.6 1.89Federal Government 65 8.3 3.5
Transportation and warehousing 4 .5 1.13Public administration 57 7.3 4.23
National security 46 5.9 4.27State government 29 3.7 1.91
Educational services 10 1.3 4.05Health care and social assistance 3 .4 2.43Public administration 11 1.4 1.72
Local government 57 7.3 1.22Utilities 5 .6 1.82Administrative and support and waste management and remediation services 3 .4 1.34
Educational services 6 .8 .97Public administration 35 4.5 1.28
Total 781 100 –
Table 6. Workplace suicides by industry, 2011–13

U.S. BUREAU OF LABOR STATISTICS MONTHLY LABOR REVIEW
14
Case characteristics
The CFOI “event” category describes how a fatality occurred. Beginning with workplace fatality data for 2011, CFOI case characteristics are classified using OIICS, version 2.01, which offers more detailed classifications of methods of suicide. From 2011 to 2013, 364 (47 percent) workplace suicides were shootings. Of these, 219 involved pistols or revolvers, 59 involved rifles or shotguns, and 86 involved firearms of an unknown type. Thirty-five percent of workplace suicides involved hanging, strangulation, or asphyxiation. (See figure 2.) Twenty-one of the 781 workplace suicides that occurred from 2011 to 2013 were linked to other workplace fatalities. Linked cases in CFOI are those with more than one fatality in the same incident. The most common of these cases were murder-suicides, events involving murder followed by the perpetrator committing suicide. The propensity for workplace suicides that are linked to other cases was 0.34. Note that for military occupations, about 59 percent of the suicides were shootings.
Time and locationFrom 2011 to 2013, the months with the highest number of workplace suicides were August (79), March (72), and January (70); the months with the fewest were February (50), December (54), and October (57). The months with the highest propensity for workplace suicide were March (1.19), January (1.17), and April (1.11); the months with the lowest propensity were October (0.83), July (0.89) and June (0.91). Workplace suicides occurred most often on Mondays (154) and Wednesdays (131), and occurred least often on weekends. The days with the highest propensity for workplace suicide were Sunday (1.36) and Monday (1.15). The hours of day when workplace suicide most frequently occurred were 8:00–8:59 am (45), 1:00–1:59 pm (38), and 7:00–7:59 am (35). Note that the time of incident was often not available for workplace suicides—time data were available for 531 of 781 workplace suicides during this 2011–13 period. Workplace suicides happened most often at office buildings (122); in worksite parking lots/garages (81); and at other commercial stores (66).

U.S. BUREAU OF LABOR STATISTICS MONTHLY LABOR REVIEW
15
ConclusionSuicide is a relatively small, but growing, occupational concern. From 2007 to 2009, a period that included the Great Recession,13 fatal work injuries declined rapidly, yet workplace suicides increased and have remained elevated. Unlike many other occupational fatalities, workplace suicides affect a broad mix of occupations, industries, and other worker characteristics. Propensity is a useful tool to identify groups where disproportionately larger shares of fatal work injuries involved suicides when compared with other segments of the labor force.
In this analysis, 45- to 54-year-old males had the highest likelihood of committing workplace suicide. Whites (non-Hispanic) committed the highest share of workplace suicides and had a propensity ratio greater than 1. Aside from the “multiple race” category, Asians (non-Hispanic) had the highest propensity for suicide. Employees working for wage or salary incurred the majority of workplace suicides, but self-employed workers had a higher propensity ratio.
Workers in the public sector had a higher propensity for workplace suicide while workers in the private sector suffered the majority of these fatalities. The private industry sectors with the highest propensities for workplace suicide were finance and insurance; professional, scientific and technical services; and health care and social assistance.
Among the major occupational groups, management occupations accounted for the highest share of workplace suicides, but legal occupations had the highest propensity. Among detailed occupations, first-line supervisors of retail-sales workers committed the second-most workplace suicides and had a propensity ratio of 2.61. Police and sheriff’s patrol officers and security guards, two detailed occupations within the protective service major occupational group, incurred the third- and fourth-most workplace suicides, respectively. Protective service occupations had the fifth-highest number of workplace suicides among major occupational groups and had a propensity ratio of 1.43.
Military occupations had the third-highest propensity for workplace suicide among major occupational groups. Other studies indicate that military members and veterans have a heightened risk for suicide. Because veteran status may be related to a higher risk of suicide, it might be useful for the CFOI program to collect veteran-status data in the future to determine whether veteran status is, in fact, related to higher risk of workplace suicide. Death certificates in many states include the field “ever served in the armed forces,” an identifier of veteran status on a source document already obtained for most CFOI cases.
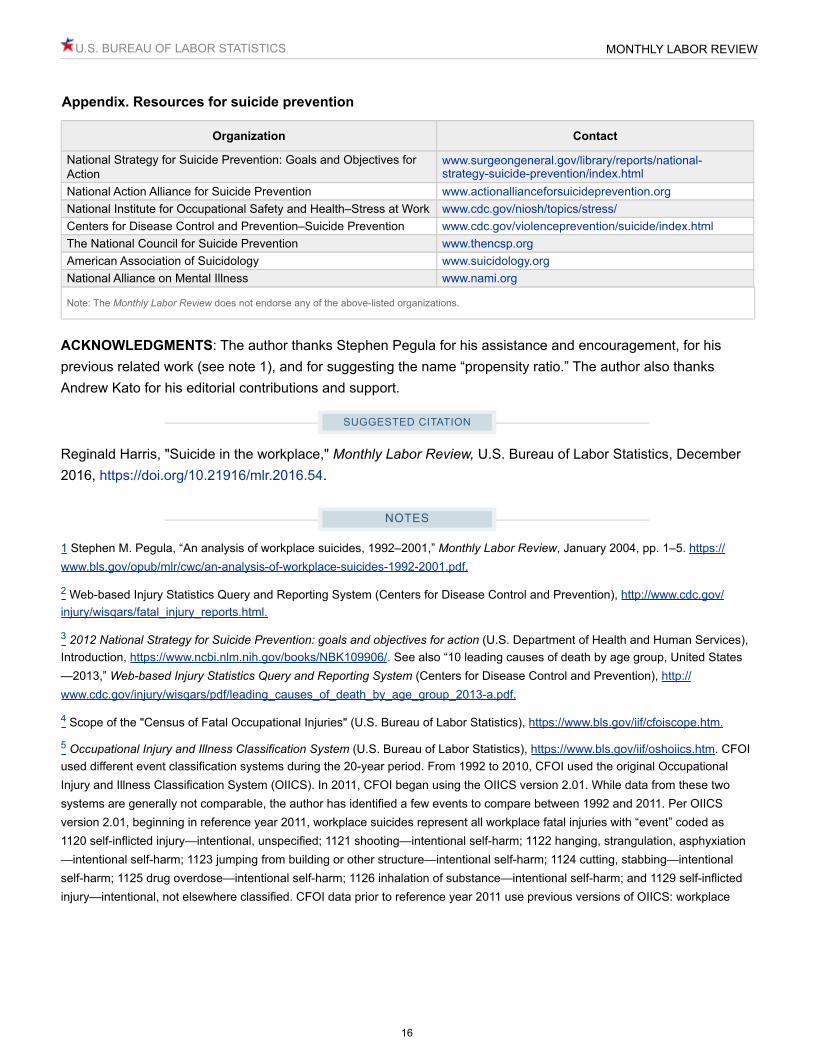
Resources are available to help organizations and individuals identify and mitigate the risks of suicide. Some of these resources are listed in the Appendix below.
Organization Contact
National Suicide Prevention Lifeline www.suicidepreventionlifeline.org (800-231-TALK/8255)Suicide Prevention Resource Center www.sprc.orgWorking Minds Suicide Prevention in the Workplace www.workingminds.org
Appendix. Resources for suicide prevention
See footnotes at end of table.
U.S. BUREAU OF LABOR STATISTICS MONTHLY LABOR REVIEW
16
Note: The Monthly Labor Review does not endorse any of the above-listed organizations.
ACKNOWLEDGMENTS: The author thanks Stephen Pegula for his assistance and encouragement, for his previous related work (see note 1), and for suggesting the name “propensity ratio.” The author also thanks Andrew Kato for his editorial contributions and support.
SUGGESTED CITATION
Reginald Harris, "Suicide in the workplace," Monthly Labor Review, U.S. Bureau of Labor Statistics, December 2016, https://doi.org/10.21916/mlr.2016.54.
NOTES
1 Stephen M. Pegula, “An analysis of workplace suicides, 1992–2001,” Monthly Labor Review, January 2004, pp. 1–5. https://www.bls.gov/opub/mlr/cwc/an-analysis-of-workplace-suicides-1992-2001.pdf.
2 Web-based Injury Statistics Query and Reporting System (Centers for Disease Control and Prevention), http://www.cdc.gov/injury/wisqars/fatal_injury_reports.html.
3 2012 National Strategy for Suicide Prevention: goals and objectives for action (U.S. Department of Health and Human Services), Introduction, https://www.ncbi.nlm.nih.gov/books/NBK109906/. See also “10 leading causes of death by age group, United States—2013,” Web-based Injury Statistics Query and Reporting System (Centers for Disease Control and Prevention), http://www.cdc.gov/injury/wisqars/pdf/leading_causes_of_death_by_age_group_2013-a.pdf.
4 Scope of the "Census of Fatal Occupational Injuries" (U.S. Bureau of Labor Statistics), https://www.bls.gov/iif/cfoiscope.htm.
5 Occupational Injury and Illness Classification System (U.S. Bureau of Labor Statistics), https://www.bls.gov/iif/oshoiics.htm. CFOI used different event classification systems during the 20-year period. From 1992 to 2010, CFOI used the original Occupational Injury and Illness Classification System (OIICS). In 2011, CFOI began using the OIICS version 2.01. While data from these two systems are generally not comparable, the author has identified a few events to compare between 1992 and 2011. Per OIICS version 2.01, beginning in reference year 2011, workplace suicides represent all workplace fatal injuries with “event” coded as 1120 self-inflicted injury—intentional, unspecified; 1121 shooting—intentional self-harm; 1122 hanging, strangulation, asphyxiation—intentional self-harm; 1123 jumping from building or other structure—intentional self-harm; 1124 cutting, stabbing—intentional self-harm; 1125 drug overdose—intentional self-harm; 1126 inhalation of substance—intentional self-harm; and 1129 self-inflicted injury—intentional, not elsewhere classified. CFOI data prior to reference year 2011 use previous versions of OIICS: workplace
Organization Contact
National Strategy for Suicide Prevention: Goals and Objectives for Action
www.surgeongeneral.gov/library/reports/national-strategy-suicide-prevention/index.html
National Action Alliance for Suicide Prevention www.actionallianceforsuicideprevention.orgNational Institute for Occupational Safety and Health–Stress at Work www.cdc.gov/niosh/topics/stress/Centers for Disease Control and Prevention–Suicide Prevention www.cdc.gov/violenceprevention/suicide/index.htmlThe National Council for Suicide Prevention www.thencsp.orgAmerican Association of Suicidology www.suicidology.orgNational Alliance on Mental Illness www.nami.org
Appendix. Resources for suicide prevention
U.S. BUREAU OF LABOR STATISTICS MONTHLY LABOR REVIEW
17
suicide data represent all workplace fatal injuries with “event” coded as 6200 self-inflicted injury, unspecified; 6210 suicide, attempted suicide; and 6220 self-inflicted injury or fatality, intent unknown.
6 Handbook of Methods, chapter 9 (U.S. Bureau of Labor Statistics), pp. 17–20, https://www.bls.gov/opub/hom/pdf/homch9.pdf.
7 “Fatal occupational injuries, total hours worked, and rates of fatal occupational injuries by selected worker characteristics, occupations, and industries, civilian workers, 2013,” Census of Fatal Occupational Injuries—current and revised data (U.S. Bureau of Labor Statistics), https://www.bls.gov/iif/oshwc/cfoi/cfoi_rates_2013hb.pdf.
8 Standard Occupational Classification (SOC) system, 2010 (U.S. Bureau of Labor Statistics, February 2010), https://www.bls.gov/soc/materials.htm.
9 2012 National Strategy for Suicide Prevention: goals and objectives for action (U.S. Department of Health and Human Services) Appendix D, https://www.ncbi.nlm.nih.gov/books/NBK109909/.
10 Jeff Hargarten, Forrest Burnson, Bonnie Campo, and Chase Cook, “Suicide rate for veterans far exceeds that of civilian population,” The Center for Public Integrity (August 8, 2013), http://www.publicintegrity.org/2013/08/30/13292/suicide-rate-veterans-far-exceeds-civilian-population.
11 Janet Kemp and Robert Bossarte, “Suicide data report, 2012” (Department of Veterans Affairs), p. 15, http://www.va.gov/opa/docs/suicide-data-report-2012-final.pdf.
12 Industry data are based on the North American Industry Classification System, 2007. See North American Classification System, 2007 NAICS (U.S. Census Bureau), https://www.census.gov/cgi-bin/sssd/naics/naicsrch?chart=2007.
13 “Great Recession” refers to the recession beginning December 2007 and ending June 2009. See “US business cycle expansions and contractions” (National Bureau of Economic Research), http://www.nber.org/cycles.html.
RELATED CONTENT
Related ArticlesFatal occupational injuries to members of the resident military, 1992–2003, Monthly Labor Review, April 2005.An analysis of workplace suicides, 1992–2001, Monthly Labor Review, January 2004.
Related Subjects
Veterans Occupational safety and health Workplace injuries and illnesses Fatal Injuries Social issuesWorker safety and health