december 2016 report - unicef · unicef erkp end of project evaluation report, december 2016 7 | p...
TRANSCRIPT

End of ProjectEnd of ProjectEnd of ProjectEnd of Project
Evaluation Enhance Evaluation Enhance Evaluation Enhance Evaluation Enhance
Resilience Karamoja Resilience Karamoja Resilience Karamoja Resilience Karamoja
Program Program Program Program
December 2016 Report
Mother and child, Kotido, Karamoja, Uganda 2016. GHL photograph by Frank Kyegombe

Report Presented by
Global Health Liaisons, LLC
2009 Lansdowne Way
Silver Spring, MD 20910
1-301-920-7818
www.ghliaisons.com
Evaluators
Christina Blanchard-Horan, PhD
Jasmine Fledderjohann, PhD
Wamuyu Maina, PhD
Denis Bwesigye, PhD
Flavia Miiro, MPH
Photographs by Frank Kyegombe
Karamoja, Uganda 2016
Commissioned by UNICEF Evaluation Timeframe November 2013- March 2016

ACKNOWLEDGEMENTS
This report was made possible thanks to the significant time, effort, and contributions of many people,
both inside and outside UNICEF. The evaluation team would like to recognize individuals who made this
evaluation possible. We would like to acknowledge Abiud Omwega, UNICEF Nutrition Manager, Deputy
Country Representative Noreen Prendiville, and Brenda Kaijuka Muwaga, who worked tirelessly to move
the evaluation forward. We would also like to thank, UNICEF Reports Specialist Kutloano Leshomo, Nelly
Birungi, Fatoumatta Sabally, Juliet Ssekandi and Alex Mokori for their inputs and guidance.
Thanks also to Siti Halati, Programme Policy Officer and Head of Nutrition at the World Food Programme,
and Dr. Priscilla Ravonimanantsoa, Nutrition Officer at the World Health Organization. We would also like
to express our appreciation to of the Ministry of Health Director of Food & Nutrition and the National SUN
Technical Focal Point. WYG consultant Maria Kwesiga and Alison Gardner, international nutrition
consultant nutrition leading the WFP Nutrition Program Evaluation.
The Implementing Partners (IPs) were also critical to this assessment, these included at CUAMM. They
provided tremendous input, cooperation, and collaboration during the evaluation process. UNICEF
Enhanced Resilience Karamoja Programme (ERKP) implementing partners, agencies, and organizations
including Action contre la Faim; AVSI/SCORE; Baylor Uganda; Community Connector; Concern
International; Feed the Children; GIZ/United Nations High Commissioner for Refugees; Initiative to End
Child Malnutrition; International Baby Food Action Network; Mildmay Centre; Mwanamugimu Nutrition
Unit of Mulago Hospital; Northern Uganda Health Integration to Enhance Services; Nutrition Innovation
Lab; Reach Out Mbuya; USAID/Resiliency through Wealth Agriculture and Nutrition.
We would also like to recognize other partners working with ERKP UNICEF in Uganda. The AIDS Control
Programme, Health Promotion and Education Department, National Medical Stores Planning Department,
Reproductive Health Department, and the Resource Centre; Office of the Prime Minister along with
ministries, departments, and agencies, including the Ministry of Agriculture, Animal Industry and
Fisheries; the Ministry of Finance, Planning and Economic Development; the Ministry of Education and
Sports; the Ministry of Gender, Labour, and Social Development; and the Uganda Bureau of Standards,
Academic institutions, e.g. Gulu University, Kyambogo University, and Makerere University.
The evaluation team included Dr Christina Blanchard-Horan, Team Lead; Dr Jasmine Fledderjohann,
Health Analyst, and Dr Gakenia Wamuyu Maina, Nutritionist Specialist, Joseph Okuda, community Liaison,
Francis Somerwell, Data Specialist, and Aristhide Nobanza, Junior Analyst. We would like to acknowledge
Harnessing Indigenous Potentials in Africa (HIPo Africa), Data Manager, Flavia Miiro and her team for their
knowledge sharing team spirit, and professionalism with data collection.
A special thanks to the Ministry of Health (MOH) officials from the Nutrition Unit, all district level officials,
and District Health Officers, who provided their inputs. Of course, the evaluation would not have been
possible without the inputs of all participants in this study, including the community health and facility
workers, caregivers, and beneficiaries. Thank you all for your time and valuable insights. We are especially
thankful to you for taking the time from the important work you do to respond to our questions. Your
contributions ensure a more robust evaluation.

TABLE OF CONTENTSTABLE OF CONTENTSTABLE OF CONTENTSTABLE OF CONTENTS Acknowledgements ............................................................................................................... 3
Executive Summary ............................................................................................................... 7
Main findings .................................................................................................................................8
Lesson learnt ............................................................................................................................... 11
Main conclusions ......................................................................................................................... 11
Overview of Recommendations .................................................................................................... 13
Chapter 1 Introduction and Context ............................................................................... 14
1.1 Scope ..................................................................................................................................... 16
1.2 Rationale ............................................................................................................................... 16
1.3 Audience ................................................................................................................................ 17
1.4 Themes .................................................................................................................................. 17
Chapter 2 Methodology ....................................................................................................... 18
2.1 Data collection ....................................................................................................................... 18
2.2 Sampling ................................................................................................................................ 18
2.3 Analysis.................................................................................................................................. 19
2.4 Limitations ............................................................................................................................. 20
2.5 UNEG norms and standards .................................................................................................... 21
Chapter 3 Results .............................................................................................................. 23
3.1 Overall relevance and appropriateness ................................................................................... 23
3.2 Aligned .................................................................................................................................. 25
3.3 Comprehensive ...................................................................................................................... 26
3.4 Appropriate for cultural context ............................................................................................. 26
3.5 Equity .................................................................................................................................... 28
3.6 Effective ................................................................................................................................. 29
3.7 Efficiency & VfM ..................................................................................................................... 50
3.8 Sustainability ......................................................................................................................... 54
Chapter 4 Lessons Learnt .................................................................................................... 56
Chapter 5 Recommendations ............................................................................................ 57
5.1 Relevance and appropriate ..................................................................................................... 57
5.2 Effectiveness .......................................................................................................................... 57
5.3 Efficiency ............................................................................................................................... 58
5.4 Sustainability ......................................................................................................................... 59
5.5 Equity .................................................................................................................................... 59
Conclusions ......................................................................................................................... 60
Appendix I, Supplementary Tables .......................................................................................... i
Appendix II, List of those Interviewed and sites visited .......................................................... iii
Appendix III, Karamoja NGO Mapping ................................................................................... v
Appendix VI, Inferential Statistics & Tables ............................................................................ v
Appendix IV, Evaluators Bio data and/or justification of team composition ............................ x
Appendix V, Terms Of Reference ........................................................................................... xi
Appendix VI, Inception Report .............................................................................................. xi
Appendix VII, List of documents consulted ............................................................................ xi
Appendix VIII, Results Framework, Informed consent, & Instruments .................................... xi
Appendix IX, Informed consents ............................................................................................ xi
Appendix X, Data collection instruments, with details about their reliability and validity ....... xi
Appendix XI, Raw data analysis files .....................................................................................xii

Table of Tables TABLE 1. KARAMOJONG FOOD CULTURE ADEQUATELY CONSIDERED WHEN PROVIDING COUNSELLING 27 TABLE 2, VHT RESPONSES TO ‘WHAT INDICATES KEY SIGNS FOR OTC REFERRAL’ 34 TABLE 3, IYCF MESSAGES GIVEN BY VHTS IN THE PROGRAMME 36 TABLE 4, REPORTED OTC/ITCS JOINTLY SUPERVISED 49 TABLE 5, OVERALL PROGRAMME ALLOCATION 51 TABLE 6, REGIONAL INDICATORS FOR SUPPLY MANAGEMENT (FROM THIRD TO FIFTH REPORT) 52 TABLE 7, PERCEPTIONS ABOUT GOVERNMENT'S LEVEL OF OWNERSHIP/INVOLVEMENT 55 TABLE 8, OVERALL FINDINGS AND CONCLUSIONS 61 TABLE 9, RESPONDENT CHARACTERISTICS I TABLE 10, CHARACTERISTICS OF SAMPLED FACILITY AND COMMUNITY LEVEL IMPLEMENTERS AS WELL AS BENEFICIARIES II TABLE 11, ASSOCIATION BETWEEN DISTRICT AND COORDINATION, FUNCTIONALITY AND REACH VI TABLE 12 ASSESSMENT & SCREENING, EDUCATION AND REFERRALS, IMAM, AND RECORD KEEPING VII TABLE 13, CURE, DEATH, AND DEFAULT RATE BY MONTH, OTC/ITC DATA IX
Table of Figures FIGURE 1. KARAMOJA SHOCKS AND STRESSES BY DISTRICT (FSN, 2014) 15 FIGURE 2. PERCENTAGE OF HEALTH FACILITIES SAMPLED BY LIVELIHOOD ZONE 19 FIGURE 3. UNICEF FOUR FOCUS AREAS 23 FIGURE 4. A THEORY OF CHANGE MODEL FOR IMPROVED ACCESS FOR MOTHERS AND CHILDREN TO HIGH-IMPACT NUTRITION
INTERVENTIONS 24 FIGURE 5. PERCEIVED COVERAGE BY GENDER AND TARGET POPULATION 28 FIGURE 6. GAM IN KARAMOJA – UNICEF PROVIDED - SOURCE WHO 30 FIGURE 7. SOUTH KARAMOJA SAM – SOURCE CUAMM 30 FIGURE 8. NORTH KARAMOJA SAM – SOURCE CUAMM 31 FIGURE 9, PROGRAMME PERCEIVED TO OFFER BEST SOLUTION 32 FIGURE 10. COMPARISON BETWEEN IYCF COUNSELLING OBSERVED AT FACILITIES, CSP SAID PROVIDED, CAREGIVERS SAID RECEIVED 33 FIGURE 11 CAREGIVER REFERRALS BY TYPE - PRIMARY DATA 2016 34 FIGURE 12. CHILDREN RECEIVING SECOND VITAMIN-A DOSE BY DISTRICT 36 FIGURE 13. CHART OF SAM ANNUAL CASELOAD VS ADMISSIONS IN KARAMOJA 2009–2016 38 FIGURE 14. MEAN CURE, DEATH AND DEFAULT RATES 39 FIGURE 15. MEAN NON-RESPONSE RATE OTC/ITC DATA JAN 2013-SEPT 2016 41 FIGURE 16. COORDINATION BETWEEN PROGRAMME IMPLEMENTATION LEVELS 42 FIGURE 17. UNICEF ERKP PARTNER LINKAGES BETWEEN VARIOUS STAKEHOLDERS 43 FIGURE 18, MAP OF NUTRITION PROGRAMS INTERVIEWED IN THE DISTRICTS OF KARAMOJA BY SUB-REGION 48 FIGURE 20, VALUE FOR MONEY FRAMEWORK, 50 FIGURE 21, FACILITY-REPORTED CHALLENGES IN SUPPLYING RUTF TO CAREGIVERS 52 FIGURE 22, AVERAGE STOCKOUTS IN MOROTO BY QUARTER Q2–Q4 2015 53 FIGURE 23, VHT SUPERVISIONS IN MOROTO - Q2 2013–Q4 2015 54 FIGURE 24, DOCUMENT TIMELINE 2000-2016 IV
Table of Photographs PHOTO 1, MOTHER AND CHILD, KOTIDO, KARAMOJA, UGANDA 2016. GHL PHOTOGRAPH BY FRANK KYEGOMBE ................................ 1 PHOTO 2, CHILDREN OF MOROTO, KARAMOJA REGION, UGANDA 2016 ..................................................................................... 17 PHOTO 3, STAKEHOLDER MEETING ATTENDEES, SEPTEMBER 2016 ............................................................................................. 18 PHOTO 4, CHILD OF KARAMOJA, MOROTO 2016 ................................................................................................................... 22

Acronyms CAF Confédération Africaine de Footbal
CSP Community service provider (including VHTs, CHEWs, and members of
mother support groups)
CUAMM Collegio Universitario Aspiranti Medici Missionari
DFID Department for International Development (UK)
DDMC District Disaster Management Committees
DNCC District Nutrition Coordination Committee
DHO District Health Officer
DHT District Health Team
DRMS Disaster risk monitoring system
DRR Disaster Risk Reduction
ERKP Enhanced Resilience Karamoja Programme
FAO Food and Agricultural Organization
FHD Family Health Day
FSNA Food Security and Nutrition Assessment
GAM Global Acute Malnutrition
HC Health Centre
HH Household
HMIS Health Management Information System
ICCM Integrated Community Case Management
IIRR International Institute of Rural Reconstruction
IMAM Integrated Management of Acute Malnutrition
ITC Inpatient Therapeutic Centre
IYCF Infant and Young Child Feeding
LQAS Lot Quality Assurance Sampling
MOH Ministry of Health
OPM Office of the Prime Minister
OTC
PDRA
Outpatient Therapeutic Centre
Participatory disaster risk assessments
RCA Resilience Context Analysis
REACH Renewed Efforts to End Child Hunger
RUTF Ready to Use Therapeutic Food
SAM Severe Acute Malnutrition
SFP Supplementary Feeding Programme
SLEAC Simplified Lot Quality Assurance Sampling Evaluation of Access and
Coverage
SQUEAC Semi-Quantitative Evaluation of Access and Coverage
TFP Therapeutic Feeding Programme
ToT Training of Trainers
UBOS Uganda Bureau of Statistics
UDHS Uganda Demographic and Health Survey
UNAP Uganda Nutrition Action Plan
VHT Village Health Team
WASH Water and Sanitation Hygiene
WFP World Food Programme
UNICEF ERKP End of Project Evaluation Report, December 2016
7 | P a g e o f 6 4
Executive Summary The Uganda Demographic and Health Survey (UDHS), 2011 revealed that the Karamoja region had the
highest rates of child stunting (45%), Severe Acute Malnutrition (SAM) (2.6%) and Global Acute Malnutrition
(GAM) (7.1%) in the country. The July 2016 Food Security and Nutrition Assessment (FSNA) indicated that
the prevalence of chronic undernutrition (stunting) was 23% and that of underweight was 17.1% in
Karamoja. An FSNA conducted in Karamoja in 2015 showed that GAM rates were at their highest since
2010. Similarly, the 2015 Department for International Development (DFID) formative assessment showed
that under-five mortality in Uganda was highest in Karamoja (153 deaths per 1,000 live births) with an
estimated 3.5% of children under the age of five suffering from severe acute malnutrition (estimated total
of up to 22,000 cases annually).
In a bid to reduce vulnerability and build resilience to cope with the effects of climate change and levels of
acute malnutrition, the DFID supported the Enhanced Resilience Karamoja Programme (ERKP) in 2013. The
programme started in October 2013 with an allocation of £38,500,000 in programme funds over three
years. It was collaboratively implemented by UNICEF, Food and Agricultural Organisation (FAO) and World
Food Programme (WFP) from November 2013 to date. The ERKP approach worked within the context of
the transitional period and worked to move from emergency support to development of programming.
• Access to high impact nutrition services – Scaling-up nutrition programmes targeting malnourished
children under five, pregnant and lactating women, by providing essential nutrition supplies and
strengthening the institutions and processes to manage the distribution of this food.
• Food and livelihoods security - Supporting food security and livelihoods for vulnerable households
through public works and livelihood development programmes, by focusing on asset creation and providing
of food / cash transfers through public works programmes.
• Early warning systems – Building and improving early warning and response systems, by developing
more effective early warning and response systems, and providing animal disease surveillance and
veterinary services.
• Development coordination – developing contingency plans with local governments and
strengthening staff capacity to understand and respond to emergencies.
• Evidence and learning – understanding what works best in the challenge of building resilience.
The Food and Nutrition Security Conceptual Framework indicates that livelihood strategies, including
improved household access to food, social and access to healthcare and improved health environment
would impact individual food intake and health status.
The UNICEF component of the ERKP strategy for reducing prevalence of GAM and SAM fell into four broad
categories: 1) improving high-impact nutrition interventions and food supplementation and managing
acute malnutrition - 2) improving advocacy, coordination and partner interaction; 3) increasing knowledge
and understanding and securing timely and quality information; 4) strengthening contingency planning and
emergency preparedness.
An end-term evaluation of the UNICEF-supported components of the broader ERKP was conducted with a
goal of understanding the effectiveness and impact of UNICEF’s work for the period November 2013 to

UNICEF ERKP End of Project Evaluation Report, December 2016
8 | P a g e o f 6 4
December 2015 to guide future programming. The investigation was expanded to March 2016, due to
timing of the evaluation in the 4th quarter of 2016.
The evaluation objectives were as follows:
1. Assess programme relevance, appropriateness and efficiency and quality of services.
2. Assess programme effectiveness, sustainability and equity.
3. Document evidence-based lessons, good practices and recommendations.
The audience for this evaluation is UNICEF, Department for International Development (UK)
(DFID) and ERKP representatives. To forge future collaboration and efforts, the evaluation will inform ERKP
stakeholders, which include sister UN organisations (World Health Organisation (WHO), WFP, FAO) and
other iNGOs providing nutrition services in Karamoja.
Evaluation Evaluation Evaluation Evaluation mmmmethodologyethodologyethodologyethodology
A cross-sectional study was conducted between 26th September 2016 and 30th October 2016 within the
seven districts of the Karamoja sub-region, namely the Abim, Kaabong, Kotido, Moroto, Nakapiripirit, Napak
and Amudat districts. UNICEF-supported health facilities in each district were selected from purposive
clusters comprising of each of the livelihood zones. Both quantitative (semi-structured interviews and data
abstraction) and qualitative (desk reviews, key informant interviews, focus group discussions, unobtrusive
activity observations and stakeholder mapping) primary data were collected at the national, district and
community levels. In addition, value for money (VfM) was assessed by examining the efficiency and efficacy
(cost) of the Ready to Use Therapeutic Food (RUTF) intervention and the training.
A descriptive analysis was conducted to assess changes in the district-level nutritional outcomes. Inferential
models were fit as fixed effects models to adjust for the autocorrelation of measures within
facilities/districts across time. Multi-Criteria Analysis (MCA) and Cost–Benefit Analysis (CBA) were explored
to demonstrate which interventions have the highest VfM. Quantitative results were presented graphically
in tables, figures and charts. Methodological triangulation of the qualitative and quantitative data was
conducted to enhance the understanding of the ERKP nutrition components.
Main findings Successful outcomes for increased resilience of targeted communities to climate extremes and weather
events were measured in terms of stabilisation in prevalence of GAM and SAM for children 6–59 months
of age in Karamoja.1 GAM was stabilised at an average of 12.45% since the programme started in December
2013, with a range of 11–14%. SAM in May 2016 was reported at 3.8% (95% CI), with a range between 3.2%
and 4.5%. Stunting was reported at 39.5% (37.9–41.2), and underweight was reported at 31.0% (95% CI),
with a range of 29.4% to 32.6%.
Assess programme relevance, appropriateness and efficiency and quality of services
AppropriatenessAppropriatenessAppropriatenessAppropriateness - UNICEF ERKP provided an appropriate people-centred humanitarian response to build
nutrition resilience. The response involved coordination and collaboration, assessment, design and
response, performance transparency and learning. UNICEF ERKP strengthened Implementing Partner (IP)
engagement at the national level. The package of integrated antenatal and early care interventions planned
for healthcare facilities and workers fit the need identified in supporting research to improve access to
1 UNICEF Uganda, 2015 log frame

UNICEF ERKP End of Project Evaluation Report, December 2016
9 | P a g e o f 6 4
high-impact nutrition. Coordination and knowledge-sharing strategies and interventions were built on
appropriate research for a nutrition resilience agenda. Intersectoral partnerships with WFP, WHO and other
nutrition programme implementers (see mapping exercise) were appropriately designed to respond to
resilience in Karamoja. In contrast, the link between Food for Agricultural Organization (FAO) and UNICEF
was found to be in need of strengthening. Furthermore, stakeholders felt the role of the Office of the Prime
Minister (OPM) was unclear and that UNICEF should be playing a greater coordination role. Stakeholders
also felt there was a need to develop an understanding and address government limitations managing
Karamoja programmes.
Relevance Relevance Relevance Relevance ---- In implementing the UNICEF ERKP nutrition programme, UNICEF had strategic and competitive
advantages, particularly its capacity to support governance institutions. At the national level, UNICEF ERKP
made relevant contributions to mainstreaming a resilience agenda, influenced policy and developed
partnership with Government of Uganda (GoU) in several sectors to implement the nutrition programme
to build resilience at the district, facility and community levels.
QualityQualityQualityQuality ---- Achievements in advocacy, partnerships for strategic planning, knowledge sharing, Integrated
Management of Acute Malnutrition (IMAM) nutrition integration and community outreach were
convincing. The cure rates and default rates of IMAM programme performance measures were improved
over the period of the evaluation, suggesting IMAM training has been impactful. National stakeholders
were engaged and policy evolved to support an agenda of developing resilience. However, UNICEF linkages
with livelihood programmes were weak. Importantly, we found an association between the cure rate and
percentage of facility staff reporting that their facility offered referrals to livelihood programmes.
Efficiency & Value for MoneyEfficiency & Value for MoneyEfficiency & Value for MoneyEfficiency & Value for Money ---- In general, the budget was implemented as planned. Operational
efficiency in terms of time and resources varied between activities. Efforts to share knowledge and
influence policy agendas were based on evidence from research in Karamoja. Challenges related to the
implementation of some activities, such as the rollout of Village Health Team (VHT) training, may have
affected operational efficiency.
Assess Assess Assess Assess programme programme programme programme effectiveness, sustainability and equity.effectiveness, sustainability and equity.effectiveness, sustainability and equity.effectiveness, sustainability and equity.
EffectiveEffectiveEffectiveEffectivenessnessnessness ---- At the national and regional levels, UNICEF ERKP leveraged existing institutional and
government systems towards nutrition-related objectives. At the local level, there was demonstrated
improvement in service performance outcomes. UNICEF and partner contributions towards capacity
development were sufficient to affect performance and community engagement.
Improved access - There were increases in the number of women exclusively breastfeeding (EBF) in
Karamoja, now at 95%. There were also slight improvements in continued breastfeeding and
complementary feeding. There were associations between caregivers reporting that they had received
messages on maternal nutrition and increased cure rates at the facility; there were also associations
between sites that had reported that they had had IMAM and Infant and Young Child Feeding (IYCF) training
and reduced death rates at those facilities. In fact, facilities staff training was associated with lower death
rates. In particular, training in the IYCF counselling, nutrition assessments and referrals. Furthermore,
Family Health Days (FHDs) contributed to increased levels of iron/folate and Vitamin A, and the percentage
of children 6–59 months receiving two doses was above the national average. By and large, UNICEF
planning, implementation, monitoring and collaboration among nutrition stakeholders targeting lactating

UNICEF ERKP End of Project Evaluation Report, December 2016
10 | P a g e o f 6 4
mothers and children under five years of age was sufficient to improve access for mothers and children to
high-impact nutrition.
Improved coordination - The effort forged strong partnerships with government ministries, influenced
national policy and strategic plans and worked with IPs to integrate nutrition into the various sectors.
District nutritionists with Collegio Universitario Aspiranti Medici Missionari (CUAMM) supported district
officials in the integration of the nutrition programme into the health system. Facilities providing IMAM
services achieved reporting goals. However, not all coordination efforts have moved forward. The National
Food and Nutrition Security Implementation plan had not been validated, nor had the communication
strategy been developed. Action plan coordination at the district level had not yet been achieved. An
agreement with the Centre for Humanitarian Change had been established to conduct and disseminate
operational research in 2017, including a review of the surveillance system.
Increased knowledge – Government and IP capacity development objectives were largely achieved.
Nutrition programme implementers in Karamoja were engaged and responsive to the nutrition resilience
agenda. The IYCF counselling effort implemented by various stakeholders in the region was well known by
caregivers. The average reporting rate for the region was close to 90%. By contrast, less effective was the
effort to assess and report nutrition services at various intersections, e.g. Health Management Information
System (HMIS) and supply management reporting. The annual report FSNA 2014 was completed and
disseminated, released by the Ministry of Health (MoH), and the dissemination was evident at the district
and facility levels. The annual report from June 2016 was under development at the time of this evaluation.
Contingency planning – UNICEF coordinated with OPM and IPs to develop, review multi-sectoral, child-
centered nutrition sensitive contingency plans with District Local Government in the region. Facilities that
referred to livelihood programmes had better cure rates. However, progress towards creating a
comprehensive coordinated response plan and the rollout of district team training did not happen in
accordance with the original timeline. These efforts were moving forward at the time of this report. A
nutrition-sensitive social protection model was designed. A contract with the International Institute for
Rural Reconstruction (IIRR) was in place since March 2015 to train district teams in contingency planning,
preparedness and response for nutrition. Contingency plans for all districts were reviewed to ensure they
were nutrition-sensitive. However, the programme had not commenced with district outreach, as was
reported in December 2015. The target rollout to the seven districts was reset for 2017. IIRR was contracted
to explore the link to referring Outpatient Therapeutic Centre (OTC) beneficiaries with supplementary
programmes, such as the Youth Livelihoods Project and other livelihood programmes. These are expected
to improve resilience in the Karamoja region.
Equitable Gender mainstreamed legislation and public policy targeted women and children, which had implications
for both women and men. Programmes focused on the health of children, resulting in fairly distributed
services to male and female children. Policies led to improved cure rates and reduced morbidity among
children under five and lactating women. For example, Vitamin A treatment improved health outcomes of
vulnerable women and their children. Cure rates were also improved for women and children who went to
facilities with trained health workers. However, there was inadequate disaggregated gender data to assess
gender equity. Although there was little in terms of indicator data to determine the successful coverage of
vulnerable populations, in the June 2016 progress report, UNICEF had a plan to support the analysis of
programme data on nutrition interventions and contextual information, with a special focus on equity
analysis.

UNICEF ERKP End of Project Evaluation Report, December 2016
11 | P a g e o f 6 4
Sustainable & resilient There were strong indications of sustainability at the national level, where GoU had signalled their
commitment to nutrition by enacting national plans and policies and working with UNICEF on strategies
towards implementation. Several targets for building sustainability were met. UNICEF successfully
supported changes to policy and national priorities towards improved treatment of women and children,
specifically as this relates to malnutrition. Facility training for better assessment and treatment helped to
build capacity through knowledge about prevention in order for communities to better address nutrition
during lean times. Community interventions that led to improved referral and behavior were also key
factors that contributed to resilience and sustainability, as was demonstrated by the association between
livelihood programmes and cure rates, as previously mentioned. Integrating IMAM into the package of
health services contributed to the sustainability of nutrition practices in the region, and the collaborative
efforts to engage iNGOs and sister UN organisations, such as WFP and WHO, built community capacity to
inform hard-to-reach communities about best practices towards resilience.
Lesson learnt Document evidenceDocument evidenceDocument evidenceDocument evidence----based lessons, good practices and recommendationsbased lessons, good practices and recommendationsbased lessons, good practices and recommendationsbased lessons, good practices and recommendations
Attribution and contribution describe the relationship between an intervention and its outcome. The
UNICEF ERKP was not set up for attribution of results. To establish attribution, strong causal links must be
found between the intervention and the observed outcome. It is clear, however, that the initiative achieved
strong results around strengthening institutions and policies and integration of nutrition services into
existing systems.
EBF increased over time, surpassing the country average. Although they slightly increased over the
programme period, the rates of dietary diversity were very low. Complementary feeding was also low, at a
quarter of the population practicing. Clearly, EBF education has been effective. We postulate that although
mothers understood the importance of complementary feeding, compliance was complicated by the lack
of food availability and resources to obtain proper available foods (Figure 1). While overall SAM rates were
on the decline, rates of SAM in the southern Karamoja districts, Kotido and Abim, were rising (Figures 26–
28).
Unexpected outcomes –––– The number of cases of SAM for under-fives was positively associated with both
the number of supervisions (b=12.4; p<0.01) and the number of VHTs who could correctly count
Respiration Rate (RR) (b=12.7; p<0.05). Thus, the higher the number of supervisions and VHTs able to
correctly count RR, the higher the number of admissions of children under five. Counting RR correctly may
be a proxy indicator for health education level of staff. DHOs in Abim, Nakapiripirit, and Amudat indicated
that women were getting pregnant sooner, since there is ‘assurance of continuous food supply during
pregnancy and breast feeding’.
Main conclusions Conclusions include good practices and recommendations organised in accordance with UNICEF’s four
objectives. A summary of overall targets, achievements and conclusions can be found in Table 8, page 60.
Increase access to Increase access to Increase access to Increase access to highhighhighhigh----impactimpactimpactimpact nutrition interventions for mothers and children.nutrition interventions for mothers and children.nutrition interventions for mothers and children.nutrition interventions for mothers and children.
Achievements in ‘mainstreaming nutrition’ in the health sector were convincing. UNICEF ERKP provided
most treatment services offered in Karamoja and forged strong links with MoH, other UN agencies and

UNICEF ERKP End of Project Evaluation Report, December 2016
12 | P a g e o f 6 4
iNGOs, which combined to make for major contributions to the integration of the IMAM programme into
the mainstream health system to build sustainability. Several targets were met, including improvements in
coverage; VHT members engaged in nutrition screening, referral and follow-up; and the number of twice-
yearly Vitamin A doses for children 6–59 months. The association between admissions and Vitamin A intake
suggested that higher Vitamin A intake was associated with fewer admissions.
There were several factors that suggest improvements in caseload estimations. There was a significant
association between the percentage of caregivers reporting messaging on maternal nutrition and facility
cure rate and the reduction in the difference between estimates and new admissions (Section 3.2.1). The
programme’s social change and behavioural interventions promoted the uptake of recommended
maternal, IYCF and care in the region, as it pertains to EBF, which resulted in an increase in EBF. However,
dietary diversity was only at 5.6% in 2016 and meal frequency did not increase significantly. Minimum Meal
Frequency was declining.
The associations between death rates and training in nutrition assessments, IYCF counselling, referrals and
integrated management of childhood illness and between cure rates and livelihood referrals suggest that
the most critical move that UNICEF Uganda can make for the nutrition programme at this point is to build
the needed processes and procedures to roll out a multi-sectoral programme that incorporates livelihood
programmes with IMAM services. FAO and UNICEF should begin work towards improving connections
between IMAM services and livelihood, and caregivers should become more resilient to shocks. This must
be done while enhancing the existing gains UNICEF has made in VHT and health worker performance. This
would expectedly raise cure rates and lower death and default rates.
UNICEF had plans to support the analysis of programme data on nutrition interventions and contextual
information, with a special focus on equity analysis. Given the dearth of information on equity and gender,
a plan for equity analysis is appropriate to the needs of the programme.
Importantly, negative associations between messaging activities and cure and default rates (e.g. with
maternal nutrition messaging) may reflect the need to scale-up rather than scale-back such activities—
actions such as additional training of health workers in counselling may be required to improve the effect.
Given the lack of improvement in dietary diversity and frequency, a study of causes specific to these IYCF
practices should be implemented. Engaging community and harmonized approach with other stakeholders
is needed to change behaviour around dietary diversity and meal frequency.
IIIImprove coordination and partners’ interaction for mprove coordination and partners’ interaction for mprove coordination and partners’ interaction for mprove coordination and partners’ interaction for nutrition services and capacity to respond to nutrition services and capacity to respond to nutrition services and capacity to respond to nutrition services and capacity to respond to
increase/change in needs.increase/change in needs.increase/change in needs.increase/change in needs.
The various components of the UNICEF ERKP were well linked, from policies and health facilities to health
workers, VHTs and communities. Knowledge sharing around the FSNA was efficient, though there was
evidence of the need for improvement. Interviews indicated that from the community and facility levels to
the district and national levels, the programme was linked with a variety of stakeholders, both within the
ERKP and with other IPs. These partnerships with iNGOs should maximise resources and build capacity by
linking to livelihood activities implemented by other partners, such as FAO.
At the national level, the UNICEF ERKP leveraged their strengths and relationships to build support for
nutrition planning and implementation. UNICEF built strong partnerships with the MoH to improve

UNICEF ERKP End of Project Evaluation Report, December 2016
13 | P a g e o f 6 4
nutrition in Karamoja. The initiative influenced policy and generated knowledge for sharing and learning.
However, UNICEF has largely focused on inpatient care, and strengthening knowledge and awareness
around nutrition. Low community engagement has been shown to result in low coverage. The next phase
should involve adequate community components to reach into hard to reach communities. Successful
community approaches involve community in the decision-making process, including allocation of
community resources.
Increase knowledge and understanding of the underlying causes of poor nutrition in mothers and Increase knowledge and understanding of the underlying causes of poor nutrition in mothers and Increase knowledge and understanding of the underlying causes of poor nutrition in mothers and Increase knowledge and understanding of the underlying causes of poor nutrition in mothers and
children in Karamoja and secure timely and quality information on the changing needs for improved children in Karamoja and secure timely and quality information on the changing needs for improved children in Karamoja and secure timely and quality information on the changing needs for improved children in Karamoja and secure timely and quality information on the changing needs for improved
programming.programming.programming.programming.
In the programme design, the SMART study provided the foundation for the UNICEF ERKP response to
barriers and bottlenecks. Strategies to reduce malnutrition considered awareness and access, specific
barriers mentioned in the LQAS Coverage and Access research done on barriers and bottlenecks in 2015.
UNICEF responded with interventions to barriers and bottlenecks that contributed to inequalities, as
indicated in the proposal and progress reports and in findings from interviews with facility staff and
community members. Results from this evaluation suggest that the interventions were appropriate to
achieve the planned results. UNICEF proposed activities be supported through the analysis of programme
data on nutrition interventions, which was done through the MoH. The analysis included a male/female
breakdown, but otherwise, no equity analysis was evident in their outputs.
The target vulnerable group was lactating women and children under five years of age. Geographic
coverage was best provided to hard-to-reach areas/groups through community outreach activities. IYCF
training of VHTs was conducted in partnership with WFP.
Regarding data efficiency, the FSNA requires continued focus and improvement on the part of UNICEF to
provide appropriate data management support and to ensure quality data are used to inform decisions.
Strengthen contingency planning and emergency Strengthen contingency planning and emergency Strengthen contingency planning and emergency Strengthen contingency planning and emergency preparedness for nutrition within Karamoja region.preparedness for nutrition within Karamoja region.preparedness for nutrition within Karamoja region.preparedness for nutrition within Karamoja region.
Although UNICEF ERKP contributed significantly to contingency planning, this was not captured in the log
frame. Furthermore, targets that were reflected in the log frame for 2015 and 2016 were not met. In 2016,
this began to change as plans were going through for the approval and rolling out of district contingency
plans. There were signs that the contingency planning and emergency preparedness were underway in
Karamoja. Discussions with iNGOs revealed that they were actively engaged in disaster preparedness and
IYCF activities, referring potential patients to the IMAM programme.
Overview of Recommendations 1. Improve the UNICEF ERKP log frame and develop theory of change model for future
interventions.
2. Integrate communication at all levels to present common nutrition messages that refines linkages
with all stakeholders and establishes regular communication mechanisms between them, e.g.
Strengthen links between UNICEF, FAO, and iNGOs by designing programmes that engage
stakeholders and community health providers to identify and refer chronic cases.
3. Streamline nutrition information and data analysis with support to build analytic structure.
4. Recognize and study high preforming facilities to identify best practices for duplication.
5. Construct district livelihood and nutrition profiles to help guide targeted interventions that close
the gap between nutrition sensitive and nutrition specific barriers to services.
6. Measure stunting to understand intervention impact, e.g. EBF at >90%, and continually every two
years’ post intervention.

U N I C E F E R K P E n d o f P r o j e c t E v a l u a t i o n P o l i c y B r i e f D e c e m b e r 2 0 1 6
14 | P a g e o f 6 4
7. Support DNCC development and ensure joint sustainability plans that clearly highlight
government and community roles, responsibilities, and nutrition budget.
8. Cultivate better coverage with community engagement strategies to serve hard-to-reach
populations, such as those discussed in resilience planning meetings. Consider effective
community-based management of acute malnutrition (CMAM) models that have been effective in
sub-Saharan Africa.
Chapter 1 Introduction and Context
Evidence suggests that drought is becoming increasingly frequent in some parts of Uganda, resulting in
progressive depletion of livelihood assets, human suffering, decreased productivity and reduced access to
learning and health opportunities, particularly for children and women who are forced to struggle for
survival. The frequent occurrence of drought has also become a major contributory factor to worsening
food insecurity, which in turn has increased the vulnerability of people living in areas prone to drought and
inadequate nutrition. Due to drought, the northeastern part of the country faces the highest levels of food
insecurity, due in part to low levels of household (HH) income, which is a consequence of low agricultural
production and the unique climate challenges in the area (six months of dry season and six months of rainy
season). These factors adversely affect food security in the region.
According to the 2011 Uganda Demographic and Health Survey (UDHS), 33% of the children under five
years are chronically malnourished, 5% are acutely malnourished and 14% are underweight. This figure
represents an improvement from 38.1% as reported in the 2006 UDHS. Although the rates of
undernutrition in Uganda have declined, the Karamoja region still has the highest rates of child stunting at
45% (UDHS, 2011), Severe Acute Malnutrition (SAM) (2.6%) and Global Acute Malnutrition (GAM) (7.1%) in
the country. According to a Food Security and Nutrition Assessment (FSNA) conducted in Karamoja in 2015,
GAM rates were at their highest since 2010. Karamoja has been in an emergency state, and rates of SAM
still hover near the Sphere standards of 10%.
As the area moved towards transition out of an emergency state, the Department for International
Development (DFID) supported the Enhanced Resilience Karamoja Programme (ERKP), aimed at ‘closing
the gap’ between short-term humanitarian response efforts and long-term investment for sustainable
development in the region. By increasing communities' resilience to climate extremes and weather events
in Karamoja, ERKP aimed to reduce vulnerability and increase the ability to withstand shocks. This involved
supporting the increase in nutrition services and local capacity to manage and maintain the nutrition
services system.
The DFID resilience report also found that cumulative shocks and stresses had a bearing on HH food
insecurity and malnutrition. Figure 1 shows the various shocks in each district. For example, Amudat faces
poor harvest/drought and issues with diseases and pests, while Kotido faces poor harvest/drought and high
food prices, all of which contribute to food insecurity.
Development and humanitarian frameworks in Karamoja emerged from the UNICEF GoU Programme of
Cooperation 2010–2014, the Uganda Nutrition Action Plan (UNAP) 2011–2016 and DFID’s Scaling Up
Nutrition position paper (Sept 2011). The ERKP aimed to complement and expand on-going initiatives,
accelerate government activities and help partners in the field of nutrition while reinforcing linkages with
efforts in health, water and sanitation and food security. The focus on resilience provided a framework for
DFID to work with development partners and the Government of Uganda (GoU) to support a substantive

U N I C E F E R K P E n d o f P r o j e c t E v a l u a t i o n P o l i c y B r i e f D e c e m b e r 2 0 1 6
15 | P a g e o f 6 4
shift away from emergency food relief towards interventions that improve livelihoods in the medium to
long term while protecting the most vulnerable in the short to medium term.
The ERKP programme was collaboratively implemented by UNICEF, Food and Agricultural Organisation
(FAO) and World Food Programme (WFP) from November 2013 to date to build resilience in Karamoja.
UNICEF ERKP coordinated with the WFP to implement the annual Food Nutrition Security Assessment
(FSNA) to increase knowledge of performance and health status in Karamoja. The World Health
Organisation (WHO), UNICEF and WFP worked to develop culturally appropriate Infant and Young Child
Feeding (IYCF) messages for Implementing Partners (IPs) and others to disseminate in Karamoja. WFP and
UNICEF alternately supported the annual Food Security Nutrition Assessment. UNICEF and WFP also
coordinated on community training in proper IYCF guidelines and training.
Figure 1. Karamoja shocks and stresses by district (FSN, 2014)
Contingency planning was organised between FAO, WFP and UNICEF, as well as with numerous other
stakeholders (see Appendix II, Mapping for a list). FAO was to support the establishment of agro-pastoral
field schools for the performance of participatory disaster risk assessments that informed remedial
planning and response for disaster preparedness pertaining to food security and nutrition. FAO and WFP
jointly piloted activities on watershed management as part of a broader roadmap to mainstream disaster
risk management in contingency planning.
UNICEF ERKP Nutrition ProgrammeUNICEF ERKP Nutrition ProgrammeUNICEF ERKP Nutrition ProgrammeUNICEF ERKP Nutrition Programme
UNICEF programmes were to build longer- term resilience and capacity for transformational adaptation
through multi-year and multi-sector joint projects. The UNICEF ERKP nutrition response involved numerous
activities aimed at strengthening capacity and building resilience. The priority areas included addressing
acute under nutrition, child protection, water and sanitation and quality of maternal care. To strengthen
health systems, UNICEF introduced Disaster Risk Reduction (DRR) for children and women as a national and
local priority. They worked with the Ministry of Health (MoH) and IPs to integrate nutrition into the health
benefits package, with a goal of transitioning Integrated Management of Acute Malnutrition (IMAM) from
iNGOs to District Health Officers (DHOs), local NGOs, the MoH and national institutions, such as the
Mwanamugimu Nutrition Unit and Makerere University. UNICEF hired seven nutrition technical assistants
and health technical advisors within District Health Teams (DHTs) at each of the Karamoja districts to build
district capacity. UNICEF, IPs and stakeholders sought to engage communities and expand malnutrition
treatment to all 102 health facilities.

U N I C E F E R K P E n d o f P r o j e c t E v a l u a t i o n P o l i c y B r i e f D e c e m b e r 2 0 1 6
16 | P a g e o f 6 4
UNICEF ERKP’s IP was Collegio Universitario Aspiranti Medici Missionari (CUAMM), located in each district.
CUAMM provided technical support, including job supervision, data and supply chain management as well
as other capacity-building activities targeting facilities and communities. They also facilitated quarterly
monitoring visits and monthly technical support supervisions, conducted by nutrition focal persons,
nutritionists and TAs. Technical assistance was also provided to health units to improve forecasting and
submission of supply requests so that commodities were mainstreamed into the National Medical Stores
(NMS) system. CUAMM was also tasked with improving the quality of data reporting for IMAM. This
involved hands-on integrated support supervision for health workers and Village Health Teams (VHTs) on
the collection, compilation and submission of IMAM data to DHOs. Working with the district
biostatisticians, CUAMM worked to consolidate district data and ensure that the registration of nutrition
data on Vitamin A, deworming and iron/folic acid was part of routine Health Management Information
System (HMIS) reporting. They ensured that outpatient, Family Health Day (FHD) and VHT registration and
screening data from mid-upper arm circumference (MUAC) measurements, weight and height were
reported and consolidated at the DHO’s office.
During this time, efforts were made to improve supply chain management, which was to include a review
of the delivery chain and tracking of Ready to Use Therapeutic Food (RUTF) by the district TA. The goal was
to have the commodities mainstreamed into the NMS system.
There are four key ERKP objectives specific to UNICEF:
1. Increase access to high-impact nutrition interventions for mothers and children.
2. Improve coordination and partners’ interaction for nutrition services and capacity to respond to
increases/changes in needs.
3. Increase knowledge and understanding of the underlying causes of poor nutrition in mothers and
children in Karamoja and secure timely and quality information on the changing needs for improved
programming.
4. Strengthen contingency planning and emergency preparedness for nutrition within Karamoja region.
The UNICEF ERKP has evolved over time, and indicators have changed and been added. The 2016 log frame
was changed in 2016 to account for the cost extension of the programme up to March 2017. UNICEF was
negotiating for a no-cost extension at the time of this report.
1.1 Scope Components of the evaluated programme intervention involved UNICEF components of the ERKP
programme and covered the four objectives at UNICEF ERKP for the period November 2013 to December
2015 in the seven districts of Karamoja.
1.2 Rationale This evaluation sought to obtain an unbiased assessment of whether the planned activities with inputs
invested led and/or contributed to the achievement of the expected results, per the Terms of Reference
(TOR) (Appendix V). It focused on programme accountability by learning from the programme and key
aspects that worked (i.e. what worked well; where, why and under what circumstances; etc.). In addition,
it provided a visual guide to nutrition activities in the Karamoja region.

U N I C E F E R K P E n d o f P r o j e c t E v a l u a t i o n P o l i c y B r i e f D e c e m b e r 2 0 1 6
17 | P a g e o f 6 4
1.3 Audience It is a mandate of each institution collaborating in the ERKP to ensure that each institution carries out its
own evaluation. In this regard, WFP and FAO had commenced theirs, hence the reason why this evaluation
focuses only on UNICEF-supported components. The audience for this evaluation is UNICEF, DFID and ERKP
representatives. To forge future collaboration and efforts, the evaluation will also inform ERKP
stakeholders, which include sister UN organisations (WHO, WFP, FAO) and other iNGOs providing nutrition
services in Karamoja.
1.4 Themes This end-term evaluation of the UNICEF-supported components of the broader ERKP, specifically the seven
districts of the Karamoja region, was conducted with a goal of understanding the effectiveness and impact
of UNICEF’s work for the period November 2013 to December 2015. The goal was to provide
recommendations for future programmes. To evaluate the overall success of the UNICEF-supported
programme components in the seven districts of the Karamoja region, the evaluation was designed in
accordance with the priority evaluation themes in the TOR. Focus areas, research questions and results
were captured in the evaluation framework, provided in Appendix VIII, Results Framework, Informed
consent, & Instruments.
The themes are as follows:
• Assess programme relevance, appropriateness and efficiency and quality of services
• Assess programme effectiveness, sustainability and equity
• Document evidence-based lessons, good practices and recommendations
Photo 2, Children of Moroto, Karamoja region, Uganda 2016

U N I C E F E R K P E n d o f P r o j e c t E v a l u a t i o n P o l i c y B r i e f D e c e m b e r 2 0 1 6
18 | P a g e o f 6 4
Chapter 2 Methodology This is an evaluation of the DFID-supported ERKP. Karamoja is in Northeastern Uganda, and it is
administratively divided into seven districts: Kaabong, Abim, Kotido, Moroto, Amudat, Napak and
Nakapiripirit. The region borders Kenya to the east; South Sudan to the north; the districts of Kitgum, Pader,
Lira/Agago, Amuria and Katakwi to the west; and the districts of Kumi, Sironko and Kapchorwa to the south.
It has an estimated population of 965,008 people. The evaluation approach was extensively discussed in
the Inception Report and summarised here (Appendix VI, Inception Report).
UNICEF TOR provided the overall guidance, with inputs from a stakeholder meeting that guided the
refinement of instruments (Appendix VIII), for the evaluation conducted between July and October 2016.
The framework was rather complex because of the ‘meta’ dimensions of almost 40 research questions and
sub-questions. The main instruments for this evaluation were the evaluation questions framed in the TOR,
located in Appendix V. The evaluation also considered the UNICEF log frame, which provided another frame
of reference and included indicators, baselines, targets, data sources and assumptions. The log frame did
not consistently report indicators, however. Not all national nutrition outcome indicators were
incorporated consistently into log frame tables for progress against DFID ERKP log frame and UNICEF log
frame outcomes. Therefore, evaluation instruments and reporting were categorised in accordance with the
TOR overarching categories, e.g. relevance, appropriateness. The framework instruments are captured in
Appendix VIII, Results Framework, Informed consent, & Instruments, organised in accordance with the
research framework: appropriateness, relevance, efficiency and effectiveness.
2.1 Data collection The research population
encompassed three main
levels: national, district and
community. These included
programme funders and
policymakers; district, facility,
community and international
non-government organisation
(iNGO) implementers; and
beneficiary caregivers. We
conducted 258 semi-
structured interviews with national, regional and local IPs. An additional 20 interviews were conducted with
iNGOs implementing nutrition programmes in Karamoja, during a mapping exercise (Appendix III). Focus
group discussions were held with community and VHT members. Characteristics of those interviewed can
be found in Appendix I (Table 9). A detailed description of the 293 those who were interviewed can be
found in Appendix II.
2.2 Sampling The sampling unit was the health facility, taking into consideration the livelihood zones and UNICEF support
to facilities. The delivery of health services at five levels was considered, namely hospitals, Health Centre
(HC) IV, HC III, HC II and HC I (VHTs). All hospitals and HC IVs (five hospitals and five HC IVs) were purposively
selected as part of the evaluation. In addition, we randomly selected three HC IIIs and three HC IIs based
on livelihood zones, facility location and UNICEF support. In total, 51 health facilities supported by UNICEF
were selected.
Photo 3, Stakeholder meeting attendees, September 2016

U N I C E F E R K P E n d o f P r o j e c t E v a l u a t i o n P o l i c y B r i e f D e c e m b e r 2 0 1 6
19 | P a g e o f 6 4
To assess whether the facilities included in our sample differed systematically from facilities not sampled,
we created a flag variable in the Outpatient Therapeutic Centre (OTC) and Inpatient Therapeutic Centre
(ITC) monthly data to indicate whether each facility was part of our sample (see Section 1.7, Limitations).
We found that facilities in our sample had a somewhat higher cure rate (b=5.40; p<0.05) and a lower non-
response rate (b=-2.90; p<0.05) as well as a slightly higher rate of Management of Acute Malnutrition
(MAM) complications (b=0.25; p<0.05). The magnitude of these differences was small, and the coefficients
were only marginally significant. Moreover, the facilities included in our sample did not differ significantly
on other outcomes (e.g. RUTF supplies, total number of new cases). Taken together, these findings suggest
that any sample selection effects were likely to be small.
Counselling observations at 22 facilities demonstrated how IYCF counselling was conducted at every facility.
Observations conducted totalled 22 at various health facilities, hospitals and HC IV, III and II. Triangulation
of their responses with implementers at the facility and community levels validated these findings.
A total of 14 FGDs were held, seven of them were discussions with 63 males and seven MSG discussions
with six males and 54 females. At the health facility level, 22 unobtrusive observations were performed to
assess the process of service delivery, namely IMAM/IYCF screening, counselling and the treatment process
at the OTC level in relation to the recommended standard process of care.
A stakeholder mapping exercise was also conducted, and it involved gathering qualitative data with a select
subset of 20 stakeholders around the following: i) number of NGO personnel directly involved with the
implementation of nutrition-related activities; ii) the donors financially supporting IPs; iii) number and
names of IPs present in each of the seven Karamoja districts; iv) perceptions of IPs’ ability to adequately
address nutrition needs of the target beneficiaries; v) scope of nutrition-related services offered by
stakeholders; vi) annual estimates of people reached by nutrition services and the categories of
beneficiaries reached; and vii) the estimated number of people unable to be reached, in order to assess for
unmet need for nutrition services. These data were captured in detail in the mapping exercise document
found in Appendix III.
2.3 Analysis A descriptive quantitative
analysis was conducted to
assess changes in the
district-level nutritional
outcomes. Results were
presented graphically in
tables, figures and charts.
Two methodologies,
namely Multi-Criteria
Analysis (MCA) and Cost–
Benefit Analysis (CBA),
were explored to
demonstrate which
interventions have the
highest value for money
(VfM). A VfM analysis was
15.70%
13.70%
17.60%
21.60%
7.80%
23.50%
Health facility sampling by Livelihood zones (n=51)
Central and southern
Karamoja pastoral zone
Eastern lowland maize
beans, rice zone
Karamoja Livestock
sorghum, Bulrush millet
zoneNorth East Karamoja
Pastoral zone
North east sorghum, maize,
simsim and livestock
South Kitgum Pader Simsim,
groundnuts, sorghum and
cattle zone
Figure 2. Percentage of health facilities sampled by livelihood zone

U N I C E F E R K P E n d o f P r o j e c t E v a l u a t i o n P o l i c y B r i e f D e c e m b e r 2 0 1 6
20 | P a g e o f 6 4
undertaken to assess cost per child and cost per trainee. The qualitative analysis involved crosschecking
primary and secondary data sources for methodological triangulation as well as stakeholder mapping to
increase validity and enhance the understanding of the ERKP nutrition components. It contributed to the
analysis of linkages and gaps between different nutrition programmes operating in the region (Appendix
III, Karamoja NGO Mapping Exercise).
In addition to descriptive statistics on primary data, we conducted a descriptive analysis of secondary data,
focusing mainly on graphing trends in malnutrition over time. We also linked our primary facility and
caregiver datasets to secondary data sources (DHIS2 and OTC/ITC monitoring data) to examine trends at
the facility and district levels. Because multiple respondents in the primary data were sampled from the
same facility, linkage with secondary facility and district data was accomplished by aggregating individual
responses to create mean facility/district scores and then matching datasets on facility/district name. All
inferential models using these data were fit as fixed effects models to adjust for the autocorrelation of
measures within facilities/districts across time.
Lastly, for stakeholder mapping, we examined the ‘supply’ and ‘demand’ side of nutrition programming
while taking stock key programme implementers and exploring the linkages being harnessed to improve
nutritional outcomes among women and children in the Karamoja region (Appendix III). A map of the
districts provides a visual impression of the diverse players engaged in nutrition programming in the
Karamoja region, an implication of stakeholder distribution for equity, access and service coverage.
2.4 Limitations 1. Accurate, rich and consistent data are essential for assessing the efficiency and efficacy of the
programme. Several problems with secondary data revealed data quality issues. The FSNA data
required considerable cleaning in order to construct a cohesive dataset that could be analysed over
time. Over time, new indicators were added to the tracking tools, which became more complex and
difficult to integrate into the findings.
2. First, it was unclear what level of oversight exists in the data entry process; in some Excel spread
sheets for the OTC/ITC monitoring data, we found errors in the formulae for calculating rates (e.g.
cure rate), suggesting inconsistent knowledge of how these rates were calculated and/or inadequacy
of Excel as a tool for data processing and calculations. These possibilities are not mutually exclusive,
and they could be resolved by centralised calculation and verification.
3. Second, some requested data were unavailable (e.g. detailed training records for all districts and
facilities over time) or came in the form of numerous files with limited explanation. For example, we
requested training and programme implementation data. One file for the Integrated Community Case
Management (ICCM) database contained training data for Moroto, but separate files were not
provided for other districts. Within this file, there were columns with the same labels (e.g. ‘Total VHTs’)
but with two different values in identically named columns for the same facility and reporting period.
Moreover, there appeared to be data for overlapping dates that did not match between different tabs.
No explanation for these discrepancies was discernible from the files, making the data difficult to use
and its quality difficult to assess.
4. With higher quality data, we had more confidence that it was correctly reporting results. After cleaning
the data and addressing multiple errors, performance indicators were not as high as they appeared
from these data previously. Data quality assessments were not being regularly conducted to ensure
proper data collection, entry and authenticity.

U N I C E F E R K P E n d o f P r o j e c t E v a l u a t i o n P o l i c y B r i e f D e c e m b e r 2 0 1 6
21 | P a g e o f 6 4
5. The most consistently collected data appeared to be the OTC/ITC data. However, as these were
focused on admissions, they were highly selective and unable to directly assess programme effects on
nutrition, because 1) they require caregivers to recognise malnutrition or to be referred, 2) they
require caregivers to have the ability to access the facility and 3) they do not include children who
were not malnourished so that rates of malnutrition could be calculated from these data.
Representative data on rates of malnutrition (e.g. GAM) were collected far less frequently and were
not available at the community or facility levels—a lower level of aggregation (i.e. facility/community
rather than district level) would facilitate comparison within districts across time, thereby allowing
analysis of variation in programme implementation in relationship to variation in health outcomes.
Adequate data were also not collected prior to programme start as a baseline, which was essential for
identifying whether changing trends over time reflected the continuation of a pattern or program-
related change. Nor were data on malnutrition in regions outside of Karamoja available across the
period. Such regions could serve as a rough control group for a quasi-experimental approach.
6. Regarding our sample, it showed some evidence of mild selection effects, including a higher cure rate
among facilities in our sample. Moreover, notably, more than half (58%) of monthly data were missing
on RUTF supplies between facilities, which may also lead to concerns that significant RUTF results
were driven by sample selection. However, a flag variable was created to identify missing cases; this
missing RUTF flag was not a significant predictor of the death or default rates (nor odds of meeting
targets for these rates), suggesting that selection was not a serious concern for the RUTF findings.
7. Staff turnover was recognised, and a plan to address it was identified. However, there were no solid
measures in the log frame to determine the impact of efforts to address staff turnover. The training
and mentoring plans involved job supervision, support for data collection and training. However, there
were few training and counselling records.
8. Data around counselling and education were not in an easily evaluable state. There was no data
dictionary for provided data sets. Names of facilities in the data sets were inconsistent. Data-collection
tools were inconsistent across months, where reports were modified numerous times to include more
indicators. While it is encouraging that UNICEF added more measures, it made for a more complex
and in some cases truncated evaluation response.
9. There was limited reference to Theory of Change (ToC) to support the discussion. The working log
frame was used as the framework, e.g. output indicators, planned results, outputs etc. However, the
framework lacked most assumptions in the causal chain. This was not a part of the TOR.
10. Information about contingency planning for resilience was most clearly articulated in reports that
were provided to consultants during the final phase of the evaluation, in October 2016, when IIRR had
completed development of the nutrition model for resilience and UNICEF provided it to the
consultant. It was also not possible to interview the UNICEF focal person or a FAO representative.
11. Although the TOR specifically stated that the evaluation should review November 2013 to December
2015, data collection began in the fourth quarter of 2016. Therefore, the evaluation necessitated
expansion to encompass more than the two-year time frame indicated in the TOR.
2.5 UNEG norms and standards The final evaluation report was prepared considering the UNICEF-Adapted UNEG Evaluation Report
Standards (July 2010).2 These standards give clear guidance on report structure. Findings were presented
in direct correspondence to the evaluation criteria and questions
2 UNEG Quality Checklist for Evaluation Reports, July 2010

U N I C E F E R K P E n d o f P r o j e c t E v a l u a t i o n P o l i c y B r i e f D e c e m b e r 2 0 1 6
22 | P a g e o f 6 4
Photo 4, Child of Karamoja, Moroto 2016

U N I C E F E R K P E n d o f P r o j e c t E v a l u a t i o n P o l i c y B r i e f D e c e m b e r 2 0 1 6
23 | P a g e o f 6 4
Chapter 3 Results As shown in Figure 3, the UNICEF ERKP results chapter is structured in accordance with the four focus areas:
1) increased access to high-impact nutrition interventions for mothers and children; 2) improved
coordination and partners’ interaction for nutrition services and capacity to respond to increasing and
changing needs; 3) increased knowledge and understanding of the underlying causes of poor nutrition in
mothers and children in Karamoja and timely and quality information on changing needs for improved
programming; and 4) strengthened contingency planning and emergency preparedness in the Karamoja
region. A summary of targets and achievements are available in Table 8.
Figure 3. UNICEF four focus areas
Assess Assess Assess Assess pppprogramme rogramme rogramme rogramme relevance and appropriateness, efficiency and quality.relevance and appropriateness, efficiency and quality.relevance and appropriateness, efficiency and quality.relevance and appropriateness, efficiency and quality.
3.1 Overall relevance and appropriateness Was the UNICEF ERKP appropriate to achieve planned results?Was the UNICEF ERKP appropriate to achieve planned results?Was the UNICEF ERKP appropriate to achieve planned results?Was the UNICEF ERKP appropriate to achieve planned results?
Programme design
The ERKP is founded in the principles of resilience, which is explained in Resilience to Food Insecurity and
Malnutrition in Karamoja, Uganda (2015). Resilience is defined as sustained well-being over time. A
resilience initiative that addresses shocks and stresses is absorptive, adaptive and transformative; is
measurable at various levels; is understood through mixed methods and objective and subjective measures
(surveys, assessments, evaluations); reveals how risks, responses and resilience interact with and affect
food security and nutrition over time; and identifies policies and programmes to be informed by findings
on how to strengthen resilience.
The UNICEF ERKP programme design was relevant to the resilience agenda. The UNICEF ERKP Nutrition
Programme combined support for governance and policy development through partnership and
coordination to improve resilience. UNICEF efforts aimed to complement and expand previous initiatives
implemented by the Government and IPs in the field of nutrition. To reinforce linkages and multi-sectoral
efforts, UNICEF appropriately designed the programme around core Sphere standards (3.2.1) and founded
around the principles of resilience. UNCIEF used strategies based on the Theory of Change (ToC), although
there is need for further development around the ToC assumptions.
As part of this larger effort to improve resilience in Karamoja, planned results were captured in log frames
based on a ToC framework for reporting to DFID. In the framework, there were four overarching themes
and approximately 14 milestone indicators for 2016, while there were only four assumptions to address all
outputs, reach/coverage, capacity, behaviour changes, direct benefits and well-being. As no model was
provided, a model was constructed from the log frames, and it is depicted in Figure 4.
Knowledge sharingIncrease access to high impact
nutrition interventions
Coordination & partnership development
Contingency planning
SAM/MAM Reduced

U N I C E F E R K P E n d o f P r o j e c t E v a l u a t i o n P o l i c y B r i e f D e c e m b e r 2 0 1 6
24 | P a g e o f 6 4
This model focused on improved access for mothers and children to high-impact nutrition interventions.
Additional models are needed to consider the other focus areas: coordination, knowledge and contingency
planning. The design of ToC did not include causal link assumptions for the ex-post causal factor evaluation
of causality and attribution. Figure 4 shows the causal link assumptions that were developed and those that
were missing, e.g. assumptions around coverage/reach and direct benefits. In addition, the well-being
assumption was unclear.
Adapted from Useful Theory of Change Models, John Mayne (2015)3
In October 2016, the UNICEF-sponsored Social Protection Model to Enhance Resilience of Vulnerable
Communities in Karamoja to Food Insecurity and Malnutrition was released as a model for nutrition
resilience. In accordance with the principles of resilience, the programme had used previous research
(Section 3.1) and had engaged partners in efforts to align programmes at the national, district and local
levels (Section 3.2). Additionally, community models were comprehensive and appropriate to the cultural
context (Section 3.4). The FSNA was utilised as a tool for sharing the measured response to improving
access to high-impact nutrition interventions. IPs engaged caregivers at facilities and in communities to
build a more adaptive response to referral and treatment. Although UNICEF was not able to achieve all
planned results, it was appropriate to address the high levels of GAM, meeting the ERKP goal of
‘stabilisation in prevalence of GAM and SAM in children aged 6–59 months in Karamoja’ (section 3.6.1).
3 Mayne, J. Useful Theory of Change Models, Canadian Journal of Program Evaluation 30.2 (Fall/autumn), 119-142.
External Influences
Food prices, other
programmes - iNGOs
Unanticipated Results
Tim
eli
ne
Training (IYCF & IMAM) counselling on
nutrition benefits & IYCF
(Core Activities)
Coverage / reach
Capacity changes in knowledge,
attitudes, skills & opportunities
Improved treatment -Increase in IYCF
practices, e.g. DD, EBF, MMF
Children have a more nutritious diet
Child nutrition status &
health improves toward resilience
Figure 4. A theory of change model for improved access for mothers and children to high-impact nutrition interventions
Assumptions

U N I C E F E R K P E n d o f P r o j e c t E v a l u a t i o n P o l i c y B r i e f D e c e m b e r 2 0 1 6
25 | P a g e o f 6 4
Built on appropriate research
Did the Did the Did the Did the ERKPERKPERKPERKP programme build upon appropriate research, studies and assessments that had already been programme build upon appropriate research, studies and assessments that had already been programme build upon appropriate research, studies and assessments that had already been programme build upon appropriate research, studies and assessments that had already been
conducted?conducted?conducted?conducted? Evidence of taking action Evidence of taking action Evidence of taking action Evidence of taking action based on findings of research/operational experience.based on findings of research/operational experience.based on findings of research/operational experience.based on findings of research/operational experience.
There were several examples demonstrating UNICEF ERKP’s utilisation of past research to design
interventions. Figure 24 in AppendixMost relevant to this evaluation, UNICEF built upon findings from the
2013 SLEAC and SQUEAC, which included an investigation into how messages that help to overcome
barriers and constraints were used to design relevant messages that sought to improve nutrition services
in Karamoja. Findings from these 2013 reports indicated that the most commonly reported barriers to
accessing OTC treatment included low awareness of the programme (35%), lack of awareness of
malnutrition (27%) and being too busy to attend (33%). The focus of the UNICEF ERKP effort to disseminate
IYCF messages was driven by this knowledge. To improve awareness, UNICEF ERKP engaged an IP, CUAMM,
to train VHTs and health workers. The programme also engaged CUAMM to recruit community leaders,
promote the inclusion of men in MSGs and VHTs and include these in programme measures. The purpose
was to raise awareness and address barriers to IMAM and IYCF services.
The programme demonstrated that planners recognised the importance of previous research to support
programme implementation, tracking and results measurement. Findings from the annual FSNA reports
were used to inform, improve, and support district partners and officials who collected and disseminated
information about programme performance and progress during quarterly meetings.
3.2 Aligned Was theWas theWas theWas the UNICEFUNICEFUNICEFUNICEF ERKPERKPERKPERKP programmeprogrammeprogrammeprogramme aligned with national and Karamoja priorities and plansaligned with national and Karamoja priorities and plansaligned with national and Karamoja priorities and plansaligned with national and Karamoja priorities and plans????
The UNICEF ERKP effort involved building governance towards a stronger regional and local leadership.
UNICEF engaged committed stakeholders to align programmes for IYCF community education, contingency
planning and resiliency development. Consistent with the principles of resilience, activities sought to build
systemic capacity at district and facility levels to absorb shocks and stresses. Stakeholders understood the
value of building capabilities towards resilience. Integration of quantitative and qualitative methods
considered progress over time. It was evidenced in the literature review and during KII with national and
regional stakeholders, that the ERKP UNICEF team had been a major influence and collaborator with
government, policymakers, and other national stakeholders in support of the nutrition agenda since 2009
(Appendix I).
MoH and UNICEF are mutually committed to the principles of best nutrition during the ‘first 1,000 days’,
demonstrated by the Uganda National Action Plan, nutrition-specific strategic planning and working
groups. Resilience to Food Insecurity and Malnutrition in Karamoja, Uganda framed the principles of
resilience to inform the resilience context. Furthermore, the effort to build resilience in Karamoja required
a multi-sectoral foundation, per the Karamoja Multi-Sectoral Nutrition Strategy and Joint UN Karamoja
Resilience Strategy. UNICEF ERKP also contributed to the development of the Karamoja Integrated
Development Plan and the Karamoja Multi-Sectoral Nutrition Strategy, ensuring alignment to national
development strategies and resilience planning. The ERKP nutrition components were aligned at the
national and district levels while considering the Sphere standards, e.g. performance indicators of cure,
death, and default rates for SAM under five years admitted.
The national nutrition strategic planning and working groups, and strategic and policy planning largely
organised by UNICEF, integrated multi-sectoral approaches that involved government, other UN sister

U N I C E F E R K P E n d o f P r o j e c t E v a l u a t i o n P o l i c y B r i e f D e c e m b e r 2 0 1 6
26 | P a g e o f 6 4
agencies (WFP, FAO, WHO and USAID) and iNGO stakeholders in the region. The influence of the UNICEF
ERKP programme was seen in the Karamoja Nutrition Programme Multi-Sectoral Nutrition Strategy as well
as the Food Nutrition Security Assessments, which were supported by UNICEF and WFP and produced by
MoH. UNICEF was involved in the Uganda National Policy on IYCF in 2007 and the IYCF Counselling, which
supported the adaptation of materials appropriate to the situation in Uganda.
At the facility level, the majority (63.9%) of implementers felt that nutrition programme activities were
highly aligned with national/Karamoja priorities, while most of the remainder of respondents felt that
activities were fairly aligned. Only a very small minority (<2%) felt health facility activities were poorly or
not at all aligned with these priorities. The open-ended follow-up question inquired about why they thought
activities were aligned to the extent they indicated. Of those respondents, 40% that had rated alignment
highly reasoned that policies, procedures and national guidelines were in place and used at the facility.
3.3 Comprehensive Was it comprehensive from a multiWas it comprehensive from a multiWas it comprehensive from a multiWas it comprehensive from a multi----sectoral perspective (agriculture, education, health, social protection, sectoral perspective (agriculture, education, health, social protection, sectoral perspective (agriculture, education, health, social protection, sectoral perspective (agriculture, education, health, social protection,
water sanitation and hygiene)?water sanitation and hygiene)?water sanitation and hygiene)?water sanitation and hygiene)?
The most comprehensive multi-sectoral effort was found in the contingency planning. The Karamoja
nutrition programme strategy and support for district nutrition and disaster management committees
demonstrated UNICEF’s influence. UNICEF worked in collaboration with WHO, UNFPA, UNDP, FAO,
UNAIDS, WFP and other bilateral agencies to implement multi-sectoral strategies (contributions and
coordination details in Section 3.6.4). The ERKP programme in general engaged numerous sectors around
agriculture, education, health, social protection, water, sanitation and hygiene. Findings from the mapping
exercise and interviews with national staff confirmed these assumptions (see Mapping Exercise in Appendix
III). Stakeholders in all sub-counties were engaged (Figure 19, page 46). In general, donor-funded projects
in Karamoja indicated that their programmes were increasingly centred on nutrition, health education and
sanitation. Their nutrition sensitive efforts that were linked with UNICEF ERKP nutrition-specific
interventions. This was achieved through meetings and IYCF training. Programme representatives said that
they received training in IYCF and were screening and referring children to facilities, though it was unclear
which UN agency or agencies had held training with stakeholders. All 20 stakeholders interviewed in
Karamoja said that health education was a component of their work. Interviews with facility staff indicated
they were referring to livelihood programmes. However, we found a negative association with both
micronutrient supplementation (b=-4.08; p<0.05) and livelihood referrals (b=-6.10; p<0.05), suggesting
those facilities providing treatment may have been less likely to refer to livelihood programmes (Appendix
VI, Table 11). The social protection model developed by IIRR emphasises ‘a long term and multi-sectoral
collaborative of programmes as part of a “twin track approach” to address the underlying and basic causes
of undernutrition whilst, at the same time, maintaining the readiness and structures to respond to potential
emergency conditions’.
3.4 Appropriate for cultural context Was the Was the Was the Was the ERKPERKPERKPERKP programme programme programme programme appropriate for appropriate for appropriate for appropriate for the the the the cultural context? cultural context? cultural context? cultural context? Was there evidence of Was there evidence of Was there evidence of Was there evidence of the the the the design design design design being being being being
shaped around cultural practices?shaped around cultural practices?shaped around cultural practices?shaped around cultural practices?
Interventions displayed cultural sensitivity to the context in which they were applied, which was confirmed
by caregivers and community representatives. With few exceptions, respondents felt the food culture and

U N I C E F E R K P E n d o f P r o j e c t E v a l u a t i o n P o l i c y B r i e f D e c e m b e r 2 0 1 6
27 | P a g e o f 6 4
context were considered. From a caregiver perspective, most (87.4%) felt that nutrition materials and
supplies had considered the local food culture.
Table 1. Karamojong food culture adequately considered when providing counselling
KARAMOJONG FOOD KARAMOJONG FOOD KARAMOJONG FOOD KARAMOJONG FOOD
CULTURE CONSIDEREDCULTURE CONSIDEREDCULTURE CONSIDEREDCULTURE CONSIDERED
COMMUNITY LEVEL COMMUNITY LEVEL COMMUNITY LEVEL COMMUNITY LEVEL
IMPLEMENTERS (N=34)IMPLEMENTERS (N=34)IMPLEMENTERS (N=34)IMPLEMENTERS (N=34)
CARE GIVERS (N=119)CARE GIVERS (N=119)CARE GIVERS (N=119)CARE GIVERS (N=119)
YESYESYESYES 94.1% 87.4%
NONONONO 5.9% 2.6%
Table 1. Karamojong food culture adequately considered when providing . Results showed that the clear
majority (94.1%) of community service providers (CSPs) felt that the methods used for screening children
under the programme parameters were acceptable to caregivers, and an equal number also believed that
the Karamojong food culture was adequately accounted for in the programme’s counselling messages.
Most CSPs (94.1%) agreed that the programme screening methods were acceptable to the community.
They were also asked if they thought key messages were easy for caregivers to follow. Of the 34 CSPs,
85.3% said that they were easy to follow. Caregivers agreed with this assessment (94%). Respondents
indicated during FGDs that some messages did not meet their needs (e.g., when ‘some women do not have
milk’). They also said they had experienced going to the health unit to find ‘health workers were not in
attendance’, which led to disappointment and probably a lower response rate.
‘The Karamojong food culture was adequately considered by the health workers and by the counsellors, because
they agree that our foods are good and they encourage eating them in a balanced way, for example, ensuring the
same type of food is not eaten every day’. MSG Napak
Evidence of community models
What is the evidence of community models being implemeWhat is the evidence of community models being implemeWhat is the evidence of community models being implemeWhat is the evidence of community models being implementing in Karamoja on behavioural change for IYCF, nting in Karamoja on behavioural change for IYCF, nting in Karamoja on behavioural change for IYCF, nting in Karamoja on behavioural change for IYCF,
maternal nutrition and hygiene?maternal nutrition and hygiene?maternal nutrition and hygiene?maternal nutrition and hygiene?
The community model involved outreach activities to engage and inform communities to change
behaviour. At the community level, models of implementation involved identification and training of
informal groups, community mobilisation, dialogues, sensitisation, forum theatres, food fairs, health facility
activation and so on, and operational support was provided to DHOs and NGOs. The evidence of community
models implemented in Karamoja was demonstrated via responses from caregivers regarding their
referrals to health facilities. More than 80% of those interviewed (n=119) had been referred via a VHT or
mother support group. Furthermore, community model organisations, such as VHTs and mother support
groups, were found to further expand their activities into other livelihood activities, such as savings and
loans groups (Appendix III, Mapping).
The UNICEF ERKP community models sought to strengthen Water and Sanitation Hygiene (WASH) training
message strategies. The mapping exercise revealed that all the IPs working in Karamoja had carried out
nutritional education campaigns at the community and HH levels. The local population was provided with
information on the recommended nutrition commodities that prevent malnutrition. Gender
mainstreaming activities aimed at promoting women’s involvement in agricultural farming included
promotion of horticulture to supplement cereals and educating women on better methods of food
preparation. The educational component included dissemination of information about WASH, e.g.
sensitising the local population about the importance of the building and use of pit latrines, restoring the
existing water sources, such as boreholes, and establishing new ones.

U N I C E F E R K P E n d o f P r o j e c t E v a l u a t i o n P o l i c y B r i e f D e c e m b e r 2 0 1 6
28 | P a g e o f 6 4
Although facility staff indicated they provide hygiene and sanitation messages, it was not evident in
responses from caregivers, community counsellors and observations (section 3.6). WASH indicators were
not tracked in the log frame.
3.5 Equity To what extent has the programme design and implementation responded to barriers and bottlenecks to To what extent has the programme design and implementation responded to barriers and bottlenecks to To what extent has the programme design and implementation responded to barriers and bottlenecks to To what extent has the programme design and implementation responded to barriers and bottlenecks to
inequalities in access and coverage of key inequalities in access and coverage of key inequalities in access and coverage of key inequalities in access and coverage of key nutrition interventions?nutrition interventions?nutrition interventions?nutrition interventions?
The SQUEAC study 2012 and the access and coverage LQAS survey in 2015, as discussed in Section 3.1,
provided the foundation for the identification of barriers and bottlenecks. They reported, ‘Consistent
themes in barriers were lack of awareness of the programme, lack of awareness of malnutrition,
opportunity costs and rejection of the child by the programme’. UNICEF sought to address these barriers
through behavior change messages and IYCF training of VHTs and community representatives in order to
reach the target population. IYCF interventions also sought to engage men and community leaders in VHTs.
Mainstreamed gender legislation and public policy targeted women and children, which had implications
for both women and men. Programmes focused on the health of children, resulting in fairly distributed
services to male and female children.4
According to reports, geographic coverage was at 50% in 2015, with the programme focus on vulnerable
women and children under five years of age in hard-to-reach communities. A household survey was not
feasible during this evaluation. Therefore, we sought to ascertain the extent to which the programme was
perceived to demonstrate equity, considering two core aspects: geographical coverage and gender equity.
This was done through the desk review of reports and interviews with facility and community members.
Figure 5. Perceived coverage by gender and target population
When asked if nutrition services were reaching vulnerable children adequately, rather evenly, when
comparing facility staff and caregiver responses, just over three quarters of both facility service providers
(75.9%) and caregivers (78.2%) felt that the programme provided coverage for all targeted populations
(lactating women and children under five years). In contrast, 22% said nutrition services were not
adequately reaching the population. Those who felt it was reaching the vulnerable children, suggested the
reason for this was that “there are VHTs in every village.” And “Most malnourished children are in the
program.” Contrarily, some caregivers felt that VHTs were not well educated and the “screening process is
not done well, since most VHTs are not educated well.”
4 Of note, most interviewed caregivers were women.
75.90%
24.10%
88%
22%
78.20%
21.80%
73.90%
26.10%
0.00% 10.00% 20.00% 30.00% 40.00% 50.00% 60.00% 70.00% 80.00% 90.00% 100.00%
Yes
No
Yes
No
Co
vera
ge
all
ta
rge
t
po
pu
lati
o
n
Co
vera
ge
by
ge
nd
er
Perceived Coverage by Gender and Target
Caregivers (N=119) Facility service providers (N=108)

U N I C E F E R K P E n d o f P r o j e c t E v a l u a t i o n P o l i c y B r i e f D e c e m b e r 2 0 1 6
29 | P a g e o f 6 4
There was some evidence that this varied by district. Specifically, when compared to respondents in
Kaabong, respondents in Napak had significantly lower odds (OR=0.11; p<0.05) of reporting that the
programme had reached targeted beneficiaries. There was somewhat less agreement on whether the
programme reached the population based on sex and age. Of facility service providers, 88% agreed that
the programme made efforts to target both men and women, compared to 73.9% of caregivers agreeing
with the statement. DHOs in Abim, Nakapiripirit, and Amudat said they were not reaching target
beneficiaries in their districts due to roads and transportation, gaps in coordination, stockouts, and lack of
VHT supervision in hard-to-reach areas.
3.6 Effective DidDidDidDid the efforts in the the efforts in the the efforts in the the efforts in the fourfourfourfour result areas scale up of result areas scale up of result areas scale up of result areas scale up of highhighhighhigh----impactimpactimpactimpact nutritionnutritionnutritionnutrition----specific interventions, coordination, specific interventions, coordination, specific interventions, coordination, specific interventions, coordination,
knowledge sharing and contingency planning preparedness implemented with sufficient quantity, qualityknowledge sharing and contingency planning preparedness implemented with sufficient quantity, qualityknowledge sharing and contingency planning preparedness implemented with sufficient quantity, qualityknowledge sharing and contingency planning preparedness implemented with sufficient quantity, quality,,,,
timeliness and adequacy to improve the quality, quantity and timeliness of implementation in support of timeliness and adequacy to improve the quality, quantity and timeliness of implementation in support of timeliness and adequacy to improve the quality, quantity and timeliness of implementation in support of timeliness and adequacy to improve the quality, quantity and timeliness of implementation in support of
achievement of planned results? achievement of planned results? achievement of planned results? achievement of planned results?
3.6.1 Scaling up access to high-impact nutrition interventions Programme effectiveness relates to the level by which the activities of a programme produce the desired
effect. Methods used in scaling up nutrition included integration of the IMAM programme into the existing
health system, skilling up healthcare workers and VHTs, engaging district officials and providing support to
assist them in transitioning IMAM services. Overall, results reported demonstrate a decline in malnutrition
rates and highlight the effort of all stakeholders in the region to stabilise the situation. By March 2015, per
UNICEF reports, they had met and exceeded most targets set forth in the proposal, including the
engagement of VHTs and the enrolment of SAM cases in therapeutic programmes. The numbers of OTC
and ITC were relatively stable. Quarterly reports showed 14 new sites, going from 102 in November 2013
to 116 in October 2015. However, by mid-2016, UNICEF had also completed training and coaching of only
89 health workers of the targeted 400.
Contrarily, community level programmes appeared to be lagging behind except for the effort to improve
exclusive breastfeeding. By mid-2016, UNICEF Uganda’s efforts in Karamoja exceeded the target of 80%
and achieved a rate of more than 90% of women EBF, above the national average. However, results of
efforts to improve meal frequency for children <5 years of age was not as impressive. The FSNA baseline in
May 2012 showed minimum meal frequency for children <5 was in the 30–50% range. Unfortunately, we
did not observe improvements in meal frequency. In 2014 the rate of practice was at 42%, 36.5% in 2015
and in June 2016, it was reported at 34%. Dietary diversity by December 2015 was up by 2.2% increasing to 5.6%
and by June, 2016 it was at 6%, with a baseline of 30-50% (May 2012 baseline corrected]. Dietary diversity and
complementary feeding practices had changed little over time, and minimum meal frequency appeared to
be on the decline.
Stabilise GAM
Was the UNICEF Was the UNICEF Was the UNICEF Was the UNICEF ERKPERKPERKPERKP programme programme programme programme appropriate to address the high levels of GAM inappropriate to address the high levels of GAM inappropriate to address the high levels of GAM inappropriate to address the high levels of GAM in Karamoja?Karamoja?Karamoja?Karamoja?
UNICEF ERKP nutrition programme was appropriate to address the high levels of GAM. The goal of
‘stabilisation in prevalence of GAM and SAM in children aged 6–59 months in Karamoja’ was achieved.
Results from the Haley Report suggest that GAM in the year 2000 was at 20%. Since 2009, Karamoja moved
from a critical status (>=15%) to a status of serious (10–14%), according to the WHO nutrition crisis

U N I C E F E R K P E n d o f P r o j e c t E v a l u a t i o n P o l i c y B r i e f D e c e m b e r 2 0 1 6
30 | P a g e o f 6 4
classification.5 GAM in Karamoja was reported in May, September and December from December 2009 to
July 2016. GAM rates over this period hovered between a low of 8.1% at the end of 2011 to a high of 14%
in June 2015. Over this same period, the average of GAM was 11% (Figure 6). The difference between the
highest and lowest rates over the entire period was 6%.
We aimed to determine the impact of the nutrition effort using existing WHO data in Figure 6. It shows
GAM rates pre- and post-implementation, starting in December 2009 to late 2016. The baseline for this
evaluation was November 2013. The average GAM in the period before the evaluation was 10.52%. The
rates of GAM have gradually increased since 2009. However, GAM rates may be stabilising. Although the
average was 1.9% higher (12.45%) between December 2013 and July 2016, the range was lower. It was
between 11% and 14%, only a 3% difference over 31 months, whereas before the evaluation period, the
difference was 4.7% over 36 months, demonstrating greater swings in the prevalence of GAM.
Figure 6. GAM in Karamoja – UNICEF provided - source WHO
Source 1 District Biostatisticians provided Oct 2016
In June 2015, GAM among children 6–59 months in the Karamoja region was reported to be 14.1%, 95% CI
(12.9–15.3), the highest recorded in the last three years. The rate fell to 12.4% by December, and by July
the following year, GAM was down to 11.0%, below average for the period (see Figure 6).
SAM in Karamoja
The March 2016, UNICF ERKP target rate for SAM was 2%. SAM indicator data for 2014 were not
available. SAM in southern Karamoja between July 2015 and June 2016 as shown in Figure 7, shows
downward trends in the south, with greatest declines in Amudat and Napak. Figure 8 shows a
downward trend in northern Karamoja only in Kaabong, with increasing trends in Abim and Kotido.
5 The Management of Nutrition in Major Emergencies, WHO, 2003
2009
Dec
2010
May
2010
Sept
2010
Dec
2011
May
2011
Sept
2011
Dec
2012
May
2013
May
2013
Dec
2014
Jun
2014
Dec
2015
Jun
2015
Dec
2016
Jul
% GAM 9.5 11.8 9.5 9.4 12.8 9.1 8.1 11.7 12.3 11.0 13.4 12.8 14.1 12.4 11.0
9.511.8
9.5 9.412.8
9.1 8.111.7 12.3 11.0
13.4 12.8 14.1 12.4 11.0
0.0
5.0
10.0
15.0
20.0
Percent GAM in Karamoja
Figure 7. South Karamoja SAM – Source CUAMM

U N I C E F E R K P E n d o f P r o j e c t E v a l u a t i o n P o l i c y B r i e f D e c e m b e r 2 0 1 6
31 | P a g e o f 6 4
Figure 8. North Karamoja SAM – Source CUAMM
Quality of IYCF services
What is the quality of IYCF services provided at the facility level?What is the quality of IYCF services provided at the facility level?What is the quality of IYCF services provided at the facility level?What is the quality of IYCF services provided at the facility level?
UNICEF ERKP improved the quality of IYCF nutrition services at facilities. The quality of counselling was
demonstrated at several levels, during observations at facilities, in interviews with facility staff and during
the sharing of community perceptions about satisfaction with the programme. Participant observation
techniques validated the quality of IYCF counselling and assessment services. Observations about processes
and information given to caregivers also informed the quality of counselling services.
0
50
100
150
200
1-Jul-15 1-Aug-15 1-Sep-15 1-Oct-15 1-Nov-15 1-Dec-15 1-Jan-16 1-Feb-16 1-Mar-16 1-Apr-16 1-May-
16
1-Jun-16
South Karamoja Severe Acute Malnutrition
(Source CUAMM Data)
Amudat Moroto Nakapiripirit
Napak Linear (Amudat) Linear (Moroto)
0
50
100
150
200
250
300
350
North Karamoja Severe Acute Malnutrition- (Source CUAMM Data)
Abim Kaabong Kotido Linear (Abim) Linear (Kaabong) Linear (Kotido)

U N I C E F E R K P E n d o f P r o j e c t E v a l u a t i o n P o l i c y B r i e f D e c e m b e r 2 0 1 6
32 | P a g e o f 6 4
Satisfaction with the nutrition programme was high among implementers. Over 90% of facility staff, CSPs
and caregivers felt that the programme offered the best possible solution to malnutrition in Karamoja,
while district implementers were inclined to say the program was a best solution 75% of the time.
Figure 9, Programme perceived to offer best solution
Moreover, facility staff and community implementers reported a range of positive results they felt were
directly attributable to the programme. More than three quarters of both groups cited an increased cure
rate, lower child deaths and increased caregiver information as positive results arising from the
programme. Indeed, cure and death rates had improved (Section 3.2.1). While 63% of facility staff (n= 108)
and 71% of community implementers (n=34) pointed to a reduction in the cases of malnutrition due to the
programme, 66.7% of facility staff and 85% of community implementers reported that OTC services were
also associated with a reduction in child sickness in general.
Our children have benefited from the Kapedo health unit and they have received RUTF and other
supplementary foods like soya flour; this has been possible through the health unit accessibility outreach
done by VHTs among other things’. FGD Men Kaabong
A smaller but still sizable proportion also felt that the nutrition programme at OTCs resulted in higher
uptake of services (52.8% facility staff and 32% VHT) and increased referrals in their facility and community
(30.6% facility staff and 32% VHT). Caregivers were not asked to report on positive results attributable to
the program; however, 92.4% said they were satisfied with the services being offered, and 99.2% felt that
IYCF counselling messages helped to improve their nutrition knowledge and influence behaviours (n=118).
Of staff interviewed at OTC/ITCs, over 80% said that they give messages on exclusive breastfeeding up to
six months (82.4%). Complementary feeding starting at 6 months (85.3%) was listed next, followed by best
practices for feeding a sick child (88.2%) and best practices for hygiene and sanitation (97.1%). In addition,
52.9% cited immunisation as a message provided to caregivers, and 50% cited maternal nutrition
messaging. Fewer than 50% reported that counselling messages include control of Vitamin A (47.1%), and
only 14.7% mentioned anaemia. Deworming was referenced (23.5%), as was growth monitoring and
promotion (41.2%).
75%
91.7% 91%97.5%
0%
50%
100%
1
Percent Reporting Program Offered the Best Solution
DNs and DHOs Facility Staff Community Implementers Program Beneficiaries
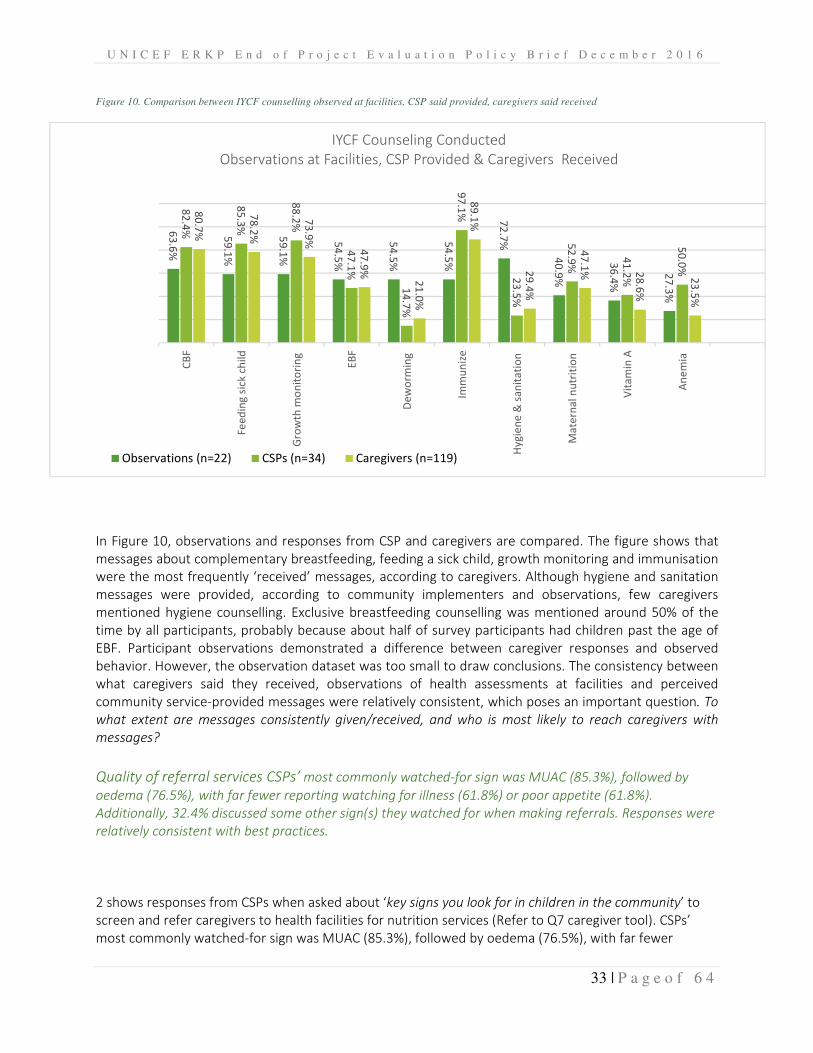
U N I C E F E R K P E n d o f P r o j e c t E v a l u a t i o n P o l i c y B r i e f D e c e m b e r 2 0 1 6
33 | P a g e o f 6 4
Figure 10. Comparison between IYCF counselling observed at facilities, CSP said provided, caregivers said received
In Figure 10, observations and responses from CSP and caregivers are compared. The figure shows that
messages about complementary breastfeeding, feeding a sick child, growth monitoring and immunisation
were the most frequently ‘received’ messages, according to caregivers. Although hygiene and sanitation
messages were provided, according to community implementers and observations, few caregivers
mentioned hygiene counselling. Exclusive breastfeeding counselling was mentioned around 50% of the
time by all participants, probably because about half of survey participants had children past the age of
EBF. Participant observations demonstrated a difference between caregiver responses and observed
behavior. However, the observation dataset was too small to draw conclusions. The consistency between
what caregivers said they received, observations of health assessments at facilities and perceived
community service-provided messages were relatively consistent, which poses an important question. To
what extent are messages consistently given/received, and who is most likely to reach caregivers with
messages?
Quality of referral services CSPs’ most commonly watched-for sign was MUAC (85.3%), followed by
oedema (76.5%), with far fewer reporting watching for illness (61.8%) or poor appetite (61.8%).
Additionally, 32.4% discussed some other sign(s) they watched for when making referrals. Responses were
relatively consistent with best practices.
2 shows responses from CSPs when asked about ‘key signs you look for in children in the community’ to
screen and refer caregivers to health facilities for nutrition services (Refer to Q7 caregiver tool). CSPs’
most commonly watched-for sign was MUAC (85.3%), followed by oedema (76.5%), with far fewer
63
.6%
59
.1%
59
.1%
54
.5%
54
.5%
54
.5%
72
.7%
40
.9%
36
.4%
27
.3%
82
.4%
85
.3%
88
.2%
47
.1%
14
.7%
97
.1%
23
.5%
52
.9%
41
.2%
50
.0%
80
.7%
78
.2%
73
.9%
47
.9%
21
.0%
89
.1%
29
.4%
47
.1% 2
8.6
%
23
.5%
CB
F
Fe
ed
ing
sic
k c
hil
d
Gro
wth
mo
nit
ori
ng
EB
F
De
wo
rmin
g
Imm
un
ize
Hy
gie
ne
& s
an
ita
tio
n
Ma
tern
al
nu
trit
ion
Vit
am
in A
An
em
ia
IYCF Counseling Conducted
Observations at Facilities, CSP Provided & Caregivers Received
Observations (n=22) CSPs (n=34) Caregivers (n=119)

U N I C E F E R K P E n d o f P r o j e c t E v a l u a t i o n P o l i c y B r i e f D e c e m b e r 2 0 1 6
34 | P a g e o f 6 4
reporting watching for illness (61.8%) or poor appetite (61.8%). Additionally, 32.4% discussed some other
sign(s) they watched for when making referrals. Responses were relatively consistent with best practices.
Table 2, VHT responses to ‘what indicates key signs for OTC referral’
KEY SIGNS TO WATCH FKEY SIGNS TO WATCH FKEY SIGNS TO WATCH FKEY SIGNS TO WATCH FOR TO REFER TO OTOR TO REFER TO OTOR TO REFER TO OTOR TO REFER TO OTCCCC NNNN N=N=N=N=34 /34 /34 /34 / %%%%
MUAC 29 85.3%
Oedema 26 76.5%
Illness 21 61.8%
Poor appetite 21 61.8%
Other 11 32.4%
Figure 11 shows how caregivers came to seek services at facilities included in the survey. There was a
significant variation across districts in how caregivers came to seek services at the facility. Most caregivers
who were at the 51 facilities visited, (72%) were seeking care because of a VHT referral, which highlighted
the important link that the VHT has within the community.
Figure 11 Caregiver Referrals by type - Primary Data 2016
Caregivers in Amudat, Nakapiripirit, and Napak had significantly lower odds of seeking services at the facility
because of VHT referral compared to those in Kaabong, which was used as reference. This may signal a
need for more VHT scale up in Amudat, Nakapiripirit, and Napak.
Unexpected results
The analysis of the data from the caregivers provided some additional insights on the qualitative
effectiveness of the nutrition programme. The clear majority of caregivers interviewed (116 out of 119)
believed that the programme has contributed to improving the nutritional needs of Karamoja. In assessing
the programme, many of them explicitly mentioned the use of RUTF, particularly in combination with locally
72%
48%
22%
17%
14%
7%
Referred by VHT
Facility near my home
Friend- family
Another health facility
Referred by MSG
Other
0% 10% 20% 30% 40% 50% 60% 70% 80%
Caregivers treatment seeking referrals to facility
(n=119)
Caregivers treatment seeking referral

U N I C E F E R K P E n d o f P r o j e c t E v a l u a t i o n P o l i c y B r i e f D e c e m b e r 2 0 1 6
35 | P a g e o f 6 4
available foods, such as green vegetables and milk, and their role in recovery from malnutrition for affected
children (including orphans, who were perceived to be most at risk of death in some interviews).
Focus groups revealed that some people starve their children to remain in the programme. They also indicated
that mothers sometimes give RUTF to other mothers who do not have food for their children. RUTF is not just
used by children with nutrition problems, because most mothers share with other mothers for their children
when they do not have food. During semi-structured interviews, facility staff said that because of OTC, they had:
• Identified some children to immunise
• Identified mothers for antenatal care (ANC)
• Dependency upon the supplemental foods
• Selling of RUTF and some starve their children to obtain it
• Community members are referring children to the programme
Equitable & accessible IMAM services
How accessible is the IMAM programHow accessible is the IMAM programHow accessible is the IMAM programHow accessible is the IMAM programmemememe? ? ? ? Is it reaching its intended beneficiaries?Is it reaching its intended beneficiaries?Is it reaching its intended beneficiaries?Is it reaching its intended beneficiaries?
The extent to which IMAM and IYCF is accessible and reaches its intended target beneficiaries was
measured by examining changes in the number of severely malnourished cases by district over time, i.e.
the number of severely malnourished cases. The sustained reduction in the under-five prevalence of acute
malnutrition demonstrated accessibility and the fact that targeted beneficiaries were reached (See cases
by district over time in Appendix I).
At facilities, the most commonly mentioned element that hampered coverage was the inclusion of men in
counselling and training. When asked about the programme’s effort to be inclusive of men and women,
42.6% indicated that UNICEF’s nutrition programme was making a ‘fair effort’, and their reasoning was that
‘men think that women are the ones responsible for the home’.
Focus group respondents said, ‘Women are the ones who usually bring children for services’ and ‘The
programme is only focused on children’. Meanwhile, 45.4% of facility implementers felt that a high effort
was made to reach both men and women, with only a small minority reporting a poor effort (8.3%) or no
effort (3.7%). Staff members at facilities were tasked with indicating their level of effort to reach both men
and women. Less than half indicated they made a high effort (45.4%), and most of the other respondents
(42.6%) said that they made a fair effort. Almost a tenth of the respondents said the effort to reach both
men and women was a ‘poor effort’, because ‘few men are seen escorting their wives to the facility’.
When caregivers were asked if nutrition services were reaching vulnerable children adequately, 78% of
them affirmed, while 22% said nutrition services were not adequately reaching the population. Those who
felt it was reaching the vulnerable children suggested the reason for this was that ‘there are VHTs in every
village’. Moreover, ‘Most malnourished children are in the programme’. Contrarily, caregivers felt some
messages were not meeting targets, because ‘the screening process is not done well, since most VHTs are
not well educated’.
FHDs
The holding of FHDs at facilities was considered an outreach platform aimed at reaching hard-to-reach
beneficiaries.6 This presented opportunities to provide services and reach programme targets for Vitamin
A, as well as providing deworming and immunisations. UNICEF and other agencies supported FHDs held in
district facilities. In 2014, FHDs were scheduled four times per year. In 2015, MoH reduced the number to
6 2014 LQAS Coverage Survey

U N I C E F E R K P E n d o f P r o j e c t E v a l u a t i o n P o l i c y B r i e f D e c e m b e r 2 0 1 6
36 | P a g e o f 6 4
twice per year. It was unclear why the number of FHDs was reduced. Data generated through FHDs were
limited to July 2015 to March 2106, charted in Figure 12. The figure shows surges in the provision of both
Vitamin A supplementation. Peak and trough periods for coverage of the second dose of Vitamin A, had
the highest across-district mean (3,456 children) receiving this micronutrient supplementation occurring in
October 2015 and the lowest mean (446 children) supplementation occurring in March 2015.
Barriers to access
Have barriers to access been identified and addressed? Have barriers to access been identified and addressed? Have barriers to access been identified and addressed? Have barriers to access been identified and addressed?
Findings from SQUEAC and SLEAC surveys in 2013, and the subsequent 2015 LQAS survey report, showed
that the most commonly reported barriers to accessing OTC treatment included low awareness of the
programme, lack of awareness of malnutrition and being too busy to attend (Section 3.1). Evaluators found
that strategies to address awareness of malnutrition had led to an improved understanding of malnutrition
at facilities and iNGOs, improved cure and default rates.
Awareness of the programme was apparent among interviewed caregivers. They shared with interviewers
the messages they had received in Karamoja. Community implementers also shared the messages that they
conveyed. Responses from both are combined in Table 2. Most of the time (97.1%), implementers said they
had disseminated hygiene and sanitation information, and 89.1% of caregivers received those messages;
for feeding practices for a sick child, these figures were 88.2% for community implementers and 78.2% for
caregivers. For exclusive breastfeeding (EBF) up to 6 months, the figure was 82.4% for VHTs, and 80.7% of
caregivers received the messages. The rate of EBF was estimated at 91%.
Table 3, IYCF messages given by VHTs in the programme
MESSAGES DISTRIBUTEDMESSAGES DISTRIBUTEDMESSAGES DISTRIBUTEDMESSAGES DISTRIBUTED AND RECEIVEDAND RECEIVEDAND RECEIVEDAND RECEIVED COMMUNITY COMMUNITY COMMUNITY COMMUNITY
IMPLEMENTERS (N=34)IMPLEMENTERS (N=34)IMPLEMENTERS (N=34)IMPLEMENTERS (N=34)
CAREGIVERSCAREGIVERSCAREGIVERSCAREGIVERS
(N=119)(N=119)(N=119)(N=119)
EXCLUSIVE BREASTFEEDEXCLUSIVE BREASTFEEDEXCLUSIVE BREASTFEEDEXCLUSIVE BREASTFEEDING UP TO SIX MONTHSING UP TO SIX MONTHSING UP TO SIX MONTHSING UP TO SIX MONTHS 82.4% 80.7%
COMPLEMENTARY FEEDINCOMPLEMENTARY FEEDINCOMPLEMENTARY FEEDINCOMPLEMENTARY FEEDINGGGG STARTING AT 6 MONTHSTARTING AT 6 MONTHSTARTING AT 6 MONTHSTARTING AT 6 MONTHS WITH CONTINUED BRES WITH CONTINUED BRES WITH CONTINUED BRES WITH CONTINUED BREASTFEEDINGASTFEEDINGASTFEEDINGASTFEEDING 85.3% 78.2%
FEEDING FEEDING FEEDING FEEDING AAAA SICK CHILDSICK CHILDSICK CHILDSICK CHILD 88.2% 73.9%
Figure 12. Children receiving second Vitamin-A dose by district
100
5000
100
5000
100
5000
Mar-2015Jul-2015
Nov-2015Mar-2016
Mar-2015Jul-2015
Nov-2015Mar-2016
Mar-2015Jul-2015
Nov-2015Mar-2016
Amudat Moroto Nakapiripirit
Napak Abim Kaabong
Kotido Total
Total R
eceiving V
itamin A
TimeGraphs by District name
# Children Receiving 2nd Vitamin A Doseby District, DHIS2 Data, March 2015-April 2016
Napak has a record of 99 deaths in the April reporting period, and Nakapiripirit did not report deaths from July 2013 to January
2015

U N I C E F E R K P E n d o f P r o j e c t E v a l u a t i o n P o l i c y B r i e f D e c e m b e r 2 0 1 6
37 | P a g e o f 6 4
CONTROL OF VITAMIN ACONTROL OF VITAMIN ACONTROL OF VITAMIN ACONTROL OF VITAMIN A 47.1% 47.9%
CONTROL OF CONTROL OF CONTROL OF CONTROL OF ANAEMIAANAEMIAANAEMIAANAEMIA 14.7% 21.0%
HYGIENE AND SANITATIHYGIENE AND SANITATIHYGIENE AND SANITATIHYGIENE AND SANITATIONONONON 97.1% 89.1%
DEWORMINGDEWORMINGDEWORMINGDEWORMING 23.5% 29.4%
IMMUNISATIONIMMUNISATIONIMMUNISATIONIMMUNISATION 52.9% 47.1%
GROWTH GROWTH GROWTH GROWTH MONITORING AND PROMOMONITORING AND PROMOMONITORING AND PROMOMONITORING AND PROMOTIONTIONTIONTION 41.2% 28.6%
MATERNAL NUTRITIONMATERNAL NUTRITIONMATERNAL NUTRITIONMATERNAL NUTRITION 50.0% 23.5%
OTHER OTHER OTHER OTHER 11.8% 1.7%
We also found that caregivers in Abim had significantly higher odds of being given messages about growth
monitoring compared to those in Kaabong (Appendix VI). Under one-quarter of community implementers
(14.7%) and 21.0% of caregivers reported messaging on control of anaemia.
Concerning the reach of programme messages, the percentage of caregivers that reported they received
messages on exclusive breastfeeding (OR=3.15; p<0.05) was positively associated with meeting the target
for death rates, while control of Vitamin A (OR=.43; p<0.05) was negatively associated with meeting the
target. In most months, over 70% of facilities met the targets, with 88% meeting the target in January and
April of 2013. At its lowest, this figure fell to 25.6 in September 2016, which was quite anomalous.
Caseload and treatment coverage
Was the ERKP nutrition programme response to IMAM Was the ERKP nutrition programme response to IMAM Was the ERKP nutrition programme response to IMAM Was the ERKP nutrition programme response to IMAM ccccaseload aseload aseload aseload sufficient to meet the need?sufficient to meet the need?sufficient to meet the need?sufficient to meet the need?
Between 2013 and June 2016, the average annual admissions were 11,947. In 2014, UNICEF reported that
the programme had reached 13,090 severely malnourished children of an estimated 20,186 annual
caseloads, representing 65% of the total SAM caseload. According to the 2015 LQAS, the overall coverage
for the OTC programme in Karamoja was 49%, (95% CI 47–52%). The Supplementary Feeding Programme
(SFP) coverage was also 49% (95% CI 48%-51%). The point coverage was estimated at 34% (95% CI= 24.4–
43.9%). As of October 2015, 66,876 children and lactating women had received treatment for malnutrition.
There was a limited snapshot of the situation in 2016, as SAM appeared to be increased widely over the
course of 2016, with a peak in July in the Kotido, Napak and Nakapiripirit districts.
Figure 13 shows SAM caseload and new admissions from 2009 to 2016. In the June FSNA report of 2013,
the number of new SAM admissions reported was 13,988, and the estimated caseload was 20,186 (69%).
In 2014, the number of new SAM admissions was down to 13,090, very close to the estimated caseload of
13,275. In 2015, new SAM cases dropped to 10,301, but the anticipated caseload was at 17,542. (Of note,
in 2015 there was a severe drought in Karamoja, hence an increased anticipated caseload.) In 2016, the
estimated caseload and the number of new SAM admissions were very close, with the estimated caseload
at only 8.5% above the actual number of new SAM admissions, demonstrating UNICEF ERKP improvements
in estimating needed coverage.

U N I C E F E R K P E n d o f P r o j e c t E v a l u a t i o n P o l i c y B r i e f D e c e m b e r 2 0 1 6
38 | P a g e o f 6 4
Figure 13. Chart of SAM annual caseload vs admissions in Karamoja 2011–2016
The end-of-project report in 2016 noted that 9,692 children were enrolled in therapeutic feeding
programmes, representing 60% of the anticipated caseload. By June 2016, the coverage had reached 86%
of the total SAM burden with 10,411 SAM admissions and a caseload of 12,059. This was well above the
50% Sphere7 standard for coverage of OTC programmes in rural settings and the recommended 70% for
combined ITC-OTC programmes.
Performance indicators and Sphere targets
What are the IMM What are the IMM What are the IMM What are the IMM programme programme programme programme performance indicators over time (cure, default and death rateperformance indicators over time (cure, default and death rateperformance indicators over time (cure, default and death rateperformance indicators over time (cure, default and death ratessss, non, non, non, non----
responders, relapses, average length of stay)responders, relapses, average length of stay)responders, relapses, average length of stay)responders, relapses, average length of stay), and, and, and, and are they consistent with are they consistent with are they consistent with are they consistent with SphereSphereSphereSphere standards?standards?standards?standards?
Key programme performance indicators (cure, death and default rates) were not within the minimum
acceptable Sphere standards. Programme performance measures for IYCF included the number of OTC/ITC
units, number of SAM children enrolled, anticipated caseload and cure, default and death rates. UNICEF
performance indicators show that cure and death rates demonstrate an improvement over time. The
default rate continued to be a key challenge that cut across all districts. Data from the FSNA were used to
confirm these rates and to assess programme performance as seen in Figure 14. Overall, 13 facilities met
or exceeded the targets for cure rate, death rate and default rate for at least 20 months during the
evaluation period. Figure 14 shows trends over the four years in cure, death and default rates (see Appendix
I, for district breakdown).
An analysis of FSNA raw data presented a full picture of performance measures (Appendix I, Table 13).
Figure 14 shows that across all facilities, the cure rate was below the Sphere target of greater than 75% for
most of the period from January 2013 to September 2016. Only in August 2013 and January 2015 did the
cure rate meet the target, at 80% and 75.2%, respectively. However, in many months, the cure rate was
not far below the target; in January, August and September of 2014, August 2015, and May, June, July, and
7 The Sphere Handbook is a widely-recognised set of common principles and universal minimum standards for the delivery of quality
humanitarian response.
13,003
16,780
20,843 20,186
13,275 17,542
12,059
8,338 9,497
11,547 13,988 13,090
10,301 10,411
1,000
6,000
11,000
16,000
21,000
26,000
2009 2010 2011 2012 2013 2014 2015
Chart showing the SAM case load vs admissions in Karamoja
since 2009 - 2016 based on May-June FSNA rounds
Estimated SAM caseload
New SAM admissions

U N I C E F E R K P E n d o f P r o j e c t E v a l u a t i o n P o l i c y B r i e f D e c e m b e r 2 0 1 6
39 | P a g e o f 6 4
September of 2016, the cure rate exceeded 70%. Our inferential models showed a positive association
between the cure rate percentage of facility staff reporting that their facility offered referrals to livelihood
programmes (b=13.1; p<0.05). Additionally, we found a positive association between the cure rate and
reported RUTF consumed at the facility (b=0.0016; p<0.05). This association held when we controlled for
health facility level and district, and it highlights the potential importance of RUTF in improving cure rates.
However, there was a negative association between the percentage of caregivers reporting messaging on
maternal nutrition and facility cure rate (b=-17.3; p<0.01). This outcome could reflect the inability of facility
staff to manage increased caseloads.
Cure rates
Although the mean cure rate was below the target for most of the 2013–2016 period assessed, in most
months, around 50% of facilities in fact met the target; the lowest percentage meeting the target across
the period was 40.3% in November 2014, while the highest was 87.2% in September 2016, which may be
an indicator of improvement. Mean cure rates tended to be skewed by poor performance among a few
facilities in any given month, but few facilities were consistently poor performers. In other words, while
mean cure rates may have been lowered by low cure rates in some specific facilities in any given month,
facility-specific performance tended to have peaks and troughs rather than being consistently poor.
Moreover, 28 facilities met the cure rate target for more than 20 months during this period (Appendix I).
Our inferential models showed a positive association between whether a facility met the target cure rate
and the percentage reporting that the facility provided micronutrient supplementation (OR=2.09; p<0.05)
and the percentage reporting referrals to livelihood programmes (OR=2.47; p<0.05). While a higher
percentage of caregivers reporting messaging on breastfeeding to six months was associated with lower
odds of meeting cure rate targets (OR=0.40; b<0.05), there was a strong and positive association with
messaging on feeding of a sick child (OR=2.22; p<0.05) (see Appendix I, Cure rates by district).
015
30
45
60
75
Rate
Jan-2013Jan-2014
Jan-2015Jan-2016
Time
Cure rate Death rate
Default rate
Mean Cure, Death, and Default RateOTC/ITC Data, Jan 2013-September 2016
Figure 14. Mean cure, death and default rates January 2013-September 2016

U N I C E F E R K P E n d o f P r o j e c t E v a l u a t i o n P o l i c y B r i e f D e c e m b e r 2 0 1 6
40 | P a g e o f 6 4
Death rates
The mean death rate for each month from January 2013 to September 2016 was also provided in Error! Error! Error! Error!
Reference source not found.Reference source not found.Reference source not found.Reference source not found., Table 13. The death rate was consistently well below the Sphere target of
10%, with the highest mean rate in any month being 6.9% in August 2016. Given rates in preceding months,
however, this appears to be an anomalous spike. As discussed above, reported training in assessments,
IYCF, referrals and integrated management of childhood illnesses were all negatively associated with the
death rate. Additional inferential models show that the percentage reporting that the facility offers
ReSoMal (b=2.72; p<0.001) and RUTF (b=2.75; p<0.05) was positively associated with the death rate. While
this seems counterintuitive, it may reflect a selection effect where higher death rates reflect a greater
number of severe cases requiring these resources (and this may also shape the distribution of resources to
facilities).
Training may have an impact on death rates. A regression analysis of IMAM training and death rates showed
a significant, negative relationship. Specifically, there was a negative association between the death rate
and the percentage of respondents at facilities reporting they had received training in assessment (b=-3.10;
p<0.01), IYCF (b=-2.69; p<0.001), referrals (b=-1.79; p<0.05) and integrated management of childhood
illnesses (b=-1.55; p<0.05). The coefficients for referrals and IMAM were no longer significant once district
was included as a control variable in the models, suggesting that some of the association between training
and the death rate was due to district-level variation in these variables (Appendix VI, Table 12).
The association of death rate with training in assessment and IYCF remained strong and significant in these
multivariate models (b=4.98; p<0.05), an association which held after a control for district was introduced.
Thus, assessment and IYCF training may be particularly fruitful areas for future training investment.
Default rate A summary of targets and achievements are available in Table 8.
Figure 3 provides the default rate. In five months (March and August 2013, January and August 2015 and
June 2016), the overall mean default rate met the Sphere target of <15% defaults. However, in several
months, the mean rate was very close to the target—for example, the rate was 15.1% in September 2015
and 15.4% in June 2015. In most months, around 45% of facilities met the default rate target, with a peak
of 68% meeting the target in January and March 2013 and a low of 10.3% meeting it in September 2016.
Yet 20 facilities also met the target for at least 20 months across the period. Interestingly, none of the
training, service or messaging variables was a significant predictor of the default rate. However, there was
a negative association between the default rate and RUTF consumption (b=-0.002; p<0.01), perhaps
reflecting the importance of receiving nutritional resources for patient retention. RUTF consumption
(OR=1.00; p<0.001) was positively associated with meeting the default rate target, while maternal nutrition
messaging was negatively associated with meeting the default rate target (OR=0.51; p<0.05).
Importantly, negative associations between activities/messaging and cure and default rates (e.g. with
maternal nutrition messaging) may reflect the need to scale-up rather than scale-back activities/actions.
That is, additional training of health workers in counselling may be required to improve the effect. It is also
worth noting that training, activity and messaging data came from our primary data collection. As
previously noted, our sample showed some evidence of mild selection effects, including a higher cure rate
among facilities in our sample. In addition, notably, more than half (58%) of monthly data were missing on
RUTF supplies between facilities, which may also lead to concerns that significant RUTF results were driven
by sample selection. However, a flag variable was created to identify missing cases; this missing RUTF flag

U N I C E F E R K P E n d o f P r o j e c t E v a l u a t i o n P o l i c y B r i e f D e c e m b e r 2 0 1 6
41 | P a g e o f 6 4
was not a significant predictor of the death or default rates (nor odds of meeting targets for these rates),
suggesting that selection was not a serious concern for the RUTF findings.
Non-response rate
IMAM performance measures for this evaluation included a look at performance indicators over time,
including non-responders, relapses and average length of stay. However, upon investigation, there were
too few data points for any measurement of success in relapses and average length of stay.
Figure 15. Mean non-response rate OTC/ITC data Jan 2013-Sept 2016
Regarding non-response rates, there was no clear pattern in non-response—it varied considerably over the
period, as can be seen in Figure 15. A decrease began after the first quarter of 2015 and continued to
September 2016, when it dropped considerably. Looking at average response rates across facilities, the
lowest value was 2.46% in June of 2013, while the highest value was 16.33% in November of 2013. The
overall mean across all facilities and observation points was 10.31%. Inferential models showed that there
was a significant and negative association between the nonnegative association between the nonnegative association between the nonnegative association between the non----response rate and the percentresponse rate and the percentresponse rate and the percentresponse rate and the percentageageageage of staff of staff of staff of staff
reporting training in treatment of mareporting training in treatment of mareporting training in treatment of mareporting training in treatment of malnourishmentlnourishmentlnourishmentlnourishment (b=-4.98; p<0.05). No other training factors were
significant predictors. Messaging reported by caregivers also appeared to be an important predictor of the
non-response rate. Specifically, there was a strong, negative relationship between the percentage reporting
comprehensive feeding messaging and the non-response rate (b=-8.96; p<0.001), as well as a negative
relationship with messaging about anaemia (b=-5.48; p<0.05). There was also an association with
immunisation (b=4.55; p<0.05), but it was a positive association—that is, a higher percentage of caregivers
reporting immunisation messaging was associated with a higher non-response rate. Additionally, unlike
some of the other rates examined here, the non-response rate also varied significantly by facility type.
Specifically, hospitals had a much lower non-response rate (b=-8.80; p<0.001) than did HC 3 facilities.
05
10
15
20
Rate
Jan-2013Jan-2014
Jan-2015Jan-2016
Time
Mean Non-response RateOTC/ITC Data, Jan 2013-September 2016

U N I C E F E R K P E n d o f P r o j e c t E v a l u a t i o n P o l i c y B r i e f D e c e m b e r 2 0 1 6
42 | P a g e o f 6 4
3.6.2 Improving coordination and partner interaction Did the Did the Did the Did the ERKPERKPERKPERKP programme add valueprogramme add valueprogramme add valueprogramme add value to andto andto andto and complement and complement and complement and complement and harmonise harmonise harmonise harmonise with plans with plans with plans with plans and actions of other and actions of other and actions of other and actions of other
agencies and donors working on intersectoral initiatives within Karamoja?agencies and donors working on intersectoral initiatives within Karamoja?agencies and donors working on intersectoral initiatives within Karamoja?agencies and donors working on intersectoral initiatives within Karamoja? Is there evidence of good Is there evidence of good Is there evidence of good Is there evidence of good
coordination practice?coordination practice?coordination practice?coordination practice?
UNICEF coordination and partner interactions enabled efficient synergies among core components of the
ERKP Nutrition Programme. Coordination and collaboration key components included participation in
sectoral coordination mechanisms to share responsibility. UNICEF and OPM organized working groups to
share assessment and programme information, and updated groups regularly. UNICEF coordinated with
other humanitarian agencies to strengthen advocacy and established clear policies regarding engagement.
UNICEF coordination and flow is diagrammed in Figure 16.
Figure 16. Coordination between programme implementation levels
Interviews with OPM, WFP, WHO and UNICEF confirmed that national strategic planning meetings took
place monthly and involved numerous players. Linkages between the various direct stakeholders were
charts in Figure 17. Figure 18 maps the 20 iNGOs in sub-counties of the Karamoja region. UNICEF’s IP was
CUAMM, and WFP’s was the MoH. Interviews with other UN agencies, IPs and DHOs demonstrated a clear
understanding of each organisation’s responsibilities. WFP and UNICEF coordinated the FSNA biannually.
Both agencies worked with WHO to develop counselling cards for IYCF counselling, training for inpatient
IMAM and UNICEF working largely in OPT with WFP providing support to pregnant and lactating women.
WHO provides technical assistance for updating and developing the guidelines, e.g. IYCF and IMAM 2013.8
FAO plans and activities with UNICEF were largely under development and not evident at the district level,
although iNGOs indicated that they had been trained in IYCF and were referring patients to OTC sites
(Appendix III, Mapping Exercise).
‘The multi-sectoral approach has stopped at the coordination meetings. There is nothing
serious on the ground; there is no evidence of work done’. [Moroto, Regional NGO]
Partners were few and widely disbursed in Moroto & Nakapiripirit, yet these districts had the
highest levels of SAM. They were under supported sub-counties North - Kacheri, Kotido,
Panyangara and Nyakwae, Abim, South –Rupa, Moroto, Lokopo, Iriiri. Mercy Corps and World
Vision had greater presence, whilst Caritas had the least. Sub-Counties of Kaabong and Napak
had the highest concurrence of IPs offering nutrition programs.
National Nutrition Initiatives &
policies
District , DHO, DN, DLO & other
Implementing Partners
Facility Staff & Community
Service Providers
VHT Community & Caregivers

U N I C E F E R K P E n d o f P r o j e c t E v a l u a t i o n P o l i c y B r i e f D e c e m b e r 2 0 1 6
43 | P a g e o f 6 4
Figure 17. UNICEF ERKP partner linkages between various stakeholders
(double-click for full view in Excel)
Stakeholders
charted-Final.xlsx
Partnership effectiveness
To what extent has the ERKP leveraged partnerships/linkages with other To what extent has the ERKP leveraged partnerships/linkages with other To what extent has the ERKP leveraged partnerships/linkages with other To what extent has the ERKP leveraged partnerships/linkages with other programmesprogrammesprogrammesprogrammes supported in the region supported in the region supported in the region supported in the region
(e.g. the USAID (e.g. the USAID (e.g. the USAID (e.g. the USAID FFFFeed eed eed eed the the the the FFFFutureutureutureuture, FAO and WFP)?, FAO and WFP)?, FAO and WFP)?, FAO and WFP)?
Overall, UNICEF did well at leveraging the partnerships. Communication and coordination were strong and
programmes well-coordinated between the WHO, WFP and UNICEF. WFP team members were aware of
most UNICEF activities, and they indicated their involvement on various levels, e.g. FSNA, IYCF training and
referral practices. Consultants did not find strong communication or coordination between UNICEF
nutrition efforts and those of FAO. ERKP partners UNICEF, WFP and WHO were not able to clearly articulate
the process of referrals between livelihood development and nutrition programmes, and there was only
some mention of referrals to livelihood evidenced from interviews with facilities. In addition, although WFP
MOH FAO WFP UNICEF WHO OPMIrish Aid,
EU
Tools for IYCF
counselingAFC MAM DHOs IMAM
CAFh CBSFP VHTsOTC/ITC
TreatmentCUAMM
SFP HC StaffSalary of M&E
officer
Contingency
Planning
ERKP Karamoja
Results (Haley Report) year 2000 =GAM at 20% & 2015 15% = 5% reduction
BCC & IYCF Training
IMAM Guidelines updates
UNICEF ERKP Nutrition
National Nutrition Players
Knowledge
Sharing
DHO
VHT
Facilities
Data Collection
Mapping
Nutrition Specific Interventions
REACH
UNAP
HMIS monitoring
DHT, NFP, Biostatistician
training in indicators
Increasing access
to high impact
nutrition
interventions
Co
nti
ng
en
cy
Pla
nn
ing
Nu
trit
ion
Se
nsi
tive
IMAM Training
FSNA support
Uganda Nutrition Policy
Monthly ERKP meeings
National indicators/DHIS II

U N I C E F E R K P E n d o f P r o j e c t E v a l u a t i o n P o l i c y B r i e f D e c e m b e r 2 0 1 6
44 | P a g e o f 6 4
did indicate that they worked with FAO on mapping, one interviewee said, ‘There are some GIS activities,
but no real work together’ [National KII]. Only 25% of facilities said they referred to livelihood programmes.
None of the CHWs and VHTs mentioned referral to livelihood programmes during caregiver counselling.
There is a need for harmonization especially on the side of donors. If the biggest problem is
food, look for the root cause; harmonize intervention before they come into the region.
[Regional Multi-sector NGO]
The measure of coordination improvements was a count of district teams trained in contingency planning,
preparedness and response for nutrition in the seven districts. This was not achieved, according to progress
reports and the log frame. A contract was put in place with IIRR to commence in 2015, and activities were
underway during the evaluation. However, the District Disaster Management Committees (DDMC), Sub-
County Disaster Management Committees and District Nutrition Coordination Committee (DNCC)
structures were being revived through numerous capacity-building sessions, according to regional
implementers. The IIRR facilitated the District Disaster Management Committee in reviewing existing
contingency plans and developing and integrating the nutrition components within the various districts’
contingency plans (seven districts of the Karamoja sub-region). However, at the district level, interviews
did not support this finding. Several districts indicated that sub-county committees either had not formed
or were in the beginning stages of forming. According to the May 2016 UNICEF report, district-level
meetings had taken place with nutrition partners in Nakapiripirit, Kaabong, Napak, Amudat and Moroto.
Those that sub-county teams were functional and indicated that they played a key role in supervisions.
The sub-county team always helps us in role plays and do supervisions too [HC VI,
Nakapiripirit]
Sub-county meetings in Abim and Kotido were planned to begin in 2016. Facility staff felt that the sub-
county-level committees were either poorly (10.2%) or not at all functional (45.4%), with only 23%
indicating that these committees were highly functional.
Stakeholder contributions
How did the programme stakeholders contribute to the programme outcomes when the programme was How did the programme stakeholders contribute to the programme outcomes when the programme was How did the programme stakeholders contribute to the programme outcomes when the programme was How did the programme stakeholders contribute to the programme outcomes when the programme was
being implemented? being implemented? being implemented? being implemented?
Programme stakeholders were numerous, including UNICEF and various sister agencies and iNGOs in
Karamoja. FAO worked with ERKP to design interventions for improved agricultural practices. WFP WHO
and WFP worked closely with UNICEF on various activities, including policy and strategic planning and
programme development, distribution of guidelines, and the implementation of research to understand
malnutrition in Uganda. WFP supported IYCF training in communities and shared responsibility with UNICEF
for the FSNA. More to the point, various stakeholders contributed to referrals of children with SAM,
including VHTs and iNGOs. The mapping exercise showed that at least 20 district partners understood the
nature of the programme and were actively contributing by screening with MUAC and referring children.
WFP, CUAMM and the MoH were responsible for the training of VHTs and community health workers
(CHEWs) to increase IYCF access for caregivers and referring children for treatment. They provided a
valuable link for the programme to reach into communities. DHTs, nutrition focal persons and DHOs
engaged OTC and ITC staff in IMAM training. They also provided surveillance and job support to improve
performance and reporting.
Facility and community linkages
How are facility and community IYCF components How are facility and community IYCF components How are facility and community IYCF components How are facility and community IYCF components linkedlinkedlinkedlinked? What are the synergies between SFP, ? What are the synergies between SFP, ? What are the synergies between SFP, ? What are the synergies between SFP, OTCOTCOTCOTC and ITC?and ITC?and ITC?and ITC?

U N I C E F E R K P E n d o f P r o j e c t E v a l u a t i o n P o l i c y B r i e f D e c e m b e r 2 0 1 6
45 | P a g e o f 6 4
The connection between facility and community appears to be well established, according to the interviews
and surveys that were conducted. Facility and community component linkages were evidenced by regular
meetings, confirmed by responses to questions about engagement between facility and community.
CUAMM brought health staff and VHTs together regularly for knowledge sharing related to nutrition
meetings. This was confirmed by VHTs and facility staff. Among interviewed CSPs (n=34) and health facilities
staff (n=108), the majority (76.5% and 78.7%, respectively) felt the UNICEF nutrition programme
components were well linked to community activities (Appendix I). VHTs were highly regarded by facility
staff and felt a ‘synergy’ as they served to increase screening and referrals for malnutrition assessment at
facilities. Moreover, nearly all OTC/ITCs (97.2%), CSPs (97.1%) and caregivers (96.6%) felt that facility and
community nutrition activities were well linked. In addition, all iNGO organisations in the mapping exercise
reported that they were carrying out malnutrition screening in collaboration with mother support groups,
which led mothers and VHTs and CHEWs in communities. For example, district nutrition staff works with
the Confédération Africaine de Football (CAF) on community supplementary feeding for moderately and
severely malnourished children, creating synergies between health facilities and schools.
‘We ensure that the beneficiaries don’t suffer reoccurrence or get lost to follow-up by use of
VHTs and peer mothers’ follow-ups’ [Regional iNGO].
Linkages between VHTs and communities were strong. In one district, when asked about linkages of VHTs
to the community for screening and referral to the health facilities, they said, ‘We were supported by WFP
and trained by the DCDO’. Others indicated health workers and VHTs and other IPs had ‘taken them through
a series of training sessions’. In Abim, district interviewees indicated they worked ‘hand in hand’ with
CUAMM, which mainly involved distributing Plumpy’nut at the health facilities. They also mentioned
working with WFP, which distributed food to pregnant woman and all children under five years in selected
health facilities (HCIIIs and hospitals). Baylor handled capacity building for both health workers and VHTs
and helped in the transportation of food supplies to hard-to-reach areas.
‘Communities turn up during outreach; VHTs are good sources for providing coordination
with the communities’ [Facility staff, Kaabong].
3.6.3 Increasing knowledge and understanding To what extent were targets and planned results met for increasing knowledge and understanding? To what extent were targets and planned results met for increasing knowledge and understanding? To what extent were targets and planned results met for increasing knowledge and understanding? To what extent were targets and planned results met for increasing knowledge and understanding?
Largely, UNICEF uses established meeting venues to present results at regular nutrition working group
meetings. Other topics of discussion include shared knowledge and lessons learnt, as provided in annual
work plans and shared among partners. Meetings and performance evaluations were shared and discussed
during national meetings. This was evidenced by confirming reports from national and regional IPs and
iNGOs. The goal of four quarterly district nutrition meetings with minutes and action points was not met.
Although the national nutrition working group meetings were held regularly, interviewees indicated that
the national-level meetings were not attended consistently. National-level interviewees also suggested that
the role of the Government was unclear and not timely in the rollout of new initiatives. For example,
interviewees indicated delays at the government level in rolling out both the new IMAM guidelines and the
National Nutrition policy.
DNCC meetings were held quarterly in accordance with programme recommendations. However, the need
for more improved coordination in other areas was unanimous among interviewees. Facility-level
respondents confirmed that there were monthly meetings occurring at the district level. In addition,

U N I C E F E R K P E n d o f P r o j e c t E v a l u a t i o n P o l i c y B r i e f D e c e m b e r 2 0 1 6
46 | P a g e o f 6 4
although some districts did not hold them monthly, they indicated that meetings occurred ‘periodically’.
When FSNA reports were released, they were followed up by regular meetings. Some district and national
interviewees felt that the release of the results was not timely. Most district nutritionists felt that
knowledge sharing has been well done and that training and counselling have raised awareness.
The UNICEF ERKP programme was set up to promote evidence-based changes and learning. Findings from
studies were used to improve the quality of nutrition services. For example, UNICEF conducted an
assessment of health staff, and findings from the assessment indicated that nutrition treatment was not
consistent. Thus, refresher training and supporting supervisions at functional OTCs and IPFs were
conducted to improve the quality of programme services and reporting.
Furthermore, improvements in the analysis and consultation/engagement process have been observed. As
outlined previously, national-level ERKP partners, DFID, FAO, WFP and UNICEF meet quarterly to discuss
nutrition interventions, provide updates and strategize. FSNAs were shared and findings discussed during
meetings; the consultant found during KIIs that meetings also occurred at the district level, at which
nutrition data were shared and discussed. Findings were also disseminated to sector groups for review and
action.
FSNA data and influencing
What is the evidence of FSNA’s influencing What is the evidence of FSNA’s influencing What is the evidence of FSNA’s influencing What is the evidence of FSNA’s influencing programme programme programme programme decision making?decision making?decision making?decision making?
UNICEF conducted meetings and disseminated FSNA results, which were followed with dissemination and
development of working groups to discuss findings and determine future action. The audience for the FSNA
included all DHOs, health practitioners, UN agencies and all local and international partners. FSNA results
were shared widely electronically, at national, regional and district levels. In Karamoja, the reports were
regularly discussed at monthly and quarterly sectoral health, nutrition and water and sanitation meetings
as well as with technical working groups at the national level (Appendix III, October 2016 mapping exercise).
Although some at the district level felt they were not released quickly enough to address the issues, they
have been instrumental as a key source of information for all key stakeholders in the region. The FSNA
contributed to numerous reports, such as Strengthening Support to Nutrition in Karamoja, Uganda (2016).
They have provided guidance for the development of strategies and plans for improving resilience in
Karamoja. The important influence of FSNAs on programme decision making was specifically mentioned at
the DHO level that the UNICEF, June 2013- 2014 assessment ‘guided the district to revise other means of
ensuring that the food security is catered for in most home steads.’
3.6.4 Contingency planning The 2014 Resilience Context Analysis (RCA) conducted in Karamoja showed that the main shocks were due
to climate-related issues, such as erratic and uneven rainfall, resulting in dry spells and flooding, leading to
high food prices and food insecurity. FAO supported the establishment of agro-pastoral field schools, which
IPs engaged to conduct Participatory Disaster Risk Assessments (PDRAs) to inform remedial planning and
response for disaster preparedness. FAO and WFP jointly piloted activities on watershed management as
part of a broader roadmap to mainstream disaster risk management in contingency planning. The targeted
watershed catchments were in Kakamongole (Nakapiripirit), Rupa (Moroto), Panyangara (Kotido), Kathile

U N I C E F E R K P E n d o f P r o j e c t E v a l u a t i o n P o l i c y B r i e f D e c e m b e r 2 0 1 6
47 | P a g e o f 6 4
(Kaabong) and Awach (Abim).9 The effort was jointly undertaken with FAO coordinated by the Office of the
Prime Minister (OPM) Disaster Risk Reduction (DRR) department.
Reports indicated that DFID and UNICEF were supporting the Department of Disaster Preparedness and
Management in the OPM to establish a Disaster Risk Monitoring System (DRMS). UNICEF contributed to
contingency planning with the SUN Secretariat. Meetings were organised at the district level during the
evaluation.
The connection between UNICEF and FAO was not clearly articulated. UNICEF engaged the International
Institute of Rural Reconstruction (IIRR) to review district emergency preparedness and response plans and
conduct district trainings. They were to review the plans with a view to integrating nutrition into
contingency planning. Although UNICEF did not report any district-level contingency planning meetings
were complete during the implementation period, interviews with DHOs, DNs, and iNGOs suggested there
were ongoing contingency planning efforts. Consultants found that contingency meetings occurred at each
of the levels: national, district, facility and community. The DHO in Moroto indicated that some activities
‘have included instituting field visits to the worst hit areas by multi-sectoral teams, so as to forge the way
forward.’ According to the DHO Nakapiripirit, contingency planning ‘helped the district to give priorities to
the worst hit sub-counties.’ All IPs in the mapping exercise reported to have contingency planning activities
operationalised through joint strategic meetings being organised by the DHOs. Contrarily, the in Kaabong
the DHO said that FAO was not well represented ‘on the ground’. Planning on paper and at the district level,
plans and targets are set, but not implemented. In fact, most of the organisations interviewed believed that
contingency planning and emergency preparedness remained inadequate due to funding constraints.
Some district stakeholders recognized that the District Disaster Management Committees (DDMC), Sub-
County Disaster Management Committees and the DNCC structures were ‘being revived’ through
numerous capacity-building sessions at the district level. IIRR, funded by UNICEF, has trained 156
community-based volunteers in risk monitoring in the 52 sub-counties of Karamoja. Also under
development and due the end of 2016, is an SMS tracking system that would allow real-time reporting
during emergency situations was. The system was said to offer real-time information for coordination and
action. The SMS alert log was designed to provide up-to-the-minute messages to improve coordination of
an information upstream and downstream emergency humanitarian response. It was designed to empower
communities to assess and report conditions. Other strategies for contingency planning involved building
capacity at HCs to handle emergency malnutrition cases, establishing contingency offices on standby and
introducing models for addressing emergency nutrition situations.
9 Resilience and Food Security in Karamoja, 2015, UNICEF, FAO, WFP, UNDP

U N I C E F E R K P E n d o f P r o j e c t E v a l u a t i o n P o l i c y B r i e f D e c e m b e r 2 0 1 6
48 | P a g e o f 6 4
Figure 18, Map of nutrition programs interviewed in the districts of Karamoja by sub-region

U N I C E F E R K P E n d o f P r o j e c t E v a l u a t i o n P o l i c y B r i e f D e c e m b e r 2 0 1 6
49 | P a g e o f 6 4
3.6.5 Technical assistance TeTeTeTechnicalchnicalchnicalchnical assistance (for system strengthening through CUAMM) to the district local governments, assistance (for system strengthening through CUAMM) to the district local governments, assistance (for system strengthening through CUAMM) to the district local governments, assistance (for system strengthening through CUAMM) to the district local governments,
particularly DHOsparticularly DHOsparticularly DHOsparticularly DHOs————hhhhas this been effective? Are there improvements in the processes (i.e. as this been effective? Are there improvements in the processes (i.e. as this been effective? Are there improvements in the processes (i.e. as this been effective? Are there improvements in the processes (i.e. recordkeepingrecordkeepingrecordkeepingrecordkeeping, , , ,
planning, data and supply management, planning, data and supply management, planning, data and supply management, planning, data and supply management, referral and reporting?referral and reporting?referral and reporting?referral and reporting?
Technical assistance from CUAMM has been effective which was demonstrated by improvements in
numerous areas, including several previously mentioned related to improved outcomes and performance
indicators. CUAMM placed a technical advisor at each of the district health offices in the seven districts to
support the DHTs in providing supervision and mentorship for staff at OTCs. They also advocated with
government for new nutrition positions in the districts, which were in place at the time of the evaluation.
During the programme period, CUAMM trained staff and VHTs and rolled out IYCF promotion and facility-
based IMAM programmes. CUAMM supported FHDs and surveillance in each district and monitored and
supervised nutrition activities.
Interviews with six of the seven DHOs confirmed their involvement in nutrition sensitive and specific
nutrition activities in their districts. Including the implementation of nutrition interventions, training,
coordination and partnership activities, securing information e.g. FSNA. All interviewed DHOs said they
were involved in contingency planning and emergency response for nutrition. Some also were involved in
screening at homesteads and conducting other community programs like sanitation and hygiene.
Comprehensive responses were given to questions about strategies used to increase access to high impact
nutrition interventions for mothers and children. The DHOs were engaged and familiar with activities in
their district.
CUAMM supported quarterly referral meetings, where the VHTs were brought together with other health
workers to review the activities and trends in their areas. During the October 2015 reporting period, UNICEF
met targets for the refresher training of VHTs in Karamoja on the ICCM module. VHTs received refresher
training four times between November 2013 and June 2015. VHT monthly health meetings held at the sub-
county level in the last quarter targeted 90% of the planned monthly health unit meetings. In addition, per
regular quarterly reports, UNICEF had reached and exceeded the 1000 targeted VHTs with training.
Section 3.7 provides detail about reporting around supply management and stockouts. In short, of the sites
offering treatment, those reporting no stockouts had reached 90% and the gap between anticipated
caseload and admissions had dropped considerably by 2016 (Figure 13 in section 3.6.1), exceeding the
programme target. Despite these achievements, supply management and reporting was still identified as
an area needing improvement in numerous reports. Table 4, Reported OTC/ITCs jointly supervised
An assessment of supply management showed that supply chain
management and reporting were in need of improvement. At
the start of the implementation period, UNICEF aimed to
conduct 67 target support quarterly supervisions in the seven
districts of Karamoja to improve elements of this programme
area, including supply management. Reports indicated they
completed about 40 supervisions, meeting 61% of this target in
2014 and 100% from January to June 2015. The 2016 progress report said there were 92 quarterly nutrition
supervision visits, which met 81.4% of the new target of 113.
No. of reported OTCs/ITCs jointly supervised
with DHT and nutrition focal persons
Nov 2013 to Mar 2014 102
Apr 2014 to Sept 2014 116
Jan 2015 to Mar 2015 65
April 2015 to June 2015 65

U N I C E F E R K P E n d o f P r o j e c t E v a l u a t i o n P o l i c y B r i e f D e c e m b e r 2 0 1 6
50 | P a g e o f 6 4
Successes included the establishment of district-level data collection for reporting and analysis, which led
to improvements in the quality reporting. The percentage of quality reports from 138 facilities went from
64% in 2013 to 87% of targets in 2016, with all OTC/ITC facilities reporting. Programme data on nutrition
interventions and contextual information were also collected. However, as has been noted in the
limitations section, there were tremendous gaps in data reported.
Training for VHTs and HC staff was conducted to ensure effective referrals to the Therapeutic Feeding
Programme (TFP) and from the TFP to the Community-Based Supplementary Feeding Programme (CB-SFP).
UNICEF ERKP original target was to have 500 VHT members engaged in screening and referral by March
2014. UNICEF exceeded this goal. They had 1,908 active VHTs by March 2014, By March 2015, CUAMM had
trained 2,400 VHTs, 600 shy of the March 2016 target of 3,000.
There was evidence for the need to increase referral and record keeping training. Facility- and community-
level workers differed in terms of whether they received training and which type of referral training they
received. About half (47%) of the CSPs declared they had received some training in referral and treatment
of malnutrition, while only 38% and 26% of them reported having been trained in recordkeeping and
integrated management of childhood illness, respectively. There was significant variation in training by
district, in that respondents in Abim had significantly higher odds of facility staff saying they had been
trained in referrals compared to those in Kaabong. Respondents in Nakapiripirit and Abim had significantly
higher odds of being trained in the integrated management of childhood illness compared to those in
Kaabong. In addition, respondents in Abim had significantly higher odds of being trained in the treatment
of malnourished children compared to those in Kaabong (Appendix I, Table 10).
3.7 Efficiency & VfM Overview of delivery costs across the programme and VOverview of delivery costs across the programme and VOverview of delivery costs across the programme and VOverview of delivery costs across the programme and VffffMMMM
In general, UNICEF ERKP made efficient use of programme resources. Although not all targets were met as
planned, efficiencies related to cost of RUTF and reduced operational costs were achieved, and targets for
supervisions were met. However, there were some issues related to supply receipt and utilisation at the
facility level, as well as challenges related to VHT training.
Efficiency indicates the accomplishment of or ability to accomplish a job with a minimum expenditure of
time and effort. VfM was a measure used to determine efficiency. VfM was defined as ‘the optimum
combination of whole-of-life costs and quality (or fitness for purpose) of the good or service to meet the
user’s requirement’ (HM
Treasury, in DFID 2013). In this
report, the VfM of the UNICEF
nutrition intervention in
Karamoja was assessed by
examining the economy (e.g.
cost inputs), efficiency (e.g.
productivity of inputs) and
effectiveness, e.g. qualitative and
quantitative measures of
increase/decrease in intended
Figure 19, Value for money framework,
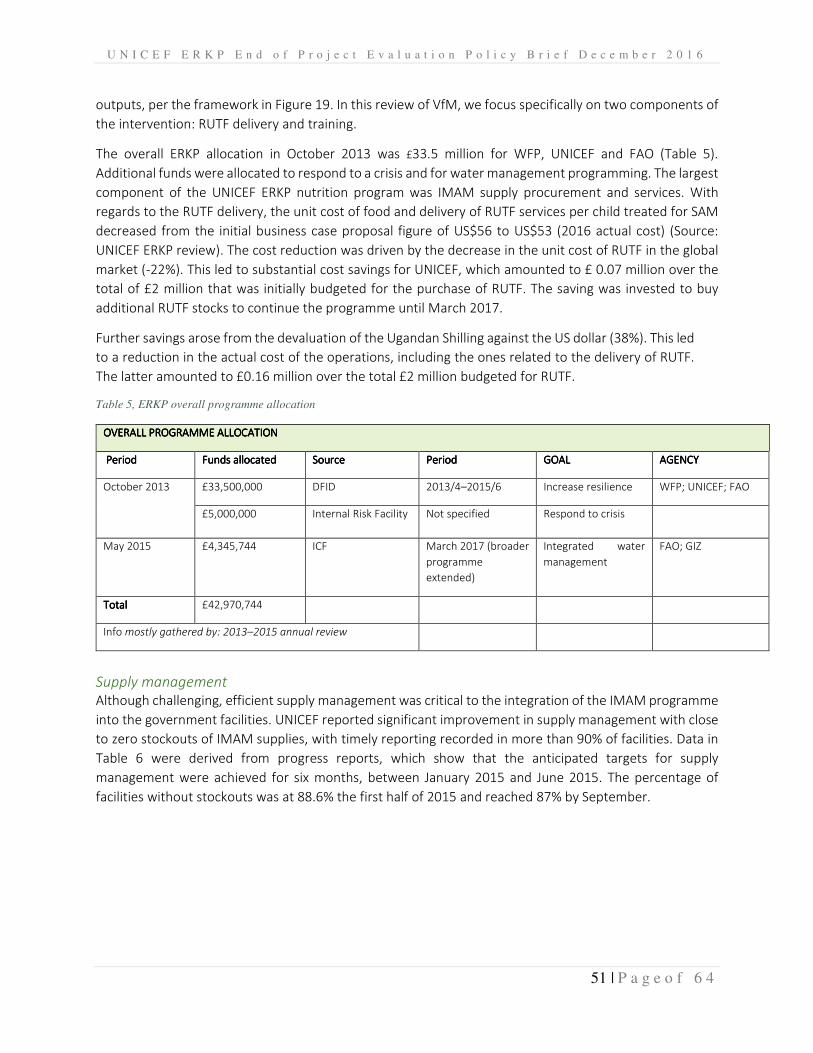
U N I C E F E R K P E n d o f P r o j e c t E v a l u a t i o n P o l i c y B r i e f D e c e m b e r 2 0 1 6
51 | P a g e o f 6 4
outputs, per the framework in Figure 19. In this review of VfM, we focus specifically on two components of
the intervention: RUTF delivery and training.
The overall ERKP allocation in October 2013 was £33.5 million for WFP, UNICEF and FAO (Table 5).
Additional funds were allocated to respond to a crisis and for water management programming. The largest
component of the UNICEF ERKP nutrition program was IMAM supply procurement and services. With
regards to the RUTF delivery, the unit cost of food and delivery of RUTF services per child treated for SAM
decreased from the initial business case proposal figure of US$56 to US$53 (2016 actual cost) (Source:
UNICEF ERKP review). The cost reduction was driven by the decrease in the unit cost of RUTF in the global
market (-22%). This led to substantial cost savings for UNICEF, which amounted to £ 0.07 million over the
total of £2 million that was initially budgeted for the purchase of RUTF. The saving was invested to buy
additional RUTF stocks to continue the programme until March 2017.
Further savings arose from the devaluation of the Ugandan Shilling against the US dollar (38%). This led
to a reduction in the actual cost of the operations, including the ones related to the delivery of RUTF.
The latter amounted to £0.16 million over the total £2 million budgeted for RUTF.
Table 5, ERKP overall programme allocation
OVERALL PROGRAMME ALLOCATIONOVERALL PROGRAMME ALLOCATIONOVERALL PROGRAMME ALLOCATIONOVERALL PROGRAMME ALLOCATION
PeriodPeriodPeriodPeriod Funds allocated Funds allocated Funds allocated Funds allocated SourceSourceSourceSource PeriodPeriodPeriodPeriod GOALGOALGOALGOAL AGENCYAGENCYAGENCYAGENCY
October 2013 £33,500,000 DFID 2013/4–2015/6 Increase resilience WFP; UNICEF; FAO
£5,000,000 Internal Risk Facility Not specified Respond to crisis
May 2015 £4,345,744 ICF March 2017 (broader
programme
extended)
Integrated water
management
FAO; GIZ
Total Total Total Total £42,970,744
Info mostly gathered by: 2013–2015 annual review
Supply management
Although challenging, efficient supply management was critical to the integration of the IMAM programme
into the government facilities. UNICEF reported significant improvement in supply management with close
to zero stockouts of IMAM supplies, with timely reporting recorded in more than 90% of facilities. Data in
Table 6 were derived from progress reports, which show that the anticipated targets for supply
management were achieved for six months, between January 2015 and June 2015. The percentage of
facilities without stockouts was at 88.6% the first half of 2015 and reached 87% by September.

U N I C E F E R K P E n d o f P r o j e c t E v a l u a t i o n P o l i c y B r i e f D e c e m b e r 2 0 1 6
52 | P a g e o f 6 4
Table 6, Regional indicators for supply management (From third to fifth report)
Yet still, 50% of individuals interviewed at facilities said that they were challenged by stockouts and lack of
storage space. Each type of facility indicated the challenges they had faced. Not surprisingly, HC III had the
highest number of supply- and transport-related issues. It had continued problems with transporting
supplies from the district to the facility. IPs were also to have provided transportation, which was confirmed
with IPs. Nonetheless, transportation remains a problem.
Keeping supplies in stock is challenging. Of 118 facility-based respondents, almost half of the staff indicated
that supply delivery issues and stockouts were the main issues. Figure 20 shows responses from 112 facility
staff when asked an open-ended question about challenges with RUTF supply. Of those reporting, 48% said
they had challenges obtaining RUTF supplies. Storage was the next most frequently cited difficulty. Storage
was the second most frequent complaint; many had small storage facilities, problems with rodent
infestation and short expiration dates on supplies. Only 15% of respondents indicated they had problems
with beneficiaries selling RUTF. As the sample was representative and not randomly selected, little
generalisation can be made about these issues. However, small storage space and the inability to store
more than a week or two of supply are challenging to health facilities. Rodent infestation was also a large
element of storage-related issues and supply loss.
Misuse of supplies was the least mentioned challenge, although caregiver misuse was mentioned. About
20% of caregivers admitted that family members consumed RUTF due to hunger and food insecurity in the
household. Sharing RUTF with other family members was mentioned by the caregivers as one of the main
challenges they see as related to the success of the programme, together with some shortages in RUTF and
perceived ineffective targeting of most-in-need children.
Reporting periodReporting periodReporting periodReporting period Supply Management IndicatorsSupply Management IndicatorsSupply Management IndicatorsSupply Management Indicators
OTC/ITCs using stock cards
for RUTF stock monitoring;
Target 100%100%100%100%
Health units without
stockout of RUTF; Target
100%100%100%100%
OTC/ITCs making timely
requests for RUTF
suppliers; Target 100%100%100%100%
N % N % N %%%%
January 2015January 2015January 2015January 2015––––March 2015March 2015March 2015March 2015 323/324 99.7% 287/324 88.6% 262/303 86.5%
April 2015April 2015April 2015April 2015––––June 2015 June 2015 June 2015 June 2015 323/324 99.7% 287/324 88.6% 262/303 86.5%
April 2015April 2015April 2015April 2015––––September 2015September 2015September 2015September 2015 NA NA 97/112 87% 190/200 95%
May 2016May 2016May 2016May 2016 NA NA 308/339 91% 170/172 98.8%
Figure 20, Facility-reported challenges in supplying RUTF to caregivers
48%
34%
19%
5%
0%
10%
20%
30%
40%
50%
60%
% Respondents (n=112)
Facility-reported RUTF supply chain challenges
Supply Delivery Storage Transport Misuse

U N I C E F E R K P E n d o f P r o j e c t E v a l u a t i o n P o l i c y B r i e f D e c e m b e r 2 0 1 6
53 | P a g e o f 6 4
Secondary data on stockouts were severely limited by missing data and poor recordkeeping. As a case study
to examine stockouts, we drew on the available data from Moroto for 2013–2016. Figure 21 provides the
mean number of stockouts for Coartem, zinc and amoxicillin across facilities within Moroto, for both facility
and village stocks. Consistently across time, the highest stockouts were in facility supplies of Coartem, with
the highest mean stockout reaching 31 days in the third quarter of 2015. In all other months, facility
Coartem stockouts were below 15, with stockouts of other supplies consistently lower than that of VHT
Coartem. Also noteworthy was the seasonal pattern of stockouts: in each year, there was a mid-year spike
in stockouts across categories of supplies. In 2013 and 2014, this spike occurred in the second quarter. In
2015, the spike occurred in the third quarter. Unfortunately, because the data were only available in
Moroto, we were not able to examine how between-district variation in stockouts was associated with
SAM/MAM. By linking these data with quarterly OTC/ITC data, we also examined some inferential models
to assess whether stockouts were associated with cure, death and default rates at facilities. We did not find
any significant associations. Importantly, however, as with our VHT and supervisions analysis, we were
restricted to data from the 17 facilities recorded in Moroto, which severely limited statistical power.
Figure 21, Average stockouts in Moroto by quarter Q2–Q4 2015
Plans to address staff turnover
Evidence of designing training and mentoring plans to address high staff turnover in KaramojaEvidence of designing training and mentoring plans to address high staff turnover in KaramojaEvidence of designing training and mentoring plans to address high staff turnover in KaramojaEvidence of designing training and mentoring plans to address high staff turnover in Karamoja
UNICEF designed staff training and mentoring plans to address high staff turnover. UNICEF supported IPs
(CUAMM and IIRC) to conduct health worker job supervision and training. Monitoring surveillance and
supervision of nutrition activities for IMAM, IYCF and Child Health Days would reduce staff turnover and
support IMAM services. It was unclear what evidence had supported this approach. There continue to be
staffing issues; often these are administrative or financial. For example, in May 2016, GoU had not signed
to release funds for staff. UNICEF filled a void in staffing by engaging CUAMM to recruit community health
workers and midwives to address the shortfall, with the understanding they would eventually be absorbed
010
20
30
Num
ber of Sto
ckouts
20131 20141 20151Time in Quarters
VHT Coartem Village Coartem
VHT Zinc Village Zinc
VHT Amoxi Village Amoxi
Average Stockouts in Moroto by Quarter,Second Quarter 2013-Fourth Quarter 2015

U N I C E F E R K P E n d o f P r o j e c t E v a l u a t i o n P o l i c y B r i e f D e c e m b e r 2 0 1 6
54 | P a g e o f 6 4
into the district payroll. During interviews, facility staff expressed their concern. One person said that at
times they had been desperate and used cleaning staff to complete reports.
Figure 22, VHT supervisions in Moroto - Q2 2013–Q4 2015
Source 2. Data for this graph available in VHT graph results file
The most complete data set on VHT support supervisions was provided by Moroto, providing a small case
study. Figure 22 shows the average number of VHT supervisions during the intervention period in Moroto.
The average number of VHTs across facilities in Moroto increased at a relatively slow pace. There was even
a decline in some quarters, with a low of 23.8 and a high of 38 VHTs. Increases in supervisions were more
marked, rising from a low mean of three in the first quarter of 2013 to a high of 38 in the third quarter of
2015. The number of supervisions appears to have been less steady across the period compared to the
number of VHTs.
3.8 Sustainability Sustainability was evidenced by the sustained results of reduced malnutrition and stabilisation of GAM;
continued support from all stakeholders; and emerging national, regional, district and community
ownership of nutrition priorities and activities. Malnutrition had much variation over time, but it was
relatively stable in Karamoja, yet below targets. Interventions that built capacity for sustained results
occurred across the entire programme, these involved various strategic efforts; gaining ownership and
support of the national and district government-, facility staff- and community-level implementers.
Observed were UNICEF ERKP efforts to strengthen national support for contingency planning, which
included development and release of strategic resiliency plans. District dissemination and training was
under development at the time of the evaluation. Coordination with the DHOs and other government
implementers was building stronger health systems. Knowledge sharing through the FSNA, if continued,
will bear much benefit. UNICEF has been involved in contingency planning, and iNGOs have structured
contingency plans that contain messages about nutrition and emergency preparedness (Appendix III).
010
20
30
40
Number of VHTs
20131 20141 20151Time in Quarters
Total VHTs VHTs Reporting
Supervisions
Average VHTs & Supervisions in Moroto by Quarter,Second Quarter 2013-Fourth Quarter 2015

U N I C E F E R K P E n d o f P r o j e c t E v a l u a t i o n P o l i c y B r i e f D e c e m b e r 2 0 1 6
55 | P a g e o f 6 4
To build local capacity at district, facility and community levels, UNICEF ERKP developed IMAM capacity
through training of health workers. IYCF counselling strategies and training were building local capacity to
inform and educate beneficiaries of best practices. IYCF counselling was widespread across all districts via
the VHT network. Continued training from various players should sustain the trend towards informing and
referring beneficiaries, and building local capacity.
3.8.1 Ownership What is the ownership of programme activities by government partners What is the ownership of programme activities by government partners What is the ownership of programme activities by government partners What is the ownership of programme activities by government partners and/or other partners?and/or other partners?and/or other partners?and/or other partners?
Evidence was obtained that showed various levels of nutrition and food security ownership across the
sectors. Interviews revealed a national level of ownership of nutrition, to be evidenced by their engagement
in policy reform and the integration of nutrition services into the basic health package. For example, the
Mwanamugimu Nutrition Unit, a government national referral partner, maintained a pool of more than 30
national trainers and supervisors. They were engaged by UNICEF to provide treatment and support for
malnourished children, and they provided all 13 referral hospitals with technical support supervision
quarterly.
At the district level, however, feelings were mixed about government involvement and ownership. In
Moroto, for example, the district and facility staff mentioned the forming of multi-sectoral teams to go to
hardest-hit areas, to ‘forge the way forward’. While district respondents felt ownership at the district level
was high, it could be strengthened. Only 58.3% of facility staff said that government was involved in
activities, and less than half of VHT respondents felt that government was involved (Table 7). In fact, despite
CUAMM’s engagement of DHOs, the perception was low regarding government involvement. Almost 18%
of facility staff and 15% of VHTs indicated government involvement was poor or non-existent.
Table 7, Perceptions about government's level of ownership/involvement
Facility Staff Community Service
Provider
N=108 % N=34 %
Fair 26 24.10% 13 38.20%
High 63 58.30% 16 47.10%
Poor 14 13.00% 3 8.80%
No level of
ownership/involvement
5 4.60% 2 5.90%
Ownership and involvement at the facility level was relatively high. Facility staff provided a list of activities
in which they were involved, demonstrating an element of commitment to nutrition. However, as was
common knowledge, they have very limited time and resources.
The mapping exercise revealed connections between iNGOs in the Karamoja region and the UNICEF
activities, which involved training to contribute to nutrition goals and IMAM and IYCF activities. Most IP
organisations interviewed that were working in Karamoja had invested in activities for sustainable capacity
building. There was at least one IP per sub-county (Figure 19, page 46). IPs practiced cost sharing while
implementing activities aimed at changing the attitudes of local people, especially to reduce reliance on

U N I C E F E R K P E n d o f P r o j e c t E v a l u a t i o n P o l i c y B r i e f D e c e m b e r 2 0 1 6
56 | P a g e o f 6 4
NGOs. They promoted agricultural and other practices that confront food insecurity with local solutions.
Mercy Corps, for example, offered better seed and mechanised farm implements at 50% less than the
market price, and they also linked local communities with good agricultural supplement suppliers to
increase livelihood opportunities.
Further to sustainability, IPs carried out deliberate planning with local districts’ leadership to devise plans
for programme absorption when the existing funding comes to an end. The local governments have
responded positively to this effort, and they play a leading role in the mobilising and forming of VHTs that
work collaboratively with IPs on diverse programmes. IPs also work with districts on a continuous basis to
review their strategic plans on nutrition activities to establish long-term emergency needs. The Caritas
Kotido Diocese reported to be setting up a farming institute aimed at training local Karamoja populations
in agriculture and other nutrition-related courses. The majority of organisations reported a sustained
fundraising effort through grant writing. The WFP was undertaking a review process of their five-year
country strategy that prioritises nutrition programming in the Karamoja region. Some organisations have
initiated women savings groups, while others have turned mother care groups into loans and savings
associations. These groups continue to stand on their own even when a project closes.
Chapter 4 Lessons Learnt 1 In the effort to fill the gap between emergency assistance and development aide, UNICEF ERKP utilised
their strategic advantage to support improvement in governance and the integration of the IMAM
programme into the mainstream health system using upstream and downstream strategies.
2 UNICEF ERKP had a weak theories of change model. It did not clearly define the causal chain, and
assumptions were missing from the log frame.
3 Although gender was tracked, there was little evidence that gender-specific issues were targeted with
interventions.
4 GAM stabilised during the intervention period to an average of 12.4%. Moreover, it was agreed that
the GAM target of less than 10% was not realistic, considering that UNICEF alone will not be able to
reduce GAM. (See change request to the Karamoja Resilience programme log frame, 2015).
5 At the national level, UNICEF ERKP has been effective at leveraging relationships to build support for
nutrition policy change, strategic planning and integration into the national system. Strengthening
relationships at the district level is needed.
6 Contingency planning was the least developed of initiatives and was under development. Contingency
planning was in the process at the end of the intervention period.
7 Research into causes of malnutrition was conducted and guidelines developed and implemented at the
district, facility and community levels. Knowledge sharing around the FSNA was efficient, but it needs
improvement and a focus on quality of data-collection inputs and analytic outputs.
8 The multi-faceted nature of GAM reduction requires appropriate performance measures and targets,
as well as a clear understanding of the impact of each initiative. The appropriate use of measures to
assess intervention impact, such as VHT training, was woefully absent, whereas it could guide VHT,
CHEW and mother support group efforts with more precision, for example, understanding how and
why certain interventions were effective and dedicating resources to enhance them.
9 Through careful analysis of the available data, this evaluation found that CUAMM training of health
workers and VHTs was associated with better cure rates and lower death rates.

U N I C E F E R K P E n d o f P r o j e c t E v a l u a t i o n P o l i c y B r i e f D e c e m b e r 2 0 1 6
57 | P a g e o f 6 4
Chapter 5 Recommendations The main purpose of this brief is to provide an outline of the emergent key considerations, principles and
priorities for action to address undernutrition. The remainder of this report includes only key
recommendations, which are organised by the research areas of the UNICEF ERKP evaluation. These include
ways to improve the multi-sectoral approach and coordination to move from stabilisation to improvement
in direct nutrition interventions. This is followed by a summary of conclusions.
5.1 Relevance and appropriate 1. Design Design Design Design programme programme programme programme modelsmodelsmodelsmodels for all future focus areas to improve resilience in Karamoja.
Enhance/construct the log frame to include inputs, outputs, measurement indicators, expected
outcomes and assumptions for each element in the causal chain. UNICEF efforts to improve hygiene
should clearly link with WASH and livelihood initiatives.
2. Enhance communicationEnhance communicationEnhance communicationEnhance communication,,,, a need identified in section 2.2.2 of the Strategic Plan for Resilience in
Karamoja. Create consistent ERKP nutrition messages that link UN sister organisations, iNGOs, and
nutrition activities (see #3 below). The primary donor should consider meeting with all agencies
together rather than independently to nurture an informed and combined effort. Develop systems to
maintain regular communication among stakeholders to share nutrition resilience messages.
Integration of the ERKP communication strategy across all ERKP participating agencies so they work
efficiently and effectively together toward shared accountability (2.1.2), e.g.. Also, integrated message
should be designed for the workshops planned with CHEWS and VHTs (see section 2.2.3 of the plan).
5.2 Effectiveness 3. Close the gap between nutritionClose the gap between nutritionClose the gap between nutritionClose the gap between nutrition----specific and nutritionspecific and nutritionspecific and nutritionspecific and nutrition----sensitive programmessensitive programmessensitive programmessensitive programmes - As a leader in nutrition
working closely with the MoH and IPs, UNICEF could play a greater role in organising collaborative
multi-sectoral efforts that fill the gaps between nutrition-specific and nutrition-sensitive initiatives.
Maximize findings from IIRR linkage assessment to identify and refer caregivers of children with chronic
SAM for resilience building, addressing recurrence at the root cause. While training facility staff and
when designing VHT and CHEW interactions, consider training that helps providers understand when
there is a need to connect the two sectors and where are the appropriate resources. Measure chronic
cases referred in the log frame and the performance database.
4. StreamlineStreamlineStreamlineStreamline Nutrition Information Nutrition Information Nutrition Information Nutrition Information ---- Harmonisation of training/programme implementation records for
each sub-county would strongly improve the potential for knowledge exchange in the future. Data
tracking should be enhanced to include training records, i.e. number of community health worker and
VHTs trained for each sub-county.
5. Recognise hRecognise hRecognise hRecognise highly performing ighly performing ighly performing ighly performing ffffacilities acilities acilities acilities ---- These should be recognised and studied with a view towards
identifying best practices that contributed to their above-average reporting performance. If they are
similar in structure to poorly performing sites, explore the reasons the facilities were doing well and
consider testing their practices when developing the road map for Health Systems Strengthening for
Facility Based Nutrition Services. Where best practices are identified, utilise staff for training sessions
in their districts. Learn about their strategies, and apply learning to best practice knowledge to transfer
to staff at other facilities.
6. Engagement community Engagement community Engagement community Engagement community ---- UNICEF has largely focused on inpatient care, and strengthening knowledge
and awareness around nutrition. Low community engagement has been shown to result in low
coverage. The next phase should involve adequate community components to reach into hard to reach
communities. The CMAM Forum Technical Brief (August 2014) suggests that successful initiatives are

U N I C E F E R K P E n d o f P r o j e c t E v a l u a t i o n P o l i c y B r i e f D e c e m b e r 2 0 1 6
58 | P a g e o f 6 4
those that emphasize ‘community owned’ rather than ‘community-based’ interventions.10 A
community approach necessitates active intervention and a multi-dimensional process that includes a
dialogue to learn from community. This may include formative studies, such as those carried out on
community attitudes or practices. Successful community approaches involve community in the
decision-making process, including allocation of community resources.
Nutrition stakeholders expressed confusion and concern about tensions around issues related to
capacity development and activities of the VHTs and CHEWs. The Ministry of Health has planned
activities for 2017, which include: development of training manuals, standard operating procedures
and manual training for CHEWs. They also seek to identify and accredit training institutions for CHEWs,
recruit and train 1500 (10%) CHEWs, and continue to monitor and supervise the VHT activities.
Furthermore, the MoH is also seeking resources for development of the CHEW strategy. This could be
an opportunity for a UNICEF and MoH partnership to harmonize VHT and CHEW scale up. Address
tensions between stakeholders with collaborative facilitated meetings. Meetings might involve using a
nominal group technique to allow the free sharing of ideas and integration in group decision making.11
It promotes ownership through inclusive contribution to problem solving and can be an opportunity to
identify champions of nutrition. This next phase can ensure nutrition is an element of maternal and
child health education, screening and referral from VHTs and CHEWs.
5.3 Efficiency6 Targeted InterventionsTargeted InterventionsTargeted InterventionsTargeted Interventions –––– Reduce costs and improve efficiency through more targeted multi-sectoral
interventions. With the introduction of tracking systems discussed to improve surveillance and district
specific information, challenges associated with the Karamoja region’s diversity in terms of contextual
factors that impact nutrition, may be addressed more efficiently. Improve efficiency of both nutrition
sensitive and nutrition specific intervention planning, through the development of livelihood and
nutrition profiles for each district. Use the profiles as a framework to design targeted interventions for
each sub-county or livelihood zone. A desk review and stakeholder interviews could easily inform a
nutrition and livelihood profile to better target interventions and provide more value for money. Map
highly performing facilities in the nutrition profiles to enhance understanding of common
environmental influences on performance. Design community interventions that address local issues
and also consider under supported sub-counties.12 7777 Regular Health SystemRegular Health SystemRegular Health SystemRegular Health Systemssss DataDataDataData –Attention should also be paid to the analysis of FSNA nutrition data.
Analysis needs to be supported by an analyst who recognises data issues and corrects for these to
derive meaningful, accurate results for programme planning. Data for the entire region should be
centralised, consistently formatted and catalogued with a codebook containing detailed information
about how each indicator is measured or calculated. Relatedly, nomenclature should be consistent
across sites and time. For example, naming a facility HC 2 in one data file/tab and the same facility HC
II in another makes harmonisation of data points more difficult and thereby reduces efficiency when
analysing data. Using a centralised calculation and verification of rates (for example, by asking two
10 Gray, N., Bedford J., Deconinck H., Brown R. CMAM Forum, Community Engagement: CMAM Forum Technical Brief, August
2014 retrieved 24 Jan 2017, http://files.ennonline.net/attachments/2181/Community-Engagement-Technical-Brief-August-
2014.pdf 11 Gaining Consensus Among Stakeholders Through the Nominal Group Technique, CDC (2006)
https://www.cdc.gov/healthyyouth/evaluation/pdf/brief7.pdf The Nominal Group Technique, University of Arkansas Division
of Agriculture
https://www.uaex.edu/support-units/program-staff-development/docs/NGTProcess%2012.pdf 12Identified in this evaluation: North - Kacheri, Kotido; Panyangara and Nyakwae; Abim. South –Rupa, Moroto, Lokopo, Iriiri.

U N I C E F E R K P E n d o f P r o j e c t E v a l u a t i o n P o l i c y B r i e f D e c e m b e r 2 0 1 6
59 | P a g e o f 6 4
analysts to enter data and calculate rates separately and then comparing results) from a purpose-built
statistical software package would facilitate knowledge exchange and data sharing more efficiently and
effectively. ((((Utilization of a statistical software package is recommended.) Furthermore, proper
programming would allow the development of a system for automating annual reporting on indicators,
which would allow more consistent tracking over time, improve quality of reporting and reduce time
spent conducting calculations. Automation could be considered during the quality-improvement
activities outlined in ‘Strengthening Support for Nutrition in Karamoja’ (2017).
8 MeasureMeasureMeasureMeasuressss –––– Impact on stunting would not be evidenced in the short-term, it could be measured
approximately every two years. This would allow time needed for interventions to impact stunting and
would improve efficiency and contribute to improved value for money. Also, conduct another SQUEAC
survey to determine coverage in 2017.
Note:Note:Note:Note: When using Admissions as a target for VHTs associated with a facility, the indicator should be
weighted to cases of malnutrition. That is, the ratio of cases to VHTs is the number of new admissions
per VHT for that facility. Also worth noting, a target of 33% increase anticipated for SAM enrolled cases
may be overly ambitious for a single year and should consider decreases in SAM due to comprehensive
ERKP strategies
5.4 Sustainability 9 Enhance programme sustainabilityEnhance programme sustainabilityEnhance programme sustainabilityEnhance programme sustainability by providing support for DNCC development and joint sustainability
plans that clearly highlights government and community roles, includes clear budgetary alignment to
create a sense of ownership right from the beginning, as recognized during the Karamoja Nutrition
Sector stakeholders meeting. Funding regular meetings and supporting further supervision and training
of DNCC and SNCC should strengthening leadership and governance for the multi-sectoral approach to
building resilience. Conducting annual reviews with IPs to assess performance, would offer
opportunities to receive feedback and determine areas needing improvement.
5.5 Equity
10 Utilize community strategiesUtilize community strategiesUtilize community strategiesUtilize community strategies to cultivate better coverage of hard-to-reach populations. Community-
based management of acute malnutrition (CMAM) has been an effective model used in other sub-
Saharan countries, such as those implemented in Malawi and Ghana to extend service coverage and
improving treatment outcomes.13
13 Maleta K, and Amadi, B. Community-based management of acute malnutrition (CMAM) in sub-Saharan Africa: case studies
from Ghana, Malawi, and Zambia Food Nutr Bull. 2014 Jun;35(2 Suppl):S34-8

U N I C E F E R K P E n d o f P r o j e c t E v a l u a t i o n P o l i c y B r i e f D e c e m b e r 2 0 1 6
60 | P a g e o f 6 4
Conclusions In conclusion, the findings from this evaluation could inform nutrition resilience programmes aimed at
engaging UN-, iNGO-, district- and facility-level implementers. Furthermore, it specifically informs multi-
sectoral approaches towards closing the gap between nutrition-sensitive and nutrition-specific initiatives.
Specifically, it could prove useful for promoting improvements in dietary diversity and meal frequency.
Opportunities will arise as contingency planning emerges to establish cross-sector interventions that can
be measured in the SMS tracking system and shared between partners.
The association between facility IYCF and IMAM training and several improved performance indicators is a
strong indicator that the approach is effective. During this exercise, facilities providing quality reporting
were identified. Achieve improvement and potential for ownership at the facility level. Site staff should be
recognised, studied and engaged to champion the nutrition training in their districts.
The multifaceted nature of GAM reduction requires appropriate performance measures and targets as well
as a clear understanding of the impact of each initiative. It also requires the appropriate use of measures
to assess the impact of community interventions on nutrition outcomes in Karamoja. For example, there
are numerous players soliciting community health workers, but little is tracked in terms of what training
they have received. This report touches on that topic, but it should be explored further.
Knowledge sharing around the FSNA is efficient, but requires more focus on quality of outputs. Numerous
data-related issues arose during the course of the evaluation, such as those related to data completeness,
consistency, organisation and analytic accuracy. These were explored and included in Limitations and
Lessons Learnt, and they could inform data systems to improve data reliability, ensuring quality data are
used for information sharing.
Linkages between livelihood nutrition sensitive and nutrition-specific treatment programmes are weak.
These deserve attention, given the association between livelihood referral and cure and death rates at
facilities.
The nutrition programme would benefit from clearly outlining theories of change models around new
multi-sector initiatives. There is opportunity for improvement around programmes in terms of ensuring
equity and strengthening messages around dietary diversity, meal frequency and hygiene. These might be
achieved by conducting a more specific study into barriers and bottlenecks and building an understanding
of proper IYCF practices by combining programmes into multi-sector approaches, such as school education
and livelihood programmes.

U N I C E F E R K P E n d o f P r o j e c t E v a l u a t i o n P o l i c y B r i e f D e c e m b e r 2 0 1 6
61 | P a g e o f 6 4
Table 8, Overall findings and conclusions – Interventions from November 2013 to March 2016
Expected Results as in Expected Results as in Expected Results as in Expected Results as in
LogframeLogframeLogframeLogframe
Log frame Performance IndicatorsLog frame Performance IndicatorsLog frame Performance IndicatorsLog frame Performance Indicators / baseline/ baseline/ baseline/ baseline 2013 Targets for 2013 Targets for 2013 Targets for 2013 Targets for
Q1 2016Q1 2016Q1 2016Q1 2016
ResultsResultsResultsResults
Expected Results #1
Improved access for
mothers and children to
high impact nutrition
interventions in
Karamoja
1. % mothers EBF children 0-6 mo. / 26-76% 88% Above 90% in all districts except Moroto 87% EBF – (May
2016 report)
2. Min Dietary Diversity (MDD) % children <5 receiving
food from 4 or more food groups / 10-35% (2013
original) - Correction 30-50% (live log frame - FNSA,
May 2012)
15% increase (5%
per year over 3
years)
December 2015 (ERKP Annual Review 2016): Increase 5.6%
3. Minimum meal freq. % of children 6-23 mo.
Fed 3-4x per day / baseline not available in proposal
5% annual
increase
39% (March
2017)
MMF in 2014 was at 42% in 2014, 36.5 in 2015 and Sept
2016 log frame indicates “Target is based on the current
MMF” for June 2016, which is at 34%.
4. No. Health workers trained / 0 700 89
5. % pregnant women who took iron 90 days during
pregnancy / <3%
6%
Reported iron supplements for pregnant women at 90%
receive during 1st ANC visit (HMIS); baseline was reported at
3% of pregnant women receive (HMIS)
6. % children 6-59mo. Receiving 2 doses of Vitamin A
/ 56 to 90%
National target
80%/Karamoja 9
Karamoja targets met at 90%
7. VHT members engaged in screening, referral, &
follow-up / 0
3000 by March
2016
VHTs trained, 1,908 in 2015 and increased to 2,400 by June
2016
8. Treatment of SAM children recovered (cured) /
>60%
75% of SAM
burden
disaggregated
male/female
5,385 children with SAM enrolled (not disaggregated) target
33% increase in 2017; average cure rates 71.57% from
performance reports (January, August and September of
2014, August 2015, and May, June, July, and September of
2016 the cure rate exceeded 70%.)
9. Performance on SPHERE standards / baseline
a. 77% cure rate
b. 21% default rate
c. 3% death rate
>75% cure rate;
default rate 15%;
death rate <10%;
Death rates averaged 2.53% per performance reports. 2012
SQUEAC survey put coverage at 50% no new coverage data
since; default rate 18% (decreased from 2013 rate of 21%;
non-response 10.1% average
Conclusions: EBF was an achievement, exceeding the national average at 90%; Targets for increase in DD and MMF were not met during
period under evaluation. In fact, MMF appears to be on a downward trend. Additional efforts are planned for 2017. The assumption that
other activities would influence these indicators should be revisited; Iron uptake efforts for pregnant women at 4 ANC visits and VitA uptake
for children 6-59 mo., far exceeded target and the national average. VHT training targets not met; scale up for improved referral and follow-
up needed. Health worker training targets were not met; but show improvement in cure rates associated with facility staff training. SAM
children enrolment is not consistently disaggregated by gender by UNICEF. A target of 33% increase anticipated for SAM enrolled cases

U N I C E F E R K P E n d o f P r o j e c t E v a l u a t i o n P o l i c y B r i e f D e c e m b e r 2 0 1 6
62 | P a g e o f 6 4
Expected Results as in Expected Results as in Expected Results as in Expected Results as in
LogframeLogframeLogframeLogframe
Log frame Performance IndicatorsLog frame Performance IndicatorsLog frame Performance IndicatorsLog frame Performance Indicators / baseline/ baseline/ baseline/ baseline 2013 Targets for 2013 Targets for 2013 Targets for 2013 Targets for
Q1 2016Q1 2016Q1 2016Q1 2016
ResultsResultsResultsResults
may be overly ambitious for a single year and should consider decreases in SAM due to comprehensive ERKP strategies. More community
engagement and health facility training for scale up is needed to meet this goal; Conduct another SQUEAC survey to determine coverage in
2017. Moderate stabilization of GAM at approximately 12.4% with a range of between 8% and 14% between 2013 and 2015; UNICEF did
not meet their targets for coverage assessments; SQEAC in 2012 and LQAS in 2015. However, to goal to stabilize GAM was met.
Expected Results #2
Improved coordination
and partners’
interaction for nutrition
services and capacity to
respond to /increase /
change in needs
1. Timely reporting rates (# facilities) reporting rates
for nutrition / 64%
80%
By 2015, achieved 70% of engaged facilities achieved with
target of 90% - 126 out of 138 health facilities with IMAM
submitting timely reports. By Q1 2016 reach was 87%
2. Operational research conducted and disseminated
/ 0
Four periodic
analytical of
nutrition info
data at district
level and
disseminated
None have been completed thus far. Agreement with Centre
for Humanitarian Change – reviewing surveillance system in
2017
3. No. health units reporting no stock out of RUTF in
Quarter / 0
100%
91% had no stock outs by 2016 (IP reports)
4. Karamoja MS Nutrition Strategy / 0 Multi-sectoral
Nutrition
Strategy
Karamoja Multi-Sectoral Strategy- resilience 2015-2020 –
completed June 2015
IIRR report on Social protection model to enhance
Conclusions: Targets for timely reporting for nutrition were exceeded. Health units reporting no stockout did not meet target of 100%;
reporting is inconsistent, e.g. Moroto is only district that provided usable stock out data for analysis. Improvements in stockout reporting
are needed in order to achieve reporting accuracy. UNICEF engaged Nutrition Focal Person to plan for improvement. UNICEF has done well
to establish data collection for surveillance systems through health facilities, which should now be strengthened through contract with IIRR.
They also completed multi-sectoral strategy by Q3 of 2016.
Expected Results #3
Increased knowledge
and understanding on
the underlying causes
of poor nutrition in
mothers and children in
Karamoja and secure
timely and quality
information on
1. No. periodic analytical nutrition data district
distribution to nutrition sector groups / 0
One FSNA report
released and
disseminated
FSNA 2014 completed and report released by MoH;
dissemination evident at districts and facilities. 2015 and Q1
2016 targets not met, per June 2016 annual report.
2. No. quarterly district nutrition meeting min / 0 district
meetings=5
Target not met; 7/1 district minutes/action points
3. Number FNSAs conducted/disseminated / 3 (2012) Annually
conducted = 2
Dissemination not achieved

U N I C E F E R K P E n d o f P r o j e c t E v a l u a t i o n P o l i c y B r i e f D e c e m b e r 2 0 1 6
63 | P a g e o f 6 4
Expected Results as in Expected Results as in Expected Results as in Expected Results as in
LogframeLogframeLogframeLogframe
Log frame Performance IndicatorsLog frame Performance IndicatorsLog frame Performance IndicatorsLog frame Performance Indicators / baseline/ baseline/ baseline/ baseline 2013 Targets for 2013 Targets for 2013 Targets for 2013 Targets for
Q1 2016Q1 2016Q1 2016Q1 2016
ResultsResultsResultsResults
changing needs for
improved programming
Conclusions: Significant progress has been made in establishing the surveillance and reporting system. However, targets were not met for
annual FSNA reporting, e.g. 2014 results distributed in 2016. The goal of biannual reports may not be reasonable due to the required review
and dissemination requirements. The Centre for Humanitarian change is contracted to identify opportunities for improvement in FSNA
system. Create district-level matrix with contributions from all sectors to understand and better target interventions in each district and
save costs.
Expected Results #4
Strengthen Contingency
planning and
emergency
preparedness for
nutrition within the
Karamoja region
1. No. district teams trained in contingency planning,
preparedness & response / 0
No. = 7 No of district plans with nutrition interventions integrated,
budgeted for and funded achieved. [Update: March 2017
UNICEF reported contingency plans reviewed in 7 districts)
DNCC orientations took place in 4 districts.
2. Comprehensive coordinated response plan
developed / 0
No. = 7 Target not met - Contract with IIRR in place since March 2015.
Dec 2015=0 achieved; Target seven districts in 2017.
Note: Joint Nutrition Strategy was approved; Action
plans; operational plans; M&E Frameworks were pending
by mid-2016.
Conclusions; Contingency planning has moved relatively slowly. No 2013 targets were met in 2015 or 2016 according to log frame. UNICEF
reports indicate district teams have not been engaged. District teams were under development during evaluation; Investigation revealed
contingency planning activities had been rolled out to engage district level teams and iNGOs - reported that they have plans. Target for
2017 is training seven districts in contingency planning to integrate IMAM into contingency planning. This includes developing an sms
tracking system; iNGOs have been engaged. Despite this progress, district teams had not been trained in contingency planning.

i | P a g e
Appendix I, Supplementary Tables Table 9, Respondent Characteristics
Facility level characteristics FacilityFacilityFacilityFacility %
Level of Health Facility
Health Center II 37.0%
Health Center III 38.0%
Health Center IV 12.0%
Hospital 13.0%
Facility Services OfferedFacility Services OfferedFacility Services OfferedFacility Services Offered N=108 %
Nutrition assessment 97.2%
Nutrition Counselling (IYCF) 96.3%
Provide ReSoMal 38.9%
Provide RUTF 88.9%
Provide micronutrients (Vitamin A, Iron etc) 69.4%
Referrals for clinical support 71.3%
Referrals to livelihood program 25.0%
Referrals to supplemental food programs 75.9%
Other 2.8%
Characteristics and Respondent Reported Services Seeking, CaregiversCaregiversCaregiversCaregivers
% (n=119)
Level of Health Facility where Caregivers were interviewed (n=119)
Health Centre II 28.6%
Health Centre III 34.5%
Health Centre IV 16.0%
Hospital 21.0%
Came to seek services at facility by
Referred from by VHT 66.4%
Referred from MSG 11.8%
Told about the health facility by a friend 21.0%
Health facility is nearest to my home 45.4%
All health services are assured at this health facility 9.2%
Other (specify) 19.3%
Child benefitted from nutrition program being implemented through
Community child health days 26.9%
Out-patient care services 81.5%
In-patient care services 26.9%
Child has not benefited 0.8%
Other (specify) 0.8%

ii | P a g e
Table 10, Characteristics of sampled facility and community level implementers as well as beneficiaries
Evaluation population characteristicsEvaluation population characteristicsEvaluation population characteristicsEvaluation population characteristics NNNN %%%%
Facility level Implementers (N=108)Facility level Implementers (N=108)Facility level Implementers (N=108)Facility level Implementers (N=108)
Cadre Cadre Cadre Cadre
Facility in-charge
OTC health worker
ITC health worker
Health assistant
48
46
11
3
Gender Gender Gender Gender
Male
Female
60
48
55.6
44.4
Community level Implementers (N=34)Community level Implementers (N=34)Community level Implementers (N=34)Community level Implementers (N=34)
Cadre Cadre Cadre Cadre
VHT
MSG leaders
ACDO
13
15
6
32.8
44.1
17.6
Beneficiaries (N=119)Beneficiaries (N=119)Beneficiaries (N=119)Beneficiaries (N=119)
Health facility service at which caregiver interviewedHealth facility service at which caregiver interviewedHealth facility service at which caregiver interviewedHealth facility service at which caregiver interviewed
Inpatient Therapeutic Care (ITC )
Outpatient Therapeutic Care (OTC)
27
92
22.6
77.3

iii | P a g e
Appendix II, List of those Interviewed and sites visited
Data collection Data collection Data collection Data collection
methodmethodmethodmethod
Respondent Respondent Respondent Respondent
categorycategorycategorycategory
Respondent detailsRespondent detailsRespondent detailsRespondent details Target sample Target sample Target sample Target sample
sizesizesizesize
Number Number Number Number
InterviewedInterviewedInterviewedInterviewed
SemiSemiSemiSemi----
structured structured structured structured
interviewsinterviewsinterviewsinterviews
Facility level
implementers
(list of facilities
is located in
attached
primary data
collection files)
Facility in-charge 51 48
OTC health worker 51 46
ITC health worker 10 11
Community
level
implementers
2 VHTS linked one HC III in each
district
14 13
2 MSG leaders of one MSG at HC III in
each district
14 15
1 ACDO at HC III level per district 7 6
Beneficiaries 6 caregivers of children aged 0 – 2
years in stabilization in each of the 10
UNICEF-supported ITCs
60
27
2 caregivers of children aged 0 – 2
years in each of the 51 UNICEF-
supported OTCs
102 92
Data Data Data Data
abstractionabstractionabstractionabstraction
District • Training data from District
Nutrition focal persons and
relevant IPs
• RUTF data from District
Store Keepers
• Nutrition status data from
District Biostatistician and
CUAMM
7 7
Nutrition Nutrition Nutrition Nutrition
ProvidersProvidersProvidersProviders
Sub-County • List is provided in Mapping
Report
28 28

iv | P a g e
Figure 23, Document timeline 2000-2016

v | P a g e
Appendix III, Karamoja NGO Mapping
Mapping Report _
DRAFT 09 November _ Denis.doc
Appendix VI, Inferential Statistics & Tables Facility Level Inferential StatisticsInferential StatisticsInferential StatisticsInferential Statistics
Secondary Results.xlsx
• (Facility Level DataFacility Level DataFacility Level DataFacility Level Data)
No inferential statistics for hampering factors due to small cell sizes—only a small subset had data for these questions. Some other variables also missing
here due to inadequate variation—I didn’t run regressions for anything with 85% or higher of cases with identical responses due to insufficient variation
(higher than 75% for community data given smaller sample size), likewise for community and caregiver data (below).
o There was no significant evidence of variation in nutrition program activities by district.
o There was significant variation in training by district
� Respondents in Abim had significantly higher odds of being trained in referrals compared to those in Kaabong
� Respondents in Nakapiripirit and Abim had significantly higher odds of being trained in integrated management of childhood illness
compared to those in Kaabong
� Respondents in Abim had significantly higher odds of being trained in treatment of malnourished children compared to those in Kaabong
o There was significant variation in the perception of positive results of the program by district
� Respondents in Napak had significantly higher odds of reporting increased referrals as a positive result of the program compared to
those in Kaabong
� Respondents in Moroto had significantly lower odds of reporting fewer cases of malnutrition as a positive result of the program
compared to those in Kaabong
� Respondents in Napak had significantly higher odds of reporting increased caregiver information as a positive result of the program
compared to those in Kaabong
o There was significant variation in the perception of what factors have contributed to achievement of results achieved so far by district
� Respondents in Kotido had significantly higher odds of reporting availability of job aides helped compared to those in Kaabong

vi | P a g e
� Respondents in Amudat had significantly lower odds of reporting effective referral systems helped compared to those in Kaabong
o Respondents in Moroto and Kotido rated how well various UNICEF nutrition components were linked lower than respondents in Kaabong
o Respondents in Kotido had much lower odds of saying the program had been implemented very well (versus somewhat well; no one said the
program was implemented fairly or poorly) compared to those in Kaabong; Respondents in Napak had far lower odds of reporting that intended
beneficiaries have been reached by the program.
Table 11, Association between district and coordination, functionality and reach
Association between District and Coordination, Functionality, and Reach, Facility Data (n=108)Facility Data (n=108)Facility Data (n=108)Facility Data (n=108)
Alignment with
Karamoja
Priorities
UNICEF Nutrition
Components Linked
Facility Activities
Linked to
Community
Effort to Reach
Men & Women
Sub-Country
Committees
Functional
Government
Ownership of
Activities
B SE B SE B SE B SE B SE B SE
District
Kaabong (ref) 0.00 0.00 0.00 0.00 0.00 0.00 0.00 0.00 0.00 0.00 0.00 0.00
Amudat 0.26 -0.20 -0.04 -0.26 0.05 -0.18 -0.08 -0.28 -0.22 -0.46 -0.58 -0.31
Moroto -0.19 -0.18 -0.78** -0.24 -0.14 -0.16 -0.18 -0.25 -0.27 -0.42 0.13 -0.28
Nakapiripirit -0.14 -0.19 -0.07 -0.24 0.10 -0.17 -0.51 -0.26 0.31 -0.43 -0.15 -0.29
Napak 0.18 -0.20 0.11 -0.26 0.05 -0.18 0.00 -0.28 0.16 -0.46 -0.27 -0.31
Abim -0.13 -0.19 -0.09 -0.25 0.01 -0.18 -0.06 -0.27 0.11 -0.44 0.17 -0.3
Kotido -0.28 -0.20 -0.66* -0.26 -0.11 -0.18 0.30 -0.28 -0.07 -0.46 -0.50 -0.31
Notes: *p<.05; **p<.01; ***p<.001
Caregivers Inferential StatisticsInferential StatisticsInferential StatisticsInferential Statistics
• Is there significant variation in any key indicators by district (Caregiver Data (n=119)Caregiver Data (n=119)Caregiver Data (n=119)Caregiver Data (n=119))?
o For models of accounting for food culture, reach, sustainability, and RUTF consumption
� Caregivers in Napak had significantly lower odds of reporting that the Karamojong food culture was taken into account compared to
those in Kaabong
� No other significant associations
o No significant variation between districts in how well the program was implemented

vii | P a g e
o Significant variation in how R came to seek services at the facility
� Caregivers in Amudat, Nakapiripirit, and Napak had significantly lower odds of seeking services at the facility as a result of VHT referral
compared to those in Kaabong
� Caregivers in Abim had significantly higher odds of seeking services at the facility as a result of the facility being near home compared
to those in Kaabong
o There was no significant variation between districts in service points caregivers reported children benefitted from
o There was one significant association between district and messaging
� Caregivers in Abim had significantly higher odds of being given messages about growth monitoring compared to those in Kaabong
Multivariate modelsMultivariate modelsMultivariate modelsMultivariate models
• Neither training nor activities offered through the facility were significant predictors of implementation in the district level data
Table 12 Assessment & Screening, education and referrals, IMAM, and record keeping
Association between District and Training, Facility Data (n=108)Facility Data (n=108)Facility Data (n=108)Facility Data (n=108)
Nutrition
Assessment &
Screening
Nutrition Education
& IYCF Referral
Integrated
Management of
Childhood Illness
Treatment of
Malnourished Children Record Keeping
Received No
Training
OR 95% CI OR 95% CI OR 95% CI OR 95% CI OR 95% CI OR 95% CI OR 95% CI
District
Kaabong (ref) 1.00 [1.00,1.00] 1.00 [1.00,1.00] 1.00 [1.00,1.00] 1.00 [1.00,1.00] 1.00 [1.00,1.00] 1.00 [1.00,1.00] 1.00 [1.00,1.00]
Amudat 1.28 [0.25,6.69] 2.12 [0.43,10.52] 3.00 [0.63,14.23] 4.50 [0.97,20.83] 0.86 [0.21,3.58] 0.38 [0.08,1.84] 0.91 [0.13,6.40]
Moroto 1.08 [0.25,4.60] 0.57 [0.15,2.12] 2.55 [0.61,10.71] 1.45 [0.38,5.54] 1.71 [0.46,6.37] 0.73 [0.20,2.72] 1.33 [0.25,7.01]
Nakapiripirit 1.79 [0.36,9.05] 2.07 [0.48,8.97] 3.94 [0.91,17.01] 6.50* [1.47,28.80] 3.25 [0.76,13.89] 3.00 [0.74,12.13] 0.31 [0.03,3.34]
Napak 1.28 [0.25,6.69] 1.43 [0.32,6.49] 2.19 [0.45,10.58] 3.20 [0.72,14.15] 3.33 [0.68,16.30] 1.46 [0.35,6.11] 1.50 [0.25,8.98]
Abim 5.38 [0.55,52.43] 4.14 [0.71,24.16] 7.00* [1.49,32.82] 8.00* [1.61,39.64] 14.00* [1.51,130.10] 3.44 [0.79,15.02] 0.36 [0.03,3.85]
Kotido 2.12 [0.34,13.13] 2.12 [0.43,10.52] 4.08 [0.86,19.37] 2.33 [0.54,10.11] 5.50 [0.94,32.21] 1.46 [0.35,6.11] 0.42 [0.04,4.53]
Notes: *p<.05; **p<.01; ***p<.001

viii | P a g e
Community Service Providers Inferential StatisticsInferential StatisticsInferential StatisticsInferential Statistics
• (Community Level DataCommunity Level DataCommunity Level DataCommunity Level Data)))) No inferential statistics for frequency of meetings, extent to which they’ve tried to reach both men and women, extent to which
community level activities were coordinated, and whether intended beneficiaries have been reached due to low sample size—only 12 responded to these
questions
o Respondents from Moroto rate the ease of conducting outreach activities as being higher compared to respondents from Kaabong
o Respondents from Nakapiripirit rate the coordination between the facility and community to be greater compared to respondents from Kaabong
o There was no significant association between district and ratings of program implementation
o There was no significant association between district and activities/services offered in the communities
o There was no significant association between district and reported training received
o There was no significant association between district and signs looked for when making referrals, nor between district and messages provided
to caregivers
o There was no significant association between district and reported positive results
o There was no significant association between district and reported factors that helped achieve positive results
o
Association between District and Outreach & Coordination, Community Service Provider Data Community Service Provider Data Community Service Provider Data Community Service Provider Data (n=34)(n=34)(n=34)(n=34)
Frequency of
Outreach
Ease of Conducting
Outreach
Ease for Caregivers to
Understand
Counselling
How Linked with
Other Partners
Coordination between
Facility & Community
Level of Community
Ownership of
Activities
B SE B SE B SE B SE B SE B SE
District
Kaabong (ref) 0.00 0.00 0.00 0.00 0.00 0.00 0.00 0.00 0.00 0.00 0.00 0.00
Amudat 0.03 -0.65 0.73 -0.50 0.03 -0.54
-
0.47 -0.38 -1.47 -0.74 0.63 -0.49
Moroto 0.63 -0.65 1.13* -0.50 0.83 -0.54 0.33 -0.38 -0.87 -0.74 0.63 -0.49
Nakapiripirit 0.23 -0.65 0.73 -0.50 0.83 -0.54 0.13 -0.38 -2.07** -0.74 -0.77 -0.49
Napak 0.83 -0.65 0.33 -0.50 -0.37 -0.54 0.13 -0.38 -1.07 -0.74 0.23 -0.49
Abim 0.33 -0.70 -0.17 -0.53 -0.17 -0.57 0.33 -0.41 -0.42 -0.79 -0.17 -0.52
Kotido 0.58 -0.70 -0.17 -0.53 0.08 -0.57
-
0.17 -0.41 -0.67 -0.79 0.08 -0.52
Notes: *p<.05; **p<.01; ***p<.001

ix | P a g e
Data Rubric
Data Rubric_v9.xlsx
Table 13, Cure, death, and default rate by month, OTC/ITC Data
Date Cure rate Death rate Default rate
01-Jan-13 72.3 2.4 18.8
01-Feb-13 64.5 0.8 22.9
01-Mar-13 70.6 0.3 14.9
01-Apr-13 67.2 2.6 24.3
01-May-13 67.2 2.3 18.9
01-Jun-13 74.0 1.5 22.2
01-Jul-13 70.9 1.4 20.1
01-Aug-13 80.0 0.5 12.7
01-Sep-13 64.7 5.0 20.5
01-Oct-13 64.3 4.6 18.5
01-Nov-13 56.4 0.8 26.4
01-Dec-13 61.2 1.5 26.9
01-Jan-14 70.3 1.1 22.6
01-Feb-14 66.9 1.4 21.6
01-Mar-14 68.9 0.5 23.7
01-Apr-14 66.1 3.2 21.3
01-May-14 66.8 2.0 21.5
01-Jun-14 61.9 3.7 21.6
01-Jul-14 67.0 2.6 20.1
01-Aug-14 72.0 1.1 17.6
01-Sep-14 72.7 1.6 17.0
01-Oct-14 67.8 2.2 17.8
01-Nov-14 59.6 3.3 22.1
01-Dec-14 62.8 0.7 23.7
01-Jan-15 75.2 1.3 13.8
01-Feb-15 68.2 1.5 19.5
01-Mar-15 66.0 2.5 21.3
01-Apr-15 66.5 2.1 18.7
01-May-15 64.7 2.8 17.9
01-Jun-15 63.2 2.4 15.4
01-Jul-15 63.7 3.7 18.1
01-Aug-15 71.1 2.6 14.7
01-Sep-15 66.7 2.0 15.1
01-Oct-15 69.4 1.0 16.2
01-Nov-15 66.2 0.6 16.0

x | P a g e
01-Dec-15 66.3 0.7 17.1
01-Jan-16 58.5 1.8 23.5
01-Feb-16 64.5 1.5 19.6
01-Mar-16 69.3 1.2 16.6
01-Apr-16 . . .
01-May-16 74.2 0.3 18.0
01-Jun-16 71.4 4.1 13.8
01-Jul-16 71.4 0.4 17.0
01-Aug-16 56.1 6.9 30.3
01-Sep-16 71.1 0.0 25.9
Appendix IV, Evaluators Bio data and/or justification of team composition
Names Names Names Names Expertise Expertise Expertise Expertise Roles and Responsibilities Roles and Responsibilities Roles and Responsibilities Roles and Responsibilities
Christina Blanchard-Horan PhD, Applied Anthropology, evaluation
with a focus on Training and Capacity
Building
(Team Leader)
Lead the research team, responsible
for survey design, training of the
research assistants and enumerators,
review key documents, and prepare
interim, draft and final report.
Wamuyu Maina PhD Nutrition
(Co-Investigator)
Assist the team leader in every activity
of the evaluation processes, contribute
to planning, implementation and
report writing.
Elisabetta Aurino Ph.D. Development Economics, Child
Poverty & Food Security
(VfM Analyst)
Conduct analysis of quantitative data.
Transcribe the information from the
semi-structured interviews and provide
draft reports to the team leader and
co-investigator.
Denis Bwesigye Ph.D., Public Health Policy Management & MA in Population and
Reproductive Health Research
(Mapping)
Conduct field visits and undertake key
informant interviews with district and
regional stakeholders, coordinate
NGO, IP & DHO interviews. Transcribe
the information from the key informant
and provide draft reports to the team
leader.
Flavia Miiro MA, (Operation and logistics
management)
Coordinate the overall activity of the
evaluation activities. Training of the
enumerators, Serve as the first point
contact person for the field team.
Conduct field visits and undertake
interviews with district officials.
Transcribe the information from the
key informant and provide draft
reports to the team leader.

xi | P a g e
Appendix V, Terms Of Reference
20160128 TOR
End-of-Project -- EKRP Nutrition.docx
Appendix VI, Inception Report
UNICEF EKRP IR
Update-26 Sept 2016-FINAL.docx
Appendix VII, List of documents consulted
Desk Review
Documents.xlsx
Appendix VIII, Results Framework, Informed consent, & Instruments
Evaluation
Framework.xlsx
Appendix IX, Informed consents
A-Informed Consent
Form.doc
Appendix X, Data collection instruments, with details about their reliability
and validity
Ci-Questionnaire for
Health Facility level implementers.docx
Cii-Questionnaire for
Community Level implementers.docx
Ciii-Questionnaire for
caregivers of children aged 0 to 2 years.docx
D_Focus Group
Discussion Guide for MSG members and Men.docx
E_Data Abstraction
Form_ District & Community Level.docx
F-Unobstrusive
Observation Checklist.docx
G_ Stakeholder
Mapping Tool.xlsx
FINAL MAPPING
TOOL _ QUESTIONNAIRE Sep 26.docx

xii | P a g e
Appendix XI, Raw data analysis files
UGA-FINAL DATA
SETv2.xlsx
Data Rubric_v9.xlsx