december 2016 exas corporate presentation final 12.12
TRANSCRIPT

vCorporate Presentation
December 2016

Safe harbor statement
This presentation contains forward-looking statements within the meaning of Section 27A of the Securities Act of 1933, as amended, and Section 21E of
the Securities Exchange Act of 1934, as amended that are intended to be covered by the "safe harbor" created by those sections. Forward-looking
statements, which are based on certain assumptions and describe our future plans, strategies and expectations, can generally be identified by the use of
forward-looking terms such as "believe," "expect," "may," "will," "should," "could," "seek," "intend," "plan," "estimate," "anticipate" or other comparable
terms. All statements other than statements of historical facts included in this presentation regarding our strategies, prospects, financial condition,
operations, costs, plans and objectives are forward-looking statements. Examples of forward-looking statements include, among others, statements we
make regarding expected future operating results, anticipated results of our sales and marketing efforts, expectations concerning payor reimbursement
and the anticipated results of our product development efforts. Forward-looking statements are neither historical facts nor assurances of future
performance. Instead, they are based only on our current beliefs, expectations and assumptions regarding the future of our business, future plans and
strategies, projections, anticipated events and trends, the economy and other future conditions. Because forward-looking statements relate to the future,
they are subject to inherent uncertainties, risks and changes in circumstances that are difficult to predict and many of which are outside of our control.
Our actual results and financial condition may differ materially from those indicated in the forward-looking statements. Therefore, you should not rely on
any of these forward-looking statements. Important factors that could cause our actual results and financial condition to differ materially from those
indicated in the forward-looking statements include, among others, the following: our ability to successfully and profitably market our products and
services; the acceptance of our products and services by patients and healthcare providers; the willingness of health insurance companies and other
payors to cover Cologuard and reimburse us for our performance of the Cologuard test; the amount and nature of competition from other cancer
screening products and services; the effects of any healthcare reforms, including the Affordable Care Act, or changes in healthcare pricing, coverage and
reimbursement; recommendations, guidelines and/or quality metrics issued by various organizations such as the U.S. Preventive Services Task Force,
the American Cancer Society and the National Committee for Quality Assurance regarding cancer screening or our products and services; our ability to
successfully develop new products and services; our success establishing and maintaining collaborative licensing and supplier arrangements; our ability
to maintain regulatory approvals and comply with applicable regulations; and the other risks and uncertainties described in the Risk Factors and in
Management's Discussion and Analysis of Financial Condition and Results of Operations sections of our most recently filed Annual Report on Form 10-K
and our subsequently filed Quarterly Report(s) on Form 10-Q. We undertake no obligation to publicly update any forward-looking statement, whether
written or oral, that may be made from time to time, whether as a result of new information, future developments or otherwise.
2

OUR MISSION
To partner with healthcare providers,
payers, patients & advocacy groups to
help eradicate colon cancer
3
Eradicating Colon Cancer:
Challenges & Opportunity
4

Source: American Cancer Society, Cancer Facts & Figures 2016; all figures annual
Colon cancer: America’s second deadliest cancer
new diagnoses in 2015
15,690
26,120
41,78040,89049,190
158,080
Esophageal Prostate Breast Pancreas Colorectal Lung
Annual cancer deaths
132,700
deaths in 2015
49,700
134,490new diagnoses
49,190deaths
5
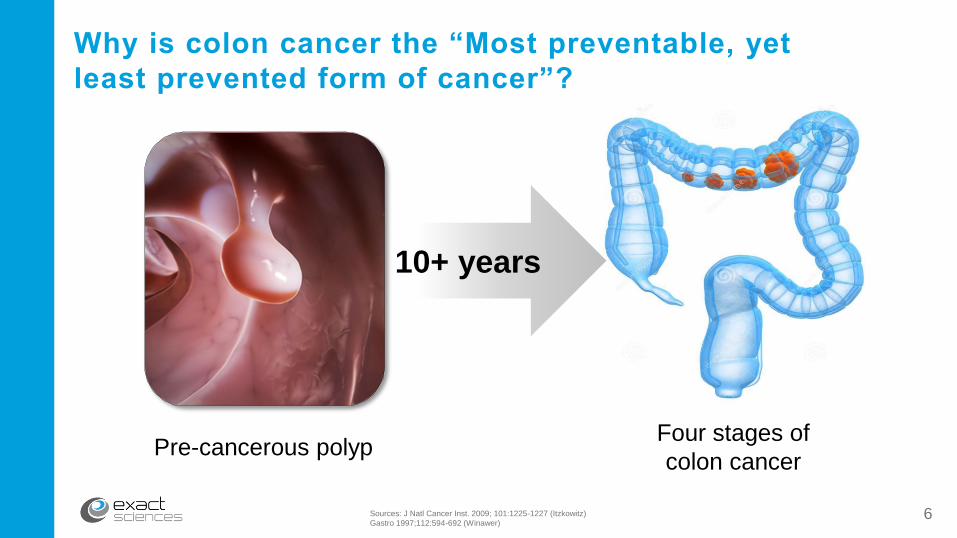
10+ years
Sources: J Natl Cancer Inst. 2009; 101:1225-1227 (Itzkowitz)
Gastro 1997;112:594-692 (Winawer)
Why is colon cancer the “Most preventable, yet
least prevented form of cancer”?
Pre-cancerous polypFour stages of
colon cancer
6

Sources: SEER 18 2004-2010
American Cancer Society, Cancer Facts & Figures 2016; all figures annual
Detecting colorectal cancer early is critical
9 out of 10
survive 5 years
Diagnosed in Stages I or II Diagnosed in Stage IV
1 out of 10
survive 5 years
60% of patients are diagnosed in stages III-IV
7

Rx Only
50%52%
59% 58%
80% 80%
2005 2008 2010 2013 2018 2020
8
95% of screened patients
underwent colonoscopy2
Sources: 1. CDC NHIS survey results as published in the CDC’s MMWR between 2006 and 2015
2. CDC BFRSS survey as published in MMWR (2013)
Care Gapcervical (81%) &
breast cancer (73%)
achieve higher
screening rates1
Actual colon cancer screening rate Goal screening rate
America’s stagnant colon cancer screening rate

Cologuard addresses the colon cancer challenge
Stool DNA test: 11 biomarkers (10 DNA & 1 protein)
FDA-approved & covered by MedicareList price - $649; Medicare rate - $509
Results of 10,000-patient prospective trial published in New England Journal of Medicine
Included in leading cancer screening guidelines at 3 year interval:
• U.S. Preventive Services Task Force (2016) • National Comprehensive Cancer Network (2016)• American Cancer Society (2014)
Source: Imperiale TF et al., N Engl J Med (2014)
Developed with
Mayo Clinic
9

Cancer
detection92%
(60/65)
Precancer
detection42%
(321/757)
Specificity(clean colon*)
90%(4002/4457)
*Clean colons have no need for a biopsy
Sources: Imperiale TF et al., N Engl J Med (2014)
Redwood DG, Asay ED, Blake ID, et al . Stool DNA Testing for Screening Detection of Colorectal Neoplasia in Alaska Native People. Mayo Clin Proc 2016; 91: 61-70.
Cologuard’s performance confirmed in multiple studies
March 2014 October 2015
41%(31/76)
100%(10/10)
93%(296/318)
10

Cologuard:
Becoming Standard of Care
11

A multi-billion dollar U.S. market opportunity
U.S. market opportunity
for Cologuard
$4B
Potential 80M-patient
U.S. screening market*
***
*80 million average-risk, asymptomatic people ages 50-85
**Assumes unscreened decreases from 42% to 30%
***Assumes 24M people screened with Cologuard every three years with ASP of $500
****Assumes 30% market share for Cologuard
*****Assumes 40% market share for colonoscopy & FOBT
*****
****
12
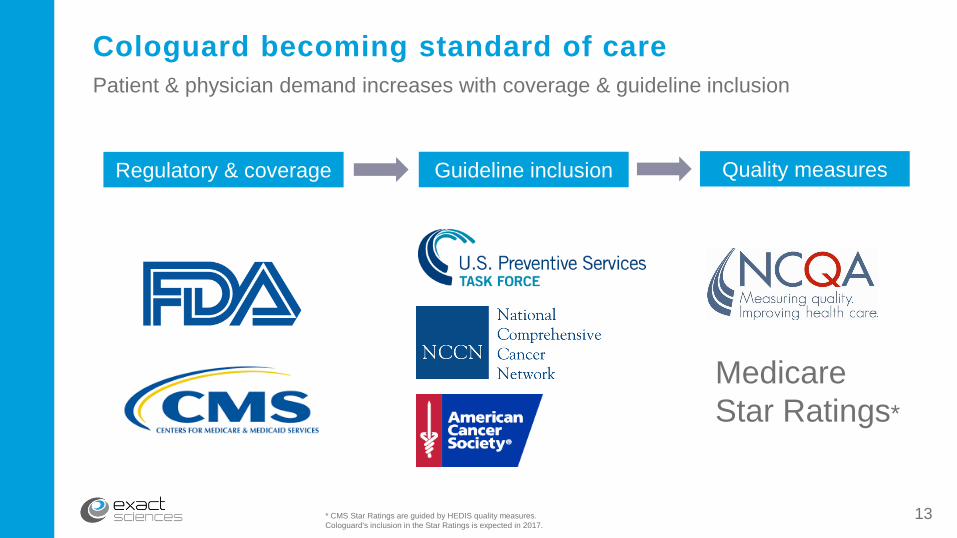
Cologuard becoming standard of care
Patient & physician demand increases with coverage & guideline inclusion
Medicare
Star Ratings*
* CMS Star Ratings are guided by HEDIS quality measures.
Cologuard's inclusion in the Star Ratings is expected in 2017.
Regulatory & coverage Guideline inclusion Quality measures
13

Rx Only 14Sources: USPSTF, “Final Recommendation Statement, Colorectal Cancer: Screening (June 2016)” JAMA (2016)
Screening Method Frequency
Stool-Based Tests
gFOBT Every year
FIT Every year
FIT-DNA Every 1 or 3 y
Direct Visualization Tests
Colonoscopy Every 10 y
CT colonography Every 5 y
Flexible sigmoidoscopy Every 5 y
Flexible sigmoidoscopy
with FIT
Flexible sigmoidoscopy every 10 y
plus FIT every year
Cologuard included in USPSTF recommendations

Rx Only 15
2016 HEDIS performance audit will use HEDIS 2017 rules.
Screening credit given for patients screened using Cologuard in 2014, 2015 or 2016.
HEDIS
HEDIS 2017 measure for
colon cancer screening
Fecal occult blood test during the measurement year.
Flexible sigmoidoscopy during the measurement year or four years prior.
Colonoscopy during the measurement year or nine years prior.
CT colonography during the measurement year or the four years prior
FIT-DNA test (FIT-DNA Value Set) during the
measurement year or the two years prior to
the measurement year
Source: NCQA, HEDIS 2017 Volume 2 Technical Update. Published October 3, 2016
Cologuard drives quality credit
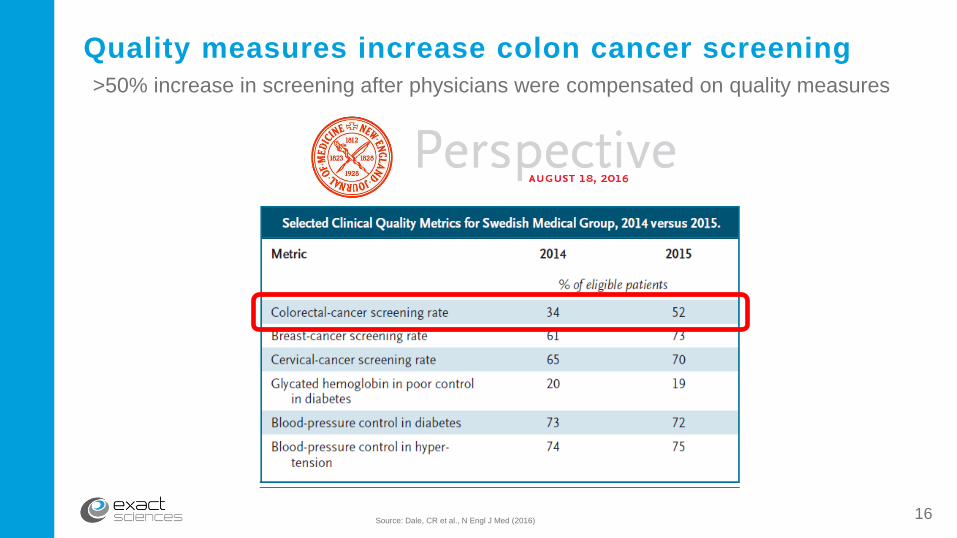
Source: Dale, CR et al., N Engl J Med (2016)
Quality measures increase colon cancer screening
>50% increase in screening after physicians were compensated on quality measures
16

17Sources: CMS 2017 Star Ratings Fact Sheet
Kaiser Health News, March 1, 2016
Quality measures impacting Medicare Advantage plansHealth plans aiming for ≥ 4 Star Rating to earn 5% bonus payments
12
67
10797
67
14
Star Rating
54.543.532.5
2017 Medicare Advantage Plans
Ratings by Star Level
Key thresholds in Star Ratings:
5 Star Ratings: year-round open
enrollment
≥ 4.0 Star Rating: ~$500 per
member and top member
rebate payments

Strong customer satisfaction with Cologuard
Physicians’
expectations
met or exceeded 98%
Patients rated
Cologuard experience
very positive90%Sources: ZS survey conducted for Exact Sciences, n=300
Exact Sciences Laboratories patient satisfaction survey data is cumulative; n = 2,79918

Cologuard: Increasing America’s screening population
Source: Colorectal Cancer Screening with Multi-target stool DNA-based Testing Previous Screening History of the Initial Patient Cohort, poster presented at American College of
Gastroenterology's Annual Scientific Meeting (ACG 2015), Oct. 16-21, 2015; ages 50-74
49% screened with
colonoscopy
42% never
screened before9% screened only
with FIT/FOBT
Screening history of
Cologuard users
19
Rx Only 20
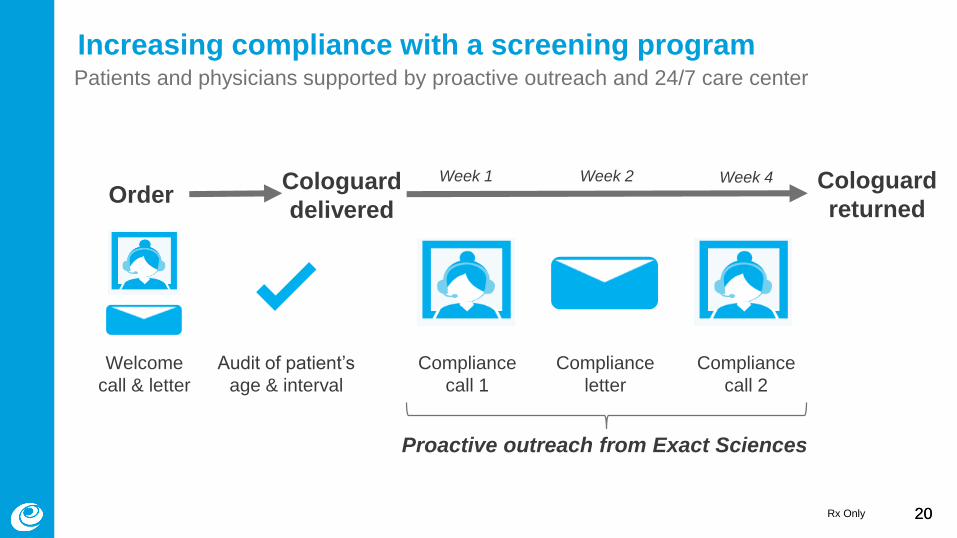
Patients and physicians supported by proactive outreach and 24/7 care center
20
OrderCologuard
delivered
Welcome
call & letter
Audit of patient’s
age & interval
Compliance
call 1
Compliance
call 2
Compliance
letter
Cologuard
returned
Week 1 Week 4
Proactive outreach from Exact Sciences
Week 2
Increasing compliance with a screening program
Rx Only 21
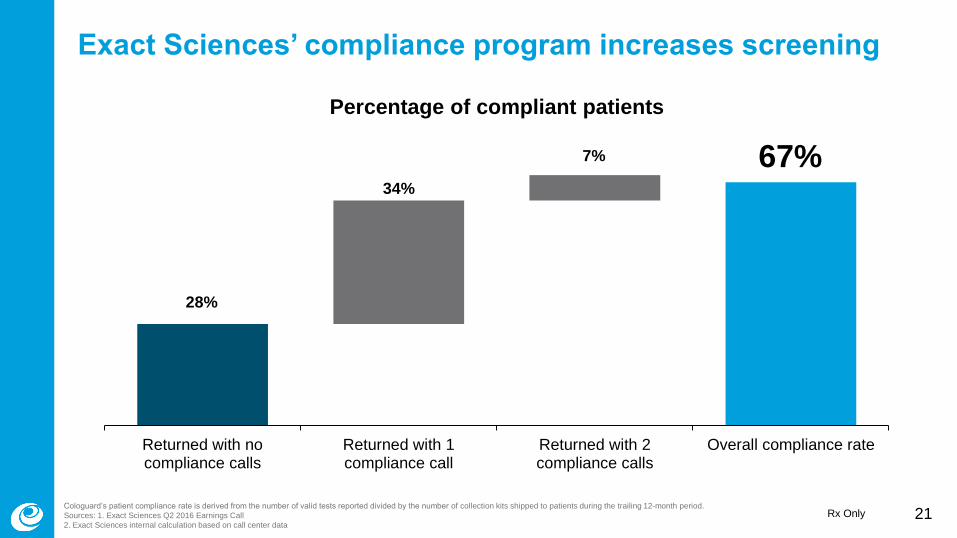
Exact Sciences’ compliance program increases screening
Cologuard’s patient compliance rate is derived from the number of valid tests reported divided by the number of collection kits shipped to patients during the trailing 12-month period.
Sources: 1. Exact Sciences Q2 2016 Earnings Call
2. Exact Sciences internal calculation based on call center data
28%
34%
7% 67%
Returned with nocompliance calls
Returned with 1compliance call
Returned with 2compliance calls
Overall compliance rate
Percentage of compliant patients
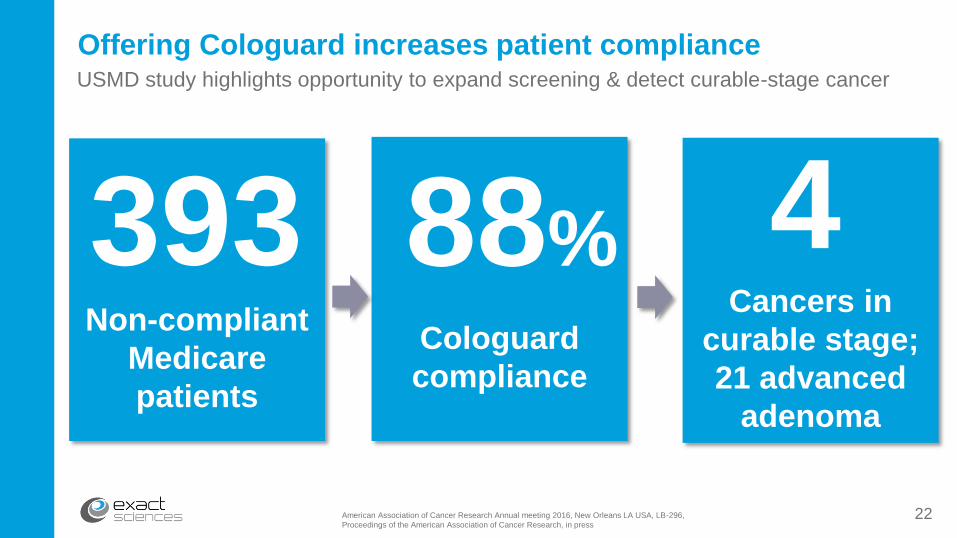
Offering Cologuard increases patient complianceUSMD study highlights opportunity to expand screening & detect curable-stage cancer
American Association of Cancer Research Annual meeting 2016, New Orleans LA USA, LB-296,
Proceedings of the American Association of Cancer Research, in press
Non-compliant
Medicare
patients
393Cancers in
curable stage;
21 advanced
adenoma
4Cologuard
compliance
88%
22

A Strategy to Drive
Cologuard Adoption
23

Three-pronged commercial strategy
Physicians
Primary care
sales force
National TV campaign
Digital marketing
Payers Clinical & health
publications
Market access
team
Guideline
inclusion
Patients
Public relations
Digital direct to
consumer
National TV campaign
24
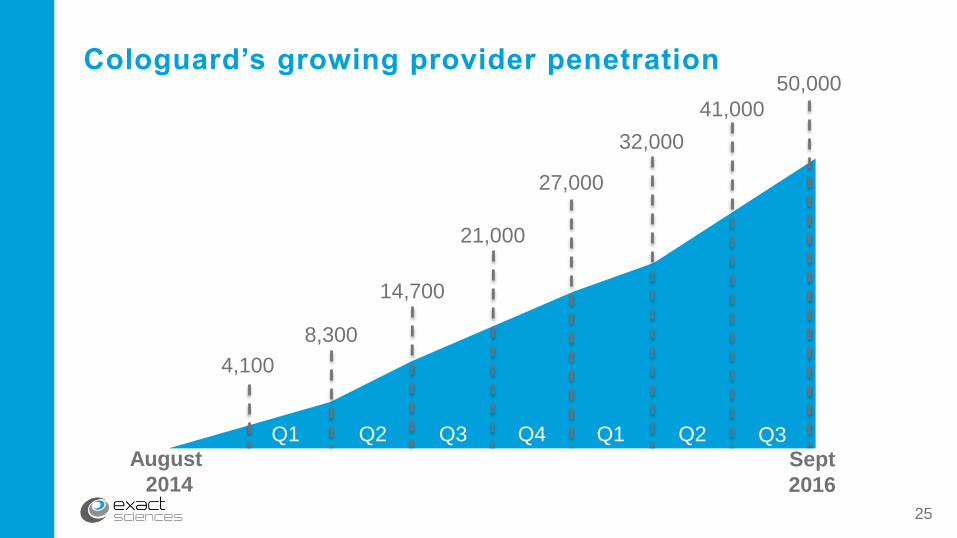
Cologuard’s growing provider penetration
4,100
8,300
14,700
21,000
27,000
32,000
Q1 Q2 Q3 Q4 Q1
41,000
August
2014
Sept
2016
Q2
25
50,000
Q3

National TV campaign increasing ordering & adoption
26
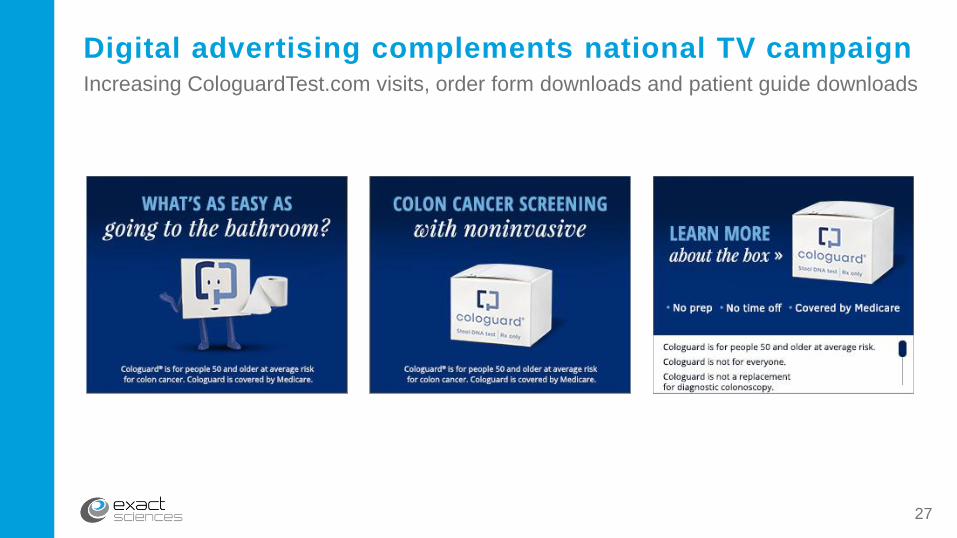
Digital advertising complements national TV campaign
27
Increasing CologuardTest.com visits, order form downloads and patient guide downloads

46% 46%
8%
Source: US Census 2013 and AIS Directory of Health Plans: 2015; ages 50-85
Medicare Commercial
Military &
Medicaid
Breakdown of current U.S. insurance market ~80M average-risk people age 50-85
28

Medical coverage accelerating following
Cologuard’s inclusion in USPSTF recommendations
-
20
40
60
80
100
120
140
160
Mill
ion
s o
f be
ne
ficia
ries
153M total
USPSTF
Medicare
Anthem
HCSC
BCBS
MA
IBC BCBS
LA
Health Net
Source: US Census data, AIS Directory of Health Plans: 2016
29
Cigna &
TRICARE
CareFirst
Humana

Strategy to advance insurance coverage
Value proposition for payers
Sources: Imperiale TF et al., N Engl J Med (2014)
Cologuard’s patient compliance rate is derived from the number of valid tests reported divided by the number of
collection kits shipped to patients during the 12-month period ending 60 days prior to June 30, 2016. 30
Quality
of care
Economic
value
Member
satisfaction
Close the care gap with a
colon cancer screening test that’s
92% sensitive and 87% specific
High compliance with Cologuard driven by
patient satisfaction and customer service
Cologuard can help increase quality rating and is
cost saving to health plans $

Cologuard growth accelerating in 2016
4,00011,000
21,000
34,00038,000 40,000
54,000
68,000
Q4 Q1 Q2 Q3 Q4 Q1 Q2 Q3
2014 2015 2016
~78,000guidance
Q4
Cologuard tests completed31
Guidance
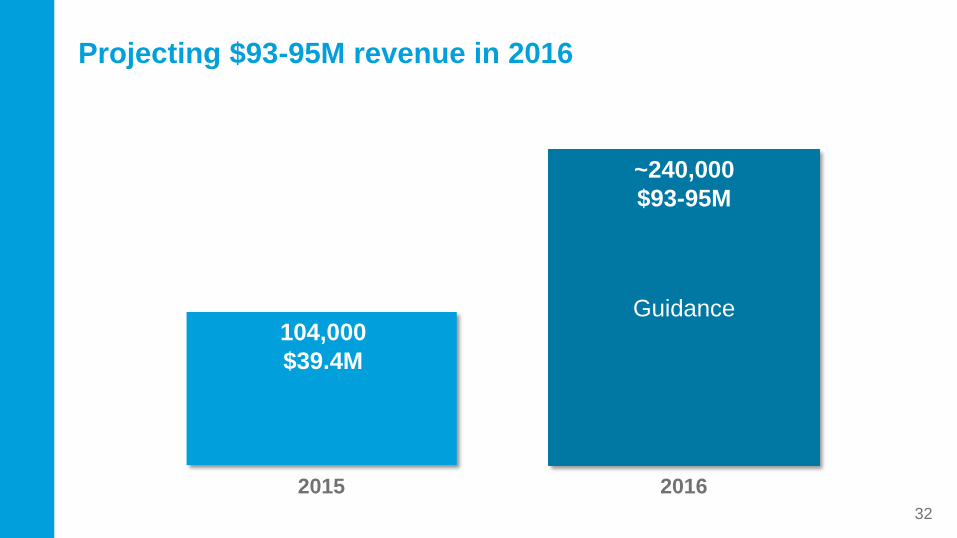
2015 2016
Projecting $93-95M revenue in 2016
104,000
$39.4M
~240,000
$93-95M
32

Source: Company data; Wells Fargo Securities, LLC
Cologuard’s strong launch trajectory
BRACAnalysis (MYGN)
Prolaris (MYGN)
Oncotype Dx Prostate (GHDX)
Oncotype Dx Breast/Colon (GHDX)
FoundationOne (FMI)
MaterniT21 (SQNM)
Panorama (NTRA)
Afirma (VCYT)
VectraDA (MYGN)
Assurex (MYGN)
0K
10K
20K
30K
40K
50K
60K
70K
80K
90K
1 2 3 4 5 6 7 8 9 10 11 12 13 14 15 16 17 18 19
Launch year
Qu
art
erl
y t
est
vo
lum
e
33
Exact Sciences
(EXAS)

34
Foundation built on key milestones
Cologuard developed with Mayo Clinic 2009 – 2010 ✔
10,000-patient DeeP-C clinical trial 2011 – 2012 ✔
DeeP-C results published in NEJM March 2014 ✔
FDA approval August 2014 ✔
Medicare coverage and pricing October 2014 ✔
Inclusion in key guidelines 2014 – 2016 ✔
Inclusion in HEDIS quality measures October 2016 ✔
Buildout of commercial infrastructure 2013 – present ✔
Broad commercial insurance coverage Ongoing
Broad provider access to electronic ordering Ongoing

Third-quarter financial results
Revenues
Operating expenses
Cash utilization
Cash balance
35
Third Quarter
2016
$28.1 million
$54.2 million
$30.5 million
$337.8 million

36