december 2014 (in inr) - indian overseas bank dec2014... · 2017-04-20 · good people to grow with...
TRANSCRIPT

Good People to Grow With
Touching Hearts Spreading Smiles
since 1937
Presentation to Analysts
December 2014
(in INR)

75 Years of Quiet & Dignified Service to the Society
Good People to Grow With

Balance Sheet Management Department
INDEX
3
Particulars Page No. Particulars Page No.
Mile Stones 4-5 NPA Details 28-33
Share Holding Pattern 6 Profitability 34-37
Foreign Branches 7 Profitability - Details of Income 38-43
Joint Ventures 8 Net Profit 44
Highlights 9
Ratios - Cost & Yield Ratios &
NIM 45-46
I.T. Initiatives 10-13
Investments - Domestic &
Foreign 47-48
Major Business Parameters 14 Capital Adequacy 49
Deposits, CASA, Domestic Deposits - category
wise 15-17 Productivity 50
Advances 18-23 Financial Inclusion 51
Restructured Accounts 24-27 PMJDY 52

4 4
Milestones IOB Young at 75 Years
FIRST 50 YEARS
1937 Opening of Bank Branch simultaneously in India & Abroad
1938 Opening Branch in Kuala Lumpur
1941 Opening Branch in Singapore
1945 Opening Branch in Colombo
1955 Opening Branch in Hong Kong
1957 Bank established its own training centre
1960s Was a decade of inorganic expansion for the Bank. The Bank took over:
The Coimbatore Standard Bank Ltd., The Nanjinnad Bank Ltd.,
The Coimbatore Vasunthara Bank Ltd., The Kulitalai Bank Ltd.,
The Srinivasaperumal Bank and The Venkateswara Bank
1964 Inauguration of IOB’s Head Office in Mount Road – A monument of highest banking tradition
1969 Nationalisation of the Bank
1973 Formation of United Asian Bank Berhad (Indian Bank / IOB / United Commercial Bank)
1974 Official Language Department established in 1974
1977 Bank opened its Tsim Tsa Tsui Branch at Kowloon side of Hongkong
1984 1000th branch – Commercial & Industrial Credit – opened
1990 Took over Bank of Tamilnad
1991 Bank moved its Staff College premises to a own spacious learning zone at Koyambedu
1996 Banks profit reached INR 100 cr. For the first time

5 5
Milestones - IOB Young at 75 Years
NEXT 50 YEARS
2000 Initial Public Offer. Follow on Public Offer in 2003
2005 Launched Debit Card
2006 Launched VISA card, Retail Sale of Gold and Non Life Joint Insurance
Bank reached INR 1 lac crore mark in Total Business
2006-07 Net Profit reached INR 1000 Cr.; Bharat Overseas Bank Ltd. was merged with IOB
2007 First Off site ATM at Kamatchi Hospital, Chennai
2009 100% CBS
2010 2000th Branch - Yamuna Vihar, New Delhi - opened
2011-12 No. of Branches in Tamil Nadu reached One Thousand, IOB celebrated Platinum Jubilee
2012-13 As on 31.3.2013 Total Deposit reached INR 2,02,135 cr.; Total Advances reached INR 1,64,366 cr.
As on 31.3.2013 Total Business Mix is at INR 3,66,501 cr.
2012-13 Total No. of Branches as on 31.03.2013 is 2908
2012-13 Received National Award For Excellence in MSME Lending and for outstanding performance for
implementing PMEGP programme in South Zone.
2012-13 Received BANKERS' EXCELLENCE AWARD from ROTARY INTERNATIONAL, USA
2013-14 3000th Branch Vaniangudi opened on 17.8.2013 by Hon. Finance Minister
IOB adjudged Best Public Sector Bank in Priority Sector Lending by Dun & Bradstreet.
IOB's Official Facebook launched by our CMD.
The New Indian Express and Sunday Standard's Best Bankers' Award presented to IOB
Agriculture Leadership Award 2013 conferred to our Bank
Award for "BEST RSETI IN THE COUNTRY received by our RSETI Thanjavur

6
Promoter (GOI) 73.80%
East Residents
7.53 7.53%
East FI
14.61 14.61%
East Corporate Bodies
0.92 0.92%
Mutual Funds 0.25%
East Banks 0.10
0.10%
East FIIs 2.33
2.33%
East NRI 0.36
0.36%
East Trusts 0.04
0.04%
East Clearing Member
0.06 0.06%
Promoter (GOI)
Residents
FI
Corporate Bodies
Mutual Funds
Banks
FIIs
NRI
Trusts
Clearing Member
Investor Profile – Shareholding Pattern (%) as on 31.12.2014
Total No. of Shares
issued:123,53,48,315

7
Global Footprints – Foreign Branches of the Bank
Singapore -
Serangoon Road
Singapore - Boon Lay
Guangzhou – China
Vietnam
Dubai
Remittance
Centres
Representative
Office
Branches
Singapore
Hong Kong Main
Hong Kong TST
Colombo
Bambalapitiya
Seoul
Bangkok
Sukhumvit, Bangkok
Malaysia:Joint Venture with Bank of Baroda (40%) and Andhra Bank (25%) with our Bank share of 35%
Sukhumvit,Bangkok Branch commenced operations from 04.07.2014
EC at Colombo has been upgraded into a branch during August 2013
Ministry of Finance, Government of India has allocated the following overseas centres for opening of overseas JV/WOS by the
Bank. 1.Thailand,2.Vietnam,3.Mongolia,4.Srilanka and 5.Republic of Korea.
J V
Subsidiary
Malaysia

8 8
Strategic Investments - Joint Ventures
IOB entered into Non Life Insurance Business with Universal Sompo General Insurance (USGI) Company Limited
with equity participation of 19% along with the Following Banks and Institutions
Joint venture Equity Contributors % INR Crs
Allahabad Bank 30 105.00
Indian Overseas Bank 19 66.50
Karnataka Bank 15 52.50
Dabur Investments 10 35.00
Universal Sompo Insurance Inc 26 91.00
Total 350.00
The Company has entered into Bancassurance tie ups with Allahabad Bank, IOB and Karnataka Bank.
Our Bank has entered into Corporate Agency arrangements with effect from 20.12.08 for distribution of USGI products.
Bank earned net commission of INR 2.36 crore in the current financial year up to 31.12.2014 compared to INR 2.01
crore up to 31.12.2013 from Health Care Policies.
During the current year up to 31.12.2014, the Bank earned commission from Non Life Sompo (Asset) Insurance
INR 6.34 crore compared to INR 6.17 crore up to 31.12.2013.

9
Highlights-31.12.2014
Business touched INR 4,11,355 Crores ( YoY Growth 6.18%)
Deposits stood at INR 2,32,823 Crores (YoY Growth 9.14%)
CASA stood at 23.98%
Advances stood at INR 1,78,532 Crores (YoY Growth 2.55%)
Operating Profit for 9M is INR 2,142.17 Crores (YOY Growth -23.66%)
Net Loss for 9M stood at INR 489.82 Crores
Provision Coverage Ratio stood at 50.03 %

10
IT Initiatives
IT Organization Structure :
For effective IT Governance, a Board level IT Strategy Committee and a Top Management level IT Steering
Committee have been formed in addition to the existing IT security Committee .
Policies like Information Security Policy, BCP and DR Policy, IT Outsourcing Policy, IT Purchase Policy , IS Audit
Policy, Data Archival Policy, Data Retention Policy have been put in place.
Information System Security Policy conforms to ISO Standards
Infrastructure Space :
Our Bank is one of the first Public sector Banks to establish 3 way DR setup for CBS to ensure Zero data loss.
For other critical applications necessary Infrastructure is in place at DR. Our Bank has provided alternate
connectivity to all our Data Centers and also to the branches wherever feasible through alternate service
providers/medium. Connectivity for Ultra Small Branches is provided through a WAN based broadband 3G
modem/ Data cards.
Core Banking Solution
Our bank has implemented the Core Banking Solution developed in-house, christened ‘CROWN’ (Centralized
Resources Over Wide-area Network).
The RFP process for migrating to the COTS based CBS model which is widely used by all other Public Sector
Banks in India, is in the final stage.
Business Intelligence :
We have introduced Business Intelligence(BI) Suite, which gives interactive Dash Boards, alerts, analytics etc,.
Systems are extablished to store huge amount of historical data as well as to connect to real time applications.
Periodical Knowledge Transfer is done through training at staff college and e-demo is also provided along with BI.

11
IT Initiatives
Alternate Delivery Channels :
Internet Banking :
Bank has home-grown internet Banking suite, with contemporary offerings; Multiple scheduling of payments to
SB/CDCC/RD/ loan accounts and online opening/closure/renewal of Deposits including Senior Citizen,
payment to PPF, RTGS/NEFT- Single and Bulk have been enabled through Internet Banking. E-PAYMENT of
major state VAT has been made online. We are the only Nationalized Bank to collect Chennai Corporation tax
across counters.
OTP facility enabled and introduced for all Ecom/Utility payment transactions
Puducherry Electricity Bill Collection/Excise Collection introduced.
Integreated with AMet University for Fee Collection
Payment Gateway :
Payment Gateway for payment of utility bills like mobile payment, insurance premium, other banks’ credit
cards, telephone bill payments etc., using debit cards has been implemented. Stella Maris College, Amet
University, EBET and Ayyan fireworks has been brought under payment gateway with IOB debit and credit
cards and other bank VISA cards for E-payment. Payment Gateway: 11 aggregators with12000 plus sub
merchants.
Mobile Banking :
Mobile Banking solution provides two way authentication through OTP (One Time Pin) and transactions can be
done through SMS Mode and Mobile Browser (GPRS). Bank is implementing a new Mobile banking Solution,
enabling all the services available with other Banks.
Credit Cards: Issued 49925 credit cards as at the end of December 2014.

12
IT Initiatives
Debit Cards:
Launched VISA International Gold/Platinum/Signature cards for high net worth customers.
• Launched Kisan debit cards to our agricultural customers.
• Launched Domestic RuPay cards of NPCI .
• Launched Gift Cards with denominations upto Rs.50000/-.
• Introduced reward points to our customers for usage of our Debit and Credit cards in Pos and Ecom
transactions.
CTS – Implementation done in 1752 branches.
No of ATMs as on 31.12.2014 is 3417 (onsite and offsite)
GENNEXT Branch to cater to the needs of techsavy younger generation of customers has been opened in
Chennai, Bangalore and Manipal.
Aadhaar Our bank is actively participating in the Aadhaar related initiates of the Government / NPCI. Linking
of Aadhaar numbers to account number through Branch channel as well as through Internet Banking and SMS
is in operation. Aadhaar Payment Bridge Solution and National Automated Clearing House platforms are in
operation. Along with NPCI, AEPS Bridge (Aadhaar Enabled Payment System) facility is enabled.
Financial Inclusion Project:
Financial inclusion application enables funds transfer, deposits and remittances towards advances in real time
and it is also BC-interoperable enabling any customer to transact through any Business Correspondent. We
have also implemented e-kyc as part of customer acquisition project through Business Correspondents.

13
IT Initiatives
Public Fund Monitoring System (PFMS) :
PFMS is a project initiated by Department of Expenditure, Ministry of Finance, Government of India, primarily to
track the disbursement of funds to the ultimate beneficiaries. Our Software for processing and accepting these
funds through our Bank is already in place.
Our bank is one of the 5 banks identified to process transactions of e-FMS (electronic Funds Management
System) in the state of Tamil Nadu wherein NREGA scheme payments are released by Government of Tamil
Nadu every week. Transactions are being processed on a day-to-day basis and credited to beneficiaries of both
intra-bank and inter-ban
MIS ADF :
As per RBI direction, Central Data Repository has been established and RBI-ADF and Internal MIS (ADF - 203
returns and Internal MIS - 400 reports) generation is online, and fully automated.
Data Warehousing : Data relating to 12 years have been ware-housed.
Electronic Transactions:
At the end of November 2014, we have electronic transactions vs paper based transactions at the ratio 69.80:
30.20
Awards & Accolades
During the current year, our Bank was awarded Skoch Order of Merit Award for ADF / MIS.
14 14
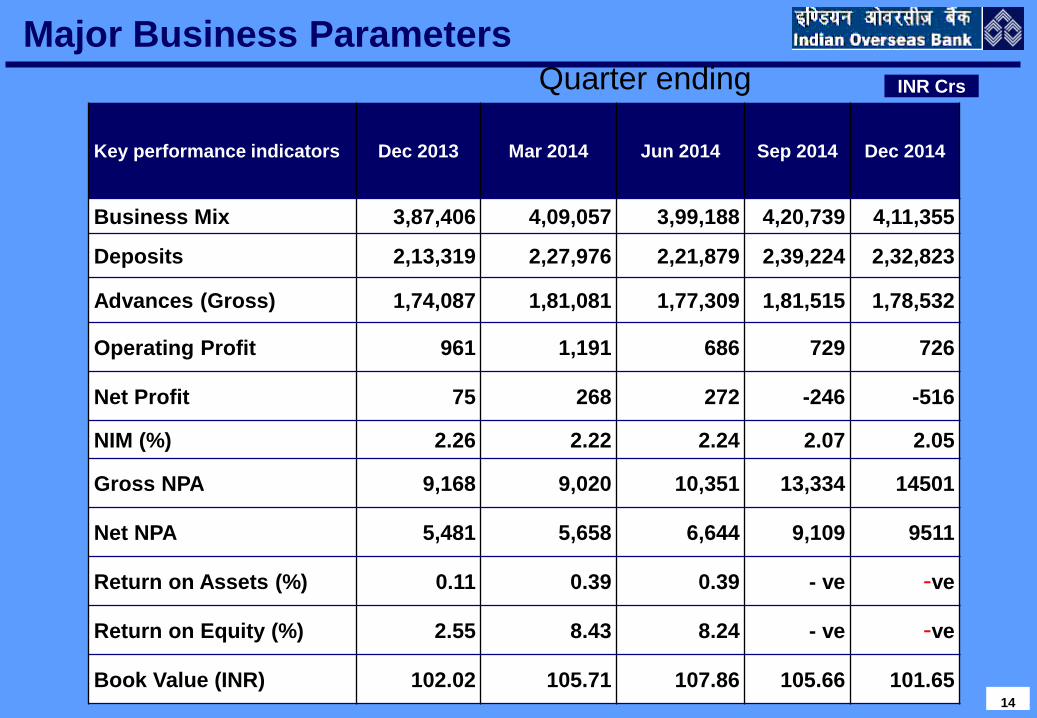
Major Business Parameters
Key performance indicators Dec 2013 Mar 2014 Jun 2014 Sep 2014
Dec 2014
Business Mix 3,87,406 4,09,057 3,99,188 4,20,739 4,11,355
Deposits 2,13,319 2,27,976 2,21,879 2,39,224 2,32,823
Advances (Gross) 1,74,087 1,81,081 1,77,309 1,81,515 1,78,532
Operating Profit 961 1,191 686 729 726
Net Profit 75 268 272 -246 -516
NIM (%) 2.26 2.22 2.24 2.07 2.05
Gross NPA 9,168 9,020 10,351 13,334 14501
Net NPA 5,481 5,658 6,644 9,109 9511
Return on Assets (%) 0.11 0.39 0.39 - ve -ve
Return on Equity (%) 2.55 8.43 8.24 - ve -ve
Book Value (INR) 102.02 105.71 107.86 105.66 101.65
Quarter ending INR Crs
15
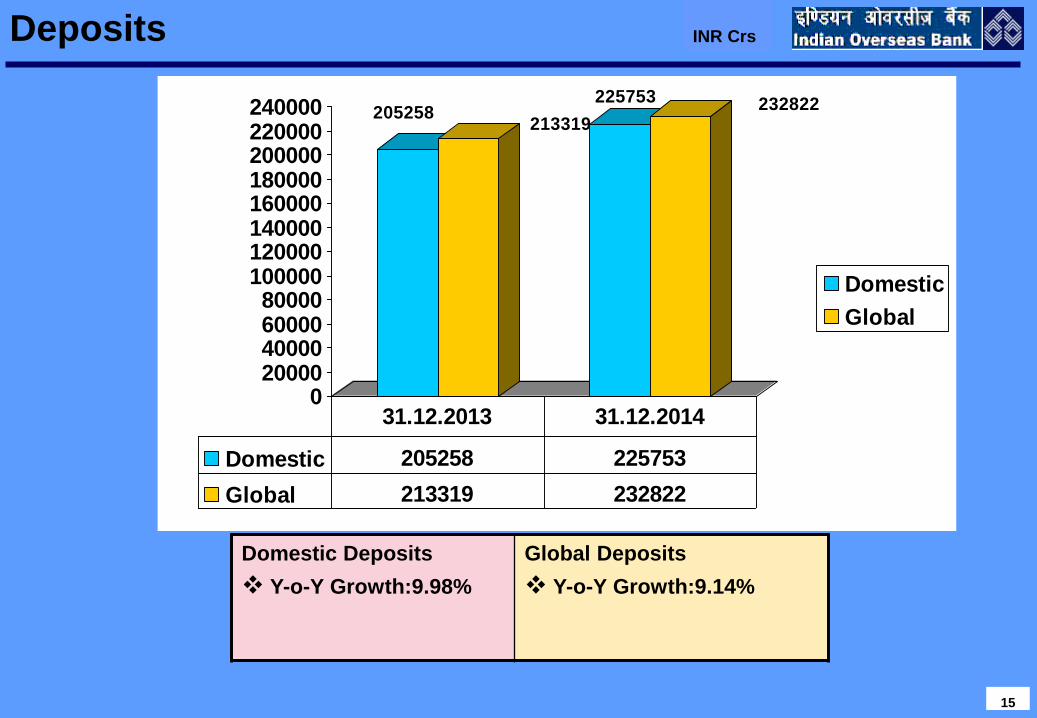
205258213319
225753 232822
020000400006000080000
100000120000140000160000180000200000220000240000
Domestic
Global
Domestic 205258 225753
Global 213319 232822
31.12.2013 31.12.2014
Domestic Deposits
Y-o-Y Growth:9.98%
Global Deposits
Y-o-Y Growth:9.14%
Deposits
INR Crs

16
CASA, Dec'13, 52800
CASA, Mar'14, 57767
CASA, Jun'14, 54367 CASA, Sep'14, 56841 CASA, Dec'14, 55833
SAVINGS, Dec'13, 40699
SAVINGS, Mar'14, 43744
SAVINGS, Jun'14, 43148
SAVINGS, Sep'14, 44553
SAVINGS, Dec'14, 44643
CURRENT, Dec'13, 12101
CURRENT, Mar'14, 14023
CURRENT, Jun'14, 11219
CURRENT, Sep'14, 12288 CURRENT, Dec'14,
11190
CASA
SAVINGS
CURRENT
Current Deposits
Y-o-Y Growth:Nil%
Savings Bank
Y-o-Y Growth: 9.69%
CASA
Y-o-Y Growth:Nil%
Share of CASA
to Aggregate
Deposits
Dec’13: 24.75%
Dec’14: 23.98%
Deposits - CASA INR Crs

17
Domestic Deposit-Category Wise
Dec 2014 INR Crs
Rural, 15,354 (7%) Semi urban,
25,848 (11%)
Urban, 53,578 (24%)
Metro, 1,30,973 (58%)

18 18
Gross Advances
31.12.2013 31.12.2014
Domestic 152,492 161,181
Global 174,087 178,532
Domestic, 31.12.2013,
152,492
Domestic, 31.12.2014,
161,181
Global, 31.12.2013,
174,087
Global, 31.12.2014,
178,532
Domestic Advances
Y-o-Y Growth:5.70%
Global Advances
Y-o-Y Growth:2.55%
INR Crs

19
Domestic Advances-Category Wise
Dec 2014 INR Crs
Rural, 18,143(11%)
Semi Urban, 19,794 (12%)
Urban, 33,438 ( 21%)
Metro, 89,806 (56%)

20 20
Key Sectors (Domestic Credits)
Sector Dec 2013 Mar 2014 Dec 2014
1.Agriculture 23,730 26,254 27,825
2.SME 21,540 24,575 23,716
of which
Micro 9,230 10,608 10,275
3.Retail Credit 16,815 17,040 17,492
INR Crs

21 21
Retail Credit (Breakup)
Sector Dec 2013 Mar 2014 Dec 2014
Retail Credit 16,815 17,040 17,492
Of which
- Housing Loans 5,707 6,078 6,625
- Misc.CC 1,301 1,356 1,365
- Pushpaka 949 1,074 1,279
- Educational Loan 3,460 3,597 3,920
- Others 1,096 1,180 1,197
Jewl Loan to Others 4,302 3,755 3,106
INR Crs
Jewel Loan to Others portfolio included in Retail Credit from 2nd Half of 2013-14

22 22
Advances to Sensitive Sectors - Domestic
INR Crs
Sector Dec 2013 Mar 2014 Dec 2014
CAPITAL MARKET 819 713 535
REAL ESTATE 19,620 22,153 23,263
of which
HOUSING LOAN * 6,872 8,246 9,129
COMMERCIAL REAL ESTATE 7,850 8,630 8,896
OTHERS
(DIRECT & INDIRECT) 4,898 5,277 5,238
(FUND + NON FUND)
* Includes Non-Priority Housing Loans

23
Dec 2013 Mar 2014 Dec 2014
Trade 8,298 7,538 6,710
Manufacturing 6,758 6,761 6,568
Real Estate 295 381 278
Buyers Credit 3,494 1,752 1,890
Others 2,750 2,651 1,068
Total 21,595 19,083 16,514
INR Crs
Overseas Advances - Breakup

24
RESTRUCTURED STANDARD ACCOUNTS
(INCLUDES ALL F.B. FACILITIES OF THE BORROWER)
Domestic Foreign Global
> 1 crore < 1 crore Total
As on 30.09.2014 17064.57 83.27 17147.84 448.82 17596.66
Addition during Q3
of 14-15
3912.11 26.69 3938.80 3.76 3942.56
Less: Repayment
in Restructured
A/Cs (COMPLETED 2 YEARS IN
RESTRUCTURED A/C)
1264.56 31.02 1295.58 4.81 1300.39
As on 31.12.2014 19712.12 78.94 19791.06 447.77 20238.83
INR Crs

Restructured Accounts Outstanding Position As On 31.12.2014
25
INR Crs
Contd…..
Sector 31.03.2014
Accounts
31.03.2014
Amount
31.03.2014
%
31.12.2014
Accounts
31.12.2014
Amount
31.12.2014
%
Chemical & Pharma 5 122.74 0.87 7 99.84 0.49
Sugar 3 62.53 0.44 5 201.30 0.99
Textile 11 436.42 3.08 28 951.26 4.70
Iron & Steel 28 1725.28 12.19 35 2486.72 12.29
Auto & Ancillary 3 375.88 2.66 5 395.22 1.95
Paper 3 230.57 1.63 11 305.95 1.51
Food Processing 2 38.82 0.27 6 574.66 2.84
Engineering 13 1155.15 8.16 16 1382.98 6.83
Telecom 5 1130.71 7.99 5 1013.85 5.01
Metal Processing 4 651.39 4.60 8 775.20 3.83
Power 14 3212.16 22.69 12 4511.38 22.29
Airways 1 921.67 6.51 1 597.68 2.95
Electronic & Software 1 26.86 0.19 2 183.74 0.92
Cement 1 85.07 0.60 4 431.99 2.13
Logistics 3 83.66 0.60 6 402.51 1.99
Other industries 11 529.98 3.74 9 376.58 1.86
Sub Total 108 10788.89 76.22 160 14690.86 72.58

26
Restructured Accounts Outstanding Position As On 31.12.2014 .. contd INR Crs
Sector 31.03.2014 Accounts
31.03.2014 Amount
31.03.2014 %
31.12.2014 Accounts
31.12.2014 Amount
31.12.2014 %
Sub Total 108 10788.89 76.22 160 14690.86 72.58
SME 240 590.90 4.17 258 819.43 4.05
Micro Finance 8 117.91 0.83 4 43.56 0.22
Infrastructure 17 1491.72 10.54 20 3204.56 15.83
Comm. Real Estate(CRE) 6 120.01 0.86 4 73.22 0.36
Trade 27 210.98 1.49 33 734.82 3.63
Agriculture 423 280.68 1.98 255 308.29 1.52
HL/EDU/Others 397 38.56 0.27 182 119.10 0.59
Real Estate (other than CRE)
5 464.19 3.28 2 70.68 0.35
Ceramic, Granite, Marble 3 37.28 0.27 3 37.97 0.19
Rubber & Plastic 0 0.00 0.00 1 11.79 0.06
Gem & Jewels 1 13.25 0.09 0 0.00 0.00
Wood 0 0.00 0.00 2 124.55 0.62
GRAND TOTAL 1235 14154.37 100.00 924 20238.83 100

27
Asset Classification wise details of Restructured Accounts
Outstanding
Asset Classification
No. of
Accounts
(31.03.2014)
Amount
(INR Crs)
(31.03.2014)
% to
Total
No. of
Accounts
(31.12.2014)
Amount
(INR Crs)
(31.12.2014)
% to
Total
Standard Assets 823 12314 87 592 16392.90 81
Sub-Standard
Assets
335 1560 11 262 3317.98 16
Doubtful Assets 77 280 2 70 527.95 3
Total 1235 14154 100 924 20238.83 100
RESTRUCTURED Accounts slipped - ( INR 1 Crore & above)-Domestic
Dec 13 Mar 14 Jun 14 Sep 14 Dec 14
No. of A/cs slipped
during the quarter
13 16 17 12 8
Amount in INR Crs 503 913 590 987 451

28 28
NPA Ratio
Gross, Dec 13, 5.27 Gross, Mar 14,
4.98
Gross, Jun 14, 5.84
Gross, Sep 14, 7.35
Gross, Dec 14, 8.12
Net, Dec 13, 3.24 Net, Mar 14, 3.2
Net, Jun 14, 3.85
Net, Sep 14, 5.17
Net, Dec 14, 5.52
Gross
Net
%

29 29
NPA SEQUENTIAL MOVEMENT
Dec 2013 Mar 2014 Jun 2014 Sep 2014 Dec 2014
OPENING GROSS NPA 8202 9168 9020 10351 13334
ADD Slippages 1650 2275 2649 4524 2269
LESS
Cash Recovery
Upgradation
Write Off
Sale to ARC
207
135
342
411
465
564
983
266
142
321
589
337
464
292
448
360
251
491
0
Total Reduction in NPA
684
2423
1318
1541
1102
Total Nettable Credits 3687 3362 3707 4225 4990
NPA Provision 3666 3342 3687 4205 4970
Other Credits 21 20 20 20 20
CLOSING GROSS NPA 9168 9020 10351 13334 14501
Net NPA 5481 5658 6644 9109 9511
Gross NPA Ratio 5.27% 4.98% 5.84% 7.35% 8.12%
Net NPA Ratio 3.24% 3.20% 3.85% 5.17% 5.52%
Provision Coverage Ratio 56.59% 54.94% 52.85% 48.74% 50.03%
NPA of Overseas Branches (included in Gross NPA above)
1310 1182 1570 1826 1820
INR Crs

30
Sector Wise Break Up of NPAs
as of 31.12.2014 (Domestic)
Category NPA as of
31.12.2014
% to total Domestic
NPA
Agriculture 2007.23 15.83
Industry 8026.57 63.30
Services 1675.07 13.21
Personal 971.97 7.66
Total 12680.84 100.00
Of which
Commercial Real Estate 590.59 4.66
INR Crs
31
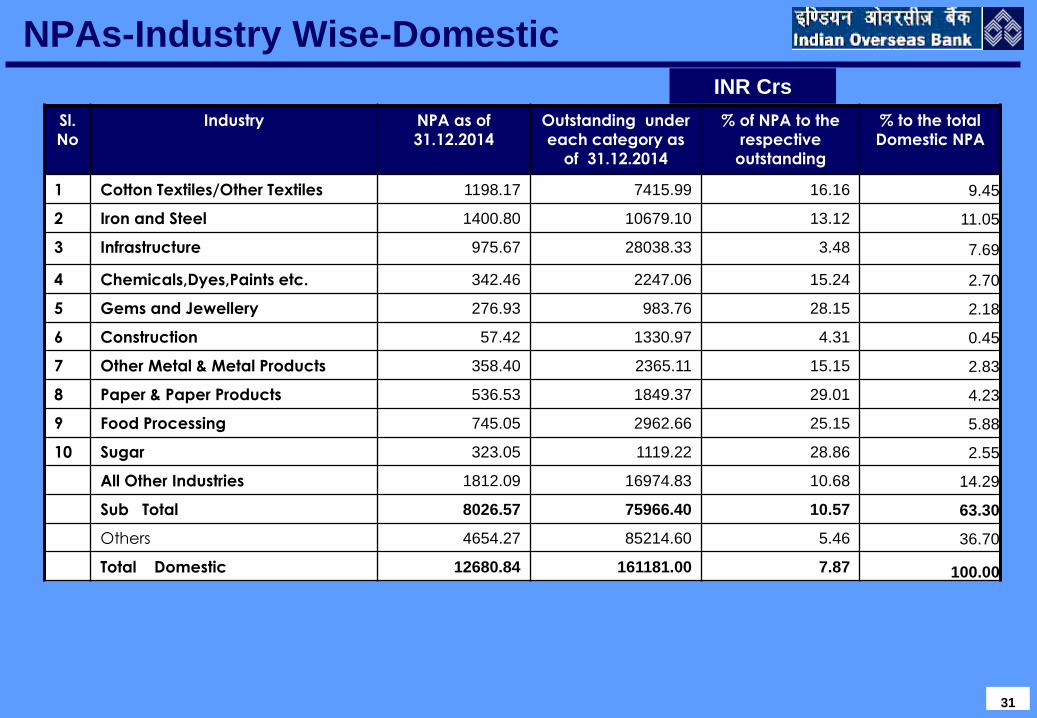
NPAs-Industry Wise-Domestic
Sl.
No
Industry NPA as of
31.12.2014
Outstanding under
each category as
of 31.12.2014
% of NPA to the
respective
outstanding
% to the total
Domestic NPA
1 Cotton Textiles/Other Textiles 1198.17 7415.99 16.16 9.45
2 Iron and Steel 1400.80 10679.10 13.12 11.05
3 Infrastructure 975.67 28038.33 3.48 7.69
4 Chemicals,Dyes,Paints etc. 342.46 2247.06 15.24 2.70
5 Gems and Jewellery 276.93 983.76 28.15 2.18
6 Construction 57.42 1330.97 4.31 0.45
7 Other Metal & Metal Products 358.40 2365.11 15.15 2.83
8 Paper & Paper Products 536.53 1849.37 29.01 4.23
9 Food Processing 745.05 2962.66 25.15 5.88
10 Sugar 323.05 1119.22 28.86 2.55
All Other Industries 1812.09 16974.83 10.68 14.29
Sub Total 8026.57 75966.40 10.57 63.30
Others 4654.27 85214.60 5.46 36.70
Total Domestic 12680.84 161181.00 7.87 100.00
INR Crs

32
Sectoral Slippages during the quarter ended 31.12.2014
Category Amount(In Crs)
Agriculture 408.73
Services ( Other than Commercial Real Estate) 422.84
Personal 192.39
Commercial Real Estate 328.58
Sub Total 1352.54
Industry
Other Metals 14.27
Gem and Jewellery 4.30
Food Processing(Other than sugar,Vegetable Oil ,Vanaspathi & Tea) 16.88
Textile 164.08
Steel 181.38
Mining 0.00
Chemicals, Dyes, Drugs & Pharma 39.90
Paper 31.42
Rubber and Rubber Products 24.87
All Engineering/All other Industries 109.85
Other Industries 180.05
Sub Total (Industry) 767.00
Total Slippages – Domestic 2119.54
Overseas 149.15
Total-Global 2268.69

33
Dec 2013 Mar 2014 Dec 2014
Trade 790.75 786.70 1,088.54
Manufacturing 277.78 118.45 496.02
Real Estate 66.03 64.08 70.74
Others 175.39 212.88 164.36
TOTAL 1309.95 1,182.11 1,819.66
INR Crs
Overseas NPAs

34 34
Profitability (Quarter Sequential)
Net Interest Income, Dec
13, 1398
Net Interest Income, Mar
14, 1411
Net Interest Income, Jun
14, 1427
Net Interest Income, Sep
14, 1344
Net Interest Income, Dec
14, 1357
Operating Profit, Dec 13,
961
Operating Profit, Mar 14,
1191
272
Operating Profit, Sep 14,
729
Operating Profit, Dec 14,
726
Net Profit, Dec 13, 75
Net Profit, Mar 14, 268
686
Net Profit, Sep 14, -245
Net Profit, Dec 14, -516
Net Interest Income
Operating Profit
Net Profit
INR Crs

35 35
PROFIT - SUMMARY
Dec 13 Mar 14 Jun 14 Sep 14 Dec 14
Interest Earned 5,737 5,875 6,007 5,962 6,059
Interest Expended 4,339 4,464 4,580 4,618 4,702
Net Interest Income 1,398 1,411 1,427 1,344 1,357
Non Interest Income 453 601 278 478 588
Total Operating Income 1,851 2,012 1,705 1,822 1,945
Operating Expenses 890 821 1,018 1,093 1,219
Operating Profit 961 1,191 686 729 726
Total Provision 886 923 414 975 1242
Net Profit 75 268 272 -246 -516
INR Crs
Quarter Ending

36 36
PROFITABILITY - Q3
INR Crs
Particulars Q3 13-14 Q3 14-15 Variance %
TOTAL INCOME 6190 6647 7.38
Interest Earned 5737 6059 5.61
Other Income 453 588 29.80
TOTAL EXPENDITURE
(excl. provisions and contingencies)
5229 5921 13.23
Interest Expended 4339 4702 8.37
Operating Expenses 890 1219 36.97
i)Payments to and provisions for employees 587 851 44.97
ii)Other Operating Expenses 303 368 21.45
OPERATING PROFIT
(profit bef. provisions and contingencies)
961 726 -ve
Total Provisions and Contingences 886 1242 40.18
Of which Provisions for NPAs 688 1157 68.17
Provision for Taxes 74 59 -ve
Others 123 26 -ve
NET PROFIT 75 -516 -ve

37 37
PROFIT – Geographical Distribution – Q3
INR Crs
Particulars Q3 13-14 Q3 14-15 Variance %
OPERATING PROFIT
Global 961 726 -ve
Domestic 840 633 -ve
Overseas 121 93 -ve
PROVISIONS
Global 886 1242 40.18
Domestic 769 1152 49.80
Overseas 117 90 -ve
NET PROFIT
Global 75 -516 -ve
Domestic 71 -519 -ve
Overseas 4 3 -ve

38 38
PROFIT - NET INTEREST INCOME
Particulars Dec 13 Mar 14 Jun 14 Sep 14 Dec 14
Total Interest Income 5,737 5,875 6,007 5,962 6,059
Of which
Int Income from Advances 4,339 4,424 4,565 4,504 4,533
Int. Income from Investments 1,285 1,297 1,291 1,324 1,398
Other Interest Income 113 153 151 134 128
Total Interest Expended 4,339 4,464 4,580 4,618 4,702
Of which
Int. Expended on Deposits 3,889 4,072 4,225 4,301 4,410
Int. Expended on borrowings 297 243 206 169 292
Other Int. Expenses 153 149 149 148 0
NET INTEREST INCOME 1,398 1,411 1,427 1,344 1,357
NET INTEREST MARGIN
Domestic
Overseas
2.26%
2.32%
1.74%
2.22%
2.26%
1.94%
2.24%
2.26%
2.04%
2.07%
2.09%
1.91%
2.05%
2.09%
1.67%
INR Crs Quarter Ending

39 39
PROFIT - NET INTEREST INCOME
INR Crs
Particulars Q3 13-14 Q3 14-15
Variance %
Total Interest Income 5,737 6,059 5.61
Of which
Int Income from Advances 4,339 4,533 4.47
Int. Income from Investments 1,285 1,398 8.79
Other Interest Income 113 128 13.27
Total Interest Expended 4,339 4,702 8.37
Of which
Int. Expended on Deposits 3,889 4,410 13.40
Int. Expended on borrowings 297 292 -ve
Other Int. Expenses 153 0 -
NET INTEREST INCOME 1,398 1,357 -ve
NET INTEREST MARGIN in %
(on avg. earning assets)
Domestic
Overseas
2.26%
2.32%
1.74%
2.05%
2.09%
1.67%

40 40
PROFIT - NET INTEREST INCOME
INR Crs
Particulars 9m 13-14 9m 14-15
Variance %
Total Interest Income 16,809 18,029 7.26
Of which
Int Income from Advances 12,865 13,602 5.73
Int. Income from Investments 3,707 4,013 8.25
Other Interest Income 237 414 74.68
Total Interest Expended 12,643 13,900 9.94
Of which
Int. Expended on Deposits 11,337 12,936 14.10
Int. Expended on borrowings 1,306 964 -ve
Other Int. Expenses 0 0 -ve
NET INTEREST INCOME 4,166 4129 -ve
NET INTEREST MARGIN in %
(on avg. earning assets)
Domestic
Overseas
2.30
2.37
1.63
2.12
2.15
1.85

41 41
Non Interest Income (Quarterly Comparison)
Particulars Dec 13 Mar 14 Jun 14 Sep 14 Dec 14
Total Non Interest Income 453 601 278 478 588
Of which
Exchange / Commission 215 292 236 243 228
Profit on Sale of Investments 32 46 90 46 126
Profit on Revaluation Of
Investments 0 0 -253 0 0
Recovery in written off Accounts 47 113 88 55 93
Other Non interest Income 159 150 117 134 141
INR Crs
Quarter Ending

42 42
Non Interest Income -Q3
INR Crs
Particulars Q3 13-14 Q3 14-15
Variance
%
Total Non Interest Income 453 588 29.80
Of which
Exchange / Commission 215 228 6.05
Profit on Sale of Investments 32 126 293.75
Profit on Revaluation Of Investments 0 0 0
Recovery in written off accounts 47 93 97.87
Other Non interest Income 206 141 -ve

43 43
Non Interest Income -9m
INR Crs
Particulars 9m 13-14 9m 14-15
Variance
%
Total Non Interest Income 1,568 1,344 -ve
Of which
Exchange / Commission 637 707 10.99
Profit on Sale of Investments 443 262 -ve
Profit on Revaluation Of Investments -105 -253 -ve
Recovery in written off accounts 189 236 0
Other Non interest Income 404 392 -ve

44 44
NET PROFIT (Quarterly Comparison)
Particulars Dec 13 Mar 14 Jun 14 Sep 14 Dec 14
OPERATING PROFIT 960.73 1191.09 686.41 729.44 726.32
Total Provision 885.66 922.76 414.69 974.95 1242.35
Of which
NPA 688.29 313.43 524.33 845.08 1156.97
Provision for un hedged Foreign
Currency Exposure
0.00 0.00 29.35 -13.50 3.69
Standard Advances 35.93 105.15 15.67 -88.82 -81.62
Depreciation on Investments 17.75 418.08 -505.93 102.12 -11.71
Staff Welfare Fund 4.00 5.00 4.50 4.50 4.50
Deferred Tax Liability 0.00 -133.00 0.00 0.00 0.00
Income Tax 74.42 174.98 115.41 82.58 59.31
Wealth Tax 0.00 0.72 0.00 0.00 0.00
Contingencies 0.58 16.36 0.55 1.62 0.40
Other General Provisions 0.00 0.00 0.00 0.00 0.00
Non Performing Investments 0.00 0.00 3.85 10.62 16.60
Diminution of Securities 0.00 -0.18 0.00 0.00 0.00
Restructured accounts 60.75 18.43 226.13 32.82 94.79
Other Assets 0.00 1.88 0.00 0.78 0.17
Country-wise risk 3.94 1.90 0.83 -2.86 -0.75
NET PROFIT 75.07 268.33 271.72 -245.51 -516.03
INR Crs
Quarter Ending
45 45
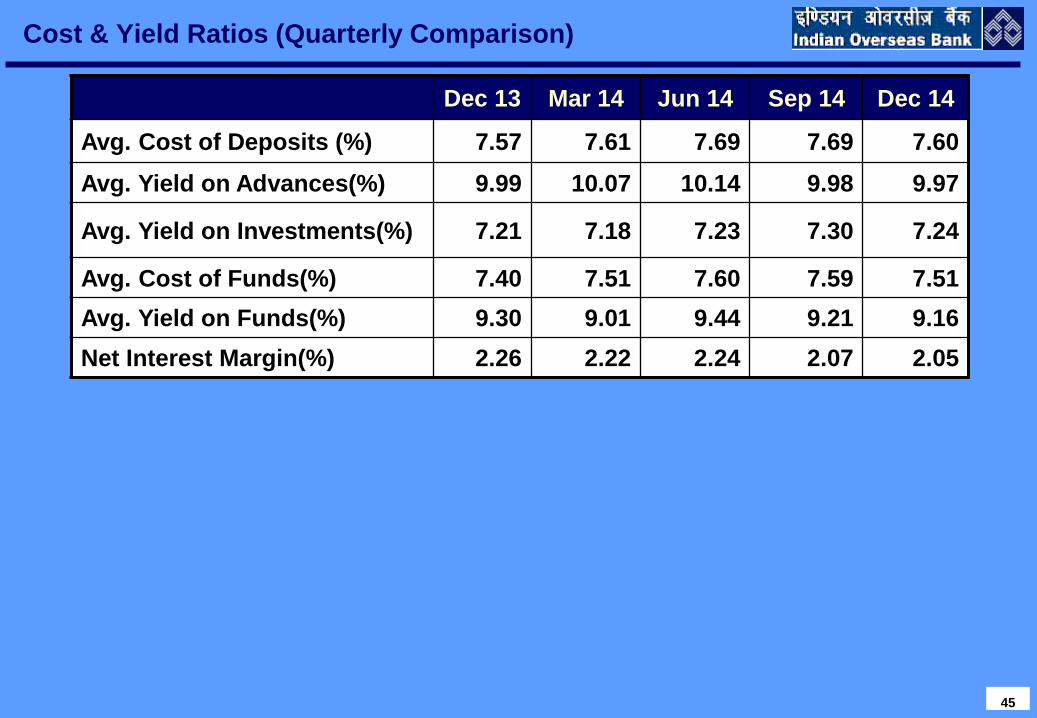
Cost & Yield Ratios (Quarterly Comparison)
Dec 13 Mar 14 Jun 14 Sep 14 Dec 14
Avg. Cost of Deposits (%) 7.57 7.61 7.69 7.69 7.60
Avg. Yield on Advances(%) 9.99 10.07 10.14 9.98 9.97
Avg. Yield on Investments(%) 7.21 7.18 7.23 7.30 7.24
Avg. Cost of Funds(%) 7.40 7.51 7.60 7.59 7.51
Avg. Yield on Funds(%) 9.30 9.01 9.44 9.21 9.16
Net Interest Margin(%) 2.26 2.22 2.24 2.07 2.05
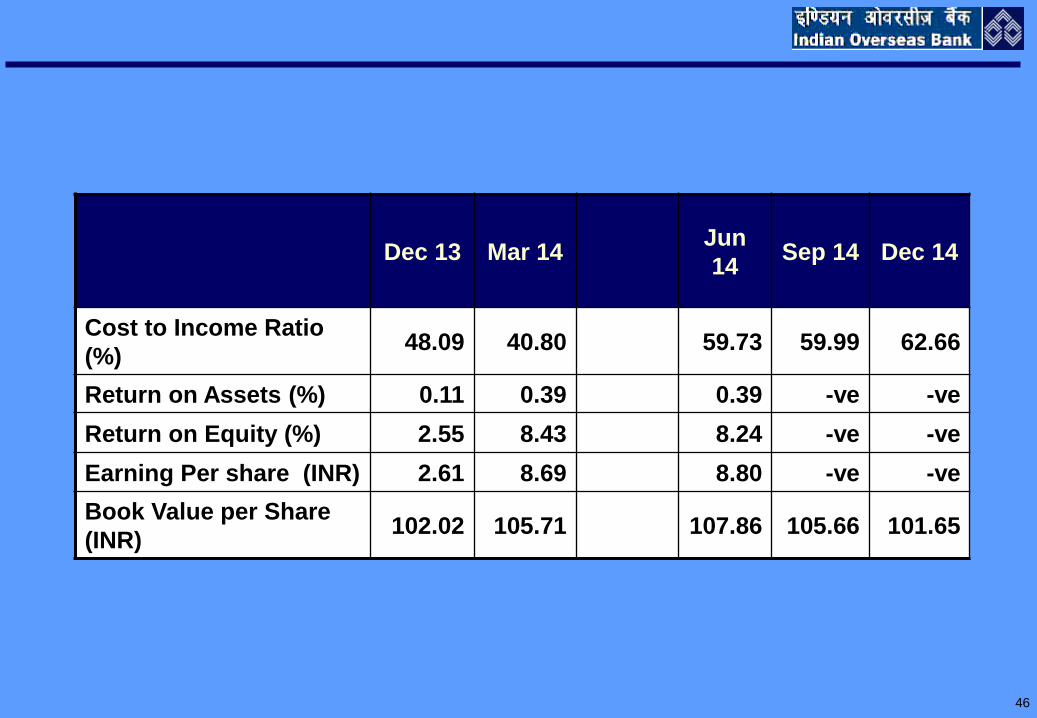
46
Dec 13
Mar 14
Jun
14 Sep 14 Dec 14
Cost to Income Ratio
(%) 48.09 40.80 59.73 59.99 62.66
Return on Assets (%) 0.11 0.39 0.39 -ve -ve
Return on Equity (%) 2.55 8.43 8.24 -ve -ve
Earning Per share (INR) 2.61 8.69 8.80 -ve -ve
Book Value per Share
(INR) 102.02 105.71 107.86 105.66 101.65

47 47
INVESTMENTS - Domestic
31.03.2014 31.12.2014
AFS HTM HFT TOTAL AFS HTM HFT TOTAL
SLR Investments 10175.35 49086.84 72.92 59335.11 13414.42 51497.93 192.67 65105.02
Of which
Government. Securities 10123.52 49083.73 72.92 59280.17 13362.55 51494.82 192.67 65050.04
Other Approved
Securities 51.83 3.11 0.00 54.94 51.87 3.11 0 54.98
M Duration (for SLR) 5.68 5.82
Non SLR Investments 8346.35 322.08 2.30 8670.73 7607.66 315.38 9.77 7932.81
M Duration (Non SLR) 4.14 5.15
M Duration
(Entire Portfolio) 4.06 6.21 5.98 5.66 5.78
Total 18521.70 49408.92 75.22 68005.84 21022.08 51813.31 202.44 73037.83
INR Crs

48 48
INVESTMENTS – Foreign -31.12.2014
Type of Investment Book Value
(Gross)
Total
Provision
G - Sec 2,447.45 1.21
Bonds - Others 9.61 -
MTN,FCCB 790.63 59.86
Shares 0.10 -
Joint Venture - Malaysia 199.58 -
Total 3,447.37 61.07
INR Crs

49 49
CAPITAL ADEQUACY
Dec 13 Mar 14 Jun 14 Sep 14 Dec 14
Tier I Capital
BASEL II
BASEL III
12,891.74
14,068.15
13,853.25
13,910.48
13,910.88
13,915.87
Tier II Capital
BASEL II
BASEL III
6,052.06
6,484.32
6,135.49
6,026.92
5,708.60
5,596.26
Total Capital
BASEL II
BASEL III
18,943.80
20,552.47
19,988.73
19,937.40
19,619.48
19,512.13
Common Equity Tier I 12,284.74 13,314.25 13,361.48 13,361.88 13,366.87
Total Net Assets (Terminal) 2,65,372.53 2,74,904.84 2,76,240.20 2,80,908.77 2,76,948.97
Risk Weighted Assets
BASEL II
BASEL III
1,72,306.53
1,84,389.06
1,85,476.43
1,87,945.44
1,90,589.50
1,90,218.10
1,92,266.93
CRAR – TIER I (%)
BASEL II
BASEL III
7.48
7.63
7.47
7.40
7.30
7.39
7.24
CRAR – TIER II (%)
BASEL II
BASEL III
3.51
3.52
3.31
3.21
3.00
2.85
2.91
CRAR (%)
BASEL II
BASEL III
10.99
11.15
10.78
10.61
10.30
10.24
10.15
CET I 7.13 7.18 7.11 7.01 6.95
INR Crs

50 50
PRODUCTIVITY Business per Branch,
Dec 13, 125.62 Business per Branch, Mar 14, 125.02
Business per Branch, Jun 14, 120.16
Business per Branch, Sep 14, 125.86 122.46
Dec 13Mar 14Jun 14Sep 14Dec 14
Business per Employee, Dec 13, 12.65
Business per Employee, Mar 14, 13.67
Business per Employee, Jun 14, 12.77
Business per Employee, Sep 14, 12.85 Business per Employee,
Dec 14, 12.61 Business perEmployee
INR Crs

51
Financial Inclusion
Basic Savings Bank Deposit Accounts (BSBDA): As per the guidelines issued by Reserve Bank of India,
our branches are opening BSBD Accounts to bring the excluded segment of population into banking fold.
General Purpose Credit Cards (GCC), Kissan Credit Cards (KCC) and Temporary Over Draft (TOD) against
BSBD Accounts are granted to meet their Credit requirements.
Smart Card Banking: To extend banking service to the villages and provide banking outlet in unbanked
centres, our Bank has introduced Smart Card Banking. Under this method villagers can operate their account
with Bio-Metric Smart Card at the Hand Held Device with a Business Correspondent.
Progress under Financial Inclusion Furnished below:
SI. No. Particulars 31.12.2013
(Nos)
31.03.2014
(Nos.)
31.12.2014
(Nos)
1 No-Frills /BSBA Accounts Opened 58,55,790 59,21,110 84,14,594
2 General Purpose Credit Cards Granted 13,744 # 4,48,246 4,45,461
3 Branches Under Smart Card Banking 833 866 1,065
4 Villages Covered Under Smart Card Banking 3,211 3,838 4,229
5 Business Correspondents engaged 2,392 2,456 2,815
6 Bio-Metric Smart Card issued 9,76,422 11,05,215 14,71,745
7 Smart Card Banking Coverage- Regions 55 56 56
8 Smart Card Banking Coverage-States/Union
Territory
21/2 21/2 21/2
# Based on the recent RBI guidelines in reporting Gcc Data

52
PRADHAN MANTRI JAN-DHAN YOJANA
“Economic resources of the country should be utilised
for the well-being of the poor.
The Change will commence from this point.” - PM
In Independence Day speech, Our PM had announced the PRADHAN MANTRI JAN - DHAN
YOJANA as a National Mission on Financial Inclusion with an ambitious objective of covering all
households in the country with banking facilities and having a bank account for each household. This is
important for including people left out into the mainstream of the financial system.
Our bank actively participated in PMJDY scheme and opened 24,05,850 accounts as on 31.12.2014.
We issued 22,89,281 RUPAY DEBIT CARD as on 31.12.2014

53 53
Thank You