december 2001 - fisk university · education and general revenues ... 1946 – 1956 stephen j....
TRANSCRIPT

DECEMBER
2001
OFFICE OF INSTITUTIONAL RESEARCH FISK UNIVERSITY
The Fact Book 2001-2002
Fisk University Nashville, TN 37208-3051

2001 Fisk University Fact Book
INTRODUCTION Page i
INTRODUCTION.......................................................................................................................... 1
QUICK FACTS......................................................................................................................... 2
A STATEMENT OF PURPOSE ............................................................................................. 3
THE MISSION.......................................................................................................................... 3
BOARD OF TRUSTEES.......................................................................................................... 4
HIGHLIGHTS OF FISK’S HISTORY .................................................................................. 5
PRESIDENTS OF FISK UNIVERSITY ................................................................................ 7
ORGANIZATIONAL CHART ............................................................................................... 8
ADMINISTRATION ................................................................................................................ 9
ACADEMIC CALENDAR .................................................................................................... 11
STUDENT AND ACADEMIC PROGRAM PROFILE ............................................................. 12
QUICK FACTS....................................................................................................................... 13
ADMISSIONS ......................................................................................................................... 14
FINANCIAL AID.................................................................................................................... 19
ENROLLMENT...................................................................................................................... 21
MAJOR PROGRAMS............................................................................................................ 26
CREDIT HOURS.................................................................................................................... 27
CLASS SIZE............................................................................................................................ 31
ACADEMIC ACHIEVEMENT ............................................................................................ 33
DISTRIBUTION OF GRADES............................................................................................. 34
DEGREES CONFERRED ..................................................................................................... 35
RETENTION AND GRADUATION RATES...................................................................... 40
FACULTY/STAFF PROFILES.................................................................................................. 41
QUICK FACTS....................................................................................................................... 42
FISK UNIVERSITY INSTRUCTIONAL FACULTY........................................................ 43
RESEARCH FACULTY........................................................................................................ 46
FACULTY STATISTICS....................................................................................................... 47
GENERAL INFORMATION...................................................................................................... 55
FACILITIES ........................................................................................................................... 66
STUDENT AFFAIRS ............................................................................................................. 66
INSTITUTIONAL ADVANCEMENT ................................................................................. 69
ALUMNI.................................................................................................................................. 70

2001 Fisk University Fact Book
INTRODUCTION Page ii
FINANCES .................................................................................................................................. 73
FINANCIAL PROFILE ......................................................................................................... 74
CURRENT FUND REVENUES, EXPENDITURES AND BALANCES .......................... 75
CURRENT FUND REVENUES............................................................................................ 76
EDUCATION AND GENERAL REVENUES..................................................................... 77
CURRENT FUND EXPENDITURES .................................................................................. 78
PERCENT DISTRIBUTION OF .......................................................................................... 79
EDUCATION AND GENERAL EXPENDITURES ........................................................... 79
STATEMENTS OF CURRENT FUNDS, REVENUES,..................................................... 80
EXPENDITURES, AND OTHER CHANGES .................................................................... 80

2001 Fisk University Fact Book
INTRODUCTION Page 1
INTRODUCTION The Fisk University Factbook is an annual compilation of academic and financial statistical data about the university. It provides a snapshot of our operations that can be used to help evaluate institutional effectiveness. The academic data is concentrated on the fall semester of the year, since this is the semester of record for most external reports. Certain functions, such as graduation and financial reporting, lend themselves to being expressed for the entire academic and fiscal years and are so reported.

2001 Fisk University Fact Book
INTRODUCTION Page 2
Fisk College and Normal School
• The Fisk College and Normal School opened for classes January 9, 1866.
Fisk University
• Fisk School was incorporated as Fisk University August 12, 1867. • The original Fisk Jubilee Singers departed Nashville October 6, 1871, to raise money for the
University. • Jubilee Hall was formally dedicated in 1876 becoming the first permanent structure built in
America for educating African Americans. • In 1930, Fisk becomes the first historically black college to gain accreditation by the Southern
Association of Colleges and Schools. • Professional Accreditations:
American Chemical Society National Association of Schools of Music
Council of Graduate Schools International Assembly for Collegiate Business Education
• Fisk University’s Academic Calendar is based on the semester system. • Degrees offered are: • Bachelor of Arts • Bachelor of Music • Bachelor of Science • Master of Arts
Rankings Fisk University ranked among the National Liberal Arts Colleges by U.S. News and World Report in its 2001 Edition of “America’s Best Colleges.” The National Science Foundation ranks Fisk University as one of the highest per capita producers in the nation for the number of its African American Baccalaureates who go on to earn the Doctorate in the Natural Sciences. For the fifth consecutive year Fisk is included in Princeton Reviews “Top 300 Colleges and Universities.”
QUICK FACTS

2001 Fisk University Fact Book
INTRODUCTION Page 3
Since it’s founding in 1866, Fisk has committed itself to providing an excellent liberal arts education for students irrespective of race, sex, and religion. While from its earliest days the university has exhibited a concern for the needs and problems of black Americans, it has always been an academic haven to all citizens of America and the world. Indeed, of the eight members of the first graduating class, two were white and five were women. Fisk University’s traditional mission of leadership development and support for pioneering research is conducted in an atmosphere of respect for ethnic diversity. As the twenty-first century begins, opportunities for leaders from all ethnic segments of America are increasing. The cultural landscape of our world demands leaders who possess the skill, knowledge, and vision and values that enable them to work effectively with others. Historically black institutions are among the best examples of colleges and universities that preserve cultural heritage, offer academic excellence and present leadership opportunities to black students and other ethnic groups. The mission of Fisk University is to provide a liberal arts education of highest quality. The University’s primary goal is to prepare students to be skilled, resourceful, and imaginative leaders who can effectively address the challenges of life in a technological society, a pluralistic nation and a multicultural world.
A STATEMENT OF PURPOSE
THE MISSION

2001 Fisk University Fact Book
INTRODUCTION Page 4
Table 1.1 Members of the Board of Trustees (2001-2002 Academic Year) Member Resident City Carolyn Baldwin Byrd Atlanta, GA Paula A. Banks Chicago, IL Carolyn J. Booker Doraville, GA Barbara L. Bowles Chicago, IL Kyle Brazile Chicago, IL Davis H. Carr, Vice Chair Nashville, TN Virgis W. Colbert, Chair Milwaukee, WI Gwendolyn S. Cruzat Detroit, MI Delbert C. Glover Haydenville, MA Reynaldo P. Glover New York, NY Ernest G. Green Washington, DC Ann B. Holiday Wilmington, DE Adrienne Lash Jones Shaker Heights, OH Harold W. Kelley Chicago, IL C. Lewis Lavine Nashville, TN Leatrice B. McKissack Nashville, TN Robert W. Norton (New York), NY Aaronetta H. Pierce San Antonio, TX Carolynn Reid-Wallace Nashville, TN Thomas C. Rozzell Washington, DC Donna J. Rawls Nashville, TN Michael D. Shmerling Nashville, TN Yvonne E. Thompson, Secretary Holland, OH Walter C. Watkins, Jr. Detroit, MI Eugene A. White Shaker Heights, OH
BOARD OF TRUSTEES

2001 Fisk University Fact Book
INTRODUCTION Page 5
Table 1.2 Selected Events from Fisk’s History Year Event 1865 John Ogden, the Reverend Erastus Milo Cravath, and the Reverend Edward P. Smith
established the Fisk School in Nashville. 1866 On January 9, Fisk convened its first classes. 1867 On August 12, Fisk School was incorporated as Fisk University. 1871 On October 6, the original Jubilee Singers departed Fisk to raise money. 1873 January 1, groundbreaking ceremony held for Jubilee Hall. 1875 Reverend E. M. Cravath became the first President of Fisk University.
Fisk graduated its first class consisting of eight students that included two women and two whites.
1876 Jubilee Hall was formally dedicated. 1878 Fisk’s first Missionaries, Albert P. Miller and Andrew E. Jackson, graduated. Upon
leaving the Mendi Mission, Miller in a short address left Fisk its motto: “Her Sons and Daughters Are Ever On The Alter.”
1880 The Mozart Society, the first Musical Organization in Tennessee, was formed. In later years, the Society becomes the Fisk University Choir.
1882 Livingston Hall was erected through a $60,000 gift by Mrs. Valerie Stone. 1883 The Fisk Herald began. 1884 The Fisk Alumni Association was founded. 1885 The Music Department was created. 1888 W.E.B. DuBois graduated. 1889 The Gymnasium and workshop (presently Van Vechten Art Gallery) was created. 1891 Bennett Hall, named from the Reverend H.S. Bennett, was erected at the cost of
$25,000. 1892 Fisk Memorial Chapel was built with a legacy of $25,000 from the estate of Clinton B. Fisk. 1893 First Football Team was organized. 1901 James G. Merrill became the second President of Fisk. 1906 Chase Hall (Science Building) was erected on the site where the statue of W.E.B.
DuBois now stands. 1908 The Carnegie Library (now the Academic Building) was erected. 1909 George A. Gates was elected third President of Fisk. 1915 Fayette A. McKenzie became the fourth President of Fisk. 1925 Fisk students strike against the Administration policies of President McKenzie on
February 4. 1926 Thomas E. Jones was selected the fifth President of Fisk. 1927 The Fisk News was established as an Alumni Publication; Fisk celebrated its first
Homecoming. 1930 Fisk became the first Historically Black College to gain accreditation by the Southern
Association of Colleges and Schools.
HIGHLIGHTS OF FISK’S HISTORY
2001 Fisk University Fact Book
INTRODUCTION Page 6
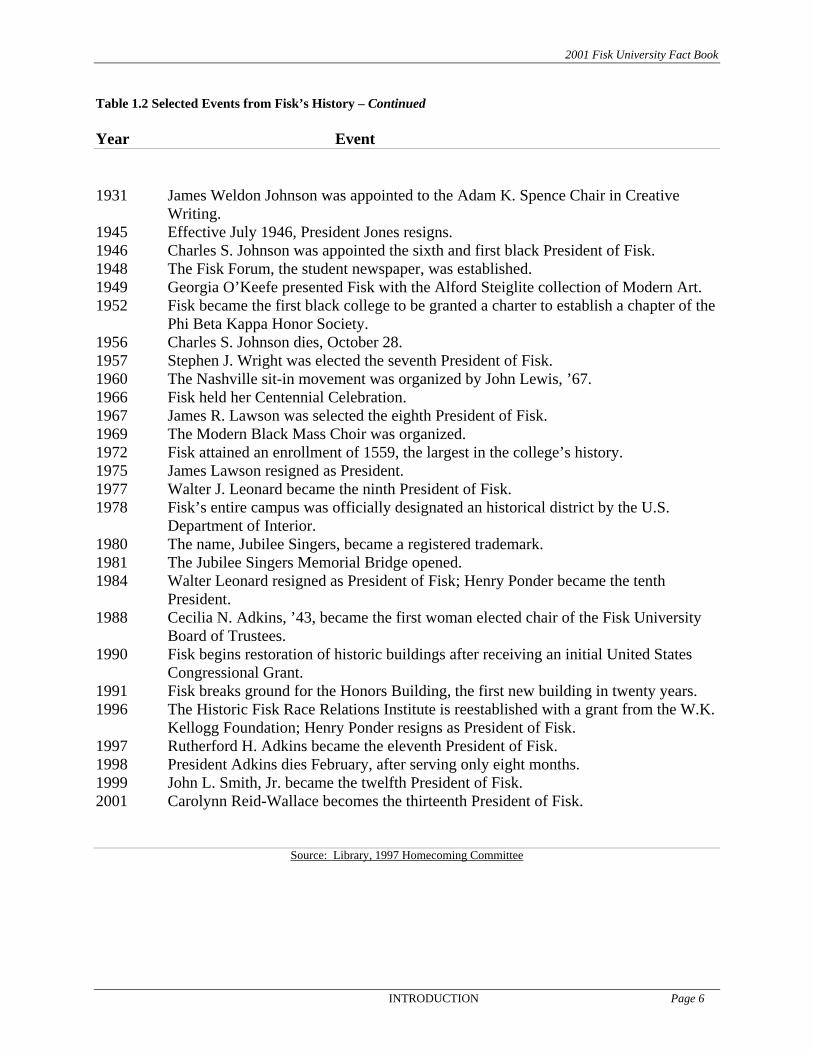
Table 1.2 Selected Events from Fisk’s History – Continued Year Event 1931 James Weldon Johnson was appointed to the Adam K. Spence Chair in Creative
Writing. 1945 Effective July 1946, President Jones resigns. 1946 Charles S. Johnson was appointed the sixth and first black President of Fisk. 1948 The Fisk Forum, the student newspaper, was established. 1949 Georgia O’Keefe presented Fisk with the Alford Steiglite collection of Modern Art. 1952 Fisk became the first black college to be granted a charter to establish a chapter of the
Phi Beta Kappa Honor Society. 1956 Charles S. Johnson dies, October 28. 1957 Stephen J. Wright was elected the seventh President of Fisk. 1960 The Nashville sit-in movement was organized by John Lewis, ’67. 1966 Fisk held her Centennial Celebration. 1967 James R. Lawson was selected the eighth President of Fisk. 1969 The Modern Black Mass Choir was organized. 1972 Fisk attained an enrollment of 1559, the largest in the college’s history. 1975 James Lawson resigned as President. 1977 Walter J. Leonard became the ninth President of Fisk. 1978 Fisk’s entire campus was officially designated an historical district by the U.S.
Department of Interior. 1980 The name, Jubilee Singers, became a registered trademark. 1981 The Jubilee Singers Memorial Bridge opened. 1984 Walter Leonard resigned as President of Fisk; Henry Ponder became the tenth
President. 1988 Cecilia N. Adkins, ’43, became the first woman elected chair of the Fisk University
Board of Trustees. 1990 Fisk begins restoration of historic buildings after receiving an initial United States
Congressional Grant. 1991 Fisk breaks ground for the Honors Building, the first new building in twenty years. 1996 The Historic Fisk Race Relations Institute is reestablished with a grant from the W.K.
Kellogg Foundation; Henry Ponder resigns as President of Fisk. 1997 Rutherford H. Adkins became the eleventh President of Fisk. 1998 President Adkins dies February, after serving only eight months. 1999 John L. Smith, Jr. became the twelfth President of Fisk. 2001 Carolynn Reid-Wallace becomes the thirteenth President of Fisk.
Source: Library, 1997 Homecoming Committee
2001 Fisk University Fact Book
INTRODUCTION Page 7
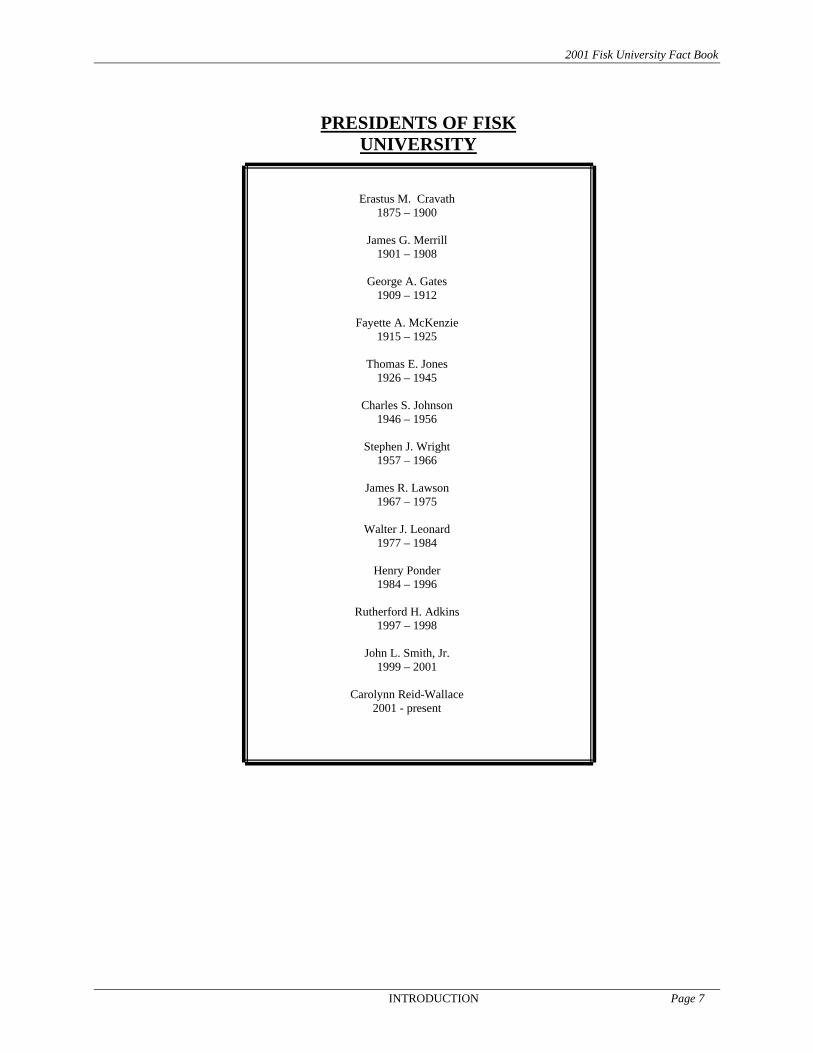
Erastus M. Cravath
1875 – 1900
James G. Merrill 1901 – 1908
George A. Gates
1909 – 1912
Fayette A. McKenzie 1915 – 1925
Thomas E. Jones
1926 – 1945
Charles S. Johnson 1946 – 1956
Stephen J. Wright
1957 – 1966
James R. Lawson 1967 – 1975
Walter J. Leonard
1977 – 1984
Henry Ponder 1984 – 1996
Rutherford H. Adkins
1997 – 1998
John L. Smith, Jr. 1999 – 2001
Carolynn Reid-Wallace
2001 - present
PRESIDENTS OF FISK UNIVERSITY

2001 Fisk University Fact Book
INTRODUCTION Page 8
ORGANIZATIONAL CHART
President
Provost Chief of Staff
Humanities & Fine Arts
Dean of Student Affairs
Social Sciences
Natural Science & Mathematics
Business Administration
Graduate Studies
Special Studies: Honors Program Core Curriculum International Programs Recruitment Programs Continuing Education
Academic Advising
Vice President for Financial
Affairs & CFO
Vice President for Institutional
Advancement
Executive Director of
Alumni Affairs
Director of Institutional
Research
Title III
Registrar’s Office
Enrollment Management Services: Admissions & Financial Aid
Information Technology: Infrastructure Delivery Services; Application Delivery Services; User Training & Web Services
Career Placement & Planning
Student Activities
Athletics
Dean of Chapel
Business Office
Comptroller
Human Resources
Auxiliary Services
Radio Station
Facilities & Grounds
Contracted Services:
Security & National
Management
Marketing & Communications
Public Relations
Annual Giving
Corporate Relations
Foundation Relations
Planned Giving & Scholarships
Alumni Annual Fund &
Reunions
Centers & Institutes
University Collections: Library & Galleries
Sponsored Programs

2001 Fisk University Fact Book
INTRODUCTION Page 9
Table 1.3: Senior Administrators (Fall 2001)
Senior Administrators AREA Office of the President Carolynn Reid-Wallace President Sam Lloyd Chief of Staff Office of the Provost Charles Giammona Provost and Dean of Academic Affairs Cathy Martin Associate Dean, Academic Affairs Alfredo Cambronero Director, Business Administration Division Leantin Bracks Director, Humanities & Fine Arts Division W. Eugene Collins Director, Natural Science & Mathematics Division Donna Rawls Director, Social Science Division Princilla Evans Director, Graduate Studies James Quirin Director, W.E.B. DuBois Honors Program Ray Winbush Director, Race Relations Division Enrique Silberman Director, NASA Research Center Opal Baker Director & Curator, University Galleries Jessie C. Smith Director, Library & Learning Resource Center Lisa Dixon Registrar Financial Affairs Sama Mondeh Vice President for Finance and Chief Financial Officer Vacant Comptroller Tracie Algood Assistant Comptroller Antoinette Lindsey-Caine Director, Budget & Grants Vacant Director, Auxiliary Services Marie Lang Director, Human Resources Vacant Director, Facilities & Grounds Raymond Cox Director, Campus Security Jerry Shelton Construction STUDENT AFFAIRS Joan Bahner Dean of Student Affairs Adrienne Latham Associate Dean of Student Affairs David Davis Director, Career Planning & Placement Lynwood Berry Director, Orientation & Student Activities Mark Adkins Director of Enrollment Management & Financial Aid Larry Glover Director of Athletics Vacant Director of Admissions
ADMINISTRATION

2001 Fisk University Fact Book
INTRODUCTION Page 10
Table 1.3: Senior Administrators - Continued
NAME AREA INFORMATION TECHNOLOGY SERVICES Melodie Mayberry-Stewart Chief Information Officer (Interim) Shanmuga Sundaram Assistant Director, IT Infrastructure Dorothy Fort Director, IT Training INSTITUTIONAL ADVANCEMENT Ramone Segree Acting Vice President, Institutional Advancement Edwina Hamby Director of Alumni Affairs George Carpenter Director of Sponsored Programs Francis Wright Director of Annual Giving Rodney Cohen Director for Corporate Relations Jacqueline Suggs Director for Foundation Relations Angela Bevens Director of Public Information NASA RESEARCH CENTER Enrique Silberman Director, NASA Research Center W. Eugene Collins Associate Director, Research Center

2001 Fisk University Fact Book
INTRODUCTION Page 11
Table 1.4 Academic Calendar Overview, Spring 2001 – Spring 2002
Classes Begin Wednesday January 10 Spring Vacation Monday – Friday March 5 - 9
Classes End Tuesday April 24 Final Exams End Wednesday May 2 Commencement Monday May 7
FALL SEMESTER 2001
Classes Begin Monday August 27 Thanksgiving Vacation Thursday – Friday November 22-23
Classes End Thursday December 6 Final Exams End Friday December 14
SPRING SEMESTER 2002
Classes Begin Wednesday January 9 Spring Vacation Monday- Friday March 4 – 8
Classes End Tuesday April 23 Final Exams End Wednesday May 1 Commencement Monday May 6
ACADEMIC CALENDAR

2001 Fisk University Fact Book
STUDENT AND ACADEMIC PROGRAM PROFILE Page 12
STUDENT AND ACADEMIC PROGRAM PROFILE

2001 Fisk University Fact Book
STUDENT AND ACADEMIC PROGRAM PROFILE Page 13
Students
• Average SAT for Entering Freshmen, Fall Semester 2001:
Verbal Math Combined 469 454 923
• Average ACT for Entering Freshmen, Fall Semester 2001:
ACT Composite: 19
• Admissions, Fall Semester 2001:
Number
Applied Number Accepted
Accepted Yield
Number Enrolled
Enrollment Yield
Freshman 1076 546 50.7% 151 27.6% Transfer 40 40 100% 26 65% Graduate 27 18 65.5% 8 44% Teaching Cert. 44 43 97.7% 30 70%
• Students at Fisk represent 39 states, The District of Columbia, The U.S. Virgin Islands, and six
foreign countries. • Fall Semester 2001 Headcount:
Full-Time 804 Part-Time 41 Total 845
• Credit hours produced by curricular area, Fall Semesters 2000 and 2001:
2000 2001
Core Curriculum 3,208 3,018 Undergraduate Studies 11,128 9,236 Graduate Studies 313 173
Total 14,649 12,427
• Degrees Conferred by Division, Academic Year 2000-01:
Bachelors
Masters
Business Administration 22 --- Humanities and Fine Arts 19.5 --- Natural Science and Math 30.5 8 Social Science 53 9
Total 145 17
• First-to-Second year retention: 83% • Graduation Rates:
Four-Year Rate 54.1% Five-Year Rate 58.2%
Six-Year Rate 61.0%
QUICK FACTS

2001 Fisk University Fact Book
STUDENT AND ACADEMIC PROGRAM PROFILE Page 14
Table 2.1 New Student Admissions (Includes transfers, re-admits and graduates) Fall Semesters, 1992-2001 Number
Applied Number Accepted
Acceptance Yield
Number Enrolled
Enrollment Yield
2001 1,076 546 50.7% 236 43.2% 2000 2,015 956 47.4% 358 37.4% 1999 1,143 718 62.8% 331 42.4% 1998 991 804 81.8% 297 36.1% 1997 760 581 76.4% 239 41.4% 1996 1,023 800 78.2% 230 28.8% 1995 1,025 825 80.5% 257 31.2% 1994 982 812 82.7% 293 36.1% 1993 1,038 720 69.4% 226 31.4% 1992 1,094 788 71.7% 238 30.2%
Figure 2.1 New Student Applicants by Admission Status
Fall Semesters 1992 – 2001
0
500
1000
1500
2000
2500
1992 1993 1994 1995 1996 1997 1998 1999 2000 2001
AppliedAcceptedEnrolled
ADMISSIONS

2001 Fisk University Fact Book
STUDENT AND ACADEMIC PROGRAM PROFILE Page 15
ADMISSIONS Table 2.2 Percent Distribution of High School Rank Fall Semesters, 1992-2001 First
Quintile Second Quintile
Third Quintile
Fourth Quintile
Fifth Quintile
% Unknown Rank
2001 25.8% 21.9% 18.5% 12.6% 2.6%q 17.9% 2000 27.0% 24.6% 13.7% 10.5% 7.7% 18.5% 1999 19.0% 16.1% 9.1% 6.2% 4.1% 54.1% 1998 27.2% 21.0% 12.9% 11.2% 4.0% 23.7% 1997 25.0% 24.4% 18.6% 10.3% 7.7% 14.1% 1996 24.0% 21.1% 25.7% 7.4% 6.9% 14.9% 1995 27.3% 19.5% 22.9% 12.2% 3.9% 14.2% 1994 27.7% 19.0% 14.5% 16.5% 5.0% 17.3% 1993 26.4% 26.0% 19.2% 10.1% 4.3% 14.0% 1992 34.5% 16.7% 18.2% 8.7% 6.0% 15.7% 10 Year Avg 26.4% 21.0% 17.3% 10.5% 5.5% 20.4% Figure 2.2 : Fall 2001 and Ten-Year Average of High School Rank by Quintile:
0%
5%10%15%20%25%30%
Perc
ent
1st 2nd 3rd 4th 5th Unk.
Quintiles
2001
Average
• First quintile is the highest class rank • Unk. means ‘unknown’

2001 Fisk University Fact Book
STUDENT AND ACADEMIC PROGRAM PROFILE Page 16
ADMISSIONS Table 2.3: Entering Status of New Students, Fall Semester, 2001 First
Time Freshmen
Transfers
Readmits
Graduates
Graduate, Special
Total
Number Applied 779 40 12 25 44 900
Number Accepted 665 40 12 18 43 778
Accepted Yield 85.4% 100% 100% 72% 97.7% 86.4%
Number Enrolled 151 26 11 8 39 235
Enrollment Yield 22.7% 65% 92% 44.4% 88.6% 30.2%
Figure 2.3 New Student Applicants by Admission Status Fall Semester, 2001
779665
1510
200400600800
1000
First Time Freshmen
Applied Accepted Enrolled
12 12
11
10.5
11
11.5
12
12.5
Readmits
Applied Accepted Enrolled
40 40
26
0
10
20
30
40
50
Transfers
Applied Accepted Enrolled
47
69 61
0
20
40
60
80
Graduates/Graduate Special
Applied Accepted Enrolled

2001 Fisk University Fact Book
STUDENT AND ACADEMIC PROGRAM PROFILE Page 17
ADMISSIONS Table 2.4: Admissions of First-Time Freshmen, Fall 2001
Entering Test Scores SAT ACT Range 580 - 1340 10 – 28 75th Percentile 1040 21 Mean 923 19 25th Percentile 770 16 Number students submitting scores 72 112 High School GPA Range 1.80 – 4.00 75th Percentile 3.40 Mean 3.09 25th Percentile 2.70 N 140 High School Rank % First-time freshmen in top 10% 14% % First-time freshmen in top 50% 58%

2001 Fisk University Fact Book
STUDENT AND ACADEMIC PROGRAM PROFILE Page 18
ADMISSIONS Table 2.5 Distribution of First Time Freshman Enrollment by Geographic Region and State Fall Semester, 2001 EAST SOUTH Connecticut 3 Alabama 4 District of Columbia 2 Florida 4 Maryland 2 Georgia 2 New Jersey 2 Mississippi 1 New York 6 North Carolina 0 Pennsylvania 2 South Carolina 2 Total 17 (11.2%) Tennessee 41 Virginia 5 Total 59 (39.1%) MIDWEST SOUTHWEST Illinois 14 Arkansas 6 Indiana 5 Louisiana 1 Iowa 0 New Mexico 1 Kansas 0 Oklahoma 1 Kentucky 5 Texas 0 Michigan 2 Total 9 (5.9%) Minnesota 2 Missouri 4 Ohio 13 WEST Wisconsin 2 Arizona 0 West Virginia 0 California 13 Total 47 (31.1%) Colorado 0 Nevada 1 New Mexico 1 Oregon 2 Washington 1 Total 18 (11.9%) FOREIGN Total 1 (0.6%) GRAND TOTAL 151

2001 Fisk University Fact Book
STUDENT AND ACADEMIC PROGRAM PROFILE Page 19
Table 2.6 Financial Aid Summary
1996-97 1997-98 1998-99 1999-00 2000-01 Grants1 $1,404,942 $1,087,304 $1,316,529 1,330,425 1,325,104Loans2 4,139,781 4,510,589 4,785,359 4,840,334 5,222,629Self Help3 319,277 233,350 216,818 221,120 217392Scholarships4 1,330,388 1,009,945 1,610,319 1,673,629 2,054,649 TOTAL AID $7,194,388 $6,841,188 $7,929,025 $8,065,508 $8,819,774 Unduplicated Recipients 655 677 736 780 730 Total Aid Per Student $10,984 $10,105 $10,773 $10,340 $11,967 GRANTS: -Average Grant/Student $2,145 $1,606 $1,789 $1,706 $1,798-Percent of Total Aid 19.5% 15.9% 16.6% 16.5% 15.0% LOANS: -Average Loan/ Student $6,320 $6,663 $6,502 $6,205 $7,086-Percent of Total Aid 57.5% 65.9% 60.4% 60.0% 59.2% SELF-HELP: -Average Amount Student $487 $345 $295 $283 $295-Percent of Total Aid 4.5% 3.4% 2.7% 2.7% 2.4% SCHOLARSHIPS: -Average Scholarship/ Student $2,031 $1,492 $2,188 $2,146 $2,788-Percent of Total Aid 18.5% 14.8% 20.3% 20.8% 23.3% 1 Pell, SEOG, State 3College Work Study, University Work 2Stafford, Perkins, Plus 4UNCF, University, Outside Sources
FINANCIAL AID

2001 Fisk University Fact Book
STUDENT AND ACADEMIC PROGRAM PROFILE Page 20
FINANCIAL AID
Table 2.7: Financial Aid Allocations 1999-00 and 2000-01
1999 - 2000
2000 – 2001
TYPE OF AID Number of Students
Amount Awarded
Number of Students
Amount Awarded
Pell Grants 410 $ 930,925 396 $928,627 SEOG 220 262,000 213 258,977 College Work Study 190 221,120 176 217,392 Stafford Loans 641 3,967,569 675 4,488,000 Perkins Loans 73 184,629 70 184,629 Plus Loans 86 688,136 80 550,000 Academic Scholarship/Grants 126 696,757 State Scholarship/Grants 55 137,500 52 Other Scholarship/Grants
380 976,872 117 335,000
$8,065,508 $8,819,774 Source: Financial Aid Office Figure 2.4 Percent Distribution of Financial Aid by Category 1996-07 through 2000-01
57.560.0 59.2
4.5 3.4 2.7 2.7 2.4
18.514.8
20.3 20.8 20.8
1516.516.615.919.5
60.4
65.9
0
10
20
30
40
50
60
70
1996-97 1997-98 1998-99 1999-00 2000-01
Grants Loans Self Help Scholarship

2001 Fisk University Fact Book
STUDENT AND ACADEMIC PROGRAM PROFILE Page 21
Table 2.8: Total Headcount by Gender
Fall Semesters 1991 – 2001 MALE FEMALE TOTAL 2001 260 625 845 2000 311 653 964 1999 268 618 886 1998 248 578 862 1997 226 534 760 1996 246 566 812 1995 265 614 879 1994 317 555 872 1993 252 598 850 1992 250 617 867 Period Average
264
596
860
Average % 30.4% 69.6% Figure 2.5: Total Headcount
Fall Semesters 1992 – 2001
826 845964886760812879872867 850
0
200
400
600
800
1000
1200
1992 1993 1994 1995 1996 1997 1998 1999 2000 2001
Total Headcount
ENROLLMENT

2001 Fisk University Fact Book
STUDENT AND ACADEMIC PROGRAM PROFILE Page 22
ENROLLMENT
Table 2.9: Total Headcount by Classification Fall Semesters 1992 – 2001 YEAR
FRESHMEN
SOPHOMORES
JUNIORS
SENIORS
GRADUATE*
TOTALS
2001 327 138 155 163 62 845 2000 375 172 149 148 120 964 1999 378 147 139 153 69 886 1998 322 120 128 189 67 826 1997 246 135 142 174 63 760 1996 292 144 147 185 44 812 1995 331 164 155 190 39 879 1994 371 159 165 144 33 872 1993 298 210 157 161 24 850 1992 326 185 185 145 26 867 Period Average
324
164
154
164
49
855
*For historical reasons, the Graduate column also includes Post-Baccalaureate students who are not in the graduate degree program, but are taking courses for such programs as teacher certification after receiving a Bachelor’s degree at Fisk or elsewhere. Table 2.10 Headcount by Class and Gender Fall Semester, 2001
Male Female
Total
Freshmen 117 210 327 Sophomore 45 93 138 Junior 34 121 155 Senior 46 118 164 Graduate 11 16 28 Graduate, Special 7 27 34 ---------------------------- ------------------------ ------------------------- ----------------- Totals 260 585 845 (% Total) 30.8% 69.2%

2001 Fisk University Fact Book
STUDENT AND ACADEMIC PROGRAM PROFILE Page 23
ENROLLMENT Table 2.11 Percent Distribution of Headcount by Geographical Region
Fall Semesters 1992 – 2001
EAST
MIDWEST
SOUTH
SOUTHWEST
WEST
FOREIGN
TOTAL
2001 8.2% 28.9% 41.2% 6.9% 10.0% 5.0% 845 2000 8.0% 27.5% 44.8% 6.8% 9.9% 3.0% 964 1999 9.5% 28.4% 40.9% 7.2% 10.2% 3.8% 886 1998 10.0% 28.5% 41.8% 8.0% 10.0% 1.5% 826 1997 11.2% 27.4% 42.6% 7.6% 10.8% 0.4% 760 1996 11.2% 26.4% 41.3% 8.5% 12.6% 0.2% 812 1995 13.7% 27.1% 40.0% 8.4% 10.2% 0.6% 879 1994 14.6% 28.6% 37.5% 7.0% 12.0% 0.3% 872 1993 14.6% 27.4% 38.4% 6.9% 12.0% 0.7% 850 1992 15.7% 27.6% 37.1% 7.3% 10.6% 1.7% 867 Period Average 11.7% 27.8% 40.6% 7.5% 10.8% 1.7% 856 Figure 2.6: Ten-Year Average of Percent Distribution of Headcount by Region: 1992-2001
11.70%
27.80%
40.60%
7.50%10.80%
1.70%
0.00%5.00%
10.00%15.00%20.00%25.00%30.00%35.00%40.00%45.00%
Average Percentage
East Midwest South Southwest West Foreign

2001 Fisk University Fact Book
STUDENT AND ACADEMIC PROGRAM PROFILE Page 24
ENROLLMENT Table 2.12 Enrollment Distribution by Region and State Fall Semesters 2000 and 2001
2000 2001 2000 2001 EAST SOUTH Connecticut 3 4 Alabama 31 20 Delaware 1 0 Florida 14 13 District of Columbia 10 6 Georgia 43 32 Maryland 19 16 Mississippi 19 15 Massachusetts 9 8 North Carolina 3 2 New Jersey 6 6 South Carolina 5 6 New York 22 21 Tennessee 270 251 Pennsylvania 7 4 Virginia 9 9 Rhode Island 1 0 TOTAL 394 348 Virgin Island 5 4 TOTAL 83 69 SOUTHWEST Arkansas 10 15 MIDWEST Louisiana 23 12 Illinois 92 78 Oklahoma 7 8 Indiana 26 19 Texas 31 24 Iowa 3 2 TOTAL 71 59 Kansas 6 3 Kentucky 11 12 Michigan 24 20 Minnesota 5 6 WEST Missouri 48 39 Alaska 1 0 Nebraska 0 0 Arizona 0 0 Ohio 46 53 California 75 63 Wisconsin 12 11 Colorado 4 1 West Virginia 1 1 Nevada 1 1 TOTAL 276 244 New Mexico 2 2 Oregon 15 15 Washington 3 3 TOTAL 101 85 FOREIGN 39 42 GRAND TOTAL 964 845

2001 Fisk University Fact Book
STUDENT AND ACADEMIC PROGRAM PROFILE Page 25
ENROLLMENT Table 2.13: Geographic Distribution of Headcount by State Fall Semester 2001

2001 Fisk University Fact Book
STUDENT AND ACADEMIC PROGRAM PROFILE Page 26
Table 2.14: Distribution of Majors by Division and Discipline Fall Semesters, 1997 through 2001 *Joint majors are weighted ½, once in each major field. 1997 1998 1999 2000 2001 BUA 104 130 114 104 100 % DECLARED MAJORS 19.8% 19.7% 14.9% 15.2% 17.6% % HEADCOUNT 13.7% 15.8% 12.9% 11.5% 13.0% HFA ART 8 3 7 8 6 DSP 18 15 16 17 12 ENG 28 34 39 33 26 MFL 2 5 8 7 3 MUS 7 17 19 14 17 RPS 6 6 7 4 1 DIVISION TOTAL 69 80 96 83 65 % DECLARED MAJORS 13.1% 12.1% 12.5% 12.1% 11.5% % HEADCOUNT 9.1% 9.7% 10.8% 9.2% 8.5% NSM BIO 142 147 208 164 117 CHE 11 23 26 25 20 CSC 26 35 46 45 44 MTH 9 9 17 13 12 PHY 19 24 24 17 11 DIVISION TOTAL 207 238 321 264 204 % DECLARED MAJORS 39.4% 32.0% 42.0% 38.5% 36.0% % HEADCOUNT 27.2% 25.6% 36.2% 29.3% 26.6% SSC HIS 9 12 17 19 16 PSC 37 41 52 47 44 PSY 108 144 152 147 121 SOC 12 14 13 21 17 DIVISION TOTAL 146 211 234 234 198 % DECLARED MAJORS 27.8% 32.0% 30.6% 34.2% 34.9% % HEADCOUNT 19.2% 25.6% 26.4% 25.9% 25.8% TOTAL DECLARED MAJORS 526 659 765 685 567 % HEADCOUNT 69.2% 79.9% 86.3% 75.9% 73.8% TOTAL UNDECLARED MAJORS
234
167
121
271 201
% HEADCOUNT 30.8% 20.1% 13.7% 24.0 26.2% TOTAL HEADCOUNT
760
826
886
902
768
MAJOR PROGRAMS
2001 Fisk University Fact Book
STUDENT AND ACADEMIC PROGRAM PROFILE Page 27
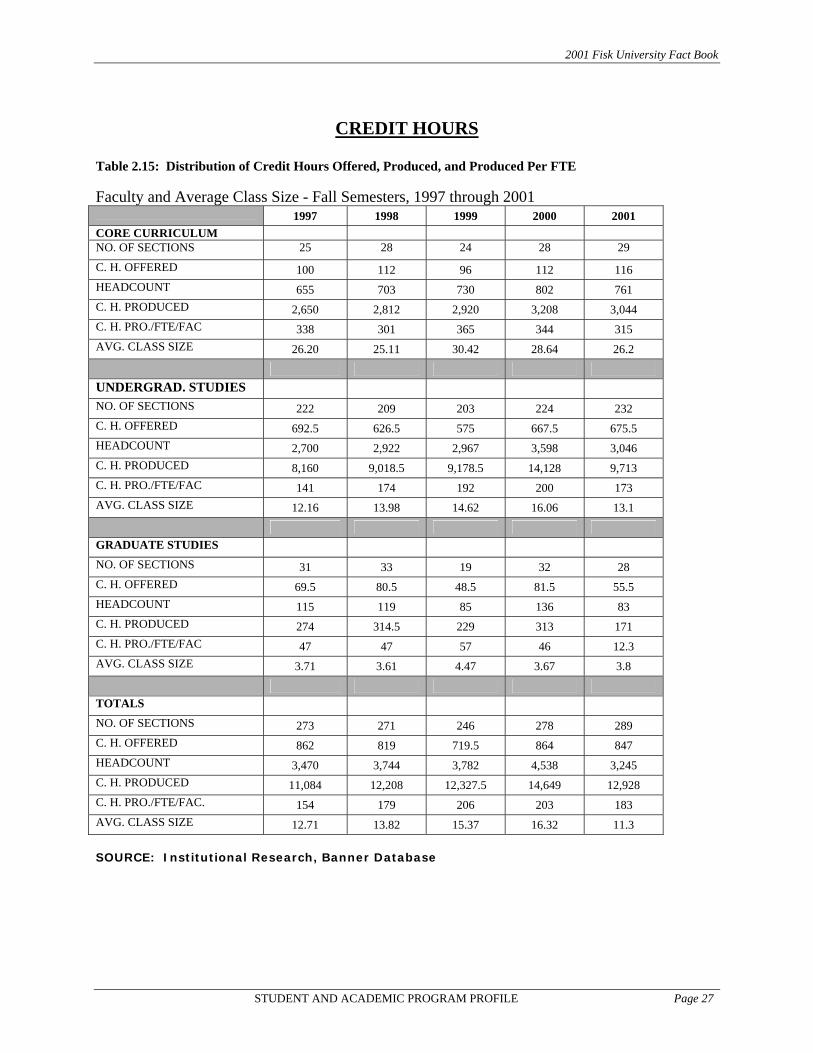
Table 2.15: Distribution of Credit Hours Offered, Produced, and Produced Per FTE Faculty and Average Class Size - Fall Semesters, 1997 through 2001 1997 1998 1999 2000 2001 CORE CURRICULUM NO. OF SECTIONS 25 28 24 28 29
C. H. OFFERED 100 112 96 112 116 HEADCOUNT 655 703 730 802 761 C. H. PRODUCED 2,650 2,812 2,920 3,208 3,044 C. H. PRO./FTE/FAC 338 301 365 344 315 AVG. CLASS SIZE 26.20 25.11 30.42 28.64 26.2 UNDERGRAD. STUDIES NO. OF SECTIONS 222 209 203 224 232 C. H. OFFERED 692.5 626.5 575 667.5 675.5 HEADCOUNT 2,700 2,922 2,967 3,598 3,046 C. H. PRODUCED 8,160 9,018.5 9,178.5 14,128 9,713 C. H. PRO./FTE/FAC 141 174 192 200 173 AVG. CLASS SIZE 12.16 13.98 14.62 16.06 13.1 GRADUATE STUDIES NO. OF SECTIONS 31 33 19 32 28 C. H. OFFERED 69.5 80.5 48.5 81.5 55.5 HEADCOUNT 115 119 85 136 83 C. H. PRODUCED 274 314.5 229 313 171 C. H. PRO./FTE/FAC 47 47 57 46 12.3 AVG. CLASS SIZE 3.71 3.61 4.47 3.67 3.8 TOTALS NO. OF SECTIONS 273 271 246 278 289 C. H. OFFERED 862 819 719.5 864 847 HEADCOUNT 3,470 3,744 3,782 4,538 3,245 C. H. PRODUCED 11,084 12,208 12,327.5 14,649 12,928 C. H. PRO./FTE/FAC. 154 179 206 203 183 AVG. CLASS SIZE 12.71 13.82 15.37 16.32 11.3 SOURCE: Institutional Research, Banner Database
CREDIT HOURS

2001 Fisk University Fact Book
STUDENT AND ACADEMIC PROGRAM PROFILE Page 28
CREDIT HOURS Figure 2.7: Profile of Total Credit Hours Offered
Fall Semester, 2001
13.7%
79.8%
6.5%
Core Undergraduate Studies Graduate Studies
Table 2.16 Undergraduate Disciplines with Highest Credit Hours Produced Fall Semester, 2001
Discipline
Fall 2001 Number Sections
Fall 2001 Credit Hours
Produced
(Fall 2000
Rank)
PSYCHOLOGY 7 1012 3 SPANISH 13 1008 1
MATH 14 912 2 EDU 9 662 4
BUSINESS ADMIN 8 499 NR Source: Banner Database

2001 Fisk University Fact Book
STUDENT AND ACADEMIC PROGRAM PROFILE Page 29
Table 2.17: Distribution of Credit Hours Offered, Credit Hours Produced, Credit Hours Produced per FTE Faculty and Average Class Size Fall Semester, 2001
Number
of Sections
Credit Hours
Offered
Enrollment
Student Credit Hour
Production
SCHP/FTE Faculty
Average Class Size
By Curricular Level: Core 29 114 761 3,018 318 26.2
Undergraduate Studies 227 664.5 3,041 9,236 167 13.4
Graduate Studies 27 55.5 83 173 44 4.18
Total 283 834 3,885 12,427 179 13.7
Core Curriculum by Course:
110 10 40 163 652 196 16.3 130 2 8 66 264 396 33.0 140 2 6 26 78 156 13.0 210 4 16 124 496 372 31.0 220 2 8 94 376 564 47.0 230 3 12 109 436 436 36.3 250 4 16 107 428 321 26.8 360 2 8 72 288 432 36.0
Total 29 114 761 3018 318 26.2 Undergraduate Studies by Division/Program:
BUA 20 67 391 1310 235 19.6 HFA 92 269 893 2611 116 9.7 NSM 79 197.5 947 2368 144 12.0 SSC 36 131 810 2948 270 22.5
Total 227 664.5 3041 9236 167 13.4 Graduate Studies by Discipline:
BIO 4 7 8 14 24 2.0 CHE 3 3.5 9 11 36 3.0 PHY 6 14 19 44 38 3.2 PSY 10 22 37 81 44 3.7 SOC 4 9 10 23 30 2.5 Total 27 55.5 83 173 172 3.1

2001 Fisk University Fact Book
STUDENT AND ACADEMIC PROGRAM PROFILE Page 30
CREDIT HOURS Table 2.18: Distribution of Credit Hours Offered, Credit Hours Produced, Credit Hours Produced per FTE Faculty and Average Class Size Fall Semester, 2001
NO.
SECTIONS
CREDIT HOURS
OFFERED
FTE
FACULTY
ENROLLED
STUDENT CREDIT HOUR
PRODUCED
STUDENT CREDIT HOURS
PRODUCED/ FTE-FAC
AVG
CLASS SIZE
BUA
ACC 4 14 1.2 60 198 170 15.0 BUA 8 23 1.9 182 539 281 22.8 ECO 2 7 0.6 63 213 365 31.5 FIN 3 11 0.9 41 137 149 13.7
MGT 3 12 1.0 45 180 180 15.0 TOTAL 20 67 5.6 391 1267 227 19.6
HFA
ART 8 32 2.7 115 460 173 14.4 DSP 11 35 2.9 88 292 100 8.0 ENG 6 24 2.0 61 244 122 10.2 HFA 9 20 1.7 79 180 108 8.8 MFL
FRE 3 12 1.0 56 96 96 18.7 GER 1 4 0.3 11 44 132 11.0 SPA 13 52 4.3 252 1008 233 19.4 MUS 34 61 5.1 200 326 64 5.9 RPH 8 23 1.9 33 129 67 4.1
TOTAL 93 263 21.9 895 2779 127 9.6
HON 5 20 1.7 52 208 125 10.4
NSM
BIO 15 26 2.2 220 438 202 14.7 CHE 18 40 3.3 234 499 150 13.0 CSC 16 34.5 2.9 156 439 153 9.8 MTH 14 56 4.7 228 912 195 16.3 NSM 4 7 0.6 30 60 103 7.5 PHY 11 26 2.2 73 175 81 6.6
TOTAL 78 189.5 15.8 941 2523 160 12.1
SSC
EDU 9 26 2.2 226 662 306 25.1 HIS 4 16 1.3 32 128 96 8.0 PSC 6 24 2.0 88 352 176 14.7 PSY 7 25 2.1 256 1012 486 36.6 SOC 6 24 2.0 112 448 224 18.7 SSC 1 4 0.3 50 200 600 50.0
TOTAL 33 119 9.9 764 2802 283 23.2
UNDERGRAD TOTALS 229 658.5 54.9 3043 9579 175 13.3
SOURCE: Institutional Research, Banner Data

2001 Fisk University Fact Book
STUDENT AND ACADEMIC PROGRAM PROFILE Page 31
Table 2.19: Distribution of Class Size Fall Semesters, 2000 and 2001
Fall 2000
Fall 2001
Number % Total Number % Total 1 - 5 76 27.3% 97 33.9% 6 – 10 54 19.4% 57 19.29 11-15 33 11.9% 36 12.6% 16-20 21 7.6% 22 7.7% 21-25 29 10.4% 26 9.1% 26-30 24 8.6% 17 5.9% 31-35 15 5.4% 8 2.8% 36-40 8 2.9% 11 3.9% 41-50 13 4.7% 10 3.5% >50 5 1.8% 2 0.7% 278 100.0% 286 100.0% Table 2.20: Distribution of Class Size by Division/Program Fall Semester 2001
BUA
CRE
HFA
HON
NSM
SSC
Total
1 - 5 4 1 38 4 32 18 97 6 - 10 2 1 23 - 23 8 57 11-15 4 5 12 - 13 2 36 16-20 1 2 8 - 9 2 22 21-25 3 6 6 - 8 3 26 26-30 1 5 5 - 3 2 17 31-35 1 2 1 - 2 2 8 36-40 3 3 0 1 0 2 11 41-50 1 3 - - 0 6 10 >50 - 1 - - - 1 2
20 29 93 5 92 50 286
CLASS SIZE
2001 Fisk University Fact Book
STUDENT AND ACADEMIC PROGRAM PROFILE Page 32
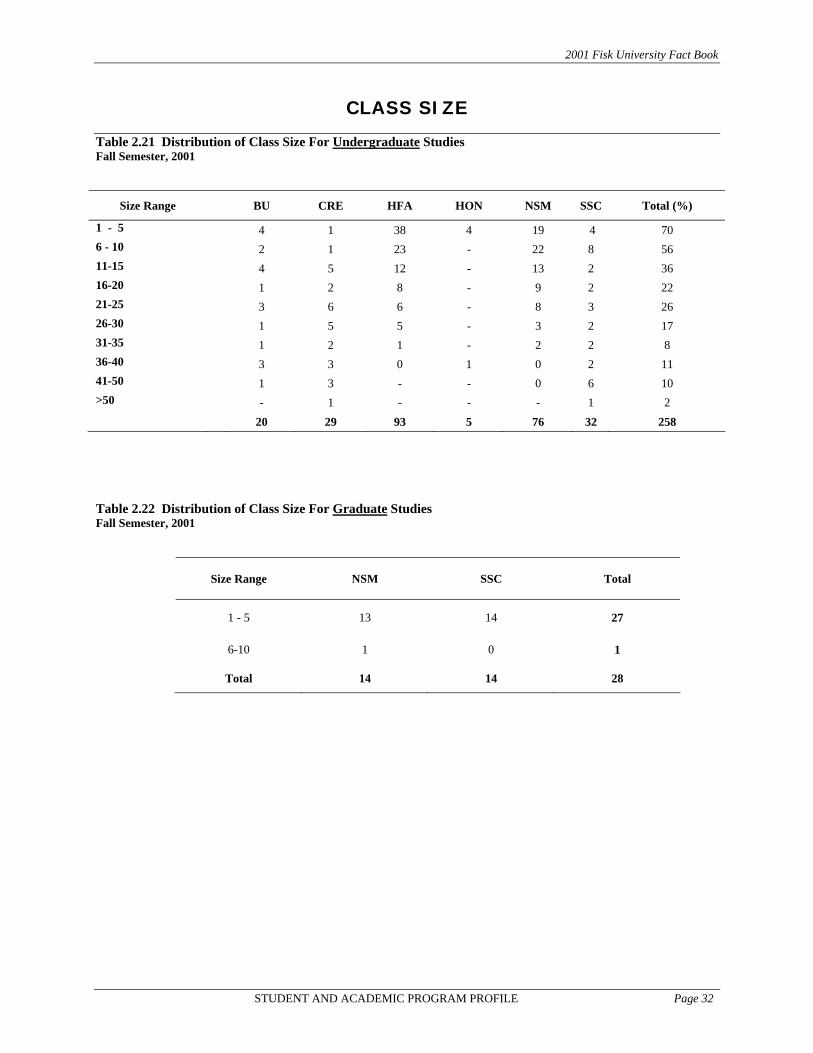
CLASS SIZE Table 2.21 Distribution of Class Size For Undergraduate Studies Fall Semester, 2001
Size Range BU CRE HFA HON NSM SSC Total (%)
1 - 5 4 1 38 4 19 4 70 6 - 10 2 1 23 - 22 8 56 11-15 4 5 12 - 13 2 36 16-20 1 2 8 - 9 2 22 21-25 3 6 6 - 8 3 26 26-30 1 5 5 - 3 2 17 31-35 1 2 1 - 2 2 8 36-40 3 3 0 1 0 2 11 41-50 1 3 - - 0 6 10 >50 - 1 - - - 1 2 20 29 93 5 76 32 258 Table 2.22 Distribution of Class Size For Graduate Studies Fall Semester, 2001
Size Range
NSM
SSC Total
1 - 5 13 14 27
6-10 1 0 1
Total 14 14 28

2001 Fisk University Fact Book
STUDENT AND ACADEMIC PROGRAM PROFILE Page 33
Table 2.23: Academic Performance of Students Academic Year 2001-02 4.00GPA DEAN’S LIST Fall
Semester Spring
Semester Fall
Semester Spring
Semester Freshmen 0 2 6 12
Sophomores 6 4 34 36 Juniors 8 7 55 46 Seniors 19 13 133 129
Totals 33 26 228 223
% Undergraduate Enrollment
4.2%
3.3%
29.1%
28.5%
SOURCE: Banner Academic History Figure 2.8: Profile of All Earned Grades: Fall 2001
A33%
A-8%
B+8%
B16%
B-5%
C+4%
C11%
C-2%
D6%
E7%
ACADEMIC ACHIEVEMENT

2001 Fisk University Fact Book
STUDENT AND ACADEMIC PROGRAM PROFILE Page 34
Grade Distribution by Program - Fall 2001(+/- Grades Combined into Single Grade)
0%
10%
20%
30%
40%
50%
60%
70%
80%
90%
100%
BADCORE
ARTDRAM/SPCH
ENG
MFLHFAR
MUS
RPH
BIOL
CHEM
CSCIMATH
NSCIPHYSEDUC
HIS
PSCIPSY
SOC
SSCIHON
Program
Perc
enta
ge o
f All
Gra
des
A B C D E
DISTRIBUTION OF GRADES

2001 Fisk University Fact Book
STUDENT AND ACADEMIC PROGRAM PROFILE Page 35
Table 2.26: Degrees Awarded by Major
Commencements May 1997 through May 2001 (Include degrees awarded in previous December)
1997 1998 1999 2000 2001 BACHELOR DEGREES
BUA 26 30 36 26 22 HFA
ART 3 3 3 1 4 DSP 4 4 2 4 1 ENG 17 10 15 8 17 MFL 3 3 5 2 6 MUS - 1 3 6 1 RPS 2 2 1 - 2.5
HFA TOTAL 29 23 27 21 30.5
NSM BIO 31 34 28 21 13 CHE 6 1 1 3 4 CSC 4 2 4 4 2 MTH - 0 - 3 0 PHY - 3 1 3 .5
NSM TOTAL 41 40 34 34 19.5
SSC HIS 7 4 3 3 6 PSC 13 7 19 15 5 PSY 28 24 46 38 38 SOC 7 4 4 2 4
SSC TOTAL 55 39 72 58 53
TOTAL BACHELOR DEGREES 151 132 169 139 125
MASTERS DEGREE
BIO 4 1 5 - 2 CHE 1 4 - 1 2 PHY 2 3 2 3 4 PSY 3 3 7 1 6 SOC 4 1 1 2 3
TOTAL MASTERS
DEGREES 14 12 15 7 17
TOTAL DEGREES 165 144 184 146 142 Source: Registrar
DEGREES CONFERRED

2001 Fisk University Fact Book
STUDENT AND ACADEMIC PROGRAM PROFILE Page 36
DEGREES CONFERRED
Figure 2.9: Undergraduate Degrees Conferred by Division Commencements 2000 and 2001
26
22
21
30.5
34
19.5
58
53
0 20 40 60 80
2000
2001 SSCNSMHFABUA
Table 2.27 Percent Distribution of B.A. Degrees Conferred by Major Commencements 2000 and 2001
2000 2001 Psychology 37.5% Psychology 41.9% Biology 21.0% Biology 10.5% Political Science 15.0% Political Science 4.0% English 8.0% English 13.7% All Other Departments 18.5% All Other Departments 31.9%
SOURCE: Registrar

2001 Fisk University Fact Book
STUDENT AND ACADEMIC PROGRAM PROFILE Page 37
DEGREES CONFERRED Figure 2.10: Degrees Conferred by Type
Commencement 2001
69.0%0.7%
18.3%
12.0%
BABMUSBSMA
Table 2.28: Characteristics of Undergraduate Degree Recipients
Commencement, 2001
Percent Graduating in Four Years 54.1%
Percent Graduating in Five Years 4.1%
Percent Graduating in More than Five Years 2.8%
Percent Graduating with Honors: Phi Beta Kappa 8.1% Summa Cum Laude 11.3% Magna Cum Laude 10.5% Cum Laude 13.7% General University Honors 10.5% Departmental Honors 51.6%

2001 Fisk University Fact Book
STUDENT AND ACADEMIC PROGRAM PROFILE Page 38
DEGREES CONFERRED Table 2.29 Degrees Conferred by Gender and Discipline – Commencements 2000 and 2001
2000 2001 M F TOTAL M F TOTAL
BACHELORS OF ARTS BUA
BUA - 0.5 0.5 0.5 1 1.5 HFA
ART - - 0 - 0.5 0 DSP 1 3 4 1 ENG - 8 8 3 13 16 MUS - 2 2 1 - 1 RPS - - 0 2.5 - 2.5 SPA - 2 2 2 4 6
SUBTOTAL 1 15 16 8.5 18.5 25.5
NSM BIO 4 17 21 2 12 14 CHE 1 - 1 1 1 CSC - 0.5 0.5 MTH 0.5 2.5 3 PHY - 1 1 0.5 0.5
SUBTOTAL 5.5 21 26.5 2 13.5 15.5
SSC HIS 0.5 2 2.5 2.5 3.5 6 PSC 2 13 15 1 4 5 PSY 6 31.5 37.5 3.5 34.5 38 SOC - 2 2 1 2.5 3.5
SUBTOTAL 8.5 48.5 57 8 44.5 52.5
TOTAL B.A. 15 85 100 19 77 96
BACHELOR OF MUSIC
MUS - 3 3 - 1 1
BACHELOR OF SCIENCE
BUA BUA 8 8 26 8 9 17
HFA
ART - 1 1 2 1.5 3.5 MUS 1 - 1 1 1
SUBTOTAL 1 1 2 2 2.5 4.5
NSM BIO - - - - 1 1
CHE - 2 2 3 3 CSC 2 2 4 1 1.5 2 PHY 1 1 1
SUBTOTAL 3 5 8 1 5 6
TOTAL B.S. 12 24 36 11 17 28
TOTAL BACHELOR
DEGREES 27 112 139 30 95 125

2001 Fisk University Fact Book
STUDENT AND ACADEMIC PROGRAM PROFILE Page 39
2000 2001
MASTER OF ARTS
NSM
M F Total M F Total
BIO - - 0 1 1 2 CHE - 1 1 2 0 2 PHY 2 1 3 2 2 4
SUBTOTAL 2 2 4 5 3 8
SSC PSY - 1 1 4 2 6 SOC 1 1 2 1 2 3
SUBTOTAL 2 2 4 5 4 9
TOTAL MASTERS DEGREES 3 4 7 10 7 17
TOTAL DEGREES 30 116 146 40 102 142
2001 Fisk University Fact Book
STUDENT AND ACADEMIC PROGRAM PROFILE Page 40
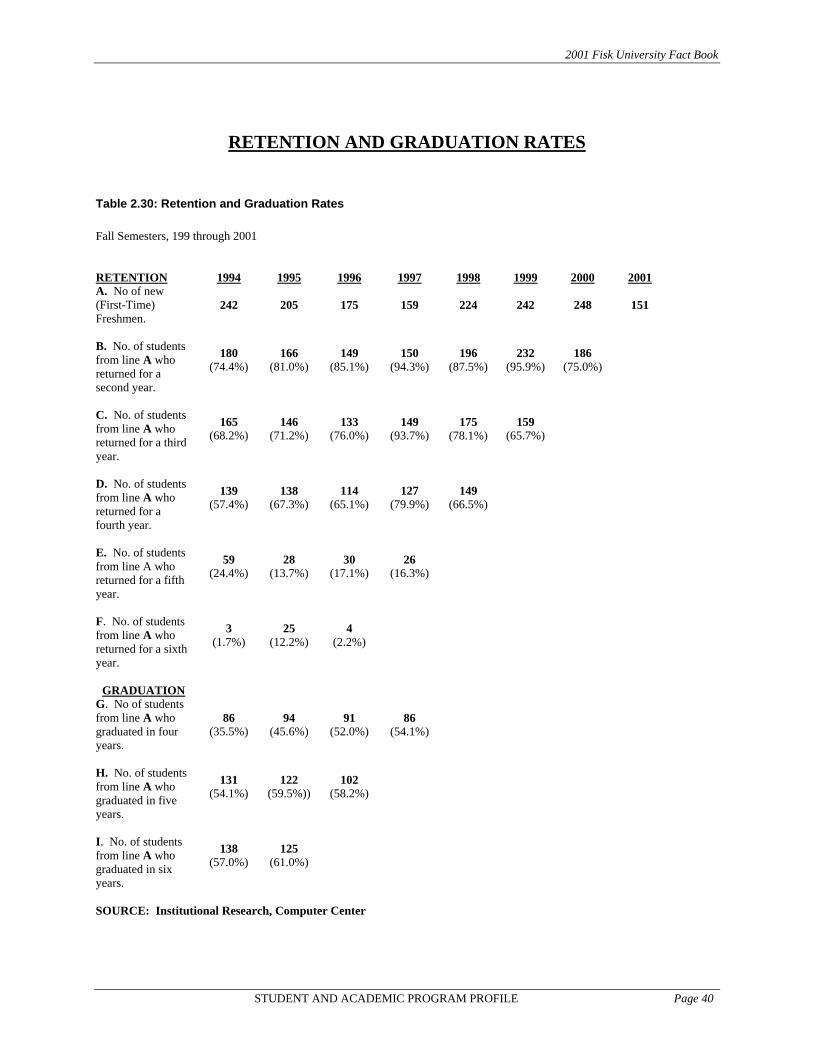
Table 2.30: Retention and Graduation Rates
Fall Semesters, 199 through 2001 RETENTION 1994 1995 1996 1997 1998 1999 2000 2001 A. No of new (First-Time) Freshmen.
242 205 175 159 224 242 248 151
B. No. of students from line A who returned for a second year.
180 (74.4%)
166 (81.0%)
149 (85.1%)
150 (94.3%)
196 (87.5%)
232 (95.9%)
186 (75.0%)
C. No. of students from line A who returned for a third year.
165 (68.2%)
146 (71.2%)
133 (76.0%)
149 (93.7%)
175
(78.1%)
159 (65.7%)
D. No. of students from line A who returned for a fourth year.
139
(57.4%)
138
(67.3%)
114 (65.1%)
127 (79.9%)
149 (66.5%)
E. No. of students from line A who returned for a fifth year.
59 (24.4%)
28 (13.7%)
30 (17.1%)
26 (16.3%)
F. No. of students from line A who returned for a sixth year.
3 (1.7%)
25 (12.2%)
4 (2.2%)
GRADUATION
G. No of students from line A who graduated in four years.
86 (35.5%)
94 (45.6%)
91 (52.0%)
86 (54.1%)
H. No. of students from line A who graduated in five years.
131 (54.1%)
122 (59.5%))
102 (58.2%)
I. No. of students from line A who graduated in six years.
138 (57.0%)
125 (61.0%)
SOURCE: Institutional Research, Computer Center
RETENTION AND GRADUATION RATES

2001 Fisk University Fact Book
FACULTY/STAFF PROFILES Page 41
FACULTY/STAFF PROFILES

2001 Fisk University Fact Book
FACULTY/STAFF PROFILES Page 42
Faculty – Fall 2001 • Faculty Profile:
Full-Time Instructional Faculty 54 Division Directors 4 Department Chairs 14 On-Leave 3 Part-Time Instructional Faculty 32 Research Faculty 12 Total 98
• Faculty Profile by Gender:
Male 58 Female 40
Total 98
• Faculty by Highest Degree: Doctoral 58 Master’s 40 Total 98
• Percent Tenured:
Full-Time Instructional Faculty 52% Part-Time Instructional Faculty 0% Research Faculty 25%
• Faculty Profile by Race:
Black 57 White 28 Asian 11 Hispanic 2 Total 98
QUICK FACTS

2001 Fisk University Fact Book
FACULTY/STAFF PROFILES Page 43
FALL 2001
Table 3.1 Full-Time Instructional Faculty
Division of Business Administration Cambronero, Alfredo, Director Associate Professor Ph.D. Economics Cargill, Stafford Assistant Professor Ph.D. Economics Holman, Vanita Assistant Professor MBA Accounting Maupin, Eilene Adjunct Assistant
Professor M.S. Accounting
Division of Humanities and Fine Arts Art Fort, L. Fran, Chair Lecturer MAT Art Henry, Alicia (Leave of Absence)
Assistant professor MFA Art
Dramatics and Speech Fields, Peter, Chair Assistant Professor PhD Dance Felder-Fentress, Persephone Assistant Professor MFA Performing Arts Lambert, E. Jean Associate Professor PhD Speech English Bracks, Lean’tin Assistant Professor PhD English Meyer, Adam, Chair Associate Professor PhD English Popkin, David (on leave) Associate Professor PhD English Washington, Teresa Visiting Assistant
Professor PhD English
Cook, Edith Assistant Professor PhD English Modern Foreign Languages Brooks, Marcellus Assistant Professor MA Spanish Godo-Solo, Hossiri Lecturer MA Spanish Meriwether, Curline Lecturer MA Spanish Rasico, Nancy, Chair Lecturer MA Spanish Soumare, Mamadou Visiting Assistant
Professor PhD French, German
Music Autry, Philip Lecturer PhD Music Bumbulis, Valija Assistant Professor M. Music Music (Voice) Carroll, Kevin Assistant Professor MA Music (Instrument) Kwami, Paul, Chair Lecturer M. Music Music Thieme, Derius Professor PhD Music Religious and Philosophical Studies
Appolis, Keith Assistant Professor PhD Religion/Philosophy Collier, Karen, Chair Assistant Professor PhD Religion
FISK UNIVERSITY INSTRUCTIONAL FACULTY

2001 Fisk University Fact Book
FACULTY/STAFF PROFILES Page 44
Table 3.1: Full-Time Instructional Faculty - Continued
Division of Natural Science and Mathematics Biology Gunasekaran, M. Professor PhD Biology Freeman-Junior, Phyllis Associate Professor PhD Biomedical Science Ike, Justus Associate Professor PhD Biology McCarroll, Patricia Lecturer, Dir. of Core Curr. MS Biology Welch, Mary McKelvey, Chair Professor PhD Biology Chemistry Evans, Princilla, Chair Associate Professor PhD Chemistry Penner, Helmut Associate Professor PhD Chemistry Pratt, Lawrence Assistant Professor PhD Chemistry Wingfield., Robert (Sabbatical) Associate Professor PhD Chemistry Mathematics & Comp Sci Bodruzzaman, Selina Visiting Lecturer MS Math/Computer Science Egarievwe, Steve Visiting Assistant Professor PhD Physics/Computer Science Hota, Sanjukta Assistant Professor PhD Mathematics Jones, Gita Lecturer MS Computer Science Mann, II, N. Horace (Leave of Absence)
Associate Professor PhD Bio Med
Murray, Leroy, Math Coordinator
Associate Professor MA, JD Mathematics
Papousek, Elizabeth Associate Professor PhD Mathematics Physics Collins, W. Eugene Professor; Dir. of NSAM PhD Physics Morgan, Steven, Chair Professor PhD Physics Silberman, Enrique Professor Emeritus PhD Physics Watson, Michael Assistant Professor PhD Physics
Division of Social Science History Mitchell, Reavis, Chair Associate Professor DA History Quirin, James Professor PhD History Wynn, Linda Visiting Lecturer MA History Political Science Adebanjo, Jennifer, Chair Associate Professor PhD Political Science Nimley, Anthony Professor PhD Political Science Psychology Carson, Richard Assistant Professor PhD Psychology Peters, Sheila Assistant Professor PhD Psychology Rawls, Donna Professor; Dir of SS Div PhD Psychology Winbush, Raymond Professor PhD Psychology Teacher Certification Glover, Janelle Lecturer MA Education Glover, Larry, Director Assistant Professor EdD Education Sociology & Anthropology Bhowmik, Dilip, Chair Associate Professor PhD Sociology Kano, Mamman Assistant Professor PhD Sociology

2001 Fisk University Fact Book
FACULTY/STAFF PROFILES Page 45
Smith, Dani Assistant Professor PhD Sociology Table 3.2: Part-Time Instructional Faculty
Division of Business Administration Ekadi, Green Adjunct Assistant
Professor PhD Economics
Parachuri, Madhlp Lecturer MA Economics Umontuen, Nicholas Lecturer MPA Business Administration
Division of Humanities and Fine Arts Collins, L.M. Professor Emeritus PhD English Davis, David Lecturer MA Religion Dobbins, Washington Lecturer MA Communications Duke, Christopher Lecturer MA Music Frierson, Eli Lecturer MS Mathematics Giles, Bernice Lecturer MA Education Holiday, Newton Lecturer MA Fine Arts Julseth, David Adjunt Professor PhD Spanish Lewis, Dwight Lecturer BS Journalism Mitchell, Jacqueline Adjunct Associate
Professor PhD English
Ridley, Gregory Lecturer MA Fine Arts Tribble, Sherman Lecturer D.Div. Religion Zahn, Fred Lecturer MFA Art
Division of Natural Science and Mathematics Henderson, Don Professor PhD Chemistry Hull, George Professor Emeritus PhD Biology Martin, Cathy Associate Professor PhD Mathematics Mohammadpour, Korush Lecturer MA Physics Shute, Elizabeth Lecturer MS Physical Chemistry Silberman, Enrique Professor Emeritus PhD Physics Springer, John Professor PhD Physics
Division of Social Science Bellard, Stephani Lecturer MA Psychology Bogan, Lana Lecturer MA Psychology Davis, Dierdre Lecturer MS Psychology Hightower, Jesse Lecturer MS Education Miller, Jeanne Lecturer MS Psychology Morrell, Barbara Lecturer MS Education
Core Curriculum McCoy, Matthews Lecturer MA Core McShephard, Gerard Lecturer MA Core Robinson, James Lecturer PhD Core Ward, Robert Lecturer PhD Core

2001 Fisk University Fact Book
FACULTY/STAFF PROFILES Page 46
Table 3.3: Research Faculty
NAME RANK HIGHEST DEGREE
RESEARCH AREAS
Burger, Arnold Research Professor PhD Semiconductor Crystals and
Films Caulfield, H. John Distinguished Research
Professor PhD Holography and Optical Information
Chattopadhyay, Kaushir Research Assistant Professor PhD Semiconductor Crystals and
Films Lui, Yunlong Research Associate PhD Semiconductor Crystals and
Films Henderson, Don Research Professor PhD Nanophase Materials Lu, Weijie Research Assistant
Professor PhD Surface Science
Mu, Rixiang Research Assistant Professor PhD Nanophase Materials
Ndap, Jean-Oliver Research Assistant Professor PhD Nanophase Materials
Roy, Utpal Research Association PhD Semiconductor Crystals and Films
Shi, Detang Research Associate Professor PhD Surface Physics
Ueda, Akira Research Associate PhD Nanophase Materials Wu, Marvin Research Assistant
Professor PhD Nanophase Materials
Zavalin, Andrey Research Assistant Professor
PhD Nanophase Materials
RESEARCH FACULTY
2001 Fisk University Fact Book
FACULTY/STAFF PROFILES Page 47
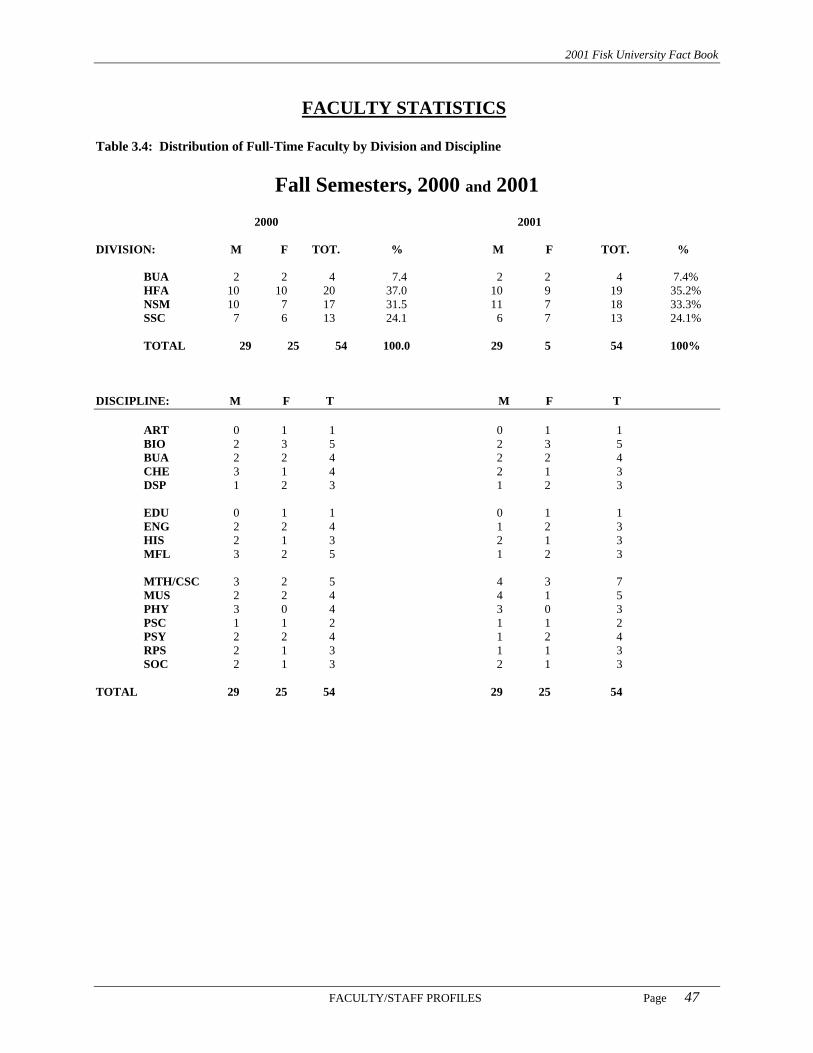
Table 3.4: Distribution of Full-Time Faculty by Division and Discipline
Fall Semesters, 2000 and 2001 2000 2001 DIVISION: M F TOT. % M F TOT. % BUA 2 2 4 7.4 2 2 4 7.4% HFA 10 10 20 37.0 10 9 19 35.2% NSM 10 7 17 31.5 11 7 18 33.3% SSC 7 6 13 24.1 6 7 13 24.1%
TOTAL 29 25 54 100.0 29 5 54 100% DISCIPLINE: M F T M F T ART 0 1 1 0 1 1 BIO 2 3 5 2 3 5 BUA 2 2 4 2 2 4 CHE 3 1 4 2 1 3 DSP 1 2 3 1 2 3 EDU 0 1 1 0 1 1 ENG 2 2 4 1 2 3 HIS 2 1 3 2 1 3 MFL 3 2 5 1 2 3 MTH/CSC 3 2 5 4 3 7 MUS 2 2 4 4 1 5 PHY 3 0 4 3 0 3 PSC 1 1 2 1 1 2 PSY 2 2 4 1 2 4 RPS 2 1 3 1 1 3 SOC 2 1 3 2 1 3 TOTAL 29 25 54 29 25 54
FACULTY STATISTICS

2001 Fisk University Fact Book
FACULTY/STAFF PROFILES Page 48
Table 3.5: Profile of Highest Earned Degree For Full-Time Faculty
Fall Semester, 2001 MASTERS DOCTORATE TOTAL
BUA 2 2 4 HFA 10 10 20 NSM 3 14 19 SSC 2 11 13
TOTAL 17 37 54
(%) (31.5) (68.5%) (100.0%) Figure 3.1 Profile of Highest Earned Degree For Full-Time Faculty
Fall Semester, 2001
68%
32%
DOCTORATEMASTERS

2001 Fisk University Fact Book
FACULTY/STAFF PROFILES Page 49
Table 3.6: Distribution of Academic Rank of Full-Time Faculty by Division Fall Semester, 2001
Professor Associate Professor
Assistant Professor
Instructor
Lecturer / Other
Total
BUA - 1 2 - 1 4 HFA 1 6 6 - 6 19 NSM 4 6 4 - 4 18 SSC 3 3 4 - 3 13 TOTALS 8 16 16 - 14 54 (%) (14.8%) (29.6%) (29.6%) (0%) (25.9%) (100.0%)

2001 Fisk University Fact Book
FACULTY/STAFF PROFILES Page 50
Figure 3.2 Profile of Academic Rank for Full-Time Faculty
Fall Semester, 2001
15%
30%
0%
26%
30%
Professor
AssociateProfessor
AssistantProfessor
Instructor
Lecturer/ Other
Table 3.7 Distribution of Gender and Tenure for Full-Time Faculty by Division Fall Semester, 2001 MALE FEMALE TOTALS
T NT T NT T NT BUA 1 1 1 1 2 2 HFA 3 6 5 4 10 10 NSM 6 3 5 2 10 7 SSC 4 2 3 4 8 5
SUBTOTALS 14 12 14 11 30 24
(55.6%) (44.4%) TOTALS 26 25 54
(%) (48.1%) (51.9%) (100.0%)

2001 Fisk University Fact Book
FACULTY/STAFF PROFILES Page 51
Figure 3.3: Profile of Gender and Tenure for Full-Time Faculty
Fall Semester, 2001
48%52%
Male Female
56%
44%
Tenured Non-Tenured

2001 Fisk University Fact Book
FACULTY/STAFF PROFILES Page 52
Table 3.8 Distribution by Race for Full-Time Faculty by Division Fall Semester, 2001 BLACK WHITE OTHER TOTAL BUA 3 0 1 4 HFA 13 6 0 19 NSM 10 5 3 18 SSC 9 3 1 13 TOTALS 35 14 5 54 (64.8%) (25.9 (9.3%) (100.0%) Figure 3.4 Profile of Race for Full-Time Faculty
Fall Semester, 2001
65%
26%
9%
Black White Other
Table 3.9: Distribution of Full-Time Faculty by Rank, Race and Gender Fall Semesters, 2000 and 2001

2001 Fisk University Fact Book
FACULTY/STAFF PROFILES Page 53
MALE
2000
2001
B W O TOTAL B W O TOTAL PROFESSOR. 3 3 1 7 2 3 1 6 ASSOCIATE PROFESSOR
4
3
2
9
3 3 2 8
ASSISTANT PROFESSOR.
8
1
-
9
9 1 10
INSTRUCTOR - - - 0 8 0 OTHER 4 - - 4 5
TOTAL 19 7 3 29 19 7 3 29
FEMALE 2000 2001
B W O TOTAL B W O TOTAL PROFESSOR 1 1 - 2 1 1 0 2 ASSOCIATE PROFESSOR
5
2
-
7
7 1 0 8
ASSISTANT PROFESSOR
4
1
1
6
2 3 1 6
INSTRUCTOR - - - 0 0 0 0 0 OTHER 9 1 - 10 8 1 0 9
TOTAL 19 5 1 25 18 6 1 25
Table 3.11: Distribution of Full-Time Faculty by Highest Degree Earned, Race and Gender Fall Semesters, 2000 and 2001
MALE 2000 2001
Black White Other TOTAL Black White Other TOTAL DOCTORATE 13 7 3 23 13 7 3 23 MASTERS 6 - - 6 5 0 0 6 TOTAL 19 7 3 29 18 7 3 29
FEMALE 2000 2001
Black White Other TOTAL Black White Other TOTAL DOCTORATE 9 3 1 13 9 3 1 13 MASTERS 10 2 - 12 10 2 0 12 TOTAL 19 5 1 25 19 5 1 25
SOURCE: Academic Affairs, Human Resources

2001 Fisk University Fact Book
FACULTY/STAFF PROFILES Page 54
Table 3.13: Distribution Of Full-Time, Part-Time, Part-Time FTE And Total FTE Faculty By Division and Program, Fall Semester, 2001
FT PT PT (FTE)* TOTAL FTE
BUA 4 3 .74 4.74
HFA 19 10 2.88 21.88
NSM 18 3 1.13 19.33
SSC 13 8 5.42 18.42
CORE - 7 4 4
HONORS - 1 .33 0.33
TOTAL 54 32 14.50 68.70
*Part-time FTE is calculated by dividing the number of credit hours taught by the part-time faculty by 12, which is a full-time teaching load. Since full-time faculty are associated with a Division, not Core or Honors, it somewhat misleadingly appears for these latter programs that there are no faculty who are employed full-time. Source: Academic Affairs and Banner Data

2001 Fisk University Fact Book
GENERAL INFORMATION Page 55
GENERAL INFORMATION

2001 Fisk University Fact Book
GENERAL INFORMATION Page 56
GENERAL INFORMATION

2001 Fisk University Fact Book
GENERAL INFORMATION Page 57
QUICK FACTS
• Tuition and Fees, Fall Semester, 2001:
Tuition $4,745 Activity Fee 150
• Estimated Academic Year Cost, 2000-01:
Tuition and Fees $9,789 Room and Board $5,182 Books and Supplies $1,000 Transportation $1,700 Miscellaneous $1,800 TOTAL $19,471

2001 Fisk University Fact Book
GENERAL INFORMATION Page 58
Tuition and Fees Table 4.1 Tuition and Student Activity Fee 1992-93 through 2001-02 Student
Activity Fee*
Tuition Tuition
And Fees 2001-02 300 9489 $9,789 2000-01 300 8,740 $ 9,040 1999-00 290 8,480 8,770 1998-99 270 8,000 8,270 1997-98 250 7,500 7,750 1996-97 250 7,078 7,328 1995-96 250 6,490 6,740 1994-95 250 6,300 6,550 1993-94 250 5,990 6,240 1992-93 -- 5,445 5,445
*As part of a recovery strategy. “Student Activity Fee” was included as general fund revenue academic years 1986-87 and 1992-93.
Figure 4.1 Tuition and Student Fees
0
2000
4000
6000
8000
10000
12000
1992-93 1993-94 1994-95 1995-96 1996-97 1997-98 1998-99 1999-00 2000-01 2001-02
Student Activity Fee Tuition Tuition and Fees

2001 Fisk University Fact Book
GENERAL INFORMATION Page 59
Table 4.2 Estimated Academic Year Cost for Resident Undergraduate Student 1997-98 to 2001-02
1997-98 1998-99 1999-00 2000-01 2001-02 Tuition and Fees
$ 7,750 $ 8,270 $ 8,770 $ 9,040 $9,789
Room and Board 4,303 4,650 4,930 5,030 $5,182 Books and Supplies 700 750 800 1,000 $1,000 Transportation 1,113 1,800 1,800 1,700 $1,700 Miscellaneous 1,800 1,800 1,800 1,800 $1,800 Total Estimated Cost
$15,667
$17,270
$18,100
$18,570
$19,471
$0$2,000$4,000$6,000$8,000
$10,000$12,000$14,000$16,000$18,000$20,000
1997-98 1998-99 1999-00 2000-01 2001-02
Estimated Academic Year Cost For Resident Undergraduate Student
1997-981998-991999-002000-012001-02

2001 Fisk University Fact Book
GENERAL INFORMATION Page 65
HOUSING Table 4.3 Capacity and Occupancy Crosthwaite Jubilee Livingston Shane Total Capacity 206 146 190 312 854 Occupancy: 1996 125 -- 134 257 516 (% Capacity) (60.7%) (0.0%) (70.5%) (82.4%) (60.4%) 1997 108 -- 122 243 473 (% Capacity) (52.4%) (0.0%) (64.2%) (77.9%) (55.4%) 1998 147 99 153 151 550 (% Capacity) (71.4%) (67.8%) (80.5%) (48.4%) (64.4%) 1999 159 118 175 142 594 (% Capacity) (77.2%) (80.8%) (92.1%) (45.5%) (69.6%) 2000 158 119 155 172 604 (% Capacity) (76.7%) (81.5%) (81.6%) (55.1%) (70.7%) Figure 4.2 Student Housing Occupancy
Fall Semesters, 1996-2000

2001 Fisk University Fact Book
GENERAL INFORMATION Page 66
Table 4.4 University Buildings by Square Footage
Building Name Gross
Square Footage Year
Constructed
Adult Student Complex 5,800 1992 Basic College 7,925 1955 Biology Research Lab 1,600 1993 Boyd House 2,762 1921 Burrus Hall 6,620 1935 Carnegie 11,994 1907 Cravath 24,520 1929 Crosthwaite Residence Hall 47,086 1962 DuBois 33,189 1959 Faculty Apartments 41,784 1969 Harris House 2,868 1876 Honors Program Building 3,376 1992 Johnson Gymnasium 27,552 1946 Jubilee Residence Hall 55,392 1873 Library and Learning Center 74,610 1969 Little Theatre 2,685 1888 Livingston Residence hall 52,217 1962 Memorial Chapel 10,008 1892 Park-Johnson 32,595 1953 President’s Residence 4,510 1969 Race Relations Institute 2,500 1945 Richardson Alumni House 1,690 1905 Science Lab Building 3,600 1973 Shane Residence Hall 86,680 1973 Spence 31,238 1953 Talley-Brady Chemistry Building 30,021 1931 Van Vechten Gallery 7,460 1881 Table 4.5 Fraternities and Sororities
Social Organization
Year Established On Campus
Fraternities
OMEGA PSI PHI 1926 ALPHA PHI ALPH 1927
KAPPA ALPHA PSI 1927 PHI BETA SIGMA 1927
Sororities
DELTA SIGMA THETA 1926 ALPHA KAPPA ALPHA 1927 SIGMA GAMMA RHO 1945
ZETA PHI BETA 1966
FACILITIES
STUDENT AFFAIRS

2001 Fisk University Fact Book
GENERAL INFORMATION Page 67
Table 4.6 Student Organizations Organization Purpose Student Governing Organizations Panhellenic Council Governing body of Greek organizations Residence Hall Councils Represents residents of and organizes residence halls Student Government Association Provides for student involvement in the institution Production Organizations Fisk Forum Student-run newspaper Forensic Club Student public speaking Fisk Herald Student publication of poetry and prose Jazz Ensemble Performance jazz group Jubilee Singers Fisk’s premier performance group Modern Black Mass Choir Perform gospel works Orchesis Performing Dance Group Oval Student Year Book Pep Band Performs at Basketball Games Stage Crafters Dramatic Performances University Choir Official Chapel Choir WFSK Radio Fisk’s Student Run Radio Station Honor Societies BETA KAPPA CHI Recognizes Achievement and excellence in all sciences MORTAR BOARD Recognizes Support scholarship in all fields of study PHI BETA KAPPA Recognizes undergraduate achievement in liberal arts SIGMA XI Recognizes achievement in scientific research Departmental Honoraries ALPHA GAMMA MU Foreign Languages ALPHA KAPPA DELTA Sociology DELTA MU DELTA Business LAMDA IOTA TAU Literature PSI CHI Psychology Departmental and professional Societies Association for computing machinery Promotes and increases knowledge and applications of modern
computing machinery Business Club Promotes Application of business practices Health Careers Club Promotes student interests in pursuing health careers NOBCCHE Opportunities and responsibilities in chemistry Psychology Club Promotes interaction between students and faculty in psychology Spanish Club Promotes interest in the language and culture of Spain Tanner Art Society Fosters support and interest in the arts Teacher Education Club Promotes interest in careers in teaching

2001 Fisk University Fact Book
GENERAL INFORMATION Page 68
Table 4.6 Student Organizations - Continued
Organization Organization Organization Geographic Clubs and Organizations Alabama Club Georgia Club NY/NJ Club Arkansas Club Kansas Club Oregon Club California Club Louisiana Club Ohio Club Chicago Club Michigan Club Oklahoma Club DC/MD/VA Club Mississippi Club Tennessee Club Florida Club Missouri Club Texas/Oklahoma Club New England Club Wisconsin Club Religious and Spiritual Organizations Baptist Student Union Pentecostal Tabernacle Club Y.E.S. Ministries Nation of Islam Students Wesley Foundation Political, Sports and Social Organizations Big Sister Mentoring and Etiquette NAACP Student of the Circle Cheerleaders Project Restoration of Association of Black Critical Thinkers R.E.A.D. Club Psychology Honda Campus All-Star Challenge Reality Visions Target Hope Club Muslin Student Association Recycle Club Troop Leaders United National Black Women’s Health Song Leaders Weight Lifting Club Pep Squad Wig Splitta Cultural Organizations African Student Association International Student Association Kucheza African Dancers Caribbean Student Union

2001 Fisk University Fact Book
GENERAL INFORMATION Page 69
The office of Institutional Advancement is responsible for private sector fundraising, seeking the understanding and support of the University and its programs. The office serves as liaison to all fundraising initiatives including annual fundraising of the General Alumni Association. Sources of Support
Table 4.7 Major Institutional Support – Fiscal Years 1998-2001 1997 1998 1999 2000 2001 Individuals: Alumni 447,284 883,755 850,168 807,771 1, 231, 605 Non-Alumni 110,514 68,402 277,162 120,556 459,909 Corporations 182,448 462,956 357,714 2,290,971 428,912 Foundations 1,334,833 803,825 1,381,030 989,986 657,451 Other 1,084,602 1,948,824 1,096,704 996,824 792,333
INSTITUTIONAL ADVANCEMENT
$0
$1,000,000
$2,000,000
$3,000,000
$4,000,000
$5,000,000
$6,000,000
1997 1998 1999 2000 2001
Sources of Institutional Support: 1997-2001
19971998199920002001

2001 Fisk University Fact Book
GENERAL INFORMATION Page 70
Table 4.8 Geographical Distribution of Alumni – as of April 2002
STATE STATE STATE
Alabama 223 Maine 5 Oregon 17 Alaska 3 Maryland 351 Pennsylvania 162 Arizona 32 Massachusetts 83 Rhode Island 2 Arkansas 42 California 550 Michigan 327 South Carolina 97 Colorado 36 Minnesota 34 Tennessee 1030 Connecticut 53 Mississippi 77 Texas 401 Delaware 28 Missouri 150 Utah 1 District of Columbia 178 Montano 1 Vermont 1 Florida 286 Nebraska 9 Virginia 199 Georgia 566 Nevada 21 Washington 30 Hawaii 8 New Hampshire 4 West Virginia 3 Idaho 0 New Jersey 168 Wisconsin 41 Illinois 487 New Mexico 5 Wyoming 1 Indiana 159 New York 339 Nevada 142 Iowa 4 North Carolina 162 Kansas 24 North Dakota 0 Puerto Rico 2 Kentucky 88 Ohio 484 Virgin Island 20 Louisiana 82 Oklahoma 52 Table 4.9 Foreign Country Residence of Alumni, as of April 2002
COUNTRY NUMBER
APO 3 Australia 1 Bahamas 41 Bermuda 1 British West Indies 1 Canada 5 China 6 England 3 Germany 3 Jamaica 4 Japan 1 Mexico 1 Nigeria 2 South Africa 1 Sweden 1 West Indies 3 Zimbabwe 2 Table 4.10 Alumni Clubs, as of April, 2002
ALUMNI

2001 Fisk University Fact Book
GENERAL INFORMATION Page 71
LOCATION STATE CLUB PRESIDENT
Atlanta Area GA Nancy Hall Baltimore MD Peter Buchanan Birmingham AL Jacqueline Williams Boston MA Helen Randolph Chicago IL Andrew L. Brown Cincinnati OH Alice Church Cleveland OH LaNita Brooks Dallas TX Susan Batie Dayton (Miami Valley) OH Gail Rowe Detroit MI Maurice Shane Gary/NW Indiana IN Chester Bell Hampton Roads VA George Tillerson III Hartford CT Valerie Williams Houston TX Byron Cobbin Indianapolis IN LaMar Ford Los Angeles CA Elroy Bond Memphis TN Carole Strong Thompson Miami FL Brenda Benedict Lee Nashville Electric Service TN Hershell Warren New Orleans LA Karl Turner New York NY Lydell Tyson Oakland/San Francisco Area CA Alphonso Campbell Palm Beach FL DeNeal Cunningham Philadelphia PA Tyrone Stevens Drummond Portland OR Theresa Williams-Stoudamir Sacramento/Stockton Area CA Dorothea Peeler Seattle WA Jessilyn Hall Whitehead St. Louis MO Darren Adams Twin Cities MN James Montague, Jr. Washington (DC)/Silver Springs MD Gloria Elliott
Table 4.13 General Alumni Association of Fisk University – Board of Trustees 2001-2002 Chairman Will J. Carter 300 M Street SW #N801 Washington, DC 20024 Vice Chairman Van A. Pinnock 7874 Highway 100 Nashville, TN 37221 Secretary Donna Burns Bryant 10614 Shasta Court Damascus, MD 20872 Treasurer Elna Green Benefee 3421 Bruner Court Nashville, TN 37211 Parliamentarian Carita Harrison Reaves 1628 Peabody Memphis, TN 38104

2001 Fisk University Fact Book
GENERAL INFORMATION Page 72
General Counsel Denise Billye Sanders, JD 3514 Geneva Circle Nashville, TN 37209 Alumni Trustee Barbara Landers Bowles 5015 S. Ellis Chicago, IL 60615 Alumni Trustee Thomas C. Rozzell, ScD 6728 Goutheir Road Falls Church, VA 22042

2001 Fisk University Fact Book
FINANCE Page 73
FINANCES

2001 Fisk University Fact Book
FINANCE Page 74
HIGHLIGHTS OF FY 2001
Total current fund revenues for FY 2001 were approximately $19 million, down 9.5% from FY 2000.
Government grants and contracts and private gifts and grants for 2001 were down 9% and
up 103%, respectfully from FY 2000. In FY 2001, net tuition and fees was $3.9 million.
Education and general (E & G) revenues per student were $18,132 for FY 2001, down $4,780 from FY 2000 level.
Tuition and Fees (25%) and private gifts and grants (41%) combine for about half (66%)
of all revenues.
Total current fund expenditures were $20.7 million for FY 2001, down .5% from FY 2000.
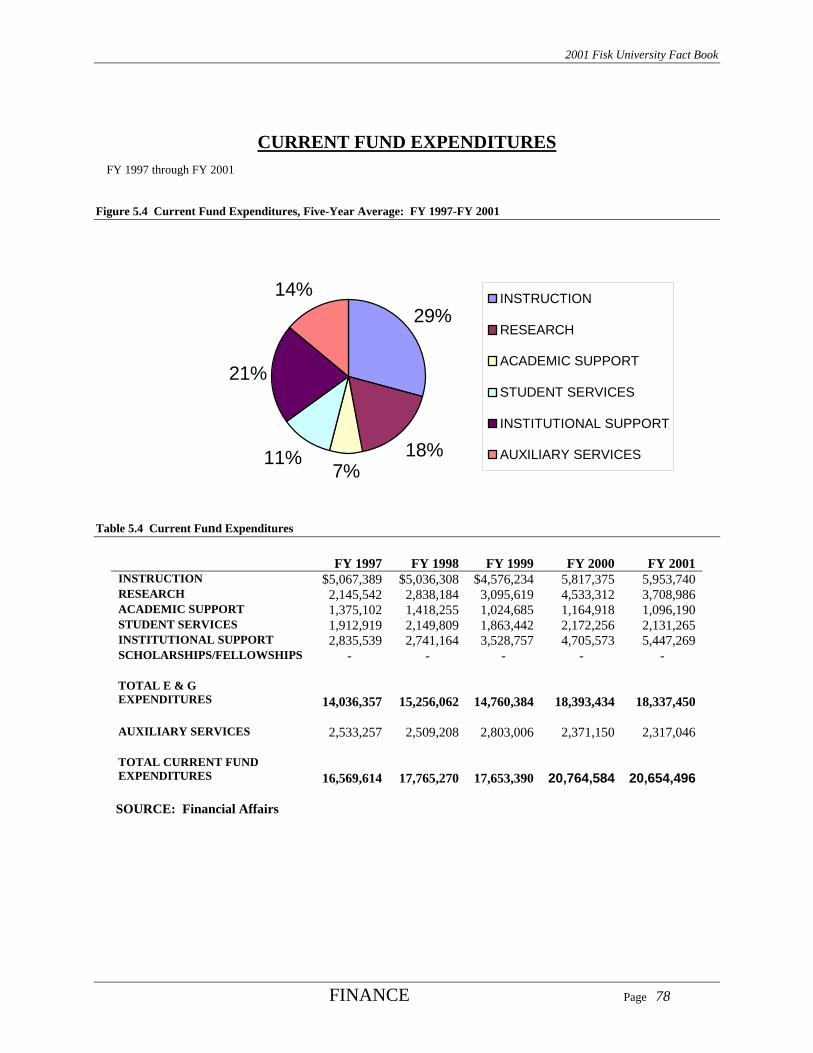
Academically related expenditures for 2001 totaled 59% of E & G expenditures: cost of
instruction, 32%; research, 20%; and academic support, 6%. The five-year average for research is 20% of E & G expenditures.
Net auxiliary enterprise revenue for FY 2001 was $1,012,257.
FINANCIAL PROFILE

2001 Fisk University Fact Book
FINANCE Page 75
FY 1997 through FY 2001 Figure 5.1 Current Fund Revenues, Expenditures and Balances
TOTAL CURRENT FUND REVENUES
$0
$5,000,000
$10,000,000
$15,000,000
$20,000,000
$25,000,000
FY1997
FY1998
FY1999
FY2000
FY2001
TOTAL CURRENT FUND EXPENDITURES
0
5,000,000
10,000,000
15,000,000
20,000,000
25,000,000
FY1997
FY1998
FY1999
FY1999
FY2000
FY2001
TOTAL CURRENT FUND BALANCE
-2,000,000
-1,000,000
0
1,000,000
2,000,000
FY 1997 FY 1998 FY 1999 FY 2000 FY 2001
Table 5.1 Current Fund Revenues, Expenditures and Balances
FY 1997 FY 1998 FY 1999 FY 2000 FY 2001 TOTAL CURRENT FUND REVENUES
$16,260,567
$18,663,021
$17,485,587
$20,826,572
$18,941,372
TOTAL CURRENT FUND EXPENDITURES
$16,569,614
$17,765,270
$17,563,390
$20,764,583
$20,654,495
CURRENT FUND BALANCE
$1,810,937
$897,742
($77,803)
$61,989
($1,713,123)
SOURCE: Financial Affairs
CURRENT FUND REVENUES, EXPENDITURES AND BALANCES

2001 Fisk University Fact Book
FINANCE Page 76
FY 1997 through FY 2001
Figure 5.2 Current Fund Revenues, Five-Year Average: FY 1997-FY 2001
6%
26%26%
22%
3%
17%
TUITION & FEES
GOVERNMENT GRANTS
PRIVATE GIFTS/GRANTS
ENDOWMENT INCOME
OTHER REVENUES
AUXILIARY ENTEPRISES
Table 5.2 Current Fund Revenues
FY 1997 FY 1998 FY 1999 FY 2000 FY 2001 TUITION & FEES $4,366,076 $3,882,593 $4,648,637 $4,487,465 $3,877,536 GOVERNMENT GRANTS 4,025,028 5,198,302 4,661,688 6,234,026 5,690,938 PRIVATE GIFTS/GRANTS 4,601,477 5,215,151 4,164,173 4,760,400 6,412,283 ENDOWMENT INCOME 1,415,922 1,171,734 973,389 1,636,099 (1,057,058) OTHER REVENUES 683,778 886,125 255,651 504,175 688,270 TOTAL EDUCATION & GENERAL REVENUES 15,092,281 16,353,905 14,703,538 17,622,165 $15,611,969
AUXILIARY ENTERPRISES
2,306,767
2,309,107
2,782,049
3,204,407
3,329,403
TOTAL CURRENT FUND REVENUES
17,399,048
18,663,012
17,485,587
20,826,572
18,941,372
SOURCE: Financial Affairs
CURRENT FUND REVENUES

2001 Fisk University Fact Book
FINANCE Page 77
FY 1997 through FY 2001
Figure 5.3 Education and General Revenues, Five-Year Average: FY 1997-FY 2001
4%5%
32%
32%
27%TUITION & FEES
GOVERNMENT GRANTS
PRIVATE GIFTS/GRANTS
ENDOWMENT INCOME
OTHER REVENUES
Table 5.3 Percent Distribution Of Total Educational And General Revenues:
FY 1997 FY 1998 FY 1999 FY 2000 FY 2001 TUITION & FEES 28.9% 23.7% 31.6% 25% 25% GOVERNMENT GRANTS 26.7% 31.8% 31.7% 36% 36% PRIVATE GIFTS/GRANTS 30.5% 31.9% 28.3% 27% 41% ENDOWMENT INCOME 9.4% 7.2% 6.6% 9% -7% OTHER REVENUES 4.5% 5.4% 1.7% 3% 5% TOTAL EDUCATION & GENERAL REVENUES
$15,092,281
$16,353,905
$14,703,538
$17,622,165
$15,611,969
FULL YEAR FTE ENROLLMENT
835
809
840
909
861
E & G REVENUES PER STUDENT
$18,075
$20,215
$17,504
$22,912
$18,132
SOURCE: Financial Affairs
EDUCATION AND GENERAL REVENUES
2001 Fisk University Fact Book
FINANCE Page 78
FY 1997 through FY 2001
Figure 5.4 Current Fund Expenditures, Five-Year Average: FY 1997-FY 2001
29%
18%7%
11%
21%
14% INSTRUCTION
RESEARCH
ACADEMIC SUPPORT
STUDENT SERVICES
INSTITUTIONAL SUPPORT
AUXILIARY SERVICES
Table 5.4 Current Fund Expenditures
FY 1997 FY 1998 FY 1999 FY 2000 FY 2001
INSTRUCTION $5,067,389 $5,036,308 $4,576,234 5,817,375 5,953,740 RESEARCH 2,145,542 2,838,184 3,095,619 4,533,312 3,708,986 ACADEMIC SUPPORT 1,375,102 1,418,255 1,024,685 1,164,918 1,096,190 STUDENT SERVICES 1,912,919 2,149,809 1,863,442 2,172,256 2,131,265 INSTITUTIONAL SUPPORT 2,835,539 2,741,164 3,528,757 4,705,573 5,447,269 SCHOLARSHIPS/FELLOWSHIPS - - - - - TOTAL E & G EXPENDITURES
14,036,357
15,256,062
14,760,384
18,393,434
18,337,450
AUXILIARY SERVICES 2,533,257 2,509,208 2,803,006 2,371,150 2,317,046 TOTAL CURRENT FUND EXPENDITURES
16,569,614
17,765,270
17,653,390
20,764,584
20,654,496
SOURCE: Financial Affairs
CURRENT FUND EXPENDITURES

2001 Fisk University Fact Book
FINANCE Page 79
FY 1997 through FY 2001
Figure 5.5 Percent Distribution of Education and General Expenditures, Five-Year Average: FY 1997-FY 2001*
33%
20%8%
13%
24%
INSTRUCTION
RESEARCH
ACADEMIC SUPPORT
STUDENT SERVICES
INSTITUTIONAL SUPPORT
*Expenditures are averaged over the period in which the University has used the new FASB standard 117 in preparing financial statement. Table 5.5 Percent Distribution Of Total Education And General Expenditures
FY 1997 FY 1998 FY 1999 FY 2000 FY 2001 INSTRUCTION 36.1% 33.0% 31.0% 32% 32% RESEARCH 15.3% 18.6% 21.0% 24% 20% ACADEMIC SUPPORT 9.8% 9.3% 6.9% 6% 6% STUDENT SERVICES 13.6% 14.9% 12.6% 12% 12% INSTITUTIONAL SUPPORT 20.2% 18.0%
23.9% 26% 30%
SCHOLARSHIPS/FELLOWSHIPS - - - - - TOTAL E & G EXPENDITURES + MT
$14,036,357
$15,256,062
$14,760,384
18,393,433
18,337,450
SOURCE: Financial Affairs
PERCENT DISTRIBUTION OF EDUCATION AND GENERAL EXPENDITURES

2001 Fisk University Fact Book
FINANCE Page 80
Year Ended June 30, 2001
(With Comparative Totals For 2000) Table 5.6 Statements of Current Funds, Revenues, Expenditures, and Other Changes FISCAL YEAR 2000 2001 REVENUES: TUITION AND FEES 4,487,465 3,877,536 PRIVATE GIFTS AND GRANTS 4,760,400 6,412,283 GOVERNMENT GRANTS/CONTRACTS 6,234,026 5,690,938 INVESTMENT INCOME 1,636,099 (1,057,058) SALES/AUXILIARY ENTERPRISES 3,204,407 3,329,403 OTHER INCOME 504,175 688,270 TOTAL REVENUES 20,826,572 18,941,372 EXPENSES: INSTRUCTION 5,817,375 5,953,740 RESEARCH 4,533,312 3,708,986 ACADEMIC SUPPORT 1,164,918 1,096,190 STUDENT SERVICES 2,172,256 2,131,265 INSTITUTIONAL SUPPORT 4,705,573 5,447,269 EXPENSES/AUXILIARY ENTERPRISES 2,371,150 2,317,046 TOTAL EXPENSES 20,764,584 20,654,496 CHANGE IN ASSETS 61,988 (1,713,123)
SOURCE: FY 2001 Audit Report, FY 2000 Audit Report, WPG CPA’s
STATEMENTS OF CURRENT FUNDS, REVENUES, EXPENDITURES, AND OTHER CHANGES