decades of disparity
TRANSCRIPT

Decades of Disparity Ethnic Mortality Trends
in New Zealand 1980–1999
Public Health Intelligence Occasional Bulletin Number 16

Citation: Ajwani S, Blakely T, Robson B, Tobias M, Bonne M. 2003. Decades of Disparity: Ethnic mortality trends in New Zealand 1980-1999. Wellington: Ministry
of Health and University of Otago.
Published in July 2003 by the Ministry of Health
PO Box 5013, Wellington, New Zealand
ISBN 0-478-25660-4 (Book) ISBN 0-478-25661-2 (Website)
HP 3641
This document is available on the Ministry of Health’s website: http://www.moh.govt.nz
and the New Zealand Census–Mortality website: http://www.wnmeds.ac.nz/nzcms-info.html

Decades of Disparity: Ethnic Mortality Trends in New Zealand 1980–1999 iii
Foreword In New Zealand, as elsewhere, inequalities in health exist between ethnic and socioeconomic groups, people living in different geographic areas, people belonging to different generations, and between males and females. These inequalities are not random: in all countries, socially disadvantaged and marginalised groups have poorer health, greater exposure to health risks, and lesser access to high-quality health services. In addition, indigenous peoples tend to have poorer health. In New Zealand the extent of these inequalities is unacceptable. Inequalities in access to and decisions over resources are the primary cause of health inequalities. Differential access to health services – and in the quality of care provided to patients – also contribute to unequal health outcomes. These structural inequalities may explain more of ethnic inequalities in health than is often recognised. Existing measures may not fully capture the dimensions and impacts of socioeconomic position relevant for different ethnic groups; cross sectional studies fail to take the effect of cumulative disadvantage over the lifecourse into account. Nevertheless, it appears likely that discrimination makes an independent contribution to ethnic inequalities in health in New Zealand – albeit one that is not currently well quantified or understood. While discrimination may affect health partly through socioeconomic pathways, the experience of personal discrimination or institutional bias may also affect health more directly, through psychosocial stress. Decades of Disparity: Ethnic Mortality Trends in New Zealand 1980–1999 represents an important contribution to this debate. For the first time, we have reliable estimates of ethnic specific mortality – estimates that are adjusted for the historical undercounting of Mäori and Pacific deaths. This has allowed us to correct the historical record and analyse trends in ethnic inequality in mortality over a period of major social change. The results are of great concern: while life expectancy has improved dramatically for the majority ethnic group over the past 20 years, for Mäori and Pacific ethnic groups it has remained static. The key contributor has been differential chronic disease mortality in middle and older ages – especially ischaemic heart disease, diabetes and cancer mortality. This information should mobilise all sectors of government and the community – not just the health sector – to redouble our efforts to address this legacy of increasing ethnic inequality in survival chances. At the same time, the health sector clearly has a special responsibility to improve access to and provision of health care for those in greatest need.
Don Matheson Deputy Director-General (Public Health)

iv Decades of Disparity: Ethnic Mortality Trends in New Zealand 1980–1999
Acknowledgements This study is a joint project of the Wellington School of Medicine and Health Sciences (University of Otago) and the Public Health Intelligence group of the Ministry of Health. The writers comprised Shilpi Ajwani and Tony Blakely (Department of Health) and Bridget Robson (Eru Pomare Mäori Health Research Centre) from the School of Medicine, and Martin Tobias and Martin Bonne from the Ministry. This report represents one output from the New Zealand Census – Mortality Study (NZCMS), which is funded jointly by the Ministry of Health and the Health Research Council of New Zealand. The NZCMS is conducted in close collaboration with Statistics New Zealand. The adjustment ratios used in this report to correct mortality rates are calculated from NZCMS data that are stored on-site at Statistics New Zealand. We wish to thank the Mäori and Pacific people and organisations that participated in a consultative seminar in March 2003 regarding the content of this report, and the peer reviewers of the report both within and outside the Ministry of Health.
Summary Statistics New Zealand Security Statement regarding the NZCMS (The full security statement is in a technical report to be published by the Wellington School of Medicine in hard copy and at http://www.wnmeds.ac.nz/nzcms-info.htm.)
The (New Zealand Census Mortality Study) NZCMS is a study of the relationship between socioeconomic factors and mortality in New Zealand, based on the integration of anonymised population census data from Statistics New Zealand and mortality data from the New Zealand Health Information Service.
The project was approved by Statistics New Zealand as a Data Laboratory project under the Microdata Access Protocols in 1997. The data sets created by the integration process are covered by the Statistics Act and can be used for statistical purposes only. Only approved researchers who have signed Statistics New Zealand’s declaration of secrecy can access the integrated data in the Data Laboratory. For further information about confidentiality matters in regard to this study please contact Statistics New Zealand.

Decades of Disparity: Ethnic Mortality Trends in New Zealand 1980–1999 v
Contents
Foreword iii
Acknowledgements iv
List of Figures vii
List of Tables viii
Executive Summary ix
Chapter 1: Introduction 1 1.1 Background 1 1.2 Objectives of this report 2 1.3 Concepts and measurement of ethnicity 2 1.4 Mortality rates used in this report 4
Chapter 2: Methods 6 2.1 Data sources 6 2.2 Calculation of adjustment ratios 6 2.3 Calculation of adjustment ratios for age groups less than one year and more
than 74 years 7 2.4 Calculation of adjusted mortality rates 8 2.5 Life expectancy 9 2.6 Validation of the study 9
Chapter 3: All-cause Mortality 10 3.1 Mortality rates 10 3.2 Life expectancy 21
Chapter 4: Cause-specific Mortality 27 4.1 Mortality rates 27 4.2 Cause-substituted life expectancy 42
Chapter 5: Discussion 45 5.1 Key findings 45 5.2 Study limitations 45 5.3 Context 46 5.4 Why are we observing these ethnic mortality trends? 48 5.5 Where to from here? 53
References 55
Appendix 1: Smoothed Adjustment Ratios by Five-Year Age Groups 59

vi Decades of Disparity: Ethnic Mortality Trends in New Zealand 1980–1999
Appendix 2: NZCMS Validation Study 62
Appendix 3: Tables of Standardised Mortality Rates and Ratios 64
Appendix 4: Results – Sole Series 99
Appendix 5: Mortality Rates by Five-year Age Categories 111

Decades of Disparity: Ethnic Mortality Trends in New Zealand 1980–1999 vii
List of Figures Figure 1: Mäori and Pacific census population, 1981–96 4 Figure 2: Standardised mortality rates, all ages, by ethnicity and gender 11 Figure 3: Standardised rate ratios, all ages, by ethnicity and gender 12 Figure 4: Age-specific mortality rate, by gender and age group (prioritised series) 15 Figure 5: Age-specific mortality rates, by gender and age group (sole series) 17 Figure 6: Mortality rate ratios, by gender and age group 18 Figure 7: Sole and prioritised Mäori mortality rates, by age group, genders pooled 20 Figure 8: Sole and prioritised Pacific mortality rates, by age group, genders pooled 21 Figure 9: Life expectancy, by age (prioritised series) 23 Figure 10: Life expectancy, by age (sole series) 24 Figure 11: Life expectancy increases for Mäori and Pacific people, by gender, following
substitution of non-Mäori non-Pacific mortality rates for selected age groups 26 Figure 12: Cause-specific standardised mortality rates, ages 1–74 years, by gender
(prioritised series) 28 Figure 13: Cause-specific standardised mortality rates, ages 1–74 years, by gender (sole
series) 29 Figure 14: Standardised mortality rates, ages 1–74 years, by gender – specific causes
(prioritised series) 32 Figure 15: Mortality rate in 35–64 and 65–74-year-old males and females for cancers and
cardiovascular diseases (prioritised series) 35 Figure 16: Mortality rate in 1–14, 15–24 and 25–44-year-old males and females for
unintentional injuries and road traffic crashes (prioritised series) 39 Figure 17: Mortality rate in 15–24, 25–44 and 45–74-year-old males and females for
suicide (prioritised series) 41 Figure 18: Cause-substituted life expectancy at birth, by gender, categories I, II, and III
(prioritised series) 42 Figure 19: Cause-substituted life expectancy at birth, by gender, specific causes
(prioritised series) 44 Figure 20: Mäori and non-Mäori life expectancy, by gender, 1950–2000 47 Figure 21: Example of smoothing 59

viii Decades of Disparity: Ethnic Mortality Trends in New Zealand 1980–1999
List of Tables Table 1: Ethnic series used in this report and as identified in 1981, 1986, 1991 and 1996
census data 4 Table 2: Smoothed adjustment ratios used in this report 60

Decades of Disparity: Ethnic Mortality Trends in New Zealand 1980–1999 ix
Executive Summary During the 1980s and early 1990s Mäori and Pacific mortality was seriously undercounted. The undercounting occurred because ethnicity was recorded differently on death registration forms than in the census. Until recently it was not possible to estimate the extent of this numerator–denominator bias in ethnic specific mortality rates, with the result that the ethnic mortality time series was unreliable.
The New Zealand Census–Mortality Study, a record linkage study in which death registration data is linked anonymously and probabilistically to census data, has finally allowed this bias to be unlocked. Using undercount adjusters derived from this study, we have recalculated ethnic specific mortality rates for the 20-year period 1980–1999. For the first time we have an ethnic mortality time series that is largely free of numerator – denominator bias and can be considered valid and reliable.
Ethnic-specific mortality rates adjusted for numerator–denominator bias have been calculated for Mäori, Pacific and non-Mäori non-Pacific ethnic groups, defined according to both sole and prioritised concepts of ethnicity. The key finding is that mortality rates declined steadily over the observation period for both genders and at all ages for the non-Mäori non-Pacific ethnic group, whichever definition of ethnicity is used. By contrast, both Mäori and Pacific ethnic groups showed little change. The result has been a progressive widening of the gap in survival chances between the ethnic groups over the 20 years. For example, the gap in life expectancy at birth for males increased from 6.3 years at the beginning to 9.9 years at the end of the period, comparing Mäori with non-Mäori non-Pacific ethnic groups (prioritised series).
Most of this increase in inequality has arisen from widening differentials in chronic disease mortality in middle and old age. These two age groups now contribute about equally to the ethnic disparities in life expectancy at birth.
Among the chronic diseases, cardiovascular mortality has decreased over the 20 years for all ethnic groups – but more rapidly for non-Mäori non-Pacific than other ethnic groups (especially for ischaemic heart disease mortality among males). This cause still ranks highest as a contributor to the total ethnic gap. However, cancer mortality is making an increasing contribution to the gap for both Mäori and Pacific ethnic groups. In fact, cancer mortality has increased among both these ethnic groups, while decreasing slightly for the non-Mäori non-Pacific ethnic group. Diabetes and chronic lung diseases also make a substantial contribution to the ethnic mortality gaps.
Beyond chronic disease mortality, unintentional injury (including road traffic crash) mortality has decreased more or less equally for all three ethnic groups, whereas suicide mortality has increased among the 15–44 age group, especially for Mäori males.
These mortality trends coincide with major structural changes in New Zealand society in the 1980s and 1990s, changes that impacted differentially on the three ethnic groups. Differential access to health care, and disparities in the quality of the health care provided to patients, may represent additional explanations and provide further intervention points for policy.

x Decades of Disparity: Ethnic Mortality Trends in New Zealand 1980–1999

Decades of Disparity: Ethnic Mortality Trends in New Zealand 1980–1999 1
Chapter 1: Introduction
1.1 Background To achieve its health and independence objectives, the Government requires reliable and valid information on population health outcomes, how equitably these outcomes are distributed, and the causes or determinants of both the level and distribution of these health outcomes. This information is required to monitor trends, project future need for government intervention, and evaluate the effectiveness and efficiency of these policies. Socioeconomic and ethnic inequalities in mortality are health outcomes of particular concern (Howden-Chapman and Tobias 2000). Yet reliable comparisons of mortality rates across ethnic groups and over time have always been problematic in New Zealand. This report aims to provide policy makers and others with accurate estimates for mortality rates (all-cause and by-cause) for Mäori, Pacific and European/Other New Zealanders (described in this report as non-Mäori non-Pacific people) for the 1980s and 1990s, a period of major structural change in the New Zealand economy and society. The mortality estimates are obtained using ‘adjusters’ derived from the New Zealand Census–Mortality Study (NZCMS), a record linkage study that anonymously and probabilistically links census and mortality data (Blakely 2002; Blakely et al 2000). Before discussing the method in detail, the origin of numerator–denominator bias in the estimation of ethnic mortality rates needs to be understood. To calculate Mäori mortality rates (for example) we routinely proceed as follows. First, we obtain data from death registration forms for the number of Mäori deaths in each gender-by-age category (the numerator) for a particular time period. Second, we obtain census data for the number of Mäori people in each of the same gender-by-age categories at risk of dying in the same period as that in which the deaths occurred (the denominator). Third, we divide the death counts by the population counts to derive the age- and gender-specific Mäori mortality rates (which could be for all causes of death or for a specified cause of death). Unfortunately, this process yields inaccurate (often very inaccurate) Mäori and Pacific mortality rates. Why? Because the way ethnicity data are collected differs between the mortality and census records. Ethnicity on the death registration form is elicited by the funeral director from the next of kin, whereas on the census form ethnicity is self-reported. Also, for a period in the 1980s and early 1990s the ethnicity questions on the death registration form and the census forms were inconsistent, being based on a biological concept (ie, percentage of blood) in the former and a sociocultural concept (ie, cultural affiliation) in the latter. Coding rules have also differed between the two data sources, with ethnicity questions not being compulsory for all ethnic groups on the death registration form up to 1995. Instead, ethnicity was recorded only for Mäori and Pacific deaths, and all deaths with missing ethnicity data were classified as non-Mäori non-Pacific. All these factors resulted in severe underestimation of Mäori and Pacific deaths during the 1980s and early 1990s (Ajwani et al 2002; Blakely et al 2002; Ajwani et al 2003).

2 Decades of Disparity: Ethnic Mortality Trends in New Zealand 1980–1999
Since 1995 the degree of bias has lessened. This improvement has resulted from major changes to the way ethnicity has been recorded on death certificates since 1995 (Ajwani et al 2002), which aligned the recording of ethnicity across all vital records with the census.
1.2 Objectives of this report The objectives of this report are to estimate:
• trends in mortality rates among Mäori, Pacific and non-Mäori non-Pacific ethnic groups, during the 1980s and 1990s
• differences in mortality rates between Mäori, Pacific and non-Mäori non-Pacific ethnic groups during the 1980s and 1990s.
The reason we can now tackle these objectives is the availability of the anonymous and probabilistic record linkage of census and mortality records carried out within the NZCMS. This study has created cohorts of census respondents followed up for mortality in order to study social inequalities in health (Blakely et al 2000; Hill et al 2002). However, as a result of the linkage of census and mortality records, it is also possible to quantify the amount of undercounting of Mäori and Pacific deaths relative to census counts. The ethnicity recorded on the linked census questionnaire – the ‘gold standard’ – is compared to that recorded on the death registration form (Ajwani et al 2002; Blakely et al 2002; Ajwani et al 2003). This report uses the NZCMS to recalculate mortality rates by ethnicity during the 1980s and 1990s. It is important to note that the NZCMS allows us to estimate adjusters for numerator–denominator bias in ethnic mortality rates at each census, but does not adjust for drift in the way New Zealanders self-identify their ethnicity in different censuses over time. It is for this reason that some caution should still be exercised in interpreting the apparent trends in ethnic mortality over the 20-year observation period. The main audience for this report is health researchers, policy analysts, health service providers and communities interested in ethnic differences in health. As well as the substantive results, the report also highlights the importance of accurately recording ethnicity in all surveys and administrative records.
1.3 Concepts and measurement of ethnicity
Census data The 1981 and 1986 censuses defined ethnicity in terms of ‘ethnic origin’. The 1991 census changed the definition from ethnic origin to that of ethnic group. The ethnicity question on the 1996 census was further modified to include extra categories, and encouraged multi-ethnic responses, although the underlying concept of self-identified cultural affiliation remained unchanged. Each ethnic group in all the censuses could be categorised into ‘sole’ and ‘prioritised’ series.

Decades of Disparity: Ethnic Mortality Trends in New Zealand 1980–1999 3
Sole ethnic group was assigned as Mäori if only one ethnic group was self-identified, and that was Mäori (or half or more Mäori ethnic origin in the 1981 census). The sole group was assigned as Pacific if the census form recorded only one self-identified ethnic group, and that was Pacific (or half or more Pacific ethnic origin in the 1981 census). The remainder were assigned as non-Mäori non-Pacific. Prioritised ethnic group was assigned as Mäori if one of the three possible self-identified ethnicity responses recorded on the 1986, 1991 or 1996 censuses was Mäori. Therefore, for Mäori, the prioritised ethnic group represents the total Mäori ethnic group (MEG). For those not allocated as Mäori, the prioritised ethnic group was assigned as Pacific if one of the self-identified ethnic groups was Pacific. The remainder were assigned as non-Mäori non-Pacific. Note that the Pacific prioritised ethnic group did not represent the total number of census respondents who identified one ethnic group as Pacific – some of these people also self-identified as Mäori and were therefore categorised as prioritised Mäori. Similar comments apply to the prioritised non-Mäori non-Pacific group, with the result that the non-Mäori non-Pacific group in the prioritised series actually represents only those people who recorded no Mäori or Pacific affiliation. In the 1981 census those who recorded any degree of Mäori ethnic origin were categorised as prioritised Mäori (or MEG). Of the rest, those who recorded any degree of Pacific ethnic origin in the 1981 census were categorised as prioritised Pacific. Although the definition is not identical to the 1986 and 1991 censuses, it is similar enough to form a time series.
Mortality data Between 1981 and 1995 the recording of ethnicity on the death certificate was different from that on the census. The concept of ethnicity used in the former was biological race (half or more blood). The data were collected only for Mäori and Pacific groups and were based on questions about the percentage of blood of the parents of the deceased rather than the deceased him- or herself. The funeral directors often guessed or assumed the extent of ‘blood’ or did not complete the section at all (Pomare et al 1995). If the section was not completed (ie, data were missing) then the deceased was classified as non-Mäori non-Pacific by default. From September 1995 the death certificate was redesigned with a comparable question to the self-identified ethnicity question in the 1996 census, including allowance for multiple ethnic identities. Completion of the ethnic field was made mandatory.

4 Decades of Disparity: Ethnic Mortality Trends in New Zealand 1980–1999
1.4 Mortality rates used in this report We present two series of ethnic mortality rates in this report, based on sole and prioritised concepts of ethnicity, as represented in census data (Table 1). Table 1: Ethnic series used in this report and as identified in 1981, 1986, 1991 and 1996
census data
Series 1980–84 1985–89 1990–94 1995–99
Sole • Half or more Mäori
• Half or more Pacific
• Rest
• Only one self-identified ethnic group, and that was Mäori
• Only one self-identified ethnic group, and that was Pacific
• Rest
Prioritised • Any Mäori
• Any Pacific (if no Mäori origin)
• Rest
• Mäori on one of up to three self-identified categories
• Pacific on one of up to three self-identified categories, and not self-identified as Mäori
• Rest
Neither the sole nor the prioritised series are completely comparable over time. The 1981 census collected quantums of ethnic origin. The 1986 census continued to collect data on ethnic origin, using similar categories, but not as quantums. The 1991 census question was the same but used the term ‘ethnic group’. The 1981 census groupings probably coincide relatively well with the ethnicity groupings in the following years, but the concordance is not exact. The 1996 census added extra categories, and saw a marked increase in the number of people self-identifying with two or more ethnic groups. In particular, the number of people categorised as belonging to the total Mäori ethnic group (ie, prioritised) in 1996 jumped markedly from that expected based on the 1991 census. Conversely, the number of people categorised as sole Mäori in 1996 fell markedly from that expected based on the 1991 census. These changes are shown in the figure below. Figure 1: Mäori and Pacific census population, 1981–96
Sole ethnic group Prioritised ethnic group
0
50
100
150
200
250
300
350
1981 1986 1991 1996
Census population (per 100,000)
0
100
200
300
400
500
600
1981 1986 1991 1996
Census population (per 100,000)
Mäori Pacific

Decades of Disparity: Ethnic Mortality Trends in New Zealand 1980–1999 5
What do these changes between 1991 and 1996 mean for comparing mortality rates over time? We would expect the 1996 prioritised Mäori and Pacific mortality rates to be underestimated, and the corresponding sole rate to be overestimated, relative to the 1991 (and earlier) rates. It is important to emphasise that the adjustment for numerator–denominator bias reported here does not correct for these variations in ethnic identification between censuses, whether arising from cultural shifts in ethnic identification or simply from wording changes in the census ethnicity questions. In this report we present adjusted Mäori, Pacific and non-Mäori non-Pacific estimates, for each of the sole and prioritised series for:
• all-cause mortality rates – all ages – by age group (1–14, 15–24, 25–44, 45–64 and 65–74 years)
• life expectancy – at birth – at selected ages (15, 45 and 65 years)
• age-substituted life expectancy at birth – by age group (1–14, 15–44, 45–64 and 65+ years)
• cause-specific mortality rates – all ages – by age group
• cause-substituted life expectancy at birth – by selected causes.

6 Decades of Disparity: Ethnic Mortality Trends in New Zealand 1980–1999
Chapter 2: Methods
2.1 Data sources
Mortality Mortality data were provided by the New Zealand Health Information Services (NZHIS) for the years 1980–99 by year of registration of death. Years were grouped into four periods: • 1980–84 (five years) • 1985–89 (five years) • 1990–95 (six years) • 1996–99 (four years). Periods were designed to reflect the denominator census years and the period following each census for which NZCMS ethnicity adjusters were derived (see below). Briefly, the adjusters were based on mortality data for the three years following census night, which is approximately the central three years of each of the above four periods. The third period was extended from five to six years to coincide with the change in ethnicity concept on the death certificate from biological to cultural, which occurred during the last quarter of 1995. Accordingly, the fourth period comprises only four rather than five years. For each period, ethnicity was available both as ‘sole’ and ‘prioritised’, as described above.
Population at risk Sole and prioritised ethnic population denominators were extracted from the 1981, 1986, 1991 and 1996 censuses as described in the Introduction.
2.2 Calculation of adjustment ratios The methodology has been described in detail in a technical report (Ajwani et al 2002). Briefly, mortality records for the three years following each of the 1981, 1986, 1991 and 1996 censuses were anonymously and probabilistically linked back to the corresponding census record to generate four cohort data sets. Approximately 75% of the mortality records were successfully linked. In order to compensate for any possible linkage bias, each of the four data sets was weighted. To determine ethnic numerator–denominator bias, the linked records were further restricted to ‘highly probably links’ (HPLs), being those linked records for which ethnicity had no effect on the linkage probability. For each of the linked records in the HPL data set, data were available for both the self-identified ethnicity at the previous census and the ethnicity assigned on the death registration form.

Decades of Disparity: Ethnic Mortality Trends in New Zealand 1980–1999 7
The adjustment ratios for the numerator–denominator bias were calculated by cross-classifying the mortality record ethnicity by census ethnicity in the HPL data set. Because of varying inclusion in the HPL data set by ethnic group (and other demographic variables), we used weighted cross-classifications. (See Ajwani et al 2002 for further details.) From these cross-classifications, we derived adjustment ratios. For example, an adjustment ratio of 1.5 for Mäori means that 1.5 times (or 50% more) the number of people who died had self-identified as Mäori on census night than were identified as Mäori on the mortality database. The larger this adjustment ratio, the more severe is the underlying numerator–denominator bias, and the larger will be the underestimation of Mäori mortality rates using routine (or unadjusted) analyses. These adjustment ratios were also calculated for strata of gender, age at death, small area deprivation, health region, rurality and cause of death. There was little variation in the adjustment ratios by gender, level of deprivation or cause of death, but a marked variation for Mäori was observed by age, with greater bias at younger ages. Therefore, we use age-specific adjustment ratios in this report, smoothed over five-year age groups (see Appendix 1 for details of the smoothing process). Adjustment for region is not required in this report as we only present national rates. The application of the adjustment ratios is, in principle, straightforward. For example, assume for a given gender-by-age group in a particular period that the number of Mäori deaths according to mortality data was 100 and the number of Mäori census records was 50,000. Accordingly, the observed mortality rate was 200 per 100,000. However, also assume that for this stratum the adjustment ratio for numerator denominator bias was 1.50. Then the adjusted Mäori mortality rate would be 300 per 100,000. Adjustment ratios by age used in this report are given in Appendix 1.
2.3 Calculation of adjustment ratios for age groups less than one year and more than 74 years
Infancy Adjustment ratios for infant mortality could not be calculated from the NZCMS because of its study design. Instead, ethnicity adjusters for infant mortality were derived by comparing birth registrations with the corresponding census counts for those less than one year of age, by ethnic group. The rationale for this is that the ethnicity reported on infant mortality records has been obtained by linkage to the birth certificate, which was routinely done until at least 1998 (Chris Lewis, New Zealand Health Information Services, personal communication, 2003). The assumption is that the ethnicity recorded on the birth certificate is likely to be more accurate than that recorded on the death certificate. The ratio of the census population under one year of age (for each ethnic group and gender) to (annualised) birth registrations for the corresponding period for each series (sole and prioritised) therefore provides adjusters for the corresponding infant mortality rates.

8 Decades of Disparity: Ethnic Mortality Trends in New Zealand 1980–1999
75+ age group The NZCMS links mortality and census data only for people aged under 75 years on census night. Hence adjusters could not be calculated directly for the 75+ age group. As a result, many analyses reported here are restricted to the 1–74 age group. However, for some analyses, adjusted mortality rates were required for all age groups. For these analyses it was assumed that the same adjusters apply to the 75+ age group as to the 70–74 age group. Note that in all periods, adjusters for the older age groups are low (close to 1), indicating that the impact of numerator–denominator bias among those aged 75+ years on mortality rates is likely to be small.
2.4 Calculation of adjusted mortality rates
Age-specific rates The smoothed adjustment ratios by age were applied to each mortality record in the corresponding five-year age group in order to correct the total number of deaths by ethnicity. The mortality rate (by age and gender) was calculated by dividing the total number of adjusted deaths by the total census count (in that age group and gender). All the rates were calculated per 100,000.
Mortality rate (over a five-year period) = Total number of adjusted deaths * 100,000 Total census count * 5
Standardised mortality rates and ratios To enable comparison of rates between ethnic groups with different age structures, mortality rates have been directly age standardised using the WHO world population as the reference population (WHO 2002). This direct standardisation adjusts for age variation between ethnic groups by multiplying the ethnic-specific five-year mortality rates into the WHO standard age distribution. Both standardised rates (per 100,000) and standardised rate ratios (SRRs) are presented in this report. The SRRs are a relative risk measure, and are calculated for Mäori and Pacific people compared to non-Mäori non-Pacific people. 95% confidence intervals for both rates and rate ratios are presented in the figures and tables. They are calculated as per Rothman and Greenland (1998) using the adjusted numbers of deaths by ethnic group. This calculation may slightly underestimate the 95% confidence intervals among Mäori and Pacific people.
Cause-specific mortality rates Age-specific and age-standardised mortality rates by cause of death were calculated in the same way as the corresponding all-cause rates. Cause of death analyses included selected ICD-9 disease or injury categories, as well as the high-level Global Burden of Disease (WHO 2002) categories: I (communicable, maternal perinatal and nutritional conditions; II (chronic diseases); and III (intentional and unintentional injuries).

Decades of Disparity: Ethnic Mortality Trends in New Zealand 1980–1999 9
2.5 Life expectancy Conventional demographic methods for abridged life-tables were used to calculate life expectancy from central mortality rates. Unlike most of the mortality rate analyses, which were restricted to the 1–74 age range, life table construction required estimation of infant mortality rates and mortality rates for the 75+ age group as well (described above).
Contribution of age- and cause-groups to ethnic disparities in life expectancy To estimate the contribution of mortality at particular ages to the difference in life expectancy at birth (between Mäori and Pacific compared to non-Mäori non-Pacific people), the Mäori and Pacific mortality rates for the age group of interest were replaced by the corresponding non-Mäori non-Pacific rates and the increase in life expectancy at birth was then calculated (age-substituted life expectancy). To show the contribution of mortality differentials with respect to particular causes of death (to the Mäori and Pacific life expectancy at birth compared to non-Mäori non-Pacific), the Mäori and Pacific mortality rates due to cause group(s) of interest were replaced by the corresponding non-Mäori non-Pacific rates in the multi-decrement life tables and the increase in life expectancy at birth was then calculated (cause-substituted life expectancy).
2.6 Validation of the study The mortality rates calculated in this report apply the adjusters from the NZCMS to the routine mortality and census data held by the Ministry of Health. A major reason for this approach was to embed the use of the adjusters in the Ministry of Health’s routine systems. However, the linkage of census and mortality data in the NZCMS also allows a direct calculation of ethnic-specific rates based solely on the linked NZCMS data set. Such analyses were also undertaken as a validation test for the ‘routine’ method. While the two methods would be expected to give similar results, some disagreement is acceptable for at least two reasons:
(1) the weighting used to calculate the numerator–denominator adjusters was different to the weighting used in the NZCMS data to allow for linkage bias (for details see Blakely et al 2000; Fawcett et al 2002; Hill et al 2002)
(2) the follow-up time periods were slightly different (ie, three years post-census for the ‘direct NZCMS’ study compared to five years for the ‘routine data’ study in most instances).
The results of this validation exercise are summarised in Appendix 2 (see electronic version of this report).

10 Decades of Disparity: Ethnic Mortality Trends in New Zealand 1980–1999
Chapter 3: All-cause Mortality
3.1 Mortality rates
Age-standardised mortality rates and ratios Figure 2 presents age-standardised mortality rates for the prioritised and sole ethnic groups for the four time periods. All mortality rates are standardised to the same WHO reference population, so removing any confounding by age. Figure 3 presents the standardised rate ratios (SRRs) for Mäori and Pacific ethnic groups compared to the non-Mäori non-Pacific ethnic group for the sole and prioritised series. The SRR is a relative risk, and is calculated by simply dividing the Mäori or Pacific standardised mortality rate by the non-Mäori non-Pacific rate. An SRR of 1.0 means that the Mäori or Pacific standardised mortality rate was the same as the non-Mäori non-Pacific mortality rate. An SRR of less than 1.0 means a lower mortality rate, and greater than 1.0 means a higher mortality rate than non-Mäori non-Pacific. Both Figures 2 and 3 show results unadjusted as well as adjusted for numerator–denominator bias to demonstrate the sizeable effect of this bias during the 1980s and early 1990s. Mäori and Pacific mortality rates increase markedly after adjustment for numerator–denominator bias for the first three time periods, reflecting the undercounting of Mäori and Pacific deaths in the earlier periods. Unadjusted rates suggest a sudden increase in mortality for both Mäori and Pacific ethnic groups around the mid-1990s. This is clearly spurious. Also, unadjusted rate ratios (Figure 3) suggest that Mäori had similar mortality rates to non-Mäori non-Pacific people until the mid-1990s, and that Pacific people had lower mortality rates. However, when adjusted for numerator–denominator bias, higher mortality rates are now evident for both Mäori and Pacific ethnic groups in all four time periods. Only results adjusted for numerator–denominator bias are presented in the remainder of this report. Non-Mäori non-Pacific ethnic group
For both males and females there was a steady decrease in age-standardised mortality rates among non-Mäori non-Pacific people over time. For the prioritised series, male mortality declined 30% from 919 per 100,000 in 1980–84 to 641 per 100,000 in 1996–99, and female mortality declined 26% from 553 to 407 per 100,000. The pattern was similar for the sole series.

Decades of Disparity: Ethnic Mortality Trends in New Zealand 1980–1999 11
Figure 2: Standardised mortality rates, all ages, by ethnicity and gender
Unadjusted male mortality rate (prioritised) Adjusted male mortality rate (prioritised)
0
300
600
900
1200
1500
1980–84 1985–89 1990–95 1996–99
Standardised mortality rate (per 100,000)
0
300
600
900
1200
1500
1980–84 1985–89 1990–95 1996–99
Standardised mortality rate (per 100,000)
Unadjusted female mortality rate (prioritised) Adjusted female mortality rate (prioritised)
0
200
400
600
800
1000
1980–84 1985–89 1990–95 1996–99
Standardised mortality rate (per 100,000)
0
200
400
600
800
1000
1980–84 1985–89 1990–95 1996–99
Standardised mortality rate (per 100,000)
Unadjusted male mortality rate (sole) Adjusted male mortality rate (sole)
0
400
800
1200
1600
2000
1980–84 1985–89 1990–95 1996–99
Standardised mortality rate (per 100,000)
0
400
800
1200
1600
2000
1980–84 1985–89 1990–95 1996–99
Standardised mortality rate (per 100,000)
Unadjusted female mortality rate (sole) Adjusted female mortality rate (sole)
0
200
400
600
800
1000
1200
1400
1980–84 1985–89 1990–95 1996–99
Standardised mortality rate (per 100,000)
0
200
400
600
800
1000
1200
1400
1980–84 1985–89 1990–95 1996–99
Standardised mortality rate (per 100,000)
Mäori Pacific Non-Mäori non-Pacific
Note: All mortality rates are per 100,000, standardised to the WHO World Population. Error bars are 95% confidence intervals. Data for all charts are provided in Appendix 3.

12 Decades of Disparity: Ethnic Mortality Trends in New Zealand 1980–1999
Figure 3: Standardised rate ratios, all ages, by ethnicity and gender
Unadjusted male mortality rate ratio (prioritised) Adjusted male mortality rate ratio (prioritised)
0.0
0.5
1.0
1.5
2.0
1980–84 1985–89 1990–95 1996–99
Standardised rate ratios (per 100,000)
0.0
0.5
1.0
1.5
2.0
1980–84 1985–89 1990–95 1996–99
Standardised rate ratios (per 100,000)
Unadjusted female mortality rate ratio (prioritised) Adjusted female mortality rate ratio (prioritised)
0.0
0.5
1.0
1.5
2.0
2.5
1980–84 1985–89 1990–95 1996–99
Standardised rate ratios (per 100,000)
0.0
0.5
1.0
1.5
2.0
2.5
1980–84 1985–89 1990–95 1996–99
Standardised rate ratios (per 100,000)
Unadjusted male mortality rate ratio (sole) Adjusted male mortality rate ratio (sole)
0.0
0.5
1.0
1.5
2.0
2.5
3.0
1980–84 1985–89 1990–95 1996–99
Standardised rate ratios (per 100,000)
0.0
0.5
1.0
1.5
2.0
2.5
3.0
1980–84 1985–89 1990–95 1996–99
Standardised rate ratios (per 100,000)
Unadjusted female mortality rate ratio (sole) Adjusted female mortality rate ratio (sole)
0.0
0.5
1.0
1.5
2.0
2.5
3.0
3.5
1980–84 1985–89 1990–95 1996–99
Standardised rate ratios (per 100,000)
0.0
0.5
1.0
1.5
2.0
2.5
3.0
3.5
1980–84 1985–89 1990–95 1996–99
Standardised rate ratios (per 100,000)
Mäori Pacific
Note: Reference category is the non-Mäori non-Pacific group.

Decades of Disparity: Ethnic Mortality Trends in New Zealand 1980–1999 13
Mäori ethnic group
For the prioritised series (or total Mäori ethnic group) there was a small decrease in age-standardised mortality rates over time, once adjusted for numerator–denominator bias (Figure 2). Male mortality declined 8% from 1361 per 100,000 in 1980–84 to 1258 per 100,000 in 1996–99, and female mortality declined 7% from 965 to 894 per 100,000. One possible reason for this modest decline is a marked increase in the number of people categorised as prioritised Mäori in the 1996 census, resulting in a much larger total Mäori ethnic group population in that year than in 1991. For the sole series, the age-standardised Mäori mortality rate in 1996–99 is actually higher than in 1990–95, after adjustment. Part of the reason for this apparent increase in sole Mäori mortality rates is the contraction in the sole Mäori population in the 1996 Census compared to the 1991 Census. Accordingly, both male and female sole Mäori mortality rates in 1996–99 were unchanged relative to the rates in 1980–84 (Figure 2). Pacific ethnic group
Pacific mortality rates during the early 1980s are statistically unstable due to small numbers. That said, there is little evidence for any change in Pacific mortality rates over the 20-year observation period. For the prioritised series, male mortality was 1264 per 100,000 in 1980–84, decreased by 9% in 1985–89 and then remained unchanged through to 1996–99. There was little evidence of any change in female mortality rates over the 20 years. For the sole series, there was possible evidence of a modest increase in Pacific mortality rates over the 20-year period. Again, the change in ethnic group populations between the 1991 and 1996 censuses may partly account for these trends. Mortality differences by ethnicity
Regardless of period, gender and choice of sole or prioritised ethnicity concept, non-Mäori non-Pacific people had the lowest mortality rates, Mäori the highest rates and Pacific people intermediate rates (once adjusted for numerator–denominator bias (Figure 2)). However, as non-Mäori non-Pacific people had falling mortality rates over time whereas Mäori had stable or only modestly decreasing rates, the gap between Mäori and non-Mäori non-Pacific mortality rates widened over the 1980s and 1990s. Likewise, the gap between Pacific and non-Mäori non-Pacific mortality rates also widened over the 1980s and 1990s. This widening of ethnic mortality gaps is evident on both absolute and relative scales. Figure 3 shows the change over time in the standardised rate ratios comparing Mäori (and Pacific) mortality with non-Mäori non-Pacific mortality. Thus it depicts changing relative differences. Considering only the adjusted results, the rate ratio for Mäori males compared to non-Mäori non-Pacific males increased from 1.48 in 1980–84 to 1.96 in 1996–99 (prioritised series). That is, an approximately 50% excess mortality risk for Mäori males (compared to non-Mäori non-Pacific males) in 1980–84 had become a near 100% excess in 1996–99. Similarly, the prioritised rate ratio increased from 1.74 to 2.20 for Mäori females compared to non-Mäori non-Pacific females. Using the sole series, the Mäori rate ratios increased from 1.59 to 2.27 for males and from 1.92 to 2.55 for females.

14 Decades of Disparity: Ethnic Mortality Trends in New Zealand 1980–1999
For Pacific people compared to non-Mäori non-Pacific people, the rate ratios were less than those for Mäori, but still sizeable and increasing over time. For the prioritised series, the rate ratios for Pacific males increased from 1.38 in 1980–84 to 1.79 in 1996–99, while for Pacific females the ratios increased from 1.22 to 1.71 respectively. In summary, there is a clear pattern of increasing gaps in age-standardised mortality rates for both Mäori and Pacific people compared to non-Mäori non-Pacific people over the 1980s and 1990s. That is, while non-Mäori non-Pacific mortality has declined substantially over the 20-year observation period, Mäori and Pacific mortality has shown little change.
Mortality rates by five main age categories Age-specific mortality rates were estimated for five lifecycle stages: 1–14 years (childhood), 15–24 years (youth), 25–44 years (young adulthood), 45–64 years (middle age) and 65–74 years (old age) years. We do not present infant mortality rates as the NZCMS is not well suited to adjusting these rates. We also do not present rates for the age group 75 years and older, as only deaths for people aged up to 74 on census night were linked back to a census record in the NZCMS. Prioritised series
Figure 4 shows the adjusted mortality rates by age group for males and females for the prioritised series (values for the rates and their 95% confidence intervals can be found in Appendix 3). For the non-Mäori non-Pacific ethnic group there is a strong and consistent pattern of decreasing mortality rates for all ages and both sexes over time. The same health gains are not apparent for Mäori and Pacific ethnic groups. For the Mäori ethnic group, taking into account the increased denominator population in 1996 and the width of the confidence intervals, there is little evidence of decreasing mortality rates between 1981 and 1996 in all age groups. (See also Figure 7 for just the Mäori mortality rates.) For Pacific people, the data are less reliable (particularly during the 1980s and among children) because of the small size of the Pacific population. Nevertheless, there appears to be some downward trend in the 1–14 and 15–24 age groups during the 1980s and 1990s, but little change in all other age groups. The relative differences in mortality rates between all three ethnic groups tended to be less at younger ages and during the early 1980s. The most notable relative differences between Mäori and non-Mäori non-Pacific mortality rates occurred among 45–64-year-olds. For example, among males the rate ratio comparing Mäori to non-Mäori non-Pacific ethnic groups was 2.05 during 1980–84 and increased to 3.09 during 1996–99. Among 45–64-year-old females this rate ratio was 2.40 during 1980–84 and increased to 3.56 during 1996–99.

Decades of Disparity: Ethnic Mortality Trends in New Zealand 1980–1999 15
Although not as large as the relative differences for 45–64-year-olds, the relative differences between Mäori and non-Mäori non-Pacific ethnic groups for 25–44 and 65–74-year-olds were also large and increasing over time. Figure 4: Age-specific mortality rate, by gender and age group (prioritised series)
Males 1–14 years (prioritised) Females 1–14 years (prioritised)
0
10
20
30
40
50
60
70
80
90
1980–84 1985–89 1990–95 1996–99
Age-specific mortality rate (per 100,000)
0
10
20
30
40
50
60
70
80
90
1980–84 1985–89 1990–95 1996–99
Age-specific mortality rate (per 100,000)
Males 15–24 years (prioritised) Females 15–24 years (prioritised)
0
50
100
150
200
250
300
1980–84 1985–89 1990–95 1996–99
Age-specific mortality rate (per 100,000)
0
50
100
150
200
250
300
1980–84 1985–89 1990–95 1996–99
Age-specific mortality rate (per 100,000)
Males 25–44 years (prioritised) Females 25–44 years (prioritised)
0
50
100
150
200
250
300
350
400
1980–84 1985–89 1990–95 1996–99
Age-specific mortality rate (per 100,000)
0
50
100
150
200
250
300
350
400
1980–84 1985–89 1990–95 1996–99
Age-specific mortality rate (per 100,000)
Mäori Pacific Non-Mäori non-Pacific
(Continued)

16 Decades of Disparity: Ethnic Mortality Trends in New Zealand 1980–1999
Males 45–64 years (prioritised) Females 45–64 years (prioritised)
0
500
1000
1500
2000
2500
1980–84 1985–89 1990–95 1996–99
Age-specific mortality rate (per 100,000)
0
500
1000
1500
2000
2500
1980–84 1985–89 1990–95 1996–99
Age-specific mortality rate (per 100,000)
Males 65–74 years (prioritised) Females 65–74 years (prioritised)
0
1000
2000
3000
4000
5000
6000
7000
8000
1980–84 1985–89 1990–95 1996–99
Age-specific mortality rate (per 100,000)
0
1000
2000
3000
4000
5000
6000
7000
8000
1980–84 1985–89 1990–95 1996–99
Age-specific mortality rate (per 100,000)
Mäori Pacific Non-Mäori non-Pacific
Sole series
The age-specific mortality rates for the ‘sole’ series are shown in Figure 5 (see Appendix 3 for actual values). Most patterns seen in the prioritised series were also evident in the sole series – except for apparent increases in the sole Mäori mortality rates between 1981–84 and 1996–99 for almost all age groups among males, and for younger age groups among females. This results partly from the census population changes in 1996. However, there is no doubt that mortality rates for sole Mäori were consistently higher than those for the total Mäori ethnic group (ie, the prioritised series). Figure 6 shows the age-specific rate ratios for Mäori and Pacific ethnic groups compared to the non-Mäori non-Pacific ethnic group (for both the prioritised and sole series). The consistent pattern is one of increasing relative gaps in mortality over time for all age groups and both series.

Decades of Disparity: Ethnic Mortality Trends in New Zealand 1980–1999 17
Figure 5: Age-specific mortality rates, by gender and age group (sole series)
Males 1–14 years (sole) Females 1–14 years (sole)
0
10
20
30
40
50
60
70
80
90
1980–84 1985–89 1990–95 1996–99
Age-specific mortality rate (per 100,000)
0
10
20
30
40
50
60
70
80
90
1980–84 1985–89 1990–95 1996–99
Age-specific mortality rate (per 100,000)
Males 15–24 years (sole) Females 15–24 years (sole)
0
50
100
150
200
250
1980–84 1985–89 1990–95 1996–99
Age-specific mortality rate (per 100,000)
0
50
100
150
200
250
1980–84 1985–89 1990–95 1996–99
Age-specific mortality rate (per 100,000)
Males 25–44 years (sole) Females 25–44 years (sole)
0
50
100
150
200
250
300
350
400
450
1980–84 1985–89 1990–95 1996–99
Age-specific mortality rate (per 100,000)
0
50
100
150
200
250
300
350
400
450
1980–84 1985–89 1990–95 1996–99
Age-specific mortality rate (per 100,000)
Males 45–64 years (sole) Females 45–64 years (sole)
0
500
1000
1500
2000
2500
1980–84 1985–89 1990–95 1996–99
Age-specific mortality rate (per 100,000)
0
500
1000
1500
2000
2500
1980–84 1985–89 1990–95 1996–99
Age-specific mortality rate (per 100,000)
Mäori Pacific Non-Mäori non-Pacific
(Continued)

18 Decades of Disparity: Ethnic Mortality Trends in New Zealand 1980–1999
Males 65–74 years (sole) Females 65–74 years (sole)
0
1000
2000
3000
4000
5000
6000
7000
8000
1980–84 1985–89 1990–95 1996–99
Age-specific mortality rate (per 100,000)
0
1000
2000
3000
4000
5000
6000
7000
8000
1980–84 1985–89 1990–95 1996–99
Age-specific mortality rate (per 100,000)
Mäori Pacific Non-Mäori non-Pacific
Figure 6: Mortality rate ratios, by gender and age group
Age-specific Mäori male mortality rate ratios (prioritised)
Age-specific Mäori female mortality rate ratios (prioritised)
0
1
2
3
4
1–14 15–24 25–44 45–64 65–74Age group (years)
Mortality rate ratios(per 100,000)
0
1
2
3
4
1–14 15–24 25–44 45–64 65–74Age group (years)
Mortality rate ratios(per 100,000)
Age-specific Pacific male mortality rate ratios (prioritised)
Age-specific Pacific female mortality rate ratios (prioritised)
0.0
0.5
1.0
1.5
2.0
2.5
3.0
3.5
1–14 15–24 25–44 45–64 65–74Age group (years)
Mortality rate ratios(per 100,000)
0.0
0.5
1.0
1.5
2.0
2.5
3.0
3.5
1–14 15–24 25–44 45–64 65–74Age group (years)
Mortality rate ratios(per 100,000)
1980–84 1985–89 1990–95 1996–99
(Continued)

Decades of Disparity: Ethnic Mortality Trends in New Zealand 1980–1999 19
Age-specific Mäori male mortality rate ratios (sole) Age-specific Mäori female mortality rate ratios (sole)
0
1
2
3
4
1–14 15–24 25–44 45–64 65–74Age group (years)
Mortality rate ratios(per 100,000)
0
1
2
3
4
1–14 15–24 25–44 45–64 65–74Age group (years)
Mortality rate ratios(per 100,000)
Age-specific Pacific male mortality rate ratios (sole) Age-specific Pacific female mortality rate ratios (sole)
0
1
2
3
1–14 15–24 25–44 45–64 65–74Age group (years)
Mortality rate ratios(per 100,000)
0
1
2
3
1–14 15–24 25–44 45–64 65–74Age group (years)
Mortality rate rat ios(per 100,000)
1980–84 1985–89 1990–95 1996–99
Note: Reference category is the non-Mäori non-Pacific ethnic group.
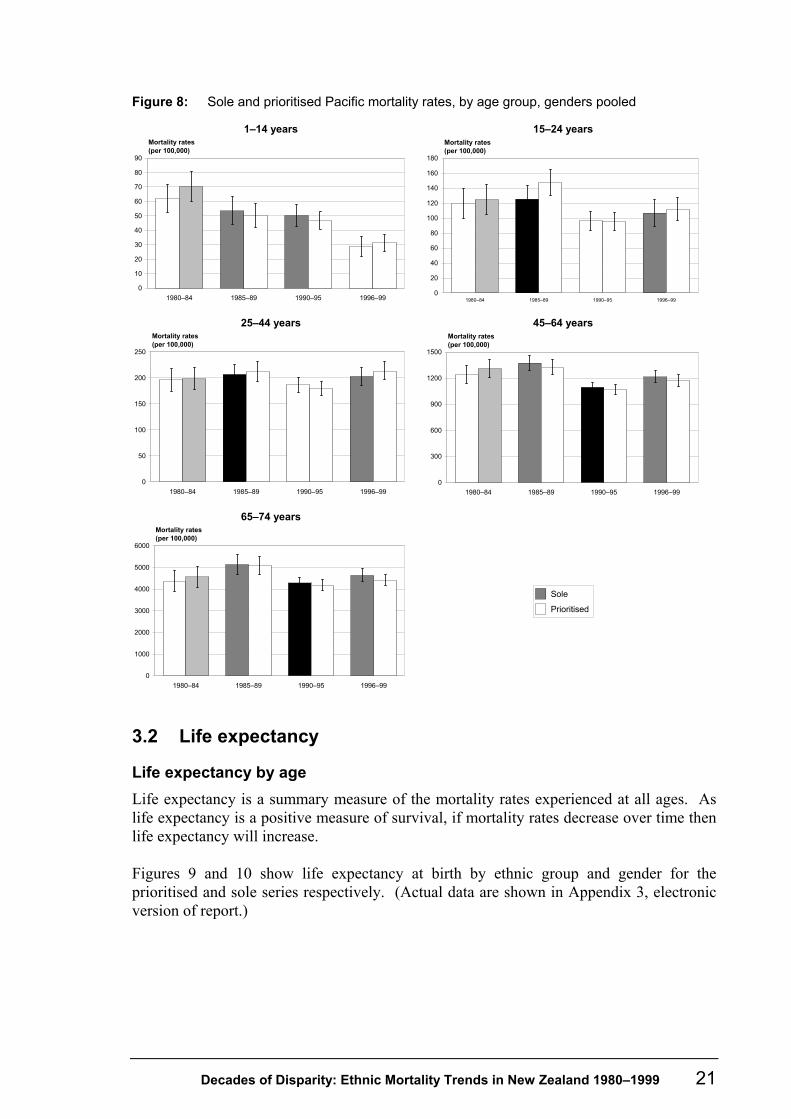
Sole ethnicity compared to prioritised ethnicity for Mäori and Pacific ethnic groups
Figures 7 and 8 plot both the prioritised and the sole mortality rates (genders pooled) for Mäori and Pacific people, respectively. The mortality rates in the sole series are consistently higher than those in the prioritised series. Among Mäori, there has been a small decrease in mortality rates across all ages for the prioritised series between 1980–84 and 1996–99. However, the nature of the sole Mäori population changed dramatically from the 1991 to 1996 census – particularly among children. More people self-identified as Mäori and other ethnic groups in 1996, and this was particularly so for children. Conversely the sole Mäori population decreased in size. Sole Mäori mortality rates actually increased from the 1990–95 to the 1996–99 period for 1–14 and 15–24-year-olds, probably reflecting this apparent contraction in population size, at least in part. Among Pacific people, the patterns observed in the sole and prioritised series are similar across all ages. The mortality rate has decreased for 1–14-year-olds and, possibly, 15–24-year-olds. There is no clear pattern for the older age groups.

20 Decades of Disparity: Ethnic Mortality Trends in New Zealand 1980–1999
Figure 7: Sole and prioritised Mäori mortality rates, by age group, genders pooled
1–14 years 15–24 years
0
10
20
30
40
50
60
70
1980–84 1985–89 1990–95 1996–99
Mortality rates(per 100,000)
0
50
100
150
200
1980–84 1985–89 1990–95 1996–99
Mortality rates(per 100,000)
25–44 years 45–64 years
0
50
100
150
200
250
300
350
1980–84 1985–89 1990–95 1996–99
Mortality rates(per 100,000)
0
400
800
1200
1600
2000
1980–84 1985–89 1990–95 1996–99
Mortality rates(per 100,000)
65–74 years
0
1000
2000
3000
4000
5000
6000
7000
1980–84 1985–89 1990–95 1996–99
Mortality rates(per 100,000)
Sole
Prioritised
Decades of Disparity: Ethnic Mortality Trends in New Zealand 1980–1999 21
Figure 8: Sole and prioritised Pacific mortality rates, by age group, genders pooled
1–14 years 15–24 years
0
10
20
30
40
50
60
70
80
90
1980–84 1985–89 1990–95 1996–99
Mortality rates(per 100,000)
0
20
40
60
80
100
120
140
160
180
1980–84 1985–89 1990–95 1996–99
Mortality rates(per 100,000)
25–44 years 45–64 years
0
50
100
150
200
250
1980–84 1985–89 1990–95 1996–99
Mortality rates(per 100,000)
0
300
600
900
1200
1500
1980–84 1985–89 1990–95 1996–99
Mortality rates(per 100,000)
65–74 years
0
1000
2000
3000
4000
5000
6000
1980–84 1985–89 1990–95 1996–99
Mortality rates(per 100,000)
Sole
Prioritised
3.2 Life expectancy
Life expectancy by age Life expectancy is a summary measure of the mortality rates experienced at all ages. As life expectancy is a positive measure of survival, if mortality rates decrease over time then life expectancy will increase. Figures 9 and 10 show life expectancy at birth by ethnic group and gender for the prioritised and sole series respectively. (Actual data are shown in Appendix 3, electronic version of report.)

22 Decades of Disparity: Ethnic Mortality Trends in New Zealand 1980–1999
For non-Mäori non-Pacific people there has been a steady increase in life expectancy at all ages. For males, life expectancy at birth has increased from 70.9 years in 1980–84 to 75.7 years in 1996–99 (prioritised series, absolute increase of 4.8 years). For non-Mäori non-Pacific females the life expectancy at birth has increased from 77.2 to 80.8 years (prioritised series, absolute increase of 3.6 years). A similar pattern is observed for the sole non-Mäori non-Pacific group. For Mäori (prioritised series), male life expectancy at birth over the same period has only increased from 64.6 to 65.8 years for males (1.2 years) and from 69.4 to 71.0 years for females (1.6 years). The gap in male life expectancy at birth between non-Mäori non-Pacific and Mäori ethnic groups (prioritised series) thus increased from 6.3 to 9.9 years over the study period – an increase of 57%. The corresponding gap for females increased from 7.8 to 9.8 years – an increase of 26%. Due to a decline in sole Mäori life expectancy at birth between the 1990–95 and the 1996–99 periods, little change in male (0.3 years) or female (0.7 years) life expectancy at birth is seen over the whole observation period (1980–84 to 1996–99). For Pacific people (prioritised series), life expectancy at birth over the same period has only increased from 66.7 to 67.9 years for males (1.2 years difference) and is unchanged for females. For the sole series, Pacific male life expectancy at birth was little changed (0.3 years) and female life expectancy actually fell from 74.8 to 73.9 years (-0.9 years), though this probably reflects the contraction of the sole Pacific population in the 1996 census, at least in part.

Decades of Disparity: Ethnic Mortality Trends in New Zealand 1980–1999 23
Figure 9: Life expectancy, by age (prioritised series)
Male life expectancy at birth (prioritised series) Female life expectancy at birth (prioritised series)
60
70
80
90
1980–84 1985–89 1990–95 1996–99
Years
60
70
80
90
1980–84 1985–89 1990–95 1996–99
Years
Male life expectancy at 15 years (prioritised series) Female life expectancy at 15 years (prioritised series)
40
50
60
70
1980–84 1985–89 1990–95 1996–99
Years
40
50
60
70
1980–84 1985–89 1990–95 1996–99
Years
Male life expectancy at 45 years (prioritised series) Female life expectancy at 45 years (prioritised series)
10
20
30
40
1980–84 1985–89 1990–95 1996–99
Years
10
20
30
40
1980–84 1985–89 1990–95 1996–99
Years
Male life expectancy at 65 years (prioritised series) Female life expectancy at 65 years (prioritised series)
0
5
10
15
20
1980–84 1985–89 1990–95 1996–99
Years
0
5
10
15
20
1980–84 1985–89 1990–95 1996–99
Years
Mäori Pacific Non-Mäori non-Pacific

24 Decades of Disparity: Ethnic Mortality Trends in New Zealand 1980–1999
Figure 10: Life expectancy, by age (sole series)
Male life expectancy at birth (sole series) Female life expectancy at birth (sole series)
60
70
80
90
1980–84 1985–89 1990–95 1996–99
Years
60
70
80
90
1980–84 1985–89 1990–95 1996–99
Years
Male life expectancy at 15 years (sole series) Female life expectancy at 15 years (sole series)
40
50
60
70
1980–84 1985–89 1990–95 1996–99
Years
40
50
60
70
1980–84 1985–89 1990–95 1996–99
Years
Male life expectancy at 45 years (sole series) Female life expectancy at 45 years (sole series)
10
20
30
40
1 2 3 4
Years
10
20
30
40
1980–84 1985–89 1990–95 1996–99
Years
Male life expectancy at 65 years (sole series) Female life expectancy at 65 years (sole series)
0
5
10
15
20
1980–84 1985–89 1990–95 1996–99
Years
0
5
10
15
20
1980–84 1985–89 1990–95 1996–99
Years
Mäori Pacific Non-Mäori non-Pacific

Decades of Disparity: Ethnic Mortality Trends in New Zealand 1980–1999 25
Age-substituted life expectancy Mäori and Pacific age-substituted life expectancies were calculated by substituting in the corresponding life-table the (lower) mortality rate of non-Mäori non-Pacific people for the adjusted Mäori or Pacific rate, one age group at a time. (Age groups used were 0–14 years, 15–44 years, 45–64 years and 65+ years.) For example, replacing the Mäori mortality rates with the non-Mäori non-Pacific rates for the 45–64 years group increased the Mäori prioritised life expectancy by 3.5 years during 1990–95 and by 3.8 years during 1996–99 (Figure 11). Put another way, the higher mortality among 45–64-year-old Mäori males (relative to 45–64-year-old non-Mäori non-Pacific males) caused a loss of 3.8 years in Mäori male life expectancy in 1996–99. By substituting at different ages, one can see how much each age group contributes to the overall difference in life expectancy between Mäori (or Pacific) and non-Mäori non-Pacific ethnic groups at each period for each gender (and series). Figure 11 shows the increases in Mäori and Pacific life expectancy that occur when non-Mäori non-Pacific mortality is substituted for the four selected age groups. Among males (prioritised series), mortality among 45–64-year-olds contributes the most to the total life expectancy difference throughout the 20-year observation period. However, among females mortality among those aged 65 year and older and those aged 45–64 years contribute equally to the total life expectancy difference by 1996–99. The pattern for the sole series is similar to that of the prioritised series. For Pacific males and females, mortality in the 45–64 and 65+ age groups contribute most to the lower life expectancy of Pacific people relative to non-Mäori non-Pacific people. As with Mäori, the contribution of the 65+ age group has increased substantially over the study period, while that of the younger age groups has remained reasonably stable.

26 Decades of Disparity: Ethnic Mortality Trends in New Zealand 1980–1999
Figure 11: Life expectancy increases for Mäori and Pacific people, by gender, following substitution of non-Mäori non-Pacific mortality rates for selected age groups
Age-substituted male life expectancy (prioritised Mäori)
Age-substituted female life expectancy (prioritised Mäori)
0
1
2
3
4
5
0–14 15–44 45–64 65+Age group (years)
Years
0
1
2
3
4
5
0–14 15–44 45–64 65+Age group (years)
Years
Age-substituted male life expectancy (prioritised Pacific)
Age-substituted female life expectancy (prioritised Pacific)
0
1
2
3
4
0–14 15–44 45–64 65+Age group (years)
Years
0
1
2
3
4
0–14 15–44 45–64 65+Age group (years)
Years
Age-substituted male life expectancy (sole Mäori)
Age-substituted female life expectancy (sole Mäori)
0
1
2
3
4
5
6
0–14 15–44 45–64 65+Age group (years)
Years
0
1
2
3
4
5
6
0–14 15–44 45–64 65+Age group (years)
Years
Age-substituted male life expectancy (sole Pacific)
Age-substituted female life expectancy (sole Pacific)
-0.5
0.0
0.5
1.0
1.5
2.0
2.5
3.0
3.5
Age group (years)
Years
0–14 15–44 45–64 65+
0.0
0.5
1.0
1.5
2.0
2.5
3.0
3.5
0–14 15–44 45–64 65+Age group (years)
Years
1980–84 1985–89 1990–95 1996–99

Decades of Disparity: Ethnic Mortality Trends in New Zealand 1980–1999 27
Chapter 4: Cause-specific Mortality
4.1 Mortality rates
Global burden of disease categories (I, II, III) Causes of death may be grouped into three broad categories (WHO 2002): • I: communicable, maternal, perinatal and nutritional diseases • II: chronic diseases • III: injuries. Prioritised series
Ethnic mortality rates by these three broad cause categories are shown in Figure 12 for the prioritised series. For non-Mäori non-Pacific people there has been a steady decline in mortality rates for all the three cause categories. For Mäori, however, the decline is evident mainly for category I causes. For Pacific people rates have decreased for category I since the mid-1980s and there has also been a decline in injury mortality rates (category III) among males over time.

28 Decades of Disparity: Ethnic Mortality Trends in New Zealand 1980–1999
Figure 12: Cause-specific standardised mortality rates, ages 1–74 years, by gender (prioritised series)
Category I: Males (prioritised) Category I: Females (prioritised)
0
10
20
30
40
50
60
70
80
1980–84 1985–89 1990–95 1996–99
Standardised mortality rates (per
0
10
20
30
40
50
60
70
80
1980–84 1985–89 1990–95 1996–99
Standardised mortality rates (per
Category II: Males (prioritised) Category II: Females (prioritised)
0
100
200
300
400
500
600
700
800
900
1980–84 1985–89 1990–95 1996–99
Standardised mortality rates (per
0
100
200
300
400
500
600
700
800
900
1980–84 1985–89 1990–95 1996–99
Standardised mortality rates (per
Category III: Males (prioritised) Category III: Females (prioritised)
0
20
40
60
80
100
120
140
1980–84 1985–89 1990–95 1996–99
Standardised mortality rates (per
0
20
40
60
80
100
120
140
1980–84 1985–89 1990–95 1996–99
Standardised mortality rates (per
Mäori Pacific Non-Mäori non-Pacific

Decades of Disparity: Ethnic Mortality Trends in New Zealand 1980–1999 29
Sole series
The pattern for the sole series is similar. Although there is evidence of decreasing mortality rates over time for cause category I for the sole Mäori ethnic group, this is not the case for the other categories. This pattern is seen for both genders (Figure 13). Figure 13: Cause-specific standardised mortality rates, ages 1–74 years, by gender (sole series)
Category I: Males (sole) Category I: Females (sole)
0
10
20
30
40
50
60
70
80
1980–84 1985–89 1990–95 1996–99
Standardised mortality rates (per
0
10
20
30
40
50
60
70
80
1980–84 1985–89 1990–95 1996–99
Standardised mortality rates (per
Category II: Males (sole) Category II: Females (sole)
0
200
400
600
800
1000
1980–84 1985–89 1990–95 1996–99
Standardised mortality rates (per
0
200
400
600
800
1000
1980–84 1985–89 1990–95 1996–99
Standardised mortality rates (per
Category III: Males (sole) Category III: Females (sole)
0
20
40
60
80
100
120
140
1980–84 1985–89 1990–95 1996–99
Standardised mortality rates (per
0
20
40
60
80
100
120
140
1980–84 1985–89 1990–95 1996–99
Standardised mortality rates (per
Mäori Pacific Non-Mäori non-Pacific
Note: Category I: communicable disease, maternal, perinatal and nutritional conditions. Category II: chronic diseases. Category III: injuries.
30 Decades of Disparity: Ethnic Mortality Trends in New Zealand 1980–1999
Selected causes – age-standardised rates Age-standardised mortality rates for selected diseases or disease groups are shown in Figure 14 for the prioritised series. The corresponding tabular data of rates and confidence intervals are provided in Appendix 3. The sole series showed a similar pattern, detailed in see Appendix 4 (Appendices 3 and 4 are included only in the electronic version of this report). There are striking differences in trends over time in cause-specific mortality rates for the three ethnic groups (both series). Overall cancer mortality rates tended to increase over time among Mäori compared to a steady decrease among non-Mäori non-Pacific people. For the prioritised series, age-standardised cancer mortality rates were 2.0 (male) and 2.1 (female) times greater for Mäori than for non-Mäori non-Pacific people during 1996–99. Pacific cancer mortality rates were similar to those for Mäori among males, but intermediate between Mäori and non-Mäori non-Pacific rates for females. For specific cancers:
• There was a strong pattern of diverging Mäori and non-Mäori non-Pacific lung cancer mortality rates, such that by 1996–99 the relative risks were 3.50 (males) and 4.91 (females). Pacific lung cancer rates were similar to those for non-Mäori non-Pacific females, but intermediate for males.
• Prostate cancer mortality rates increased over time among Mäori, while remaining essentially stable among non-Mäori non-Pacific people. By 1996–99 non-Mäori non-Pacific prostate cancer rates were half those of Mäori. Pacific prostate cancer rates appeared to decrease over time.
• Breast cancer mortality rates increased among both Mäori and Pacific females, compared to decreases among non-Mäori non-Pacific females. By 1996–99 non-Mäori non-Pacific breast cancer mortality rates were 60% of those for Mäori. Pacific breast cancer mortality rates appear to have become the highest of all three ethnic groups in the 20-year period (although 95% confidence intervals include the Mäori female rate). At the beginning of the 20-year period, Pacific breast cancer mortality rates were clearly the lowest of the three ethnic groups.
• In the early 1980s Mäori had colorectal cancer mortality rates only one-third (females) to two-thirds (males) of those for non-Mäori non-Pacific people. Small decreases in age-standardised mortality rates among non-Mäori non-Pacific people over the last 20 years, in contrast to increasing rates among Mäori, have resulted in similar colorectal cancer mortality rates by the late 1990s. While rates are imprecise for Pacific people, it appears that there has been an even more substantial increase in colorectal cancer mortality among this group. By the end of the 20-year period all three ethnic groups had roughly comparable colorectal cancer mortality rates.

Decades of Disparity: Ethnic Mortality Trends in New Zealand 1980–1999 31
Cardiovascular mortality rates on the whole have steadily decreased over time, but to a lesser extent among Mäori and Pacific ethnic groups. Consequently, by 1996–99 cardiovascular mortality rates were 3.0 times higher for Mäori males and 2.5 times higher for Pacific males compared to non-Mäori non-Pacific males. Among females the corresponding relative risks were 4.2 for Mäori and 3.1 for Pacific people.
• Ischaemic heart disease mortality rates tended to decrease over time for all ethnic groups and both genders – although not much for Mäori and Pacific males. The relative inequalities between ethnic groups at the end of the 1990s were larger for ischaemic heart disease than for cardiovascular diseases as a whole.
• Stroke mortality rates were clearly highest for Pacific people among males and (possibly) females. All ethnic groups had decreasing stroke mortality rates over time.
Respiratory disease mortality decreased for all three ethnic groups. However, Mäori male and female respiratory mortality rates remain elevated compared to non-Mäori non-Pacific people, and likewise for Pacific males. The major contributor to respiratory disease is chronic obstructive pulmonary disease, which is largely attributable to tobacco consumption. Unintentional injury mortality rates decreased over time for all ethnic groups and both genders. This pattern was similar for road traffic crashes – a major contributor to unintentional injuries. Suicide rates increased most notably among both Mäori males and females over the 1980s and 1990s. Increasing suicide mortality for Pacific and non-Mäori non-Pacific males was also evident – but the increases were not as marked as for Mäori. The pattern varies by age, and is described in more detail in the next section. In summary, Mäori and Pacific people experienced decreasing rates of mortality from three major causes of death: cardiovascular disease, unintentional injury, and respiratory diseases. However, these gains have largely been offset by increasing cancer mortality (all major types). Further, even for those diseases with decreasing rates over time among all ethnic groups (eg, cardiovascular disease), the relative inequalities between ethnic groups have tended to increase over time. Mäori males (and, to a lesser extent, females) have had large increases in suicide mortality over the 1980s and 1990s. By contrast, non-Mäori non-Pacific people experienced declining mortality rates for all major causes except lung cancer among females and (until recently) suicide among youth.

32 Decades of Disparity: Ethnic Mortality Trends in New Zealand 1980–1999
Figure 14: Standardised mortality rates, ages 1–74 years, by gender – specific causes (prioritised series)
Cancer: males (prioritised) Cancer: females (prioritised)
0
50
100
150
200
250
1980–84 1985–89 1990–95 1996–99
Standardised mortality rates (per 100,000)
0
50
100
150
200
250
1980–84 1985–89 1990–95 1996–99
Standardised mortality rates (per 100,000)
Lung cancer: males (prioritised) Lung cancer: females (prioritised)
0
20
40
60
80
100
1980–84 1985–89 1990–95 1996–99
Standardised mortality rates (per 100,000)
0
20
40
60
80
100
1980–84 1985–89 1990–95 1996–99
Standardised mortality rates (per 100,000)
Prostate cancer: males (prioritised) Breast cancer: females (prioritised)
0
5
10
15
20
25
30
1980–84 1985–89 1990–95 1996–99
Standardised mortality rates (per 100,000)
0
10
20
30
40
50
1980–84 1985–89 1990–95 1996–99
Standardised mortality rates (per 100,000)
Colorectal cancer: males (prioritised) Colorectal cancer: females (prioritised)
0
5
10
15
20
25
1980–84 1985–89 1990–95 1996–99
Standardised mortality rates (per 100,000)
0
5
10
15
20
25
1980–84 1985–89 1990–95 1996–99
Standardised mortality rates (per 100,000)
Mäori Pacific Non-Mäori non-Pacific
(Continued)

Decades of Disparity: Ethnic Mortality Trends in New Zealand 1980–1999 33
Cardiovascular disease: males (prioritised) Cardiovascular disease: females (prioritised)
0
100
200
300
400
500
1980–84 1985–89 1990–95 1996–99
Standardised mortality rates (per 100,000)
0
100
200
300
400
500
1980–84 1985–89 1990–95 1996–99
Standardised mortality rates (per 100,000)
Ischaemic heart disease: males (prioritised) Ischaemic heart disease: females (prioritised)
0
50
100
150
200
250
300
1980–84 1985–89 1990–95 1996–99
Standardised mortality rates (per 100,000)
0
50
100
150
200
250
300
1980–84 1985–89 1990–95 1996–99
Standardised mortality rates (per 100,000)
Stroke: males (prioritised) Stroke: females (prioritised)
0
20
40
60
80
100
120
1980–84 1985–89 1990–95 1996–99
Standardised mortality rates (per 100,000)
0
20
40
60
80
100
120
1980–84 1985–89 1990–95 1996–99
Standardised mortality rates (per 100,000)
Respiratory diseases: males (prioritised) Respiratory diseases: females (prioritised)
0
20
40
60
80
100
120
140
1980–84 1985–89 1990–95 1996–99
Standardised mortality rates (per 100,000)
0
20
40
60
80
100
120
140
1980–84 1985–89 1990–95 1996–99
Standardised mortality rates (per 100,000)
Mäori Pacific Non-Mäori non-Pacific
(Continued)

34 Decades of Disparity: Ethnic Mortality Trends in New Zealand 1980–1999
Unintentional injuries: males (prioritised) Unintentional injuries: females (prioritised)
0
20
40
60
80
100
1980–84 1985–89 1990–95 1996–99
Standardised mortality rates (per 100,000)
0
20
40
60
80
100
1980–84 1985–89 1990–95 1996–99
Standardised mortality rates (per 100,000)
Road traffic crashes: males (prioritised) Road traffic crashes: females (prioritised)
0
10
20
30
40
50
60
70
1980–84 1985–89 1990–95 1996–99
Standardised mortality rates (per 100,000)
0
10
20
30
40
50
60
70
1980–84 1985–89 1990–95 1996–99
Standardised mortality rates (per 100,000)
Suicide: males (prioritised) Suicide: females (prioritised)
0
10
20
30
40
1980–84 1985–89 1990–95 1996–99
Standardised mortality rates (per 100,000)
0
10
20
30
40
1980–84 1985–89 1990–95 1996–99
Standardised mortality rates (per 100,000)
Mäori Pacific Non-Mäori non-Pacific
Selected causes – age-specific rates Cancer and cardiovascular mortality are concentrated among middle and older age groups, whereas unintentional injury mortality is concentrated among younger age groups. Cause-specific mortality by selected age groups is presented in Figures 15, 16 and 17. Prioritised series results only are presented (sole series results can be found in Appendix 4, electronic version of report). In general, similar patterns are seen for age-specific as for age-standardised rates. For example, the decline in overall cardiovascular disease mortality for all ethnic groups (albeit less so for Mäori and Pacific males) was evident for 35–64 and 65–74-year-olds. However, the relative differences between ethnic groups in cardiovascular disease mortality were greater among 35–64-year-olds (Figure 15).

Decades of Disparity: Ethnic Mortality Trends in New Zealand 1980–1999 35
Figure 15: Mortality rate in 35–64 and 65–74-year-old males and females for cancers and cardiovascular diseases (prioritised series)
Cancer: 35–64-year-old males (prioritised) Cancer: 35–64-year-old females (prioritised)
0
50
100
150
200
250
300
350
400
1980–84 1985–89 1990–95 1996–99
Mortality rate(per 100,000)
0
50
100
150
200
250
300
350
400
1980–84 1985–89 1990–95 1996–99
Mortality rate(per 100,000)
Cancer: 65–74-year-old males (prioritised) Cancer: 65–74-year-old females (prioritised)
0
500
1000
1500
2000
2500
1980–84 1985–89 1990–95 1996–99
Mortality rate(per 100,000)
0
500
1000
1500
2000
2500
1980–84 1985–89 1990–95 1996–99
Mortality rate(per 100,000)
Lung cancer: 35–64-year-old males (prioritised) Lung cancer: 35–64-year-old females (prioritised)
0
20
40
60
80
100
120
140
160
1980–84 1985–89 1990–95 1996–99
Mortality rate(per 100,000)
0
20
40
60
80
100
120
140
160
1980–84 1985–89 1990–95
Mortality rate(per 100,000)
Lung cancer: 65–74-year-old males (prioritised) Lung cancer: 65–74-year-old females (prioritised)
0
200
400
600
800
1000
1980–84 1985–89 1990–95 1996–99
Mortality rate(per 100,000)
0
200
400
600
800
1000
1980–84 1985–89 1990–95 1996–99
Mortality rate(per 100,000)
Mäori Pacific Non-Mäori non-Pacific
(Continued)

36 Decades of Disparity: Ethnic Mortality Trends in New Zealand 1980–1999
Prostate cancer: 35–64-year-old males (prioritised) Breast cancer: 35–64-year-old females (prioritised)
0
5
10
15
20
25
1980–84 1985–89 1990–95 1996–99
Mortality rate(per 100,000)
0
20
40
60
80
100
120
1980–84 1985–89 1990–95 1996–99
Mortality rate(per 100,000)
Prostate cancer: 65–74-year-old males (prioritised) Breast cancer: 65–74-year-old females (prioritised)
0
50
100
150
200
250
300
350
400
450
500
1980–84 1985–89 1990–95 1996–99
Mortality rate(per 100,000)
0
50
100
150
200
250
1980–84 1985–89 1990–95 1996–99
Mortality rate(per 100,000)
Colorectal cancer: 35–64-year-old males (prioritised) Colorectal cancer: 35–64-year-old females (prioritised)
0
5
10
15
20
25
30
35
40
1980–84 1985–89 1990–95 1996–99
Mortality rate(per 100,000)
0
5
10
15
20
25
30
35
40
1980–84 1985–89 1990–95 1996–99
Mortality rate(per 100,000)
Colorectal cancer: 65–74-year-old males (prioritised) Colorectal cancer: 65–74-year-old females (prioritised)
0
50
100
150
200
250
300
1980–84 1985–89 1990–95 1996–99
Mortality rate(per 100,000)
0
50
100
150
200
250
300
1980–84 1985–89 1990–95 1996–99
Mortality rate(per 100,000)
Mäori Pacific Non-Mäori non-Pacific
(Continued)

Decades of Disparity: Ethnic Mortality Trends in New Zealand 1980–1999 37
Ischaemic heart disease: 35–64-year-old males (prioritised)
Ischaemic heart disease: 35–64-year-old females (prioritised)
0
50
100
150
200
250
300
350
400
450
1980–84 1985–89 1990–95 1996–99
Mortality rate(per 100,000)
0
50
100
150
200
250
300
350
400
450
1980–84 1985–89 1990–95 1996–99
Mortality rate(per 100,000)
Ischaemic heart disease: 65–74-year-old males (prioritised)
Ischaemic heart disease: 65–74-year-old females (prioritised)
0
500
1000
1500
2000
2500
1980–84 1985–89 1990–95 1996–99
Mortality rate(per 100,000)
0
500
1000
1500
2000
2500
1980–84 1985–89 1990–95 1996–99
Mortality rate(per 100,000)
Stroke: 35–64-year-old males (prioritised) Stroke: 35–64-year-old females (prioritised)
0
30
60
90
120
150
1980–84 1985–89 1990–95 1996–99
Mortality rate(per 100,000)
0
30
60
90
120
150
1980–84 1985–89 1990–95 1996–99
Mortality rate(per 100,000)
Stroke: 65–74-year-old males (prioritised) Stroke: 65–74-year-old females (prioritised)
0
200
400
600
800
1000
1200
1980–84 1985–89 1990–95 1996–99
Mortality rate(per 100,000)
0
200
400
600
800
1000
1200
1980–84 1985–89 1990–95 1996–99
Mortality rate(per 100,000)
Mäori Pacific Non-Mäori non-Pacific
(Continued)

38 Decades of Disparity: Ethnic Mortality Trends in New Zealand 1980–1999
Cardiovascular disease: 35–64-year-old males (prioritised)
Cardiovascular disease: 35–64-year-old females (prioritised)
0
100
200
300
400
500
600
700
1980–84 1985–89 1990–95 1996–99
Mortality rate(per 100,000)
0
100
200
300
400
500
600
700
1980–84 1985–89 1990–95 1996–99
Mortality rate(per 100,000)
Cardiovascular disease: 65–74-year-old males (prioritised)
Cardiovascular disease: 65–74-year-old females (prioritised)
0
500
1000
1500
2000
2500
3000
3500
1980–84 1985–89 1990–95 1996–99
Mortality rate(per 100,000)
0
500
1000
1500
2000
2500
3000
3500
1980–84 1985–89 1990–95 1996–99
Mortality rate(per 100,000)
Mäori Pacific Non-Mäori non-Pacific
Note: Missing bars indicate insufficient data.
For unintentional injury deaths (Figure 16) there were notable differences between ethnic groups at all ages up to 25–44 years, but they were most marked in this latter age group. Road traffic crashes contributed to much of the unintentional injury deaths in these age groups. Figure 17 shows that suicide rates among 45–74-year-olds were greatest among non-Mäori non-Pacific people in all four time periods. The rapid increase in Mäori suicide rates is most notable among 15–24-year-olds and 25–44-year-olds. For example, among 25–44-year-old males Mäori had a suicide rate that was 22% less than that of non-Mäori non-Pacific people in 1981–84, but by 1996–99 the rate was 70% greater. However, among 45–74-year-olds non-Mäori non-Pacific people had the highest rates. The suicide rates among 15–24 and 25–44-year-old Pacific people were similar to those among non-Mäori non-Pacific people over time (allowing for statistical imprecision), but were lower for 45–74-year-olds.

Decades of Disparity: Ethnic Mortality Trends in New Zealand 1980–1999 39
Figure 16: Mortality rate in 1–14, 15–24 and 25–44-year-old males and females for unintentional injuries and road traffic crashes (prioritised series)
Unintentional injuries: 1–14-year-old males (prioritised) Unintentional injuries: 1–14-year-old females (prioritised)
0
5
10
15
20
25
30
35
40
45
1980–84 1985–89 1990–95 1996–99
Mortality rate(per 100,000)
0
5
10
15
20
25
30
35
40
45
1980–84 1985–89 1990–95 1996–99
Mortality rate(per 100,000)
Unintentional injuries: 15–24-year-old males (prioritised)
Unintentional injuries: 15–24-year-old females (prioritised)
0
30
60
90
120
150
1980–84 1985–89 1990–95 1996–99
Mortality rate(per 100,000)
0
30
60
90
120
150
1980–84 1985–89 1990–95 1996–99
Mortality rate(per 100,000)
Unintentional injuries: 25–44-year-old males (prioritised)
Unintentional injuries: 25–44-year-old females (prioritised)
0
20
40
60
80
100
120
140
1980–84 1985–89 1990–95 1996–99
Mortality rate(per 100,000)
0
20
40
60
80
100
120
140
1980–84 1985–89 1990–95 1996–99
Mortality rate(per 100,000)
Mäori Pacific Non-Mäori non-Pacific
(Continued)

40 Decades of Disparity: Ethnic Mortality Trends in New Zealand 1980–1999
Road traffic crashes: 1–14-year-old males (prioritised)
Road traffic crashes: 1–14-year-old females (prioritised)
0
5
10
15
20
25
30
35
1980–84 1985–89 1990–95 1996–99
Mortality rate(per 100,000)
0
5
10
15
20
25
30
35
1980–84 1985–89 1990–95 1996–99
Mortality rate(per 100,000)
Road traffic crashes: 15–24-year-old males (prioritised) Road traffic crashes: 15–24-year-old females (prioritised)
0
20
40
60
80
100
120
1980–84 1985–89 1990–95 1996–99
Mortality rate(per 100,000)
0
20
40
60
80
100
120
1980–84 1985–89 1990–95 1996–99
Mortality rate(per 100,000)
Road traffic crashes: 25–44-year-old males (prioritised) Road traffic crashes: 25–44-year-old females (prioritised)
0
10
20
30
40
50
60
70
80
90
1980–84 1985–89 1990–95 1996–99
Mortality rate(per 100,000)
0
10
20
30
40
50
60
70
80
90
1980–84 1985–89 1990–95 1996–99
Mortality rate(per 100,000)
Mäori Pacific Non-Mäori non-Pacific

Decades of Disparity: Ethnic Mortality Trends in New Zealand 1980–1999 41
Figure 17: Mortality rate in 15–24, 25–44 and 45–74-year-old males and females for suicide (prioritised series)
Suicide: 15–24-year-old males (prioritised) Suicide: 15–24-year-old females (prioritised)
0
10
20
30
40
50
60
70
80
1980–84 1985–89 1990–95 1996–99
Mortality rate(per 100,000)
0
10
20
30
40
50
60
70
80
1980–84 1985–89 1990–95 1996–99
Mortality rate(per 100,000)
Suicide: 25–44-year-old males (prioritised) Suicide: 25–44-year-old females (prioritised)
0
10
20
30
40
50
60
70
1980–84 1985–89 1990–95 1996–99
Mortality rate(per 100,000)
0
10
20
30
40
50
60
70
1980–84 1985–89 1990–95 1996–99
Mortality rate(per 100,000)
Suicide: 45–74-year-old males (prioritised) Suicide: 45–74-year-old females (prioritised)
0
5
10
15
20
25
30
35
1980–84 1985–89 1990–95 1996–99
Mortality rate(per 100,000)
0
5
10
15
20
25
30
35
1980–84 1985–89 1990–95 1996–99
Mortality rate(per 100,000)
Mäori Pacific Non-Mäori non-Pacific
Note: Missing bars indicate insufficient data.

42 Decades of Disparity: Ethnic Mortality Trends in New Zealand 1980–1999
4.2 Cause-substituted life expectancy
Global burden of disease categories (I, II, III) In the same way that we can substitute for various ages in the calculation of life expectancy, we can also do the same for various causes of death (using multi-decrement life-tables). Figure 18 shows the cause-substituted life expectancy for Mäori and Pacific people, using non-Mäori non-Pacific mortality rates for Global Burden of Disease cause categories, for the prioritised series. It can be seen that category II causes of death (chronic diseases) contribute the major share of the disparity in life expectancy between Mäori (and Pacific) and non-Mäori non-Pacific people. Moreover, the contribution of chronic disease to ethnic differences in life expectancy is increasing over time and is the major reason for diverging ethnic life expectancies. Figure 18: Cause-substituted life expectancy at birth, by gender, categories I, II, and III
(prioritised series)
Increase in male life expectancy (prioritised Mäori) Increase in female life expectancy (prioritised Mäori)
0
2
4
6
8
10
Category I Category II Category III
Years
0
2
4
6
8
10
Category I Category II Category III
Years
Increase in male life expectancy (prioritised Pacific) Increase in female life expectancy (prioritised Pacific)
0
1
2
3
4
5
6
7
8
Category I Category II Category III
Years
-1
0
1
2
3
4
5
6
7
8Years
Category I Category II Category III
1980–84 1985–89 1990–95 1996–99
Note: Increases and decreases are for life expectancy at birth. Category I: communicable, maternal, perinatal and nutritional diseases. Category II: chronic diseases. Category III: injuries.

Decades of Disparity: Ethnic Mortality Trends in New Zealand 1980–1999 43
Selected causes Among the chronic diseases, cardiovascular disease (especially ischaemic heart disease) is the major contributing cause to the growth in life expectancy disparities between Mäori and Pacific and non-Mäori non-Pacific people (Figure 19). Diabetes also appears to make a sizeable contribution to ethnic disparities in life expectancy. It is important to note that causes of death attributed to diabetes in routine mortality data (as used in this report) underestimate the total contribution of diabetes to mortality – perhaps by about a half (Ministry of Health 2002d). Therefore, we might expect the contribution of diabetes to ethnic differences in life expectancy to be substantially greater than that shown in Figure 19. Conversely, some of the contribution of cardiovascular disease might actually be more appropriately attributed to diabetes as the underlying cause. The contribution of cancer to ethnic differences in life expectancy has risen notably during the 1980s and 1990s, but still remains less than that of cardiovascular disease for both Mäori and Pacific people (both genders). Respiratory diseases also make a substantial (but stable) contribution among Mäori and Pacific males. Injury deaths (unintentional, suicide and other intentional) are an important cause for disparity in life expectancy between Mäori and non-Mäori non-Pacific ethnic groups, but not so for Pacific compared to non-Mäori non-Pacific ethnic groups. Finally, there is still a sizeable contribution of ‘Other’ causes of death to ethnic disparities in life expectancy. No single other cause of death stands out as making a large contribution. Rather, this category is due to small contributions from many relatively minor causes of death.

44 Decades of Disparity: Ethnic Mortality Trends in New Zealand 1980–1999
Figure 19: Cause-substituted life expectancy at birth, by gender, specific causes (prioritised series)
Increase in male life expectancy (prioritised Mäori) Increase in female life expectancy (prioritised Mäori)
0
1
2
3
4
5
Cancer Diabetes Cardiovasculardisease
Respiratorydisease
Unintentionalinjuries
Other
Years
0
1
2
3
4
5
Cancer Diabetes Cardiovasculardisease
Respiratorydisease
Unintentionalinjuries
Other
Years
Increase in male life expectancy (prioritised Pacific) Increase in female life expectancy (prioritised Pacific)
0
1
2
3
4Years
Cancer Diabetes Cardiovascular disease
Respiratory disease
Unintentional injuries
Other
-1
0
1
2
3
4Years
Cancer Diabetes Cardiovascular disease
Respiratory disease
Unintentional injuries
Other
1980–84 1985–89 1990–95 1996–99
Note: Increases and decreases shown are for life expectancy at birth.

Decades of Disparity: Ethnic Mortality Trends in New Zealand 1980–1999 45
Chapter 5: Discussion
5.1 Key findings This report presents mortality rates and life expectancies by ethnicity for the 1980s and 1990s. Most importantly, the underlying mortality data have been corrected for numerator–denominator bias for the first time in New Zealand. There are clear and concerning patterns. Most notably, there has been little (if any) decline in Mäori and Pacific mortality rates over these two decades despite a steady decline in non-Mäori non-Pacific rates. As a consequence, the gaps in life expectancy between Mäori and Pacific and non-Mäori non-Pacific ethnic groups increased markedly over the 1980s and 1990s. By age, any decline in Mäori and Pacific mortality rates has been apparent only for children and young people. The 45–64 and 65+ age groups now contribute substantially and about equally to the ethnic disparity in life expectancy at birth. By cause of death, decreasing mortality rates for cardiovascular disease and unintentional injury among Mäori and Pacific people have been off-set by increasing cancer and (until recently) suicide mortality rates. The slow decline in Mäori and Pacific rates of cardiovascular mortality is in contrast to the rapid decline among non-Mäori non-Pacific people. As a consequence, differential cardiovascular mortality (especially ischaemic heart disease mortality) among middle and older age groups still remains the major contributor to the (increasing) gaps in mortality and life expectancy between the ethnic groups. However, cancer is rapidly increasing in importance as a cause of these gaps.
5.2 Study limitations This report presents accurate ethnic mortality rates adjusted for numerator–denominator bias for the first time in New Zealand. As such, the results in this report supersede all previous official mortality statistics by ethnicity for the 1980s and 1990s. However, there are still two important limitations to these results. First, our adjustment for numerator–denominator bias is unlikely to be exact. To adjust for numerator–denominator bias we had to calculate correction factors from anonymously and probabilistically linked census and mortality data (Ajwani et al 2002). We were only able to use approximately two-thirds of the eligible mortality records to calculate the adjustment factors. However, extensive sensitivity analyses (Ajwani et al 2002; Blakely and Atkinson 2001) lead us to conclude that the results published in this report are accurate – certainly more so than any previous method of calculation has allowed. As a rough guide, we estimate that any all-cause mortality rates for all ages presented in this report are likely to be within a couple of percent of the ‘true’ rate. Our accuracy will be somewhat less for Pacific all-cause mortality, particularly in the early 1980s where the smaller population size and number of deaths also contribute to likely error.

46 Decades of Disparity: Ethnic Mortality Trends in New Zealand 1980–1999
Second, the best we could do was to adjust the ethnicity reported on mortality records to the self-identified ethnicity on the corresponding census. For example, we adjusted 1980–84 mortality data to represent the number of deaths equivalent to that which would have been recorded if the 1981 census question had been used when reporting ethnicity on mortality records in 1980–84. The concept and recording of census ethnicity has varied for each of the 1981, 1986, 1991 and 1996 censuses. Thus, the ethnic populations for which we calculate mortality rates over time are not exactly comparable. This instability of ethnic classifications is a major problem for the 1991 to 1996 census comparisons for Mäori and Pacific ethnic groups. We have presented both sole and prioritised series in this report to ‘bracket’ the possible variations. That said, any change in the ethnic group composition over time is at the margin. The changing trends in mortality between the ethnic groups demonstrated in this report are far too large to be explained by changes in ethnic group composition over time.
5.3 Context
Mäori and non-Mäori life expectancy trends from 1950 to 2000 To put the results of this report in context we consider historical life expectancy trends over the long term. Figure 20 shows a number of Mäori and non-Mäori life expectancy series from 1950 to 2000. The non-Mäori male and female series is that based on official Statistics New Zealand data, and is centred on census years (1951 to 1996 inclusive). It is not adjusted for numerator–denominator bias, but (as demonstrated in this report) numerator–denominator bias has little impact on the non-Mäori rates. The life expectancy estimates for non-Mäori non-Pacific people in this report are very similar to the non-Mäori estimates in the graph for the last four periods (1981, 1986, 1991 and 1996 censuses), allowing for slightly different years and the exclusion of Pacific people. Three different time series for Mäori life expectancy are shown in Figure 20:
• the ‘official’ Statistics New Zealand series for 1951 to 1976 census years, using three years of mortality data bracketing each census, without adjustment for numerator–denominator bias
• the sole series adjusted for numerator–denominator bias from this report for the 1980s and 1990s
• the prioritised series adjusted for numerator–denominator bias from this report for the 1980s and 1990s.
The first series is not adjusted for numerator–denominator bias, so there is uncertainty regarding the exact point estimates. However, this uncertainty does not alter the conclusion that a dramatic improvement in life expectancy occurred among Mäori during the 1950s, 1960s and 1970s.

Decades of Disparity: Ethnic Mortality Trends in New Zealand 1980–1999 47
Figure 20: Mäori and non-Mäori life expectancy, by gender, 1950–2000
50
55
60
65
70
75
80
85
1950 1955 1960 1965 1970 1975 1980 1985 1990 1995 2000
Years
Non-Mäori female Non-Mäori male Mäori female, pre-1980
Mäori male, pre-1980 Mäori female, adj. prioritised Mäori female, adj. sole
Mäori male, adj. prioritised Mäori male, adj. sole
Inspecting the patterns shown in Figure 20, it is clear that non-Mäori have experienced a substantial increase in life expectancy during the past half century (a 7.0-year gain for males and 8.2-year gain for females). However, the pattern has not been one of consistent increase. Little improvement occurred in non-Mäori life expectancy during the 1960s and 1970s. Indeed, male non-Mäori life expectancy only changed from 69.2 to 69.4 between 1961 and 1976. Much of this stasis in non-Mäori male life expectancy may be attributable to the peaking of the ischaemic heart disease epidemic at this time (Ministry of Health 1999a: 110). The pattern for Mäori life expectancy is dramatically different. Even though numerator–denominator bias is not adjusted for in the 1951 to 1976 series, the rapid increase in Mäori life expectancy over this period is clear and, as described by one author, ‘spectacular’ (Pool 1985). Some authors have attributed most of this improvement to falling rates of tuberculosis and other infectious disease among Mäori and falling infant mortality rates (Ministry of Health 1999a: 113; Pool 1985). The apparent period of stagnation in Mäori life expectancy between 1965–67 and 1970–72 may reflect the peaking of the ischaemic heart disease epidemic among Mäori at this time, but may also be an artefact of changes to the ethnicity question in the 1971 census. In the 1970s Mäori life expectancy resumed its former upward trajectory.

48 Decades of Disparity: Ethnic Mortality Trends in New Zealand 1980–1999
When exactly did Mäori life expectancy stop improving and flatten out? It seems unlikely that numerator–denominator bias (if any) during the late 1970s would have caused mortality rates to be underestimated and hence life expectancy to be overestimated. Far more likely is that the life expectancy estimate for 1975–77 is slightly overestimated, pointing to the early 1980s as the turning point (ie, life expectancy from the mid-1980s onwards is lower than that expected on the basis of past trends). On the other hand, if the 1975–77 life expectancy estimate is accurate, then the turning point might have occurred as early as the late 1970s. Whichever was the case, the long-term picture is one of rapidly rising Mäori life expectancy up to the late 1970s or early 1980s. As a result, until the early 1980s the gap between Mäori and non-Mäori life expectancies was closing. However, since then non-Mäori life expectancy has continued to increase while Mäori life expectancy has been (mostly) static, resulting in a widening of the gap. There are insufficient data for a long time series of Pacific life expectancies, so we do not know the long-term picture for Pacific people. However, we do know from this study that, since the 1980s at least, there has also been stasis of Pacific mortality rates and a widening life expectancy gap for Pacific relative to non-Mäori non-Pacific people.
5.4 Why are we observing these ethnic mortality trends? Possible explanations for the observed trends may be considered to fall into three categories: • epidemiological (ie, risk factors and diseases) • social structural • health services (access and quality).
Epidemiological explanations: risk factors and diseases This report points to cardiovascular disease, diabetes and cancer as the major causes of death that must be tackled to reduce ethnic disparities in mortality. These causes of death have been the subject of extensive and continuing aetiological research. Much of that research has focused on ‘risk factors’ such as tobacco, cholesterol and high blood pressure. The lung cancer and ischaemic heart disease trends in this report are consistent with what we know about tobacco consumption trends. Tobacco consumption is more prevalent, and has reduced less, among Mäori and Pacific males during the last 20 years (Borman et al 1999). Cross-sectional survey data on risk factors such as obesity and high blood pressure are consistent with the ethnic disparities in mortality described in this report (Bullen et al 1996; Skeaff et al 2001; Wilson et al 2001). But there is insufficient trend data for risk factors over time by ethnicity (with the exception of tobacco described above).

Decades of Disparity: Ethnic Mortality Trends in New Zealand 1980–1999 49
The increasing colorectal cancer rates among Mäori and Pacific people described in this report are something of a surprise; the prevailing public health view is that colorectal cancers are less common among Mäori and Pacific people (Ferguson et al 1995). This historical pattern has been considered something of a paradox given the tendency to lower red meat and fat and higher fibre and cereal diets of non-Mäori non-Pacific people in recent decades (Metcalf et al 1998; Russell et al 1999) and a (modest only) difference in physical activity between ethnic groups (Ministry of Health 1999b). It is plausible that different dietary patterns decades ago may explain this paradox given the lengthy time lag involved in colonic carcinogenesis. Of particular note, the very marked increase in Pacific colorectal cancer mortality may represent a late effect of migration to New Zealand. The Tokelau Island Migrant Study found substantial changes in diet, body mass index, diabetes incidence, cholesterol and other risk factors following migration (Wessen et al 1992). These risk factors and disease profiles probably overlap with a colorectal cancer risk profile. The exact role of energy and fat intake, and other aspects of nutrition, in the aetiology of colorectal cancer remains uncertain, although clearly there is something about western culture (and most likely diet) that affects colorectal cancer risk (Lawlor and Ness 2003). A major criticism of ‘risk factor’ research is that it has tended to decontextualise behaviour, and can potentially lead to victim blaming (Krieger 1994; Pearce 1996; Susser 1973; Susser 1985; Susser 1989). Risk factors themselves must be understood as being structured by the distal social determinants of health. For example, smoking is strongly associated with increasing deprivation (Salmond and Crampton 2000), and negatively associated with increasing income (O’Dea and Howden-Chapman 2000). The Workforce Survey found gross annual household income to be inversely associated with relative risk for diabetes and impaired glucose tolerance (Scragg et al 1991). Those on low incomes are less able to afford nutritious or healthy food (Waldegrave et al 1999), and food security is a concern for some low income New Zealanders (Russell et al 1999). Tackling socioeconomic inequalities is likely to have flow-on effects that will reduce inequalities in risk factor profiles between ethnic groups. Interventions to improve health risk profiles should be seen as a dual strategy involving both tackling the underlying determinants of risk factors, as well as directly addressing the risk factors themselves. Any discussion of risk factors and strategies for intervention must therefore take into account the social, political, economic and physical environment in which people live.

50 Decades of Disparity: Ethnic Mortality Trends in New Zealand 1980–1999
Structural explanations
Social and economic change in New Zealand society during the 1980s and 1990s
Between 1980 and 1999 New Zealand underwent major social and economic changes which form an influential backdrop to the mortality trends discussed in this report. The regulated economy of the late 1970s and early 1980s featured subsidies to control price and wage fluctuations, state housing and mortgage subsidies for low-income people, and an unemployment rate of 4% or less. 1984 is often seen as a turning point in New Zealand history, although it should be noted that the pressure for change, and indeed some of the change itself, had its roots in the prior decade (Belich 2001). However, starting apace from 1984 to at least 1993, successive governments implemented major reforms to the relationship of the state with the public by deregulating the financial sector, reorganising the state sector, and ending state support for industry (Belich 2001; Boston et al 1999; Cheyne et al 1997). Some results of these widespread reforms included a substantially flattened tax system, fully targeted income support, a regressive consumption tax (GST), market rentals for housing, privatised major utilities, user charges for health, education and other government services, and a restructured labour market designed to facilitate ‘flexibility’ (Mowbray 2001). These changes, in part at least, resulted in substantially widened income inequalities in New Zealand . Benefit cuts in 1990 resulted in the mean equivalent disposable income of households with a beneficiary dropping to below that of superannuitants, and to less than half that of households containing neither a superannuitant nor a beneficiary. Health system restructuring was also a feature of this period. The early 1990s saw the introduction of a funder/provider split, a competitive model for provision, business objectives for hospitals, increased ‘efficiencies’ by the introduction of managerialism, capped budgets, increased ‘flexibility’ of the health workforce, withdrawal of services from public hospitals, restricted access to free emergency care, additional co-payments, and increasing use of contracts in primary care (Barnett and Barnett 1999). Mäori health providers increased in number during this period (Cunningham and Durie 1999), but by 2000/01 were still only receiving $180 million of the $6.6 billion health budget. These social and macroeconomic changes did not impact equally on Mäori and non-Mäori. Mäori leaders warned at Hui Taumata in 1984 that such policies would make Mäori the ‘shock absorbers in the economy’. Indeed, inequalities between Mäori and non-Mäori widened in employment status, education, income, and housing – key social determinants of health (Howden-Chapman and Tobias 2000). Unemployment rates for Mäori rose from levels similar to those of non-Mäori in the early 1980s to three times those of non-Mäori in the late 1980s. Real incomes of Mäori households dropped during this period and did not recover to the level they had reached in the early 1980s (Mowbray 2001; Statistics New Zealand 1999; Te Puni Kökiri 2000). The 1990s also saw a significant drop in resources going to Mäori communities following the ‘mainstreaming’ of Mäori services (Cunningham and Durie 1999).

Decades of Disparity: Ethnic Mortality Trends in New Zealand 1980–1999 51
The education system plays a pivotal role in producing social inequalities between Mäori and non-Mäori, with disparities starting at primary-school level and increasing throughout secondary school. Since the mid-1970s, educational qualifications have increasingly determined access to jobs, and non-Mäori ‘advantage’ in terms of gaining access to jobs and tertiary education has increased during the last decade (Te Puni Kökiri 2000). Even with similar levels of education, however, and taking other factors into account (such as age, marital status, and length of time working), non-Mäori have been found to be advantaged in the job market, both in terms of occupational status and wages. This has been attributed to discrimination against Mäori in the job market (Alexander et al 2002; Sutherland and Alexander 2002). The wage and salary gap between Mäori and non-Mäori thus increases with age until the age of 65, with the biggest differences in the middle age group. The total income (ie, wage and other income) gap also increases through to middle age as Mäori receive less income from investments and inherited wealth (Statistics New Zealand 1999). There is also some evidence of systematic discrimination against Mäori in the welfare system (Hackwell and Howell 2002; Ministerial Advisory Committee 1986; MacDonald 1986). As New Zealand’s macroeconomic and social policies paralleled trends in other industrialised countries, we could expect the health outcomes of such policies to reflect those observed internationally. In the UK, for example, increasing social inequalities have been matched by increasing health inequalities (Drever and Whitehead 1997; Graham 2000). Although there has been an overall improvement in life expectancy in the UK during the past two decades, the improvement has mostly benefited the more advantaged socioeconomic classes. Life expectancy for men in social class 1 increased by 5.7 years while among men in social class 5 the gain was only 1.7 years. In the 1970s unskilled manual workers had death rates twice as high as those of professionals, but by the 1990s the rate was three times higher. Widening differentials were observed in major causes of premature death, including cardiovascular disease and lung cancer (Graham 2000). Similar trends of a decline in overall death rates but increasing inequalities were observed in the US: as socioeconomic differentials widened during the latter part of the 20th century (Feldman et al 1989), the mortality gap between people with low and higher incomes increased, as did black–white differences in mortality rates (Miller 1996). In summary, there has been a major and rapid structural change in New Zealand society during the last 20 years that has adversely impacted on Mäori and Pacific people. As socioeconomic factors are known to be the major determinant of health, it is highly plausible that the widening social inequalities between ethnic groups have in turn led to widening health inequalities. Ethnic disparities in health arise from differential access to the political, social, environmental, economic and behavioural determinants of health, resulting in differential incidence of disease. Differential incidence is then compounded by differential access to health care and differential quality of care (Jones 2001) leading to differential mortality. This study has confirmed that Pacific people have lower mortality rates than Mäori, both overall and for many specific causes – despite higher levels of deprivation. Possible reasons for this may include a ‘healthy migrant’ effect and the Mäori experience of colonisation. Yet this study has also shown that trends in mortality over 1980–99 were similar among Mäori and Pacific ethnic groups.

52 Decades of Disparity: Ethnic Mortality Trends in New Zealand 1980–1999
Health service explanations: access and quality The New Zealand health system – with fee-for-service primary care, GPs acting as gatekeepers to secondary services, and specialists as gatekeepers to tertiary services – is more accessible to those with higher incomes, the group less likely to need medical attention. Higher rates of co-morbidities, multiple disabilities, more complex health needs, and lower incomes, make access to optimal health care a particularly important issue when considering mortality differentials between Mäori and non-Mäori (Baxter 2002; Ministry of Health 2002b). US research has found that co-payments discourage visits for low-income people, irrespective of how medically necessary the visit was thought to be (including visits for preventive care (Miller 1996). There is evidence that this is also the case in New Zealand. An iwi general practice in Taranaki found the introduction of an $8.00 part charge for community cardholders led to a dramatic decrease in attendance (30%) among a group with extremely high health needs, and the co-payment was subsequently dropped (Ruakere 1998). Recent surveys in New Zealand have found that adults with below-average income were more likely to report having gone without needed care because of the cost (Ministry of Health 1999b; Schoen et al 2002). The Commonwealth Fund 2001 Survey also found that Mäori adults were twice as likely as non-Mäori to have gone without needed care in the past year because of the cost – partly reflecting income differences. However, even when controlling for income, access was significantly lower for Mäori (Schoen et al 2002). Adults without private health insurance are twice as likely as those with private insurance to forgo needed care or to have difficulties paying medical bills (Schoen et al 2002). The likelihood of holding health insurance is higher among employed people, but Mäori are less likely than non-Mäori to have private insurance in all categories of labour force status (Te Puni Kökiri 2000). The difference in the proportion of Mäori and non-Mäori with health insurance is greatest at age 45–64 years. In the absence of health insurance coverage, access to timely medical care (through specialist diagnostic services, for example) may be paid for privately, but many Mäori lack the means to do so. A significant body of research examining ethnic health disparities in the US has found that white Americans receive a higher quality of health services, and are more likely to receive even routine medical procedures, than other ethnic groups. Relative to white Americans, African Americans are less likely to receive appropriate cardiac medication or to undergo coronary artery bypass surgery, are less likely to receive haemodialysis and kidney transplantation, and are likely to receive a lower quality of basic clinical services such as intensive care even when variations in such factors as insurance status, income, age, co-morbid conditions, and symptom expression are taken into account. These differences were found to be associated with greater mortality among African-American patients (Smedley et al 2002).

Decades of Disparity: Ethnic Mortality Trends in New Zealand 1980–1999 53
The ratio of Mäori to non-Mäori mortality for all adult cancer is higher than the same ratio for disease incidence (Ministry of Health 2002a). This pattern indicates higher case fatality rates among Mäori compared to non-Mäori once they have cancer, suggesting an important role for health services to reduce ethnic inequalities. This pattern is consistent across sites which have a similar or lower incidence rate among Mäori (eg, breast, prostate, colorectal), as well as across those that have a higher incidence (eg, lung, cervix and stomach). The mortality/incidence ratio also increases with increasing NZDep96 decile. Early and effective diagnosis and treatment are key to better survival outcomes for many cancers. Poorer five-year relative survival for Mäori across a range of cancer sites has been directly demonstrated by analysis of New Zealand Cancer Registry data (V Stevanovic, personal communication, May 2003). Despite higher mortality from cardiovascular disease, there is evidence that Mäori and Pacific people receive fewer cardiac interventions than would be expected (Tukuitonga and Bindman 2002). Westbrooke et al (2000) found that these differences remained even after controlling for gender, age and deprivation (NZDep96) (Westbrooke et al 2000). In summary, there is some New Zealand evidence for ethnic differences in access to, and quality of, health care. While unlikely to account for all the inequality in survival chances between the ethnic groups demonstrated in this report, such health service explanations could make an important contribution to the observed disparities.
5.5 Where to from here? Reducing socioeconomic disparities between ethnic groups will lead to reduction in health gaps – although the time lags for chronic disease mortality may be measured in decades rather than years. Therefore, the results of this report clearly support ongoing efforts outside of the health sector to reduce social and ethnic inequalities in health (Ministry of Health 2002). While traditional ‘risk factor profiles’ among Mäori and Pacific people clearly need to improve more rapidly than those of non-Mäori non-Pacific people to help close ethnic gaps in mortality, it is a moot point whether they should be tackled only indirectly via structural and health services approaches. Alternatively, risk factors such as tobacco consumption, diet and obesity might also be tackled head on. However, such programmes will have to be carefully implemented so as not to be victim blaming or unintentionally contribute to the widening of ethnic health gaps. Deficit model approaches, which aim to make Mäori change to better fit current institutions, rather than changing institutions to better fit Mäori, are unlikely to be effective. Clinicians, managers, policy makers and governance bodies in the health sector have a particular responsibility to examine how their policies and practices contribute to the higher risks of premature mortality among Mäori and Pacific populations.

54 Decades of Disparity: Ethnic Mortality Trends in New Zealand 1980–1999
At a more fundamental level, we need to scrutinise the ideologies that support the ongoing reproduction of social inequalities between Mäori and non-Mäori, and determine how the circulation of these ideologies and stereotypes contributes to the maintenance of disparities. Some commentators, for example, have critiqued the often unspoken but influential labelling of the ‘deserving and the undeserving’ (Gans 1996: 92–93). In the context of ethnic health disparities, we need to consider whether ideologies of the ‘deserving’ (of jobs, education, good income, good housing, high-quality health care) are (whether consciously or unconsciously) being applied preferentially to non-Mäori and to the better-off. The tenor of media discourse indicates this as a strong possibility. A strengths-based approach (Ministry of Health 2002c) and an insistence that the health sector takes responsibility for the part it plays in maintaining or reducing inequalities is embedded in current health legislation and consequential policy settings. This policy direction is supported internationally by the World Health Organization, which now monitors the performance of countries in reducing health inequalities (World Health Organization 2002). In New Zealand the Treaty of Waitangi also provides a foundation for the Crown to address Mäori/non-Mäori disparities. The evidence on ethnic inequalities in survival chances in New Zealand presented in this report clearly demonstrates the imperative to take action.

Decades of Disparity: Ethnic Mortality Trends in New Zealand 1980–1999 55
References Ajwani S, Blakely T, Robson B, et al. 2003. Unlocking the numerator–denominator bias. III: Adjustment ratios by ethnicity for 1981–1999 mortality data. New Zealand Medical Journal (in press).
Ajwani S, Blakely T, Robson B, et al. 2002. Unlocking the Numerator–Denominator Bias for the 1980s and 1990s. NZCMS Technical Report No. 4. Wellington: Department of Public Health, Wellington School of Medicine and Health Sciences, University of Otago. Also at: http://www.wnmeds.ac.nz/nzcms-info.html.
Alexander W, Genc M, Jaforullah M. 2002. Mäori Disadvantage in the Labour Market. Dunedin: University of Otago.
Bach P, Cramer L, Warren J, et al. 1999. Racial differences in the treatment of early-stage lung cancer. New England Journal of Medicine 341: 1198–205.
Barnett P, Barnett R. 1999. Reform and change in health service provision. In: P Davis, K Dew (eds) Health and Society in Aotearoa New Zealand. Auckland: Oxford University Press.
Baxter J. 2002. Barriers to Health Care for Mäori with Known Diabetes: A literature review and summary of issues. Wellington: New Zealand National Working Group on Diabetes.
Belich J. 2001. Paradise Reforged: A history of the New Zealanders from the 1880s to the year 2000. Auckland: Penguin.
Bell C, Swinburn B, Stewart A, et al. 1996. Ethnic differences and recent trends in coronary heart disease incidence in New Zealand. New Zealand Medical Journal 109: 66–8.
Berkman L, Glass T. 2000. Social integration, social networks, social support, and health. In: L Berkman, I Kawachi (eds) Social Epidemiology (pp. 137–73). New York: Oxford University Press.
Blakely T. 2002. The New Zealand Census-Mortality Study: Socioeconomic inequalities and adult mortality 1991–94. Wellington: Ministry of Health. Also at: http://www.wnmeds.ac.nz/nzcms-info.html.
Blakely T, Atkinson J. 2001. Unlocking the Numerator–Denominator Bias, 1991–94 Deaths. NZCMS Technical Report No. 2. Wellington: Department of Public Health, Wellington School of Medicine, University of Otago. Also at: http://www.wnmeds.ac.nz/nzcms-info.html.
Blakely T, Robson B, Atkinson J, et al. 2002. Unlocking the numerator–denominator bias. I: adjustment ratios by ethnicity for 1991–94 mortality data. New Zealand Medical Journal 115: 39–43.
Blakely T, Salmond C, Woodward A. 2000. Anonymous linkage of New Zealand mortality and census data. Australian and New Zealand Journal of Public Health 24: 92–5.
Borman B, Wilson N, Maling C. 1999. Soci-demographic characteristics of New Zealand smokers: results from the 1996 census. New Zealand Medical Journal 112: 460–3.
Boston J, Dalziel P, John S. 1999. Redesigning the Welfare State in New Zealand: Problems, policies and prospects. Auckland: Oxford University Press.
Brunner E. 2000. Towards a new social biology. In: L Berkman, I Kawachi (eds) Social Epidemiology (pp. 306–31). New York: Oxford University Press.

56 Decades of Disparity: Ethnic Mortality Trends in New Zealand 1980–1999
Bullen C, Tipene-Leach D, Vander Hoorn S, et al. 1996. Ethnic difference in blood pressure: findings from the Fletcher Challenge – Auckland University Heart and Health Study. New Zealand Medical Journal 109: 395–7.
Cheyne C, O’Brien M, Belgrave M. 1997. Social Policy in Aotearoa New Zealand: A critical introduction. Auckland: Oxford University Press.
Cunningham C, Durie M. 1999. Te Rerenga Hauora. In: P Davis, K Dew (eds) Health and Society in Aotearoa New Zealand. Auckland: Oxford University Press.
Dahlgren G, Whitehead M. 1991. Policies and Strategies to Promote Social Equity in Health. Stockholm: Institute for Future Studies.
Drever F, Whitehead M. 1997. Health Inequalities. London: Office for National Statistics.
Ezzati M, Lopez A, Rodgers A, et al. 2002. Selected major risk factors and global and regional burden of disease. Lancet 360: 1347–60.
Fawcett J, Blakely T, Atkinson J. 2002. Weighting the 1981, 1986, 1991 and 1996 Census-Mortality Cohorts to Adjust for Linkage Bias. NZCMS Technical Report No. 5. Wellington: Department of Public Health, Wellington School of Medicine and Health Sciences, University of Otago. Also at: http://www.wnmeds.ac.nz/nzcms-info.html.
Feldman J, Makuc D, Kleinman J, et al. 1989. National trends in educational differentials in mortality. American Journal of Epidemiology 129: 919–33.
Ferguson L, Yee R, Scragg R, et al. 1995. Differences in intake of specific food plants by Polynesians may explain their lower incidence of colorectal cancer compared with Europeans in New Zealand. Nutrition & Cancer 23: 33–42.
Galgali G, Beaglehole R, Scragg R, et al. 1998. Potential for prevention of premature death and disease in New Zealand. New Zealand Medical Journal 110: 7–10.
Gans H. 1996. The so-called underclass and the future of antipoverty policy. In: M Lykes, A Banuazizi, R Liem, et al (eds) Myths about the Powerless: Contesting social inequalities. Philadelphia: Temple University Press.
Graham H. 2000. Understanding Health Inequalities. Buckingham: Open University Press.
Hackwell K, Howell G. 2002. Widening the Gaps: Ethnic bias in the administration of welfare to those most in hardship. Wellington: Downtown Community Ministry.
Hardisty J, Leopold E. 1996. Cancer and poverty: double jeopardy for women. In: M Lykes, A Banuazizi, R Liem, et al. (eds) Myths about the Powerless: Contesting social inequalities. Philadelphia: Temple University Press.
Hill S, Atkinson J, Blakely T. 2002. Anonymous Record Linkage of Census and Mortality Records: 1981, 1986, 1991, 1996 census cohorts. NZCMS Technical Report No. 3. Wellington: Department of Public Health, Wellington School of Medicine and Health Sciences, University of Otago. Also at: http://www.wnmeds.ac.nz/nzcms-info.html.
Howden-Chapman P, Tobias M. 2000. Social Inequalities in Health: New Zealand 1999. Wellington: Ministry of Health.
Jones C. 2001. Invited commentary: ‘race’, racism, and the practice of epidemiology. American Journal of Epidemiology 154: 299–304.
Krieger N. 1994. Epidemiology and the web of causation: has anyone seen the spider? Social Science and Medicine 39: 887–903.

Decades of Disparity: Ethnic Mortality Trends in New Zealand 1980–1999 57
Lynch J, Kaplan G, Salonen J. 1997. Why do poor people behave poorly? Variation in adult health behaviours and psychosocial characteristics by stages of the socioeconomic lifecourse. Social Science and Medicine 44: 809–19.
Macdonald J. 1986. Racism and Rental Accommodation: A report of the Office of the Race Relations Conciliator. Auckland: Race Relations Office.
Mäori Women’s Housing Research Project. 1991. For the Sake of Decent Shelter. Wellington: Mäori Women’s Housing Research Project.
Marmot MG, Bosma H, Hemingway H, et al. 1997. Contribution of job control to social gradient in coronary disease [letter – authors’ reply]. Lancet 350: 1405.
Marmot MG, Shipley M, Rose G. 1984. Inequalities in death: specific explanations of a general pattern? Lancet 1: 1003–6.
Metcalf P, Scragg R, Tukuitonga C, et al. 1998. Dietary intakes of middle-aged European, Mäori and Pacific Islands people living in New Zealand. New Zealand Medical Journal 111: 310–13.
Miller S. 1996. Equality, morality, and the health of democracy. In: M Lykes, A Banuazizi, R Liem, et al (eds) Myths about the Powerless: Contesting social inequalities. Philadelphia: Temple University Press.
Ministerial Advisory Committee on a Mäori Perspective for the Department of Social Welfare. 1986. Puao-te-ata-tu (day break): The report of the Ministerial Advisory Committee on a Mäori perspective for the Department of Social Welfare. Wellington: Department of Social Welfare.
Ministry of Health. 1999a. Our Health, Our Future: Hauora Pakari, Koiora Roa. Wellington: Ministry of Health.
Ministry of Health. 1999b. Taking the Pulse: The 1996/97 New Zealand Health Survey. Wellington: Ministry of Health.
Ministry of Health. 2002a. Cancer in New Zealand: Trends and projections. Wellington: Ministry of Health.
Ministry of Health. 2002b. Reducing Inequalities in Health. Wellington: Ministry of Health.
Ministry of Health. 2002c. He Korowai Oranga. Wellington: Ministry of Health.
Ministry of Health. 2002d. Modelling Diabetes. Wellington: Ministry of Health.
Mowbray M. 2001. Distributions and Disparity: New Zealand household incomes. Wellington: Ministry of Social Policy.
National Health Committee. 1998. The Social, Cultural and Economic Determinants of Health in New Zealand: Action to improve health. Wellington: National Health Committee.
Pearce N. 1996. Traditional epidemiology, modern epidemiology, and public health. American Journal of Public Health 86: 678–83.
Pomare E, Keefe-Ormsby V, Ormsby C, et al. 1995. Hauora: Maori Standards of Health III. Wellington: Eru Pomare Maori Health Research Centre.
Pool I. 1985. Mortality trends and differentials. In: PD Economic and Social Commission for Asia and the Pacific (ed) Country Monograph Series No. 12: Population of New Zealand (pp. 209–42). New York: United Nations.
Rothman K, Greenland S. 1998. Modern Epidemiology. Philadelphia: Lippincott-Raven.

58 Decades of Disparity: Ethnic Mortality Trends in New Zealand 1980–1999
Ruakere T. 1998. A comparative study of Mäori use of an iwi general practice and mainstream general practice. In: Massey University (ed) Te Oru Rangahau, Maori Research and Development Conference. Palmerston North: Massey University.
Russell D, Parnell W, Wilson N, et al. 1999. New Zealand Food, New Zealand People: Key results of the 1997 Nutritional Nutrition Survey. Wellington: Ministry of Health.
Schoen C, Blendon R, DesRoches C, et al. 2002. New Zealand Adults’ Health Care System Views and Experiences, 2001: Findings from the Commonwealth Fund 2001. International Health Policy Survey. New York: The Commonwealth Fund. Also at: http://ww.cmwf.org/programs/international/nz_sb_553.pdf.
Skeaff C, Mann J, McKenzie J, et al. 2001. Declining levels of total serum cholesterol in adult New Zealanders. New Zealand Medical Journal 114: 131–4.
Smedley B, Stith A, Nelson A. 2002. Unequal treatment: confronting racial and ethnic disparities in health care. In: Couaeraedih Care (ed) Washington: National Academy Press.
Spoonley P, Hirsh W. 1990. Between the Lines: Racism and the New Zealand media. Auckland: Heinemann Reed.
Statistics New Zealand. 1999. New Zealand Now: Incomes. Wellington: Statistics New Zealand.
Susser M. 1973. Causal Thinking in the Health Sciences: Concepts and strategies in the health sciences. New York: Oxford University Press.
Susser M. 1985. Epidemiology in the United States after World War II: the evolution of technique. Epidemiological Review 7: 147–77.
Susser M. 1989. Epidemiology today: ‘a thought-tormented world. International Journal of Epidemiology 18: 481–8.
Sutherland H, Alexander W. 2002. The Occupational Distribution of Mäori 1997–2000. Dunedin: University of Otago.
Te Puni Kökiri. 2000a. Progress Towards Closing the Social and Economic Gaps Between Mäori and non-Mäori: A report to the Minister of Maori Affairs. Wellington: Te Puni Kökiri.
Te Puni Kökiri. 2000b. Tikanga Oranga Hauora. Whakapakari 4. Wellington: Te Puni Kökiri.
Tukuitonga C, Bindman A. 2002. Ethnic and gender differences in the use of coronary artery revascularisation procedures in New Zealand. New Zealand Medical Journal 115: 179–82.
Turrell G, Oldenburg B, McGuffog I, et al. 1999. Socioeconomic Determinants of Health: Towards a national research program and a policy and intervention agenda. Canberra: Centre for Public Health Research, School of Public Health, Queensland University of Technology (in association with the Health Inequalities Research Collaboration).
Westbrooke I, Baxter J, Hogan J. 2000. Are Mäori under-served for cardiac interventions? New Zealand Medical Journal 114: 484–7.
Wilson B, Wilson N, Russell D. 2001. Obesity and body fat distribution in the New Zealand population. New Zealand Medical Journal 114: 127–30.
World Health Organization. 2002. World Health Report. Geneva: World Health Organization.

Decades of Disparity: Ethnic Mortality Trends in New Zealand 1980–1999 59
Appendix 1: Smoothed Adjustment Ratios by Five-Year Age Groups The adjustment ratios available for analyses in this report were by five levels of age at death: (1–14, 15–24, 25–44, 45–64 and 65–77 years). For the purpose of calculating mortality rates by five-year age categories and over the age of 77, we estimated ‘smoothed’ adjustment ratios for each five-year age group. Briefly, the crude ratios were assigned to the appropriate five-year age group within the broader age category. The smoothed ratio for the remaining age groups was calculated mathematically as follows:
SmoothRatio = {RatioVal*y}/numint + {nextrat*(numint-y)}/numint or
SmoothRatio = {prevrat*y}/numint + {RatioVal*(numint-y)}/numint,
Where:
RatioVal = the crude ratio given to that broad age category nextrat = the crude ratio given to the succeeding broad age category prevrat = the crude ratio given to the preceding broad age category numint = the total number of age intervals between the two crude ratios y = the age interval (in decreasing order) of that particular five-year age
group between the two crude ratios. Figure 21: Example of smoothing
1.85
(y =
1.75
5 4 3 2 1 0)
1.95 1.70
5–9
ye
ars
10–1
4 y
ears
15
–19
ye
ars
20
–24
ye
ars
For example, if the crude adjustment ratio for the 1–14 year category is 1.95 and for the 15–24 year category is 1.70, then the crude ratios are allotted to the ages shown in Figure 21. The smoothed ratio for the 10–14 year age group is:
SmoothRatio = {RatioVal*y}/numint + {nextrat*(numint-y)}/numint = 1.95*3}/5 + {1.70*(5-3)}/5 = 1.85
and for the 15–19 year age group is: SmoothRatio = {prevrat*y}/numint + {RatioVal*(numint-y)}/numint
= {1.95*1}/5 + {1.70*(5-1)}/5 = 1.75

60 Decades of Disparity: Ethnic Mortality Trends in New Zealand 1980–1999
For the 1–4 year age group the ratios were calculated by extrapolating the 5–9 year age group ratios, whereas those over the age of 75 years were given the same ratio as the 75–79 year age group. An additional weight was given to each of the five-year smoothed ratios based on the proportion of deaths in that five-year age group within the broader age category to produce adjustment ratios most accurate to that age group. Table 2: Smoothed adjustment ratios used in this report
Adjustment ratios (prioritised) Adjustment ratios (sole) Age group
Ethnic group
1980–84 1985–89 1990–95 1996–99 1980–84 1985–89 1990–95 1996–99
Mäori 1.42 1.62 1.62 0.94 1.11 1.09 1.24 0.75
Pacific 1.00 0.84 0.95 0.83 0.89 0.67 0.84 0.67
Non-Mäori non-Pacific 0.90 0.84 0.83 0.98 0.98 0.98 0.95 1.13
Less than 1 year
Non-Mäori 0.90 0.86 0.86 0.96 0.97 0.96 0.94 1.07
Mäori 2.14 2.61 2.65 1.09 1.68 1.68 1.97 0.91
Pacific 2.78 1.74 1.88 1.01 2.37 1.50 1.66 0.79
Non-Mäori non-Pacific 0.79 0.74 0.70 0.95 0.86 0.88 0.81 1.07
1–4 years
Non-Mäori 0.85 0.80 0.79 0.95 0.92 0.92 0.88 1.05
Mäori 2.04 2.47 2.49 1.11 1.60 1.66 1.87 0.87
Pacific 2.45 2.04 1.92 1.05 2.13 1.63 1.69 0.84
Non-Mäori non-Pacific 0.81 0.77 0.74 0.94 0.88 0.89 0.83 1.07
5–9 years
Non-Mäori 0.87 0.82 0.81 0.95 0.93 0.92 0.89 1.05
Mäori 1.94 2.34 2.33 1.13 1.53 1.64 1.77 0.84
Pacific 2.13 2.34 1.96 1.08 1.89 1.76 1.71 0.89
Non-Mäori non-Pacific 0.84 0.79 0.78 0.94 0.90 0.89 0.86 1.07
10–14 years
Non-Mäori 0.88 0.84 0.84 0.95 0.94 0.92 0.90 1.06
Mäori 1.76 2.10 2.11 1.13 1.38 1.54 1.60 0.78
Pacific 1.56 2.47 1.84 1.10 1.44 1.73 1.58 0.92
Non-Mäori non-Pacific 0.87 0.83 0.82 0.93 0.93 0.92 0.90 1.07
15–19 years
Non-Mäori 0.89 0.87 0.86 0.95 0.95 0.93 0.92 1.06
Mäori 1.67 1.99 1.96 1.14 1.32 1.52 1.52 0.77
Pacific 1.44 2.54 1.87 1.11 1.36 1.79 1.62 0.94
Non-Mäori non-Pacific 0.89 0.85 0.85 0.93 0.94 0.92 0.91 1.07
20–24 years
Non-Mäori 0.91 0.88 0.88 0.95 0.95 0.94 0.93 1.07
Mäori 1.49 1.82 1.65 1.11 1.24 1.50 1.41 0.78
Pacific 1.61 2.13 1.92 1.08 1.53 1.75 1.81 0.92
Non-Mäori non-Pacific 0.91 0.86 0.87 0.95 0.95 0.91 0.91 1.08
25–29 years
Non-Mäori 0.92 0.89 0.90 0.96 0.96 0.94 0.94 1.06
Mäori 1.45 1.77 1.58 1.10 1.22 1.49 1.38 0.79
Pacific 1.63 2.06 1.93 1.08 1.56 1.75 1.85 0.92
Non-Mäori non-Pacific 0.91 0.87 0.87 0.95 0.95 0.91 0.91 1.08
30–34 years
Non-Mäori 0.93 0.90 0.91 0.96 0.97 0.94 0.94 1.06
Mäori 1.36 1.68 1.45 1.09 1.17 1.47 1.32 0.79
Pacific 1.67 1.92 1.95 1.06 1.61 1.75 1.92 0.92
Non-Mäori non-Pacific 0.92 0.88 0.89 0.96 0.96 0.91 0.91 1.08
35–39 years
Non-Mäori 0.94 0.91 0.92 0.97 0.97 0.94 0.94 1.06
(Continued)

Decades of Disparity: Ethnic Mortality Trends in New Zealand 1980–1999 61
Adjustment ratios (prioritised) Adjustment ratios (sole) Age group
Ethnic group
1980–84 1985–89 1990–95 1996–99 1980–84 1985–89 1990–95 1996–99
Mäori 1.34 1.62 1.43 1.08 1.16 1.43 1.31 0.81
Pacific 1.68 1.94 1.89 1.04 1.60 1.80 1.87 0.91
Non-Mäori non-Pacific 0.93 0.89 0.90 0.97 0.96 0.92 0.92 1.07
40–44 years
Non-Mäori 0.95 0.92 0.93 0.97 0.98 0.94 0.95 1.05
Mäori 1.33 1.54 1.47 1.06 1.14 1.37 1.34 0.86
Pacific 1.66 2.09 1.79 1.00 1.54 1.94 1.74 0.91
Non-Mäori non-Pacific 0.95 0.92 0.92 0.98 0.97 0.94 0.94 1.05
45–49 years
Non-Mäori 0.96 0.94 0.94 0.98 0.98 0.96 0.96 1.04
Mäori 1.32 1.51 1.46 1.05 1.14 1.35 1.33 0.87
Pacific 1.66 2.10 1.76 0.99 1.54 1.96 1.72 0.91
Non-Mäori non-Pacific 0.95 0.92 0.92 0.98 0.98 0.95 0.94 1.05
50–54 years
Non-Mäori 0.96 0.94 0.94 0.98 0.98 0.96 0.96 1.04
Mäori 1.29 1.45 1.43 1.04 1.12 1.31 1.32 0.89
Pacific 1.66 2.11 1.71 0.97 1.52 2.01 1.67 0.91
Non-Mäori non-Pacific 0.96 0.94 0.93 0.99 0.98 0.96 0.95 1.04
55–59 years
Non-Mäori 0.97 0.95 0.95 0.99 0.99 0.97 0.96 1.03
Mäori 1.31 1.43 1.42 1.04 1.12 1.27 1.30 0.89
Pacific 1.66 2.03 1.70 0.96 1.52 1.90 1.66 0.90
Non-Mäori non-Pacific 0.97 0.95 0.95 0.99 0.99 0.97 0.96 1.03
60–64 years
Non-Mäori 0.98 0.96 0.96 0.99 0.99 0.98 0.97 1.02
Mäori 1.35 1.40 1.39 1.07 1.12 1.21 1.25 0.87
Pacific 1.65 1.84 1.70 0.96 1.53 1.66 1.64 0.89
Non-Mäori non-Pacific 0.98 0.97 0.96 0.99 0.99 0.98 0.97 1.02
65–69 years
Non-Mäori 0.98 0.98 0.97 0.99 0.99 0.99 0.98 1.02
Mäori 1.36 1.38 1.37 1.07 1.12 1.17 1.22 0.87
Pacific 1.65 1.76 1.70 0.95 1.53 1.56 1.63 0.89
Non-Mäori non-Pacific 0.98 0.98 0.98 0.99 0.99 0.99 0.98 1.01
70–74 years
Non-Mäori 0.99 0.99 0.98 0.99 1.00 0.99 0.99 1.01
Mäori 1.37 1.37 1.37 1.08 1.12 1.16 1.21 0.87
Pacific 1.65 1.72 1.70 0.94 1.53 1.51 1.63 0.89
Non-Mäori non-Pacific 0.99 0.99 0.98 1.00 1.00 1.00 0.99 1.01
75–79 years
Non-Mäori 0.99 0.99 0.99 0.99 1.00 1.00 1.00 1.01
Mäori 1.36 1.39 1.38 1.07 1.12 1.18 1.23 0.87
Pacific 1.65 1.78 1.70 0.95 1.53 1.58 1.64 0.89
Non-Mäori non-Pacific 0.98 0.98 0.97 0.99 0.99 0.99 0.98 1.02
80–84 years
Non-Mäori 0.99 0.99 0.98 0.99 1.00 0.99 0.99 1.01
Mäori 1.36 1.39 1.38 1.07 1.12 1.18 1.23 0.87
Pacific 1.65 1.78 1.70 0.95 1.53 1.58 1.64 0.89
Non-Mäori non-Pacific 0.98 0.98 0.97 0.99 0.99 0.99 0.98 1.02
85+ years
Non-Mäori 0.99 0.99 0.98 0.99 1.00 0.99 0.99 1.01

62 Decades of Disparity: Ethnic Mortality Trends in New Zealand 1980–1999
Appendix 2: NZCMS Validation Study Results of directly calculating ethnic-specific mortality rates from the linked records of the NZCMS dataset are compared with those obtained by applying NZCMS-derived adjusters to routine Ministry of Health datasets (Figures 22 and 23) as a validation test. Figure 22: Comparison of mortality rates, by age, EMT v. NZCMS, prioritised series
1–14 years (prioritised) 15–24 years (prioritised)
0
20
40
60
80
1980–84 1985–89 1990–95 1996–99
Mortality rates (per 100,000)
0
50
100
150
200
1980–84 1985–89 1990–95 1996–99
Mortality rates (per 100,000)
25–44 years (prioritised) 45–64 years (prioritised)
0
50
100
150
200
250
300
1980–84 1985–89 1990–95 1996–99
Mortality rates (per 100,000)
0
500
1000
1500
2000
1980–84 1985–89 1990–95 1996–99
Mortality rates (per 100,000)
65–74 years (prioritised)
0
1000
2000
3000
4000
5000
6000
7000
1980–84 1985–89 1990–95 1996–99
Mortality rates (per 100,000)
Mäori – EMT
Pacific – EMT
Mäori – CMS
Pacific – CMS
Non-Mäori non-Pacific – EMT Non-Mäori non-Pacific – CMS
Corresponding table is Table 49.

Decades of Disparity: Ethnic Mortality Trends in New Zealand 1980–1999 63
Figure 23: Comparison of mortality rates, by age, EMT v. NZCMS, sole series
1–14 years (sole) 15–24 years (sole)
0
10
20
30
40
50
60
70
1980–84 1985–89 1990–95 1996–99
Mortality rates (per 100,000)
0
50
100
150
200
1980–84 1985–89 1990–95 1996–99
Mortality rates (per 100,000)
25–44 years (sole) 45–64 years (sole)
0
50
100
150
200
250
300
350
1980–84 1985–89 1990–95 1996–99
Mortality rates (per 100,000)
0
500
1000
1500
2000
1980–84 1985–89 1990–95 1996–99
Mortality rates (per 100,000)
65–74 years (sole)
0
1000
2000
3000
4000
5000
6000
7000
1980–84 1985–89 1990–95 1996–99
Mortality rates (per 100,000)
Mäori – EMT
Pacific – EMT
Mäori – CMS
Pacific – CMS
Non-Mäori non-Pacific – EMT Non-Mäori non-Pacific – CMS
Corresponding table is Table 50.
While the patterns are similar for both methods, for both sole and prioritised series the NZCMS rates are consistently lower than the rates shown in this study for all age groups except 65–74 years, where the pattern is reversed. The reason for the lower mortality rate is lower mortality numbers. This difference is about 600 for each cohort. There are two possible reasons for this finding. First, NZCMS excluded anyone who had the domicile code = 999 or missing to improve the linkage. Second, during the linkage records anyone who was not a New Zealand resident or whose status was not mentioned in either the census or mortality record (n = 300 approximately) was excluded. Given these differences, the pattern of NZCMS rates agrees reasonably closely with that calculated using adjusters and routine mortality data, as presented in this report.
64 Decades of Disparity: Ethnic Mortality Trends in New Zealand 1980–1999
Appendix 3: Tables of Standardised Mortality Rates and Ratios Note: In all tables, the numbers in parentheses are 95% confidence intervals.
Table 3: Overall standardised mortality rate, all ages (prioritised ethnic group)
1980–84 1985–89 1990–95 1996–99 Ethnic group
Unadj. Adj. Unadj. Adj. Unadj. Adj. Unadj. Adj.
Mäori 851.5 1154.9 (1131–1179)
730.3 1063.8 (1043–1084) 769.4 1095.5 (1077–1114)
997.6 1061.8 (1043–1080)
Pacific 546.4 896.3 (843–950) 506.2 928.8 (888–969) 498.4 849.0 (820–878) 919.6 887.8 (859–917)
Non-Mäori non-Pacific
734.5 710.5 (707–714) 698.9 666.9 (664–670) 615.1 584.2 (582–587) 513.9 508.3 (506–511)
Table 4: Male standardised mortality rate, all ages (prioritised ethnic group)
1980–84 1985–89 1990–95 1996–99 Ethnic group
Unadj. Adj. Unadj. Adj. Unadj. Adj. Unadj. Adj.
Mäori 1002.9 1361.0 (1323–1399)
865.9 1264.7 (1232–1298) 907.8 1295.5 (1266–1326)
1181.2 1257.9 (1227–1289)
Pacific 769.3 1263.9 (1143–1384)
625.0 1155.1 (1083–1227) 657.4 1121.5 (1065–1178)
1185.7 1144.2 (1092–1196)
Non-Mäori non-Pacific
949.0 918.5 (912–925) 890.2 849.8 (844–855) 783.7 744.6 (740–749) 648.0 640.8 (636–646)
Table 5: Female standardised mortality rate, all ages (prioritised ethnic group)
1980–84 1985–89 1990–95 1996–99 Ethnic group
Unadj. Adj. Unadj. Adj. Unadj. Adj. Unadj. Adj.
Mäori 712.3 965.2 (935–995) 610.8 885.5 (860–911) 653.9 927.2 (905–950) 840.1 893.7 (871–917)
Pacific 410.4 672.2 (613–731) 407.0 737.8 (690–786) 387.0 657.7 (624–691) 720.7 695.5 (662–729)
Non-Mäori non-Pacific
571.4 553.1 (549–557) 548.6 524.5 (521–528) 484.5 460.9 (458–464) 411.1 406.9 (404–410)
Table 6: Overall standardised mortality rate, all ages (sole ethnic group)
1980–84 1985–89 1990–95 1996–99 Ethnic group
Unadj. Adj. Unadj. Adj. Unadj. Adj. Unadj. Adj.
Mäori 1118.7 1266.8 (1238–1295)
903.5 1127.6 (1104–1151) 911.2 1161.9 (1142–1182)
1458.5 1258.9 (1233–1285)
Pacific 557.8 846.2 (794–898) 579.7 944.4 (901–988) 536.6 877.3 (846–908) 1037.5 926.4 (893–959)
Non-Mäori non-Pacific
724.4 713.9 (711–717) 688.4 671.3 (668–675) 607.1 587.0 (584–590) 508.6 522.0 (519–525)
Table 7: Male standardised mortality rate, all ages (sole ethnic group)
1980–84 1985–89 1990–95 1996–99 Ethnic group
Unadj. Adj. Unadj. Adj. Unadj. Adj. Unadj. Adj.
Mäori 1294.7 1467.3 (1423–1511)
1067.8 1334.9 (1297–1373) 1071.6 1367.7 (1334–1401)
1731.5 1492.8 (1449–1537)

Decades of Disparity: Ethnic Mortality Trends in New Zealand 1980–1999 65
1980–84 1985–89 1990–95 1996–99 Ethnic group
Unadj. Adj. Unadj. Adj. Unadj. Adj. Unadj. Adj.
Pacific 781.6 1188.1 (1071–1305)
708.2 1162.5 (1085–1240) 713.8 1168.7 (1106–1231)
1339.4 1196.3 (1136–1257)
Non-Mäori non-Pacific
936.2 922.8 (917–929) 877.3 855.4 (850–861) 773.9 748.4 (744–753) 641.2 657.9 (653–663)
Table 8: Female standardised mortality rate, all ages (sole ethnic group)
1980–84 1985–89 1990–95 1996–99 Ethnic group
Unadj. Adj. Unadj. Adj. Unadj. Adj. Unadj. Adj.
Mäori 945.0 1068.8 (1032–1105)
757.4 941.9 (913–971) 776.3 987.6 (962–1013) 1230.6 1064.1 (1032–1096)
Pacific 426.1 645.2 (586–704) 470.9 757.3 (705–809) 416.4 679.0 (644–714) 810.9 723.6 (686–762)
Non-Mäori non-Pacific
563.7 555.8 (552–560) 540.5 527.8 (524–531) 478.2 462.9 (460–466) 407.0 417.5 (414–421)
Table 9: Overall standardised rate ratios, all ages (prioritised ethnic group)
1980–84 1985–89 1990–95 1996–99 Ethnic group
Unadj. Adj. Unadj. Adj. Unadj. Adj. Unadj. Adj.
Mäori 1.16 1.63 (1.59–1.66) 1.04 1.60 (1.56–1.63) 1.25 1.88 (1.84–1.91) 1.94 2.09 (2.05–2.13)
Pacific 0.74 1.26 (1.19–1.34) 0.72 1.39 (1.33–1.46) 0.81 1.45 (1.40–1.50) 1.79 1.75 (1.69–1.81)
Non-Mäori non-Pacific
1.00 1.00 (0.99–1.01) 1.00 1.00 (0.99–1.01) 1.00 1.00 (0.99–1.01) 1.00 1.00 (0.99–1.01)
Table 10: Male standardised rate ratios, all ages (prioritised ethnic group)
1980–84 1985–89 1990–95 1996–99 Ethnic group
Unadj. Adj. Unadj. Adj. Unadj. Adj. Unadj. Adj.
Mäori 1.06 1.48 (1.44–1.52) 0.97 1.49 (1.45–1.53) 1.16 1.74 (1.70–1.78) 1.82 1.96 (1.91–2.01)
Pacific 0.81 1.38 (1.25–1.51) 0.70 1.36 (1.28–1.45) 0.84 1.51 (1.43–1.59) 1.83 1.79 (1.70–1.87)
Non-Mäori non-Pacific
1.00 1.00 (0.99–1.01) 1.00 1.00 (0.99–1.01) 1.00 1.00 (0.99–1.01) 1.00 1.00 (0.99–1.01)
Table 11: Female standardised rate ratios, all ages (prioritised ethnic group)
1980–84 1985–89 1990–95 1996–99 Ethnic group
Unadj. Adj. Unadj. Adj. Unadj. Adj. Unadj. Adj.
Mäori 1.25 1.74 (1.69–1.80) 1.11 1.69 (1.64–1.74) 1.35 2.01 (1.96–2.06) 2.04 2.20 (2.14–2.26)
Pacific 0.72 1.22 (1.11–1.33) 0.74 1.41 (1.32–1.50) 0.80 1.43 (1.36–1.50) 1.75 1.71 (1.63–1.80)
Non-Mäori non-Pacific
1.00 1.00 (0.99–1.01) 1.00 1.00 (0.99–1.01) 1.00 1.00 (0.99–1.01) 1.00 1.00 (0.99–1.01)
Table 12: Overall standardised rate ratios, all ages (sole ethnic group)
1980–84 1985–89 1990–95 1996–99 Ethnic group
Unadj. Adj. Unadj. Adj. Unadj. Adj. Unadj. Adj.
Mäori 1.54 1.77 (1.73–1.82) 1.31 1.68 (1.64–1.72) 1.50 1.98 (1.94–2.02) 2.87 2.41 (2.36–2.46)
Pacific 0.77 1.19 (1.11–1.26) 0.84 1.41 (1.34–1.47) 0.88 1.49 (1.44–1.55) 2.04 1.77 (1.71–1.84)
Non-Mäori non-Pacific
1.00 1.00 (0.99–1.01) 1.00 1.00 (0.99–1.01) 1.00 1.00 (0.99–1.01) 1.00 1.00 (0.99–1.01)

66 Decades of Disparity: Ethnic Mortality Trends in New Zealand 1980–1999
Table 13: Male standardised rate ratios, all ages (sole ethnic group)
1980–84 1985–89 1990–95 1996–99 Ethnic group
Unadj. Adj. Unadj. Adj. Unadj. Adj. Unadj. Adj.
Mäori 1.38 1.59 (1.54–1.64) 1.22 1.56 (1.52–1.61) 1.38 1.83 (1.78–1.87) 2.70 2.27 (2.20–2.34)
Pacific 0.83 1.29 (1.17–1.42) 0.81 1.36 (1.27–1.45) 0.92 1.56 (1.48–1.65) 2.09 1.82 (1.73–1.91)
Non-Mäori non-Pacific
1.00 1.00 (0.99–1.01) 1.00 1.00 (0.99–1.01) 1.00 1.00 (0.99–1.01) 1.00 1.00 (0.99–1.01)
Table 14: Female standardised rate ratios, all ages (sole ethnic group)
1980–84 1985–89 1990–95 1996–99 Ethnic group
Unadj. Adj. Unadj. Adj. Unadj. Adj. Unadj. Adj.
Mäori 1.68 1.92 (1.86–1.99) 1.40 1.78 (1.73–1.84) 1.62 2.13 (2.08–2.19) 3.02 2.55 (2.47–2.63)
Pacific 0.76 1.16 (1.06–1.27) 0.87 1.43 (1.34–1.54) 0.87 1.47 (1.39–1.54) 1.99 1.73 (1.64–1.83)
Non-Mäori non-Pacific
1.00 1.00 (0.99–1.01) 1.00 1.00 (0.99–1.01) 1.00 1.00 (0.99–1.01) 1.00 1.00 (0.99–1.01)
Table 15: Overall age-specific mortality rate, by age group (prioritised series)
Age group Ethnic group 1980–84 1985–89 1990–95 1996–99
Mäori 49.0 (44.8–53.2) 48.9 (44.7–53.1) 41.8 (38.2–45.3) 43.7 (39.7–47.8)
Pacific 70.6 (60.2–81.0) 50.2 (42.0–58.3) 46.9 (40.5–53.3) 31.3 (25.2–37.4)
1–14 years
Non-Mäori non-Pacific 35.4 (33.6–37.2) 33.1 (31.3–34.9) 25.6 (24.1–27.1) 20.6 (19.0–22.2)
Mäori 148.0 (138–157) 159.2 (150–169) 154.0 (145–163) 141.9 (132–152)
Pacific 124.9 (105–144) 147.7 (130–166) 95.5 (83.9–107) 111.7 (96.4–127)
15–24 years
Non-Mäori non-Pacific 103.0 (99.5–106) 105.7 (102–109) 95.5 (92.4–98.7) 72.4 (68.9–75.9)
Mäori 283.9 (270–298) 276.6 (264–290) 262.3 (252–273) 252.9 (242–264)
Pacific 198.6 (177–220) 212.1 (193–231) 179.6 (166–193) 213.3 (196–230)
25–44 years
Non-Mäori non-Pacific 129.0 (126–132) 122.9 (120–126) 113.3 (111–116) 94.9 (92.3–97.6)
Mäori 1749.7 (1697–1803) 1734.0 (1685–1783) 1723.0 (1682–1764) 1569.2 (1527–1612)
Pacific 1309.5 (1204–1415) 1324.5 (1241–1408) 1071.0 (1015–1127) 1173.2 (1109–1237)
45–64 years
Non-Mäori non-Pacific 787.3 (779–796) 707.1 (699–715) 605.5 (599–612) 502.3 (495–510)
Mäori 5671.7 (5452–5891) 5317.9 (5111–5525) 5469.3 (5291–5647) 5295.8 (5118–5473)
Pacific 4567.4 (4078–5057) 5074.6 (4653–5496) 4184.9 (3922–4448) 4421.2 (4148–4695)
65–74 years
Non-Mäori non-Pacific 3205.0 (3175–3235) 2948.7 (2921–2977) 2592.3 (2569–2615) 2122.2 (2098–2147)
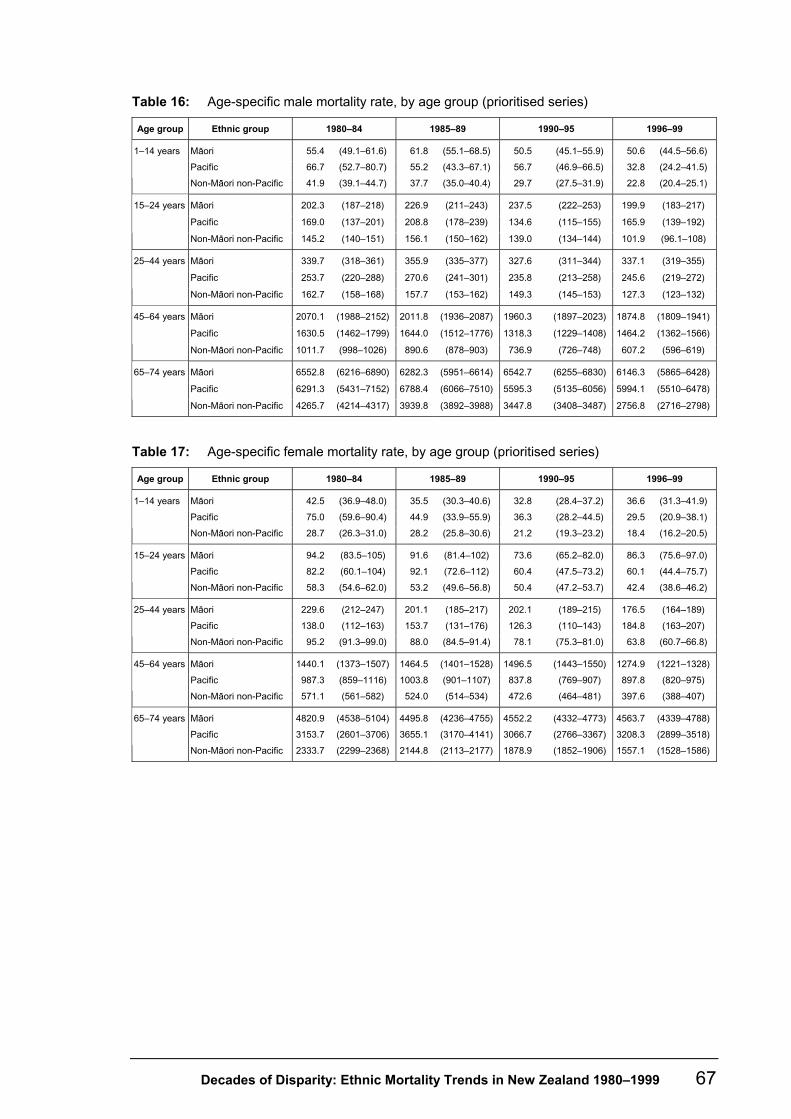
Decades of Disparity: Ethnic Mortality Trends in New Zealand 1980–1999 67
Table 16: Age-specific male mortality rate, by age group (prioritised series)
Age group Ethnic group 1980–84 1985–89 1990–95 1996–99
Mäori 55.4 (49.1–61.6) 61.8 (55.1–68.5) 50.5 (45.1–55.9) 50.6 (44.5–56.6)
Pacific 66.7 (52.7–80.7) 55.2 (43.3–67.1) 56.7 (46.9–66.5) 32.8 (24.2–41.5)
1–14 years
Non-Mäori non-Pacific 41.9 (39.1–44.7) 37.7 (35.0–40.4) 29.7 (27.5–31.9) 22.8 (20.4–25.1)
Mäori 202.3 (187–218) 226.9 (211–243) 237.5 (222–253) 199.9 (183–217)
Pacific 169.0 (137–201) 208.8 (178–239) 134.6 (115–155) 165.9 (139–192)
15–24 years
Non-Mäori non-Pacific 145.2 (140–151) 156.1 (150–162) 139.0 (134–144) 101.9 (96.1–108)
Mäori 339.7 (318–361) 355.9 (335–377) 327.6 (311–344) 337.1 (319–355)
Pacific 253.7 (220–288) 270.6 (241–301) 235.8 (213–258) 245.6 (219–272)
25–44 years
Non-Mäori non-Pacific 162.7 (158–168) 157.7 (153–162) 149.3 (145–153) 127.3 (123–132)
Mäori 2070.1 (1988–2152) 2011.8 (1936–2087) 1960.3 (1897–2023) 1874.8 (1809–1941)
Pacific 1630.5 (1462–1799) 1644.0 (1512–1776) 1318.3 (1229–1408) 1464.2 (1362–1566)
45–64 years
Non-Mäori non-Pacific 1011.7 (998–1026) 890.6 (878–903) 736.9 (726–748) 607.2 (596–619)
Mäori 6552.8 (6216–6890) 6282.3 (5951–6614) 6542.7 (6255–6830) 6146.3 (5865–6428)
Pacific 6291.3 (5431–7152) 6788.4 (6066–7510) 5595.3 (5135–6056) 5994.1 (5510–6478)
65–74 years
Non-Mäori non-Pacific 4265.7 (4214–4317) 3939.8 (3892–3988) 3447.8 (3408–3487) 2756.8 (2716–2798)
Table 17: Age-specific female mortality rate, by age group (prioritised series)
Age group Ethnic group 1980–84 1985–89 1990–95 1996–99
Mäori 42.5 (36.9–48.0) 35.5 (30.3–40.6) 32.8 (28.4–37.2) 36.6 (31.3–41.9)
Pacific 75.0 (59.6–90.4) 44.9 (33.9–55.9) 36.3 (28.2–44.5) 29.5 (20.9–38.1)
1–14 years
Non-Mäori non-Pacific 28.7 (26.3–31.0) 28.2 (25.8–30.6) 21.2 (19.3–23.2) 18.4 (16.2–20.5)
Mäori 94.2 (83.5–105) 91.6 (81.4–102) 73.6 (65.2–82.0) 86.3 (75.6–97.0)
Pacific 82.2 (60.1–104) 92.1 (72.6–112) 60.4 (47.5–73.2) 60.1 (44.4–75.7)
15–24 years
Non-Mäori non-Pacific 58.3 (54.6–62.0) 53.2 (49.6–56.8) 50.4 (47.2–53.7) 42.4 (38.6–46.2)
Mäori 229.6 (212–247) 201.1 (185–217) 202.1 (189–215) 176.5 (164–189)
Pacific 138.0 (112–163) 153.7 (131–176) 126.3 (110–143) 184.8 (163–207)
25–44 years
Non-Mäori non-Pacific 95.2 (91.3–99.0) 88.0 (84.5–91.4) 78.1 (75.3–81.0) 63.8 (60.7–66.8)
Mäori 1440.1 (1373–1507) 1464.5 (1401–1528) 1496.5 (1443–1550) 1274.9 (1221–1328)
Pacific 987.3 (859–1116) 1003.8 (901–1107) 837.8 (769–907) 897.8 (820–975)
45–64 years
Non-Mäori non-Pacific 571.1 (561–582) 524.0 (514–534) 472.6 (464–481) 397.6 (388–407)
Mäori 4820.9 (4538–5104) 4495.8 (4236–4755) 4552.2 (4332–4773) 4563.7 (4339–4788)
Pacific 3153.7 (2601–3706) 3655.1 (3170–4141) 3066.7 (2766–3367) 3208.3 (2899–3518)
65–74 years
Non-Mäori non-Pacific 2333.7 (2299–2368) 2144.8 (2113–2177) 1878.9 (1852–1906) 1557.1 (1528–1586)

68 Decades of Disparity: Ethnic Mortality Trends in New Zealand 1980–1999
Table 18: Overall age-specific mortality rate, by age group (sole series)
Age group Ethnic group 1980–84 1985–89 1990–95 1996–99
Mäori 56.6 (51.1–62.0) 51.0 (45.6–56.4) 47.6 (43.0–52.2) 61.5 (54.3–68.7)
Pacific 62.2 (52.4–72.0) 53.5 (43.9–63.1) 50.3 (43.0–57.7) 28.7 (21.7–35.8)
1–14 years
Non-Mäori non-Pacific 35.6 (33.8–37.3) 34.4 (32.6–36.1) 25.9 (24.5–27.3) 22.2 (20.7–23.7)
Mäori 159.4 (148–171) 158.3 (147–169) 158.8 (149–169) 167.0 (152–182)
Pacific 119.7 (100–139) 125.3 (107–143) 96.6 (83.9–109) 106.8 (89.3–124)
15–24 years
Non-Mäori non-Pacific 104.1 (101–107) 109.1 (106–113) 97.1 (94.0–100) 78.4 (75.1–81.8)
Mäori 311.9 (295–328) 297.0 (282–312) 289.9 (278–302) 287.7 (273–303)
Pacific 196.0 (174–218) 206.8 (187–226) 186.8 (172–201) 202.9 (185–221)
25–44 years
Non-Mäori non-Pacific 130.4 (127–134) 124.9 (122–128) 113.8 (111–116) 103.2 (101–106)
Mäori 1906.7 (1845–1969) 1866.7 (1811–1923) 1833.6 (1788–1879) 1848.2 (1792–1905)
Pacific 1238.0 (1134–1342) 1372.7 (1283–1463) 1095.9 (1038–1154) 1213.3 (1144–1283)
45–64 years
Non-Mäori non-Pacific 793.5 (785–802) 711.5 (703–720) 609.3 (603–616) 519.1 (512–526)
Mäori 6205.5 (5941–6470) 5571.7 (5337–5806) 5691.8 (5496–5887) 6141.4 (5903–6380)
Pacific 4350.8 (3866–4836) 5136.3 (4684–5589) 4281.8 (4007–4556) 4632.6 (4327–4938)
65–74 years
Non-Mäori non-Pacific 3213.3 (3183–3243) 2957.1 (2929–2985) 2600.1 (2577–2623) 2151.6 (2127–2176)
Table 19: Age-specific male mortality rate, by age group (sole series)
Age group Ethnic group 1980–84 1985–89 1990–95 1996–99
Mäori 64.0 (55.8–72.1) 64.2 (55.7–72.7) 57.4 (50.3–64.5) 70.8 (60.1–81.5)
Pacific 58.5 (45.3–71.7) 58.4 (44.4–72.5) 60.7 (49.5–71.8) 27.9 (18.3–37.5)
1–14 years
Non-Mäori non-Pacific 42.1 (39.5–44.8) 39.3 (36.6–41.9) 30.1 (28.0–32.2) 24.7 (22.5–27.0)
Mäori 217.3 (198–236) 222.7 (204–241) 239.9 (222–258) 231.1 (206–256)
Pacific 162.7 (130–195) 176.9 (146–208) 135.5 (114–157) 165.9 (135–197)
15–24 years
Non-Mäori non-Pacific 147.1 (141–153) 161.6 (156–167) 142.0 (137–147) 110.4 (105–116)
Mäori 371.6 (346–397) 379.8 (356–404) 356.4 (337–376) 378.9 (354–404)
Pacific 249.8 (215–284) 262.4 (231–293) 244.7 (221–268) 236.4 (208–265)
25–44 years
Non-Mäori non-Pacific 164.5 (160–169) 160.7 (156–165) 150.2 (146–154) 138.3 (134–143)
Mäori 2251.4 (2155–2348) 2156.1 (2071–2242) 2063.8 (1995–2133) 2164.6 (2078–2251)
Pacific 1537.1 (1371–1703) 1698.3 (1557–1840) 1345.8 (1253–1439) 1494.3 (1384–1605)
45–64 years
Non-Mäori non-Pacific 1019.9 (1006–1034) 896.5 (884–909) 742.4 (732–753) 629.7 (618–641)
Mäori 7112.9 (6710–7515) 6623.8 (6246–7002) 6828.5 (6511–7145) 7165.2 (6782–7548)
Pacific 6016.3 (5158–6875) 6715.6 (5957–7474) 5666.0 (5191–6141) 6252.1 (5715–6790)
65–74 years
Non-Mäori non-Pacific 4274.5 (4223–4326) 3950.4 (3902–3998) 3458.3 (3419–3498) 2794.4 (2754–2835)

Decades of Disparity: Ethnic Mortality Trends in New Zealand 1980–1999 69
Table 20: Age-specific female mortality rate, by age group (sole series)
Age group Ethnic group 1980–84 1985–89 1990–95 1996–99
Mäori 49.0 (41.8–56.2) 37.1 (30.5–43.7) 37.5 (31.6–43.3) 51.4 (41.9–60.9)
Pacific 66.3 (51.6–80.9) 48.3 (35.2–61.4) 39.1 (29.7–48.5) 29.6 (19.3–39.9)
1–14 years
Non-Mäori non-Pacific 28.7 (26.5–31.0) 29.3 (27.0–31.6) 21.5 (19.7–23.3) 19.5 (17.5–21.5)
Mäori 101.9 (88.9–115) 92.3 (80.3–104) 77.7 (67.6–87.8) 103.0 (86.0–120)
Pacific 78.4 (56.5–100) 78.5 (58.7–98.3) 61.4 (47.3–75.5) 51.1 (34.0–68.1)
15–24 years
Non-Mäori non-Pacific 58.8 (55.2–62.5) 54.7 (51.2–58.2) 51.0 (47.8–54.2) 46.3 (42.6–50.0)
Mäori 251.9 (231–273) 217.1 (199–235) 226.9 (212–242) 202.7 (185–221)
Pacific 136.3 (111–162) 150.7 (127–174) 131.5 (114–149) 173.3 (150–197)
25–44 years
Non-Mäori non-Pacific 96.2 (92.4–100.0) 89.3 (85.9–92.8) 78.2 (75.5–81.0) 69.8 (66.7–72.8)
Mäori 1573.6 (1494–1653) 1583.6 (1511–1656) 1609.5 (1549–1670) 1537.0 (1465–1609)
Pacific 939.1 (812–1067) 1044.2 (933–1155) 860.3 (789–932) 945.6 (860–1032)
45–64 years
Non-Mäori non-Pacific 575.4 (565–586) 526.9 (517–537) 475.1 (467–484) 409.2 (400–418)
Mäori 5327.7 (4982–5673) 4690.4 (4398–4983) 4730.9 (4489–4973) 5285.7 (4987–5584)
Pacific 2990.1 (2446–3535) 3777.1 (3245–4309) 3168.7 (2852–3485) 3376.8 (3030–3724)
65–74 years
Non-Mäori non-Pacific 2340.6 (2306–2375) 2151.3 (2119–2183) 1884.5 (1858–1911) 1579.2 (1550–1608)
Table 21: Age-specific mortality rate ratios, by gender (prioritised)
Ethnic group Gender Age group 1980–84 1985–89 1990–95 1996–99
1–14 years 1.32 (1.16–1.51) 1.64 (1.44–1.86) 1.70 (1.49–1.94) 2.22 (1.90–2.60)
15–24 years 1.39 (1.28–1.52) 1.45 (1.34–1.58) 1.71 (1.58–1.84) 1.96 (1.77–2.17)
25–44 years 2.09 (1.95–2.24) 2.26 (2.11–2.41) 2.19 (2.07–2.32) 2.65 (2.48–2.82)
45–64 years 2.05 (1.96–2.13) 2.26 (2.17–2.35) 2.66 (2.57–2.76) 3.09 (2.97–3.21)
Males
65–74 years 1.54 (1.46–1.62) 1.59 (1.51–1.68) 1.90 (1.81–1.99) 2.23 (2.12–2.34)
1–14 years 1.48 (1.27–1.73) 1.26 (1.06–1.49) 1.54 (1.31–1.82) 1.99 (1.65–2.40)
15–24 years 1.62 (1.42–1.84) 1.72 (1.51–1.96) 1.46 (1.28–1.66) 2.04 (1.75–2.37)
25–44 years 2.41 (2.21–2.63) 2.29 (2.09–2.49) 2.59 (2.40–2.78) 2.77 (2.54–3.02)
45–64 years 2.52 (2.40–2.65) 2.80 (2.67–2.93) 3.17 (3.04–3.30) 3.21 (3.06–3.36)
Mäori
Females
65–74 years 2.07 (1.94–2.19) 2.10 (1.97–2.22) 2.42 (2.30–2.55) 2.93 (2.78–3.09)
1–14 years 1.59 (1.28–1.98) 1.46 (1.16–1.84) 1.91 (1.58–2.30) 1.44 (1.09–1.91)
15–24 years 1.16 (0.96–1.41) 1.34 (1.15–1.56) 0.97 (0.83–1.13) 1.63 (1.37–1.93)
25–44 years 1.56 (1.36–1.79) 1.72 (1.53–1.92) 1.58 (1.43–1.74) 1.93 (1.72–2.16)
45–64 years 1.61 (1.45–1.79) 1.85 (1.70–2.00) 1.79 (1.67–1.92) 2.41 (2.24–2.59)
Males
65–74 years 1.47 (1.29–1.69) 1.72 (1.55–1.92) 1.62 (1.49–1.76) 2.17 (2.00–2.36)
1–14 years 2.62 (2.10–3.26) 1.59 (1.23–2.07) 1.71 (1.34–2.18) 1.61 (1.17–2.20)
15–24 years 1.41 (1.07–1.86) 1.73 (1.39–2.16) 1.20 (0.96–1.50) 1.42 (1.08–1.86)
25–44 years 1.45 (1.20–1.75) 1.75 (1.50–2.04) 1.62 (1.41–1.85) 2.90 (2.55–3.29)
45–64 years 1.73 (1.52–1.97) 1.92 (1.73–2.13) 1.77 (1.63–1.93) 2.26 (2.06–2.47)
Pacific
Females
65–74 years 1.35 (1.13–1.61) 1.70 (1.49–1.95) 1.63 (1.48–1.80) 2.06 (1.87–2.27)

70 Decades of Disparity: Ethnic Mortality Trends in New Zealand 1980–1999
Table 22: Age-specific mortality rate ratios, by gender (sole)
Ethnic group Gender Age group 1980–84 1985–89 1990–95 1996–99
1–14 years 1.52 (1.32–1.75) 1.64 (1.41–1.90) 1.91 (1.65–2.20) 2.86 (2.40–3.41)
15–24 years 1.48 (1.34–1.63) 1.38 (1.26–1.51) 1.69 (1.56–1.83) 2.09 (1.86–2.36)
25–44 years 2.26 (2.10–2.43) 2.36 (2.21–2.53) 2.37 (2.24–2.52) 2.74 (2.55–2.95)
45–64 years 2.21 (2.11–2.31) 2.40 (2.31–2.51) 2.78 (2.68–2.88) 3.44 (3.29–3.59)
Males
65–74 years 1.66 (1.57–1.76) 1.68 (1.58–1.78) 1.97 (1.88–2.07) 2.56 (2.43–2.71)
1–14 years 1.70 (1.44–2.01) 1.27 (1.04–1.54) 1.74 (1.46–2.08) 2.64 (2.13–3.26)
15–24 years 1.73 (1.50–2.00) 1.69 (1.46–1.95) 1.52 (1.32–1.76) 2.22 (1.85–2.67)
25–44 years 2.62 (2.39–2.87) 2.43 (2.22–2.66) 2.90 (2.69–3.13) 2.91 (2.63–3.21)
45–64 years 2.73 (2.59–2.89) 3.01 (2.86–3.16) 3.39 (3.25–3.53) 3.76 (3.57–3.96)
Mäori
Females
65–74 years 2.28 (2.13–2.43) 2.18 (2.04–2.32) 2.51 (2.38–2.65) 3.35 (3.15–3.55)
1–14 years 1.39 (1.10–1.76) 1.49 (1.16–1.91) 2.02 (1.66–2.45) 1.13 (0.79–1.61)
15–24 years 1.11 (0.90–1.35) 1.09 (0.92–1.31) 0.95 (0.81–1.12) 1.50 (1.24–1.83)
25–44 years 1.52 (1.32–1.75) 1.63 (1.45–1.84) 1.63 (1.47–1.80) 1.71 (1.51–1.93)
45–64 years 1.51 (1.35–1.68) 1.89 (1.74–2.06) 1.81 (1.69–1.95) 2.37 (2.20–2.56)
Males
65–74 years 1.41 (1.22–1.62) 1.70 (1.52–1.90) 1.64 (1.51–1.78) 2.24 (2.05–2.44)
1–14 years 2.31 (1.82–2.91) 1.65 (1.24–2.19) 1.82 (1.41–2.35) 1.52 (1.06–2.18)
15–24 years 1.33 (1.00–1.77) 1.44 (1.11–1.86) 1.20 (0.95–1.53) 1.10 (0.78–1.55)
25–44 years 1.42 (1.17–1.72) 1.69 (1.43–1.98) 1.68 (1.47–1.92) 2.48 (2.15–2.87)
45–64 years 1.63 (1.42–1.87) 1.98 (1.78–2.21) 1.81 (1.66–1.97) 2.31 (2.10–2.54)
Pacific
Females
65–74 years 1.28 (1.06–1.53) 1.76 (1.52–2.02) 1.68 (1.52–1.86) 2.14 (1.93–2.37)
Table 23: Sole and prioritised Mäori mortality rates, by age group
Age group Ethnic group 1980–84 1985–89 1990–95 1996–99
Sole 56.6 (51.1–62.0) 51.0 (45.6–56.4) 47.6 (43.0–52.2) 61.5 (54.3–68.7) 1–14 years
Prioritised 49.0 (44.8–53.2) 48.9 (44.7–53.1) 41.8 (38.2–45.3) 43.7 (39.7–47.8)
Sole 159.4 (148–171) 158.3 (147–169) 158.8 (149–169) 167.0 (152–182) 15–24 years
Prioritised 148.0 (138–157) 159.2 (150–169) 154.0 (145–163) 141.9 (132–152)
Sole 311.9 (295–328) 297.0 (282–312) 289.9 (278–302) 287.7 (273–303) 25–44 years
Prioritised 283.9 (270–298) 276.6 (264–290) 262.3 (252–273) 252.9 (242–264)
Sole 1906.7 (1845–1969) 1866.7 (1811–1923) 1833.6 (1788–1879) 1848.2 (1792–1905) 45–64 years
Prioritised 1749.7 (1697–1803) 1734.0 (1685–1783) 1723.0 (1682–1764) 1569.2 (1527–1612)
Sole 6205.5 (5941–6470) 5571.7 (5337–5806) 5691.8 (5496–5887) 6141.4 (5903–6380) 65–74 years
Prioritised 5671.7 (5452–5891) 5317.9 (5111–5525) 5469.3 (5291–5647) 5295.8 (5118–5473)

Decades of Disparity: Ethnic Mortality Trends in New Zealand 1980–1999 71
Table 24: Sole and prioritised Pacific mortality rates, by age group
Age group Ethnic group 1980–84 1985–89 1990–95 1996–99
Sole 62.2 (52.4–72.0) 53.5 (43.9–63.1) 50.3 (43.0–57.7) 28.7 (21.7–35.8) 1–14 years
Prioritised 70.6 (60.2–81.0) 50.2 (42.0–58.3) 46.9 (40.5–53.3) 31.3 (25.2–37.4)
Sole 119.7 (100–139) 125.3 (107–143) 96.6 (83.9–109) 106.8 (89.3–124) 15–24 years
Prioritised 124.9 (105–144) 147.7 (130–166) 95.5 (83.9–107) 111.7 (96.4–127)
Sole 196.0 (174–218) 206.8 (187–226) 186.8 (172–201) 202.9 (185–221) 25–44 years
Prioritised 198.6 (177–220) 212.1 (193–231) 179.6 (166–193) 213.3 (196–230)
Sole 1238.0 (1134–1342) 1372.7 (1283–1463) 1095.9 (1038–1154) 1213.3 (1144–1283) 45–64 years
Prioritised 1309.5 (1204–1415) 1324.5 (1241–1408) 1071.0 (1015–1127) 1173.2 (1109–1237)
Sole 4350.8 (3866–4836) 5136.3 (4684–5589) 4281.8 (4007–4556) 4632.6 (4327–4938) 65–74 years
Prioritised 4567.4 (4078–5057) 5074.6 (4653–5496) 4184.9 (3922–4448) 4421.2 (4148–4695)
Table 25: Life expectancy, by age (prioritised series)
Gender Age Prioritised ethnic group 1980–84 1985–89 1990–95 1996–99
Mäori 64.6 64.9 65.2 65.8
Pacific 66.7 66.9 68.6 67.9
At birth
Non-Mäori non-Pacific 70.9 71.9 73.7 75.7
Mäori 51.1 51.5 51.5 51.9
Pacific 53.0 53.1 54.6 53.8
15 years
Non-Mäori non-Pacific 57.2 58.0 59.5 61.3
Mäori 24.2 24.9 24.7 25.1
Pacific 25.4 25.9 27.0 26.3
45 years
Non-Mäori non-Pacific 29.2 30.1 31.5 33.0
Mäori 11.2 12.0 11.5 11.6
Pacific 11.1 11.8 11.8 11.7
Males
65 years
Non-Mäori non-Pacific 13.4 13.9 14.8 15.9
Mäori 69.4 70.5 70.2 71.0
Pacific 74.2 73.2 75.0 74.2
At birth
Non-Mäori non-Pacific 77.2 77.9 79.4 80.8
Mäori 55.7 56.8 56.2 56.9
Pacific 60.6 59.4 60.9 60.0
15 years
Non-Mäori non-Pacific 63.2 63.8 65.1 66.4
Mäori 27.9 28.7 28.1 28.6
Pacific 32.2 31.1 32.2 31.8
45 years
Non-Mäori non-Pacific 34.4 34.9 36.1 37.2
Mäori 13.7 14.9 14.2 13.9
Pacific 17.0 15.7 16.2 16.0
Females
65 years
Non-Mäori non-Pacific 17.3 17.6 18.6 19.4

72 Decades of Disparity: Ethnic Mortality Trends in New Zealand 1980–1999
Table 26: Life expectancy, by age (sole series)
Gender Age Sole ethnic group 1980–84 1985–89 1990–95 1996–99
Mäori 63.34 64.10 64.27 63.60
Pacific 67.40 66.88 68.21 67.67
At birth
Non-Mäori non-Pacific 70.86 71.75 73.64 75.31
Mäori 50.09 50.81 50.81 50.04
Pacific 53.54 53.17 54.36 53.48
15 years
Non-Mäori non-Pacific 57.17 57.95 59.44 61.02
Mäori 23.40 24.27 24.20 23.49
Pacific 25.99 25.78 26.73 25.91
45 years
Non-Mäori non-Pacific 29.18 30.06 31.43 32.80
Mäori 10.66 11.60 11.12 10.41
Pacific 11.50 11.84 11.66 11.20
Males
65 years
Non-Mäori non-Pacific 13.34 13.85 14.76 15.78
Mäori 67.95 69.60 69.15 68.66
Pacific 74.79 72.88 74.61 73.89
At birth
Non-Mäori non-Pacific 77.10 77.76 79.36 80.51
Mäori 54.53 55.91 55.38 54.82
Pacific 61.08 59.18 60.52 59.59
15 years
Non-Mäori non-Pacific 63.17 63.76 65.02 66.12
Mäori 26.78 27.92 27.36 26.75
Pacific 32.63 30.77 31.91 31.23
45 years
Non-Mäori non-Pacific 34.33 34.86 36.03 37.04
Mäori 12.79 14.41 13.76 12.54
Pacific 17.25 15.48 15.97 15.57
Females
65 years
Non-Mäori non-Pacific 17.26 17.59 18.60 19.33
Table 27: Age-substituted life expectancy, by gender (prioritised series)
Age-substituted life expectancy Gender Prioritised ethnic group
Period
0–14 years 15–44 years 45–64 years 65+ years
1980–84 0.33 1.45 3.21 1.36
1985–89 0.60 1.67 3.51 1.18
1990–95 0.70 1.74 3.96 2.17
Mäori
1996–99 0.71 2.05 4.32 2.89
1980–84 0.03 0.68 1.96 1.55
1985–89 0.12 1.01 2.45 1.39
1990–95 0.36 0.58 2.01 2.21
Males
Pacific
1996–99 0.40 1.22 3.05 3.16
1980–84 0.42 1.22 3.40 2.72
1985–89 0.37 1.08 3.85 2.01
1990–95 0.53 1.09 4.22 3.37
Mäori
1996–99 0.53 1.17 3.69 4.48
1980–84 0.40 0.47 1.84 0.27
1985–89 0.34 0.74 2.07 1.50
1990–95 0.24 0.45 1.69 2.01
Females
Pacific
1996–99 0.29 1.12 2.31 2.88

Decades of Disparity: Ethnic Mortality Trends in New Zealand 1980–1999 73
Table 28: Age-substituted life expectancy, by gender (sole series)
Age-substituted life expectancy Gender Prioritised ethnic group
Period
0–14 years 15–44 years 45–64 years 65+ years
1980–84 0.64 1.70 3.58 1.60
1985–89 0.70 1.74 3.84 1.37
1990–95 0.95 1.91 4.17 2.34
Mäori
1996–99 0.99 2.35 4.87 3.50
1980–84 -0.10 0.61 1.68 1.28
1985–89 0.18 0.73 2.59 1.36
1990–95 0.44 0.62 2.06 2.31
Males
Pacific
1996–99 0.19 1.01 3.01 3.42
1980–84 0.72 1.40 3.74 3.29
1985–89 0.46 1.17 4.22 2.31
1990–95 0.74 1.29 4.57 3.61
Mäori
1996–99 0.75 1.37 4.45 5.28
1980–84 0.25 0.43 1.62 0.01
1985–89 0.38 0.61 2.21 1.67
1990–95 0.30 0.49 1.76 2.20
Females
Pacific
1996–99 0.15 0.88 2.43 3.15
Table 29: Cause-specific standardised mortality rates, ages 1–74 years (prioritised series)
Cause Ethnic group 1980–84 1985–89 1990–95 1996–99
Category I Mäori 28.7 (25.4–32.0) 26.3 (23.4–29.3) 20.0 (17.8–22.1) 14.2 (12.3–16.1)
Pacific 36.4 (27.7–45.1) 40.0 (32.6–47.3) 20.3 (16.6–24.1) 14.9 (11.7–18.1)
Non-Mäori non-Pacific 10.3 (9.8–10.7) 9.6 (9.2–10.0) 7.3 (6.9–7.6) 4.5 (4.2–4.9)
Category II Mäori 698.0 (682–714) 670.0 (655–685) 680.7 (668–694) 641.3 (628–654)
Pacific 527.2 (494–561) 562.9 (535–591) 469.2 (451–488) 522.2 (502–542)
Non-Mäori non-Pacific 347.5 (345–350) 314.3 (312–317) 274.5 (273–276) 226.8 (225–229)
Category III Mäori 69.5 (65.6–73.4) 76.7 (72.9–80.4) 71.3 (68.2–74.4) 70.9 (67.6–74.2)
Pacific 56.2 (48.6–63.8) 50.1 (44.2–56.0) 41.7 (37.8–45.7) 39.5 (35.3–43.8)
Non-Mäori non-Pacific 46.1 (45.1–47.0) 46.9 (45.9–47.9) 42.0 (41.2–42.9) 34.7 (33.8–35.7)

74 Decades of Disparity: Ethnic Mortality Trends in New Zealand 1980–1999
Table 30: Cause-specific standardised mortality rates, ages 1–74 years, by gender (prioritised series)
Gender Cause Ethnic group 1980–84 1985–89 1990–95 1996–99
Mäori 32.2 (27.3–37.2) 29.3 (24.9–33.8) 25.4 (21.9–29) 14.3 (11.5–17.1)
Pacific 43.2 (29–57.3) 58.4 (45.4–71.3) 26.6 (20–33.1) 16.7 (11.7–21.7)
Category I
Non-Mäori non-Pacific 12.1 (11.4–12.8) 11.9 (11.3–12.6) 9.5 (9–10.1) 5.7 (5.2–6.2)
Mäori 800.2 (775.6–824.9) 776.6 (752.9–800.2) 783.2 (763–803.5) 749.6 (729–770.1)
Pacific 668.4 (611.9–725) 703.9 (657.7–750.1) 590.2 (559.5–620.8) 662.1 (628.2–696.1)
Category II
Non-Mäori non-Pacific 448.5 (444.4–452.5) 401.2 (397.5–405) 343.6 (340.5–346.7) 279.8 (276.5–283.1)
Mäori 106.3 (99.5–113.2) 115.9 (109.3–122.4) 107.5 (102.1–112.8) 109.6 (103.6–115.5)
Pacific 92.0 (78.3–105.7) 79.7 (68.6–90.8) 67.7 (60.4–75) 62.8 (55–70.5)
Males
Category III
Non-Mäori non-Pacific 66.9 (65.2–68.6) 70.1 (68.4–71.8) 63.8 (62.3–65.2) 52.5 (50.8–54.1)
Mäori 25.2 (20.9–29.6) 23.3 (19.3–27.2) 15.1 (12.6–17.7) 14.1 (11.5–16.8)
Pacific 30.4 (19.6–41.3) 23.1 (15.3–31) 15.1 (10.9–19.3) 13.2 (9–17.4)
Category I
Non-Mäori non-Pacific 8.6 (8.1–9.2) 7.6 (7.1–8.1) 5.1 (4.7–5.5) 3.5 (3.1–3.9)
Mäori 599.5 (578.7–620.4) 572.6 (553.4–591.8) 588.6 (572.1–605) 541.9 (525.3–558.5)
Pacific 401.6 (362.2–441) 435.4 (401.7–469.2) 365.6 (343.7–387.4) 404.9 (381–428.7)
Category II
Non-Mäori non-Pacific 258.1 (255.1–261.1) 237.2 (234.4–240.1) 212.5 (210.1–214.9) 177.6 (175–180.2)
Mäori 33.4 (29.7–37.1) 38.8 (35.1–42.6) 37.0 (33.8–40.2) 34.9 (31.8–38.1)
Pacific 19.3 (12.9–25.8) 22.1 (17.2–27.1) 17.5 (13.9–21) 17.9 (13.9–22)
Females
Category III
Non-Mäori non-Pacific 25.0 (24–26) 23.5 (22.5–24.5) 20.3 (19.5–21.1) 17.3 (16.4–18.3)

Decades of Disparity: Ethnic Mortality Trends in New Zealand 1980–1999 75
Table 31: Standardised mortality rates, ages 1–74 years – specific causes (prioritised series)
Causes Ethnic group 1980–84 1985–89 1990–95 1996–99
Mäori 189.7 (181–198) 192.6 (185–201) 205.2 (198–212) 215.2 (208–223)
Pacific 155.6 (138–174) 175.8 (160–191) 144.7 (135–155) 179.3 (168–191)
Cancer
Non-Mäori non-Pacific 119.4 (118–121) 117.5 (116–119) 115.6 (114–117) 104.0 (103–105)
Mäori 66.1 (61.0–71.2) 64.7 (59.9–69.5) 72.1 (67.8–76.4) 76.8 (72.2–81.4)
Pacific 28.0 (20.2–35.8) 35.9 (28.8–43.1) 34.8 (29.6–39.9) 40.3 (34.5–46.1)
Lung cancer
Non-Mäori non-Pacific 25.2 (24.6–25.9) 24.4 (23.7–25.0) 22.9 (22.4–23.5) 19.0 (18.4–19.6)
Mäori 10.0 (8.0–11.9) 11.4 (9.4–13.3) 11.8 (10.1–13.5) 14.8 (12.8–16.8)
Pacific 1.4 (0.1–2.7) 7.3 (3.9–10.7) 6.8 (4.6–9.0) 13.6 (10.4–16.9)
Colorectal cancer
Non-Mäori non-Pacific 19.4 (18.8–20.0) 18.9 (18.3–19.5) 18.6 (18.1–19.1) 16.8 (16.2–17.3)
Mäori 345.8 (334.4–357.3) 317.5 (307.0–328.0) 305.5 (296.8–314.1) 264.9 (256.5–273.4)
Pacific 255.3 (231.8–278.9) 261.1 (241.7–280.6) 215.8 (203.3–228.3) 208.9 (196.1–221.7)
Cardiovascular disease
Non-Mäori non-Pacific 171.1 (169.4–172.8) 142.3 (140.8–143.8) 111.4 (110.2–112.6) 78.5 (77.2–79.7)
Mäori 199.8 (191–209) 178.2 (170–186) 179.0 (172–186) 156.4 (150–163)
Pacific 127.4 (111–144) 135.9 (122–150) 112.2 (103–121) 105.9 (96.7–115)
Ischaemic heart disease
Non-Mäori non-Pacific 117.6 (116–119) 98.4 (97.1–99.6) 74.3 (73.3–75.3) 51.2 (50.2–52.2)
Mäori 56.8 (52.1–61.5) 50.2 (45.9–54.4) 44.4 (41.1–47.8) 32.7 (29.7–35.6)
Pacific 76.6 (63.2–90.1) 60.4 (50.8–70.0) 52.0 (45.7–58.3) 45.9 (39.7–52.1)
Stroke
Non-Mäori non-Pacific 30.2 (29.4–30.9) 23.2 (22.5–23.8) 18.8 (18.3–19.3) 13.5 (13.0–14.0)
Mäori 81.4 (75.9–86.8) 73.7 (68.6–78.7) 62.1 (58.1–66.1) 54.5 (50.5–58.4)
Pacific 68.5 (56.0–81.0) 79.1 (68.2–89.9) 34.5 (29.4–39.6) 37.6 (32.0–43.1)
Respiratory diseases
Non-Mäori non-Pacific 29.3 (28.6–30.0) 27.1 (26.5–27.8) 19.4 (18.9–19.9) 16.7 (16.2–17.3)
Mäori 59.7 (56.1–63.3) 60.4 (57.1–63.7) 53.0 (50.3–55.8) 44.7 (42.1–47.4)
Pacific 41.5 (35.0–47.9) 36.6 (31.5–41.7) 27.3 (24.1–30.5) 24.8 (21.3–28.3)
Unintentional injuries
Non-Mäori non-Pacific 33.9 (33.0–34.7) 32.9 (32.1–33.7) 26.8 (26.1–27.4) 19.9 (19.2–20.6)
Mäori 36.7 (34.0–39.4) 40.5 (37.8–43.2) 35.4 (33.2–37.5) 27.6 (25.6–29.6)
Pacific 21.9 (17.9–25.9) 17.7 (14.6–20.8) 17.1 (14.6–19.6) 14.3 (11.7–16.9)
Road traffic crash
Non-Mäori non-Pacific 19.1 (18.5–19.8) 21.1 (20.4–21.7) 17.0 (16.5–17.5) 12.1 (11.5–12.6)
Mäori 7.2 (5.9–8.4) 10.2 (9.0–11.4) 13.7 (12.5–14.9) 21.4 (19.7–23.2)
Pacific 7.7 (5.0–10.4) 9.1 (6.9–11.2) 10.6 (8.6–12.6) 10.9 (8.8–13.0)
Suicide
Non-Mäori non-Pacific 11.1 (10.6–11.5) 12.4 (11.9–12.9) 13.6 (13.2–14.1) 13.8 (13.2–14.4)
Note: ICD9 codes used: Cancer 140–208, Lung cancer 162, Colorectal cancer 153–154, Cardiovascular diseases 390–459, Ischaemic heart disease 410–414, Stroke 430–438, Respiratory diseases 460–519, Unintentional injuries 800–949, Road traffic crash 810–825, Suicide: 950–959.

76 Decades of Disparity: Ethnic Mortality Trends in New Zealand 1980–1999
Table 32: Standardised mortality rates, ages 1–74 years, by gender – specific causes (prioritised series)
Gender Cause Ethnic group 1980–84 1985–89 1990–95 1996–99
Mäori 204.7 (192–217) 208.4 (196–221) 224.9 (214–236) 229.2 (218–241)
Pacific 203.3 (172–235) 219.3 (193–245) 166.2 (150–183) 210.9 (192–230)
Cancer
Non-Mäori non-Pacific 136.6 (134–139) 132.2 (130–134) 128.8 (127–131) 113.8 (112–116)
Mäori 84.2 (76.0–92.3) 76.3 (68.6–83.9) 86.6 (79.6–93.6) 85.8 (78.7–92.9)
Pacific 54.8 (38.0–71.5) 55.5 (42.5–68.5) 58.6 (48.6–68.6) 64.0 (53.1–74.8)
Lung cancer
Non-Mäori non-Pacific 40.6 (39.4–41.9) 36.4 (35.3–37.6) 31.7 (30.7–32.6) 24.5 (23.6–25.5)
Mäori 11.5 (8.3–14.7) 13.9 (10.5–17.4) 15.5 (12.4–18.7) 16.1 (12.8–19.3)
Pacific 18.0 (7.4–28.6) 20.8 (11.7–29.8) 13.5 (8.2–18.7) 11.2 (6.5–15.9)
Prostate cancer
Non-Mäori non-Pacific 8.8 (8.2–9.3) 8.9 (8.4–9.5) 9.7 (9.2–10.2) 8.6 (8.0–9.1)
Mäori 12.9 (9.8–16.1) 13.7 (10.6–16.8) 14.2 (11.4–16.9) 18.9 (15.5–22.2)
Pacific 1.7 (0.5–3.8) 11.1 (4.9–17.2) 8.1 (4.6–11.5) 17.9 (12.3–23.5)
Colorectal cancer
Non-Mäori non-Pacific 21.4 (20.5–22.3) 21.0 (20.1–21.8) 21.7 (20.9–22.5) 19.6 (18.7–20.5)
Mäori 411.9 (394.1–429.7)
381.6 (365.0–398.2)
380.1 (66.0–394.1) 343.8 (29.9–357.8)
Pacific 322.3 (283.5–361.1)
334.0 (302.3–365.6)
286.9 (65.7–308.0) 284.4 (62.2–306.6)
Cardiovascular disease
Non-Mäori non-Pacific 240.0 (237.0–243.0)
203.3 (200.6–205.9)
158.4 (56.3–160.5) 113.2 (11.1–115.3)
Mäori 257.5 (243–272) 228.2 (215–241) 241.1 (230–252) 218.1 (207–229)
Pacific 188.7 (159–218) 199.4 (174–225) 158.5 (143–174) 166.4 (150–183)
Ischaemic heart disease
Non-Mäori non-Pacific 175.4 (173–178) 149.2 (147–151) 112.3 (111–114) 79.9 (78.1–81.6)
Mäori 51.0 (44.6–57.3) 51.8 (45.5–58.2) 42.8 (38.1–47.6) 31.3 (27.1–35.6)
Pacific 81.4 (61.4–101) 71.8 (56.5–87.1) 58.2 (48.3–68.1) 51.8 (42.0–61.7)
Stroke
Non-Mäori non-Pacific 33.8 (32.7–34.9) 26.4 (25.4–27.3) 21.6 (20.8–22.3) 15.3 (14.5–16.0)
Mäori 89.7 (81.4–97.9) 78.3 (70.6–85.9) 61.4 (55.6–67.3) 52.4 (46.7–58.1)
Pacific 93.2 (70.8–116) 110.5 (91.4–130) 46.9 (37.7–56.1) 59.1 (48.4–69.7)
Respiratory diseases
Non-Mäori non-Pacific 40.4 (39.2–41.6) 34.9 (33.8–35.9) 23.9 (23.1–24.7) 20.0 (19.1–20.8)
Mäori 91.6 (85.2–98.0) 89.1 (83.3–94.9) 78.4 (73.7–83.0) 68.6 (63.8–73.4)
Pacific 69.8 (58.1–81.6) 57.0 (47.4–66.5) 43.0 (37.2–48.9) 39.3 (33.0–45.5)
Unintentional injuries
Non-Mäori non-Pacific 49.4 (48.0–50.9) 48.8 (47.4–50.2) 39.8 (38.6–41.0) 29.6 (28.4–30.8)
Mäori 53.5 (48.8–58.2) 56.0 (51.5–60.5) 51.0 (47.3–54.6) 40.0 (36.4–43.5)
Pacific 36.8 (29.3–44.4) 25.7 (20.7–30.7) 24.6 (20.3–29.0) 21.1 (16.6–25.6)
Road traffic crashes
Non-Mäori non-Pacific 27.4 (26.4–28.5) 30.1 (29.0–31.2) 24.1 (23.2–25.0) 17.0 (16.1–18.0)
Mäori 11.0 (8.8–13.3) 17.2 (14.9–19.6) 22.5 (20.3–24.8) 33.9 (30.7–37.1)
Pacific 10.5 (6.3–14.8) 15.3 (11.3–19.3) 18.9 (15.0–22.7) 17.2 (13.4–21.1)
Males
Suicide
Non-Mäori non-Pacific 16.1 (15.3–16.9) 19.2 (18.3–20.1) 21.8 (21.0–22.7) 21.6 (20.6–22.6)
(Continued)
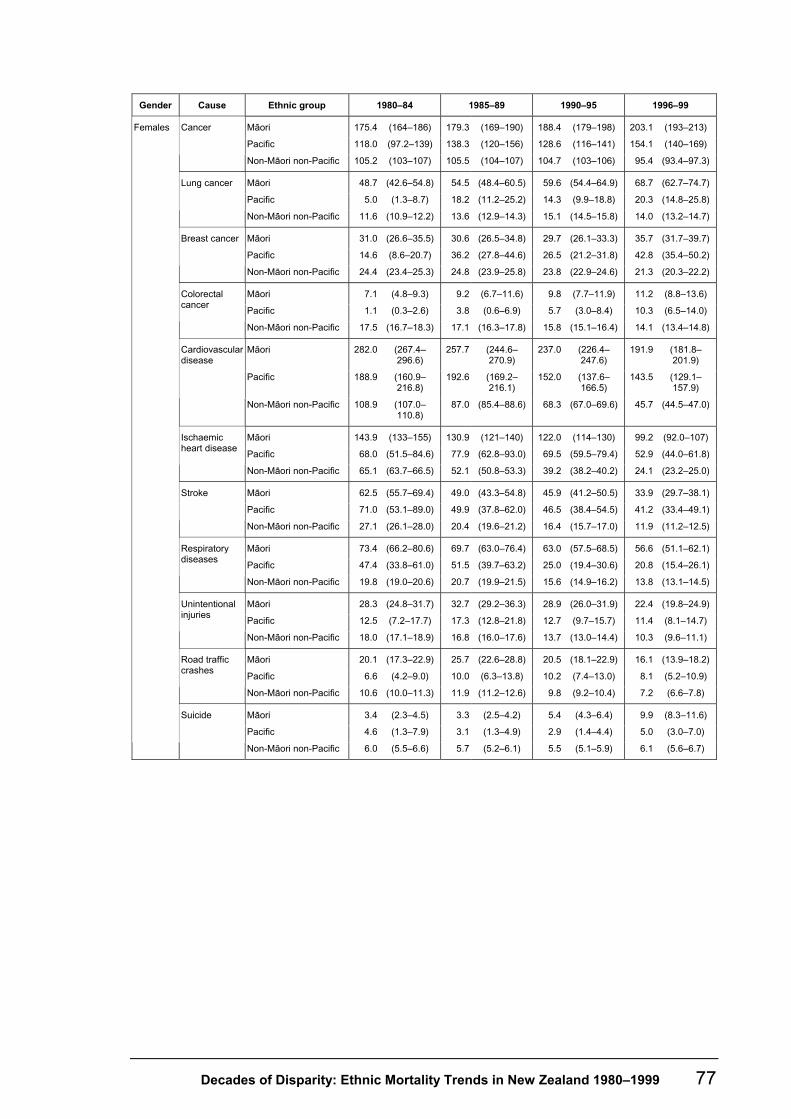
Decades of Disparity: Ethnic Mortality Trends in New Zealand 1980–1999 77
Gender Cause Ethnic group 1980–84 1985–89 1990–95 1996–99
Mäori 175.4 (164–186) 179.3 (169–190) 188.4 (179–198) 203.1 (193–213)
Pacific 118.0 (97.2–139) 138.3 (120–156) 128.6 (116–141) 154.1 (140–169)
Cancer
Non-Mäori non-Pacific 105.2 (103–107) 105.5 (104–107) 104.7 (103–106) 95.4 (93.4–97.3)
Mäori 48.7 (42.6–54.8) 54.5 (48.4–60.5) 59.6 (54.4–64.9) 68.7 (62.7–74.7)
Pacific 5.0 (1.3–8.7) 18.2 (11.2–25.2) 14.3 (9.9–18.8) 20.3 (14.8–25.8)
Lung cancer
Non-Mäori non-Pacific 11.6 (10.9–12.2) 13.6 (12.9–14.3) 15.1 (14.5–15.8) 14.0 (13.2–14.7)
Mäori 31.0 (26.6–35.5) 30.6 (26.5–34.8) 29.7 (26.1–33.3) 35.7 (31.7–39.7)
Pacific 14.6 (8.6–20.7) 36.2 (27.8–44.6) 26.5 (21.2–31.8) 42.8 (35.4–50.2)
Breast cancer
Non-Mäori non-Pacific 24.4 (23.4–25.3) 24.8 (23.9–25.8) 23.8 (22.9–24.6) 21.3 (20.3–22.2)
Mäori 7.1 (4.8–9.3) 9.2 (6.7–11.6) 9.8 (7.7–11.9) 11.2 (8.8–13.6)
Pacific 1.1 (0.3–2.6) 3.8 (0.6–6.9) 5.7 (3.0–8.4) 10.3 (6.5–14.0)
Colorectal cancer
Non-Mäori non-Pacific 17.5 (16.7–18.3) 17.1 (16.3–17.8) 15.8 (15.1–16.4) 14.1 (13.4–14.8)
Mäori 282.0 (267.4–296.6)
257.7 (244.6–270.9)
237.0 (226.4–247.6)
191.9 (181.8–201.9)
Pacific 188.9 (160.9–216.8)
192.6 (169.2–216.1)
152.0 (137.6–166.5)
143.5 (129.1–157.9)
Cardiovascular disease
Non-Mäori non-Pacific 108.9 (107.0–110.8)
87.0 (85.4–88.6) 68.3 (67.0–69.6) 45.7 (44.5–47.0)
Mäori 143.9 (133–155) 130.9 (121–140) 122.0 (114–130) 99.2 (92.0–107)
Pacific 68.0 (51.5–84.6) 77.9 (62.8–93.0) 69.5 (59.5–79.4) 52.9 (44.0–61.8)
Ischaemic heart disease
Non-Mäori non-Pacific 65.1 (63.7–66.5) 52.1 (50.8–53.3) 39.2 (38.2–40.2) 24.1 (23.2–25.0)
Mäori 62.5 (55.7–69.4) 49.0 (43.3–54.8) 45.9 (41.2–50.5) 33.9 (29.7–38.1)
Pacific 71.0 (53.1–89.0) 49.9 (37.8–62.0) 46.5 (38.4–54.5) 41.2 (33.4–49.1)
Stroke
Non-Mäori non-Pacific 27.1 (26.1–28.0) 20.4 (19.6–21.2) 16.4 (15.7–17.0) 11.9 (11.2–12.5)
Mäori 73.4 (66.2–80.6) 69.7 (63.0–76.4) 63.0 (57.5–68.5) 56.6 (51.1–62.1)
Pacific 47.4 (33.8–61.0) 51.5 (39.7–63.2) 25.0 (19.4–30.6) 20.8 (15.4–26.1)
Respiratory diseases
Non-Mäori non-Pacific 19.8 (19.0–20.6) 20.7 (19.9–21.5) 15.6 (14.9–16.2) 13.8 (13.1–14.5)
Mäori 28.3 (24.8–31.7) 32.7 (29.2–36.3) 28.9 (26.0–31.9) 22.4 (19.8–24.9)
Pacific 12.5 (7.2–17.7) 17.3 (12.8–21.8) 12.7 (9.7–15.7) 11.4 (8.1–14.7)
Unintentional injuries
Non-Mäori non-Pacific 18.0 (17.1–18.9) 16.8 (16.0–17.6) 13.7 (13.0–14.4) 10.3 (9.6–11.1)
Mäori 20.1 (17.3–22.9) 25.7 (22.6–28.8) 20.5 (18.1–22.9) 16.1 (13.9–18.2)
Pacific 6.6 (4.2–9.0) 10.0 (6.3–13.8) 10.2 (7.4–13.0) 8.1 (5.2–10.9)
Road traffic crashes
Non-Mäori non-Pacific 10.6 (10.0–11.3) 11.9 (11.2–12.6) 9.8 (9.2–10.4) 7.2 (6.6–7.8)
Mäori 3.4 (2.3–4.5) 3.3 (2.5–4.2) 5.4 (4.3–6.4) 9.9 (8.3–11.6)
Pacific 4.6 (1.3–7.9) 3.1 (1.3–4.9) 2.9 (1.4–4.4) 5.0 (3.0–7.0)
Females
Suicide
Non-Mäori non-Pacific 6.0 (5.5–6.6) 5.7 (5.2–6.1) 5.5 (5.1–5.9) 6.1 (5.6–6.7)

78 Decades of Disparity: Ethnic Mortality Trends in New Zealand 1980–1999
Table 33: Cause-specific standardised mortality rates, by age group (prioritised series)
Cause Age group Ethnic group 1980–84 1985–89 1990–95 1996–99
Mäori 4.8 (3.5–6.1) 4.8 (3.5–6.1) 4.0 (2.9–5.0) 3.0 (2.0–4.0)
Pacific 9.9 (5.9–13.8) 10.7 (7.0–14.5) 6.4 (4.1–8.6) 4.6 (2.4–6.9)
1–14 years
Non-Mäori non-Pacific
3.0 (2.5–3.5) 2.6 (2.1–3.2) 2.6 (2.1–3.1) 1.5 (1.1–1.9)
Mäori 3.8 (2.3–5.3) 2.2 (1.1–3.4) 4.1 (2.6–5.5) 2.0 (0.8–3.1)
Pacific 1.7 (0.5–4.0) 6.0 (2.4–9.6) 1.9 (0.3–3.6) 5.9 (2.4–9.4)
15–24 years
Non-Mäori non-Pacific
2.1 (1.6–2.6) 2.0 (1.6–2.5) 1.5 (1.1–1.8) 1.1 (0.6–1.5)
Mäori 6.8 (4.6–9.0) 6.6 (4.6–8.5) 7.4 (5.6–9.1) 5.2 (3.7–6.8)
Pacific 15.1 (9.4–20.8) 7.3 (3.8–10.8) 11.8 (8.3–15.4) 5.0 (2.5–7.6)
25–44 years
Non-Mäori non-Pacific
3.0 (2.5–3.5) 3.8 (3.3–4.3) 5.3 (4.7–5.8) 3.0 (2.5–3.4)
Mäori 52.1 (43.0–61.2) 53.6 (45.0–62.2) 38.7 (32.5–44.8) 21.2 (16.4–26.1)
Pacific 52.6 (32.0–73.1) 73.3 (53.9–92.7) 22.6 (14.4–30.8) 31.4 (20.9–41.9)
45–64 years
Non-Mäori non-Pacific
15.5 (14.2–16.7) 13.8 (12.7–15.0) 9.9 (9.0–10.8) 6.5 (5.6–7.3)
Mäori 255.3 (208–302) 212.5 (171–254) 146.4 (117–176) 129.9 (102–158)
Pacific 330.1 (196–464) 343.4 (235–452) 184.2 (128–241) 84.3 (46.4–122)
Category I
65–74 years
Non-Mäori non-Pacific
91.6 (86.5–96.6) 83.9 (79.2–88.6) 49.1 (46.0–52.3) 31.7 (28.7–34.7)
Mäori 17.5 (15.0–20.0) 16.2 (13.8–18.7) 12.4 (10.5–14.4) 13.9 (11.7–16.2)
Pacific 33.8 (26.6–41.0) 23.0 (17.5–28.5) 20.7 (16.4–25.0) 16.3 (11.9–20.8)
1–14 years
Non-Mäori non-Pacific
15.1 (13.9–16.3) 14.6 (13.4–15.8) 10.7 (9.8–11.7) 10.2 (9.0–11.3)
Mäori 47.5 (42.1–52.9) 29.3 (25.2–33.4) 29.0 (25.2–32.7) 27.5 (23.2–31.8)
Pacific 45.5 (33.7–57.2) 53.5 (42.9–64.2) 25.4 (19.4–31.4) 41.9 (32.5–51.2)
15–24 years
Non-Mäori non-Pacific
24.0 (22.4–25.7) 20.5 (19.0–22.1) 18.7 (17.3–20.1) 15.6 (14.0–17.2)
Mäori 199.7 (188–211) 179.4 (169–190) 171.4 (163–180) 152.9 (144–162)
Pacific 128.1 (110–146) 156.9 (140–173) 123.1 (112–135) 157.3 (143–172)
25–44 years
Non-Mäori non-Pacific
79.0 (76.6–81.5) 67.5 (65.4–69.7) 58.5 (56.7–60.2) 49.0 (47.2–50.9)
Mäori 1616.3 (1565–1667) 1604.6 (1557–1652) 1611.8 (1572–1652) 1483.4 (1442–1525)
Pacific 1181.4 (1081–1282) 1188.5 (1109–1268) 996.9 (943–1051) 1095.2 (1034–1157)
45–64 years
Non-Mäori non-Pacific
722.5 (714–731) 644.9 (637–653) 553.3 (547–560) 458.7 (452–466)
Mäori 5296.1 (5084–5508) 5006.0 (4805–5207) 5239.2 (5065–5413) 5106.3 (4932–5281)
Pacific 4149.3 (3683–4616) 4639.1 (4236–5043) 3941.8 (3686–4197) 4313.6 (4043–4584)
Category II
65–74 years
Non-Mäori non-Pacific
3031.1 (3002–3060) 2796.8 (2770–2824) 2488.8 (2466–2511) 2041.1 (2017–2065)
(Continued)

Decades of Disparity: Ethnic Mortality Trends in New Zealand 1980–1999 79
Cause Age group Ethnic group 1980–84 1985–89 1990–95 1996–99
Mäori 26.4 (23.4–29.5) 27.5 (24.3–30.7) 25.3 (22.6–28.1) 26.1 (23.0–29.3)
Pacific 26.9 (20.6–33.3) 16.4 (11.8–21.1) 19.2 (15.1–23.3) 10.3 (6.8–13.8)
1–14 years
Non-Mäori non-Pacific
17.0 (15.7–18.2) 15.3 (14.1–16.6) 11.8 (10.8–12.8) 8.6 (7.5–9.6)
Mäori 95.1 (87.5–103) 125.4 (117–134) 119.2 (112–127) 110.9 (102–120)
Pacific 72.7 (57.8–87.5) 88.2 (74.5–102) 66.3 (56.6–75.9) 62.2 (50.8–73.5)
15–24 years
Non-Mäori non-Pacific
75.8 (72.8–78.8) 82.0 (78.9–85.1) 73.8 (71.0–76.6) 55.1 (52.0–58.1)
Mäori 75.3 (68.4–82.1) 89.5 (82.6–96.4) 82.6 (77.0–88.2) 92.8 (86.4–99.2)
Pacific 52.6 (41.8–63.4) 47.9 (39.3–56.4) 42.5 (36.2–48.9) 49.0 (41.1–56.9)
25–44 years
Non-Mäori non-Pacific
46.2 (44.3–48.0) 50.3 (48.4–52.1) 48.2 (46.6–49.8) 41.8 (40.0–43.6)
Mäori 79.0 (68.2–89.9) 73.0 (63.1–83.0) 69.0 (60.9–77.0) 62.5 (54.2–70.8)
Pacific 75.6 (51.6–99.6) 51.5 (35.4–67.7) 46.0 (34.5–57.6) 46.6 (34.3–58.9)
45–64 years
Non-Mäori non-Pacific
47.9 (45.7–50.1) 46.5 (44.4–48.7) 40.9 (39.1–42.7) 35.9 (33.9–37.8)
Mäori 120.3 (88.2–152) 91.0 (64.0–118) 77.8 (56.4–99.3) 59.6 (41.0–78.2)
Pacific 88.0 (23.2–153) 92.1 (35.5–149) 47.5 (20.8–74.3) 23.2 (3.7–42.8)
Category III
65–74 years
Non-Mäori non-Pacific
79.0 (74.3–83.7) 64.5 (60.4–68.6) 50.7 (47.5–53.9) 47.7 (43.9–51.4)

80 Decades of Disparity: Ethnic Mortality Trends in New Zealand 1980–1999
Table 34: Mortality rate in 35–64 and 65–74-year-old males and females for cancers and cardiovascular diseases (prioritised series)
Gender Cause Age group
Ethnic group
1980–84 1985–89 1990–95 1996–99
Mäori 322.8 (298–348) 315.3 (293–338) 326.3 (307–346) 339.3 (318–361)
Pacific 312.2 (255–369) 285.8 (245–327) 212.3 (185–239) 277.3 (244–311)
35–64 years
Non-Mäori non-Pacific
196.6 (192–201) 183.7 (179–188) 173.1 (169–177) 154.0 (150–158)
Mäori 1474.7 (1315–1634)
1667.3 (1497–1838) 1865.9 (1713–2019)
1863.9 (1709–2019)
Pacific 1641.9 (1198–2086)
1947.4 (1560–2335) 1554.8 (1310–1799)
1866.3 (1596–2136)
Cancer
65–74 years
Non-Mäori non-Pacific
1127.4 (1101–1154)
1140.7 (1115–1167) 1156.7 (1134–1180)
1020.5 (996–1045)
Mäori 131.0 (115–147) 104.3 (91.1–117) 118.8 (107–131) 123.7 (111–137)
Pacific 84.5 (55.1–114) 89.0 (64.8–113) 78.3 (61.5–95.0) 83.6 (64.9–102)
35–64 years
Non-Mäori non-Pacific
57.1 (54.6–59.7) 50.8 (48.5–53.1) 40.9 (39.0–42.8) 30.0 (28.0–31.9)
Mäori 686.0 (577–795) 717.2 (606–829) 816.9 (715–919) 773.5 (674–873)
Pacific 458.3 (216–700) 443.0 (263–623) 568.8 (422–716) 632.1 (475–789)
Lung cancer
65–74 years
Non-Mäori non-Pacific
375.4 (360–391) 338.9 (325–353) 315.6 (304–328) 255.1 (243–268)
Mäori 13.1 (7.9–18.3) 15.7 (10.3–21.1) 15.0 (10.7–19.3) 12.3 (8.1–16.5)
Pacific – – – – – – – –
35–64 years
Non-Mäori non-Pacific
6.8 (5.9–7.6) 6.8 (6.0–7.6) 7.3 (6.5–8.1) 6.9 (5.9–7.8)
Mäori 126.3 (78.7–174.0)
154.1 (102–206) 187.7 (138–238) 215.4 (162–268)
Pacific – – 311.7 (155–468) 204.6 (113–296) 161.0 (83–239)
Prostate cancer
65–74 years
Non-Mäori non-Pacific
116.8 (108–125) 119.4 (111–128) 130.8 (123–138) 112.4 (104–121)
Mäori 19.7 (13.7–25.7) 24.1 (17.8–30.4) 17.6 (13.2–22.1) 27.0 (20.9–33.1)
Pacific – – – – – – 17.3 (9.2–25.4)
35–64 years
Non-Mäori non-Pacific
34.8 (32.8–36.8) 33.8 (31.9–35.8) 33.0 (31.3–34.7) 27.9 (26.0–29.8)
Mäori 104.3 (61.7–146.9)
89.2 (50.0–128.5)
138.5 (96.8–180.1)
167.5 (121–214)
Pacific – – – – – – 198.9 (112–285)
Colorectal cancer
65–74 years
Non-Mäori non-Pacific
163.5 (153–174) 163.0 (153–173) 181.1 (172–190) 174.9 (165–185)
Mäori 643.2 (608–677) 618.2 (586–649) 603.6 (577–629) 553.2 (526–580)
Pacific 463.6 (397–530) 494.1 (439–548) 417.0 (379–454) 399.8 (359–439)
35–64 years
Non-Mäori non-Pacific
319.3 (313–325) 261.6 (256–267) 194.3 (190–198) 140.6 (136–144)
Mäori 3243.0 (3005–3480)
2856.4 (2632–3079) 2915.4 (2723–3107)
2648.6 (2464–2833)
Pacific 2778.4 (2215–3341)
2714.4 (2256–3172) 2429.9 (2129–2730)
2484.8 (2174–2795)
Cardiovascular disease
65–74 years
Non-Mäori non-Pacific
2282.8 (2245–2320)
1986.9 (1952–2021) 1603.3 (1576–1630)
1136.4 (1110–1162)
Mäori 396.5 (369–424) 393.6 (368–419) 375.1 (354–396) 357.1 (335–379)
Pacific 268.5 (219–318) 294.9 (252–338) 236.0 (208–264) 250.1 (219–282)
35–64 years
Non-Mäori non-Pacific
247.3 (242–253) 201.8 (197–206) 144.4 (141–148) 103.9 (100–108)
Males
Ischaemic heart disease
65–74 years
Mäori 2119.4 (1928–2311)
1606.8 (1439–1774) 1946.5 (1790–2103)
1679.0 (1533–1825)

Decades of Disparity: Ethnic Mortality Trends in New Zealand 1980–1999 81
Gender Cause Age group
Ethnic group
1980–84 1985–89 1990–95 1996–99
Pacific 1679.9 (1244–2116)
1749.9 (1381–2118) 1320.9 (1103–1539)
1384.8 (1152–1617)
Non-Mäori non-Pacific
1598.9 (1567–1630)
1417.5 (1389–1446) 1115.5 (1093–1138)
784.3 (762–806)
(Continued)
Gender Cause Age group
Ethnic group
1980–84 1985–89 1990–95 1996–99
Mäori 71.2 (59.5–82.8) 64.5 (54.3–74.7) 61.5 (53.1–69.9) 44.1 (36.5–51.7)
Pacific 112.7 (79.3–146) 90.6 (67.3–114) 81.3 (64.4–98.3) 51.4 (36.8–65.9)
35–64 years
Non-Mäori non-Pacific
34.6 (32.6–36.6) 26.9 (25.2–28.6) 21.4 (20.0–22.8) 16.3 (14.9–17.8)
Mäori 437.7 (350–525) 523.9 (428–620) 357.9 (290–425) 273.5 (214–333)
Pacific 751.9 (458–1046) 719.1 (483–955) 533.8 (389–678) 612.6 (459–767)
Males Stroke
65–74 years
Non-Mäori non-Pacific
385.6 (370–401) 298.8 (286–312) 248.6 (238–259) 168.8 (159–179)
Mäori 303.1 (280–326) 316.7 (295–339) 336.4 (317–355) 344.1 (323–365)
Pacific 200.0 (159–241) 242.4 (206–279) 220.6 (195–246) 246.7 (217–277)
35–64 years
Non-Mäori non-Pacific
178.5 (174–183) 177.1 (173–182) 176.8 (173–181) 157.4 (153–162)
Mäori 1100.5 (966–1235) 1133.2 (1003–1263) 1167.9 (1056–1279)
1380.3 (1257–1503)
Pacific 772.1 (499–1045) 800.8 (575–1027) 837.5 (680–995) 1017.2 (842–1192)
Cancer
65–74 years
Non-Mäori non-Pacific
674.7 (656–693) 698.8 (680–717) 701.3 (685–718) 660.7 (642–680)
Mäori 77.6 (65.6–89.6) 87.5 (75.8–99.2) 101.9 (91.2–112.5)
102.2 (90.6–113.8)
Pacific – – 27.0 (13.9–40.0) 20.1 (12.1–28.1) 27.1 (16.9–37.2)
35–64 years
Non-Mäori non-Pacific
18.2 (16.7–19.6) 21.7 (20.2–23.3) 23.0 (21.6–24.5) 20.4 (18.8–22.0)
Mäori 391.8 (312–472) 425.9 (346–506) 431.2 (364–498) 593.5 (513–674)
Pacific – – – – 132.9 (69.7–196.2)
191.8 (116–268)
Lung cancer
65–74 years
Non-Mäori non-Pacific
94.6 (87.6–101.6)
108.8 (1026–116) 126.5 (120–133) 122.7 (114–131)
Mäori 66.5 (56.0–77.0) 68.5 (58.5–78.6) 58.0 (50.2–65.9) 77.6 (68.0–87.2)
Pacific 39.7 (22.8–56.7) 84.7 (64.0–105.4)
57.9 (45.4–70.4) 87.2 (69.8–104.6)
35–64 years
Non-Mäori non-Pacific
50.1 (47.7–52.6) 50.6 (48.1–53.0) 48.6 (46.5–50.8) 43.9 (41.6–46.3)
Mäori 123.8 (78.6–169.1)
101.6 (62.4–140.9)
155.8 (114–197) 122.7 (85.8–159.6)
Pacific – – – – – – 171.4 (99.3–243.5)
Breast cancer
65–74 years
Non-Mäori non-Pacific
112.3 (105–120) 116.5 (109–124) 111.5 (105–118) 97.4 (90.0–104.7)
Mäori 13.0 (8.1–17.9) 15.2 (10.3–20.1) 18.0 (13.6–22.4) 20.5 (15.3–25.7)
Pacific – – – – – – 18.6 (10.2–26.9)
35–64 years
Non-Mäori non-Pacific
30.4 (28.5–32.3) 28.9 (27.1–30.7) 26.4 (24.9–28.0) 22.3 (20.7–24.0)
Mäori – – 69.9 (37.5–102.2)
60.9 (35.1–86.7) 72.6 (44.6–100.7)
Pacific – – – – – – – –
Females
Colorectal cancer
65–74 years
Non-Mäori non-Pacific
121.2 (113–129) 124.5 (117–132) 115.3 (109–122) 111.4 (103–119)

82 Decades of Disparity: Ethnic Mortality Trends in New Zealand 1980–1999
Gender Cause Age group
Ethnic group
1980–84 1985–89 1990–95 1996–99
Mäori 401.0 (374–427) 378.8 (354–403) 360.6 (340–380) 266.6 (248–285)
Pacific 294.2 (240–348) 250.2 (210–289) 201.7 (176–227) 183.2 (156–209)
35–64 years
Non-Mäori non-Pacific
119.7 (116–123) 91.6 (88.5–94.8) 70.9 (68.3–73.4) 48.0 (45.6–50.4)
Mäori 2433.2 (2231–2635)
2189.3 (2008–2370) 1939.8 (1795–2084)
1743.0 (1604–1882)
Pacific 1431.6 (1058–1804)
1810.0 (1465–2154) 1417.6 (1212–1622)
1318.9 (1120–1517)
Cardiovascular disease
65–74 years
Non-Mäori non-Pacific
1182.3 (1157–1206)
973.4 (952–994) 768.5 (751–785) 505.1 (488–521)
(Continued)
Gender Cause Age group
Ethnic group
1980–84 1985–89 1990–95 1996–99
Mäori 190.4 (172–209) 174.0 (157–191) 178.1 (164–192) 133.7 (121–147)
Pacific 135.8 (98.8–173) 103.2 (78.1–128) 83.4 (66.7–100) 64.6 (48.8–80.4)
35–64 years
Non-Mäori non-Pacific
68.3 (65.6–71.1) 53.3 (50.9–55.7) 38.0 (36.1–39.8) 23.7 (22.0–25.4)
Mäori 1390.8 (1238–1543)
1267.1 (1129–1405) 1076.2 (969–1184) 947.7 (845–1050)
Pacific 360.1 (173–548) 749.4 (525–974) 728.4 (582–875) 537.8 (411–664)
Ischaemic heart disease
65–74 years
Non-Mäori non-Pacific
748.6 (729–768) 607.2 (590–624) 469.9 (457–483) 286.7 (274–299)
Mäori 91.8 (79.0–105) 71.1 (60.6–81.7) 65.6 (57.2–73.9) 48.3 (40.4–56.1)
Pacific 68.9 (43.3–94.5) 60.5 (41.1–79.9) 61.0 (46.8–75.3) 50.6 (36.7–64.5)
35–64 years
Non-Mäori non-Pacific
30.3 (28.4–32.2) 21.3 (19.8–22.9) 19.1 (17.7–20.4) 13.8 (12.4–15.1)
Mäori 524.0 (431–617) 426.1 (346–506) 399.4 (334–465) 299.0 (242–356)
Pacific 832.9 (549–1117) 511.3 (329–693) 451.3 (335–567) 423.6 (311–536)
Females
Stroke
65–74 years
Non-Mäori non-Pacific
287.6 (276–300) 225.4 (215–236) 170.6 (163–179) 121.7 (114–130)
Note: ‘–‘ indicates insufficient data.

Decades of Disparity: Ethnic Mortality Trends in New Zealand 1980–1999 83
Table 35: Mortality rate in 1–14, 15–24 and 25–44-year-old males and females for unintentional injuries and motor vehicle accidents (prioritised series)
Gender Cause Age group
Ethnic group
1980–84 1985–89 1990–95 1996–99
Mäori 30.1 (25.5–34.7) 29.9 (25.3–34.6) 29.5 (25.3–33.6) 26.1 (21.8–30.5)
Pacific 33.6 (23.8–43.4) 15.0 (8.8–21.2) 21.3 (15.3–27.4) 11.3 (6.4–16.3)
1–14 years
Non-Mäori non-Pacific
20.4 (18.5–22.3) 16.8 (15.0–18.6) 12.9 (11.4–14.3) 9.2 (7.7–10.7)
Mäori 127.1 (115–140) 128.5 (116–141) 123.3 (112–134) 90.9 (79.7–102)
Pacific 100.5 (75.6–125) 105.1 (83.4–127) 67.3 (53.2–81.4) 59.1 (43.2–74.9)
15–24 years
Non-Mäori non-Pacific
95.3 (90.7–100.0)
98.2 (93.5–103) 74.9 (71.0–78.8) 48.8 (44.8–52.9)
Mäori 96.0 (85.0–107) 116.4 (105–128) 91.7 (83.1–100) 85.7 (76.6–94.7)
Pacific 64.0 (47.3–80.6) 46.6 (34.7–58.5) 48.1 (38.3–57.9) 40.7 (30.4–51.1)
Unintentional injuries
25–44 years
Non-Mäori non-Pacific
48.9 (46.2–51.5) 51.8 (49.2–54.4) 45.3 (43.1–47.5) 33.7 (31.4–36.0)
Mäori 14.8 (11.6–18.0) 10.8 (8.0–13.6) 15.1 (12.1–18.1) 12.6 (9.5–15.6)
Pacific 25.2 (16.7–33.7) – – 8.6 (4.7–12.4) – –
1–14 years
Non-Mäori non-Pacific
8.2 (7.0–9.4) 8.1 (6.9–9.4) 6.7 (5.6–7.8) 4.5 (3.5–5.5)
Mäori 89.3 (78.8–99.7) 95.3 (84.9–106) 103.8 (93.6–114) 66.3 (56.7–75.8)
Pacific 83.2 (60.6–106) 67.2 (49.8–84.5) 40.9 (29.9–51.9) 36.6 (24.1–49.0)
15–24 years
Non-Mäori non-Pacific
70.2 (66.3–74.2) 75.3 (71.1–79.4) 56.0 (52.6–59.3) 35.9 (32.5–39.4)
Mäori 62.7 (53.8–71.6) 76.4 (67.4–85.5) 55.3 (48.7–61.9) 54.6 (47.5–61.8)
Pacific 31.2 (19.5–42.9) 30.3 (20.9–39.7) 33.9 (25.7–42.1) 26.2 (17.9–34.5)
Males
Road traffic crashes
25–44 years
Non-Mäori non-Pacific
25.8 (23.9–27.8) 31.5 (29.5–33.6) 27.4 (25.7–29.1) 19.1 (17.4–20.8)
Mäori 18.3 (14.7–21.9) 19.6 (15.8–23.5) 14.5 (11.5–17.4) 15.4 (12.0–18.8)
Pacific – – 11.3 (5.8–16.8) 11.6 (7.0–16.2) 5.7 (1.9–9.5)
1–14 years
Non-Mäori non-Pacific
11.9 (10.4–13.4) 11.5 (10.0–13.0) 8.0 (6.8–9.1) 5.7 (4.5–6.9)
Mäori 36.8 (30.1–43.4) 41.9 (34.9–48.8) 28.1 (22.9–33.3) 34.1 (27.4–40.8)
Pacific – – 26.9 (16.4–37.5) 18.9 (11.7–26.1) 13.3 (6.0–20.6)
15–24 years
Non-Mäori non-Pacific
27.4 (24.9–30.0) 25.5 (23.0–27.9) 23.5 (21.2–25.7) 16.6 (14.2–19.0)
Mäori 25.4 (19.6–31.2) 28.2 (22.8–33.6) 31.5 (26.6–36.4) 23.4 (18.9–27.9)
Pacific – – 19.2 (11.7–26.6) 10.0 (5.8–14.3) 11.7 (6.3–17.1)
Unintentional injuries
25–44 years
Non-Mäori non-Pacific
11.4 (10.1–12.7) 13.8 (12.5–15.2) 12.5 (11.3–13.6) 7.8 (6.8–8.9)
Mäori 12.1 (9.1–15.0) 11.3 (8.4–14.3) 8.4 (6.2–10.7) 9.8 (7.0–12.5)
Pacific – – – – – – – –
1–14 years
Non-Mäori non-Pacific
6.0 (4.9–7.1) 6.6 (5.4–7.7) 4.9 (4.0–5.8) 3.2 (2.3–4.1)
Mäori 31.3 (25.2–37.5) 38.4 (31.8–45.0) 23.1 (18.4–27.8) 28.5 (22.3–34.6)
Pacific – – – – 16.9 (10.1–23.7) – –
15–24 years
Non-Mäori non-Pacific
21.9 (19.6–24.1) 22.4 (20.1–24.7) 19.9 (17.8–22.0) 13.8 (11.6–16.0)
Mäori 18.2 (13.4–23.0) 24.1 (19.1–29.1) 23.5 (19.3–27.6) 17.2 (13.4–21.0)
Pacific – – – – 7.7 (3.9–11.5) 9.9 (4.9–14.9)
Females
Road traffic crashes
25–44 years
Non-Mäori non-Pacific
7.1 (6.0–8.1) 10.6 (9.4–11.7) 8.9 (7.9–9.8) 6.0 (5.1–7.0)
Note: ‘–‘ indicates insufficient data.

84 Decades of Disparity: Ethnic Mortality Trends in New Zealand 1980–1999
Table 36: Mortality rate in 15–24, 25–44 and 45–74-year-old males and females for suicide (prioritised series)
Gender Cause Age group
Ethnic group
1980–84 1985–89 1990–95 1996–99
Mäori 13.5 (9.4–17.6) 46.5 (39.1–53.8) 58.8 (51.2–66.5) 64.0 (54.5–73.4)
Pacific – – 33.1 (21.0–45.3) 40.7 (29.7–51.7) 37.0 (24.4–49.6)
15–24 years
Non-Mäori non-Pacific
19.0 (16.9–21.1) 26.9 (24.4–29.4) 36.8 (34.0–39.5) 31.3 (28.1–34.5)
Mäori 16.3 (11.8–20.9) 18.2 (13.6–22.9) 29.3 (24.6–34.0) 54.6 (47.5–61.6)
Pacific 16.7 (8.4–24.9) 19.9 (12.2–27.6) 18.5 (12.4–24.5) 25.9 (17.5–34.3)
25–44 years
Non-Mäori non-Pacific
20.9 (19.2–22.7) 23.7 (21.9–25.5) 28.0 (26.3–29.7) 32.2 (29.9–34.4)
Mäori 13.4 (7.4–19.4) 10.9 (5.9–15.9) 10.5 (6.6–14.5) 19.0 (12.9–25.0)
Pacific – – – – 21.8 (11.4–32.1) – –
Males Suicide
45–74 years
Non-Mäori non-Pacific
23.8 (21.9–25.7) 26.7 (24.7–28.7) 25.1 (23.3–26.8) 23.3 (21.4–25.3)
Mäori 4.5 (2.2–6.8) 14.0 (10.0–18.0) 15.9 (12.0–19.7) 23.0 (17.5–28.5)
Pacific – – – – – – 11.7 (4.8–18.6)
15–24 years
Non-Mäori non-Pacific
4.8 (3.7–5.9) 6.4 (5.2–7.6) 6.8 (5.6–8.0) 10.9 (8.9–12.8)
Mäori 5.3 (2.9–7.8) – – 5.1 (3.2–7.0) 13.5 (10.1–17.0)
Pacific – – – – – – 7.8 (3.4–12.2)
25–44 years
Non-Mäori non-Pacific
7.5 (6.4–8.5) 6.9 (6.0–7.9) 7.0 (6.2–7.9) 7.9 (6.8–9.0)
Mäori – – – – – – – –
Pacific – – – – – – – –
Females Suicide
45–74 years
Non-Mäori non-Pacific
11.1 (9.8–12.4) 9.0 (7.8–10.1) 8.0 (7.0–9.0) 6.5 (5.5–7.5)
Note: ‘–‘ indicates insufficient data.
Table 37: Cause-specific standardised mortality rates (sole series)
Cause Ethnic group 1980–84 1985–89 1990–95 1996–99
Mäori 31.5 (27.6–35.4) 27.9 (24.5–31.3) 21.2 (18.8–23.6) 17.1 (14.4–19.7)
Pacific 34.6 (26.0–43.3) 40.7 (32.8–48.6) 21.0 (17.1–24.9) 15.0 (11.5–18.6)
Category I
Non-Mäori non-Pacific 10.3 (9.9–10.7) 9.7 (9.3–10.1) 7.3 (7.0–7.6) 4.8 (4.5–5.1)
Mäori 762.5 (743–782) 712.9 (696–730) 720.1 (706–734) 749.7 (732–767)
Pacific 501.1 (468–534) 573.0 (543–603) 480.9 (462–500) 538.6 (516–561)
Category II
Non-Mäori non-Pacific 349.4 (347–352) 316.2 (314–318) 275.7 (274–278) 233.3 (231–235)
Mäori 76.3 (71.7–81.0) 80.1 (75.8–84.3) 76.5 (72.9–80.0) 83.2 (78.5–88.0)
Pacific 53.6 (46.1–61.1) 47.8 (41.6–54.1) 43.0 (38.8–47.2) 38.2 (33.5–43.0)
Category III
Non-Mäori non-Pacific 46.5 (45.5–47.4) 47.9 (46.9–48.9) 42.4 (41.6–43.2) 37.0 (36.1–38.0)

Decades of Disparity: Ethnic Mortality Trends in New Zealand 1980–1999 85
Table 38: Cause-specific standardised mortality rates, ages 1–74 years, by gender (sole series)
Gender Cause Ethnic group 1980–84 1985–89 1990–95 1996–99
Mäori 35.1 (29.2–41) 31.1 (26–36.2) 26.8 (22.9–30.8) 17.1 (13.2–21)
Pacific 41.2 (27.1–55.3) 58.6 (45–72.2) 27.2 (20.4–34) 17.5 (11.9–23.1)
Category I
Non-Mäori non-Pacific 12.2 (11.5–12.8) 12.0 (11.4–12.7) 9.6 (9.1–10.1) 5.9 (5.5–6.4)
Mäori 870.0 (840.8–899.3) 826.1 (799.2–853) 823.7 (801.4–846) 869.4 (841.9–897)
Pacific 636.0 (579.9–692.1) 707.9 (659.1–756.7) 601.1 (569.4–632.8) 679.2 (641.9–716.5)
Category II
Non-Mäori non-Pacific 450.8 (446.8–454.9) 403.6 (399.8–407.4) 345.4 (342.3–348.5) 287.8 (284.5–291.1)
Mäori 116.3 (108.1–124.5) 120.2 (112.7–127.7) 113.6 (107.5–119.6) 126.2 (117.9–134.6)
Pacific 87.7 (74.2–101.2) 75.4 (63.7–87) 69.5 (61.8–77.2) 61.4 (52.8–70)
Males
Category III
Non-Mäori non-Pacific 67.5 (65.9–69.2) 71.7 (70–73.4) 64.5 (63.1–66) 56.1 (54.5–57.7)
Mäori 27.9 (22.7–33.1) 24.6 (20.2–29.1) 16.1 (13.3–19) 17.0 (13.4–20.7)
Pacific 28.9 (18.1–39.6) 23.7 (15.2–32.2) 15.7 (11.3–20.1) 12.9 (8.3–17.5)
Category I
Non-Mäori non-Pacific 8.7 (8.1–9.2) 7.6 (7.1–8.2) 5.1 (4.8–5.5) 3.7 (3.3–4)
Mäori 658.4 (633.4–683.4) 610.0 (588.1–631.8) 626.8 (608.5–645.1) 640.0 (617.6–662.3)
Pacific 382.0 (343.1–420.9) 448.2 (411.6–484.8) 377.0 (354.1–399.9) 420.4 (393.9–447)
Category II
Non-Mäori non-Pacific 259.6 (256.6–262.5) 238.6 (235.8–241.4) 213.3 (210.9–215.7) 182.7 (180.2–185.3)
Mäori 36.9 (32.4–41.3) 40.8 (36.5–45.2) 40.3 (36.6–44) 42.3 (37.6–46.9)
Pacific 18.2 (11.9–24.6) 21.4 (16.1–26.7) 18.1 (14.3–21.9) 16.7 (12.3–21.1)
Females
Category III
Non-Mäori non-Pacific 25.2 (24.2–26.2) 23.9 (23–24.9) 20.4 (19.6–21.2) 18.4 (17.5–19.3)

86 Decades of Disparity: Ethnic Mortality Trends in New Zealand 1980–1999
Table 39: Standardised mortality rates, ages 1–74 years – specific causes (sole series)
Cause Ethnic group 1980–84 1985–89 1990–95 1996–99
Mäori 207.1 (197–217) 205.1 (196–214) 217.3 (210–225) 249.5 (239–260)
Pacific 148.1 (130–166) 179.0 (163–196) 148.3 (138–159) 181.1 (168–194)
Cancer
Non-Mäori non-Pacific 120.1 (119–122) 118.3 (117–120) 116.2 (115–117) 106.8 (105–108)
Mäori 72.2 (66.1–78.2) 68.8 (63.3–74.2) 76.0 (71.3–80.7) 90.0 (83.8–96.2)
Pacific 26.6 (18.9–34.4) 36.9 (29.3–44.6) 35.6 (30.2–40.9) 41.9 (35.5–48.2)
Lung cancer
Non-Mäori non-Pacific 25.4 (24.7–26.0) 24.5 (23.8–25.1) 23.0 (22.5–23.6) 19.6 (19.0–20.2)
Mäori 10.9 (8.6–13.2) 12.1 (9.9–14.4) 12.5 (10.6–14.4) 15.9 (13.3–18.5)
Pacific 1.4 (0.1–2.7) 7.5 (3.9–11.2) 7.0 (4.7–9.3) 14.1 (10.5–17.7)
Colorectal cancer
Non-Mäori non-Pacific 19.5 (18.9–20.1) 19.0 (18.4–19.6) 18.7 (18.1–19.2) 17.1 (16.5–17.6)
Mäori 377.84 (364.1–391.5) 337.83 (325.9–349.7) 323 (313.4–332.6) 310.21 (298.9–321.6)
Pacific 242.67 (219.3–265.9) 266.2 (245.3–287.0) 221.09 (208.1–234.1) 218.47 (204.2–232.7)
Cardiovascular disease
Non-Mäori non-Pacific 171.96 (170.2–173.6) 142.98 (141.4–144.5) 111.9 (110.7–113.1) 80.65 (79.4–81.8)
Mäori 218.3 (208–229) 189.6 (181–199) 189.0 (182–196) 180.6 (172–189)
Pacific 121.1 (105–137) 139.1 (124–154) 114.9 (106–124) 110.7 (101–121)
Ischaemic heart disease
Non-Mäori non-Pacific 118.2 (117–120) 98.8 (97.5–100) 74.6 (73.6–75.6) 52.6 (51.6–53.6)
Mäori 62.1 (56.5–67.6) 53.3 (48.5–58.1) 47.0 (43.3–50.7) 38.8 (34.8–42.8)
Pacific 72.9 (59.6–86.1) 61.7 (51.4–72.0) 53.2 (46.7–59.8) 46.9 (40.1–53.7)
Stroke
Non-Mäori non-Pacific 30.3 (29.6–31.0) 23.3 (22.7–23.9) 18.9 (18.4–19.4) 13.8 (13.3–14.3)
Mäori 89.0 (82.5–95.6) 78.2 (72.4–83.9) 65.5 (61.1–69.9) 64.0 (58.7–69.3)
Pacific 65.3 (52.9–77.6) 80.5 (68.8–92.1) 35.4 (30.1–40.7) 39.9 (33.7–46.2)
Respiratory diseases
Non-Mäori non-Pacific 29.4 (28.7–30.1) 27.3 (26.6–28.0) 19.4 (18.9–19.9) 17.1 (16.6–17.7)
Mäori 65.5 (61.2–69.9) 63.3 (59.4–67.1) 57.0 (53.9–60.2) 53.4 (49.6–57.2)
Pacific 39.3 (33.0–45.7) 35.0 (29.6–40.4) 28.2 (24.8–31.6) 24.6 (20.7–28.5)
Unintentional injuries
Non-Mäori non-Pacific 34.2 (33.3–35.0) 33.6 (32.8–34.4) 27.0 (26.4–27.7) 21.1 (20.4–21.8)
Mäori 40.2 (37.0–43.5) 42.3 (39.2–45.4) 37.9 (35.4–40.4) 33.3 (30.3–36.2)
Pacific 20.7 (16.7–24.6) 16.5 (13.2–19.8) 17.6 (14.9–20.3) 13.8 (11.0–16.7)
Motor vehicle accident
Non-Mäori non-Pacific 19.3 (18.7–19.9) 21.5 (20.9–22.2) 17.2 (16.6–17.7) 12.8 (12.3–13.4)
Mäori 7.9 (6.4–9.3) 10.5 (9.1–11.9) 14.5 (13.1–16.0) 24.4 (21.9–26.9)
Pacific 7.4 (4.7–10.0) 8.5 (6.3–10.8) 10.8 (8.7–13.0) 9.7 (7.4–11.9)
Suicide
Non-Mäori non-Pacific 11.2 (10.7–11.6) 12.6 (12.1–13.1) 13.7 (13.3–14.2) 14.7 (14.2–15.3)

Decades of Disparity: Ethnic Mortality Trends in New Zealand 1980–1999 87
Table 40: Standardised mortality rates, ages 1–74 years, by gender – specific causes (sole series)
Gender Cause Ethnic group 1980–84 1985–89 1990–95 1996–99
Mäori 222.9 (208–238) 221.7 (208–236) 236.4 (224–248) 262.3 (247–278)
Pacific 193.4 (162–225) 220.7 (193–248) 169.3 (152–186) 207.7 (187–228)
Cancer
Non-Mäori non-Pacific 137.3 (135–140) 133.0 (131–135) 129.5 (128–131) 116.9 (115–119)
Mäori 91.5 (81.8–101) 81.1 (72.3–89.8) 90.7 (83.0–98.3) 99.6 (90.1–109)
Pacific 52.2 (35.5–68.9) 56.2 (42.5–69.9) 59.7 (49.4–70.0) 66.0 (54.1–77.9)
Lung cancer
Non-Mäori non-Pacific 40.8 (39.6–42.1) 36.6 (35.5–37.7) 31.8 (30.9–32.8) 25.2 (24.3–26.2)
Mäori 12.6 (8.8–16.4) 14.8 (10.9–18.7) 16.2 (12.8–19.7) 18.1 (13.8–22.4)
Pacific 17.2 (6.6–27.8) 20.8 (11.2–30.4) 13.7 (8.2–19.1) 11.5 (6.3–16.7)
Prostate cancer
Non-Mäori non-Pacific 8.8 (8.3–9.4) 8.9 (8.4–9.5) 9.8 (9.2–10.3) 8.7 (8.2–9.3)
Mäori 14.1 (10.3–17.8) 14.6 (11.1–18.2) 14.9 (11.8–18.0) 19.7 (15.5–24.0)
Pacific 1.6 (0.5–3.7) 11.3 (4.7–17.9) 8.2 (4.6–11.7) 18.6 (12.3–24.8)
Colorectal cancer
Non-Mäori non-Pacific 21.6 (20.7–22.5) 21.1 (20.2–22.0) 21.8 (21.0–22.6) 20.0 (19.1–20.9)
Mäori 447.5 (426.3–468.6)
406.1 (387.3–425.0)
400.0 (384.5–415.5)
398.0 (379.4–416.6)
Pacific 306.3 (268.0–344.7)
336.5 (303.0–370.0)
292.1 (270.2–313.9)
298.0 (273.4–322.6)
Cardiovascular disease
Non-Mäori non-Pacific 241.3 (238.3–244.2)
204.3 (201.6–207.0)
159.2 (157.1–161.3)
116.4 (114.3–118.5)
Mäori 279.7 (263–296) 243.0 (228–258) 253.6 (241–266) 249.0 (234–264)
Pacific 179.3 (150–209) 201.9 (175–229) 161.3 (145–177) 174.0 (155–193)
Ischaemic heart disease
Non-Mäori non-Pacific 176.3 (174–179) 149.9 (148–152) 112.9 (111–115) 82.1 (80.4–83.9)
Mäori 55.5 (48.0–63.1) 55.1 (47.9–62.3) 45.1 (39.8–50.3) 36.0 (30.4–41.7)
Pacific 77.4 (57.6–97.1) 72.4 (56.2–88.6) 59.3 (49.0–69.5) 53.5 (42.6–64.4)
Stroke
Non-Mäori non-Pacific 33.9 (32.8–35.0) 26.5 (25.5–27.4) 21.7 (20.9–22.4) 15.6 (14.9–16.4)
Mäori 97.6 (87.8–107) 83.1 (74.4–91.7) 64.5 (58.0–70.9) 62.0 (54.3–69.8)
Pacific 89.4 (67.0–112) 111.1 (90.9–131) 47.8 (38.2–57.3) 62.9 (51.0–74.9)
Respiratory diseases
Non-Mäori non-Pacific 40.6 (39.4–41.8) 35.0 (34.0–36.1) 24.0 (23.2–24.8) 20.4 (19.5–21.2)
Mäori 100.3 (92.6–108) 92.7 (86.1–99.3) 83.1 (77.8–88.4) 80.0 (73.3–86.7)
Pacific 66.4 (54.8–78.0) 54.0 (44.0–64.1) 44.2 (38.1–50.3) 38.7 (31.7–45.7)
Unintentional injuries
Non-Mäori non-Pacific 49.9 (48.5–51.3) 49.9 (48.5–51.3) 40.3 (39.2–41.4) 31.6 (30.4–32.8)
Mäori 58.5 (52.9–64.0) 58.0 (52.8–63.2) 53.7 (49.5–57.9) 46.7 (41.7–51.7)
Pacific 35.0 (27.5–42.4) 23.6 (18.4–28.7) 25.2 (20.7–29.8) 19.7 (14.9–24.6)
Motor vehicle accident
Non-Mäori non-Pacific 27.7 (26.7–28.8) 30.8 (29.7–31.9) 24.5 (23.6–25.4) 18.2 (17.3–19.1)
Mäori 12.0 (9.4–14.7) 17.7 (15.0–20.4) 23.5 (21.0–26.1) 37.7 (33.2–42.1)
Pacific 10.2 (6.0–14.4) 14.2 (10.1–18.3) 19.3 (15.3–23.3) 16.2 (12.0–20.4)
Males
Suicide
Non-Mäori non-Pacific 16.3 (15.5–17.1) 19.5 (18.7–20.4) 22.1 (21.2–22.9) 23.1 (22.1–24.2)
(Continued)

88 Decades of Disparity: Ethnic Mortality Trends in New Zealand 1980–1999
Gender Cause Ethnic group 1980–84 1985–89 1990–95 1996–99
Mäori 192.1 (179–205) 191.4 (179–203) 201.5 (191–212) 239.2 (226–253)
Pacific 112.6 (92.0–133) 141.8 (122–161) 132.7 (119–146) 160.2 (144–176)
Cancer
Non-Mäori non-Pacific 105.8 (104–108) 106.2 (104–108) 105.2 (103–107) 97.8 (95.9–99.8)
Mäori 53.4 (46.2–60.7) 58.0 (51.2–64.9) 63.4 (57.6–69.3) 81.6 (73.5–89.7)
Pacific 4.8 (1.1–8.5) 18.9 (11.2–26.5) 14.8 (10.1–19.4) 21.3 (15.2–27.5)
Lung cancer
Non-Mäori non-Pacific 11.6 (11.0–12.3) 13.7 (13.0–14.3) 15.2 (14.5–15.8) 14.4 (13.7–15.1)
Mäori 33.8 (28.5–39.1) 32.9 (28.1–37.7) 31.9 (27.9–35.9) 43.0 (37.5–48.4)
Pacific 14.2 (8.2–20.2) 37.1 (28.1–46.1) 27.5 (21.9–33.0) 43.9 (35.7–52.1)
Breast cancer
Non-Mäori non-Pacific 24.5 (23.6–25.5) 25.0 (24.0–25.9) 23.9 (23.1–24.7) 21.8 (20.9–22.7)
Mäori 7.7 (5.1–10.3) 9.8 (7.0–12.6) 10.5 (8.1–12.8) 12.6 (9.4–15.7)
Pacific 1.1 (0.3–2.6) 4.0 (0.5–7.4) 5.9 (3.0–8.7) 10.6 (6.4–14.9)
Colorectal cancer
Non-Mäori non-Pacific 17.6 (16.8–18.4) 17.2 (16.4–17.9) 15.8 (15.2–16.5) 14.4 (13.6–15.1)
Mäori 310.1 (292.5–327.7)
274.2 (259.2–289.1)
251.7 (240.0–263.5)
228.3 (214.8–241.8)
Pacific 179.5 (151.8–207.1)
198.8 (173.3–224.3)
156.7 (141.6–171.9)
149.5 (133.4–165.5)
Cardiovascular disease
Non-Mäori non-Pacific 109.5 (107.6–111.3)
87.4 (85.8–89.0) 68.5 (67.2–69.8) 47.0 (45.7–48.3)
Mäori 158.3 (145–171) 138.9 (128–150) 129.3 (121–138) 116.9 (107–127)
Pacific 64.6 (48.2–81.0) 80.5 (64.1–96.9) 71.5 (61.1–82.0) 55.0 (45.1–64.9)
Ischaemic heart disease
Non-Mäori non-Pacific 65.4 (64.0–66.8) 52.3 (51.0–53.5) 39.3 (38.4–40.3) 24.7 (23.8–25.6)
Mäori 68.6 (60.4–76.8) 52.1 (45.6–58.7) 48.8 (43.6–54.0) 41.4 (35.7–47.2)
Pacific 67.5 (49.8–85.3) 51.6 (38.5–64.7) 47.9 (39.4–56.4) 41.9 (33.2–50.5)
Stroke
Non-Mäori non-Pacific 27.2 (26.3–28.1) 20.5 (19.7–21.3) 16.4 (15.8–17.1) 12.1 (11.5–12.8)
Mäori 80.8 (72.2–89.4) 74.0 (66.4–81.7) 66.9 (60.8–72.9) 66.4 (59.1–73.8)
Pacific 45.0 (31.5–58.4) 53.0 (40.1–65.8) 25.8 (19.9–31.7) 21.8 (15.8–27.9)
Respiratory diseases
Non-Mäori non-Pacific 19.9 (19.1–20.7) 20.8 (20.0–21.6) 15.6 (15.0–16.3) 14.2 (13.5–14.9)
Mäori 31.2 (27.1–35.4) 34.5 (30.4–38.6) 31.6 (28.2–34.9) 27.9 (24.0–31.7)
Pacific 11.7 (6.5–16.8) 16.7 (11.9–21.5) 13.2 (9.9–16.4) 11.5 (7.8–15.2)
Unintentional injuries
Non-Mäori non-Pacific 18.1 (17.3–19.0) 17.1 (16.3–17.9) 13.8 (13.1–14.5) 10.9 (10.2–11.6)
Mäori 22.2 (18.8–25.5) 27.1 (23.5–30.7) 22.3 (19.5–25.1) 20.3 (17.1–23.6)
Pacific 6.0 (3.7–8.4) 9.7 (5.7–13.7) 10.6 (7.6–13.5) 8.5 (5.3–11.7)
Motor vehicle accident
Non-Mäori non-Pacific 10.7 (10.1–11.4) 12.1 (11.4–12.8) 9.9 (9.3–10.5) 7.5 (7.0–8.1)
Mäori 3.8 (2.5–5.1) 3.4 (2.4–4.4) 5.8 (4.6–7.1) 11.8 (9.4–14.2)
Pacific 4.3 (1.1–7.6) 3.0 (1.1–4.9) 3.0 (1.4–4.6) 3.6 (1.6–5.5)
Females
Suicide
Non-Mäori non-Pacific 6.1 (5.6–6.6) 5.7 (5.3–6.2) 5.5 (5.1–5.9) 6.6 (6.0–7.1)

Decades of Disparity: Ethnic Mortality Trends in New Zealand 1980–1999 89
Table 41: Cause-specific mortality rates, by age group (sole series)
Cause Age group Ethnic group 1980–84 1985–89 1990–95 1996–99
Mäori 5.6 (3.8–7.3) 5.0 (3.3–6.7) 4.6 (3.2–5.9) 3.9 (2.2–5.6)
Pacific 8.7 (5.0–12.5) 11.4 (6.9–15.8) 6.8 (4.2–9.5) 4.3 (1.7–7.0)
1–14 years
Non-Mäori non-Pacific
3.0 (2.5–3.5) 2.7 (2.2–3.2) 2.6 (2.2–3.1) 1.7 (1.3–2.1)
Mäori 4.1 (2.3–5.9) 2.2 (0.9–3.5) 4.2 (2.5–5.8) 2.4 (0.6–4.3)
Pacific 1.6 (0.6–3.9) 5.1 (1.5–8.7) 1.9 (0.2–3.6) 7.0 (2.5–11.4)
15–24 years
Non-Mäori non-Pacific
2.1 (1.7–2.6) 2.1 (1.6–2.6) 1.5 (1.1–1.9) 1.1 (0.7–1.5)
Mäori 311.9 (295–328) 297.0 (282–312) 289.9 (278–302) 287.7 (273–303)
Pacific 196.0 (174–218) 206.8 (187–226) 186.8 (172–201) 202.9 (185–221)
25–44 years
Non-Mäori non-Pacific
130.4 (127–134) 124.9 (122–128) 113.8 (111–116) 103.2 (101–106)
Mäori 56.7 (46.0–67.4) 57.6 (47.8–67.4) 41.2 (34.3–48.0) 25.3 (18.8–31.8)
Pacific 49.8 (29.5–70.0) 75.9 (55.2–96.7) 23.1 (14.6–31.7) 32.4 (20.9–43.8)
45–64 years
Non-Mäori non-Pacific
15.6 (14.4–16.8) 13.9 (12.8–15.0) 10.0 (9.1–10.8) 6.7 (5.9–7.5)
Mäori 280.1 (223–337) 222.7 (176–270) 152.1 (120–184) 158.5 (120–197)
Pacific 315.1 (182–448) 347.6 (231–464) 188.9 (130–248) 87.8 (45.4–130)
Category I
65–74 years
Non-Mäori non-Pacific
91.8 (86.8–96.8) 84.1 (79.4–88.8) 49.3 (46.1–52.4) 32.1 (29.2–35.1)
Mäori 20.2 (16.9–23.4) 16.9 (13.8–20.1) 14.2 (11.6–16.7) 18.2 (14.2–22.1)
Pacific 29.8 (23.0–36.6) 24.6 (18.1–31.1) 22.2 (17.3–27.1) 15.1 (10.0–20.3)
1–14 years
Non-Mäori non-Pacific
15.2 (14.1–16.3) 15.2 (14.0–16.4) 10.8 (9.9–11.7) 10.7 (9.7–11.8)
Mäori 51.2 (44.7–57.7) 29.1 (24.4–33.9) 29.9 (25.5–34.3) 32.7 (26.0–39.4)
Pacific 43.6 (31.9–55.3) 45.7 (34.8–56.5) 25.8 (19.2–32.4) 40.0 (29.3–50.7)
15–24 years
Non-Mäori non-Pacific
24.3 (22.7–25.9) 21.2 (19.6–22.7) 19.0 (17.7–20.4) 17.0 (15.4–18.5)
Mäori 218.7 (205–233) 193.3 (181–206) 190.2 (180–200) 175.3 (163–187)
Pacific 126.5 (109–144) 153.6 (137–171) 127.9 (116–140) 152.0 (136–168)
25–44 years
Non-Mäori non-Pacific
79.9 (77.5–82.4) 68.6 (66.5–70.7) 58.7 (57.0–60.4) 53.5 (51.6–55.4)
Mäori 1762.0 (1702–1822) 1727.6 (1674–1781) 1714.8 (1671–1759) 1749.1 (1694–1804)
Pacific 1116.5 (1017–1216) 1232.2 (1147–1318) 1020.1 (964–1076) 1131.2 (1064–1199)
45–64 years
Non-Mäori non-Pacific
728.2 (720–737) 648.8 (641–657) 556.8 (550–563) 474.0 (467–481)
Mäori 5793.5 (5538–6049) 5244.9 (5017–5473) 5452.6 (5261–5644) 5921.3 (5688–6155)
Pacific 3952.5 (3491–4414) 4695.4 (4262–5128) 4032.8 (3767–4299) 4519.2 (4218–4821)
Category II
65–74 years
Non-Mäori non-Pacific
3038.9 (3010–3068) 2804.8 (2778–2832) 2496.3 (2474–2519) 2069.4 (2045–2093)
(Continued)

90 Decades of Disparity: Ethnic Mortality Trends in New Zealand 1980–1999
Cause Age group Ethnic group 1980–84 1985–89 1990–95 1996–99
Mäori 30.5 (26.5–34.5) 28.7 (24.6–32.7) 28.9 (25.3–32.5) 38.4 (32.7–44.1)
Pacific 23.7 (17.6–29.7) 17.5 (12.0–23.0) 20.6 (15.9–25.3) 9.3 (5.3–13.3)
1–14 years
Non-Mäori non-Pacific
17.0 (15.8–18.3) 15.9 (14.7–17.1) 11.9 (11.0–12.9) 9.4 (8.4–10.4)
Mäori 102.5 (93.3–112) 124.8 (115–135) 122.9 (114–132) 131.1 (118–145)
Pacific 69.6 (54.8–84.3) 74.6 (60.7–88.4) 67.0 (56.4–77.5) 57.9 (45.0–70.8)
15–24 years
Non-Mäori non-Pacific
76.6 (73.7–79.5) 84.6 (81.5–87.6) 75.0 (72.3–77.7) 59.5 (56.6–62.4)
Mäori 83.4 (75.1–91.6) 95.5 (87.5–103) 90.5 (84.0–97.0) 104.5 (95.5–113)
Pacific 51.8 (40.9–62.7) 46.0 (37.2–54.8) 44.3 (37.5–51.0) 45.6 (37.1–54.0)
25–44 years
Non-Mäori non-Pacific
46.7 (44.8–48.5) 51.2 (49.4–53.0) 48.4 (46.8–50.0) 45.2 (43.4–47.0)
Mäori 85.6 (72.9–98.2) 78.6 (67.3–89.9) 73.8 (64.8–82.8) 72.2 (61.2–83.2)
Pacific 71.7 (48.0–95.4) 53.3 (36.0–70.5) 47.1 (35.2–59.1) 49.7 (36.1–63.4)
45–64 years
Non-Mäori non-Pacific
48.2 (46.0–50.4) 46.9 (44.7–49.0) 41.1 (39.3–43.0) 37.0 (35.1–38.9)
Mäori 131.9 (93.1–171) 95.3 (64.8–126) 80.9 (57.3–104) 61.6 (37.8–85.4)
Pacific 83.3 (19.5–147) 93.2 (32.5–154) 48.4 (20.7–76.1) 25.6 (3.3–47.8)
Category III
65–74 years
Non-Mäori non-Pacific
79.2 (74.5–83.9) 64.7 (60.6–68.8) 50.9 (47.6–54.1) 48.4 (44.7–52.1)

Decades of Disparity: Ethnic Mortality Trends in New Zealand 1980–1999 91
Table 42: Mortality rate in 35–64 and 65–74-year-old males and females for cancers and cardiovascular diseases (sole series)
Gender Cause Age group
Ethnic group
1980–84 1985–89 1990–95 1996–99
Mäori 351.3 (322–381) 338.5 (313–364) 344.8 (323–366) 384.5 (357–412)
Pacific 295.2 (239–351) 294.1 (250–338) 217.2 (189–245) 275.6 (240–312)
35–64 years
Non-Mäori non-Pacific
198.3 (194–203) 185.0 (181–189) 174.3 (170–178) 159.7 (155–164)
Mäori 1600.5 (1410–1791)
1757.9 (1563–1953) 1947.8 (1779–2117)
2139.7 (1930–2349)
Pacific 1573.7 (1130–2018)
1928.7 (1521–2336) 1575.6 (1323–1829)
1843.0 (1552–2134)
Cancer
65–74 years
Non-Mäori non-Pacific
1129.8 (1103–1156)
1143.8 (1118–1170) 1160.3 (1137–1183)
1034.8 (1010–1060)
Mäori 142.6 (124–161) 111.9 (96.9–127) 125.0 (112–138) 141.9 (125–159)
Pacific 79.7 (50.9–109) 92.3 (66.4–118) 80.1 (62.8–97.5) 85.7 (65.3–106)
35–64 years
Non-Mäori non-Pacific
57.6 (55.1–60.1) 51.1 (48.8–53.5) 41.2 (39.3–43.1) 31.3 (29.4–33.3)
Mäori 744.3 (615–874) 756.0 (629–883) 852.2 (740–965) 909.8 (774–1046)
Pacific 442.2 (199–685) 433.9 (248–620) 576.2 (424–728) 655.7 (481–830)
Lung cancer
65–74 years
Non-Mäori non-Pacific
376.2 (361–391) 339.8 (326–354) 316.6 (305–329) 259.2 (247–272)
Mäori 14.4 (8.2–20.6) 16.9 (10.8–23.0) 15.8 (11.0–20.5) 13.7 (8.4–19.1)
Pacific – – – – – – – –
35–64 years
Non-Mäori non-Pacific
6.8 (6.0–7.7) 6.8 (6.0–7.7) 7.3 (6.5–8.1) 7.0 (6.1–8.0)
Mäori 137.5 (80.3–194.7)
162.5 (103–222) 195.5 (140–250) 242.7 (172–314)
Pacific – – 309.8 (144–475) 207.9 (113–303) 164.1 (77.9–250.3)
Prostate cancer
65–74 years
Non-Mäori non-Pacific
117.0 (109–125) 119.7 (111–128) 131.2 (123–139) 114.1 (106–122)
Mäori 21.4 (14.4–28.4) 25.9 (18.7–33.1) 18.7 (13.8–23.6) 28.8 (21.1–36.4)
Pacific – – – – – – 16.5 (8.1–24.9)
35–64 years
Non-Mäori non-Pacific
35.1 (33.1–37.1) 34.1 (32.1–36.0) 33.2 (31.5–35.0) 28.7 (26.8–30.5)
Mäori 113.3 (62.3–164.2)
94.1 (49.3–138.8)
144.6 (98.7–190.5)
171.2 (112–231)
Pacific – – – – – – 220.0 (121–319)
Colorectal cancer
65–74 years
Non-Mäori non-Pacific
163.9 (154–174) 163.4 (154–173) 181.7 (173–191) 177.0 (167–187)
Mäori 698.3 (658–739) 663.0 (627–699) 639.1 (610–668) 639.6 (604–675)
Pacific 439.1 (374–504) 508.6 (450.567) 426.9 (388–466) 410.8 (367–454)
35–64 years
Non-Mäori non-Pacific
322.0 (316–328) 263.5 (258–269) 195.7 (191–200) 146.9 (143–151)
Mäori 3520.9 (3237–3804)
3011.6 (2757–3266) 3042.9 (2831–3254)
3067.5 (2818–3317)
Pacific 2647.9 (2088–3207)
2687.7 (2207–3169) 2458.9 (2148–2769)
2660.1 (2311–3010)
Cardiovascular disease
65–74 years
Non-Mäori non-Pacific
2287.5 (2250–2325)
1992.1 (1958–2026) 1608.2 (1581–1635)
1151.9 (1126–1178)
Mäori 430.5 (399–462) 421.9 (393–451) 396.8 (374–420) 410.9 (382–439)
Pacific 254.5 (205–304) 304.4 (258–350) 241.6 (213–271) 254.7 (221–289)
35–64 years
Non-Mäori non-Pacific
249.4 (244–255) 203.2 (199–208) 145.4 (142–149) 108.4 (105–112)
Males
Ischaemic heart disease
65–74 years
Mäori 2300.7 (2072–2530)
1694.2 (1503–1886) 2031.5 (1859–2204)
1896.0 (1700–2092)

92 Decades of Disparity: Ethnic Mortality Trends in New Zealand 1980–1999
Gender Cause Age group
Ethnic group
1980–84 1985–89 1990–95 1996–99
Pacific 1599.5 (1167–2032)
1735.0 (1347–2123) 1334.7 (1110–1559)
1489.5 (1227–1752)
Non-Mäori non-Pacific
1602.2 (1571–1634)
1421.3 (1392–1450) 1118.9 (1096–1141)
796.0 (774–818)
(Continued)
Gender Cause Age group
Ethnic group
1980–84 1985–89 1990–95 1996–99
Mäori 77.6 (63.9–91.3) 69.2 (57.7–80.8) 65.1 (55.8–74.4) 51.6 (41.5–61.6)
Pacific 106.7 (73.9–140) 93.4 (68.5–118) 83.2 (65.7–101) 51.6 (35.9–67.3)
35–64 years
Non-Mäori non-Pacific
34.9 (32.9–36.9) 27.1 (25.4–28.8) 21.6 (20.2–23.0) 17.0 (15.5–18.4)
Mäori 475.5 (371–580) 552.4 (443–662) 373.4 (299–448) 306.6 (227–386)
Pacific 717.2 (425–1010) 712.6 (464–961) 541.2 (392–691) 647.8 (476–820)
Males Stroke
65–74 years
Non-Mäori non-Pacific
386.4 (371–402) 299.5 (286–313) 249.3 (239–260) 171.0 (161–181)
Mäori 330.8 (304–358) 342.7 (318–368) 364.7 (343–386) 411.1 (383–439)
Pacific 192.1 (151–233) 250.1 (211–290) 227.3 (200–254) 257.5 (224–291)
35–64 years
Non-Mäori non-Pacific
180.0 (175–185) 178.3 (174–183) 177.6 (174–182) 162.1 (158–167)
Mäori 1209.5 (1047–1372)
1182.3 (1035–1329) 1214.3 (1092–1337)
1590.2 (1427–1753)
Pacific 732.1 (463–1001) 828.2 (580–1076) 865.4 (700–1031) 1090.7 (893–1289)
Cancer
65–74 years
Non-Mäori non-Pacific
676.8 (658–695) 701.0 (683–719) 703.4 (687–720) 668.0 (649–687)
Mäori 85.0 (70.8–99.1) 94.7 (81.3–108.2)
109.9 (97.9–121.9)
123.2 (107–139)
Pacific – – 27.9 (13.9–41.9) 20.6 (12.3–28.9) 28.1 (16.8–39.3)
35–64 years
Non-Mäori non-Pacific
18.3 (16.9–19.7) 21.8 (20.3–23.4) 23.1 (21.7–24.6) 21.2 (19.6–22.8)
Mäori 430.7 (334–528) 444.4 (355–534) 448.9 (375–523) 693.0 (585–801)
Pacific – – – – 137.5 (71–204) 204.7 (118–291)
Lung cancer
65–74 years
Non-Mäori non-Pacific
94.9 (87.9–101.8)
109.2 (102–116) 126.9 (120–134) 125.2 (117–133)
Mäori 72.2 (59.9–84.5) 74.1 (62.5–85.6) 63.2 (54.3–72.0) 95.1 (81.8–108.3)
Pacific 38.6 (21.6–55.5) 87.0 (64.9–109.1)
60.0 (46.9–73.1) 91.7 (72.4–111.1)
35–64 years
Non-Mäori non-Pacific
50.5 (48.1–53.0) 50.9 (48.5–53.3) 48.9 (46.7–51.0) 45.1 (42.8–47.4)
Mäori 136.6 (81.6–191.5)
106.0 (61.7–150.2)
161.5 (116–207) 136.8 (88.6–185.1)
Pacific – – – – – – 170.3 (91.1–249.5)
Breast cancer
65–74 years
Non-Mäori non-Pacific
112.7 (105–120) 116.9 (109–124) 111.8 (105–118) 98.6 (91.3–106.0)
Mäori 14.1 (8.4–19.8) 16.4 (10.9–22.0) 19.5 (14.6–24.5) 21.6 (15.1–28.2)
Pacific – – – – – – 19.9 (10.6–29.3)
35–64 years
Non-Mäori non-Pacific
30.6 (28.7–32.5) 29.1 (27.3–30.9) 26.6 (25.0–28.1) 22.9 (21.3–24.6)
Mäori – – 72.9 (36.4–109.4)
63.2 (35.0–91.4) 90.4 (51.8–129.1)
Pacific – – – – – – – –
Females
Colorectal cancer
65–74 years
Non-Mäori non-Pacific
121.6 (114–129) 124.9 (117–133) 115.6 (109–122) 111.6 (104–119)

Decades of Disparity: Ethnic Mortality Trends in New Zealand 1980–1999 93
Gender Cause Age group
Ethnic group
1980–84 1985–89 1990–95 1996–99
Mäori 437.9 (406–469) 410.0 (382–438) 389.8 (367–412) 321.9 (297–347)
Pacific 280.4 (227–334) 260.3 (218–303) 207.2 (180–234) 193.1 (164–222)
35–64 years
Non-Mäori non-Pacific
120.6 (117–124) 92.2 (89.0–95.3) 71.2 (68.7–73.7) 50.0 (47.5–52.4)
Mäori 2694.2 (2447–2941)
2284.1 (2080-2488) 2015.3 (1857–2173)
2048.9 (1863–2235)
Pacific 1357.3 (990–1725) 1868.1 (1491–2245) 1464.9 (1249–1681)
1375.1 (1154–1596)
Cardiovascular disease
65–74 years
Non-Mäori non-Pacific
1185.7 (1161–1210)
976.3 (955–998) 770.8 (754–788) 512.3 (496–529)
(Continued)
Gender Cause Age group
Ethnic group
1980–84 1985–89 1990–95 1996–99
Mäori 208.1 (186–230) 188.3 (169–207) 192.0 (176–208) 160.4 (143–178)
Pacific 129.1 (92.4–166) 107.3 (80.4–134) 85.5 (68.1–103) 66.5 (49.2–83.8)
35–64 years
Non-Mäori non-Pacific
68.8 (66.1–71.6) 53.6 (51.2–56.0) 38.2 (36.3–40.0) 24.7 (23.0–26.4)
Mäori 1539.4 (1353–1726)
1321.7 (1166–1477) 1117.9 (1000–1236)
1097.1 (961–1233)
Pacific 341.4 (157–526) 772.0 (527–1017) 752.7 (598–907) 562.5 (421–704)
Ischaemic heart disease
65–74 years
Non-Mäori non-Pacific
750.8 (731–770) 609.0 (592–626) 471.3 (458–485) 290.9 (279–303)
Mäori 100.1 (85.1–115) 77.0 (64.9–89.1) 71.2 (61.7–80.7) 59.6 (48.8–70.4)
Pacific 65.9 (40.5–91.4) 63.0 (42.1–83.9) 62.8 (47.9–77.6) 53.6 (38.0–69.1)
35–64 years
Non-Mäori non-Pacific
30.5 (28.7–32.4) 21.5 (19.9–23.0) 19.1 (17.8–20.5) 14.1 (12.8–15.4)
Mäori 578.9 (465–693) 444.7 (355–535) 414.8 (343–487) 360.4 (283–438)
Pacific 789.7 (510–1070) 528.3 (329–727) 466.5 (344–589) 415.6 (293–538)
Females
Stroke
65–74 years
Non-Mäori non-Pacific
288.4 (276–300) 226.1 (216–236) 171.1 (163–179) 123.3 (115–131)
Note: ‘–‘ indicates insufficient data.

94 Decades of Disparity: Ethnic Mortality Trends in New Zealand 1980–1999
Table 43: Mortality rate in 1–14, 15–24 and 25–44-year-old males and females for unintentional injuries and motor vehicle accidents (sole series)
Gender Cause Age group
Ethnic group
1980–84 1985–89 1990–95 1996–99
Mäori 34.8 (28.8–40.8) 31.1 (25.2–37.1) 33.5 (28.1–38.9) 36.8 (29.1–44.4)
Pacific 29.3 (20.1–38.6) 16.0 (8.7–23.4) 22.8 (16.0–29.7) 9.3 (3.9–14.7)
1–14 years
Non-Mäori non-Pacific
20.5 (18.6–22.4) 17.5 (15.7–19.2) 13.0 (11.6–14.4) 10.4 (8.9–11.8)
Mäori 136.6 (121–152) 126.3 (113–140) 124.5 (112–137) 105.7 (88.6–123)
Pacific 96.4 (71.6–121) 88.8 (66.9–111) 67.7 (52.5–83.0) 59.0 (40.4–77.7)
15–24 years
Non-Mäori non-Pacific
96.5 (92.0–101) 101.6 (97.0–106) 76.5 (72.7–80.4) 52.5 (48.6–56.4)
Mäori 106.4 (93.1–120) 123.3 (110–136) 99.2 (89.3–109) 96.9 (84.4–109)
Pacific 63.1 (46.3–79.8) 44.6 (32.4–56.8) 49.9 (39.6–60.3) 37.7 (26.6–48.7)
Unintentional injuries
25–44 years
Non-Mäori non-Pacific
49.4 (46.7–52.0) 52.8 (50.2–55.4) 45.6 (43.5–47.8) 36.5 (34.2–38.7)
Mäori 16.9 (12.7–21.0) 11.3 (7.7–14.9) 17.2 (13.3–21.1) 18.2 (12.8–23.7)
Pacific 22.0 (14.0–30.0) – – 9.1 (4.7–13.5) – –
1–14 years
Non-Mäori non-Pacific
8.3 (7.1–9.5) 8.4 (7.2–9.6) 6.8 (5.8–7.8) 4.8 (3.9–5.8)
Mäori 95.9 (83.2–109) 93.7 (81.8–106) 104.9 (93.2–117) 78.8 (64.0–93.5)
Pacific 79.7 (57.2–102) 56.8 (39.3–74.3) 41.0 (29.1–52.8) 32.7 (18.8–46.6)
15–24 years
Non-Mäori non-Pacific
71.1 (67.2–75.0) 77.9 (73.8–82.0) 57.2 (53.8–60.5) 38.5 (35.2–41.9)
Mäori 69.4 (58.7–80.1) 80.7 (70.3–91.1) 59.7 (52.1–67.3) 60.9 (51.0–70.7)
Pacific 30.8 (19.0–42.6) 28.7 (19.1–38.3) 35.2 (26.6–43.9) 23.3 (14.6–32.0)
Males
Road traffic crashes
25–44 years
Non-Mäori non-Pacific
26.1 (24.2–28.0) 32.2 (30.1–34.2) 27.6 (25.9–29.3) 20.9 (19.2–22.6)
Mäori 21.2 (16.5–26.0) 20.5 (15.6–25.4) 16.5 (12.7–20.4) 23.0 (16.7–29.4)
Pacific – – 12.3 (5.7–18.9) 12.5 (7.2–17.8) 6.5 (1.7–11.4)
1–14 years
Non-Mäori non-Pacific
12.0 (10.5–13.4) 12.0 (10.5–13.4) 8.0 (6.9–9.2) 6.0 (4.8–7.1)
Mäori 39.8 (31.6–47.9) 42.2 (34.1–50.3) 29.8 (23.6–36.1) 43.7 (32.6–54.8)
Pacific – – 22.8 (12.2–33.4) 19.2 (11.3–27.1) – –
15–24 years
Non-Mäori non-Pacific
27.7 (25.2–30.2) 26.2 (23.8–28.6) 23.7 (21.5–25.9) 17.7 (15.4–20.0)
Mäori 28.0 (21.1–34.8) 30.3 (24.0–36.6) 35.1 (29.4–40.9) 26.9 (20.5–33.2)
Pacific 18.2 (10.6–25.9) 10.5 (5.9–15.0) 12.4 (6.2–18.5)
Unintentional injuries
25–44 years
Non-Mäori non-Pacific
11.5 (10.2–12.8) 14.1 (12.7–15.4) 12.5 (11.4–13.6) 8.5 (7.4–9.5)
Mäori 13.9 (10.1–17.8) 11.8 (8.1–15.6) 9.6 (6.6–12.6) 14.1 (9.1–19.1)
Pacific – – – – – – – –
1–14 years
Non-Mäori non-Pacific
6.0 (5.0–7.0) 6.8 (5.7–7.9) 4.9 (4.1–5.8) 3.4 (2.6–4.3)
Mäori 33.9 (26.4–41.4) 38.7 (31.0–46.5) 24.4 (18.8–30.1) 36.5 (26.4–46.7)
Pacific – – – – 17.1 (9.7–24.5) – –
15–24 years
Non-Mäori non-Pacific
22.1 (19.8–24.3) 23.1 (20.8–25.3) 20.1 (18.1–22.1) 14.5 (12.4–16.6)
Mäori 20.1 (14.4–25.9) 25.9 (20.0–31.8) 26.1 (21.2–31.0) 20.5 (14.9–26.0)
Pacific – – – – 8.0 (4.0–12.0) 10.5 (4.8–16.2)
Females
Road traffic crashes
25–44 years
Non-Mäori non-Pacific
7.1 (6.1–8.1) 10.7 (9.5–11.9) 8.9 (8.0–9.8) 6.4 (5.5–7.4)
Note: ‘–‘ indicates insufficient data.

Decades of Disparity: Ethnic Mortality Trends in New Zealand 1980–1999 95
Table 44: Mortality rate in 15–24, 25–44 and 45–74-year-old males and females for suicide (sole series)
Gender Cause Age group
Ethnic group
1980–84 1985–89 1990–95 1996–99
Mäori 14.52 (9.51–19.54) 45.59 (37.28–53.9) 59.59 (50.78–68.4) 72.88 (58.69–87.06)
Pacific – – 28.15 (15.87–40.44) 41.14 (29.22–53.06) 37.22 (22.36–52.09)
15–24 years
Non-Mäori non-Pacific
19.26 (17.22–21.3) 27.81 (25.36–30.26) 37.56 (34.87–40.26) 33.96 (30.83–37.08)
Mäori 18.14 (12.65–23.63) 19.45 (14.06–24.83) 31.44 (26.05–36.83) 57.98 (48.41–67.54)
Pacific 16.38 (8.09–24.68) 18.91 (11.04–26.77) 19.16 (12.78–25.55) 22.85 (14.1–31.61)
25–44 years
Non-Mäori non-Pacific
21.15 (19.4–22.91) 24.13 (22.36–25.9) 28.17 (26.47–29.88) 35.02 (32.78–37.25)
Mäori 14.39 (7.33–21.46) 11.58 (5.91–17.25) 11.2 (6.78–15.63) 21.34 (13.3–29.38)
Pacific – – – – 22.21 (11.5–32.92) – –
Males Suicide
45–74 years
Non-Mäori non-Pacific
23.94 (22.05–25.83) 26.87 (24.87–28.88) 25.23 (23.5–26.96) 23.83 (21.91–25.75)
Mäori 4.89 (2.07–7.7) 14.07 (9.4–18.74) 16.82 (12.12–21.52) 26.46 (17.86–35.05)
Pacific – – – – – – (1.2–14.6)
15–24 years
Non-Mäori non-Pacific
4.83 (3.78–5.87) 6.58 (5.37–7.79) 6.89 (5.72–8.06) 12.05 (10.16–13.94)
Mäori 5.95 (2.99–8.91) – – 5.64 93.42–7.85) 15.14 (10.34–19.94)
Pacific – – – – – – – –
25–44 years
Non-Mäori non-Pacific
7.55 (6.5–8.6) 7.02 (6.07–7.98) 7.01 (6.18–7.85) 8.58 (7.5–9.65)
Mäori – – – – – – – –
Pacific – – – – – – – –
Females Suicide
45–74 years
Non-Mäori non-Pacific
11.19 (9.89–12.48) 9.01 (7.86–10.16) 8.02 (7.04–8.99) 6.54 (5.55–7.54)
Note: ‘–‘ indicates insufficient data.
Table 45: Cause-substituted life expectancy, by gender – categories I, II, III (prioritised series)
Cause-substituted life expectancy (in years) Prioritised ethnic group
Gender Period
Category I Category II Category III
1980–84 0.37 5.20 0.77
1985–89 0.33 5.60 1.03
1990–95 0.31 7.13 1.12
Males
1996–99 0.26 8.31 1.41
1980–84 0.47 7.06 0.24
1985–89 0.37 6.57 0.38
1990–95 0.26 8.57 0.40
Mäori
Females
1996–99 0.30 9.01 0.57
1980–84 0.51 3.26 0.45
1985–89 0.62 4.26 0.09
1990–95 0.43 4.62 0.11
Males
1996–99 0.43 7.13 0.27
1980–84 0.50 2.67 -0.19
1985–89 0.52 4.18 -0.05
1990–95 0.34 4.12 -0.08
Pacific
Females
1996–99 0.42 6.15 0.02

96 Decades of Disparity: Ethnic Mortality Trends in New Zealand 1980–1999
Table 46: Cause-substituted life expectancy, by gender – categories I, II, III (sole series)
Cause-substituted life expectancy (in years) Sole ethnic group Gender Period
Category I Category II Category III
1980–84 0.48 6.08 0.96
1985–89 0.37 6.22 1.06
1990–95 0.37 7.73 1.26
Males
1996–99 0.28 9.73 1.70
1980–84 0.60 8.22 0.34
1985–89 0.41 7.34 0.42
1990–95 0.32 9.40 0.49
Mäori
Females
1996–99 0.34 10.71 0.79
1980–84 0.38 2.34 0.27
1985–89 0.58 3.87 -0.05
1990–95 0.36 3.80 0.11
Males
1996–99 0.34 6.52 0.10
1980–84 0.43 2.13 -0.23
1985–89 0.50 4.13 -0.08
1990–95 0.32 3.88 -0.06
Pacific
Females
1996–99 0.33 5.70 -0.04
Table 47: Cause-substituted life expectancy by gender – specific causes (prioritised series)
Age-substituted life expectancy (in years) Prioritised ethnic group
Gender Period
Cancer Diabetes Cardiovascular disease
Respiratory disease
Unintentional injuries
1980–84 0.92 0.47 2.49 0.89 0.85
1985–89 1.01 0.45 2.58 0.70 0.90
1990–95 1.37 0.65 3.50 0.63 1.00
Males
1996–99 1.84 0.81 4.01 0.58 1.06
1980–84 1.37 0.61 3.60 1.26 0.28
1985–89 1.28 0.59 3.32 1.09 0.41
1990–95 1.75 0.92 3.82 1.05 0.38
Mäori
Females
1996–99 2.51 0.93 3.61 1.04 0.46
1980–84 0.81 0.20 1.67 0.69 0.42
1985–89 1.23 0.24 1.70 1.08 0.04
1990–95 0.59 0.43 2.47 0.54 0.07
Males
1996–99 1.84 0.66 3.06 0.74 0.26
1980–84 0.27 0.32 1.36 0.47 -0.20
1985–89 0.49 0.51 2.00 0.82 -0.02
1990–95 0.62 0.61 2.24 0.31 -0.03
Pacific
Females
1996–99 1.50 1.09 2.62 0.29 0.03

Decades of Disparity: Ethnic Mortality Trends in New Zealand 1980–1999 97
Table 48: Cause-substituted life expectancy by gender – specific causes (sole series)
Age-substituted life expectancy (in years) Sole ethnic group
Gender Period
Cancer Diabetes Cardiovascular disease
Respiratory disease
Unintentional injuries
1980–84 1.11 0.49 2.87 1.01 1.03
1985–89 1.15 0.46 2.88 0.75 0.93
1990–95 1.50 0.66 3.74 0.68 1.12
Males
1996–99 2.17 0.89 4.57 0.64 1.33
1980–84 1.65 0.64 4.11 1.40 0.37
1985–89 1.49 0.62 3.66 1.18 0.45
1990–95 1.99 0.96 4.08 1.12 0.47
Mäori
Females
1996–99 3.12 1.02 4.21 1.15 0.69
1980–84 0.68 0.18 1.40 0.63 0.30
1985–89 1.25 0.24 1.71 1.09 -0.08
1990–95 0.64 0.43 2.56 0.55 0.10
Males
1996–99 1.74 0.68 3.26 0.78 0.15
1980–84 0.13 0.29 1.10 0.40 -0.23
1985–89 0.55 0.52 2.13 0.85 -0.05
1990–95 0.72 0.63 2.37 0.34 -0.02
Pacific
Females
1996–99 1.57 1.11 2.73 0.31 0.02
Table 49: Comparison of mortality rates, by age, EMT v. NZCMS (prioritised series)
Age group
Period Mäori – EMT Mäori – CMS Pacific – EMT Pacific – CMS Non-Mäori non-Pacific – EMT
Non-Mäori non-Pacific – CMS
1980–84 49.0 38.1 70.6 42.1 35.4 27.4
1985–89 48.9 37.7 50.2 39.9 33.1 24.3
1990–95 41.8 29.1 46.9 31.7 25.6 21.2
1–14 years
1996–99 43.7 34.8 31.3 25.8 20.6 17.5
1980–84 148.0 144.0 124.9 125.2 102.9 100.1
1985–89 159.2 155.9 147.7 127.8 105.7 105.0
1990–95 154.0 140.8 95.5 78.7 95.5 95.9
15–24 years
1996–99 141.9 155.1 111.6 103.4 72.4 71.9
1980–84 283.9 273.2 198.6 138.4 129.0 123.4
1985–89 276.6 249.5 212.0 194.5 122.9 119.1
1990–95 262.3 237.8 179.6 148.1 113.3 111.5
25–44 years
1996–99 252.9 240.9 213.3 195.6 94.9 94.7
1980–84 1749.7 1681.3 1309.5 1007.3 787.2 844.8
1985–89 1734.0 1595.4 1324.5 1056.2 707.1 760.7
1990–95 1723.0 1618.9 1071.0 887.2 605.5 621.7
45–64 years
1996–99 1569.2 1461.6 1173.2 995.7 502.3 485.6
1980–84 5671.6 6193.0 4567.4 4663.0 3205.0 3758.5
1985–89 5317.9 5793.1 5074.5 4587.1 2948.7 3577.3
1990–95 5469.3 5857.5 4184.9 4210.8 2592.3 3085.4
65–74 years
1996–99 5295.8 5781.5 4421.2 4358.9 2122.2 2636.7

98 Decades of Disparity: Ethnic Mortality Trends in New Zealand 1980–1999
Table 50: Comparison of mortality rates, by age, EMT v. NZCMS (sole series)
Age group
Period Mäori – EMT Mäori – CMS Pacific – EMT Pacific – CMS Non-Mäori non-Pacific – EMT
Non-Mäori non-Pacific – CMS
1980–84 56.6 40.3 62.2 42.2 35.6 27.9
1985–89 51.0 41.2 53.5 44.5 34.4 24.9
1990–95 47.6 32.2 50.3 33.4 25.9 21.5
1–14 years
1996–99 61.5 49.7 28.7 22.6 22.2 18.7
1980–84 159.4 154.6 119.7 130.9 104.1 100.7
1985–89 158.3 160.4 125.3 115.1 109.1 107.6
1990–95 158.8 144.5 96.5 81.8 97.1 97.4
15–24 years
1996–99 167.0 177.8 106.8 106.3 78.4 79.0
1980–84 311.9 304.3 196.0 141.5 130.4 124.7
1985–89 297.0 270.2 206.8 191.6 124.9 120.7
1990–95 289.9 261.5 186.8 154.2 113.8 112.1
25–44 years
1996–99 287.7 275.6 202.9 195.0 103.2 102.0
1980–84 1906.7 1835.7 1238.0 973.6 793.5 848.6
1985–89 1866.7 1727.2 1372.7 1096.1 711.5 762.8
1990–95 1833.6 1731.7 1095.9 904.0 609.3 625.4
45–64 years
1996–99 1848.2 1804.3 1213.3 1043.3 519.1 497.4
1980–84 6205.5 6780.7 4350.8 4693.1 3213.2 3763.6
1985–89 5571.7 6123.9 5136.3 4718.5 2957.1 3581.8
1990–95 5691.8 6105.3 4281.8 4318.1 2600.1 3091.5
65–74 years
1996–99 6141.4 6723.4 4632.6 4617.8 2151.6 2661.3

Decades of Disparity: Ethnic Mortality Trends in New Zealand 1980–1999 99
Appendix 4: Results – Sole Series
Global burden of disease categories I, II, III (sole series) The pattern for the sole group is slightly different from that for the prioritised group, especially for Mäori. Although there is evidence of decreasing mortality rates over time for cause category I, the trend is opposite for category II and there has been very little difference in injury mortality rates (category III). Figure 24: Cause-specific standardised mortality rates, ages 1–74 years, by gender (sole series)
Category I: Males (sole) Category I: Females (sole)
0
10
20
30
40
50
60
70
80
1980–84 1985–89 1990–95 1996–99
Standardised mortality rates (per
0
10
20
30
40
50
60
70
80
1980–84 1985–89 1990–95 1996–99
Standardised mortality rates (per
Category II: Males (sole) Category II: Females (sole)
0
200
400
600
800
1000
1980–84 1985–89 1990–95 1996–99
Standardised mortality rates (per
0
200
400
600
800
1000
1980–84 1985–89 1990–95 1996–99
Standardised mortality rates (per
Category III: Males (sole) Category III: Females (sole)
0
20
40
60
80
100
120
140
1980–84 1985–89 1990–95 1996–99
Standardised mortality rates (per
0
20
40
60
80
100
120
140
1980–84 1985–89 1990–95 1996–99
Standardised mortality rates (per
Mäori Pacific Non-Mäori non-Pacific
Corresponding table is Table 38. Category I: communicable disease, maternal, perinatal and nutritional conditions. Category II: non-communicable diseases. Category III: injuries.

100 Decades of Disparity: Ethnic Mortality Trends in New Zealand 1980–1999
Cause-specific mortality rates (sole series) The pattern for the sole group was similar to that for the prioritised pattern. Figure 25: Standardised mortality rates, ages 1–74 years, by gender – specific causes (sole series)
Cancer: males (sole) Cancer: females (sole)
0
50
100
150
200
250
300
1980–84 1985–89 1990–95 1996–99
Standardised mortality rates (per 100,000)
0
50
100
150
200
250
300
1980–84 1985–89 1990–95 1996–99
Standardised mortality rates (per 100,000)
Lung cancer: males (sole) Lung cancer: females (sole)
0
20
40
60
80
100
120
1980–84 1985–89 1990–95 1996–99
Standardised mortality rates (per 100,000)
0
20
40
60
80
100
120
1980–84 1985–89 1990–95 1996–99
Standardised mortality rates (per 100,000)
Prostate cancer: males (sole) Breast cancer: females (sole)
0
5
10
15
20
25
30
35
1980–84 1985–89 1990–95 1996–99
Standardised mortality rates (per 100,000)
0
10
20
30
40
50
60
1980–84 1985–89 1990–95 1996–99
Standardised mortality rates (per 100,000)
Colorectal cancer: males (sole) Colorectal cancer: females (sole)
0
5
10
15
20
25
1980–84 1985–89 1990–95 1996–99
Standardised mortality rates (per 100,000)
0
5
10
15
20
25
1980–84 1985–89 1990–95 1996–99
Standardised mortality rates (per 100,000)
Mäori Pacific Non-Mäori non-Pacific
(Continued)

Decades of Disparity: Ethnic Mortality Trends in New Zealand 1980–1999 101
Cardiovascular disease: males (sole) Cardiovascular disease: females (sole)
0
100
200
300
400
500
1980–84 1985–89 1990–95 1996–99
Standardised mortality rates (per 100,000)
0
100
200
300
400
500
1980–84 1985–89 1990–95 1996–99
Standardised mortality rates (per 100,000)
Ischaemic heart disease: males (sole) Ischaemic heart disease: females (sole)
0
50
100
150
200
250
300
1980–84 1985–89 1990–95 1996–99
Standardised mortality rates (per 100,000)
0
50
100
150
200
250
300
1980–84 1985–89 1990–95 1996–99
Standardised mortality rates (per 100,000)
Stroke: males (sole) Stroke: females (sole)
0
20
40
60
80
100
1980–84 1985–89 1990–95 1996–99
Standardised mortality rates (per 100,000)
0
20
40
60
80
100
1980–84 1985–89 1990–95 1996–99
Standardised mortality rates (per 100,000)
Respiratory diseases: males (sole) Respiratory diseases: females (sole)
0
20
40
60
80
100
120
140
1980–84 1985–89 1990–95 1996–99
Standardised mortality rates (per 100,000)
0
20
40
60
80
100
120
140
1980–84 1985–89 1990–95 1996–99
Standardised mortality rates (per 100,000)
Mäori Pacific Non-Mäori non-Pacific
(Continued)

102 Decades of Disparity: Ethnic Mortality Trends in New Zealand 1980–1999
Unintentional injuries: males (sole) Unintentional injuries: females (sole)
0
20
40
60
80
100
120
1980–84 1985–89 1990–95 1996–99
Standardised mortality rates (per 100,000)
0
20
40
60
80
100
120
1980–84 1985–89 1990–95 1996–99
Standardised mortality rates (per 100,000)
Road traffic crashes: males (sole) Road traffic crashes: females (sole)
0
10
20
30
40
50
60
70
1980–84 1985–89 1990–95 1996–99
Standardised mortality rates (per 100,000)
0
10
20
30
40
50
60
70
1980–84 1985–89 1990–95 1996–99
Standardised mortality rates (per 100,000)
Suicide: males (sole) Suicide: females (sole)
0
5
10
15
20
25
30
35
40
45
1980–84 1985–89 1990–95 1996–99
Standardised mortality rates (per 100,000)
0
5
10
15
20
25
30
35
40
45
1980–84 1985–89 1990–95 1996–99
Standardised mortality rates (per 100,000)
Mäori Pacific Non-Mäori non-Pacific
Corresponding table is Table 40.

Decades of Disparity: Ethnic Mortality Trends in New Zealand 1980–1999 103
Selected causes – specific age groups (sole series)
Figure 26: Mortality rate in 35–64 and 65–74-year-old males and females for cancers and cardiovascular diseases (sole series)
Cancer: 35–64-year-old males (sole) Cancer: 35–64-year-old females (sole)
0
100
200
300
400
500
1980–84 1985–89 1990–95 1996–99
Mortality rate(per 100,000)
0
100
200
300
400
500
1980–84 1985–89 1990–95 1996–99
Mortality rate(per 100,000)
Cancer: 65–74-year-old males (sole) Cancer: 65–74-year-old females (sole)
0
500
1000
1500
2000
2500
1980–84 1985–89 1990–95 1996–99
Mortality rate(per 100,000)
0
500
1000
1500
2000
2500
1980–84 1985–89 1990–95 1996–99
Mortality rate(per 100,000)
Lung cancer: 35–64-year-old males (sole) Lung cancer: 35–64-year-old females (sole)
0
30
60
90
120
150
180
1980–84 1985–89 1990–95 1996–99
Mortality rate(per 100,000)
0
30
60
90
120
150
180
1980–84 1985–89 1990–95 1996–99
Mortality rate(per 100,000)
Lung cancer: 65–74-year-old males (sole) Lung cancer: 65–74-year-old females (sole)
0
200
400
600
800
1000
1200
1980–84 1985–89 1990–95 1996–99
Mortality rate(per 100,000)
0
200
400
600
800
1000
1200
1980–84 1985–89 1990–95 1996–99
Mortality rate(per 100,000)
Mäori Pacific Non-Mäori non-Pacific
(Continued)

104 Decades of Disparity: Ethnic Mortality Trends in New Zealand 1980–1999
Prostate cancer: 35–64-year-old males (sole) Breast cancer: 35–64-year-old females (sole)
0
5
10
15
20
25
1980–84 1985–89 1990–95 1996–99
Mortality rate(per 100,000)
0
20
40
60
80
100
120
1980–84 1985–89 1990–95 1996–99
Mortality rate(per 100,000)
Prostate cancer: 65–74-year-old males (sole) Breast cancer: 65–74-year-old females (sole)
0
100
200
300
400
500
1980–84 1985–89 1990–95 1996–99
Mortality rate(per 100,000)
0
50
100
150
200
250
1980–84 1985–89 1990–95 1996–99
Mortality rate(per 100,000)
Colorectal cancer: 35–64-year-old males (sole) Colorectal cancer: 35–64-year-old females (sole)
0
5
10
15
20
25
30
35
40
1980–84 1985–89 1990–95 1996–99
Mortality rate(per 100,000)
0
5
10
15
20
25
30
35
40
1980–84 1985–89 1990–95 1996–99
Mortality rate(per 100,000)
Colorectal cancer: 65–74-year-old males (sole) Colorectal cancer: 65–74-year-old females (sole)
0
50
100
150
200
250
300
350
1980–84 1985–89 1990–95 1996–99
Mortality rate(per 100,000)
0
50
100
150
200
250
300
350
1980–84 1985–89 1990–95 1996–99
Mortality rate(per 100,000)
Mäori Pacific Non-Mäori non-Pacific
(Continued)

Decades of Disparity: Ethnic Mortality Trends in New Zealand 1980–1999 105
Ischaemic heart disease: 35–64-year-old males (sole) Ischaemic heart disease: 35–64-year-old females (sole)
0
100
200
300
400
500
1980–84 1985–89 1990–95 1996–99
Mortality rate(per 100,000)
0
100
200
300
400
500
1980–84 1985–89 1990–95 1996–99
Mortality rate(per 100,000)
Ischaemic heart disease: 65–74-year-old males (sole) Ischaemic heart disease: 65–74-year-old females (sole)
0
500
1000
1500
2000
2500
3000
1980–84 1985–89 1990–95 1996–99
Mortality rate(per 100,000)
0
500
1000
1500
2000
2500
3000
1980–84 1985–89 1990–95 1996–99
Mortality rate(per 100,000)
Stroke: 35–64-year-old males (sole) Stroke: 35–64-year-old females (sole)
0
30
60
90
120
150
1980–84 1985–89 1990–95 1996–99
Mortality rate(per 100,000)
0
30
60
90
120
150
1980–84 1985–89 1990–95 1996–99
Mortality rate(per 100,000)
Stroke: 65–74-year-old males (sole) Stroke: 65–74-year-old females (sole)
0
200
400
600
800
1000
1200
1980–84 1985–89 1990–95 1996–99
Mortality rate(per 100,000)
0
200
400
600
800
1000
1200
1980–84 1985–89 1990–95 1996–99
Mortality rate(per 100,000)
Mäori Pacific Non-Mäori non-Pacific
(Continued)

106 Decades of Disparity: Ethnic Mortality Trends in New Zealand 1980–1999
Cardiovascular disease: 35–64-year-old males (sole) Cardiovascular disease: 35–64-year-old females (sole)
0
100
200
300
400
500
600
700
800
1980–84 1985–89 1990–95 1996–99
Mortality rate(per 100,000)
0
100
200
300
400
500
600
700
800
1980–84 1985–89 1990–95 1996–99
Mortality rate(per 100,000)
Cardiovascular disease: 65–74-year-old males (sole) Cardiovascular disease: 65–74-year-old females (sole)
0
500
1000
1500
2000
2500
3000
3500
4000
1980–84 1985–89 1990–95 1996–99
Mortality rate(per 100,000)
0
500
1000
1500
2000
2500
3000
3500
4000
1980–84 1985–89 1990–95 1996–99
Mortality rate(per 100,000)
Mäori Pacific Non-Mäori non-Pacific
Corresponding table is Table 42.

Decades of Disparity: Ethnic Mortality Trends in New Zealand 1980–1999 107
Figure 27: Mortality rate in 1–14, 15–24 and 25–44-year-old males and females for unintentional injuries and road traffic crashes (sole series)
Unintentional injuries: 1–14-year-old males (sole) Unintentional injuries: 1–14-year-old females (sole)
0
5
10
15
20
25
30
35
40
45
1980–84 1985–89 1990–95 1996–99
Mortality rate(per 100,000)
0
5
10
15
20
25
30
35
40
45
1980–84 1985–89 1990–95 1996–99
Mortality rate(per 100,000)
Unintentional injuries: 15–24-year-old males (sole) Unintentional injuries: 15–24-year-old females (sole)
0
20
40
60
80
100
120
140
160
1980–84 1985–89 1990–95 1996–99
Mortality rate(per 100,000)
0
20
40
60
80
100
120
140
160
1980–84 1985–89 1990–95 1996–99
Mortality rate(per 100,000)
Unintentional injuries: 25–44-year-old males (sole) Unintentional injuries: 25–44-year-old females (sole)
0
20
40
60
80
100
120
140
1980–84 1985–89 1990–95 1996–99
Mortality rate(per 100,000)
0
20
40
60
80
100
120
140
1980–84 1985–89 1990–95 1996–99
Mortality rate(per 100,000)
Mäori Pacific Non-Mäori non-Pacific
(Continued)

108 Decades of Disparity: Ethnic Mortality Trends in New Zealand 1980–1999
Road traffic crashes: 1–14-year-old males (sole) Road traffic crashes: 1–14-year-old females (sole)
0
5
10
15
20
25
30
1980–84 1985–89 1990–95 1996–99
Mortality rate(per 100,000)
0
5
10
15
20
25
30
1980–84 1985–89 1990–95 1996–99
Mortality rate(per 100,000)
Road traffic crashes: 15–24-year-old males (sole) Road traffic crashes: 15–24-year-old females (sole)
0
20
40
60
80
100
120
1980–84 1985–89 1990–95 1996–99
Mortality rate(per 100,000)
0
20
40
60
80
100
120
1980–84 1985–89 1990–95 1996–99
Mortality rate(per 100,000)
Road traffic crashes: 25–44-year-old males (sole) Road traffic crashes: 25–44-year-old females (sole)
0
20
40
60
80
100
1980–84 1985–89 1990–95 1996–99
Mortality rate(per 100,000)
0
20
40
60
80
100
1980–84 1985–89 1990–95 1996–99
Mortality rate(per 100,000)
Mäori Pacific Non-Mäori non-Pacific
Corresponding table is Table 43.

Decades of Disparity: Ethnic Mortality Trends in New Zealand 1980–1999 109
Figure 28: Mortality rate in 15–24, 25–44 and 45–74-year-old males and females for suicide (sole series)
Suicide: 15–24-year-old males (sole) Suicide: 15–24-year-old females (sole)
0
10
20
30
40
50
60
70
80
90
1980–84 1985–89 1990–95 1996–99
Mortality rate(per 100,000)
0
10
20
30
40
50
60
70
80
90
1980–84 1985–89 1990–95 1996–99
Mortality rate(per 100,000)
Suicide: 25–44-year-old males (sole) Suicide: 25–44-year-old females (sole)
0
10
20
30
40
50
60
70
1980–84 1985–89 1990–95 1996–99
Mortality rate(per 100,000)
0
10
20
30
40
50
60
70
1980–84 1985–89 1990–95 1996–99
Mortality rate(per 100,000)
Suicide: 45–74-year-old males (sole) Suicide: 45–74-year-old females (sole)
0
5
10
15
20
25
30
35
40
1980–84 1985–89 1990–95 1996–99
Mortality rate(per 100,000)
0
5
10
15
20
25
30
1980–84 1985–89 1990–95 1996–99
Mortality rate(per 100,000)
Mäori Pacific Non-Mäori non-Pacific
Corresponding table is Table 44.

110 Decades of Disparity: Ethnic Mortality Trends in New Zealand 1980–1999
Figure 29: Cause substituted life expectancy, by gender – specific causes (sole series)
Cause-substituted male life expectancy (sole Mäori)
Cause-substituted female life expectancy (sole Mäori)
0
1
2
3
4
5
Cancer Diabetes Cardiovasculardisease
Respiratorydisease
Unintentionalinjuries
Other
Years
0
1
2
3
4
5
Cancer Diabetes Cardiovasculardisease
Respiratorydisease
Unintentionalinjuries
Other
Years
Cause-substituted male life expectancy (sole Pacific)
Cause-substituted female life expectancy (sole Pacific)
-1
0
1
2
3
4Years
Cancer Diabetes Cardiovascular disease
Respiratory disease
OtherUnintentional injuries
-1
0
1
2
3
4Years
Cancer Diabetes Cardiovascular disease
Respiratory disease
OtherUnintentional injuries
1980–84 1985–89 1990–95 1996–99
Corresponding table is Table 48.

Decades of Disparity: Ethnic Mortality Trends in New Zealand 1980–1999 111
Appendix 5: Mortality Rates by Five-year Age Categories Figure 30: Mortality rate, by gender and five-year age group (prioritised series)
Males 1–4 years (prioritised) Females 1–4 years (prioritised)
0
20
40
60
80
100
120
140
1980–84 1985–89 1990–95 1996–99
Standardised mortality rate (per 100,000)
0
20
40
60
80
100
120
140
1980–84 1985–89 1990–95 1996–99
Standardised mortality rate (per 100,000)
Males 5–9 years (prioritised) Females 5–9 years (prioritised)
0
20
40
60
80
100
1980–84 1985–89 1990–95 1996–99
Standardised mortality rate (per 100,000)
0
20
40
60
80
100
1980–84 1985–89 1990–95 1996–99
Standardised mortality rate (per 100,000)
Males 10–14 years (prioritised) Females 10–14 years (prioritised)
0
10
20
30
40
50
60
1980–84 1985–89 1990–95 1996–99
Standardised mortality rate (per 100,000)
0
10
20
30
40
50
60
1980–84 1985–89 1990–95 1996–99
Standardised mortality rate (per 100,000)
Males 15–19 years (prioritised) Females 15–19 years (prioritised)
0
50
100
150
200
250
1980–84 1985–89 1990–95 1996–99
Standardised mortality rate (per 100,000)
0
50
100
150
200
250
1980–84 1985–89 1990–95 1996–99
Standardised mortality rate (per 100,000)
Mäori Pacific Non-Mäori non-Pacific
(Continued)

112 Decades of Disparity: Ethnic Mortality Trends in New Zealand 1980–1999
Males 20–24 years (prioritised) Females 20–24 years (prioritised)
0
50
100
150
200
250
300
350
1980–84 1985–89 1990–95 1996–99
Standardised mortality rate (per 100,000)
0
50
100
150
200
250
300
350
1980–84 1985–89 1990–95 1996–99
Standardised mortality rate (per 100,000)
Males 25–29 years (prioritised) Females 25–29 years (prioritised)
0
50
100
150
200
250
300
1980–84 1985–89 1990–95 1996–99
Standardised mortality rate (per 100,000)
0
50
100
150
200
250
300
1980–84 1985–89 1990–95 1996–99
Standardised mortality rate (per 100,000)
Males 30–34 years (prioritised) Females 30–34 years (prioritised)
0
50
100
150
200
250
300
1980–84 1985–89 1990–95 1996–99
Standardised mortality rate (per 100,000)
0
50
100
150
200
250
300
1980–84 1985–89 1990–95 1996–99
Standardised mortality rate (per 100,000)
Males 35–39 years (prioritised) Females 35–39 years (prioritised)
0
50
100
150
200
250
300
350
400
1980–84 1985–89 1990–95 1996–99
Standardised mortality rate (per 100,000)
0
50
100
150
200
250
300
350
400
1980–84 1985–89 1990–95 1996–99
Standardised mortality rate (per 100,000)
Mäori Pacific Non-Mäori non-Pacific
(Continued)

Decades of Disparity: Ethnic Mortality Trends in New Zealand 1980–1999 113
Males 40–44 years (prioritised) Females 40–44 years (prioritised)
0
100
200
300
400
500
600
1980–84 1985–89 1990–95 1996–99
Standardised mortality rate (per 100,000)
0
100
200
300
400
500
600
1980–84 1985–89 1990–95 1996–99
Standardised mortality rate (per 100,000)
Males 45–49 years (prioritised) Females 45–49 years (prioritised)
0
200
400
600
800
1000
1200
1980–84 1985–89 1990–95 1996–99
Standardised mortality rate (per 100,000)
0
200
400
600
800
1000
1200
1980–84 1985–89 1990–95 1996–99
Standardised mortality rate (per 100,000)
Males 50–54 years (prioritised) Females 50–54 years (prioritised)
0
200
400
600
800
1000
1200
1400
1600
1980–84 1985–89 1990–95 1996–99
Standardised mortality rate (per 100,000)
0
200
400
600
800
1000
1200
1400
1600
1980–84 1985–89 1990–95 1996–99
Standardised mortality rate (per 100,000)
Males 55–59 years (prioritised) Females 55–59 years (prioritised)
0
500
1000
1500
2000
2500
3000
1980–84 1985–89 1990–95 1996–99
Standardised mortality rate (per 100,000)
0
500
1000
1500
2000
2500
3000
1980–84 1985–89 1990–95 1996–99
Standardised mortality rate (per 100,000)
Mäori Pacific Non-Mäori non-Pacific
(Continued)
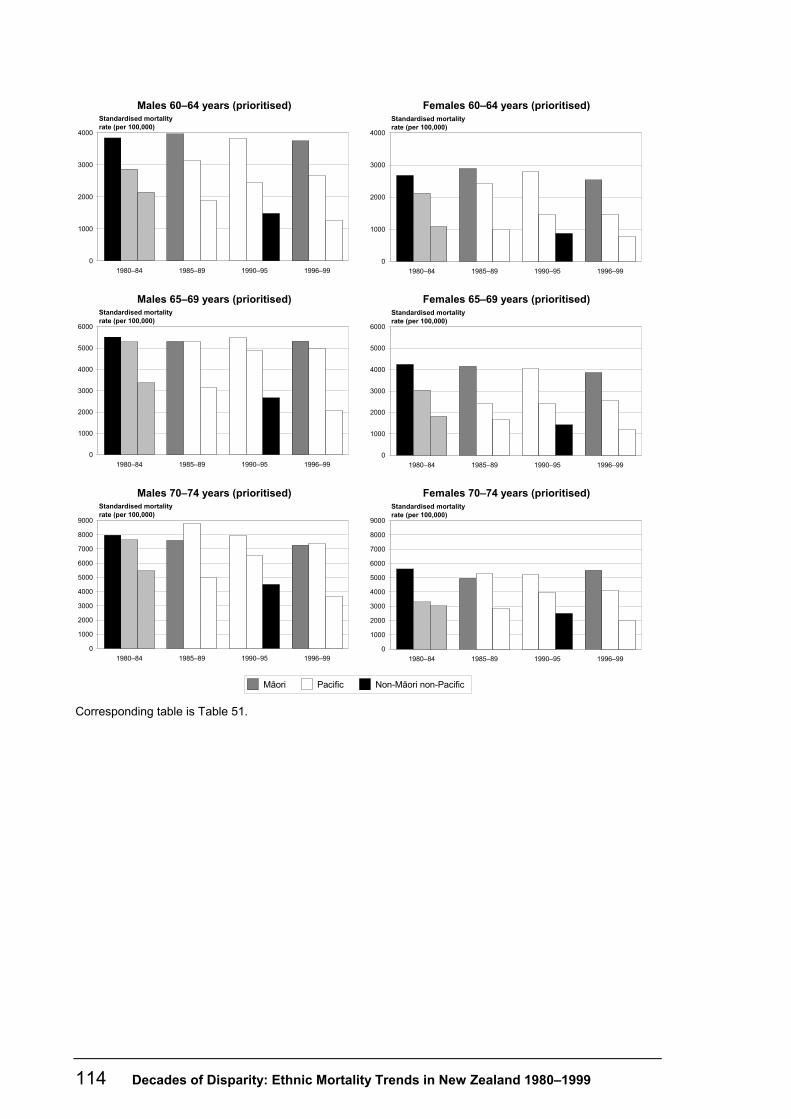
114 Decades of Disparity: Ethnic Mortality Trends in New Zealand 1980–1999
Males 60–64 years (prioritised) Females 60–64 years (prioritised)
0
1000
2000
3000
4000
1980–84 1985–89 1990–95 1996–99
Standardised mortality rate (per 100,000)
0
1000
2000
3000
4000
1980–84 1985–89 1990–95 1996–99
Standardised mortality rate (per 100,000)
Males 65–69 years (prioritised) Females 65–69 years (prioritised)
0
1000
2000
3000
4000
5000
6000
1980–84 1985–89 1990–95 1996–99
Standardised mortality rate (per 100,000)
0
1000
2000
3000
4000
5000
6000
1980–84 1985–89 1990–95 1996–99
Standardised mortality rate (per 100,000)
Males 70–74 years (prioritised) Females 70–74 years (prioritised)
0
1000
2000
3000
4000
5000
6000
7000
8000
9000
1980–84 1985–89 1990–95 1996–99
Standardised mortality rate (per 100,000)
0
1000
2000
3000
4000
5000
6000
7000
8000
9000
1980–84 1985–89 1990–95 1996–99
Standardised mortality rate (per 100,000)
Mäori Pacific Non-Mäori non-Pacific
Corresponding table is Table 51.

Decades of Disparity: Ethnic Mortality Trends in New Zealand 1980–1999 115
Figure 31: Mortality rate, by gender and five-year age group (sole series)
Males 1–4 years (sole) Females 1–4 years (sole)
0
20
40
60
80
100
120
1980–84 1985–89 1990–95 1996–99
Standardised mortality rate (per 100,000)
0
20
40
60
80
100
120
1980–84 1985–89 1990–95 1996–99
Standardised mortality rate (per 100,000)
Males 5–9 years (sole) Females 5–9 years (sole)
0
10
20
30
40
50
60
70
80
1980–84 1985–89 1990–95 1996–99
Standardised mortality rate (per 100,000)
0
10
20
30
40
50
60
70
80
1980–84 1985–89 1990–95 1996–99
Standardised mortality rate (per 100,000)
Males 10–14 years (sole) Females 10–14 years (sole)
0
10
20
30
40
50
60
70
80
1980–84 1985–89 1990–95 1996–99
Standardised mortality rate (per 100,000)
0
10
20
30
40
50
60
70
80
1980–84 1985–89 1990–95 1996–99
Standardised mortality rate (per 100,000)
Males 15–19 years (sole) Females 15–19 years (sole)
0
50
100
150
200
250
1980–84 1985–89 1990–95 1996–99
Standardised mortality rate (per 100,000)
0
50
100
150
200
250
1980–84 1985–89 1990–95 1996–99
Standardised mortality rate (per 100,000)
Mäori Pacific Non-Mäori non-Pacific
(Continued)

116 Decades of Disparity: Ethnic Mortality Trends in New Zealand 1980–1999
Males 20–24 years (sole) Females 20–24 years (sole)
0
50
100
150
200
250
300
1980–84 1985–89 1990–95 1996–99
Standardised mortality rate (per 100,000)
0
50
100
150
200
250
300
1980–84 1985–89 1990–95 1996–99
Standardised mortality rate (per 100,000)
Males 25–29 years (sole) Females 25–29 years (sole)
0
50
100
150
200
250
300
350
1980–84 1985–89 1990–95 1996–99
Standardised mortality rate (per 100,000)
0
50
100
150
200
250
300
350
1980–84 1985–89 1990–95 1996–99
Standardised mortality rate (per 100,000)
Males 30–34 years (sole) Females 30–34 years (sole)
0
50
100
150
200
250
300
350
1980–84 1985–89 1990–95 1996–99
Standardised mortality rate (per 100,000)
0
50
100
150
200
250
300
350
1980–84 1985–89 1990–95 1996–99
Standardised mortality rate (per 100,000)
Males 35–39 years (sole) Females 35–39 years (sole)
0
50
100
150
200
250
300
350
400
1980–84 1985–89 1990–95 1996–99
Standardised mortality rate (per 100,000)
0
50
100
150
200
250
300
350
400
1980–84 1985–89 1990–95 1996–99
Standardised mortality rate (per 100,000)
Mäori Pacific Non-Mäori non-Pacific
(Continued)

Decades of Disparity: Ethnic Mortality Trends in New Zealand 1980–1999 117
Males 40–44 years (sole) Females 40–44 years (sole)
0
100
200
300
400
500
600
700
1980–84 1985–89 1990–95 1996–99
Standardised mortality rate (per 100,000)
0
100
200
300
400
500
600
700
1980–84 1985–89 1990–95 1996–99
Standardised mortality rate (per 100,000)
Males 45–49 years (sole) Females 45–49 years (sole)
0
200
400
600
800
1000
1200
1980–84 1985–89 1990–95 1996–99
Standardised mortality rate (per 100,000)
0
200
400
600
800
1000
1200
1980–84 1985–89 1990–95 1996–99
Standardised mortality rate (per 100,000)
Males 50–54 years (sole) Females 50–54 years (sole)
0
300
600
900
1200
1500
1800
1980–84 1985–89 1990–95 1996–99
Standardised mortality rate (per 100,000)
0
300
600
900
1200
1500
1800
1980–84 1985–89 1990–95 1996–99
Standardised mortality rate (per 100,000)
Males 55–59 years (sole) Females 55–59 years (sole)
0
500
1000
1500
2000
2500
3000
1980–84 1985–89 1990–95 1996–99
Standardised mortality rate (per 100,000)
0
500
1000
1500
2000
2500
3000
1980–84 1985–89 1990–95 1996–99
Standardised mortality rate (per 100,000)
Mäori Pacific Non-Mäori non-Pacific
(Continued)

118 Decades of Disparity: Ethnic Mortality Trends in New Zealand 1980–1999
Males 60–64 years (sole) Females 60–64 years (sole)
0
1000
2000
3000
4000
5000
1980–84 1985–89 1990–95 1996–99
Standardised mortality rate (per 100,000)
0
1000
2000
3000
4000
5000
1980–84 1985–89 1990–95 1996–99
Standardised mortality rate (per 100,000)
Males 65–69 years (sole) Females 65–69 years (sole)
0
1000
2000
3000
4000
5000
6000
1980–84 1985–89 1990–95 1996–99
Standardised mortality rate (per 100,000)
0
1000
2000
3000
4000
5000
6000
1980–84 1985–89 1990–95 1996–99
Standardised mortality rate (per 100,000)
Males 70–74 years (sole) Females 70–74 years (sole)
0
1000
2000
3000
4000
5000
6000
7000
8000
9000
1980–84 1985–89 1990–95 1996–99
Standardised mortality rate (per 100,000)
0
1000
2000
3000
4000
5000
6000
7000
8000
9000
1980–84 1985–89 1990–95 1996–99
Standardised mortality rate (per 100,000)
Mäori Pacific Non-Mäori non-Pacific
Corresponding table is Table 52.

Decades of Disparity: Ethnic Mortality Trends in New Zealand 1980–1999 119
Table 51: Age-specific mortality rates, by gender (five-year age groups) – prioritised series
Males Females Age group
Prioritised ethnic group
1980–84 1985–89 1990–95 1996–99 1980–84 1985–89 1990–95 1996–99
Mäori 85.7 91.4 73.3 75.8 69.6 66.0 47.9 55.5
Pacific 128.9 74.1 103.2 60.8 82.3 78.6 47.9 40.4
1–4 years
Non-Mäori non-Pacific 69.0 58.8 44.6 30.9 49.3 43.3 33.9 26.4
Mäori 45.2 45.6 33.4 26.6 22.5 15.8 29.8 15.9
Pacific 45.0 43.3 40.9 12.2 88.4 28.3 27.7 18.2
5–9 years
Non-Mäori non-Pacific 30.3 26.5 20.8 19.3 20.1 24.0 16.8 11.9
Mäori 40.9 54.0 49.2 54.2 40.6 30.5 23.5 42.1
Pacific 37.9 51.8 34.9 31.0 55.4 34.3 35.7 32.1
10–14 years
Non-Mäori non-Pacific 31.6 31.9 26.6 19.6 20.5 20.2 15.4 18.4
Mäori 187.4 208.0 183.9 181.5 91.0 73.6 70.4 97.8
Pacific 172.9 113.5 98.2 124.5 53.8 74.4 61.9 61.8
15–19 years
Non-Mäori non-Pacific 119.7 140.0 108.6 93.3 51.6 51.8 45.7 48.6
Mäori 217.8 246.5 293.1 218.9 97.5 110.3 76.8 74.5
Pacific 165.0 307.6 172.3 208.8 111.8 110.4 58.8 58.2
20–24 years
Non-Mäori non-Pacific 171.7 172.8 170.5 110.9 65.2 54.7 55.4 35.9
Mäori 237.8 245.7 239.2 270.0 104.0 91.5 84.9 103.4
Pacific 78.4 172.8 120.9 210.6 55.3 71.9 67.4 84.6
25–29 years
Non-Mäori non-Pacific 133.3 144.5 139.4 120.7 53.6 58.2 49.8 38.7
Mäori 253.4 266.3 251.9 284.1 170.3 154.8 153.0 124.5
Pacific 167.1 211.6 208.5 181.8 108.1 126.1 73.8 172.8
30–34 years
Non-Mäori non-Pacific 125.6 131.6 124.1 101.5 69.9 64.9 60.0 51.7
Mäori 354.8 357.8 327.6 327.1 279.1 203.3 220.9 188.8
Pacific 267.9 200.5 285.7 242.2 222.6 157.7 98.2 169.0
35–39 years
Non-Mäori non-Pacific 158.1 140.7 149.9 129.2 96.8 91.2 83.5 62.6
Mäori 544.4 588.8 520.4 489.4 394.2 383.1 378.5 310.3
Pacific 547.7 531.9 350.4 364.6 178.9 278.9 287.8 335.9
40–44 years
Non-Mäori non-Pacific 245.7 222.2 189.3 163.0 172.4 146.8 127.1 109.0
Mäori 1040.1 908.7 905.8 812.0 759.0 722.0 692.0 588.3
Pacific 766.2 605.5 561.8 662.8 492.6 532.7 483.0 423.2
45–49 years
Non-Mäori non-Pacific 416.8 365.7 322.2 237.3 286.0 249.6 226.0 173.4
Mäori 1511.2 1547.5 1477.5 1546.8 1119.0 991.8 1170.8 942.2
Pacific 1142.7 1467.7 1025.6 1205.4 906.2 744.7 736.6 717.7
50–54 years
Non-Mäori non-Pacific 680.3 656.9 548.4 432.3 427.6 421.0 385.0 311.9
Mäori 2647.2 2423.8 2403.0 2134.8 1708.6 1837.5 1886.0 1544.7
Pacific 2334.0 1993.8 1735.0 1841.4 810.6 779.3 912.6 1275.6
55–59 years
Non-Mäori non-Pacific 1264.9 1049.4 899.5 763.5 694.5 613.2 573.2 487.4
Mäori 3838.7 3966.1 3824.3 3753.9 2679.4 2894.8 2792.3 2538.2
Pacific 2869.5 3150.4 2454.0 2672.5 2127.4 2425.0 1467.8 1460.6
60–64 years
Non-Mäori non-Pacific 2145.3 1885.2 1482.5 1268.2 1089.4 1008.3 875.4 774.9
Mäori 5515.6 5312.3 5506.9 5322.8 4242.0 4155.1 4044.4 3863.9
Pacific 5293.2 5309.4 4891.6 4959.1 3044.4 2429.3 2395.2 2560.9
65–69 years
Non-Mäori non-Pacific 3378.8 3165.1 2670.0 2078.9 1821.1 1657.9 1423.4 1216.5
Mäori 7967.1 7605.1 7955.2 7269.2 5610.3 4960.4 5244.6 5518.1
Pacific 7652.3 8805.3 6554.9 7405.4 3302.6 5326.6 3982.5 4091.1
70–74 years
Non-Mäori non-Pacific 5475.0 4996.2 4508.5 3681.1 3032.7 2808.8 2500.1 2021.5

120 Decades of Disparity: Ethnic Mortality Trends in New Zealand 1980–1999
Table 52: Age-specific mortality rates, by gender (five-year age groups) – sole series
Males Females Age group
Sole ethnic group
1980–84 1985–89 1990–95 1996–99 1980–84 1985–89 1990–95 1996–99
Mäori 101.8 94.2 84.0 104.4 82.6 68.3 54.9 72.5
Pacific 111.7 84.7 111.2 44.0 71.5 89.7 51.8 38.3
1–4 years
Non-Mäori non-Pacific 69.1 61.6 45.5 36.0 49.3 45.3 34.6 29.5
Mäori 52.5 47.9 38.1 39.1 26.2 16.6 34.0 23.3
Pacific 39.7 44.6 43.4 13.8 78.0 29.7 29.7 17.9
5–9 years
Non-Mäori non-Pacific 30.5 27.4 21.1 19.1 20.2 24.8 17.0 11.9
Mäori 44.8 56.2 55.3 75.6 44.6 32.4 26.7 62.7
Pacific 34.2 51.0 37.0 29.1 50.1 33.4 38.2 34.3
10–14 years
Non-Mäori non-Pacific 32.0 33.0 26.6 21.3 20.7 20.8 15.3 19.0
Mäori 200.2 206.6 194.2 223.0 98.5 75.1 77.6 121.9
Pacific 163.4 99.3 102.6 126.7 50.7 65.6 64.6 62.4
15–19 years
Non-Mäori non-Pacific 121.3 145.2 110.3 99.8 52.1 53.3 45.9 52.2
Mäori 235.0 239.4 287.2 239.4 105.4 110.1 77.8 83.3
Pacific 162.1 257.2 169.6 206.4 107.1 91.9 58.0 39.4
20–24 years
Non-Mäori non-Pacific 173.7 178.6 174.8 121.3 65.8 56.1 56.2 40.3
Mäori 269.5 254.3 250.2 309.1 116.8 96.4 92.1 115.1
Pacific 77.3 159.4 124.9 204.1 53.9 66.9 70.2 74.3
25–29 years
Non-Mäori non-Pacific 134.2 147.6 140.6 130.1 54.0 59.1 49.7 43.3
Mäori 285.5 280.0 269.2 322.5 189.9 165.2 167.3 146.8
Pacific 165.0 197.6 214.2 171.4 106.7 118.0 76.6 147.7
30–34 years
Non-Mäori non-Pacific 127.4 134.6 125.3 110.6 70.8 66.2 60.2 56.9
Mäori 392.9 391.6 363.8 357.6 305.7 223.9 252.2 217.2
Pacific 267.4 195.4 300.4 218.3 220.7 155.6 103.2 165.3
35–39 years
Non-Mäori non-Pacific 160.1 143.2 150.3 142.0 98.0 92.6 83.5 68.2
Mäori 569.8 632.0 576.0 550.9 426.2 413.9 429.1 356.2
Pacific 534.6 533.2 362.4 369.9 176.9 283.2 298.7 330.1
40–44 years
Non-Mäori non-Pacific 248.3 225.4 190.3 176.1 174.0 148.6 127.4 118.0
Mäori 1096.8 965.3 973.6 948.2 805.3 770.5 752.9 728.0
Pacific 729.8 605.5 570.8 679.9 473.6 544.1 501.4 446.2
45–49 years
Non-Mäori non-Pacific 420.3 368.9 324.9 251.7 288.2 251.4 227.4 181.2
Mäori 1613.0 1640.3 1564.6 1790.9 1227.3 1060.1 1263.4 1142.0
Pacific 1081.7 1486.0 1039.1 1197.9 866.2 765.9 756.9 763.3
50–54 years
Non-Mäori non-Pacific 687.5 662.4 552.5 455.6 430.9 423.9 387.0 323.0
Mäori 2924.1 2605.8 2529.0 2525.6 1890.6 2014.0 2029.4 1904.2
Pacific 2205.7 2070.9 1766.7 1910.8 763.2 825.0 940.7 1333.8
55–59 years
Non-Mäori non-Pacific 1275.1 1056.0 905.7 784.6 699.9 615.6 575.7 498.1
Mäori 4219.2 4281.0 3981.9 4233.5 2931.0 3131.1 2981.7 2968.4
Pacific 2679.4 3316.8 2527.1 2729.7 2018.9 2533.8 1493.1 1538.9
60–64 years
Non-Mäori non-Pacific 2160.1 1895.5 1493.3 1303.9 1097.4 1013.6 880.2 793.9
Mäori 5951.7 5585.5 5782.9 5945.4 4589.7 4342.7 4238.7 4468.4
Pacific 4957.5 5157.7 4925.0 5226.7 2887.1 2537.3 2468.9 2560.2
65–69 years
Non-Mäori non-Pacific 3389.8 3176.7 2679.9 2119.2 1828.7 1664.2 1428.2 1240.0
Mäori 8696.3 8039.8 8254.2 8828.6 6334.1 5164.5 5402.0 6400.2
Pacific 7460.1 8840.1 6676.5 7650.3 3130.6 5467.7 4122.8 4490.3
70–74 years
Non-Mäori non-Pacific 5481.0 5005.4 4519.8 3715.0 3038.6 2815.4 2506.7 2041.7