dec science panel 2010 sre summary part ii 6/9/2010 on other vessel (seven seas mariner) dec science...
TRANSCRIPT
DEC Science Panel 2010 SRE Summary Part II 6/9/2010
1
F S i P lFor Science Panel
ADEC 2010
Source Reduction Evaluation (SRE) Reporting
General:
This part will discuss the SRE reporting results, items and ADEC’s review findings.
All i S i d ( l b l) i S All items are Summarized (global) in Summary Document.
Review of the SRE reporting was done by ADEC CPVEC staff.
Presentation includes SRE Reporting by operator / vessels.
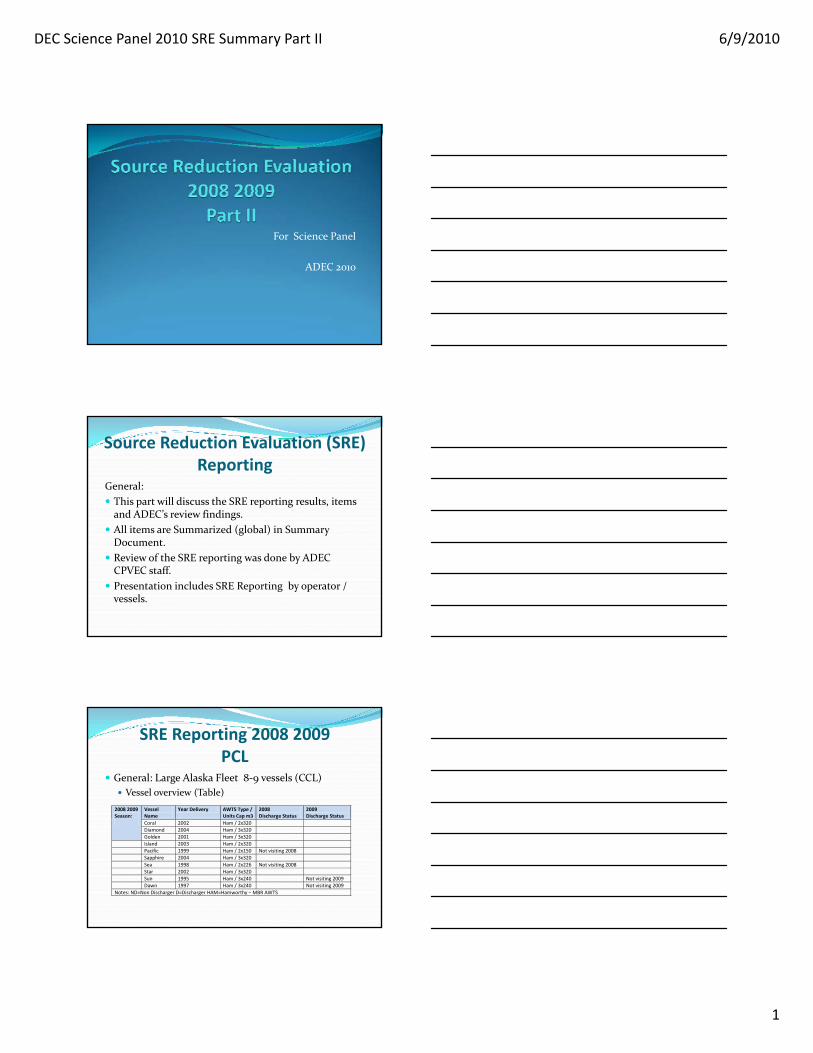
SRE Reporting 2008 2009PCL
General: Large Alaska Fleet 8‐9 vessels (CCL)
Vessel overview (Table)
2008 2009 Season:
Vessel Name
Year Delivery AWTS Type / Units Cap m3
2008 Discharge Status
2009 Discharge Status
p g g
Coral 2002 Ham / 2x320
Diamond 2004 Ham / 3x320
Golden 2001 Ham / 3x320
Island 2003 Ham / 2x320
Pacific 1999 Ham / 2x150 Not visiting 2008
Sapphire 2004 Ham / 3x320
Sea 1998 Ham / 2x226 Not visiting 2008
Star 2002 Ham / 3x320
Sun 1995 Ham / 3x240 Not visiting 2009
Dawn 1997 Ham / 3x240 Not visiting 2009
Notes: ND=Non Discharger D=Discharger HAM=Hamworthy – MBR AWTS

DEC Science Panel 2010 SRE Summary Part II 6/9/2010
2
Princess WW Sampling
Treatment System Type: Hamworthy
Note: Sample data does not include samples where there was a known malfunction in the treatment system. This was only two samples.
Ammonia Copper Nickel Zinc
Median 53 15.0 9.2 120.0
Average 57.9 25.3 13.9 131.7
Max 160 160 420 450
Min 0.1 0.25 2.92 18
95th Percentile 120 87.385 23.75 273.5
99th Percentile 145.6 134.35 68.9 404.8
SRE Reporting 2008 2009PCL [continued]
I (a) Source Water Evaluation:
General discussions
Bunker water / Evaporator Water
B k d d V l P Bunker water produced water Volumes Percentages (Table)
Evaporation systems identified
Identification Langlier Index potable water (corrosiveness)
Piping materials shore connections tanks not given for all vessels
PCL Water Sources
Vessel Evaporator Water % Bunkered Water % CommentsCoral 72 28
Diamond 53 47
Golden 70 30
Island 71 29
Pacific 65 35
Sapphire 53 47
Sea 78 22
Star 68 32
Sun Not visiting in 2009
Dawn Not visiting in 2009

DEC Science Panel 2010 SRE Summary Part II 6/9/2010
3
SRE Reporting 2008 2009PCL [continued]
Chemical use Evaporators (Vap treat )
Carry over of metals in Evaporator from bio fouling system not identified.
Tank coatings Tank coatings
Source sampling performed (Table)
Indentified soft water and causes (piping), including potential treatment (water balance).
Strategic Bunkering OR findings
SRE Reporting 2008 2009Vessel Source Location Results* ug/L
Remarks
Cu Ni
Zn
Star Princess
[6/17/08] Potable Water Pot Water Tk (8&9) 15.3 1.74 17.8
Tap Bridge Pantry 14 19.5 1.87 26.9
Cabin 10 FWD (hot) 52.3 8.27 33.5
Cabin 8 FWD STB (hot) 56.3 8.2 34.9
Cabin Deck 11 Mid ship 44.7 2.21 33.7
Cabin Deck 4 Port 41.6 1.85 40.0
Tap Crew Galley 5 Aft (hot) 26.3 10.4 25.2 Tap Crew Galley 5 Aft (hot) 26.3 10.4 25.2
[6/18/08] Treated WW Des. OB Dis Sample Port 59.2 13.6 123
WW Alt. OB Dis Sample Port 116 258 183
BW influent Influent MBR BW Evac 4 17 8.58 115
GW influent Influent MBR GW buffer Tk 22.5 7.64 94.6
Potable Water Pot Water Tk (11&12) 17.6 1.48 18
[6/20/08] Evaporator 1 49.7 3.13 15.4
Evaporator 3 42.5 1.04 51.8
[6/23/08] Evaporator 2 50.3 1 28.1
[6/25/08] Treated WW Des. OB Dis Sample Port 55.5 15.7 119
Golden Princess
[6/7/09] Evaporators 49 2.3 60
^The sample flow from the Evaporators combined, separate samples per evaporator are not made.
SRE Reporting 2008 2009PCL [continued]
I (b) Chemical Use / Process Evaluation
Identification cleaning products
Use of Hepburn Bio products in toilet care etc.
R i H l d Review Hotel procedures
Chemical substitutions made (leaching potential)
Drain pipe cleaners (anti scaling chemicals ) usage not identified.
DEC Science Panel 2010 SRE Summary Part II 6/9/2010
4
SRE Reporting 2008 2009PCL [continued]
I (c) Water Supply Evaluation ACA study
PCL performed bunker water sampling
Summary Table Selected sample results (See ACA results Summary Table Selected sample results (See ACA results Table)
II Treatment Technology Evaluation / Implementation
Princess Fleet has only Hamworthy AWTS systems installed
GW from galleys and laundry is generally not treated and is stored in holding tanks.
SRE Reporting 2008 2009PCL [continued]
Ammonia is a “structural” problem for PCL Hamworthy systems.
Bio Care product are used to create better pre‐treatment of the organic waste stream (pipe system)
Ammo 100 product usage to convert ammonia to nitrate p g(dosage in the aeration chamber)
Nutrient dosage, foam fighters in EVAC tanks were used Golden Princess selected to do Pilot project
“Ammonia Removal Trail” (SRE Report Exhibit 4, April 14 2009) MBR 3 changes (1st stage) conversion Anoxic Tank, 2nd stage will
serve as an aerobic tank. TK 5 used as mixing tank. (nitrification improvement)
Control system installed (Tank 5, Ammonia meter, dosage, level) Waste water characterization: Laundry water and Sanitary GW have
low levels ammonia.
SRE Reporting 2008 2009PCL [continued]
GW effectively dilutes BW ammonia loading
In 2009 was reported that Phase 1 was completed
Nitrification was not further improved by lower capacity
Higher DOg
Suggestions from Hamworthy:
Dedicate one MBR unit for BW
Increase BW GW ratio (1:3)
BW GW ratio was not clearly identified earlier was 1:2 identified.
Hamworthy on other vessel (Seven Seas Mariner)
DEC Science Panel 2010 SRE Summary Part II 6/9/2010
5
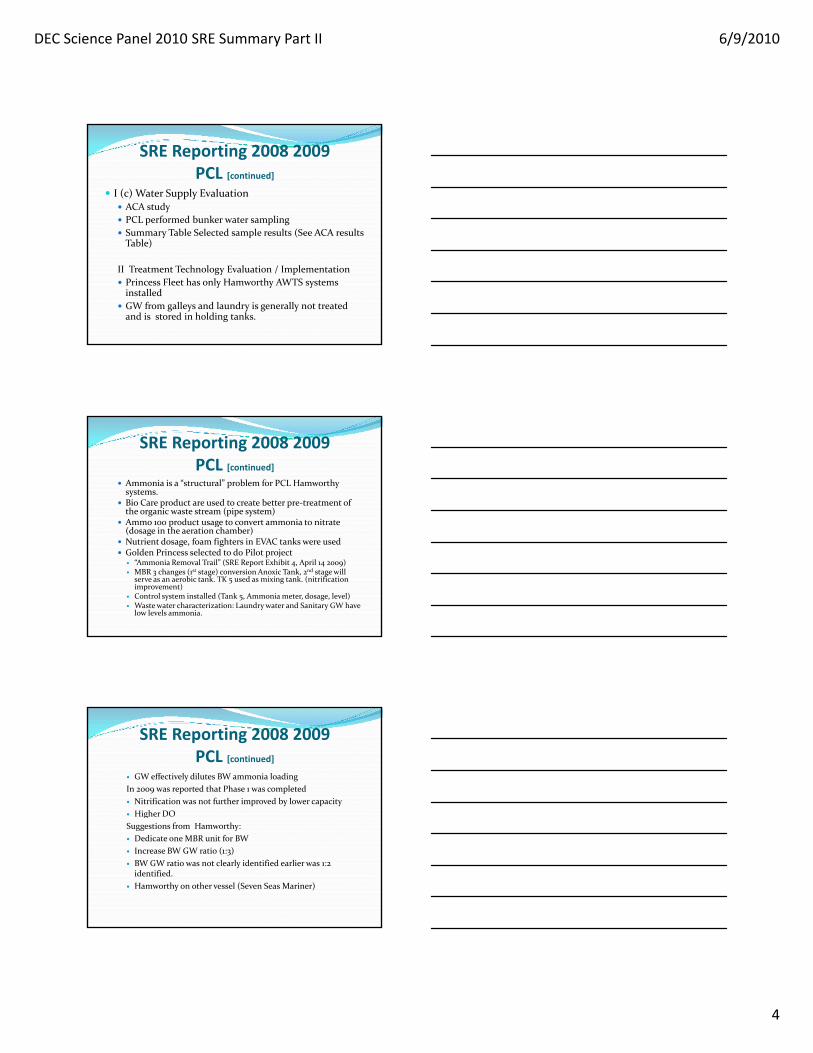
SRE Reporting 2008 2009PCL [continued]
Sample Result Trends 2008 2009
131.4136.5
120.0
140.0
160.0
49.5 52.0
69.0
19.724.9 25.1
9.1 10.8
18.3
86.9
0.0
20.0
40.0
60.0
80.0
100.0
2007 2008 2009
Ammonia
Copper
Nickel
Zinc
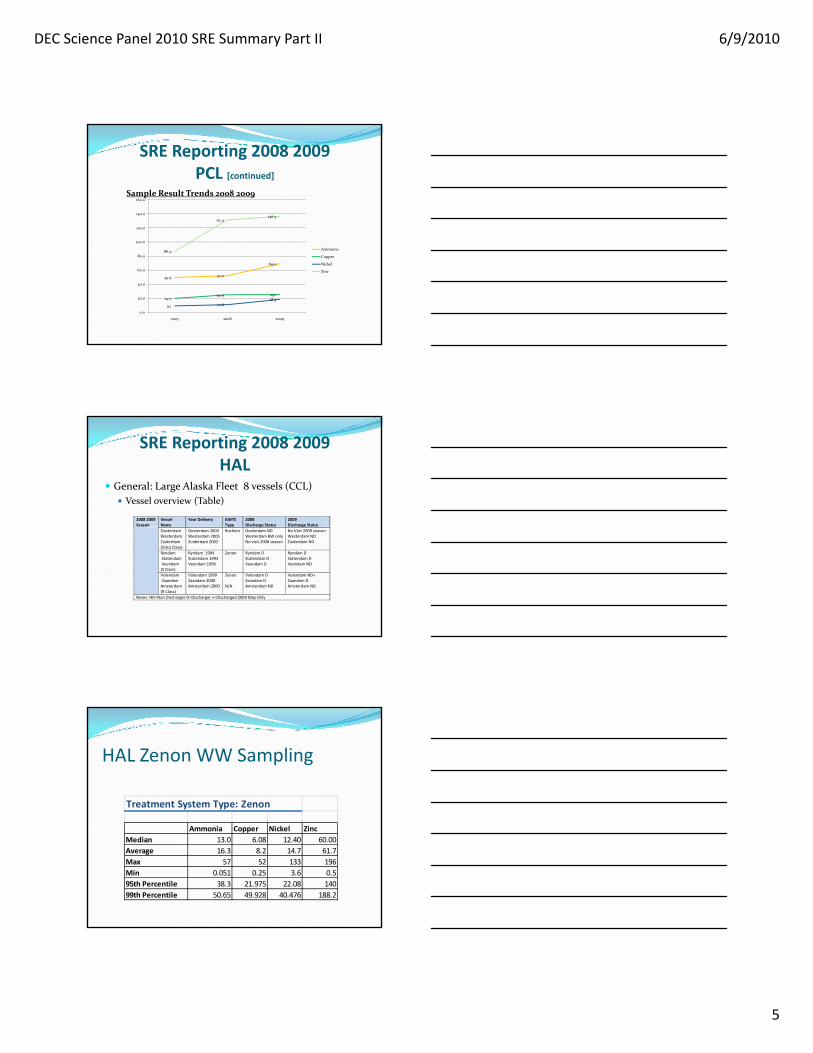
SRE Reporting 2008 2009HAL
General: Large Alaska Fleet 8 vessels (CCL)
Vessel overview (Table)
2008 2009 Season:
Vessel Name
Year Delivery AWTS Type
2008 Discharge Status
2009 Discharge StatusSeason:
Name Type Discharge Status Discharge Status
Oosterdam Westerdam Zuiderdam (Vista Class)
Oosterdam 2003 Westerdam 2005 Zuiderdam 2002
Rochem Oosterdam ND Westerdam BW only No visit 2008 season
No Visit 2009 season Westerdam ND Zuiderdam ND
Ryndam Statendam Veendam (S Class)
Ryndam 1994 Statendam 1993 Veendam 1996
Zenon Ryndam D Statendam D Veendam D
Ryndam D Statendam D Veendam ND
Volendam Zaandam Amsterdam (R Class)
Volendam 1999 Zaandam 2000 Amsterdam 2000
Zenon N/A
Volendam D Zaandam D Amsterdam ND
Volendam ND+ Zaandam D Amsterdam ND
Notes: ND=Non Discharger D=Discharger +=Discharged 2009 May Only
HAL Zenon WW Sampling
Treatment System Type: Zenon
Ammonia Copper Nickel Zinc
Median 13.0 6.08 12.40 60.00
Average 16.3 8.2 14.7 61.7
Max 57 52 133 196
Min 0.051 0.25 3.6 0.5
95th Percentile 38.3 21.975 22.08 140
99th Percentile 50.65 49.928 40.476 188.2
DEC Science Panel 2010 SRE Summary Part II 6/9/2010
6
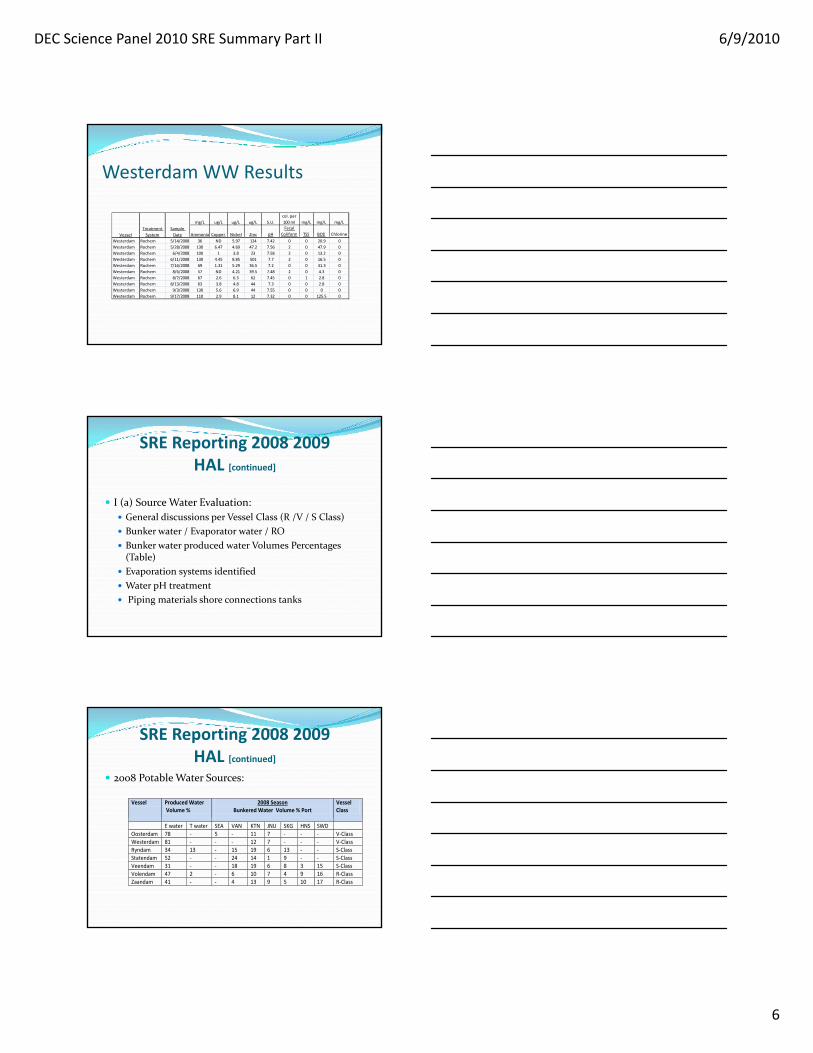
WesterdamWW Results
mg/L ug/L ug/L ug/L S.U.
col. per
100 ml mg/L mg/L mg/L
Ammonia Copper Nickel Zinc pH
Fecal
Coliform TSS BOD ChlorineVessel
Treatment
System
Sample
Date Ammonia Copper Nickel Zinc pH Coliform TSS BOD Chlorine
Westerdam Rochem 5/14/2008 36 ND 5.97 124 7.42 0 0 20.9 0
Westerdam Rochem 5/28/2008 130 6.47 4.69 47.2 7.56 2 0 47.9 0
Westerdam Rochem 6/4/2008 100 1 3.8 23 7.58 2 0 13.2 0
Westerdam Rochem 6/11/2008 130 4.45 8.85 501 7.7 2 0 16.5 0
Westerdam Rochem 7/16/2008 69 1.31 5.29 36.5 7.2 0 0 41.3 0
Westerdam Rochem 8/6/2008 57 ND 4.21 39.5 7.48 2 0 4.3 0
Westerdam Rochem 8/7/2008 67 2.6 6.3 62 7.45 0 1 2.8 0
Westerdam Rochem 8/13/2008 63 3.8 4.8 44 7.3 0 0 2.8 0
Westerdam Rochem 9/3/2008 130 5.6 6.9 44 7.55 0 0 0 0
Westerdam Rochem 9/17/2008 110 2.9 8.1 12 7.32 0 0 125.5 0
Vessel System Date
SRE Reporting 2008 2009HAL [continued]
I (a) Source Water Evaluation:
General discussions per Vessel Class (R /V / S Class)
Bunker water / Evaporator water / RO
Bunker water produced water Volumes Percentages (Table)
Evaporation systems identified
Water pH treatment
Piping materials shore connections tanks
SRE Reporting 2008 2009HAL [continued]
2008 Potable Water Sources:
Vessel Produced Water Volume %
2008 Season Bunkered Water Volume % Port
VesselClass
E water T water SEA VAN KTN JNU SKG HNS SWD
Oosterdam 78 ‐ 5 ‐ 11 7 ‐ ‐ ‐ V‐Class
Westerdam 81 ‐ ‐ ‐ 12 7 ‐ ‐ ‐ V‐Class
Ryndam 34 13 ‐ 15 19 6 13 ‐ ‐ S‐Class
Statendam 52 ‐ ‐ 24 14 1 9 ‐ ‐ S‐Class
Veendam 31 ‐ ‐ 18 19 6 8 3 15 S‐Class
Volendam 47 2 ‐ 6 10 7 4 9 16 R‐Class
Zaandam 41 ‐ ‐ 4 13 9 5 10 17 R‐Class
DEC Science Panel 2010 SRE Summary Part II 6/9/2010
7
SRE Reporting 2008 2009HAL [continued]
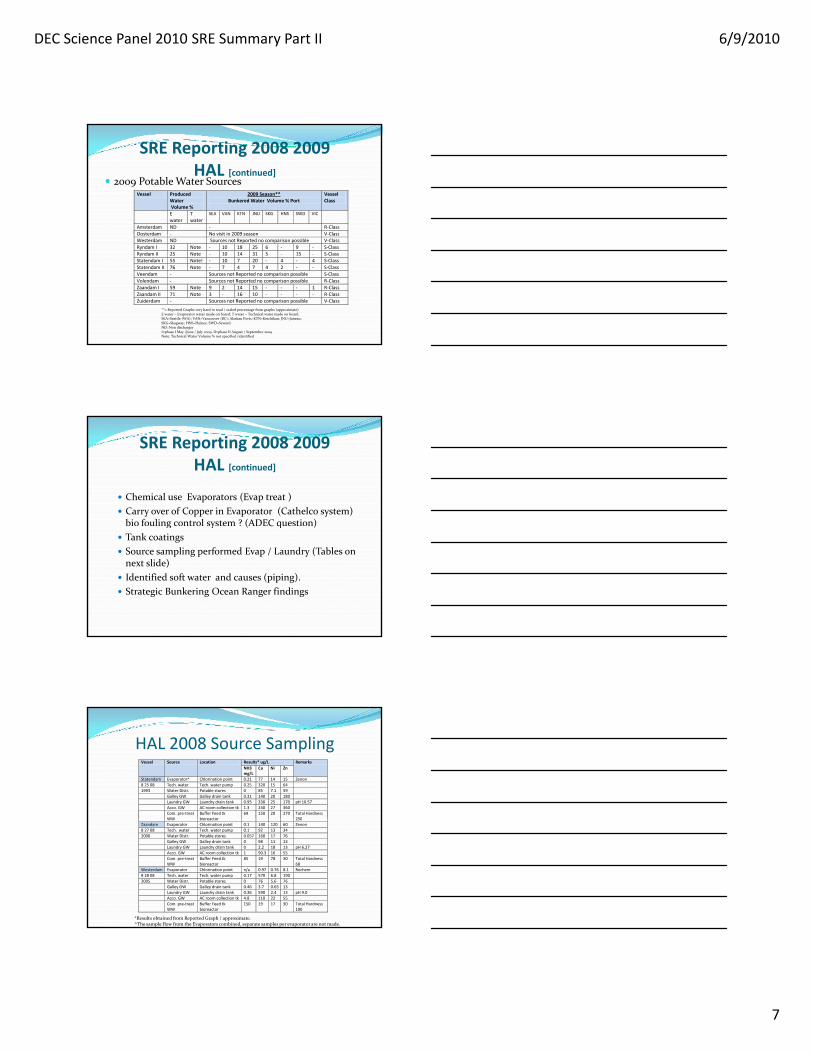
2009 Potable Water SourcesVessel Produced
Water Volume %
2009 Season** Bunkered Water Volume % Port
VesselClass
E water
T water
SEA VAN KTN JNU SKG HNS SWD VIC
Amsterdam ND ‐ R‐Class
Oosterdam ‐ No visit in 2009 season V‐ClassOosterdam No visit in 2009 season V Class
Westerdam ND Sources not Reported no comparison possible V‐Class
Ryndam I 32 Note ‐ 10 18 25 6 ‐ 9 ‐ S‐Class
Ryndam II 25 Note ‐ 10 14 31 5 ‐ 15 ‐ S‐Class
Statendam I 55 Note! ‐ 10 7 20 ‐ 4 ‐ 4 S‐Class
Statendam II 76 Note ‐ 7 4 7 4 2 ‐ ‐ S‐Class
Veendam ‐ Sources not Reported no comparison possible S‐Class
Volendam ‐ Sources not Reported no comparison possible R‐Class
Zaandam I 59 Note 9 2 14 15 ‐ ‐ ‐ 1 R‐Class
Zaandam II 71 Note 3 ‐ 16 10 ‐ ‐ ‐ ‐ R‐Class
Zuiderdam ‐ Sources not Reported no comparison possible V‐Class
**= Reported Graphs very hard to read / scaled percentage from graphs (approximate)E water = Evaporator water made on board; T water = Technical water made on board.SEA=Seattle (WA); VAN=Vancouver (BC); Alaskan Ports: KTN=Ketchikan; JNU=Juneau; SKG=Skagway; HNS=Haines; SWD=Seward.ND=Non dischargerI=phase I May /June / July 2009. II=phase II August / September 2009Note: Technical Water Volume % not specified /identified
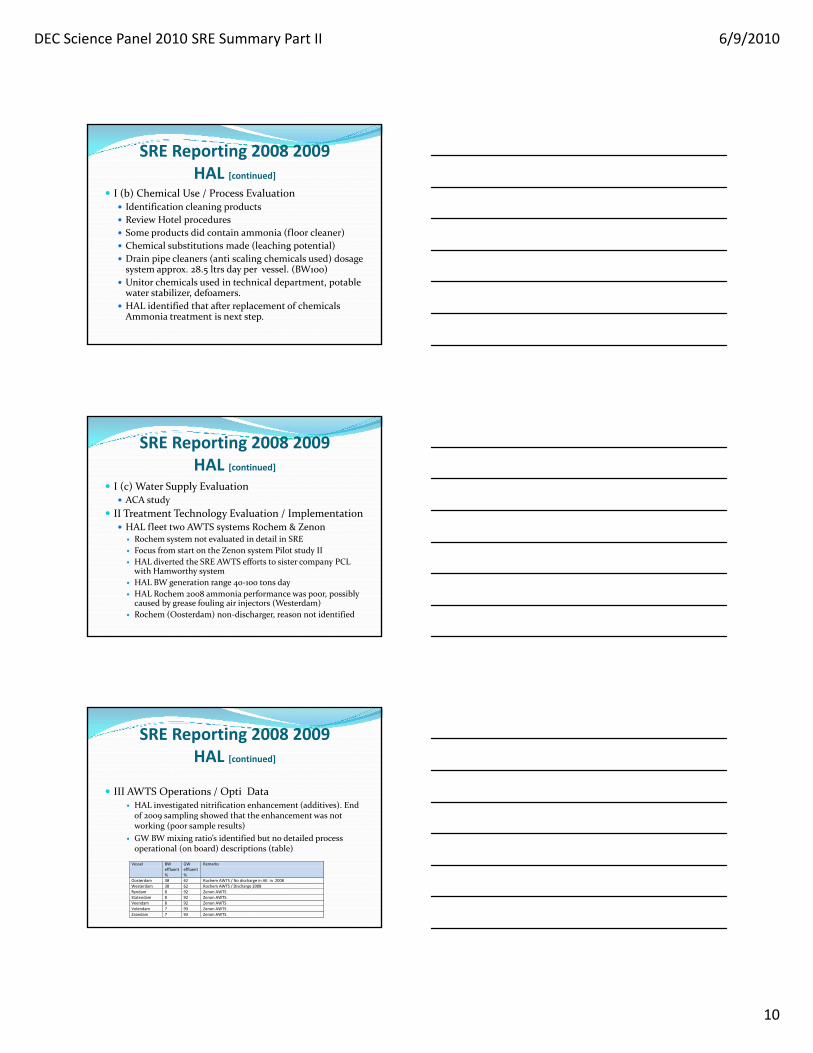
SRE Reporting 2008 2009HAL [continued]
Chemical use Evaporators (Evap treat )
Carry over of Copper in Evaporator (Cathelco system) bio fouling control system ? (ADEC question)g y ( C q )
Tank coatings
Source sampling performed Evap / Laundry (Tables on next slide)
Identified soft water and causes (piping).
Strategic Bunkering Ocean Ranger findings
HAL 2008 Source SamplingVessel Source Location Results* ug/L Remarks
NH3 mg/L
Cu Ni
Zn
Statendam Evaporator^ Chlorination point 0.21 77 14 15 Zenon
8 25 08 Tech. water Tech. water pump 0.25 320 15 64
1993 Water Distr. Potable stores 0 85 7.1 59
Galley GW Galley drain tank 0.31 140 20 180
Laundry GW Laundry drain tank 0.95 330 25 170 pH 10.57
Acco. GW AC room collection tk 1.3 240 27 360
Com. pre‐treat WW
Buffer Feed tk bi t
69 150 20 270 Total Hardness 250WW bioreactor 250
Zaandam Evaporator Chlorination point 0.1 140 120 60 Zenon
8 27 08 Tech. water Tech. water pump 0.1 92 13 34
2000 Water Distr. Potable stores 0.057 160 17 76
Galley GW Galley drain tank 0 98 11 13
Laundry GW Laundry drain tank 0 2.2 18 13 pH 6.27
Acco. GW AC room collection tk 1 90.3 16 55
Com. pre‐treat WW
Buffer Feed tk bioreactor
85 19 78 30 Total Hardness 68
Westerdam Evaporator Chlorination point n/a 0.97 0.76 8.1 Rochem
8 28 08 Tech. water Tech. water pump 0.17 570 6.8 190
2005 Water Distr. Potable stores 0 76 5.6 76
Galley GW Galley drain tank 0.46 3.7 0.65 13
Laundry GW Laundry drain tank 0.36 590 2.4 13 pH 9.0
Acco. GW AC room collection tk 4.8 110 22 55
Com. pre‐treat WW
Buffer Feed tk bioreactor
150 19 17 30 Total Hardness 100
*Results obtained from Reported Graph / approximate.^The sample flow from the Evaporators combined, separate samples per evaporator are not made.

DEC Science Panel 2010 SRE Summary Part II 6/9/2010
8
SRE Reporting 2008 2009HAL [continued]
Statendam 2008 Sample Results
Ammonia Copper Nickel Zinc
Statendam S‐Class Zenon 6/23/2008 13 ND 13 1.7
Statendam S‐Class Zenon 6/30/2008 4.8 ND 6.01 3.1
Statendam S‐Class Zenon 7/14/2008 24 ND 14.3 4.75
Statendam S‐Class Zenon 7/28/2008 16 1.12 13.9 5.96
Statendam S‐Class Zenon 8/11/2008 10 ND 17 2.2
Statendam S‐Class Zenon 8/18/2008 11 1.5 15 5.3
Statendam S‐Class Zenon 9/1/2008 27 3.2 14 7
Statendam S‐Class Zenon 9/8/2008 10 2.6 17 4.8
SRE Reporting 2008 2009HAL [continued]
Zaandam 2008 Sample Results
Ammonia Copper Nickel Zinc
Zaandam R‐Class Zenon 5/14/2008 2.4 52 11.8 99.5
Zaandam R‐Class Zenon 5/22/2008 12 6.93 9.4 103
Zaandam R‐Class Zenon 6/5/2008 18 6.16 12.4 108
Zaandam R‐Class Zenon 6/11/2008 2.2 5.1 6.7 97
Zaandam R‐Class Zenon 6/19/2008 11 3.49 11.3 30.5
Zaandam R‐Class Zenon 7/9/2008 5.9 7.81 10.1 51.5
Zaandam R‐Class Zenon 7/17/2008 12 8.28 12 59.7
Zaandam R‐Class Zenon 8/14/2008 19 6.4 10 60
Zaandam R‐Class Zenon 8/15/2008 24 6.2 8.6 68
Zaandam R‐Class Zenon 8/28/2008 11 6.6 8.4 58
Zaandam R‐Class Zenon 9/3/2008 1.7 11 9.8 61
Zaandam R‐Class Zenon 9/11/2008 6.4 3.8 6 3.2
SRE Reporting 2008 2009HAL [continued]
Westerdam 2008 Sample Results
Ammonia Copper Nickel Zinc
Westerdam Vista Rochem 5/14/2008 36 ND 5.97 124
Westerdam Vista Rochem 5/28/2008 130 6 47 4 69 47 2Westerdam Vista Rochem 5/28/2008 130 6.47 4.69 47.2
Westerdam Vista Rochem 6/4/2008 100 1 3.8 23
Westerdam Vista Rochem 6/11/2008 130 4.45 8.85 501
Westerdam Vista Rochem 7/16/2008 69 1.31 5.29 36.5
Westerdam Vista Rochem 8/6/2008 57 ND 4.21 39.5
Westerdam Vista Rochem 8/7/2008 67 2.6 6.3 62
Westerdam Vista Rochem 8/13/2008 63 3.8 4.8 44
Westerdam Vista Rochem 9/3/2008 130 5.6 6.9 44
Westerdam Vista Rochem 9/17/2008 110 2.9 8.1 12

DEC Science Panel 2010 SRE Summary Part II 6/9/2010
9
SRE Reporting 2008 2009HAL Laundry Samples
Vessel / sample date
2009 Results ug/L*
Laundry Supply Laundry Drain Tk Increment
Copper Cu
Westerdam
6 17 09 120 240 120
6 24 09 60 140 80
7 8 09 60 125 65
7 15 09 60 125 65
Vessel / sample date
2009 Results ug/L*
Laundry Supply Laundry Drain Tk Increment
Nickel Ni
Westerdam
6 17 09 14 23 9
6 24 09 6 8 2
7 8 09 6 Missing data point N/A
7 15 09 4 9 57 15 09 60 125 65
8 5 09 110 160 50
8 26 09 90 120 30
9 2 09 210 290 80
9 16 10 100 150 50
Ryndam
6 23 09 65 140 75
6 30 09 50 95 45
7 7 09 60 150 90
7 21 09 60 365 305
8 4 09 60 125 65
8 11 09 48 105 57
9 1 09 20 60 40
9 8 09 70 140 70
7 15 09 4 9 5
8 5 09 5 7.5 2.5
8 26 09 5 5 0
9 2 09 9 11 2
9 16 10 4 7 3
Ryndam
6 23 09 20 26 5
6 30 09 15 Missing data point N/A
7 7 09 10 15 5
7 21 09 12.5 17.5 5
8 4 09 12.5 19 6.5
8 11 09 12.5 18 5.5
9 1 09 13 17 4
9 8 09 16 19 3
*Results obtained from 2009 Reported Graph / approximate. Graph not clear / Data value interpretation may not correct. No raw sample data provided by HAL.
SRE Reporting 2008 2009HAL Laundry Samples
Vessel / sample date
2009 Results ug/L*
Laundry Supply Laundry Drain Tk Increment Comments
Zinc Zn
Westerdam
6 17 09 240 260 30
6 24 09 60 90 30
7 8 09 50 70 20
7 15 09 80 95 157 15 09 80 95 15
8 5 09 60 90 30
8 26 09 75 90 15
9 2 09 100 180 80
9 16 10 60 120 60
Ryndam
6 23 09 60 70 10
6 30 09 40 110 70
7 7 09 25 85 60
7 21 09 85 260 175
8 4 09 40 110 70
8 11 09 40 150 110
9 1 09 45 Missing Data Point N/A
9 8 09 75 200 125
*Results obtained from 2009 Reported Graph / approximate. Graph not clear / Data value interpretation may not correct. No raw sample data provided by HAL.
SRE Reporting 2008 2009HAL Laundry Ozonator
Vessel / sample date
2009 Results ug/L*
Laundry Supply Laundry Drain Tk Change Comments
Ryndam
12 27 09 Cu 2910 1480 ‐1480
Ni 948 34 ‐914
Zn 3700 246 ‐3454
1 3 10 Cu 1180 1600 420
Ni 36 23 13
Zn 79 167 88
*Results obtained from 2009 Reported Graph / approximate. Graph not clear / Data value interpretation may not correct. No raw sample data provided by HAL.
DEC Science Panel 2010 SRE Summary Part II 6/9/2010
10
SRE Reporting 2008 2009HAL [continued]
I (b) Chemical Use / Process Evaluation Identification cleaning products
Review Hotel procedures
Some products did contain ammonia (floor cleaner)Some products did contain ammonia (floor cleaner)
Chemical substitutions made (leaching potential)
Drain pipe cleaners (anti scaling chemicals used) dosage system approx. 28.5 ltrs day per vessel. (BW100)
Unitor chemicals used in technical department, potable water stabilizer, defoamers.
HAL identified that after replacement of chemicals Ammonia treatment is next step.
SRE Reporting 2008 2009HAL [continued]
I (c) Water Supply Evaluation ACA study
II Treatment Technology Evaluation / Implementation HAL fleet two AWTS systems Rochem & Zenon HAL fleet two AWTS systems Rochem & Zenon
Rochem system not evaluated in detail in SRE
Focus from start on the Zenon system Pilot study II
HAL diverted the SRE AWTS efforts to sister company PCL with Hamworthy system
HAL BW generation range 40‐100 tons day
HAL Rochem 2008 ammonia performance was poor, possibly caused by grease fouling air injectors (Westerdam)
Rochem (Oosterdam) non‐discharger, reason not identified
SRE Reporting 2008 2009HAL [continued]
III AWTS Operations / Opti Data HAL investigated nitrification enhancement (additives). End of 2009 sampling showed that the enhancement was not of 2009 sampling showed that the enhancement was not working (poor sample results)
GW BW mixing ratio’s identified but no detailed process operational (on board) descriptions (table)
Vessel BW effluent %
GW effluent %
Remarks
Oosterdam 38 62 Rochem AWTS / No discharge in AK in 2008
Westerdam 38 62 Rochem AWTS / Discharge 2008
Ryndam 8 92 Zenon AWTS Statendam 8 92 Zenon AWTS
Veendam 8 92 Zenon AWTS
Volendam 7 93 Zenon AWTS
Zaandam 7 93 Zenon AWTS
DEC Science Panel 2010 SRE Summary Part II 6/9/2010
11
80 0
100.0
120.0
HAL Zenon Averages 2004‐2009
0.0
20.0
40.0
60.0
80.0
2004 2005 2006 2007 2008 2009
Ammonia (mg)
Copper
Nickel
Zinc
SRE Reporting 2008 2009NCL
General: Alaska Fleet ‐ 3 vessels (NCL)
Vessel overview (Table)
2008 2009 Season: Vessel Name Year Delivery AWTS Type / Units Cap
m3
2008
Discharge Status
2009
Discharge Statusm3 Discharge Status Discharge Status
Norwegian Pearl 2006 Scanship / 1780 Yes Yes
Norwegian Star 2001 Scanship / 1400 Yes Yes
Norwegian Sun 2001 Scanship / 1440 Yes Yes
Notes: ND=Non Discharger D=Discharger
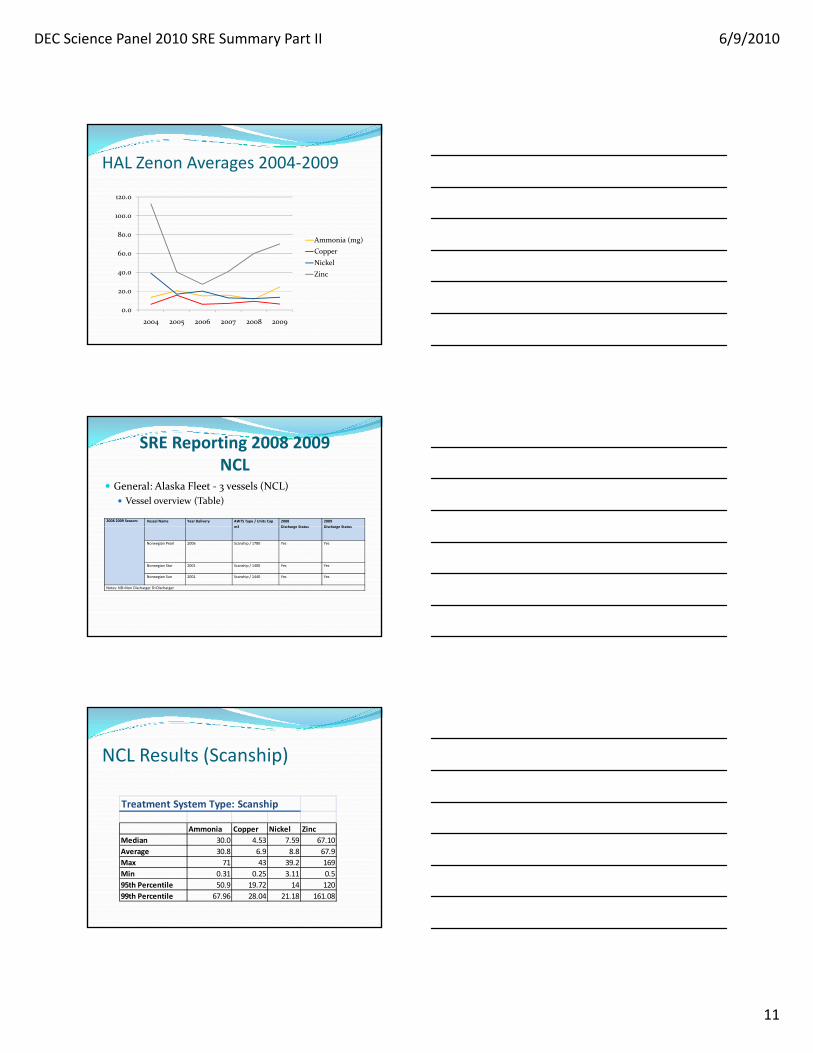
NCL Results (Scanship)
Treatment System Type: Scanship
Ammonia Copper Nickel Zinc
Median 30.0 4.53 7.59 67.10
Average 30.8 6.9 8.8 67.9
Max 71 43 39.2 169
Min 0.31 0.25 3.11 0.5
95th Percentile 50.9 19.72 14 120
99th Percentile 67.96 28.04 21.18 161.08
DEC Science Panel 2010 SRE Summary Part II 6/9/2010
12
SRE Reporting 2008 2009NCL [continued]
Generally concise, to the point reporting
I (a) Source Water Evaluation:
General discussions
Bunker water / Evaporator Water / RO
Potable water treated if needed.
Piping materials shore connections tanks not identified for all vessels
SRE Reporting 2008 2009NCL [continued]
Chemical use Evaporators (Evap treat )
Carry over of metals in Evaporator from bio fouling system not identified.
Tank coatings Tank coatings.
Source sampling performed (Table)
Indentified soft water and causes (piping), including potential treatment (water balance). NCL Sun poly butylenes piping / NCL Star copper piping.
Strategic Bunkering OR findings
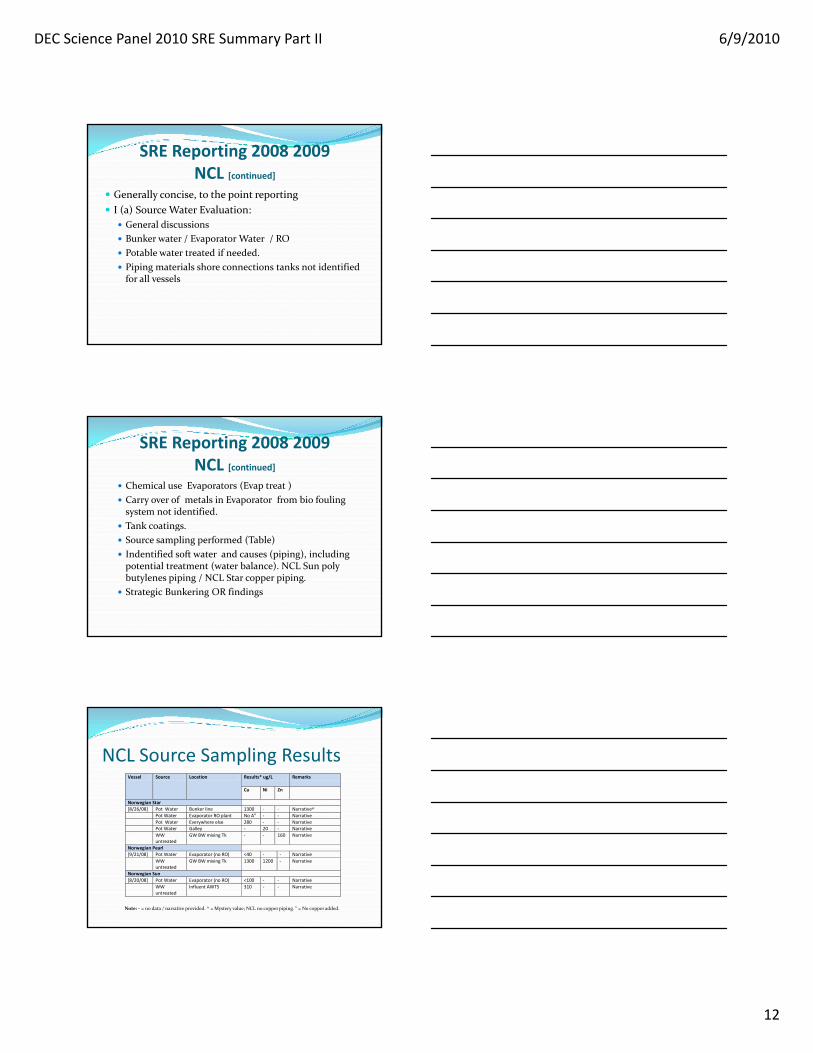
NCL Source Sampling ResultsVessel Source Location Results* ug/L
Remarks
Cu Ni
Zn
Norwegian Star
[8/26/08] Pot Water Bunker line 1300 ‐ ‐ Narrative^
Pot Water Evaporator RO plant No A” ‐ ‐ Narrative p p
Pot Water Everywhere else 280 ‐ ‐ Narrative
Pot Water Galley ‐ 20 ‐ Narrative
WW untreated
GW BW mixing Tk ‐ ‐ 160 Narrative
Norwegian Pearl
[9/21/08] Pot Water Evaporator (no RO) <40 ‐ ‐ Narrative
WW untreated
GW BW mixing Tk 1300 1200 ‐ Narrative
Norwegian Sun
[8/20/08] Pot Water Evaporator (no RO) <100 ‐ ‐ Narrative
WW untreated
Influent AWTS 310 ‐ ‐ Narrative
Note: ‐ = no data / narrative provided. ̂ = Mystery value; NCL no copper piping. “ = No copper added.

DEC Science Panel 2010 SRE Summary Part II 6/9/2010
13
SRE Reporting 2008 2009NCL [continued]
I (b) Chemical Use / Process Evaluation
Identification cleaning products
Use of Swisher Bio products in toilet care etc.
E l b d “ lk li b i ” l Ecolab products are on “alkaline basis” no metals.
Bio organic cleaners used as well
Review Hotel procedures
Chemical substitutions made (leaching potential)
Drain pipe cleaners (anti scaling chemicals ) usage (volume) not identified (Unitor brand).
EVAC de‐foamer used (ether alcohol).
SRE Reporting 2008 2009NCL [continued]
II Treatment Technology Evaluation / Implementation
NCL AWTS systems Scanship
NCL AWTS Scanship pioneer
Scanship system in detail evaluated in SRE Scanship system in detail evaluated in SRE
Focus from start was on Ammonia
SRE action plan from outset and focusing on results
NCL BW generation range 60‐100 tons day
NCL Scanship 2008 / 2009 ammonia performance
OR findings in 2008 2009 NCL appears very actively working on the AWTS systems.
SRE Reporting 2008 2009NCL [continued]
NCL provided actions plans and “worse case scenarios”
NCL provide confidential information
Phase I: Nor Pearl and Nor Star if AWTS modifications k h h l i l d dworks then other vessels included.
Bio reactor modifications
Coagulant smart use / organic type
Residence time
New bio media surfaces
Increase Oxygen ratio

DEC Science Panel 2010 SRE Summary Part II 6/9/2010
14
SRE Reporting 2008 2009NCL [continued]
Trends 2008 2009
112.5
100.0
120.0
29.8 31.0 31.827.1 27.4
34.9
2.16.3 4.4 3.6
5.99.1
6.9
14.5
9.66.7 7.4
9.8
82.5
42.8
80.3
66.363.0
0.0
20.0
40.0
60.0
80.0
2004 2005 2006 2007 2008 2009
Ammonia
Copper
Nickel
Zinc
SRE Reporting 2008 2009Seven Seas Mariner
General: 1 vessel
Detailed concise to the point SRE reporting
2008 2009 Season:
Vessel Name Year Delivery
AWTS Type / Units Cap m3
2008 Discharge Status
2009 Discharge Status
Seven Seas Mariner
2001 Hamworthy 240C 360 [2 x 180]
D D
Detailed concise to the point SRE reporting
1(a) Source Water Evaluation: General discussions
Bunker water / Evap water
Evap systems identified
Distribution system materials breakdown.
Vessel actively tracked metal sources and started replacement of piping.
Seven Seas Mariner piping
BW system Material GW system Material Potable water Material
Toilets/ urinals / hospital /drain sink
Stainless steel
Sink / drain / baths / shower /
Stainless steel
Distribution system
Copper
suite
Galley sink drains
Bunkering / engine spaces
Galvanized steel
Pulpers Technical water Galvanized steel / copper
Laundry sinks drains
Jacuzzis

DEC Science Panel 2010 SRE Summary Part II 6/9/2010
15
SRE Reporting 2008 2009Seven Seas Mariner [continued]
I (b) Chemical Use / Process Evaluation
Identification cleaning products
Sodium Hypochlorite used in pool Jacuzzi (identified)
Bi i l d ll Bio organic cleaners used as well
Review Hotel procedures
Chemical substitutions made (leaching potential)
Drain pipe cleaners (anti scaling chemicals ) usage (volume) not identified but used quarterly (Bio Scale Zapper).
Reduction of laundry detergents, more efficient use.
SRE Reporting 2008 2009Seven Seas Mariner [continued]
II Treatment Technology Evaluation / Implementation Seven Seas Hamworthy systems
SSM Hamworthy good results Relatively better Ammonia results than PCL Hamworthy AWTS Focus from start on the vessel system metalsy SRE action plan from outset and focusing on results BW GW ratio about 5%BW 95%GW SSM 2008 / 2009 ammonia metal performance (next table) Metal spikes (zinc) in effluent corrected by storing boilerwater in
tanks for offshore discharge. AWTS Hamworthy units are operated not at maximum operation
load.
OR findings in 2008 2009 SSM appears very actively working on the AWTS systems and vessel piping systems.
Seven Seas Mariner 2008‐2009 Ammonia WW Sample Results
25
30
35
40
45
42
19
2933
40
13 11 9.94.7
1116
29
8.31.8
7.83.4 6.70.237.4 6.9
0
5
10
15
20
25
1 2 3 4 5 6 7 8 9 10 11 12 13 14 15 16 17 18 19 20
mg/L
Note 1‐10 in 2008, 11‐20 in 2009

DEC Science Panel 2010 SRE Summary Part II 6/9/2010
16
Seven Seas Mariner
100.0
120.0
0.0
20.0
40.0
60.0
80.0
2004 2005 2006 2008 2009
Ammonia
Copper
Nickel
Zinc
SRE Reporting 2008 2009Silver Shadow
General: 1 vessel
Vessel overview (Table)
2008 Vessel Name Year AWTS Type / 2008 20092008 2009 Season:
Vessel Name Year Delivery
AWTS Type / Units Cap m3
2008 Discharge Status
2009 Discharge Status
Silver Shadow 2000 Marisan Biopure 300 [2 x 25 / 250]
D D
Silver Shadow WW sampling
Treatment System Type: Marisan
Ammonia Copper Nickel Zinc
Median 0.3 52.0 13.9 21.0
Average 1.8 48.6 13.4 25.6
Max 23.0 172.0 24.1 125.0
Min 0.1 3.8 5.7 0.5
95th Percentile 7.2 97.0 23.1 61.4
99th Percentile 19.7 157.0 23.9 112.3
DEC Science Panel 2010 SRE Summary Part II 6/9/2010
17
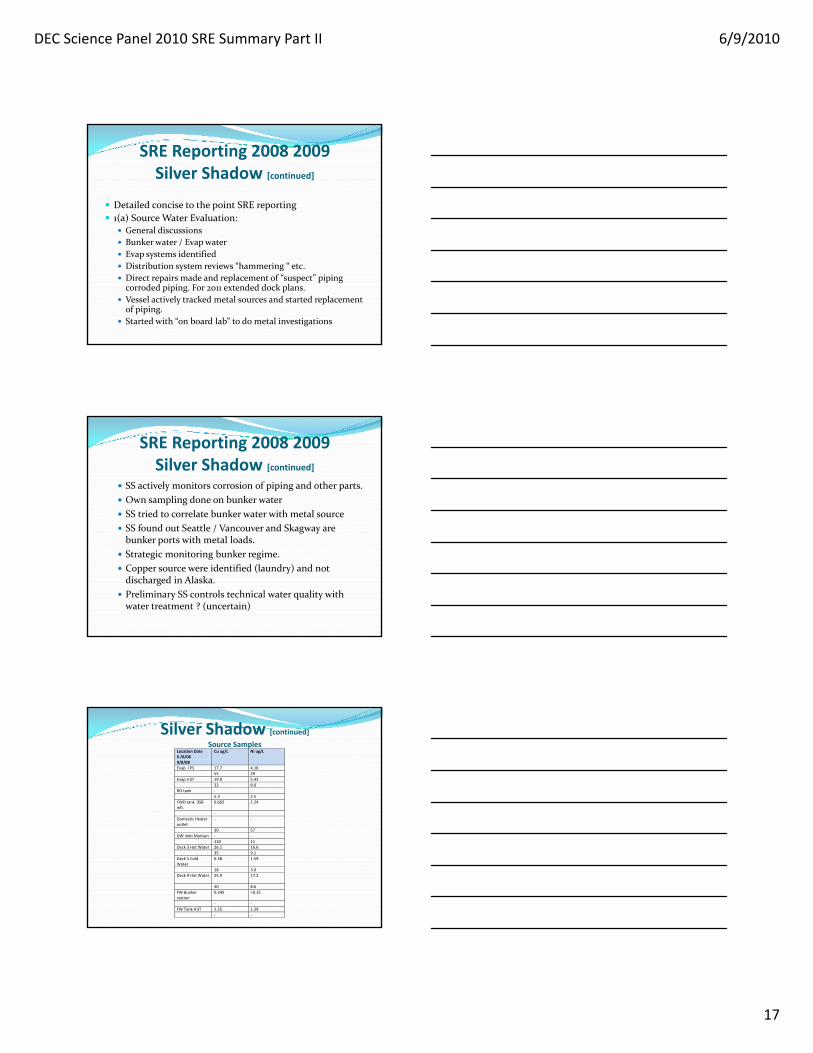
SRE Reporting 2008 2009Silver Shadow [continued]
Detailed concise to the point SRE reporting
1(a) Source Water Evaluation: General discussions
Bunker water / Evapwater
Evap systems identified
Distribution system reviews “hammering “ etc.
Direct repairs made and replacement of “suspect” piping corroded piping. For 2011 extended dock plans.
Vessel actively tracked metal sources and started replacement of piping.
Started with “on board lab” to do metal investigations
SRE Reporting 2008 2009Silver Shadow [continued]
SS actively monitors corrosion of piping and other parts.
Own sampling done on bunker water
SS tried to correlate bunker water with metal source
SS f d t S ttl / V d Sk SS found out Seattle / Vancouver and Skagway are bunker ports with metal loads.
Strategic monitoring bunker regime.
Copper source were identified (laundry) and not discharged in Alaska.
Preliminary SS controls technical water quality with water treatment ? (uncertain)
Location Date 6 /6/08 9/8/08
Cu ug/L Ni ug/L
Evap I PS 17.7 4.18 55 29
Evap II ST 19.9 5.42
32 8.0
RO tank ‐ ‐
5.3 2.5
FWD tank 3SB infl.
0.602 2.24
‐ ‐
D ti H t
Silver Shadow [continued]Source Samples
Domestic Heater outlet
‐ ‐
30 57
GW inlet Marisan ‐ ‐
110 11
Deck 3 Hot Water 26.1 16.6
35 9.1
Deck 5 Cold Water
6.38 1.59
18 3.0
Deck 9 Hot Water
25.9 17.2
40 8.6
FW Bunker station
0.345 <0.15
‐ ‐
FW Tank 4 ST 2.25 1.29
‐ ‐

DEC Science Panel 2010 SRE Summary Part II 6/9/2010
18
SRE Reporting 2008 2009Silver Shadow [continued]
I (b) Chemical Use / Process Evaluation
Identification cleaning productsg p
Review Hotel procedures
Process evaluation for new products will continue
All paints that contained “copper pigments” in coating are re‐coated with solvent free amine cured epoxy coating.
SRE Reporting 2008 2009Silver Shadow [continued]
II Treatment Technology Evaluation / Implementation Silver Shadow systems
Silver Shadow Marisan System appears to have good effluent performance (good results)
Vessel appears actively working on AWTS improvements.
Silver Shadow identified that upgrade possibilities are not possible.
Vessel continues actively working on corrosion piping and parts exchange and corrosion controls.
OR findings in 2008 2009 it appeared they were very actively working on the AWTS systems and vessel piping systems.
Silver Shadow
101.45
83.7080.00
100.00
120.00Silver Shadow Marisan Averages 2004‐2009
10.23
0.07 0.31 0.68
9.03
31.88
59.25
18.9514.80
9.79
16.00
34.90
12.48
24.63
0.00
20.00
40.00
60.00
2004 2006 2008 2009
Ammonia (mg) Copper Nickel Zinc

DEC Science Panel 2010 SRE Summary Part II 6/9/2010
19
General: 1 Alaska bound vessel
Vessel overview (Table)
SRE Reporting 2008 2009Carnival Cruise Line
2008 2009 Season:
Vessel Name Year Delivery
AWTS Type / Units Cap m3
2008 Discharge Status
2009 Discharge Status
Carnival Spirit 2001 Rochem 740 (GW) D [only GW] D [only GW]
Notes: ND=Non Discharger D=Discharger *=Vessels that participated in SRE Reporting per season.
Carnival Spirit 2008‐2009 GW
Treatment System Type: Rochem
Ammonia Copper Nickel Zinc
Median 0.1 0.6 0.5 6.4
Average 0.1 1.4 0.5 8.8
Max 0.5 11.7 1.4 32.4
Min 0.1 0.3 0.2 2.9
95th Percentile 0.1 6.2 0.9 21.1
99th Percentile 0.1 10.7 1.3 30.3
SRE Reporting 2008 2009Carnival [continued] Waste stream selected GW only
Piping shore bunker connection tank providedVessel Evaporator
Average day
RO water maker
Average condensate TG m3/day
Bunker Ports AK loading
Bunker Port Vancouver Volume %
m3/day Cap day m3/day
Volume %
Carnival Spirit
1200 [2x600]
NP NP 75 25
2008
Treated waste water discharged volumes 2008
m3
July September August
Carnival Spirit 310 434 967
*Note: NP = NP Provided and Alaska Bunker Ports not identified

DEC Science Panel 2010 SRE Summary Part II 6/9/2010
20
Carnival Spirit 2008‐2009
9.610.0
12.0Sample Averages (2004‐2009)
0.2 0.10.6
1.7
0.5 0.5
6.8
0.0
2.0
4.0
6.0
8.0
2008 2009
Ammonia Copper Nickel Zinc
General: Alaska fleet 6 vessels (2008 and 2009)
Vessel overview (Table)
Vessel Name Year AWTS Type / 2008 2009
SRE Reporting 2008 2009Royal Caribbean Cruises Ltd.
Delivery yp /
Units Cap m3 Discharge Status Discharge Status
Celebrity Infinity *
2001 Zenon ND ND
Celebrity Millennium*
2001 Hydroxyl ND [only discharged to sample for a study]
ND
Serenade of the Seas*
2003 Scanship ND Yes Discharger (D)
Radiance of the Seas*
2001 Hydroxyl ND ND
Rhapsody of the Seas*
1997 Navalis [under construction]
ND ND
Notes: ND=Non Discharger D=Discharger *=Vessels that participated in SRE Reporting per season.
Serenade of the Seas 2009Sample Results‐ Scanship
mg/L ug/L ug/L ug/L S.U.
col. per
100 ml mg/L mg/L mg/L
Ammonia Copper Nickel Zinc pH
Fecal
Coliform TSS BOD ChlorineVessel
Treatment
System
Wastewa
ter Type
Sample
Date
Serenade Scanship Mixed 5/21/2009 28 2.98 9.61 102 6.8 9.47 13 11.8 ND
Serenade Scanship Mixed 5/28/2009 17 3.93 17.2 141 6.9 ND 16 8.54 ND
Serenade Scanship Mixed 6/4/2009 23 3.79 10.6 94.5 6.9 ND 6 2.92 ND
Serenade Scanship Mixed 6/25/2009 16 3.02 12 94 6.8 ND 12 5.89 ND
Serenade Scanship Mixed 7/2/2009 23 3.84 12.5 133 6.9 ND ND 2.15 ND
Serenade Scanship Mixed 7/23/2009 16 4.96 22.1 135 7 ND 5 2.66 ND
Serenade Scanship Mixed 8/6/2009 23 3.7 12.4 267 6.8 ND 10 4.87 ND
Serenade Scanship Mixed 8/20/2009 14 5.02 9.13 60.3 7 ND 4 5.66 ND
Serenade Scanship Mixed 9/17/2009 15 8.15 28.2 77.8 6.9 ND 4 ND ND
Serenade Scanship Mixed 9/24/2009 10 4.71 21.1 81.4 6.8 ND 5 3.06 ND
y yp
DEC Science Panel 2010 SRE Summary Part II 6/9/2010
21
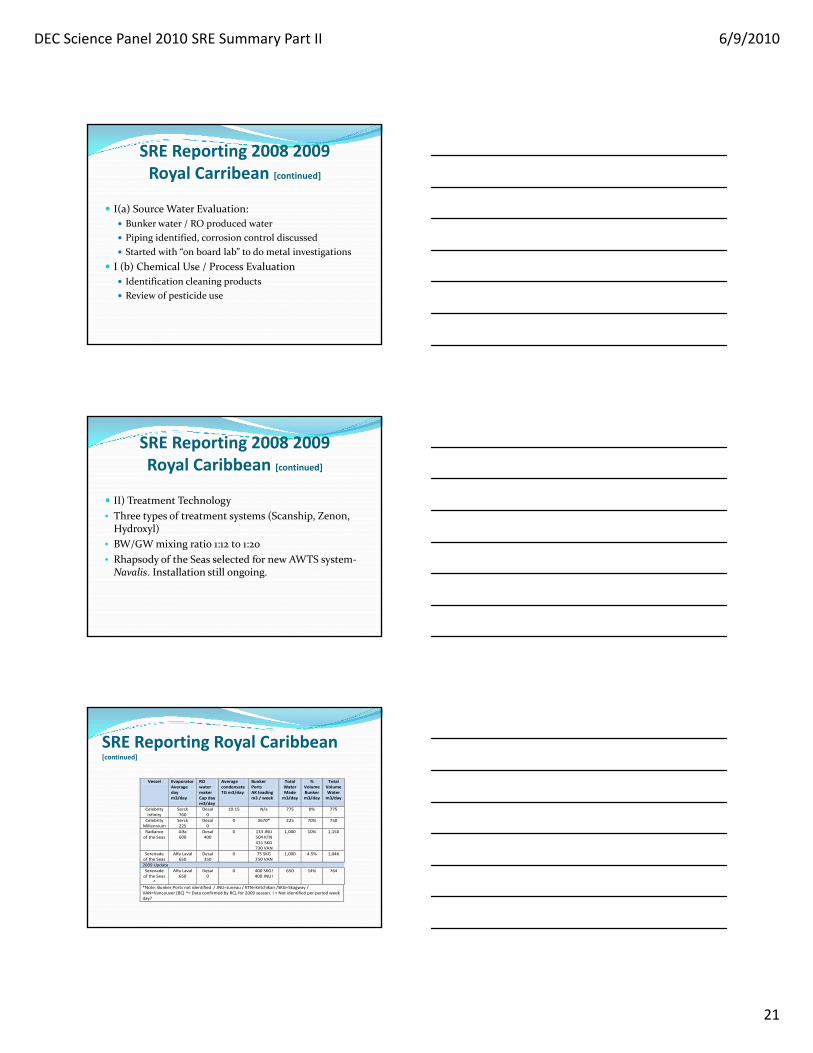
SRE Reporting 2008 2009Royal Carribean [continued]
I(a) Source Water Evaluation:
Bunker water / RO produced water
Pi i id ifi d i l di d Piping identified, corrosion control discussed
Started with “on board lab” to do metal investigations
I (b) Chemical Use / Process Evaluation
Identification cleaning products
Review of pesticide use
SRE Reporting 2008 2009Royal Caribbean [continued]
II) Treatment Technology
• Three types of treatment systems (Scanship, Zenon, H d l)Hydroxyl)
• BW/GW mixing ratio 1:12 to 1:20
• Rhapsody of the Seas selected for new AWTS system‐Navalis. Installation still ongoing.
SRE Reporting Royal Caribbean[continued]
Vessel Evaporator Average day m3/day
RO water maker Cap day m3/day
Average condensate TG m3/day
Bunker Ports AK loading m3 / week
Total Water Made m3/day
% Volume Bunker m3/day
TotalVolume Water m3/day
Celebrity Infinity
Serck 760
Desal 0
10‐15 N/a 775 0% 775
Celebrity Millennium
Serck 225
Desal 0
0 3670* 225 70% 750
Radiance of the Seas
Alfa 600
Desal 400
0 133 JNU 504 KTN 411 SKG 730 VAN
1,000 10% 1,150
Serenade of the Seas
Alfa Laval 650
Desal 350
0 75 SKG 250 VAN
1,000 4.5% 1,046
2009 Update
Serenade of the Seas
^
Alfa Laval 650
Desal 0
0 400 SKG! 400 JNU!
650 14% 764
*Note: Bunker Ports not identified / JNU=Juneau / KTN=Ketchikan /SKG=Skagway / VAN=Vancouver [BC] ^= Data confirmed by RCL for 2009 season. ! = Not identified per period week day?

DEC Science Panel 2010 SRE Summary Part II 6/9/2010
22
Questions?