debunking the 100x gpu vs. cpu myth: an evaluation of
TRANSCRIPT

Debunking the 100x GPU vs. CPU Myth:An Evaluation of Throughput Computing
on CPU and GPU
Presenter: Victor [email protected]
Throughput Computing Lab, Intel Architecture Group

GPUs is 10 – 100x faster than CPUs
7/6/20102
Background
Performance of applications critically depends on two resources provided by processors –compute and bandwidth
• Compute does the work
• Bandwidth feeds the compute
7/6/20103

Background
Well optimized applications are compute or bandwidth bounded
For compute bound applications:
Performance = Arch efficiency * Peak Compute Capability
For bandwidth bound applications:
Performance = Arch efficiency * Peak Bandwidth Capability
7/6/20104

BackgroundChip A Chip B
7/6/20105
PerfB = EffB * PeakB(Comp or BW)
)/()/(
BWCompPeakBWCompPeak
EffEff
PerfPerf
ABSpeedup
B
A
A
B
A
B ∗==
PerfA = EffA * PeakA(Comp or BW)

Background
Core i7 960• Four OoO Superscalar
Cores, 3.2GHz
• Peak SP Flop: 102GF/s
• Peak BW: 30 GB/s
GTX 280• 30 SMs (w/ 8 In-order SP
each), 1.3GHz
• Peak SP Flop: 933GF/s*
• Peak BW: 141 GB/s
7/6/20106
Max Speedup:GTX 280 over Core i7 960
Compute Bound Apps: (SP) 933/102 = 9.1x
Bandwidth Bound Apps: 141/30 = 4.7x
Assuming both Core i7 and GTX280 have the same efficiency:
* 933GF/s assumes mul-add and the use of SFU every cycle on GPU

GPUs is 10 – 100x faster than CPUs
7/6/20107

Outline
• Throughput Workloads
• Performance Measurements
• Architecture Analysis
• Conclusion
8 7/6/2010

Outline
• Throughput workloads
• Performance Measurements
• Architecture Analysis
• Conclusion
9 7/6/2010

Throughput workloads
• About processing a large amount of data in a given amount of time
• Characteristics:- Workloads with plenty of data level parallelism- Fast response time for all data processed vs. a single data
processed
10 7/6/2010

Examples of Throughput Apps
7/6/201011
Hollywood Physics
EDA
Financial Services
Virtual World
Computational Medicine
Bioscience, astronomy

Throughput Benchmarks
12
Applications DomainSGEMM HPCSAXPY HPCSpMV HPCFFT HPCMonte Carlo Financial ServicesHistogram EDABilateral Image ProcessingConvolution Image ProcessingRay Casting Medical ImagingConstraint Solver DCC (Physical Simulation)GJK DCC (Physical Simulation)LBM DCC (Physical Simulation)Sort DatabaseSearch Database

Throughput Benchmarks
13
Applications DLP processed by Main limiterSGEMM Threads / SIMD ComputeSAXPY Threads / SIMD BandwidthSpMV Threads / SIMD (Gather) BandwidthFFT Threads / SIMD ComputeMonte Carlo Threads / SIMD ComputeHistogram Threads / SIMD (Atomic) ComputeBilateral Threads / SIMD ComputeConvolution Threads / SIMD ComputeRay Casting Threads / SIMD (Gather) ComputeConstraint Solver Threads / SIMD (Gather) ComputeGJK Threads / SIMD (Gather) ComputeLBM Threads / SIMD BandwidthSort Threads / SIMD (Gather) ComputeSearch Threads / SIMD (Gather) Compute

Outline
• Throughput workload characteristics
• Performance Measurements
• Architecture Analysis
• Conclusion
14 7/6/2010

Methodology
• Start with previously best published code / algorithm
• Validate claims by others
• Optimize BOTH CPU and GPU versions
• Collect and analysis performance data
15
Note: Only computation time on the CPU and GPU is measured. PCIe transfer time and host application time are not measured for GPU. Including such overhead will lower GPU performance
7/6/2010

What was claimed
16
[Chr
iste
n08]
[Egl
off0
8]
[Gen
oves
e09]
[Nag
a07]
[Vol
kov0
8]
[Bai
ley0
9]
[Vaz
quez
09]
[Sat
ish0
9]
[Alc
anta
ra09
]
[Yan
g08]
[Lan
g07]
Geomean: 22x
7/6/2010

What we measured
17
Geomean on our version: 2.5x
7/6/2010

Case Study: Sparse MVM
• [Vazquez09]: GTX295: ~12.5GF/s, Core 2 Duo E8400: ~ 0.25GF/s
• Our results: GTX280: 8.3GF/s, Core i7 960: 4.0GF/s
7/6/2010 Intel Confidential18
50x
GTX295 GTX280
1.5x differencedue to BW difference
Core2E8400
+ Multi-threads(3.73x)
+ RegTiling/PF (1.1x)
Core i7960
3x differencedue to arch difference
+ SIMD(1.15x)
+ CacheBlocking(1.15x)
2.1x
What went wrong
• CPU and GPU are not contemporary
• All attention is given to GPU coding
• CPU version is under optimized- E.g. Not use multi-threading- E.g. Not use common optimizations such as cache
blocking
7/6/2010 Intel Confidential19
Outline
• Throughput workload characteristics
• Performance Measurements
• Architecture Analysis
• Conclusion
20 7/6/2010

Performance Analysis
Core i7 960• Four OoO Superscalar
Cores, 3.2GHz
• Peak SP Flop: 102GF/s
• Peak BW: 30 GB/s
GTX 280• 30 SMs (w/ 8 In-order SP
each), 1.3GHz
• Peak SP Flop: 933GF/s*
• Peak BW: 141 GB/s
7/6/201021
Max Speedup:GTX 280 over Core i7 960
Compute Bound Apps: (SP) 933/102 = 9.1x
Bandwidth Bound Apps: 141/30 = 4.7x
Assuming both Core i7 and GTX280 have the same efficiency:
* 933GF/s assumes mul-add and the use of SFU every cycle on GPU

Performance Analysis
22
• Compute-bound– SGEMM, Conv, FFT: Single-Precision (2.8x – 3.0x)– MC: Double-Precision (1.8x)
• Bandwidth-bound– SAXPY, LBM: Main Memory (5.0x – 5.3x)
GPUs are much less compute efficient than CPUs but are slightly more bandwidth efficient
7/6/2010

Performance Analysis
23
• Compute-bound– SGEMM, Conv, FFT: Single-Precision (2.8x – 3.0x)– MC: Double-Precision (1.8x)
• Bandwidth-bound– SAXPY, LBM: Main Memory (5.0x – 5.3x)
• Advantage of Cache (reduce BW gap)– SpMV: Bandwidth-bound (2.1x)– Sort, Search, RC: Compute-bound (0.79x - 1.8x)
7/6/2010
Performance Analysis
24
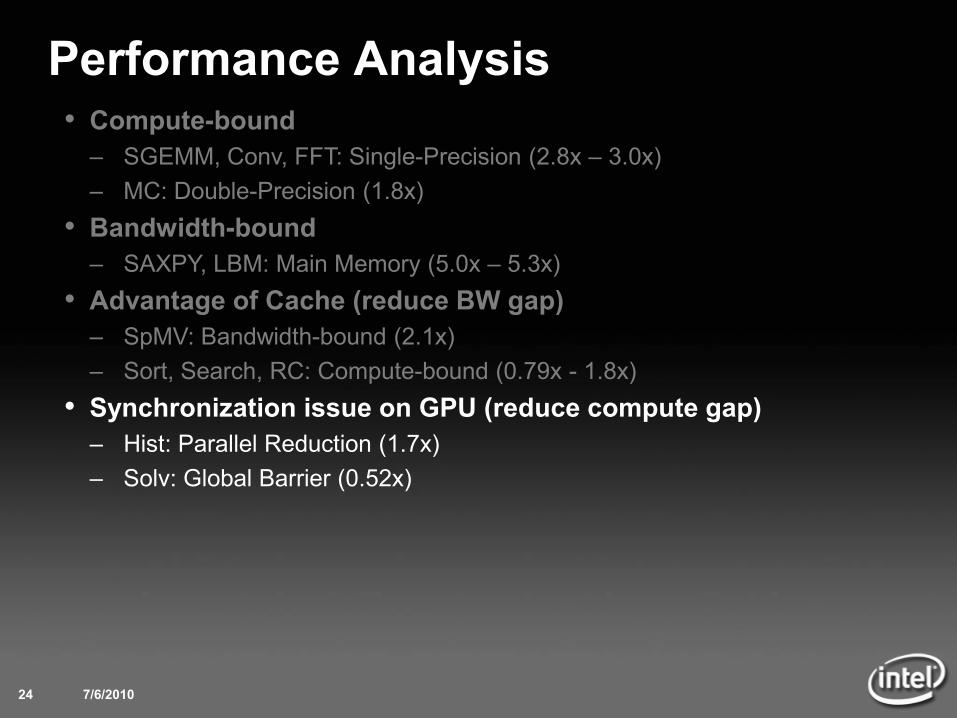
• Compute-bound– SGEMM, Conv, FFT: Single-Precision (2.8x – 3.0x)– MC: Double-Precision (1.8x)
• Bandwidth-bound– SAXPY, LBM: Main Memory (5.0x – 5.3x)
• Advantage of Cache (reduce BW gap)– SpMV: Bandwidth-bound (2.1x)– Sort, Search, RC: Compute-bound (0.79x - 1.8x)
• Synchronization issue on GPU (reduce compute gap)– Hist: Parallel Reduction (1.7x)– Solv: Global Barrier (0.52x)
7/6/2010

Performance Analysis
25
• Compute-bound– SGEMM, Conv, FFT: Single-Precision (2.8x – 3.0x)– MC: Double-Precision (1.8x)
• Bandwidth-bound– SAXPY, LBM: Main Memory (5.0x – 5.3x)
• Advantage of Cache (reduce BW gap)– SpMV: Bandwidth-bound (2.1x)– Sort, Search, RC: Compute-bound (0.79x - 1.8x)
• Synchronization issue on GPU (reduce compute gap)– Hist: Parallel Reduction (1.7x)– Solv: Global Barrier (0.52x)
• Advantage of Fixed Function for GPU (increase compute gap)– Bilat: Transcendental Operations (5.7x)– GJK: Texture Sampler Hardware (15x)
7/6/2010

Outline
• Throughput workload characteristics
• Performance
• Case studies
• Architecture Analysis
• Conclusion
26 7/6/2010

Conclusion
1. GPUs are NOT orders of magnitude faster than CPUs• In many cases, they are architecturally less efficient than CPU
2. Problems with previous work• Processors of comparison are not contemporary• Lack of architecture specific optimizations
3. Architecture features are important for throughput computing
• Caches are good for reducing external bandwidth requirement• Fast synchronization and fixed function are useful for some apps
27 7/6/2010

Acknowledgements
Throughput Computing LabPradeep Dubey, Yen-Kuang Chen, Jatin Chhugani, Michael Deisher, Michael Espig, Christopher J Hughes, Changkyu Kim, Daehyun Kim, Anthony D Nguyen, Satish Nadathur Rajagopalan, Mikhail Smelyanskiy
Intel Architecture GroupSrinivas Chennupaty, Per Hammarlund, Ronak Singhal

Thank You!
•Visit our website: http://tcl.intel-research.net/
Copyright © 2010, Intel Corporation. All Rights Reserved.
Partner Disclaimer: It is acknowledged that the use of the word "Partner" is a commonly used term in the technology industry to designate a marketing relationship between otherwise unaffiliated companies and is used in accordance with this common usage herein. The use of the word “Partner” herein shall not be deemed to nor is it intended to create a partnership, agency, joint venture or other similar arrangement between Intel and such partners and the employees, agents and representatives of one party shall not be deemed to be employees, agents or representatives of the other. Intel and the partners shall be deemed to be independent contractors and shall have no authority to bind each other.
Intel and the Intel logo are trademarks of Intel Corporation in the United States and other countries.
* Other names and brands may be claimed as the property of others.