debugging xcode exceptions - buzztouch
TRANSCRIPT
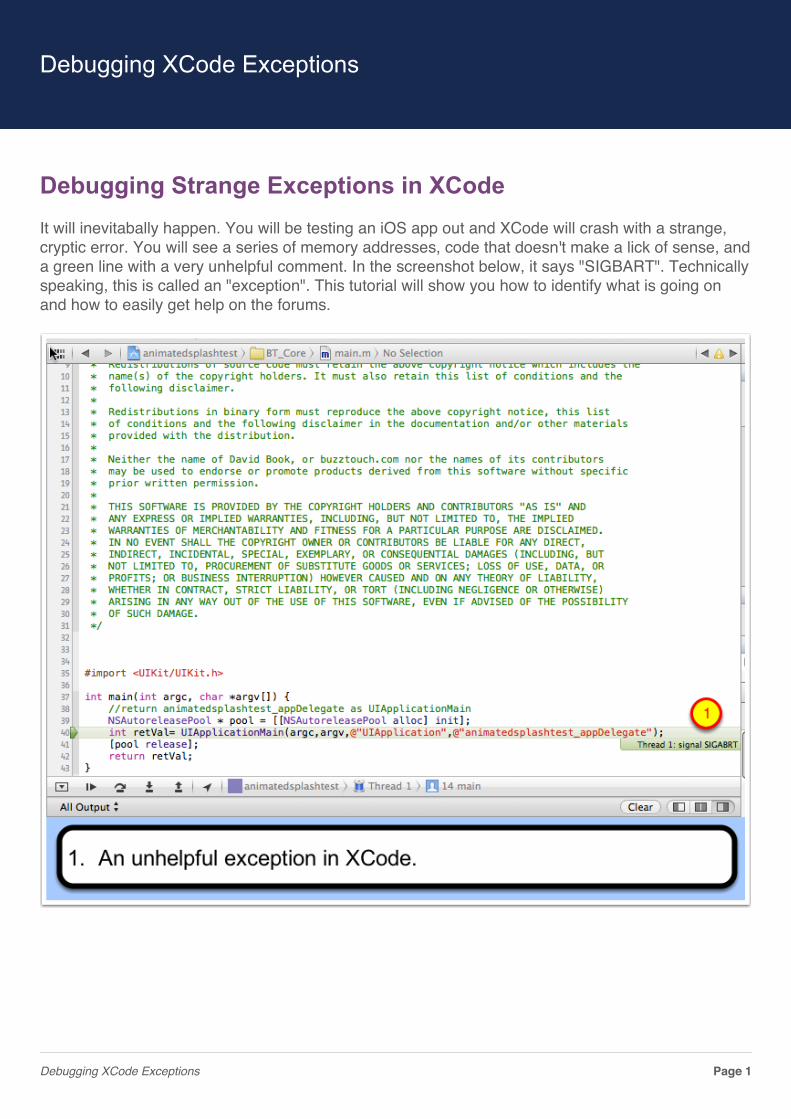
Debugging Strange Exceptions in XCodeIt will inevitabally happen. You will be testing an iOS app out and XCode will crash with a strange,cryptic error. You will see a series of memory addresses, code that doesn't make a lick of sense, anda green line with a very unhelpful comment. In the screenshot below, it says "SIGBART". Technicallyspeaking, this is called an "exception". This tutorial will show you how to identify what is going onand how to easily get help on the forums.
Debugging XCode Exceptions
Debugging XCode Exceptions Page 1
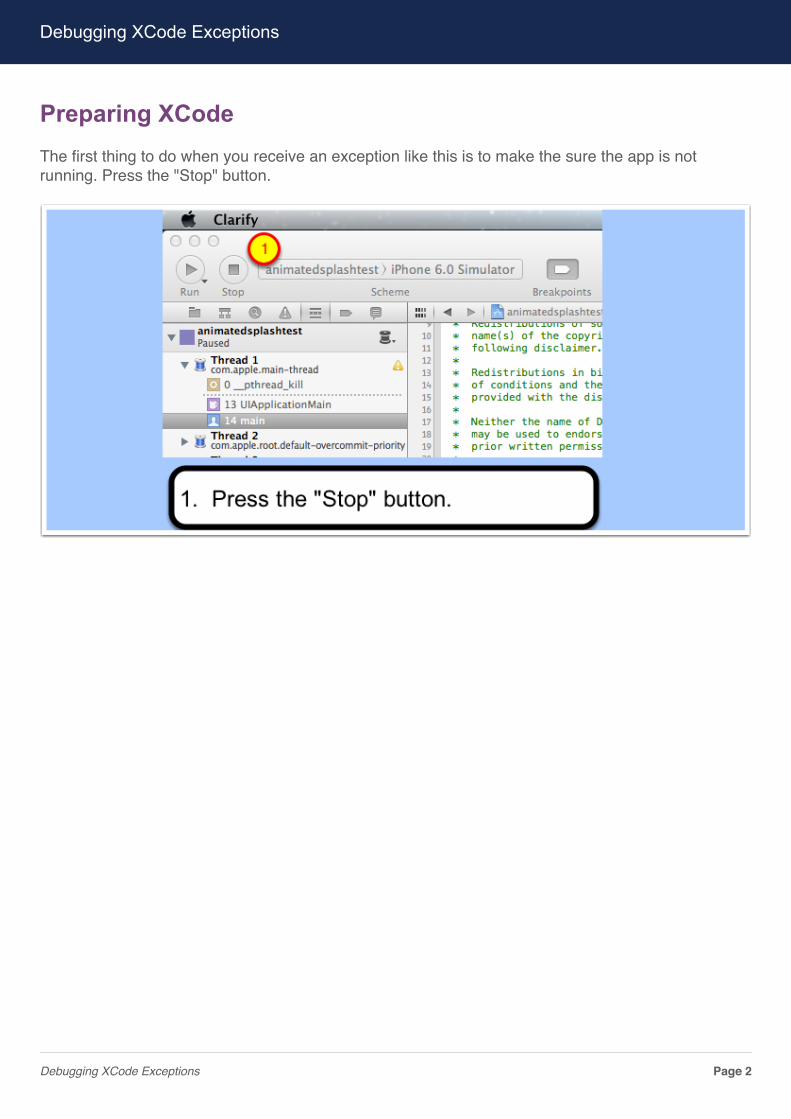
Preparing XCodeThe first thing to do when you receive an exception like this is to make the sure the app is notrunning. Press the "Stop" button.
Debugging XCode Exceptions
Debugging XCode Exceptions Page 2
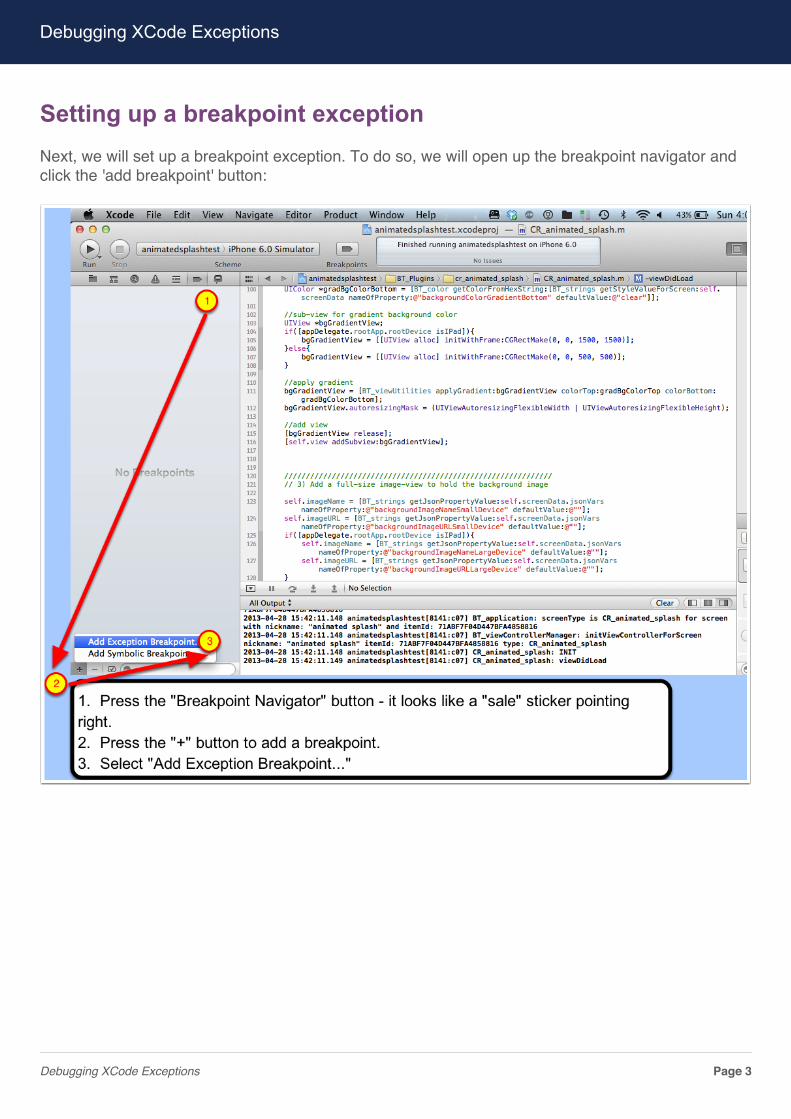
Setting up a breakpoint exceptionNext, we will set up a breakpoint exception. To do so, we will open up the breakpoint navigator andclick the 'add breakpoint' button:
Debugging XCode Exceptions
Debugging XCode Exceptions Page 3
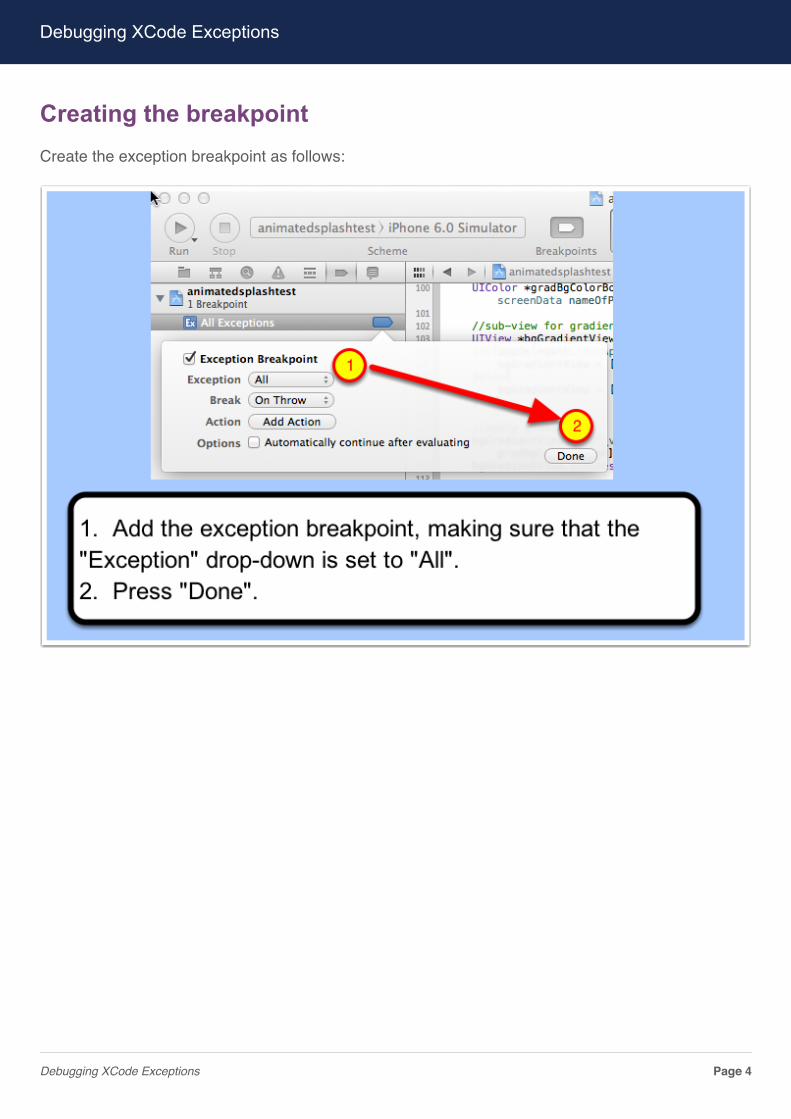
Creating the breakpointCreate the exception breakpoint as follows:
Debugging XCode Exceptions
Debugging XCode Exceptions Page 4
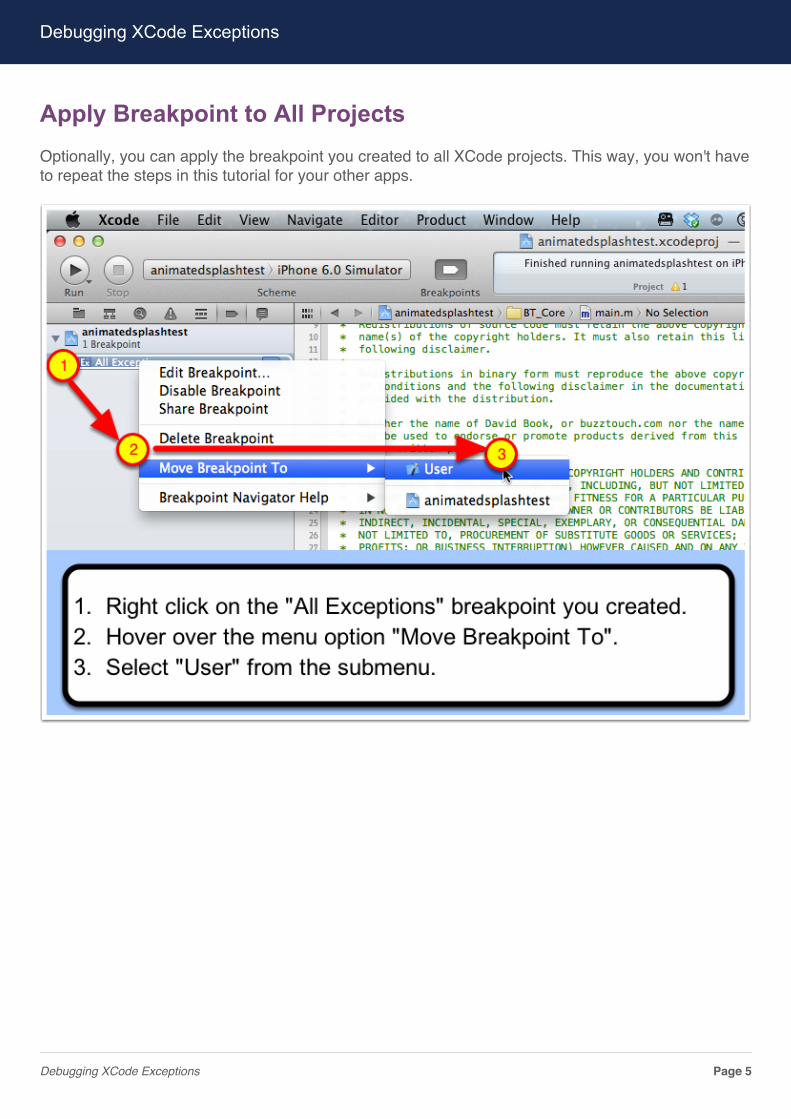
Apply Breakpoint to All ProjectsOptionally, you can apply the breakpoint you created to all XCode projects. This way, you won't haveto repeat the steps in this tutorial for your other apps.
Debugging XCode Exceptions
Debugging XCode Exceptions Page 5
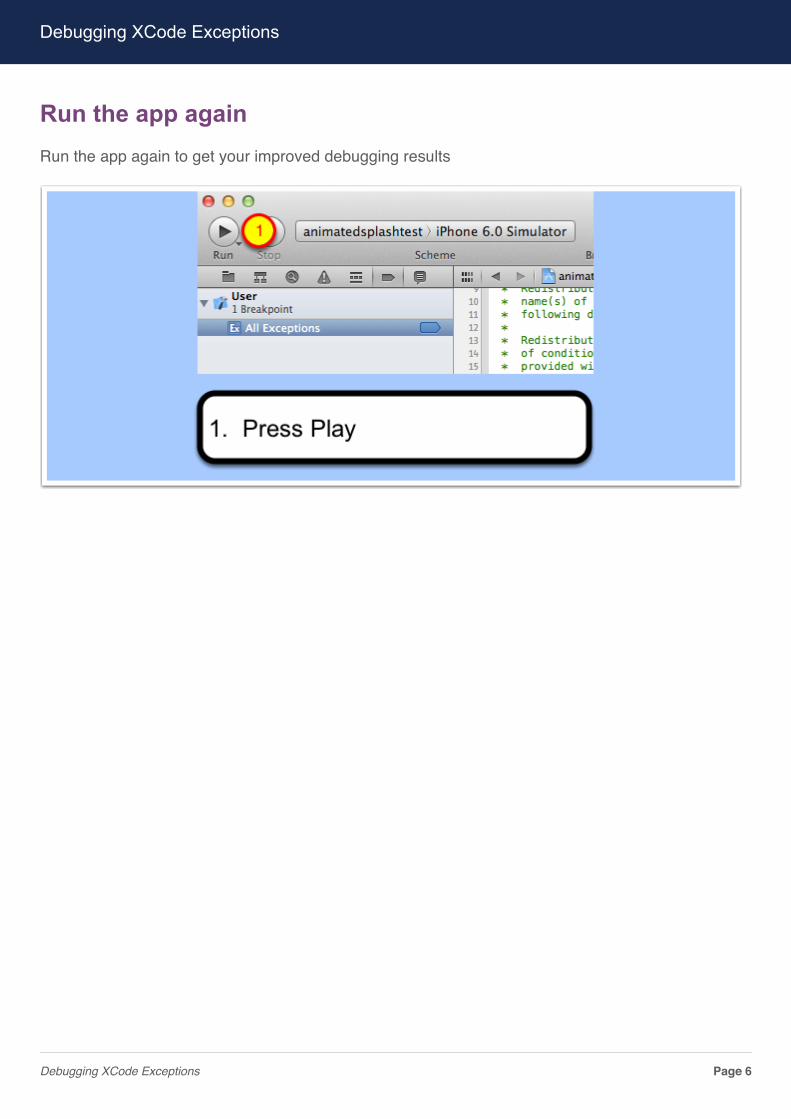
Run the app againRun the app again to get your improved debugging results
Debugging XCode Exceptions
Debugging XCode Exceptions Page 6
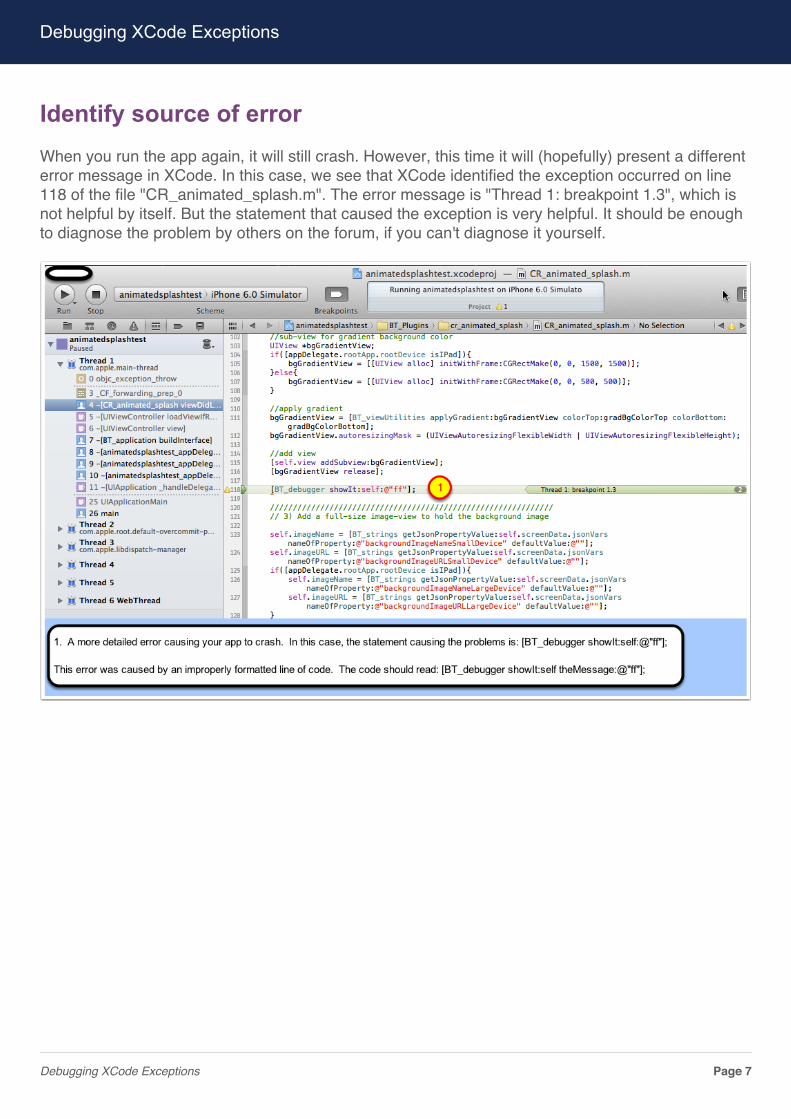
Identify source of errorWhen you run the app again, it will still crash. However, this time it will (hopefully) present a differenterror message in XCode. In this case, we see that XCode identified the exception occurred on line118 of the file "CR_animated_splash.m". The error message is "Thread 1: breakpoint 1.3", which isnot helpful by itself. But the statement that caused the exception is very helpful. It should be enoughto diagnose the problem by others on the forum, if you can't diagnose it yourself.
Debugging XCode Exceptions
Debugging XCode Exceptions Page 7
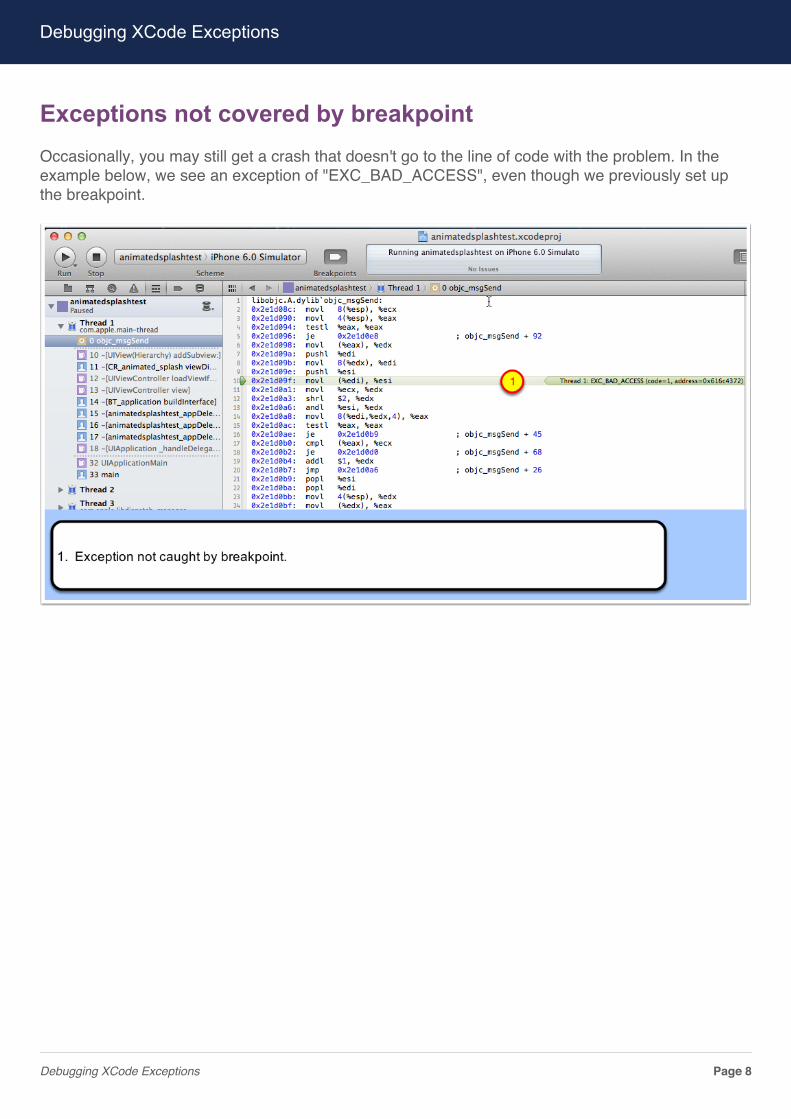
Exceptions not covered by breakpointOccasionally, you may still get a crash that doesn't go to the line of code with the problem. In theexample below, we see an exception of "EXC_BAD_ACCESS", even though we previously set upthe breakpoint.
Debugging XCode Exceptions
Debugging XCode Exceptions Page 8
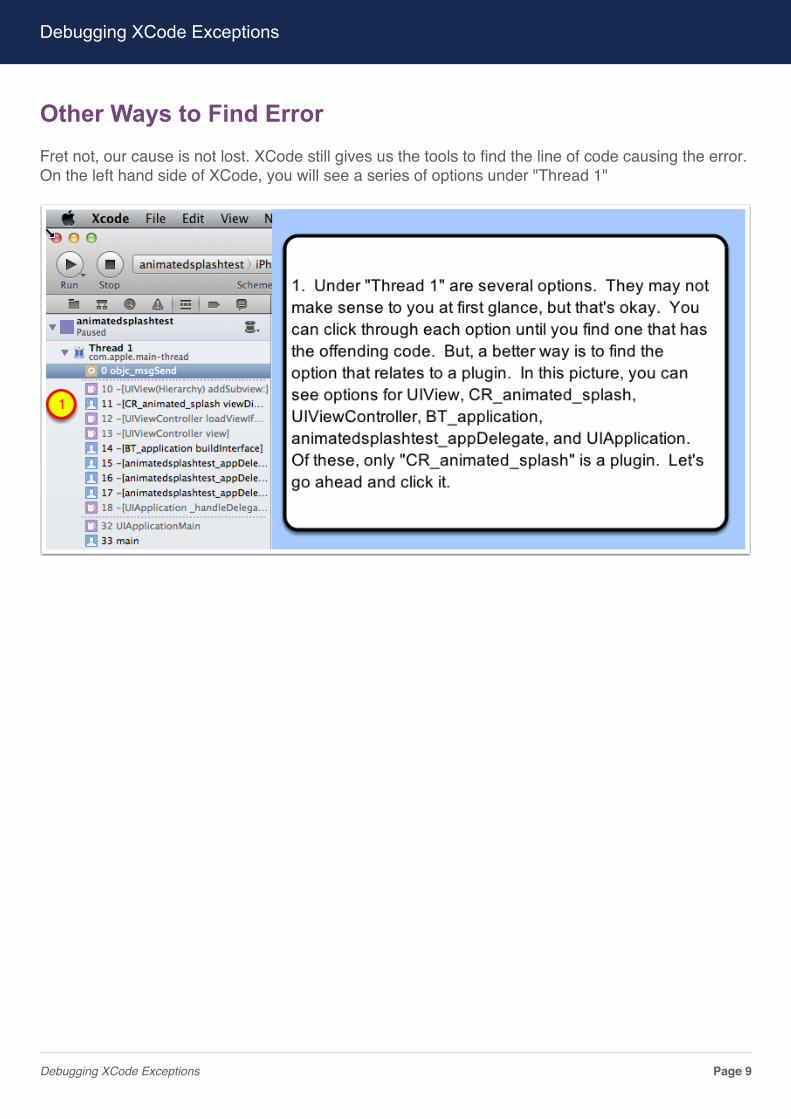
Other Ways to Find ErrorFret not, our cause is not lost. XCode still gives us the tools to find the line of code causing the error.On the left hand side of XCode, you will see a series of options under "Thread 1"
Debugging XCode Exceptions
Debugging XCode Exceptions Page 9
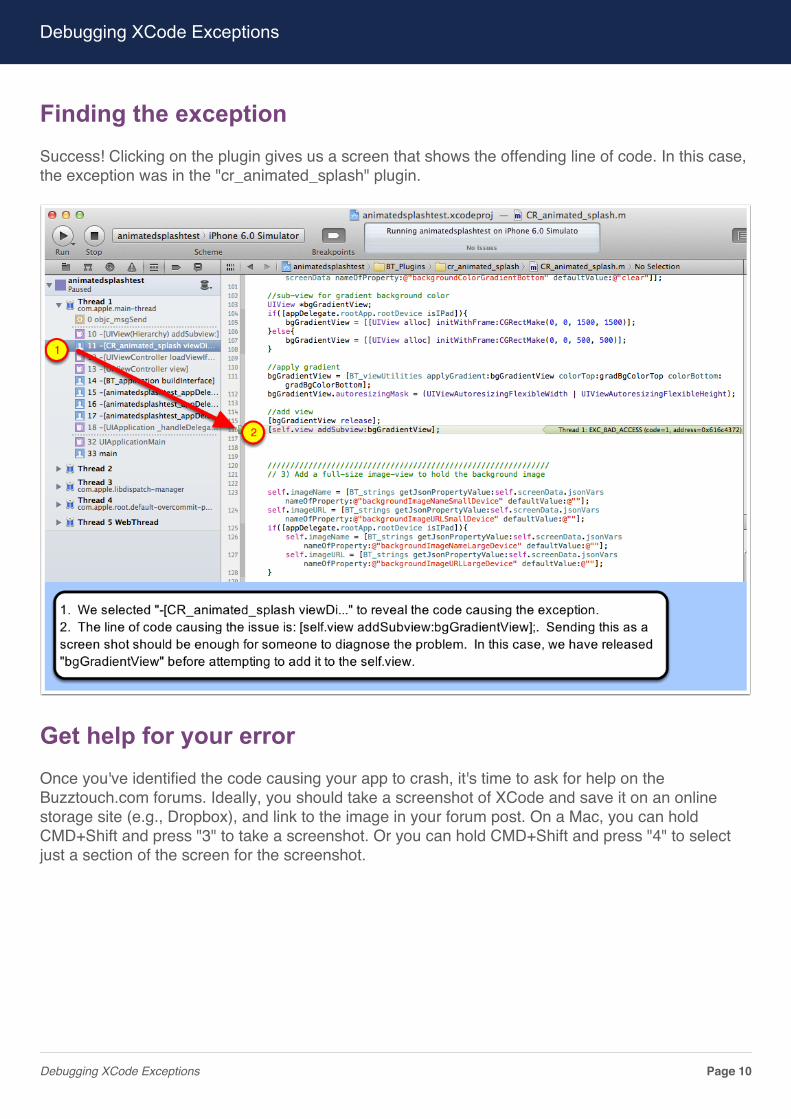
Finding the exceptionSuccess! Clicking on the plugin gives us a screen that shows the offending line of code. In this case,the exception was in the "cr_animated_splash" plugin.
Get help for your errorOnce you've identified the code causing your app to crash, it's time to ask for help on theBuzztouch.com forums. Ideally, you should take a screenshot of XCode and save it on an onlinestorage site (e.g., Dropbox), and link to the image in your forum post. On a Mac, you can holdCMD+Shift and press "3" to take a screenshot. Or you can hold CMD+Shift and press "4" to selectjust a section of the screen for the screenshot.
Debugging XCode Exceptions
Debugging XCode Exceptions Page 10