debt service and capital planning · debt service ... indebtedness is calculated by adding the...
TRANSCRIPT

Debt Service and Capital Planning
Section 6

In This Section
Capital Improvement Plan (CIP) ................................... See separate 2017-2022 Capital Improvement Plan Debt Service ................................................................................................................................................. 6-1 Calculation of Total Net Indebtedness ....................................................................................................... 6-4 Constitutional Debt Limit and Debt Margin ............................................................................................. 6-5 2017 Debt Service Summary - All Funds .................................................................................................... 6-6 2017 Debt Service Summary - Countywide Debt Service ........................................................................... 6-7 2017 Debt Service Summary - Special Districts .......................................................................................... 6-8 Indebtedness Authorized and Unissued ..................................................................................................... 6-9 Serial Bonds.................................................................................................................................................. 6-10 Serial Bonds by Department ........................................................................................................................ 6-11 Capital Planning .......................................................................................................................................... 6-16 Proposed Projects - Six Year Summary of Estimated Expenses .................................................................. 6-19 Proposed Projects- Source of Funds 2017-2022 .......................................................................................... 6-22 Proposed Projects- Summary of 2017 Estimated Expenses ........................................................................ 6-23 Proposed Capital Improvement Projects for 2017 ..................................................................................... 6-25
Debt Service
Several methods are available to finance capital improvement projects and other authorized activities. Onondaga County, like most governmental units, borrows money in order to acquire land and equipment, construct buildings, and make renovations and improvements. The cost of these capital projects are normally financed by the issuance of debt obligations which are then repaid over several years along with the interest incurred on the borrowings. An amount is included in the County’s annual operating budget to make these payments, which is defined as “debt service”. This policy enables the cost of these capital assets to be borne by the present and future taxpayers receiving the benefit of the capital assets or improvements.
The use of debt, usually through the issuance of bonds, to finance capital projects has several advantages. Primarily, it allows the County to obtain for current use a capital facility that would go beyond its capacity to finance on a pay-as-you-go basis. In addition, the flexibility associated with the repayment of bonds allows the County to smooth out its expenditure pattern over a period of several years. The structure of the principal payments cumulatively effects both interest payments and subsequently the County’s operating budget.
In general, the State Legislature has granted the power and defined the procedure for the County to borrow by the enactment of the Local Finance Law. Pursuant to the Local Finance Law, its Charter and the County Law, the County authorizes the issuance of bonds by the adoption of a bond resolution, which must be approved by at least two-thirds of the members of the County Legislature. Through the bond resolutions, the County Legislature delegates to the Chief Fiscal Officer the power to authorize and sell bond anticipation notes in anticipation of authorized bonds.
Each bond resolution authorizes the construction, acquisition or installation of the object or purpose to be financed, the plan of financing, the amount of money being borrowed, and the Period of Probable Usefulness (PPU), which ties in with the maximum maturity of the bonds subject to legal restrictions. Within these bonding requirements, the County has considerable flexibility in its borrowing program and can issue two basic forms of debt instruments: Serial Bonds (Bonds) and Bond Anticipation Notes (BANs). BANs, due to their short term (12 months or less), are used to facilitate borrowing for projects that have a PPU of 5 years or less, or are relatively small in amount or otherwise inappropriate for long-term borrowing.
In addition, BANs allow the County the option of conversion to Serial Bonds when interest rates are most beneficial for long-term debt. Statutory law in New York permits BANs to be renewed each year provided annual principal installments are made prior to the second renewal, if the principal is not paid off after the fourth renewal (5 years from the original date of borrowing), the BAN must be converted to a Serial Bond. There is an exception to the 4-time renewal limitation on BANs for Special District Borrowing for Water Environment Protection and Water. BANs may be renewed indefinitely for Special Districts as long as they do not violate the assigned PPU.
The Local Finance Law contains provisions providing the County with power to issue certain other short-term general obligation indebtedness, including revenue and tax anticipation notes and budget and capital notes. Onondaga County has not used any of these short-term borrowing options since 1992.
Bond Advisors
Bond counsel and our financial advisors play an important role in the bond issuing process. They can be influential in reducing borrowing costs by advising the issuing government on how best to structure the issue and when best to go to market. They assist us in the preparation of the County’s Official Statement,
Debt Service & Capital Planning Section 6 Page 1
insuring that it meets the legal requirements and includes the information to present the County’s financial status and economic activities and comparisons.
They assist us in the application for bond ratings, which provide investors with a symbol of credit quality that is easily recognized. Through careful fiscal planning and sound financial management, Onondaga County received the following ratings: AAA by Fitch, AA+ by S&P and Aa2 by Moody’s, with a stable outlook from all of the agencies.
Market Factors Affecting Bonds
The market for Bonds and Notes could be affected by a variety of factors, some of which are beyond the County’s control. There can be no assurance that adverse events at the state level will not occur which might affect the market price of outstanding Bonds and Notes and the market for additional debt. If a significant default or other financial crisis should occur in the affairs of the federal or state government or of any of its agencies or political subdivisions, it could impair the acceptability of obligations issued and bond ratings of borrowers, such as Onondaga County.
The traditional market for our debt has changed over the years, from primarily banks and individual investors, to the major brokerage houses and fund investors. The County looks to market conditions when scheduling its bond sale to optimize savings to the taxpayers.
Debt Management Planning
Onondaga County’s debt management planning covers all debt issued by the County including debt wholly supported by special district fund revenues. The County’s comprehensive approach to debt management includes: administrative review, emphasis on pay-as-you-go within defined limits, adherence to multiple policies established by the legislature, adherence to local finance law, and comprehensive use of bond counsel and financial advisors.
Between 2000 - 2015, Onondaga County has undertaken many debt management initiatives. In 2000, the County defeased $10.7M of debt using its fund balance. The County Legislature had passed a resolution in November 1999, which established a fund balance target of 10% of General Fund revenues. Any excesses would be used to avoid or reduce debt and provide property tax relief. The defeasance had a benefit to taxpayers of $11.7M in 2000 - 2004. In August 2001, the County participated in a pooled financing with 5 other New York counties to sell its rights to the tobacco revenues guaranteed under the Master Tobacco Agreement with the 4 major tobacco companies. This financing provided funds sufficient to defease approximately $95M of Onondaga County General Obligation debt, beneficially affecting the years 2002 - 2021 for a total of $131.7M.
Taking advantage of the lowest interest-rate environment in 40 years, the County refunded $18.5M of 10 year old bonds in 2003, saving $1.8M through 2014. In 2005, the County participated in a second pooled tobacco bond sale, which enabled the County to defease $19.9M, beneficially affecting the years 2007 - 2025 for total debt service relief of $27.3M. In 2007, $8M in cash was used to fund capital projects, avoiding debt and maintaining the County’s fund balance 10% target. In 2009 and again in 2012, the County issued $33.3M and $20.6M of refunding bonds, enabling savings of $3.3M and $1.2M, respectively. In 2014 the county issued $19.6M of refunding bonds saving over $1.1M and in 2015 $11.37M of refunding debt was issued saving $572,000. It is the County’s goal to annually review its outstanding debt for refunding opportunities, which meet the 3% NPV savings target. In 2010, the County maximized its interest savings by issuing a mix of tax-exempt, Build America (35% interest subsidy) and Recovery Zone
Debt Service & Capital Planning Section 6 Page 2

(45% interest subsidy) bonds. During the 2013 budget process, the Legislature passed a resolution committing $5M of fund balance to offset future debt service.
The County has established the following policies to guide its management of debt (calculations based on 2017 Budget):
1. Debt service costs paid through the General Fund will not exceed 5.5% of total General Fund revenue. For 2017, debt service costs are 4.51% of revenues.
2. The County’s total net direct indebtedness will not exceed $700 per capita or 1.5% of the full valuation of taxable property in the County.
3. Net general fund indebtedness is $597 per capita and 1.018% of the County’s full valuation. (Population source is 2010 U. S. Census Bureau)
4. Rapid pay down of debt will continue as a goal of the County’s debt management policies, with a target of 65% of outstanding principal scheduled for retirement within 10 years. This goal may be modified to reflect changes in the interest rate environment, which may argue for shorter or longer retirement terms. Currently, 71% of the County’s outstanding general fund debt is scheduled to be retired within 10 years.
In addition, the following capital planning and debt management strategies will continue:
Where possible, capital expenditures will be funded through pay-as-you-go programs and alternative financing mechanisms, such as state loan programs and as federal pilot projects;
Reviewing operating cost and revenue implications for all proposed capital projects as a part of the annual 60 year capital improvement planning process;
Maintaining an inventory of capital assets and developing plans to reduce maintenance costs and extend the useful life of the County’s infrastructure, including the development and implementation of preventive maintenance programs.
Debt Management - Department of Water Environment Protection
The County has taken advantage of zero-interest short-term notes and subsidized-interest loans with the NYS Environmental Facilities Corp., as well as Federal and State grants. This is especially true for the Onondaga Lake cleanup projects.
Debt Limits
Local Finance Law prohibits the County from issuing debt in excess of the Debt Limit. The Debt Limit is 7% of the 5 year average full valuation of Taxable Real Property within the County. Total Net Indebtedness is calculated by adding the County’s short and long-term debt and subtracting the legal exclusions. As of September 2, 2016 the County will have exhausted 16.50% of its Debt-Contracting Power, a minimal increase from the 15.5% in 2000. Despite the issuance of new debt the percentage of Debt-Contracting Power has increased marginally due to the use of tobacco bond revenues to defease $115M of General Fund debt (2001 & 2005). The following table is the calculation of Total Net Indebtedness:
Debt Service & Capital Planning Section 6 Page 3

Calculation of Total Net Indebtedness (As of September 2, 2016) 5 Year Average Full Valuation of Taxable Real Property $26,982,767,318 Debt Limit (7% of 5 year average) $1,888,793,712 Outstanding Indebtedness:
Bonds $ 630,662,344
Bond Anticipation Notes $ 10,009,415
Outstanding Gross Indebtedness $ 640,671,759 Less Exclusions $ (328,967,414) Total Net Indebtedness $311,704,345 Net Debt-Contracting Margin $1,577,089,367 Percentage of Debt-Contracting Power Exhausted 16.50% 1
1 The Debt Limit of the County is computed in accordance with the provisions of Article VIII of the State Constitution and Title 9 of Article 2 of the Local Finance Law
Debt Service & Capital Planning Section 6 Page 4
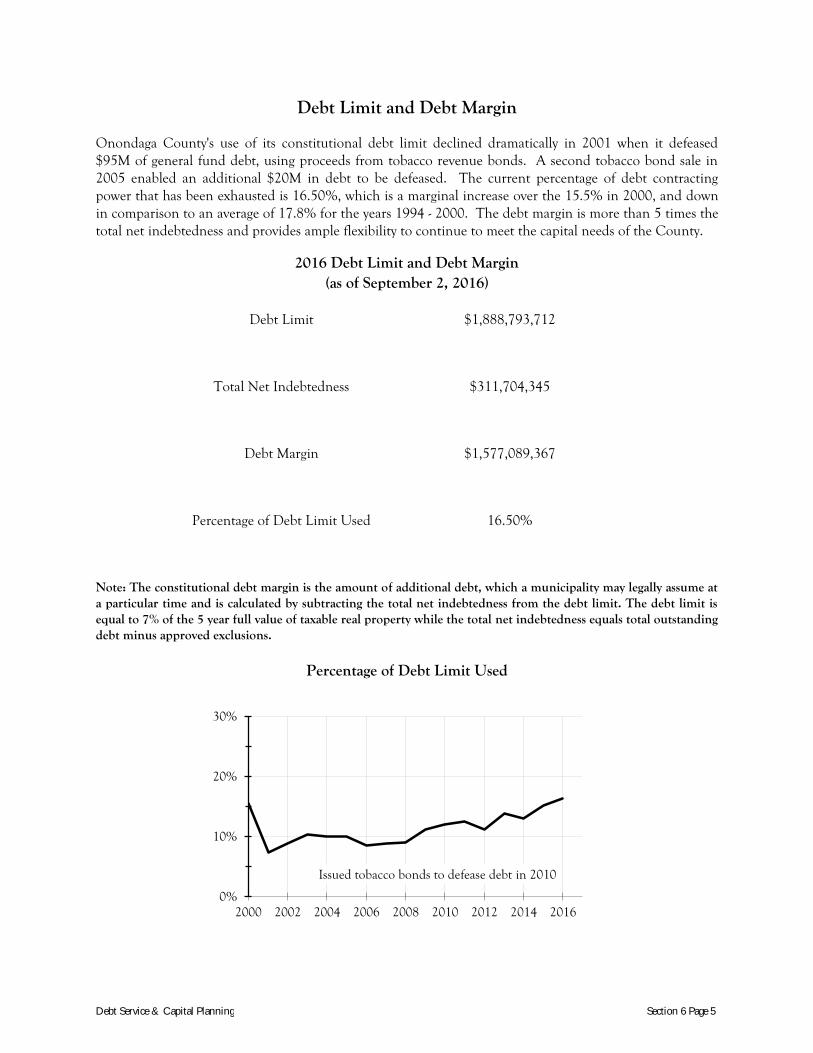
Debt Limit and Debt Margin
Onondaga County's use of its constitutional debt limit declined dramatically in 2001 when it defeased $95M of general fund debt, using proceeds from tobacco revenue bonds. A second tobacco bond sale in 2005 enabled an additional $20M in debt to be defeased. The current percentage of debt contracting power that has been exhausted is 16.50%, which is a marginal increase over the 15.5% in 2000, and down in comparison to an average of 17.8% for the years 1994 - 2000. The debt margin is more than 5 times the total net indebtedness and provides ample flexibility to continue to meet the capital needs of the County.
2016 Debt Limit and Debt Margin (as of September 2, 2016)
Debt Limit $1,888,793,712
Total Net Indebtedness $311,704,345
Debt Margin $1,577,089,367
Percentage of Debt Limit Used 16.50%
Note: The constitutional debt margin is the amount of additional debt, which a municipality may legally assume at a particular time and is calculated by subtracting the total net indebtedness from the debt limit. The debt limit is equal to 7% of the 5 year full value of taxable real property while the total net indebtedness equals total outstanding debt minus approved exclusions.
Percentage of Debt Limit Used
0%
10%
20%
30%
2000 2002 2004 2006 2008 2010 2012 2014 2016
Issued tobacco bonds to defease debt in 2010
Debt Service & Capital Planning Section 6 Page 5

Debt Service Summary - All Funds
2017
Countywide Tax Levy
Van Duyn Water/Ad Valorem Tax
WEP/Unit Charge
Total
General Oblig. Principal 25,023,064 385,000 1,402,700 6,064,236 32,875,000
General Oblig. Interest 11,310,708 89,900 1,326,010 3,560,822 16,287,440
NYS EFC* Principal 0 0 0 11,901,780 11,901,780
NYS EFC* Interest 0 0 0 8,992,040 8,992,040
Estimated EFC* Principal 0 0 0 0 0
Estimated EFC* Interest 0 0 0 400,000 400,000
Fiscal Agent Fees 40,530 0 0 568,872 609,402
Debt Service Totals 36,374,302 474,900 2,728,710 31,487,750 71,065,662
RBD/Subsidy/Other** 8,639,798 474,900 329,499 6,435,984 15,880,181
Charges to Operating Fund 27,734,504 0 2,399,211 25,051,766 55,185,481
Note: WEP - Water Environment Protection (Consolidated Sanitary District and Drainage Districts)
*EFC – Environmental Facilities Corporation, a New York State agency financing environmental projects.
**Includes subsidies for BAB & RZ Bonds, EFC, Oneida Exclusivity
Debt Service & Capital Planning Section 6 Page 6

Debt Service Summary - Countywide Debt Service
2017
General Obligation Fiscal Agent Fees
Debt Service Totals
RBD/ Fed Subsidy
Other Sources
Charge to Operating
Fund Department/Fund Principal Interest
Office of Environment 0 53,334 0 53,334 53,334 0
Board of Elections 43,000 10,445 0 53,445 0 53,445
Community College 2,253,073 1,661,934 0 3,915,007 608,043 3,306,964
OnCenter Complex 762,300 587,287 40,000 1,389,587 175,573 1,214,014
Information Technology 1,480,141 384,194 0 1,864,335 328,389 1,535,946
Facilities 4,373,870 1,380,099 530 5,754,499 1,615,218 4,139,281
Correction 110,000 75,200 0 185,200 185,200 0
Sheriff/Jail 220,000 17,050 0 237,050 11,495 225,555
Children & Family Services 310,385 158,921 0 469,306 100,000 369,306
Parks & Recreation 2,680,466 2,753,450 0 5,433,916 3,286,007 2,147,909
Library 550,000 269,881 0 819,881 432,782 387,099
Transportation 8,438,133 3,263,716 0 11,701,849 1,824,164 9,877,685
E-911 3,801,696 695,197 0 4,496,893 19,593 4,477,300
TOTALS 25,023,064 11,310,708 40,530 36,374,302 8,639,798 27,734,504
Debt Service & Capital Planning Section 6 Page 7

Debt Service Summary - Special Districts
2017
Van Duyn 1
Water District
Consol. San Dist
Meadowbrook DD
Bear Trap DD
BloodyBrook
DD
Harbor Brook
DD Total
General Oblig. Principal 385,000 1,402,700 5,463,792 393,444 14,000 66,000 127,000 7,851,936
General Oblig. Interest 89,900 1,326,010 3,409,402 101,419 10,035 25,341 14,625 4,976,732
NYS EFC* Principal 0 0 11,901,780 0 0 0 0 11,901,780
NYS EFC* Interest 1 0 0 8,992,040 0 0 0 0 8,992,040
Estimated EFC* Principal 0 0 0 0 0 0 0 0
Estimated EFC* Interest 0 0 400,000 0 0 0 0 400,000
Fiscal Agent Fees 0 0 568,872 0 0 0 0 568,872
Debt Service Totals 474,900 2,728,710 30,735,886 494,863 24,035 91,341 141,625 34,691,360
RBD/Fed 2 Subsidy/ Other 474,900 329,499 6,432,795 0 0 3,189 0 7,240,383
Charges to Operating Fund 0 2,399,211 24,303,091 494,863 24,035 88,152 141,625 27,450,977
1 Van Duyn debt will be paid with proceeds of Van Duyn's sale 2 Includes Reserves for Bonded Debt, EFC Subsidies, and BAB & RZ Subsidies
Debt Service & Capital Planning Section 6 Page 8

County Indebtedness
Authorized and Unissued
As of September 2, 2016
Department Authorized and Unissued
Facilities 8,020,264
Parks & Recreation 1,805,699
County Clerk 600,000
Transportation 11,023,500
Emergency Communications 1,788,852
Sheriff 100,000
Community College 3,800,205
Metropolitan Water Board 20,551,556
Water Environment Protection 148,125,201
Total 195,815,277
Debt Service & Capital Planning Section 6 Page 9

Serial Bonds 2017 Debt Service
Interest Rate*
Amount Issued
Initial
Interest
Balance
12/31/2017 Title of Bond Final
Maturity 2017
Principal 2017
Interest
N.Y.S. E.F.C. Bonds 1998* 2018 2.996% 6,030,821 3,386,630 355,000 17,202 365,942
N.Y.S. E.F.C. Bonds 2000* 2020 2.996% 1,383,178 881,653 75,000 9,700 253,288
N.Y.S. E.F.C. Bonds 2001A* 2020 2.996% 9,078,380 4,562,877 500,000 71,318 1,691,161
N.Y.S. E.F.C. Bonds 2001B* 2021 2.306 2,195,433 1,108,934 115,000 17,660 516,529
N.Y.S. E.F.C. Bonds 2002A* 2021 4.522 1,980,745 1,980,745 101,180 17,008 482,968
N.Y.S. E.F.C. Bonds 2002G* 2028 1.306% 14,681,217 5,432,687 615,600 256,470 7,919,271
N.Y.S. E.F.C. Bonds 2003A* 2022 4.311% 1,128,465 1,583,722 60,000 9,248 301,289
N.Y.S. E.F.C. Bonds 2003F* 2023 3.823% 4,657,961 1,868,010 250,000 53,961 1,623,223
N.Y.S. E.F.C. Bonds 2004D* 2024 4.493% 9,579,475 4,760,948 500,000 202,652 3,905,153
N.Y.S. E.F.C. Bonds 2005A* 2024 3.888% 17,469,284 7,080,442 915,000 161,872 7,533,246
N.Y.S. E.F.C. Bonds 2005B* 2025 3.689% 5,495,439 2,218,182 280,000 100,359 2,658,606
N.Y.S. E.F.C. Bonds 2006C* 2036 4.960% 44,610,657 44,610,657 1,430,000 1,256,594 40,935,807
N.Y.S. E.F.C. Bonds 2007D* 2036 4.180% 41,442,558 26,106,369 1,585,000 1,165,596 33,887,110
General Obligation Bonds 2007A 2027 4.021% 25,600,000 10,650,054 1,350,000 164,626 0
N.Y.S. E.F.C. Bonds 2008A&B* 2028 4.270% 1,645,373 801,562 80,000 45,262 1,240,257
General Obligation Bonds 2009A 2029 3.738% 61,725,000 13,881,162 4,675,000 1,538,375 38,442,063
GO Refund Bonds 2009 2023 2.400% 33,345,000 8,234,590 3,135,000 416,531 9,734,609
N.Y.S. E.F.C. Bonds 2010C* 2030 2.412% 2,972,800 1,150,144 135,000 74,991 2,532,829
General Obligation Bonds 2010A 2019 2.093% 31,150,000 7,611,076 3,000,000 377,500 6,351,250
GO Bonds 2010B (BAB's) 2026 4.761% 17,570,000 10,532,039 0 828,406 21,921,218
GO Bonds 2010B (RZ's) 2030 5.709% 4,905,000 7,021,077 0 282,352 8,019,422
N.Y.S. E.F.C. Bonds 2011C* 2031 1.753% 15,603,494 6,787,783 705,000 424,570 15,001,399
General Obligation Bonds 2011 2030 3.006% 33,755,000 11,688,907 2,475,000 949,595 25,679,141
N.Y.S. E.F.C. Bonds 2012B* 2034 1.015% 11,395,171 4,410,561 465,000 281,411 12,434,858
General Obligation Bonds 2012 2037 2.699% 51,425,000 17,994,687 3,125,000 1,468,376 47,172,750
GO Refund Bonds 2012 2025 2.511% 20,615,000 3,844,196 2,400,000 397,012 9,233,169
N.Y.S. E.F.C. Bonds 2012E* 2032 0.779% 4,100,953 1,238,401 180,000 85,063 4,034,725
General Obligation Bonds 2013 2033 3.169% 67,870,000 30,461,070 5,125,000 2,707,500 70,776,250
N.Y.S. E.F.C. Bonds 2014D* 2044 0.622% 128,800,968 79,460,686 3,555,000 4,016,474 184,170,926
General Obligation Bonds 2014 2034 2.632% 34,800,000 12,060,823 2,700,000 1,307,187 36,781,781
GO Refund Bonds 2014 2036 2.194% 19,600,000 5,951,257 2,255,000 781,325 20,138,175
General Obligation Bonds 2015 2045 3.433% 79,900,000 46,215,073 2,365,000 3,118,460 115,979,991
GO Refunds Bonds 2015 2027 2.215% 11,370,000 3,592,519 5,000 481,101 13,761,625
QECB 2015 2025 3.500% 2,650,000 1,041,161 265,000 104,145 3,326,256
General Obligation Bonds 2016 2036 2.080% 26,500,000 7,770,442 0 1,364,950 32,905,491
TOTAL:
847,032,372 397,981,126 44,776,780 24,554,852 781,711,778
*Interest Rates for General Obligation Bonds are based on the True Interest Costs, while rates for EFC Loans are based on the budget year coupon per maturity
Debt Service & Capital Planning Section 6 Page 10
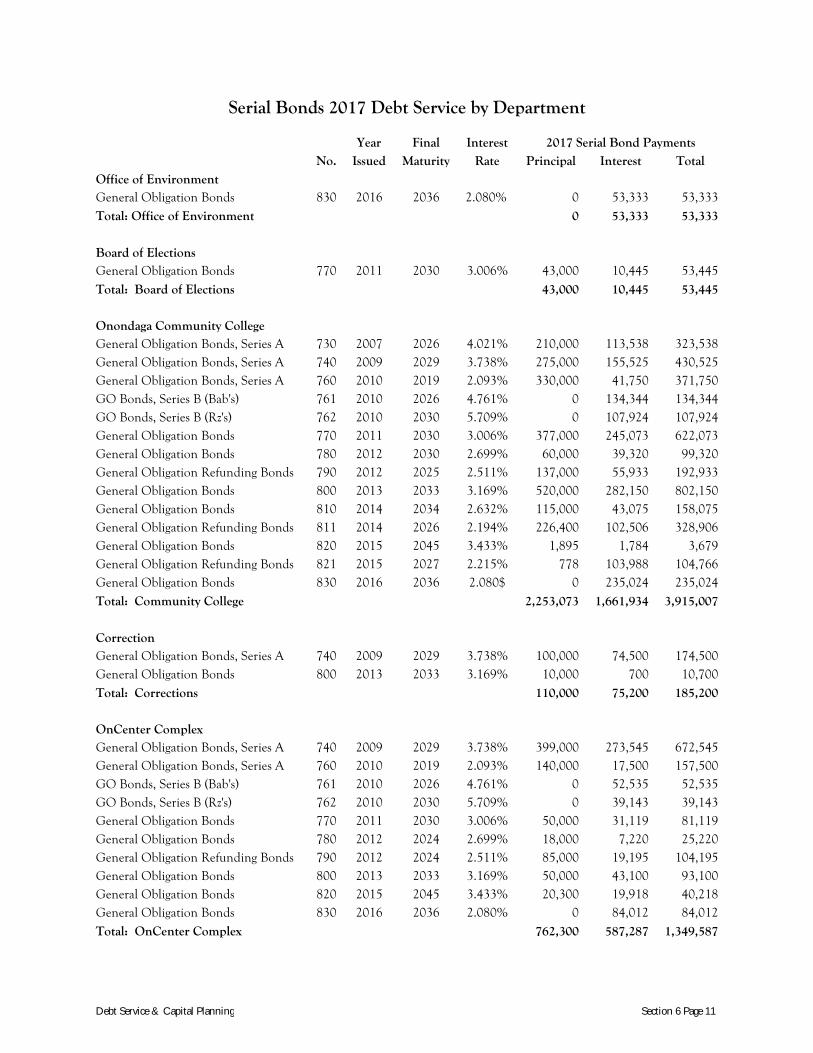
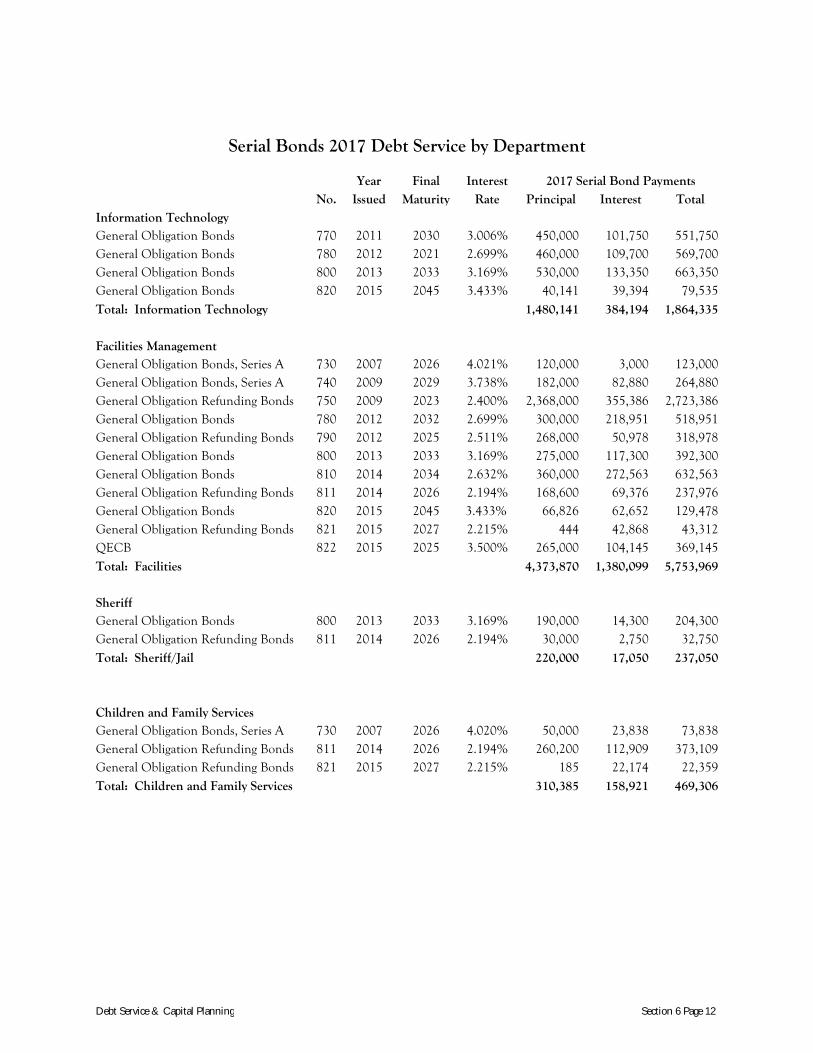
Serial Bonds 2017 Debt Service by Department
Year Final Interest 2017 Serial Bond Payments
No. Issued Maturity Rate Principal Interest Total
Office of Environment General Obligation Bonds 830 2016 2036 2.080% 0 53,333 53,333 Total: Office of Environment 0 53,333 53,333 Board of Elections
General Obligation Bonds 770 2011 2030 3.006% 43,000 10,445 53,445 Total: Board of Elections
43,000 10,445 53,445
Onondaga Community College General Obligation Bonds, Series A 730 2007 2026 4.021% 210,000 113,538 323,538
General Obligation Bonds, Series A 740 2009 2029 3.738% 275,000 155,525 430,525 General Obligation Bonds, Series A 760 2010 2019 2.093% 330,000 41,750 371,750 GO Bonds, Series B (Bab's) 761 2010 2026 4.761% 0 134,344 134,344 GO Bonds, Series B (Rz's) 762 2010 2030 5.709% 0 107,924 107,924 General Obligation Bonds 770 2011 2030 3.006% 377,000 245,073 622,073 General Obligation Bonds 780 2012 2030 2.699% 60,000 39,320 99,320 General Obligation Refunding Bonds 790 2012 2025 2.511% 137,000 55,933 192,933 General Obligation Bonds 800 2013 2033 3.169% 520,000 282,150 802,150 General Obligation Bonds 810 2014 2034 2.632% 115,000 43,075 158,075 General Obligation Refunding Bonds 811 2014 2026 2.194% 226,400 102,506 328,906 General Obligation Bonds 820 2015 2045 3.433% 1,895 1,784 3,679 General Obligation Refunding Bonds 821 2015 2027 2.215% 778 103,988 104,766 General Obligation Bonds 830 2016 2036 2.080$ 0 235,024 235,024 Total: Community College
2,253,073 1,661,934 3,915,007
Correction
General Obligation Bonds, Series A 740 2009 2029 3.738% 100,000 74,500 174,500 General Obligation Bonds 800 2013 2033 3.169% 10,000 700 10,700 Total: Corrections
110,000 75,200 185,200
OnCenter Complex General Obligation Bonds, Series A 740 2009 2029 3.738% 399,000 273,545 672,545
General Obligation Bonds, Series A 760 2010 2019 2.093% 140,000 17,500 157,500 GO Bonds, Series B (Bab's) 761 2010 2026 4.761% 0 52,535 52,535 GO Bonds, Series B (Rz's) 762 2010 2030 5.709% 0 39,143 39,143 General Obligation Bonds 770 2011 2030 3.006% 50,000 31,119 81,119 General Obligation Bonds 780 2012 2024 2.699% 18,000 7,220 25,220 General Obligation Refunding Bonds 790 2012 2024 2.511% 85,000 19,195 104,195 General Obligation Bonds 800 2013 2033 3.169% 50,000 43,100 93,100 General Obligation Bonds 820 2015 2045 3.433% 20,300 19,918 40,218 General Obligation Bonds 830 2016 2036 2.080% 0 84,012 84,012 Total: OnCenter Complex
762,300 587,287 1,349,587
Debt Service & Capital Planning Section 6 Page 11
Serial Bonds 2017 Debt Service by Department
Year Final Interest 2017 Serial Bond Payments
No. Issued Maturity Rate Principal Interest Total
Information Technology General Obligation Bonds 770 2011 2030 3.006% 450,000 101,750 551,750
General Obligation Bonds 780 2012 2021 2.699% 460,000 109,700 569,700 General Obligation Bonds 800 2013 2033 3.169% 530,000 133,350 663,350 General Obligation Bonds 820 2015 2045 3.433% 40,141 39,394 79,535 Total: Information Technology
1,480,141 384,194 1,864,335
Facilities Management
General Obligation Bonds, Series A 730 2007 2026 4.021% 120,000 3,000 123,000 General Obligation Bonds, Series A 740 2009 2029 3.738% 182,000 82,880 264,880 General Obligation Refunding Bonds 750 2009 2023 2.400% 2,368,000 355,386 2,723,386 General Obligation Bonds 780 2012 2032 2.699% 300,000 218,951 518,951 General Obligation Refunding Bonds 790 2012 2025 2.511% 268,000 50,978 318,978 General Obligation Bonds 800 2013 2033 3.169% 275,000 117,300 392,300 General Obligation Bonds 810 2014 2034 2.632% 360,000 272,563 632,563 General Obligation Refunding Bonds 811 2014 2026 2.194% 168,600 69,376 237,976 General Obligation Bonds 820 2015 2045 3.433% 66,826 62,652 129,478 General Obligation Refunding Bonds 821 2015 2027 2.215% 444 42,868 43,312 QECB 822 2015 2025 3.500% 265,000 104,145 369,145 Total: Facilities
4,373,870 1,380,099 5,753,969
Sheriff General Obligation Bonds 800 2013 2033 3.169% 190,000 14,300 204,300
General Obligation Refunding Bonds 811 2014 2026 2.194% 30,000 2,750 32,750 Total: Sheriff/Jail
220,000 17,050 237,050
Children and Family Services
General Obligation Bonds, Series A 730 2007 2026 4.020% 50,000 23,838 73,838 General Obligation Refunding Bonds 811 2014 2026 2.194% 260,200 112,909 373,109 General Obligation Refunding Bonds 821 2015 2027 2.215% 185 22,174 22,359 Total: Children and Family Services
310,385 158,921 469,306
Debt Service & Capital Planning Section 6 Page 12
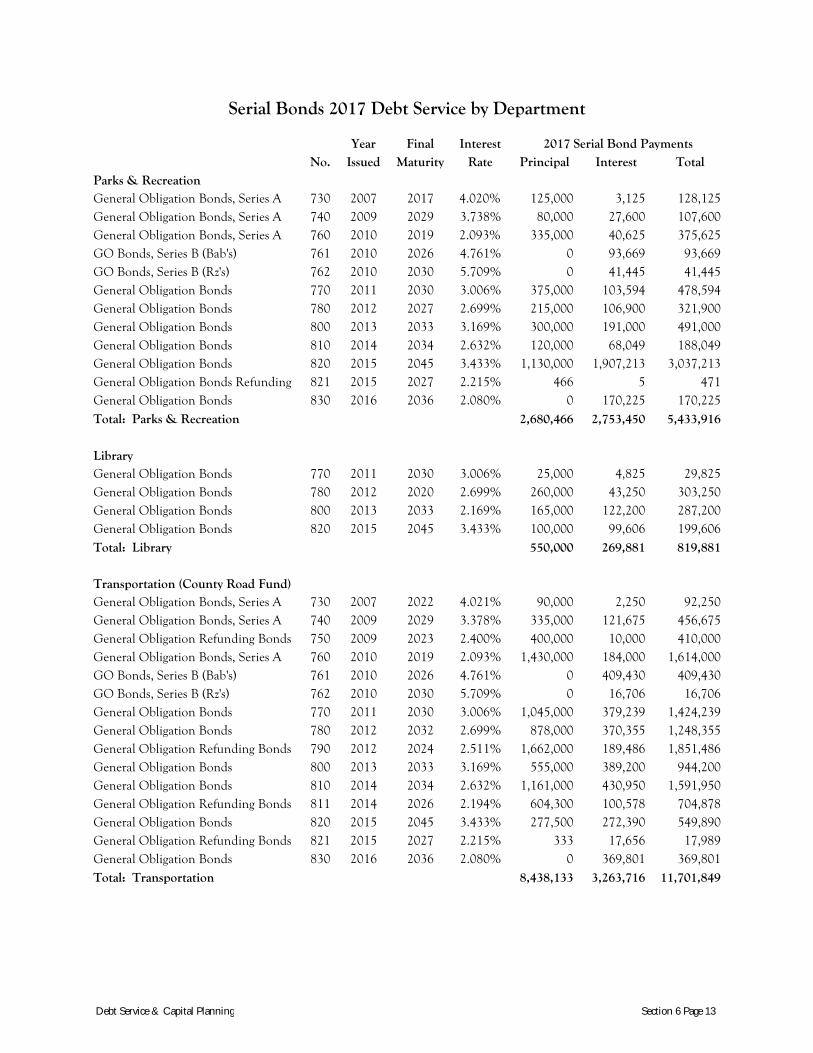
Serial Bonds 2017 Debt Service by Department
Year Final Interest 2017 Serial Bond Payments
No. Issued Maturity Rate Principal Interest Total
Parks & Recreation General Obligation Bonds, Series A 730 2007 2017 4.020% 125,000 3,125 128,125
General Obligation Bonds, Series A 740 2009 2029 3.738% 80,000 27,600 107,600 General Obligation Bonds, Series A 760 2010 2019 2.093% 335,000 40,625 375,625 GO Bonds, Series B (Bab's) 761 2010 2026 4.761% 0 93,669 93,669 GO Bonds, Series B (Rz's) 762 2010 2030 5.709% 0 41,445 41,445 General Obligation Bonds 770 2011 2030 3.006% 375,000 103,594 478,594 General Obligation Bonds 780 2012 2027 2.699% 215,000 106,900 321,900 General Obligation Bonds 800 2013 2033 3.169% 300,000 191,000 491,000 General Obligation Bonds 810 2014 2034 2.632% 120,000 68,049 188,049 General Obligation Bonds 820 2015 2045 3.433% 1,130,000 1,907,213 3,037,213 General Obligation Bonds Refunding 821 2015 2027 2.215% 466 5 471 General Obligation Bonds 830 2016 2036 2.080% 0 170,225 170,225 Total: Parks & Recreation
2,680,466 2,753,450 5,433,916
Library
General Obligation Bonds 770 2011 2030 3.006% 25,000 4,825 29,825 General Obligation Bonds 780 2012 2020 2.699% 260,000 43,250 303,250 General Obligation Bonds 800 2013 2033 2.169% 165,000 122,200 287,200 General Obligation Bonds 820 2015 2045 3.433% 100,000 99,606 199,606 Total: Library
550,000 269,881 819,881
Transportation (County Road Fund) General Obligation Bonds, Series A 730 2007 2022 4.021% 90,000 2,250 92,250
General Obligation Bonds, Series A 740 2009 2029 3.378% 335,000 121,675 456,675 General Obligation Refunding Bonds 750 2009 2023 2.400% 400,000 10,000 410,000 General Obligation Bonds, Series A 760 2010 2019 2.093% 1,430,000 184,000 1,614,000 GO Bonds, Series B (Bab's) 761 2010 2026 4.761% 0 409,430 409,430 GO Bonds, Series B (Rz's) 762 2010 2030 5.709% 0 16,706 16,706 General Obligation Bonds 770 2011 2030 3.006% 1,045,000 379,239 1,424,239 General Obligation Bonds 780 2012 2032 2.699% 878,000 370,355 1,248,355 General Obligation Refunding Bonds 790 2012 2024 2.511% 1,662,000 189,486 1,851,486 General Obligation Bonds 800 2013 2033 3.169% 555,000 389,200 944,200 General Obligation Bonds 810 2014 2034 2.632% 1,161,000 430,950 1,591,950 General Obligation Refunding Bonds 811 2014 2026 2.194% 604,300 100,578 704,878 General Obligation Bonds 820 2015 2045 3.433% 277,500 272,390 549,890 General Obligation Refunding Bonds 821 2015 2027 2.215% 333 17,656 17,989 General Obligation Bonds 830 2016 2036 2.080% 0 369,801 369,801 Total: Transportation
8,438,133 3,263,716 11,701,849
Debt Service & Capital Planning Section 6 Page 13
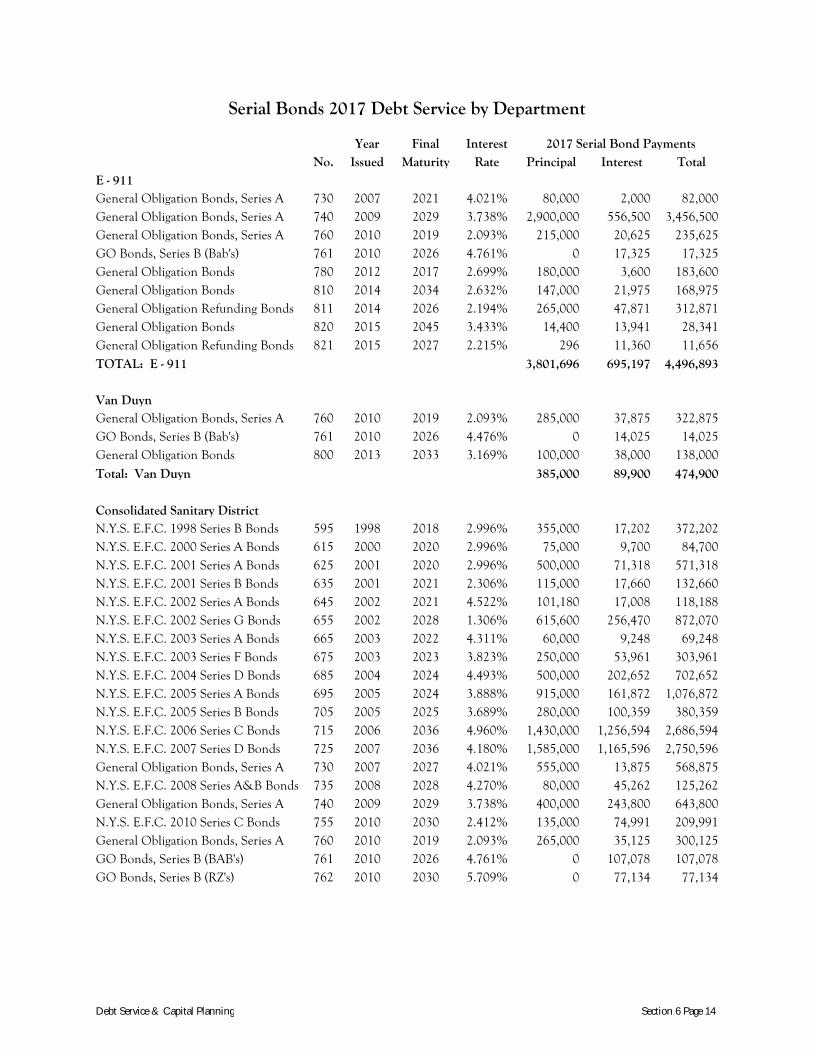
Serial Bonds 2017 Debt Service by Department
Year Final Interest 2017 Serial Bond Payments
No. Issued Maturity Rate Principal Interest Total
E - 911 General Obligation Bonds, Series A 730 2007 2021 4.021% 80,000 2,000 82,000
General Obligation Bonds, Series A 740 2009 2029 3.738% 2,900,000 556,500 3,456,500 General Obligation Bonds, Series A 760 2010 2019 2.093% 215,000 20,625 235,625 GO Bonds, Series B (Bab's) 761 2010 2026 4.761% 0 17,325 17,325 General Obligation Bonds 780 2012 2017 2.699% 180,000 3,600 183,600 General Obligation Bonds 810 2014 2034 2.632% 147,000 21,975 168,975 General Obligation Refunding Bonds 811 2014 2026 2.194% 265,000 47,871 312,871 General Obligation Bonds 820 2015 2045 3.433% 14,400 13,941 28,341 General Obligation Refunding Bonds 821 2015 2027 2.215% 296 11,360 11,656 TOTAL: E - 911
3,801,696 695,197 4,496,893
Van Duyn General Obligation Bonds, Series A 760 2010 2019 2.093% 285,000 37,875 322,875
GO Bonds, Series B (Bab's) 761 2010 2026 4.476% 0 14,025 14,025 General Obligation Bonds 800 2013 2033 3.169% 100,000 38,000 138,000
Total: Van Duyn
385,000 89,900 474,900 Consolidated Sanitary District
N.Y.S. E.F.C. 1998 Series B Bonds 595 1998 2018 2.996% 355,000 17,202 372,202 N.Y.S. E.F.C. 2000 Series A Bonds 615 2000 2020 2.996% 75,000 9,700 84,700 N.Y.S. E.F.C. 2001 Series A Bonds 625 2001 2020 2.996% 500,000 71,318 571,318 N.Y.S. E.F.C. 2001 Series B Bonds 635 2001 2021 2.306% 115,000 17,660 132,660 N.Y.S. E.F.C. 2002 Series A Bonds 645 2002 2021 4.522% 101,180 17,008 118,188 N.Y.S. E.F.C. 2002 Series G Bonds 655 2002 2028 1.306% 615,600 256,470 872,070 N.Y.S. E.F.C. 2003 Series A Bonds 665 2003 2022 4.311% 60,000 9,248 69,248 N.Y.S. E.F.C. 2003 Series F Bonds 675 2003 2023 3.823% 250,000 53,961 303,961 N.Y.S. E.F.C. 2004 Series D Bonds 685 2004 2024 4.493% 500,000 202,652 702,652 N.Y.S. E.F.C. 2005 Series A Bonds 695 2005 2024 3.888% 915,000 161,872 1,076,872 N.Y.S. E.F.C. 2005 Series B Bonds 705 2005 2025 3.689% 280,000 100,359 380,359 N.Y.S. E.F.C. 2006 Series C Bonds 715 2006 2036 4.960% 1,430,000 1,256,594 2,686,594 N.Y.S. E.F.C. 2007 Series D Bonds 725 2007 2036 4.180% 1,585,000 1,165,596 2,750,596 General Obligation Bonds, Series A 730 2007 2027 4.021% 555,000 13,875 568,875 N.Y.S. E.F.C. 2008 Series A&B Bonds 735 2008 2028 4.270% 80,000 45,262 125,262 General Obligation Bonds, Series A 740 2009 2029 3.738% 400,000 243,800 643,800 N.Y.S. E.F.C. 2010 Series C Bonds 755 2010 2030 2.412% 135,000 74,991 209,991 General Obligation Bonds, Series A 760 2010 2019 2.093% 265,000 35,125 300,125 GO Bonds, Series B (BAB's) 761 2010 2026 4.761% 0 107,078 107,078 GO Bonds, Series B (RZ's) 762 2010 2030 5.709% 0 77,134 77,134
Debt Service & Capital Planning Section 6 Page 14

Serial Bonds 2017 Debt Service by Department
Year Final Interest 2017 Serial Bond Payments
No. Issued Maturity Rate Principal Interest Total
N.Y.S. E.F.C. 2011 Series C Bonds 765 2011 2031 1.753% 705,000 424,570 1,129,570 General Obligation Bonds 770 2011 2030 3.006% 110,000 73,550 183,550 N.Y.S. E.F.C. 2012 Series B Bonds 775 2012 2034 1.015% 465,000 281,411 746,411 General Obligation Bonds 780 2012 2032 2.699% 466,000 312,910 778,910 General Obligation Refunding Bonds 790 2012 2025 2.511% 153,000 48,154 201,154 N.Y.S. E.F.C. 2012 Series E Bonds 795 2012 2032 0.779% 180,000 85,063 265,063 General Obligation Bonds 800 2013 2033 3.169% 1,825,000 772,400 2,597,400 N.Y.S. E.F.C. 2014 Series B Bonds 805 2014 2044 0.622% 3,555,000 4,016,474 7,571,474 General Obligation Bonds 810 2014 2034 2.632% 607,000 328,075 935,075 General Obligation Refunding Bonds 811 2014 2026 2.194% 591,800 280,763 872,563 General Obligation Bonds 820 2015 2045 3.343% 488,938 482,399 971,337 General Obligation Refunding Bonds 821 2015 2027 2.215% 2,054 231,426 233,480 General Obligation Bonds 830 2016 2036 2.080% 0 402,715 402,715 Total: Consol. Sanitary District
17,365,572 11,676,815 29,042,387
Drainage Districts
General Obligation Bonds, Series A 730 2007 2027 4.021% 120,000 3,000 123,000 General Obligation Bonds, Series A 740 2009 2029 3.738% 4,000 2,350 6,350 General Obligation Refunding Bonds 750 2009 2023 2.400% 367,000 51,145 418,145 General Obligation Bonds 780 2012 2032 2.99% 14,000 10,035 24,035 General Obligation Refunding Bonds 790 2012 2025 2.511% 95,000 33,266 128,266 General Obligation Refunding Bonds 821 2015 2027 2.215% 444 51,624 52,068 Total: Drainage Districts
600,444 151,420 751,864
Water District General Obligation Bonds 780 2012 2037 2.699% 274,000 246,135 520,135
General Obligation Bonds 800 2013 2033 3.169% 605,000 603,800 1,208,800 General Obligation Bonds 810 2014 2034 2.632% 160,000 142,500 302,500 General Obligation Refunding Bonds 811 2014 2026 2.194% 138,700 64,572 203,272 General Obligation Bonds 820 2015 2045 3.343% 225,000 219,163 444,163 General Obligation Bonds 830 2016 2036 2.080% 0 49,840 49,840 Total: Water District
1,402,700 1,326,010 2,728,710
Total: All Funds
44,776,780 24,554,852 69,331,632
* All payments are as scheduled with no subsidies or other offsets applied
**Does not include Short Term EFC Grid Notes
Debt Service & Capital Planning Section 6 Page 15

Capital Planning
The Capital Process
The Capital Improvement Plan (CIP) serves as a mechanism for defining and prioritizing capital projects that are necessary to maintain the high standard of living that County residents have come to expect. Throughout the CIP, 3 spending priorities emerge: environmental protection, economic development, and operational efficiency.
Capital planning involves the County Executive, members of the County Legislature, heads of various County departments, and a citizen advisory board in a process that determines capital needs, alternatives, and priorities. The development of the Capital Improvement Plan takes place over several months, beginning in February of each year, and includes 5 major phases:
1. In February, department heads begin preparation of project proposals in accordance with executive guidelines.
2. In April, proposals are submitted to the Division of Management and Budget (DMB). The proposals are analyzed by DMB in conjunction with the Syracuse-Onondaga County Planning Agency and the Department of Finance. The Law Department is consulted as needed.
3. By September, a tentative CIP has been approved by the County Executive. It is presented to the Capital Program Committee (a committee made up of legislators and representatives from the executive branch of County government) and the County Planning Board (a citizen advisory group).
4. In September, the Tentative Capital Improvement Plan is presented with the County's Annual Operating Budget to the Ways & Means Committee of the County Legislature and then to the full Legislature in October for approval.
5. From October to February, research on capital planning and management is conducted, and the prior year's process is critiqued. Revisions to forms and instructions are completed.
Coordination and interaction among units of government occurs throughout the process, both formally and informally. The heads of County departments are consulted to discuss questions and recommendations regarding particular projects. Some of the major criteria for evaluating proposals are:
1. Consistency with the stated goals of the County Executive
2. Degree of the overall need for the project
3. Fiscal impact, including the County's capacity to borrow
4. Non-County funding sources
5. Community participation and support
The final product of this process is a 6-year plan to improve those facilities or components of County infrastructure considered necessary to provide or maintain an adequate level of public service.
Debt Service & Capital Planning Section 6 Page 16
Approval by the County Legislature is not a commitment to fund every project in the plan, but rather it is an indication of support for the plan as a whole. Projects, which require borrowing, must be presented to the Legislature individually in order to secure authorization to borrow funds.
The 2010 Development Guide
In 1991, the Onondaga County Legislature adopted the 2010 Development Guide to outline County policy with respect to infrastructure, land development, the environment and fiscal capacity. The Development Guide profiles Onondaga County in terms of natural resources and land use, population, and our local economy. While the Development Guide serves many purposes, clearly the most important is its role in influencing land development within Onondaga County. The 2010 Development Guide provides the planning framework within which capital-spending decisions will be made.
Project Criteria
As a matter of policy, capital requests are not considered for the Capital Improvement Plan if: 1) the total cost of the project is less than $250,000; 2) the probable useful life (PPU) is less than 5 years; 3) the request involves the procurement of light or heavy vehicles. These must be funded through the operating budget and are excluded from the Capital Improvement Plan.
A Brief Summary
In addition to projects, which have been authorized by the County Legislature, the 2017-2022 Capital Improvement Plan (CIP) includes 43 County Wide projects, 11 projects in the Sewer Fund, and 1 project in the Water Fund. All 55 projects recommended for inclusion in the 6-year plan estimate total spending at $486,110,000.
Total funds for the recommended County-wide project, for 6 years, are $234,468,000 of which $46,621,000 will be pay-as-you-go and $113,356,000 will be debt. The rest is State and Federal Aid. The Special Funds projects are expected to cost $251,642,000, of which $31,590,000 will be pay-as-you-go and $220,052,000 will be debt.
Impact on the Operating Budget
Capital projects can affect the operating budget in several ways. First, when funds are borrowed, annual principal and interest payments to retire the debt must be made. The County’s budget to pay scheduled debt payments is presented in the Annual Budget as Debt Service (Debt Service Fund). Additionally, scheduled debt service payments are summarized by department and fund, as well as specified by individual borrowing, in the Debt Service Fund section.
As an alternative to assuming debt, some capital projects are funded on a “pay-as-you-go” basis through departmental operating budgets. Most engineering studies are funded in this manner. Finally, operating costs associated with a project, such as utilities and maintenance, may cause a change in departmental budgets. The impact of these anticipated changes is calculated during the operating budget process as well as in the review, analysis and decision-making process for each capital project. A very brief summary of those projects anticipated to require funding in 2017 is included in this section. Additionally included are:
1. Estimated 6 year costs for the proposed projects in the CIP
Debt Service & Capital Planning Section 6 Page 17

2. The proposed source of funding for those projects
3. Summary of the estimated debt service for:
currently scheduled debt
debt which has been authorized but not yet issued
estimated debt service if all of the proposed projects were to be authorized by the County Legislature
It is important to note that the summary of estimated debt service schedule shows a maximum possible debt obligation through the payoff period.
2017 – 2022 Capital Priorities
Debt Service & Capital Planning Section 6 Page 18

CIP Proposed Projects
Six Year Summary of Estimated Expenses ($ in 000’s)
Countywide Status Project 2017 - 22 Total
General Fund Emergency Communications Auxiliary Power Systems Replacement 622 Computer Aided Dispatch (CAD) System Hardware Refresh 975 new E911 Center Roof Replacement (NEW) 303 Next Generation 911 (NG-911) Telephone System Replacement/refresh 3,659 Oblique Aerial Digital Imagery Refresh 394 Public Safety Radio Tower Replacement 604 Trunked Land Mobile Radio Network Backup Prime Site 1,964 ------------------------ Subtotal $ 8,521
Facilities Management Carnegie Library Rehabilitation 3,957 Civic Center Office and Masonry Improvements 1,487 Community Plaza Garage 1,299 Courthouse - HVAC Renovations 10,400 Facilities Various Capital Improvements 7,100 Oncenter Rehabilitations 2,000 Remodeling TA Intake 2,503 ------------------------ Subtotal $ 28,746
Hillbrook Detention Home new Hillbrook Detention Facility Improvements (NEW) 394 ------------------------ Subtotal $ 394
Office Of Environment Ash Tree Management 4,500 ------------------------ Subtotal $ 4,500
Parks & Recreation Dept. Beach Development at Onondaga Lake Park 300 new Building an AZA Required Animal Medical Care Center with African Savannah Exhibit (NEW) 14,100 new Carpenters Brook Fish Hatchery Pond Repair (NEW) 402 Lights on the Lake Storage Facility 330 Long Branch Park Improvements 1,950 new Onondaga Lake Park Shoreline Stabilization (NEW) 756 Park Buildings 720 Park Improvements/Willow Bay 2,720 Park Roads, Parking Areas, and Trail Paving 3,750 Park Roofs 569 Salt Museum Rehabilitation 310 ------------------------ Subtotal $ 25,907 General Fund Total $ 68,068
Debt Service & Capital Planning Section 6 Page 19

Countywide Status Project 2017 - 22 Total
Community College Onondaga Community College Allyn Hall Upgrades and Improvements 2,780 Critical roof maintenance 3,254 Elevator Replacement and Upgrades/ Protection of the Campus E-mail and Phone Servers 646 Infrastructure - Campus Wide 10,488 Site Improvements 2,718 Student Center Renovation and Redesign 3,950 ------------------------ Community College Total $ 23,836
County Road Transportation Bituminous Surface Treatment 9,376 Bridges 12,198 Capital Highway Construction 29,127 Caughdenoy Road / NYS Route 31 Road Improvements 4,120 Cold Mix Bituminous Paving 20,406 Guide Rail 3,060 Rehabilitation of North Area and Camillus Highway Maintenance Facilities 17,000 Repaving Program (Hot Mix Bituminous) 39,447 Testing, Drainage and Facilities Repair 5,820 Traffic Systems Management 2,010 ------------------------
County Road Total $ 142,564 Countywide Total $ 234,468
Debt Service & Capital Planning Section 6 Page 20

CIP Proposed Projects
Six Year Summary of Estimated Expenses ($ in 000’s)
Special Funds Status Project 2017 - 22 Total
Sewer Water Environment Protection Baldwinsville Seneca Knolls WWTP Disinfection and Phase II Asset Renewal Improvements 20,186 new Bear Trap - Ley Creek North Midler Culvert Repair Project 130 Brewerton WWTP Asset Renewal Improvements 7,400 new Camillus Force Main Replacement 10,000 Energy Efficiency Improvements/Performance Contracting 26,300 new Harbor Brook Miscellaneous Culvert and Channel Improvements 800 new Meadowbrook-Limestone WWTP Disinfection System and Collection System Improvements 18,725 Metro WWTP Phosphorus Treatment System Optimization 22,005 new Oak Orchard Disinfection and Lagoon Cleaning 6,024 new Oak Orchard WWTP Secondary Clarifier Rehabilitation 7,150 Wastewater Transportation System Improvements 95,323 ------------------------
Sewer Total $ 214,043 Water Metropolitan Water Board Water Treatment Plant Comprehensive Improvements 37,599 ------------------------
Water Total $ 37,599
Special Funds Total $ 251,642 Grand Total $ 486,110
Debt Service & Capital Planning Section 6 Page 21

Funding Sources of Proposed Projects
Countywide 2017 2018 2019 2020 2021 2022 6yr Total General Fund Pay as You Go 1,000 1,000 1,000 1,000 4,000 Authorized Borrowing 2,801 500 500 3,801 Borrowing to be Authorized 2,153 14,982 18,639 10,593 12,300 1,250 59,917 State Aid 350 350
Sub Totals $4,954 $16,832 $20,139 $11,593 $13,300 $1,250 $68,068
County Road Pay as You Go 2,121 8,100 8,100 8,100 8,100 8,100 42,621 Borrowing to be Authorized 17,220 10,900 2,400 2,400 2,400 2,400 37,720 Federal Aid 8,080 13,025 1,130 2,400 24,635 State Aid 6,405 8,083 5,730 6,090 5,640 5,640 37,588
Sub Totals $33,826 $40,108 $17,360 $18,990 $16,140 $16,140 $142,564
Community College Borrowing to be Authorized 2,677 3,072 6,169 11,918 State Aid 2,677 3,072 6,169 11,918
Sub Totals $5,354 $6,144 $12,338 $23,836
Countywide TOTALS $38,780 $62,294 $43,643 $42,921 $29,440 $17,390 $234,468
Special Funds 2017 2018 2019 2020 2021 2022 6yr Total Water Authorized Borrowing 3,472 3,472 Borrowing to be Authorized 3,127 13,000 13,000 5,000 34,127
Sub Totals $3,472 $3,127 $13,000 $13,000 $5,000 $37,599
Sewer Pay as You Go 7,250 7,042 5,277 3,947 4,047 4,027 31,590 Authorized Borrowing 5,064 4,898 3,387 577 110 14,036 Borrowing to be Authorized 19,256 24,246 43,063 45,187 27,665 9,000 168,417
Sub Totals $31,570 $36,186 $51,727 $49,711 $31,822 $13,027 $214,043
Special Funds TOTALS $35,042 $39,313 $64,727 $62,711 $36,822 $13,027 $251,642
GRAND TOTAL $73,822 $101,607 $108,370 $105,632 $66,262 $30,417 $486,110
Debt Service & Capital Planning Section 6 Page 22
CIP Proposed Projects
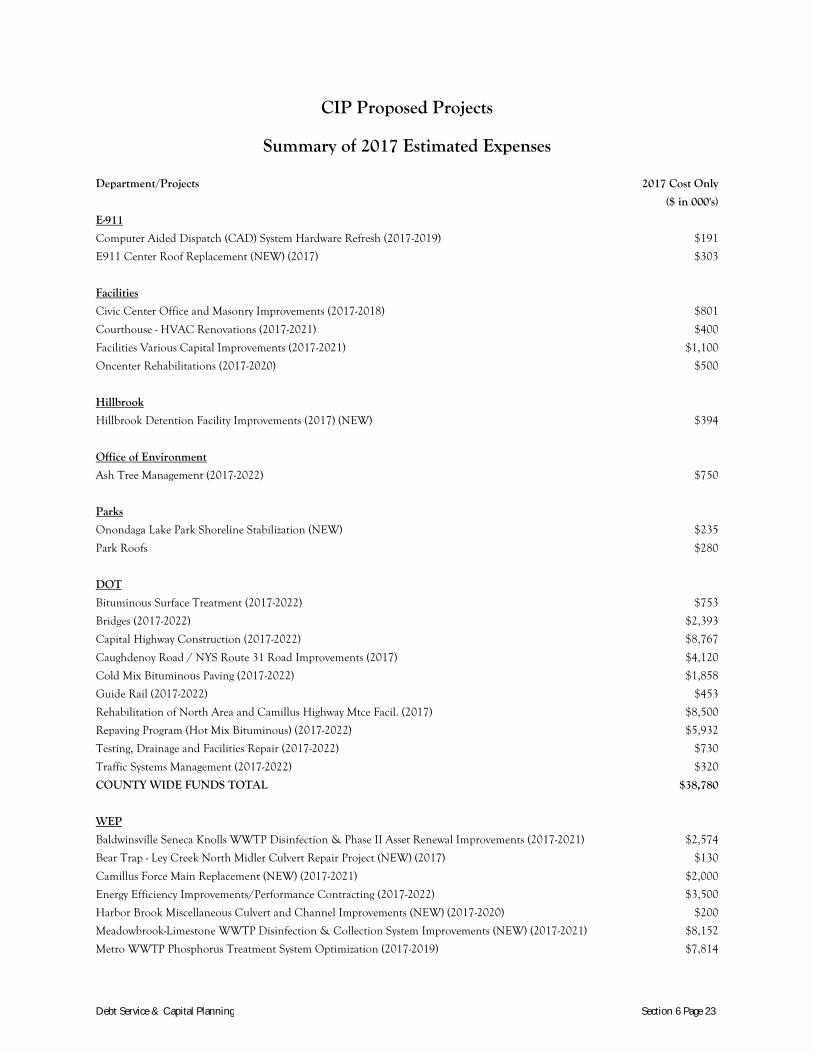
Summary of 2017 Estimated Expenses
Department/Projects 2017 Cost Only
($ in 000's)
E-911 Computer Aided Dispatch (CAD) System Hardware Refresh (2017-2019) $191
E911 Center Roof Replacement (NEW) (2017) $303
Facilities Civic Center Office and Masonry Improvements (2017-2018) $801
Courthouse - HVAC Renovations (2017-2021) $400
Facilities Various Capital Improvements (2017-2021) $1,100
Oncenter Rehabilitations (2017-2020) $500
Hillbrook Hillbrook Detention Facility Improvements (2017) (NEW) $394
Office of Environment Ash Tree Management (2017-2022) $750
Parks Onondaga Lake Park Shoreline Stabilization (NEW) $235
Park Roofs $280
DOT Bituminous Surface Treatment (2017-2022) $753
Bridges (2017-2022) $2,393
Capital Highway Construction (2017-2022) $8,767
Caughdenoy Road / NYS Route 31 Road Improvements (2017) $4,120
Cold Mix Bituminous Paving (2017-2022) $1,858
Guide Rail (2017-2022) $453
Rehabilitation of North Area and Camillus Highway Mtce Facil. (2017) $8,500
Repaving Program (Hot Mix Bituminous) (2017-2022) $5,932
Testing, Drainage and Facilities Repair (2017-2022) $730
Traffic Systems Management (2017-2022) $320
COUNTY WIDE FUNDS TOTAL $38,780
WEP Baldwinsville Seneca Knolls WWTP Disinfection & Phase II Asset Renewal Improvements (2017-2021) $2,574
Bear Trap - Ley Creek North Midler Culvert Repair Project (NEW) (2017) $130
Camillus Force Main Replacement (NEW) (2017-2021) $2,000
Energy Efficiency Improvements/Performance Contracting (2017-2022) $3,500
Harbor Brook Miscellaneous Culvert and Channel Improvements (NEW) (2017-2020) $200
Meadowbrook-Limestone WWTP Disinfection & Collection System Improvements (NEW) (2017-2021) $8,152
Metro WWTP Phosphorus Treatment System Optimization (2017-2019) $7,814
Debt Service & Capital Planning Section 6 Page 23

Oak Orchard WWTP Secondary Clarifier Rehabilitation (NEW) (2017-2020) $950
Wastewater Transportation System Improvements (2017-2022) $6,250
MWB Water Treatment Plant Comprehensive Improvements (2017-2022) $3,472
ALL FUNDS TOTAL $73,822
Debt Service & Capital Planning Section 6 Page 24
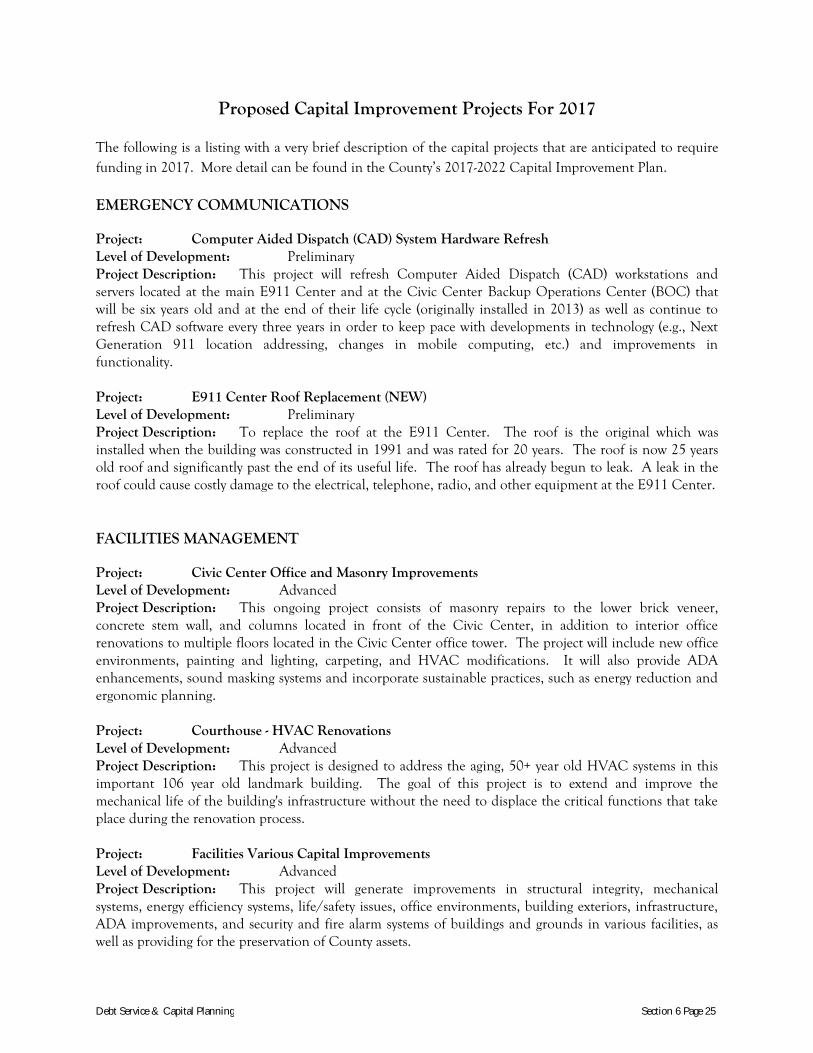
Proposed Capital Improvement Projects For 2017
The following is a listing with a very brief description of the capital projects that are anticipated to require funding in 2017. More detail can be found in the County’s 2017-2022 Capital Improvement Plan.
EMERGENCY COMMUNICATIONS
Project: Computer Aided Dispatch (CAD) System Hardware Refresh Level of Development: Preliminary Project Description: This project will refresh Computer Aided Dispatch (CAD) workstations and servers located at the main E911 Center and at the Civic Center Backup Operations Center (BOC) that will be six years old and at the end of their life cycle (originally installed in 2013) as well as continue to refresh CAD software every three years in order to keep pace with developments in technology (e.g., Next Generation 911 location addressing, changes in mobile computing, etc.) and improvements in functionality. Project: E911 Center Roof Replacement (NEW) Level of Development: Preliminary Project Description: To replace the roof at the E911 Center. The roof is the original which was installed when the building was constructed in 1991 and was rated for 20 years. The roof is now 25 years old roof and significantly past the end of its useful life. The roof has already begun to leak. A leak in the roof could cause costly damage to the electrical, telephone, radio, and other equipment at the E911 Center.
FACILITIES MANAGEMENT
Project: Civic Center Office and Masonry Improvements Level of Development: Advanced Project Description: This ongoing project consists of masonry repairs to the lower brick veneer, concrete stem wall, and columns located in front of the Civic Center, in addition to interior office renovations to multiple floors located in the Civic Center office tower. The project will include new office environments, painting and lighting, carpeting, and HVAC modifications. It will also provide ADA enhancements, sound masking systems and incorporate sustainable practices, such as energy reduction and ergonomic planning. Project: Courthouse - HVAC Renovations Level of Development: Advanced Project Description: This project is designed to address the aging, 50+ year old HVAC systems in this important 106 year old landmark building. The goal of this project is to extend and improve the mechanical life of the building's infrastructure without the need to displace the critical functions that take place during the renovation process. Project: Facilities Various Capital Improvements Level of Development: Advanced Project Description: This project will generate improvements in structural integrity, mechanical systems, energy efficiency systems, life/safety issues, office environments, building exteriors, infrastructure, ADA improvements, and security and fire alarm systems of buildings and grounds in various facilities, as well as providing for the preservation of County assets.
Debt Service & Capital Planning Section 6 Page 25

Project: Oncenter Rehabilitations Level of Development: Advanced Project Description: We propose to replace, rehabilitate and restore various fatigued, out of date and failing systems and components within the Oncenter Building group. This will include, but will not be limited to, theater enhancements of acoustical treatments, ADA upgrades and appurtenances, building systems modifications, as well as lighting and insulation replacements.
OFFICE OF ENVIRONMENT
Project: Ash Tree Management Level of Development: Intermediate Project Description: Emerald Ash Borer (EAB), an invasive species of beetle that kills ash trees, arrived in the U.S. around 2002 and is spreading across the Country. The beetle is already infesting ash trees in Onondaga County. One in nine trees in Onondaga County is an ash tree. Onondaga County has developed and is implementing an Emerald Ash Borer (EAB) management strategy in order to minimize the hazard risk to the community, the impact of EAB on County operations and to plan for and minimize EAB costs (tree removal/inoculation, manpower and equipment, disposal and tree replacement). All County-owned ash trees with potential targets in the drop zone (people or physical assets) will need to be removed or inoculated to protect the public, protect assets and reduce liability.
PARKS & RECREATION
Project: Onondaga Lake Park Shoreline Stabilization (NEW) Level of Development: Advanced Project Description: The Onondaga Lake Park shoreline has areas that are in need of stabilization. This project provides funding of $756,000 to be authorized to complete 4 different phases of the project over the next 4 years. The goal of this project is to prevent the further erosion of the existing shoreline. Project: Park Roofs Level of Development: Intermediate Project Description: Many roofs throughout Onondaga County Parks are in dire need of replacement.
TRANSPORTATION
Project: Bituminous Surface Treatment Level of Development: Ongoing Project Description: This project provides for the treatment of County highways with a bituminous surface treatment to prolong the life of the wearing surface. Project: Bridges Level of Development: Ongoing Project Description: This program addresses the maintenance and repair of bridges within the County highway system.
Debt Service & Capital Planning Section 6 Page 26
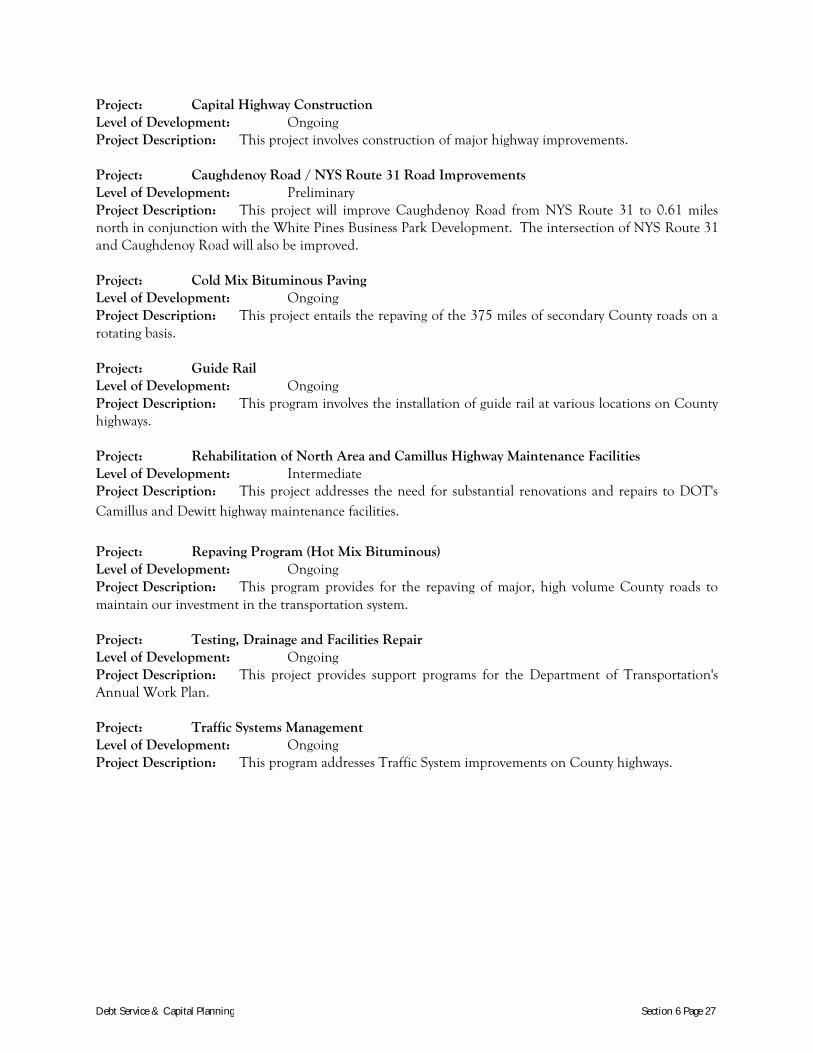
Project: Capital Highway Construction Level of Development: Ongoing Project Description: This project involves construction of major highway improvements. Project: Caughdenoy Road / NYS Route 31 Road Improvements Level of Development: Preliminary Project Description: This project will improve Caughdenoy Road from NYS Route 31 to 0.61 miles north in conjunction with the White Pines Business Park Development. The intersection of NYS Route 31 and Caughdenoy Road will also be improved. Project: Cold Mix Bituminous Paving Level of Development: Ongoing Project Description: This project entails the repaving of the 375 miles of secondary County roads on a rotating basis. Project: Guide Rail Level of Development: Ongoing Project Description: This program involves the installation of guide rail at various locations on County highways. Project: Rehabilitation of North Area and Camillus Highway Maintenance Facilities Level of Development: Intermediate Project Description: This project addresses the need for substantial renovations and repairs to DOT's Camillus and Dewitt highway maintenance facilities. Project: Repaving Program (Hot Mix Bituminous) Level of Development: Ongoing Project Description: This program provides for the repaving of major, high volume County roads to maintain our investment in the transportation system. Project: Testing, Drainage and Facilities Repair Level of Development: Ongoing Project Description: This project provides support programs for the Department of Transportation's Annual Work Plan. Project: Traffic Systems Management Level of Development: Ongoing Project Description: This program addresses Traffic System improvements on County highways.
Debt Service & Capital Planning Section 6 Page 27

METROPOLITAN WATER BOARD
Project: Water Treatment Plant Comprehensive Improvements Level of Development: Preliminary Project Description: This project will implement comprehensive improvements at the MWB Water Treatment Campus required to replace and repair end-of-life equipment to reduce further deterioration; to assure continued compliance with current water quality regulatory standards; to reduce chemical consumption/costs, to optimize energy efficiency, and to advance operations technology in a manner that will improve productivity.
WATER ENVIRONMENT PROTECTION
Project: Baldwinsville Seneca Knolls WWTP Rehabilitation Project Level of Development: Preliminary Project Description: The Baldwinsville-Seneca Knolls Wastewater Treatment Plant was issued a renewed SPDES Discharge Permit in June 2014 by the New York State Department of Environmental Conservation (NYSDEC) which included modifications to the effluent total residual chlorine (TRC) limit from 2.0 mg/L to 0.08 mg/L. The new TRC permit limits will become effective beginning May 15, 2018. The WWTP currently has no means to dechlorinate the effluent to meet this limit. Therefore, the County initiated this project to design and construct upgrades to the disinfection system which will enable the new TRC limit to be met. Additionally, the plant is over 30 years old. Various small and discrete improvements and repairs have been done to the facility as a means of operational enhancements and infrastructure maintenance. However, there is a contemporary need to implement a robust infrastructure renewal project for many of the treatment plant's assets so as to ensure continued satisfactory operation and extend its service life. This project is for Phase II asset renewal improvements.
Project: Bear Trap - Ley Creek North Midler Culvert Repair Project (NEW) Level of Development: Preliminary Project Description: Repair of 1950s vintage concrete box culvert located on North Midler Avenue in the Town of DeWitt. Project: Camillus Force Main Replacement (NEW) Level of Development: Preliminary Project Description: Replacement of a 24 inch diameter, 7 mile long wastewater pipeline. Project: Energy Efficiency Improvements/Performance Contracting Level of Development: Preliminary Project Description: This project entails working with an energy service company (ESCO, a commercial business providing a broad range of comprehensive energy solutions including designs and implementation of energy savings projects, energy conservation, power generation and energy supply, and risk management) to design and implement various process and infrastructure improvements for energy savings. The project serves to support the County's effort to pursue sustainability, affect the goals of the County's Climate Action Plan, reduce energy usage, and correspondingly reduce annual operating costs.
Debt Service & Capital Planning Section 6 Page 28

Project: Harbor Brook Miscellaneous Culvert and Channel Improvements (NEW) Level of Development: Intermediary Project Description: Repair and rehabilitation of 110 year old culvert and channel sections within the Harbor Brook Drainage District. Project would include rehabilitation of the concrete wing walls near Delaware and Amy Streets and rehabilitation of selected culvert sections. Project: Meadowbrook-Limestone WWTP Disinfection & Collection System Improvements
(NEW) Level of Development: Advanced Project Description: The Meadowbrook-Limestone Wastewater Treatment Plant (WWTP) was issued a renewed SPDES Discharge Permit in June 2014 by the New York State Department of Environmental Conservation (NYSDEC) which included modifications to the effluent total residual chlorine (TRC) limit from 2.0 mg/L to 0.02 mg/L. The new TRC permit limits will become effective beginning May 15, 2018. The WWTP currently has no means to dechlorinate the effluent to meet this limit. Therefore, the County initiated this project to design and construct upgrades to the disinfection system which will enable the new TRC limit to be met. Additionally, the treatment plant is in need of several other asset renewal measures. This project also provides for necessary collection system improvements so as to reduce extraneous flow coming into the plant. Project: Metro WWTP Phosphorus Treatment System Optimization Level of Development: Intermediate Project Description: This project is for various modifications, upgrades, and improvements to Metro's Wastewater Treatment Plant (WWTP) Biological Aerated Filter (BAF) and High-Rate Flocculated Settling (HRFS) systems so as to enhance and maximize system performance. The BAF and HRFS systems are those unit processes used at Metro to remove ammonia and phosphorus, respectively, in accordance with NYSDEC SPDES permit mandates. The project will also serve to respond to the improvement needs born out of the November 2009 4th Stipulation of the ACJ and the Onondaga Lake Total Maximum Daily Load (TMDL) for phosphorus. Project: Oak Orchard Disinfection and Lagoon Cleaning (NEW) Level of Development: Intermediate Project Description: The Oak Orchard Wastewater Treatment Plant was issued a new York State Pollutant Discharge Elimination System (SPDES) permit in June 2014 which contained more restrictive disinfection limits in terms of allowable chlorine residual. The existing infrastructure is inadequate to meet those new limits. Consequently, new and additional process tankage and chemical treatment systems will be installed to meet those new limits. In addition, cleaning and improvements are necessary for the onsite lagoons so as to ensure SPDES compliance and continued satisfactory plant operations. Project: Wastewater Transportation System Improvements Level of Development: Ongoing Project Description: This project consists of three primary or categorical elements: pump station improvements, trunk sewer improvements, and facility maintenance improvements (i.e., paving, roofing, and larger-scale maintenance activities).
Debt Service & Capital Planning Section 6 Page 29