deal capsule · 2020-07-04 · deal capsule transactions in chemicals & pharmaceuticals april...
TRANSCRIPT

Deal CapsuleTransactions in Chemicals & Pharmaceuticals
April 2015
highlighTs• M&A market for the pharmaceutical sector continued at a frenzied
pace during Q1 2015. Total completed deal value at €156 billion not only tripled in comparison to Q1 2014 but also surpassed 2012 and 2013.
• All of the top 10 pharmaceutical deals (completed as well as announced) are each over € 1 billion. Key therapy areas for pharmaceutical M&A include oncology, gastro-intestinal and anti-infectives. Renewed interest in antibiotics coincides with governmental incentives offered. The FDA approval of biosimilar pathways will spur M&A interest in the Us biosimilars market.
• in Q1 2015, the chemical sector showed higher levels of M&A activity as compared to Q1 2014. Four of the top 10 completed as well as announced deals were valued above $1 billion.
• specialization continues to be the driving force for M&A.
• Us followed by China are consistently the most active M&A countries in both sectors. Other markets where M&A activity increased in Q1 2015 included Japan (outbound) and south Korea (domestic) for the chemicals sector and France for both sectors.
• KPMg’s Deal Thermometer suggests that the environment for M&A activity will remain ‘hot’ in pharmaceuticals and ‘Moderate’ in chemicals.
DeAl TheRMOMeTeR Q1 2015KPMG’s Deal Thermometer signals the environment for M&A deals in chemicals and pharmaceuticals. It combines the appetite for deals (changes in forward P/E ratios) with the capacity to fund deals (changes in Net Debt/EBITDA multiples). ‘Hot’ signifies an environment conducive to deal-making.
HOT
MODERATE
COOL
DEAL APPETITE (Forward P/E ratio)
DEAL APPETITE (Forward P/E ratio)
Sources: Capital IQ, KPMG Analysis Sources: Capital IQ, KPMG Analysis
PHARMACEuTICALS CHEMICALSDEAL CAPACITy(Net debt/EBITDA)
DEAL CAPACITy(Net debt/EBITDA)
Q1 2014
16.5
18.3
Q1 2015
11%
Q1 2014
12.8
14.1
Q1 2015
10%
1.3x1.2x
3%
Q1 2014
Q1 2015
Chemical and pharmaceutical M&A activity jump-starts the year 2015 with several mega deals dominating the deal landscape.
vIr lAkshmAN | hEAD oF chEmIcAls & PhArmAcEuTIcAls, kPmG IN GErmANy
“ ”
sources: Thomson one, kPmG Analysis
FIGurE 2: DEAL vALuE By SECTOR 2012-2015 ($ Billion)
2012 2013 2014 Q1 2014 Q1 2015
7932111
72
51123 162
52214
50
5815617
173
PHARMACEuTICALS CHEMICALS
FIGurE 1: NuMBER Of DEALS By SECTOR 2012-2015
sources: Thomson one, kPmG Analysis
643
7961,439
2012 2013
602
7031,305
2014
606
5851,191
Q1 2014
280
Q1 2015
301
PHARMACEuTICALS CHEMICALS
0.1x
Q1 2014
0.5x
Q1 2015
70%
134146
159142
8
© 2015 KPMG AG Wirtschaftsprüfungsgesellschaft, a member firm of the KPMG network of independent member firms affiliated with KPMG International Cooperative (“KPMG International”), a Swiss entity. All rights reserved. Printed in Germany. The KPMG name, logo and “cutting through complexity” are registered trademarks of KPMG International.
2 | Deal Capsule | April 2015
PHARMACEUTICALS
in Q1 2015, top 10 completed deals amount to a total value of $134 billion with the largest completed deal valued at $70.5 billion, indicating that the wave of mega deals is continuing well into 2015. half of the top deals in the sector involve Us targets, the other half targets european countries. strategic investors are showing keen interest in orphan drugs, antibiotics and biosimilars.
DeAl FOCUs AReAs
Orphan drugs
since the Orphan Drug Act of 1983, the Us fosters orphan drug development by granting seven years of exclusivity beyond patent expiry, a waiver for Us Food and Drug Administration (FDA) fees and tax credits. The passage of the FDA safety innovation Act in 2013 made it easier to get them through clinical trials. Medications for rare diseases can be priced high enough to cover R&D costs, insurance companies reimburse most patient costs.
shire PlC’s acquisition of NPs Pharmaceuticals inc. brought with it various gastrointestinal and orphan drugs including the rights to Natpara, an orphan drug awaiting FDA approval. if approved, shire would be the only provider of bioengineered hormone replacement therapy treating hypoparathybroidism. shire will also add gattex/Revesitive, a drug treatment for a rare gastrointestinal condition.
Aegerion Pharmaceuticals inc., too, is interested in orphan drugs by acquiring Myalept from AstraZeneca PlC for $325 million. Myalept treats complications of leptin deficiency in patients with generalized lipodystrophy.
Interest in antibiotics renewed: Cubist leads the way
Deal activity in antibiotics has been limited in the past, due to lower margins as compared with other lucrative segments such as cancer medicines. however, an uptick in deal activity is expected, driven by government incentives and increasing health concerns. For example, in Q1 2015, Us President Barack Obama’s 2016 budget has proposed a historic investment of $1.2 billion to combat antibiotic-resistant bacteria. in the Us, at least two million illnesses and 23,000 deaths are caused by antibiotic-resistant bacteria each year.
Merck & Co. inc. acquired Cubist Pharmaceuticals inc., a global leader in antibiotics with an annual research budget for antibiotics of $400 million. Merck gains access to Cubist’s primary revenue generator, Cubicin. it also adds Zerbaxta and sivextro, two of the four antibacterial drugs approved by the FDA in 2014, both designated ‘Qualified infectious Disease Products’ treating a serious or life threatening infection. The deal is expected to contribute over $1 billion in revenue in 2015.
AstraZeneca announced the carve-out of its early stage antibiotic research in order to focus on core areas such as cancer and diabetes. AstraZeneca will create a standalone company in which it plans to invest $40 million, while exploring potential partnerships. AstraZeneca has one of the strongest antibiotic pipelines in the industry including a Phase ii clinical trial drug for gonorrhoea. The new structure would not impact already marketed and late-stage medicines.
FIGurE 3: SELECTED COuNTRIES IN PHARMACEuTICAL M&A Q1 2015
sources: Thomson one, kPmG Analysis
fOREIGN ACQuIRERDOMESTIC ACQuIRER
23
14
25
0
9
1 06
4 0
13
1 36 5
1 1 2
us chINA FrANcE INDIA uk sWITZEr-lAND
cANADA s. korEA GErmANy JAPAN
3 0
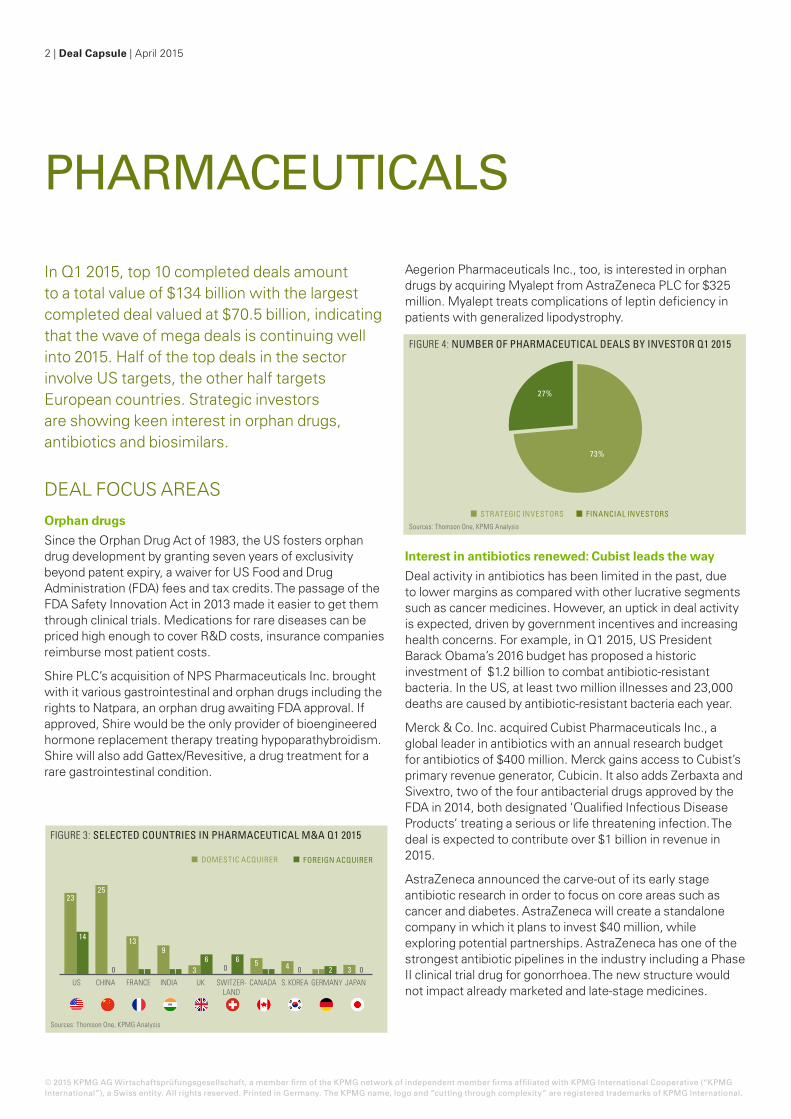
FIGurE 4: NuMBER Of PHARMACEuTICAL DEALS By INvESTOR Q1 2015
sources: Thomson one, kPmG Analysis
fINANCIAL INvESTORSSTRATEGIC INvESTORS
73%
27%
© 2015 KPMG AG Wirtschaftsprüfungsgesellschaft, a member firm of the KPMG network of independent member firms affiliated with KPMG International Cooperative (“KPMG International”), a Swiss entity. All rights reserved. Printed in Germany. The KPMG name, logo and “cutting through complexity” are registered trademarks of KPMG International.

April 2015 | Deal Capsule | 3
Biosimilars
in March 2015, Novartis Ag’s sandoz announced that the FDA approved Zarxio. This makes sandoz the first firm to receive approval of a biosimilar through the new FDA biosimilars pathway established under the Biologics Price Competition and innovation Act. Unlike europe, biosimilars have been unavailable in the Us as these were excluded in the landmark 1984 hatch-Waxman law, prohibiting cheaper generic copies derived from biotechnology. The approval is likely to open the gates for further investments.
in Q1 2015, Pfizer inc. announced the $17 billion acquisition of hospira inc., the leading global provider of injectable drugs and infusion technologies as well as a leader in biosimilars. Pfizer expects to bolster its biosimilars business with hospira’s marketed and late-stage pipeline candidates, expecting a global marketplace for biosimilars of approximately $20 billion in 2020. Beyond biosimilars, the deal would align complementary product portfolios and product pipelines. Pfizer expects annual cost savings up to $800 million by 2018.
CAPiTAl iNDeXThe pharma indices continue to outperform the MsCi world index, with europe and Asia Pacific in particular performing strongly and widening the gap to Us indices.
ChiNAin Q1 2015, a total of 31 listed pharmaceutical companies completed or announced new share issuance amounting to $6.5 billion for acquisitions or capital investments.
Many of the Chinese deals focused on specific therapy areas such as cardiovascular, anti-virus and anti-tumor products as well as geographic expansion within China. For example, in Q1 2015, huapont-Nutrichem Co., ltd. acquired Tibet linzhi Baisheng Pharmaceutical Co., ltd. for $300 million investing in cardiovascular medicine and allowing for expansion into the Northeast Chinese market.
The online pharmacy market is also attracting investments. For example, in January 2015, an investor group including Alibaba group founder Jack Ma’s Pe firm Yunfeng Capital announced to invest $1.6 billion in guangzhou Baiyunshan Pharmaceutical holdings Co., ltd., to establish a medical e-commerce platform. While OTC drugs, health products and home medical can already be sold online, China FDA plans to relax regulations of prescription drugs, which would result in an online pharmacy market worth close to $161 billion.
FIGurE 7: PHARMACEuTICAL DEALS IN SELECTED COuNTRIES IN Q1 2015
sources: Thomson one, kPmG Analysis
TARGET NATIONSACQuIRER NATIONS36 37
6 6
10 9
2 3
9 10
15 14
2
6
25 25
53
us cANADA FrANcE uk sWITZEr-lAND
GErmANy chINA INDIA JAPAN s. korEA
4 4
FIGurE 5: DEvELOPMENT Of PHARMA SHARE PRICES Q1 2015
sources: Bloomberg, kPmG Analysis
JAN FEB mAr
MSCI wORLD INDExS&P 500 PHARMA INDEx
BLOOMBERG EuROPE 500 PHARMA INDExBLOOMBERG ASIA PACIfIC PHARMA INDEx
90
100
115
110
120
125
105
95
FIGurE 6: DEAL ACTIvITy By TARGET’S MAIN THERAPy AREA
The bubbles reflect the total deal value in the respective therapeutic area. All pharma deals greater than $1 billion announced during the last 12 months (except withdrawn).sources: Thomson one, kPmG Analysis; Thomson one, EvaluatePharma
0
2
4
6
Num
ber o
f dea
ls
42.0
4.4
11.8
78.816.0
22.2
30.0
22.4 11.4
14.33.0
Cardiovascular Respiratory, Otology & Ophthalmology Gastro-intestinal Generics & Biosimilars Animal Health Oncology and immunomodulators Central Nervous System Endocrine & Genito-urinary Systemic anti-infectives Over-the-counter Multiple sectors
© 2015 KPMG AG Wirtschaftsprüfungsgesellschaft, a member firm of the KPMG network of independent member firms affiliated with KPMG International Cooperative (“KPMG International”), a Swiss entity. All rights reserved. Printed in Germany. The KPMG name, logo and “cutting through complexity” are registered trademarks of KPMG International.

4 | Deal Capsule | April 2015
BIDDER TARGET THERAPY AREA DEAl sTATusToTAl
vAluE1
Abbvie Inc. Pharmacyclics Inc. Cancer and immune mediated diseases
Tender offer subject to customary closing conditions, antitrust approval
21.0
Pfizer Inc. Hospira Inc. Injectable drugs, infusion technologies, and biosimilars
Pending shareholder and antitrust approval 17.0
valeant Pharmaceuticals International Inc. Salix Pharmaceuticals Ltd. Gastrointestinal disease Completed on 01 April 2015 15.8
Teva Pharmaceutical Industriesm Ltd. Auspex Pharmaceuticals Inc. Hyperkinetic movement disorders
and other rare diseasesPending shareholder and antitrust approval 3.5
Mallinckrodt PLC Ikaria Inc. Cancer and immune diseases Pending antitrust approval 2.3
Investor Group including Xinliyi Group Co. , Ltd. Hubei Biocause Pharm Co., Ltd. Eye care, neurosciences,
dermatology, and urology Pending shareholder and antitrust approval 1.6
Investor Group including Yunfeng Capital
Guangzhou Baiyunshan Pharmaceutical Holdings Co., Ltd.
Neuroscience, gastrointestinal, internal medicine Pending 1.6
Bristol-Myers Squibb Co. flexus Biosciences Inc. Anti-cancer therapeutics Completed 08 April 2015 1.3
Concordia Healthcare Corp. Commercial assets of Covis Pharma S.à.r.l and Covis Injectables, S.à.r.l Generics Board of Directors approval,
pending antitrust approval 1.2
Depomed Inc. Janssen Pharmaceuticals Inc. – uS-rights to Nucynta & Nucynta ER
Acute and severe pain management Completed 02 April 2015 1.1
TAbLE 1: GLobAL ToP dEALS CoMPLETEd In Q1 2015
TAbLE 2: GLobAL ToP dEALS AnnoUnCEd In Q1 2015, yET To CLoSE
BIDDER TARGET THERAPY AREA vAluE1conTInGEnT
PAYmEnTs1ToTAl
vAluE1
Actavis PLC Allergan Inc. Ophthalmology, neurosciences, dermatology, cosmetics and urology 70.5
Novartis AG GlaxoSmithKline PLC – Oncology Business Oncology 14.5 1.5 16.0
Merck & Co. Inc. Cubist Pharmaceuticals Inc. Anti-infective therapies for the acute care environment 9.5
GlaxoSmithKline PLC Novartis AG – vaccine Business vaccines 5.3 1.8 7.1
Mylan Inc. Abbott Laboratories – Non-uS generics business
Cardio/metabolic, gastrointestinal medicine etc. 6.3
Laboratory Corporation of America Holdings Covance Inc. CRO providing drug development 6.2
Eli Lilly & Co. Novartis AG – Animal Health Division Animal health 5.4
Shire PLC NPS Pharmaceuticals Inc. Bone and mineral, gastrointestinal and central nervous system disorders 5.2
Sun Pharmaceutical Industries Ltd. Ranbaxy Laboratories Ltd. Generics 4.0
Perrigo Co. PLC Omega Pharma N.v. OTC 3.8
$134.0 billion
$66.4 billion
The deal value of the global top 10 completed deals in Q1 2015 was
The deal value of the global top 10 announced deals in Q1 2015 was
1 All numbers are in us$ billion Financial investors are italicized Figures in blue are estimated values
sources: Thomson one, kPmG Analysis
PHARMACEUTICALS
© 2015 KPMG AG Wirtschaftsprüfungsgesellschaft, a member firm of the KPMG network of independent member firms affiliated with KPMG International Cooperative (“KPMG International”), a Swiss entity. All rights reserved. Printed in Germany. The KPMG name, logo and “cutting through complexity” are registered trademarks of KPMG International.

April 2015 | Deal Capsule | 5
BIDDER TARGET BusInEss AREA DEAl sTATusToTAl
vAluE1
Olin Corp. The Dow Chemical Co. – Chlor-Alkali business Chlor-alkali and derivatives Pending shareholder and
antitrust approval 5.0
Asahi Kasei Corp. Polypore International Inc. Lithium and lead-acid battery separators , OEM membranes, etc.
Pending shareholder and antitrust approval 2.2
Tronox Ltd. fMC Corp. – Alkali business Soda ash Completed 01 April 2015 1.6
3M Co. Polypore International Inc. – Separations Media business
Microporous membranes and modules for filtration
Pending shareholder and antitrust approval 1.0
A Schulman Inc. Citadel Plastics Holdings Inc. Thermoplastic and thermoset resins Subject to standard closing conditions 0.8
Investor Group including Xu Gang Henan Billions Chemicals Co., Ltd. Titanium and zirconium fine powder materials Pending 0.6
Qinghai Jinrui Mineral Development Co., Ltd. Guangxi Mingli Chem Co., Ltd. Phosphoric acids and phosphate
products Pending 0.4
OAO TAIF-NK Nizhnekamskneftekhim OAO (50%) Monomers, synthetic rubber, plastics, petrochemical products Pending 0.4
Investor Group including Shenzhen Huitong Zhengyuan
Shenzhen Rainbow fine Chemical Industry Co., Ltd. Aerosol series products Shareholder approval,
pending antitrust approval 0.3
China Zhenhua Oil Co., Ltd. North Huajin Chemical Industries Co., Ltd. fertilizers, petrochemical products Pending 0.2
TAbLE 3: GLobAL ToP dEALS CoMPLETEd In Q1 2015
TAbLE 4: GLobAL ToP dEALS AnnoUnCEd In Q1 2015, yET To CLoSE
BIDDER TARGET BusInEss AREAToTAl
vAluE1
Albemarle Corp. Rockwood Holdings Inc. Lithium, catalysts, bromine and surface treatment 6.2
Platform Specialty Products Corp. Arysta LifeScience Ltd. Agrochemical and biological products 3.5
Arkema SA Bostik SA (a part of Total S.A.) Adhesives 2.2
Golden Gate Capital ANGuS Chemical Company (part of Dow Chemical) Nitroalkanes and their derivatives 1.2
Blackstone Group LP Orica Ltd. – Chemicals Business Industrial and mining chemicals 0.6
Ingredion Inc. Penford Corp. Modification technologies, proprietary processing, custom manufacturing, etc. 0.3
Kurita water Industries Ltd BK Guilini GmbH – water, paper, alumine business water treatment and paper chemicals, alumina compounds 0.3
Al Othman Holding Co. Savola Packaging Systems Ltd. Plastics 0.2
CITIC Trust Co., Ltd. Jiangsu Kangde xin Composite Material Co., Ltd. (6.3 %)
Polypropylene film, polyester film and precoated laminating machines 0.2
HB fuller Co. Tonsan Adhesive Inc. (95%) Adhesives 0.2
$14.9 billion
$12.5 billion
The deal value of the global top 10 completed deals in Q1 2015 was
The deal value of the global top 10 announced deals in Q1 2015 was
CHEMICALS
1 All numbers are in us$ billion Financial investors are italicized Figures in blue are estimated values
sources: Thomson one, kPmG Analysis
© 2015 KPMG AG Wirtschaftsprüfungsgesellschaft, a member firm of the KPMG network of independent member firms affiliated with KPMG International Cooperative (“KPMG International”), a Swiss entity. All rights reserved. Printed in Germany. The KPMG name, logo and “cutting through complexity” are registered trademarks of KPMG International.

6 | Deal Capsule | April 2015
in Q1 2015, top 10 completed deals amount to a total value of $14.9 billion, a significant increase compared to $7.1 billion in Q1 2014. The Us has been the most active country in chemical M&A activity. specialization was the key deal driver behind the majority of top 10 completed deals. Financial investors are also showing keen interest in the sector. Deal announcements indicate a wave of domestic deals in the chemical sector in 2015.
DeAl FOCUs AReAsSpecialization
investors are showing continued interest in specialty chemicals companies with eight of the top 10 completed deals in the specialty area. This is driven by attractive growth prospects and higher margins.
The largest deal in Q1 2015 represents Albermale Corp.’s acquisition of Rockwood holdings inc. for $6.2 billion. This will enable Albermale to align complementary specialty chemicals portfolios, leveraging Rockwood’s market-leading positions across lithium, catalysts, bromine and surface treatment.
By acquiring Arysta lifescience ltd. for $3.5 billion, Platform specialty Products gains a leading provider of a broad range of crop solutions, e.g. insecticides, fungicides, herbicides, biostimulants and value-added nutrients. Arysta has a flexible supply chain sourcing active ingredients from more than 100 suppliers to develop highly-specialized formulations and product applications.
Arkema sA’s acquisition of oil and gas giant Total’s Bostik sA, one of the largest adhesive and sealant companies globally, aims at reinforcing Arkema’s position in specialty chemicals and advancing its high performance materials.
PE involvement in chemical M&A
in Q1 2015, Pe continues to show keen interest in the sector. since 2008, Pe involvement in global chemical M&A has averaged around 15%, typically driven by opportunities in specialties, strong valuation metrics, diversification, strong margins and a positive industry outlook.
in Q1 2015, golden gate Capital bought Angus Chemical Company, the world’s sole manufacturer and distributor of nitroalkanes and their derivatives with high growth potential. Angus was sold as part of The Dow Chemical Company’s strategic disposal plan to divest up to $6 billion of non-strategic assets and businesses.
Blackstone group lP completed the acquisition of Orica ltd.’s chemical business in Q1 2015. Orica’s chemical business provides a wide range of chemical products and services to sectors such as agriculture, building and construction and is the largest supplier of industrial chemicals in Australia and New Zealand. it is also present in North America, europe, China and latin America.
CHEMICALS
FIGurE 8: NuMBER Of CHEMICAL DEALS By INvESTOR Q1 2015
sources: Thomson one, kPmG Analysis
fINANCIAL INvESTORSSTRATEGIC INvESTORS
78%
22%
FIGurE 9: SELECTED COuNTRIES IN CHEMICAL M&A IN Q1 2015
sources: Thomson one, kPmG Analysis
fOREIGN ACQuIRERDOMESTIC ACQuIRER28
8
19
12
7 7
0
6
0
9
1
5 4 3 3 2 2
us chINA s. korEA GErmANy cANADA FrANcE INDIA JAPAN TurkEy uk
21
© 2015 KPMG AG Wirtschaftsprüfungsgesellschaft, a member firm of the KPMG network of independent member firms affiliated with KPMG International Cooperative (“KPMG International”), a Swiss entity. All rights reserved. Printed in Germany. The KPMG name, logo and “cutting through complexity” are registered trademarks of KPMG International.

April 2015 | Deal Capsule | 7
ChiNAChinese chemical M&A continues to remain local with almost 95% of deals being domestic in nature. Most transactions are driven by the intention of domestic consolidation, horizontally or vertically, as China’s chemical industry is still comparatively diversified with quite a few small to mid cap enterprises. The largest domestic deal is CiTiC Trust Co., ltd.’s privately negotiated acquisition of 6.3% of Jiangsu Kangde Xin Composite Material Co., ltd. for $0.2 billion.
inbound, only hB Fuller Co. acquired a Chinese target, Tonsan Adhesive inc., investing in the specialty segment of adhesives. The Chinese adhesives market is attractive for foreign investors as Chinese end-user industry demand remains high. industry experts expect a CAgR of 10.2% during 2014-2019. Tonsan is the largest engineering adhesive supplier in China.
CAPiTAl iNDeXshare prices of chemical firms listed in the Bloomberg europe 500 and Asia Pacific indices outperform the market. s&P 500 Chemical index has broadly followed the MsCi world index.
sOUTh KOReAThe south Korean ethylene vinyl acetate (eVA) market is further consolidating with hanwha group’s $1 billion acquisition of samsung general Chemicals Co. decreasing the number of competitors from four to three. south Korea’s Fair Trade Commission’s approval requires hanwha to adhere to an eVA pricing strategy attractively tailored to the local market. With the acquisition, hanwha becomes the leader in defense and petrochemicals in south Korea.
JAPANin Q1 2015, Japanese chemical firms made 11 cross-border deals, far more than in previous quarters. Despite a weaker Yen, the chemical sector already was one of the top two in terms of outbound M&A activity due to weak economic growth prospects in the domestic market. searching for new growth opportunities, Japanese firms mainly target North America, southeast Asia and europe. For example, by acquiring BK guilini gmbh’s water solutions, paper solutions and alumina compounds, Kurita Water industries ltd. expects european sales to contribute 10% of total sales.
Domestic M&A activity is driven by a weaker Yen, an increase in sales taxes and government supported market restructuring in the form of consolidations or divestitures.
FIGurE 11: TOP COuNTRIES IN CHEMICAL M&A Q1 2015
sources: Thomson one, kPmG Analysis
TARGET NATIONSACQuIRER NATIONS45
36
79
4
9
24
9 1011
7 8
3
21 20
11
6
us cANADA FrANcE GErmANy uk TurkEy chINA s. korEA JAPAN INDIA
46
FIGurE 10: DEvELOPMENT Of CHEMICAL SHARE PRICES Q1 2015
sources: Bloomberg, kPmG Analysis
JAN FEB mAr
MSCI wORLD INDExS&P 500 CHEMICALS INDEx
BLOOMBERG EuROPE 500 CHEM INDExBLOOMBERG ASIA PACIfIC CHEM INDEx
90
100
115
110
120
125
105
95
© 2015 KPMG AG Wirtschaftsprüfungsgesellschaft, a member firm of the KPMG network of independent member firms affiliated with KPMG International Cooperative (“KPMG International”), a Swiss entity. All rights reserved. Printed in Germany. The KPMG name, logo and “cutting through complexity” are registered trademarks of KPMG International.

www.kpmg.de
The information contained herein is of a general nature and is not intended to address the circumstances of any particular individual or entity. Although we endeavor to provide accurate and timely information, there can be no guarantee that such information is accurate as of the date it is received or that it will continue to be accurate in the future. No one should act on such information without appropriate professional advice after a thorough examination of the particular situation. Our services are provided subject to our verification whether a provision of the specific services is permissible in the individual case.
© 2015 KPMg Ag Wirtschaftsprüfungsgesellschaft, a member firm of the KPMg network of independent member firms affiliated with KPMg international Cooperative (“KPMg international”), a swiss entity. All rights reserved. Printed in germany. The KPMg name, logo and “cutting through complexity” are registered trademarks of KPMg international.
Imprint
PublisherKPMg Ag Wirtschaftsprüfungsgesellschaft Tersteegenstrasse 19 - 31 40474 Dusseldorf germany
ContactVir Lakshman * Partner, Deal Advisory head of Chemicals & Pharmaceuticals, germany T +49 211 475 6666 [email protected]
Christian Klingbeil Partner, Deal Advisory – Valuation T +49 89 9282 1284 [email protected]
Christian Specht Partner, Deal Advisory – M&A T +49 69 9587 2240 [email protected] AuthorsRita Duran senior Manager, Deal Advisory Chemicals & Pharmaceuticals, KPMg in germanyHelen Christmann Chemicals & Pharmaceuticals, KPMg in germanySebastian Heinisch Chemicals & Pharmaceuticals, KPMg in germany ContributorsDr Lizzie Tuckey Chief Operating Officer life sciences & healthcare, KPMg in the UKAndy Qiu Partner, KPMg in China Ellen Zhang Manager, KPMg in China
* Responsible according to german law (§ 7 (2) Berliner Presseg)
BAsis OF DATA PRePARATiONValues and volumes used throughout the report are based on completion date as provided by Thomson Reuters’ database Thomson One as of 2 April 2015, and supplemented by additional independent research. This report includes disclosed and undisclosed values for M&A transactions including minority stake purchases, acquisitions of remaining interest, and recapitalizations and it explicitly excludes self-tenders and spinoffs. The published numbers of deals and deal values are based on the analysis of target companies which operate in the following subsectors:
Pharmaceuticals
• Medicinal chemicals & botanical products
• Pharmaceutical preparations
• in vivo and in vivo diagnostic substances
• Biotechnology – biological products, except diagnostic substances
• Pharmaceutical wholesale (added starting in Q2 2014)
Chemicals
• Clay, kaolin, ceramic & refractory minerals
• Chemical and non-metallic mineral mining, except fuels
• Fertilizers and agricultural chemicals
• industrial gases
• specialty chemicals
• Chemical wholesale
• Plastics and rubber components
KPMg’s Deal Thermometer is based on financial data as provided by s&P Capital iQ of public companies in the same sector as noted above with a market capitalization at quarter end of at least a $1 billion. For the pharmaceutical sector, this comprises 180 public companies. For the chemical sector, this comprises 181 public companies.
All figures in this report are shown in Us Dollars ($).
Sources
Online databases:
• Thomson One (Thomson Reuters)
• Mergermarket
• s&P Capital iQ
• Bloomberg
• evaluatePharma
Publications
• Various companies’ press releases