de-pbs school-wide positive behavior supports team training june 18 & 19, 2013
TRANSCRIPT
DE-PBS School-wide Positive Behavior Supports Team TrainingJune 18 & 19, 2013

Adapted from :Maryland PBISIllinois PBISStrategies for Developing Self-Discipline and Improving School Climate Workshop
(G. Bear, 2012)
Based on research of Rob Horner & George SugaiOSEP Center on PBISUniversities of Oregon & Connecticut

The Delaware Positive Behavior Support Project is a collaboration with the DE Department of Education, the
UD Center for Disabilities Studies, and Delaware Public Schools.
Who is here today?Where are you on the PBS continuum?
• Please share:• School name• Are you a New or Revising SWPBS Team?• Your burning question about SWPBS
Essential Questions
• How does Positive Behavior Support address challenges schools face?
• What are the key features of a comprehensive Positive Behavior Support approach?
• What are the elements needed to develop and maintain a School-wide PBS program for our school?

Introduction to PBS
What is it?Why do it?How do we do it?
Illinois PBIS Network, 2011

Delaware PBS Key Features
Preventing behavior problemsPositiv
e and safe
Developing Self-discipline
Correcting misbehavior
ALL students
Comprehensive and intensive evidence-based
interventions and supports
Problem-solving team process
Susta
ined
Com
mitm
ent
Participation and implementation
with fidelity
Dynamic and evolving
Data-based decision making
On-going professional
development and support

School Wide PBS is:
Framework for enhancing adoption & implementation of Continuum of evidence-based interventions to achieve Academically and behaviorally important outcomes for ALL students.
Not a specific practice or curriculum…it’s a general approachto preventing problem behavior
Not new…it’s based on a long history ofbehavioral practices & effective Instructional design & strategies
Not limited to any particular group ofstudents…it’s for all students
So, what is PBS?

SWPBS isFramework for enhancing adoption & implementation of
Continuum of evidence-based interventions to achieve
Academically & behaviorally important outcomes for
All students

SYST
EMS
PRACTICES
DATASupportingStaff
Behavior
Supporting Decision Making
SupportingStudent Behavior
Positive Behavior Support OUTCOMES
Social Competence & Academic Achievement

Primary Prevention:School-/Classroom-Wide Systems for
All Students,Staff, & Settings
Secondary Prevention:Specialized Group
Systems for Students with At-Risk Behavior
Tertiary Prevention:Specialized
IndividualizedSystems for Students
with High-Risk Behavior
~80% of Students
~15%
~5%
SCHOOL-WIDE POSITIVE BEHAVIOR
SUPPORT

Positive Behavior Support
Adapted from George Sugai, 1996
© Terrance M. Scott, 2001
Universal
School-Wide Data Collection and Analyses
School-Wide Prevention Systems (rules, routines, arrangements)
Targeted
Individual
AnalyzeStudent Data
Interviews, Questionnaires, etc.
Observations and ABC Analysis
Simple Student Interventions
Group Interventions
Complex Individualized Interventions
Inte
rven
tionAssessm
ent

Number of Schools Implementing SWPBIS since 2000
19,054

Common Behavior Concerns•Texting and emailing during instruction•Talking during instruction•Eating, drinking and gum chewing•Late arrival, early departure•Starting an activity before listening to the instructions or “set up”•Inappropriate attire
Staff Behaviors !!

What does PBS look like in a school?
• >80% of students can tell you what is expected of them & can give behavioral examples because they have been taught, actively supervised, practiced, & acknowledged.
• Positive adult-to-student interactions exceed negative.• Administrators are active participants.• Data & team-based action planning & implementation. • Function based behavior support is a foundation for
addressing problem behavior.• Full continuum of behavior support is available to all
students.

What isSchool-wide Positive Behavior Support?
• School-wide PBS: A systems approach for establishing the social culture and individualized behavioral supports needed for schools to achieve both social and academic success for all students.
• Evidence-based features of SW-PBS• Prevention• Define and teach positive social expectations• Acknowledge positive behavior• Arrange consistent consequences for problem behavior• On-going collection and use of data for decision-making• Continuum of intensive, individual interventions. • Administrative leadership – Team-based implementation
(Systems that support effective practices)www.pbis.org - Horner

Elementary PBS vs. Secondary PBS
• Staff working in departments• # of staff, # of students• District-wide policies • Multiple administrators• Varied expectations in regards to academic
achievement and motivation• More groundwork is needed • Buy in from staff is lower (30% report that 76% of
more of staff supported SWPBS implementation)

BIG IDEAS
• 3-5 years for full implementation & to create a sustainable positive school culture
• Organizational FRAMEWORK• Critical Key Features same across schools, but
unique to the CULTURE & CONTEXT of the school• Be sensitive and respectful of the existing school
environment • Coaching support for implementation

“PBS Biggest Idea!”Instead of working harder (inefficient), schools have to establish systems/processes and use data and practices
that enable them to work smarter (efficient, effective).
PBIS Enables Schools To…• Establish a small number of priorities
• “do less, better”• Consolidate/integrate whenever possible
• “only do it once”• Specify what is wanted & how you’ll know when you get
there• “invest in a clear outcome and assess progress”
• Give priority to what works• “research-based, evidence-based”
Illinois PBIS Network, 2011

What is so important about climate?
• The goal of this study is to determine what makes successful schools different from other schools. Rather than define success in absolute terms—such as the percentage of students who are proficient on a standardized test—this study’s definition is based on whether or not a school is performing better than predicted given the characteristics of the students it serves. Using data from over 1,700 California public middle and high schools, 40 schools were identified that consistently performed better than predicted on standardized tests of math and English language arts achievement. These schools were labeled “beating-the-odds” (BTO) schools.
• “The results of this study show that ‘Beating The Odds’ schools had substantially more positive levels of school climate than other schools”.
Voight, A., Austin, G., and Hanson, T. (2013). A climate for academicsuccess: How school climate distinguishes schools that are beating the
achievement odds (Report Summary). San Francisco: WestEd

The Facts: Why we need to do things differently• Each year almost one third of public high school
students fail to graduate from high school (Bridgeland, et al, 2006)
• One high school student drops-out every 9 seconds (Reimer & Smink, 2005)
• High school students from low-income families (the lowest 20%) were six times more likely to drop out than students from higher income families. Ultimately, about one half of all dropouts never receive
a high school credential. (American Youth Policy Forum, n.d.)

Of youth with disabilities who drop out of school, the highest proportions are students with learning disabilities (32%) and students with emotional/behavioral disabilities (50%) (Wagner, et al, 1993; U.S. Department of Education, 2009.
Among minorities, only about 52% of Hispanic students and 56% of African-American students will graduate in four years, compared with 78% of white students.
The Facts: Why we need to do things differently

Students Feedback on Why They Dropped-out Demonstrates “A Gradual Process of Disengagement”
Nearly half (47%) said a major reason for dropping out was that classes were not interesting.
38% believed they had “too much freedom” and not enough rules.
(Bridgeland, et al, 2006)

• What is our purpose?• How do we want our School/Family/Community
to be different as a result of implementing PBS?
Why Are We Here?
Illinois PBIS Network, 2011
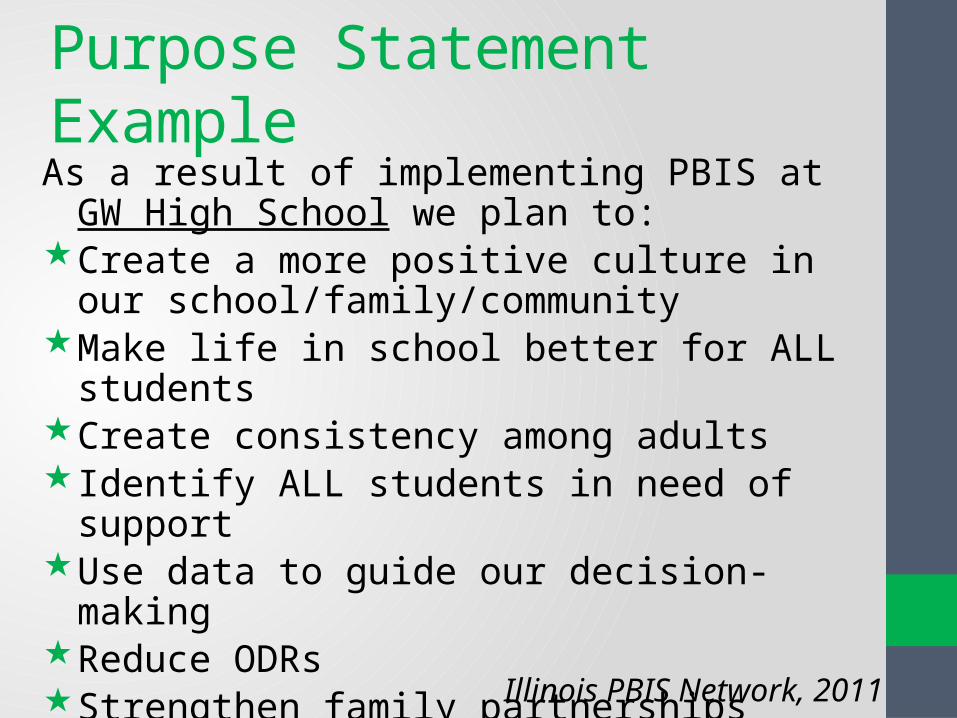
Purpose Statement ExampleAs a result of implementing PBIS at GW High School
we plan to:Create a more positive culture in our
school/family/communityMake life in school better for ALL students Create consistency among adultsIdentify ALL students in need of supportUse data to guide our decision-makingReduce ODRsStrengthen family partnerships
Illinois PBIS Network, 2011

• Think about the multiple initiatives and committees currently in your building. • Is there overlap or duplication of effort?• Are many of the same people serving on different
committees? • Goal is to work smarter not harder!• How can we make this happen?
Adapted from materials on www.pbis.org
Prepare for Working Smarter
DE-PBS

• Allows schools to identify the multiple committees within their school
• Helps in identifying purposes, outcomes, target groups, and staff involved
• Assists schools in addressing, evaluating, and restructuring committees and initiatives to address school improvement plan
• Important for schools to identify that School-wide PBS is a framework within which existing committees and initiatives can integrate
Adap
ted
from
mat
eria
ls o
n w
ww
.pbi
s.or
g
Prepare for Working Smarter (Not Harder)

Step 1: Identify ALL Current Teams (discipline, instruction, climate, school improvement, parent support, etc.) List in 1st column
Step 2: Identify purpose, outcomes, target audience, and staff involved for each committee List in 2nd -5th columns
Step 3: Identify which School Improvement Goal is supported by committee efforts List in 6th column
Step 4: Based on your summary, what committees/teams can you align and integrate to support everyone’s efforts towards the school strategic plan and mission?
Determine your next steps …
Adap
ted
from
mat
eria
ls o
n w
ww
.pbi
s.or
g
Working Smarter—Committee Review Worksheet

Initiative, Committee
Purpose Outcome Target Group
Staff Involved
School Improvement
PlanAttendance Committee
Increase attendance Increase % of students attending daily
All students Eric, Ellen, Marlee
Goal #2
School Climate Committee
Improve Climate Improve Climate All students Marlee, J.S., Ellen, Eric
Goal #3
Safety Committee Improve safety Predictable response to threat/crisis
Dangerous students
Has not met Goal #3
School Spirit Committee
Enhance school spirit
Improve morale All students Has not met
Discipline Committee
Improve behavior Decrease office referrals
Bullies, antisocial students, repeat offenders
Ellen, Eric, Marlee, Otis
Goal #3
S&DFS Committee Prevent drug use High/at-risk drug users
Don
PBIS Work Group Implement 3-tier model
Decrease office referrals, increase attendance, enhance academic engagement, improve grades
All students Eric, Ellen, Marlee, Otis, Emma
Goal #2Goal #3
Are outcomes measurable?
1. Eliminate initiatives that do NOT have a defined purpose and measurable outcome.
2. Combine initiatives that have the same measurable outcome and/or same target group
3. Combine initiatives that have 75% of the same staff4. Eliminate initiatives that are not tied to School
Improvement Goals.
Team Led Process - Sample Teaming Matrix

Initiative, Committee
Purpose Outcome Target Group
Staff Involved
School Improvement
Plan

Team Coordination & Collaboration• Keep communication open!• Problem solving teams coordinating behavioral
interventions at Tier 2 & 3 and the School-wide PBS Team are to communicate regularly• Often dual membership across teams supports these
efforts

DE-PBS Key Features for SW• Program Development & Evaluation
• Problem-Solving/Leadership Team• Data• Professional Development & Resources
• Developing SW and Classroom Systems to Prevent Problem Behavior• Expectations, Recognition and Teaching• Positive relationships
• Correcting Problem Behaviors• Consistent and clear procedures• Disciplinary encounters used as learning opportunities to teach
problem solving strategies • Developing Self-Discipline
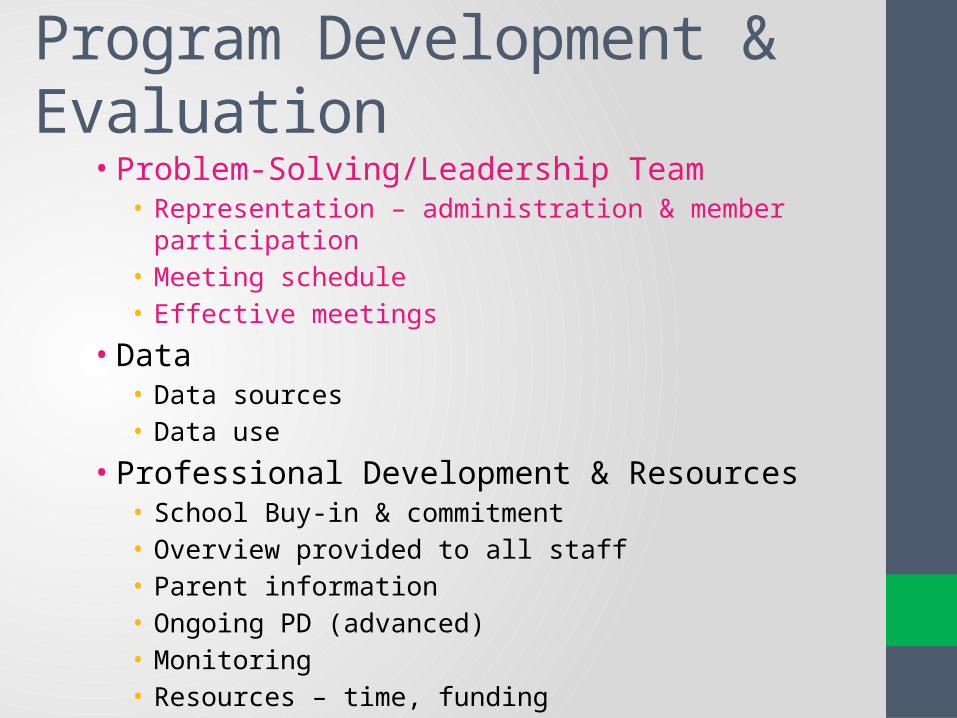
Program Development & Evaluation
• Problem-Solving/Leadership Team• Representation – administration & member participation• Meeting schedule• Effective meetings
• Data• Data sources• Data use
• Professional Development & Resources• School Buy-in & commitment• Overview provided to all staff• Parent information• Ongoing PD (advanced)• Monitoring• Resources – time, funding

Building a Strong & EffectivePBS Leadership Team• Adopt a problem-solving team process for planning,
development, implementation, and evaluation of evidence-based practices across all three levels of prevention and intervention (primary, secondary, and tertiary).

Are we as a team representative of our staff?
• Administration a must have!• Consider:
• Grade levels• Content areas: academic and related arts• Regular and Special Education• Related arts• Specialists: Counseling/School Psychology• Students• Parents

Our Goal!
• To be efficient and effective!• Let’s work smarter not harder!
• BUT HOW?

Monthly meeting schedule
• Pre-set monthly meeting schedule for the year• Avoid month to month scheduling to support team
participation
• Set consistent day & time – e.g., 2nd Tuesday afternoon of the month at 2:20-3:30.
• Select location that is distraction-free as possible

What role will you play onPBS Team?
• Specific roles can include:• *Facilitator (create the agenda, lead the meeting) • *Time-keeper (keeps team on task) • *Recorder/Note-taker (takes and distributes minutes;
archives material)• *Reporter/Communicator (shares information on activities
and data to staff, families, and communities)• Data Manager (brings data to team meetings)
• Others as needed (consider team/school culture):• Door keeper• Jargon buster• “But” Buster

Team Mission and Purpose
• Establish function of the team• Include program development & implementation
• Shared understanding and commitment• Communication of team membership and mission

Establish Meeting Norms/Ground Rules• A set of guidelines that a team establishes to shape the
interaction of team members with each other and with staff outside the team.
• Team norms can encompass as many topics as the team deems necessary for successful functioning.
• Post norms and mission at meetings for review & reference

Meeting Norm Examples
Team problem solving, conflict resolution, and decision making• Team members will make
decisions by consensus, but majority will rule if timely consensus is not reached;
• Conflicts will be resolved directly with the persons in conflict.
Team member interaction in meetings
• Team members use 1 voice at a time
• Hold no side or competing conversations
• Arrive on time• Work from an agenda• Record minutes• End meetings on time

Clear Agenda
• Have a reasonable agenda for each meeting and set time limits per topic
• Include:• Review of data to make informed decisions on
program effectiveness• Revisit action plans/goals and celebrate successes• Identify information to share with whole staff
• How will this information be shared?

Parking Lot
• Strategy to capture valued ideas, thoughts, concerns, etc. that are not on the meeting agenda
• Post-its, index cards, etc. available to all to jot down thoughts to be collected for follow up at end of meeting if time, or post-meeting.

Form Subcommittees
• As your program is developing and growing, the team may benefit from breaking off into subcommittees that report back to the whole team. • Data Review & Summary• Product Development• Expectation Teaching Plans/Activities

Documentation of Logistics of meeting (date, time, location, attendance &
roles)Agenda items for today’s meeting ( and next meeting)Discussion items, decisions made, tasks and timelines
assignedProblem statements & solutionsDecisions made/tasks to be donePeople assigned to implement with timelines assignedEvaluation plan to determine the effect on student
behavior
Meeting Minutes & Action Planning

Reviewing Meeting Minutes An effective strategy for getting a snapshot of what
happened at the previous meeting and what needs to be reviewed during the upcoming meetingWhat was the issue/problem?What were we going to do?,Who was going to do it and by when?,How are we measuring progress toward the goal?
Visual tracking of focus topics during and after meetingsPrevents side conversationsPrevents repetition Encourages completion of tasks
Meeting Minutes & Action Planning

Langley Elementary PBIS Team Meeting Minutes and Problem-Solving Action Plan FormToday’s Meeting: Date, time, location: Facilitator: Minute Taker: Data Analyst:
Next Meeting: Date, time, location: Facilitator: Minute Taker: Data Analyst:
Team Members (bold are present today)
Today’s Agenda Items Next Meeting Agenda Items01. 02. 03.
1. 2.
Information for Team, or Issue for Team to Address
Discussion/Decision/Task (if applicable) Who? By When?
Administrative/General Information and Issues
Implementation and EvaluationPrecise Problem Statement, based on review of
data(What, When, Where, Who, Why)
Solution Actions (e.g., Prevent, Teach, Prompt, Reward, Correction, Extinction,
Safety)Who? By When?
Goal, Timeline, Decision Rule, & Updates
Problem-Solving Action Plan
Our RatingYes So-So No
1. Was today’s meeting a good use of our time?2. In general, did we do a good job of tracking whether we’re completing the tasks we agreed on at previous meetings?
3. In general, have we done a good job of actually completing the tasks we agreed on at previous meetings?4. In general, are the completed tasks having the desired effects on student behavior?
Evaluation of Team Meeting (Mark your ratings with an “X”)
Where in the Form would you place:
1.Planning for next PTA meeting?
2.Too many students in the “intensive support” for literacy
3.Schedule for hallway monitoring for next month
4.There have been five fights on playground in last month.
5.Next meeting report on lunch-room status.

SWPBS Team Materials• Permanent Products Notebook Model
• Program materials the team creates to support implementing a Schoolwide PBS program
• Materials used year to year• E.g., Expectations/poster templates, behavior matrix, expectation
lesson plans• Working Notebook Model
• PBS Team monthly meeting materials• E.g., agendas, minutes & sign-in documents, data reports

Problem-Solving/Leadership Team Planning• As a team reflect on the strategies covered to support running
an effective and efficient problem solving team• Decide if action items are needed to put strategies in place for
your SW PBS Team
Example:
Category Task Action PlanRepresentative Team
Team membership and member commitment established.
Sarah will email (by Wednesday evening 6/19) related arts department staff to request a representative for the SW PBS Team.

Key Feature Status Tracker• School-wide Tier 1: Program Development &
Evaluation• Problem-solving Teams
• Status• Discuss as a team if components are:• In Place, Partially in place, Not in Place
• Action Plan• Discuss as a team the items Partially in place or
Not in Place• Note activities to be completed, who will do
them and when

Program Development & Evaluation
• Problem-Solving/Leadership Team• Representation – admin & member participation• Meeting schedule• Effective meetings
• Data• Data sources• Data use in decision making
• Professional Development & Resources• School Buy-in & commitment & planning• Overview provided to all staff• Parent information• Monitoring• Resources – time, funding

DE-PBS Key Feature
• Schools value the importance of data-based decision making, as reflected in the on-going evaluation of program effectiveness and modification of program components, interventions and supports based on multiple sources of data.

Understanding & Using Data
DATA
Sources
AnalysisAction Planning
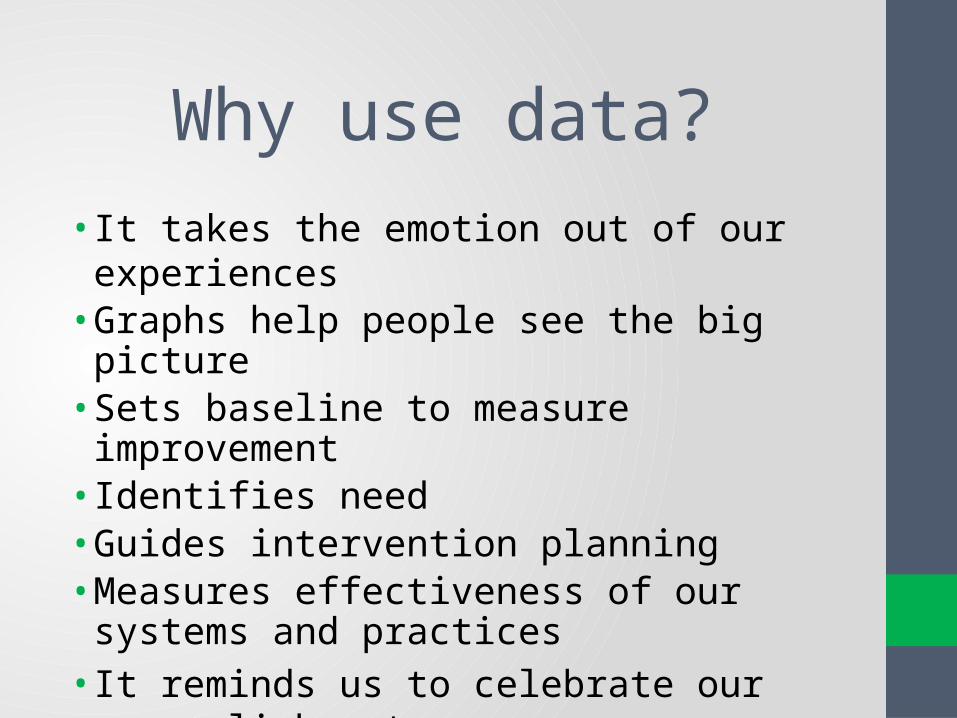
Why use data?• It takes the emotion out of our experiences• Graphs help people see the big picture• Sets baseline to measure improvement• Identifies need• Guides intervention planning• Measures effectiveness of our systems and practices• It reminds us to celebrate our accomplishments
It’s fun!
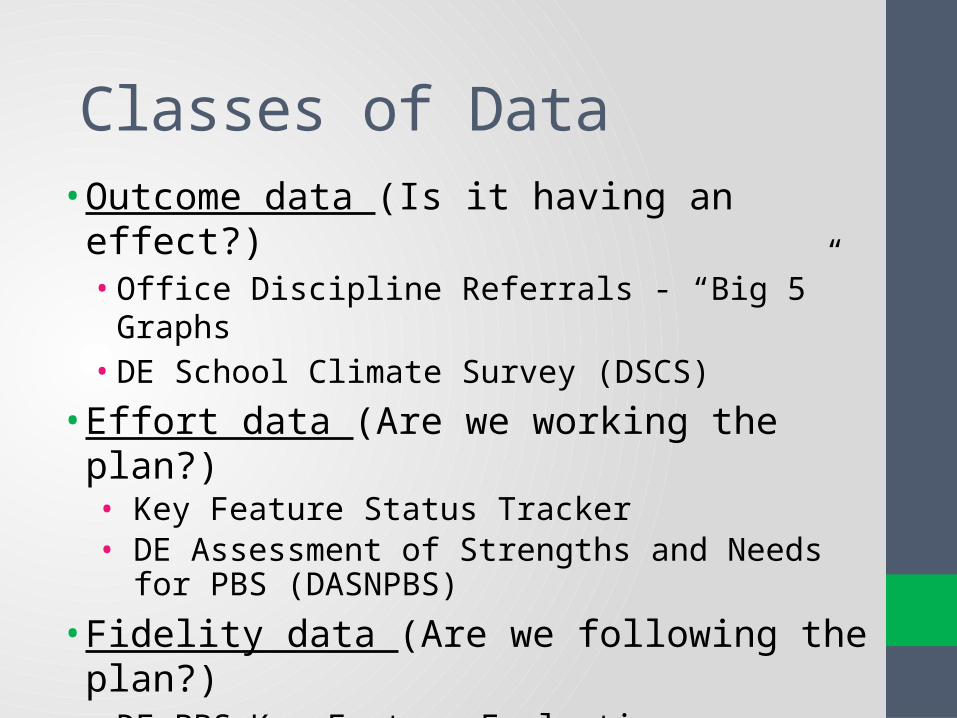
Classes of Data• Outcome data (Is it having an effect?)
• Office Discipline Referrals - “Big 5” Graphs• DE School Climate Survey (DSCS)
• Effort data (Are we working the plan?)• Key Feature Status Tracker • DE Assessment of Strengths and Needs for PBS
(DASNPBS)
• Fidelity data (Are we following the plan?)• DE-PBS Key Feature Evaluation
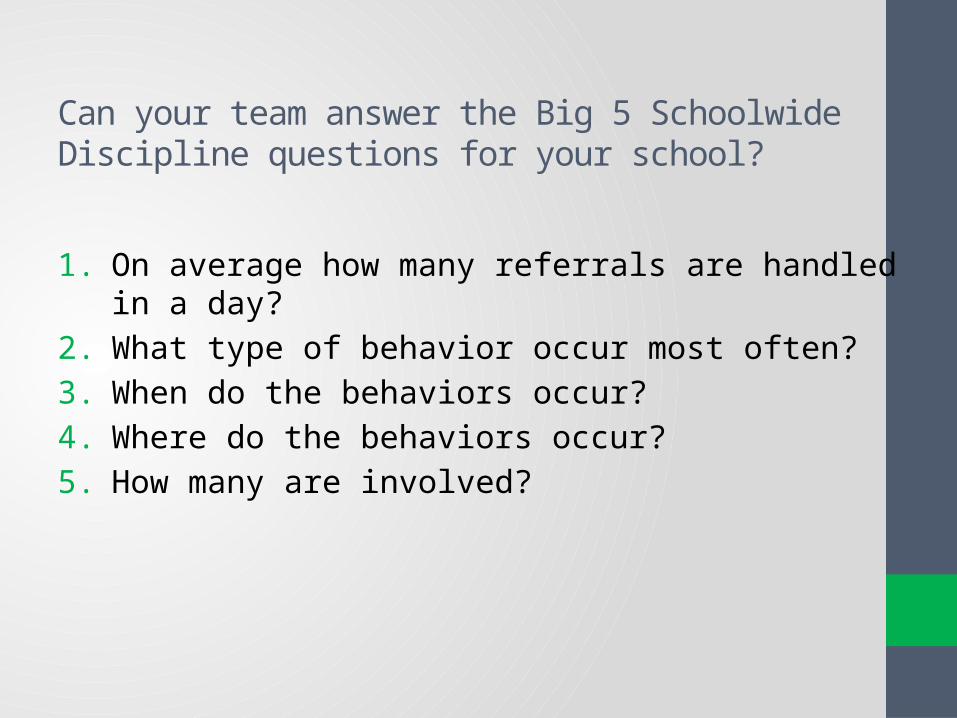
Can your team answer the Big 5 Schoolwide Discipline questions for your school?
1. On average how many referrals are handled in a day?2. What type of behavior occur most often?3. When do the behaviors occur?4. Where do the behaviors occur?5. How many are involved?

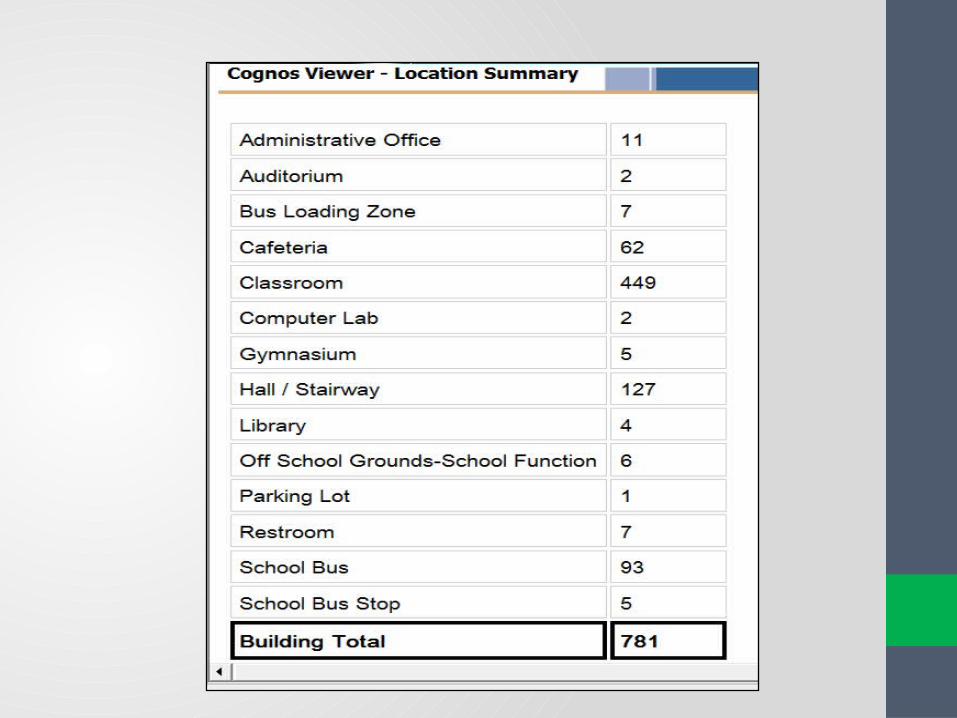
Office Discipline Referral Data (ODR)
• The Big 5• Average Referral/Day/Month (DDRT)• # of Referrals by Location• # of Referrals by Behavior• # of Referrals by Time of Day• # of Referrals by Student (DDRT) Where do we find
this information?

August September October November December January February March April May June0
0.5
1
1.5
2
2.5
3
3.5
4
4.5
5
0.75
1.42
1.95
1.6
3.21
2.05 2.12
2.47
2.95
2.53
00
4.43
4.09
2.67
1.59
2.1
2.82
3.7
3.15
1.68
00.00
0.63
1.29 1.36
1.86
0.47
1.171.26 1.19
1.05
0.50
0.00
1.321.15
1.64
1.13
0.83
1.69
1.41
0.64 0.70
0.50
Comparison of Average Referrals/Day/Month
2007-2008
2008-2009
2009-2010
2010-2011


Referrals by Student
76%
21%
4%
0%
10%
20%
30%
40%
50%
60%
70%
80%
90%
100%
Behavior Reporting Triangle
6+ Referrals
2 - 5 Referrals
0 - 1 Referrals
Total Enrollment 327
# of Students with 0-1 247 76%
# of Students with 2-4 68 21%
# of Students with 6+ 12 4%

Expanding the Big 5
The “Big Five” Reports• Average per day per
month• By type of behavior• By location• By time of day• By student
Data Review by Subgroups• By Ethnicity• By Disability

Disproportionality Defined
• Disproportionality refers to the over or under representation of a group within a category• Eighty-five percent of office discipline referrals (ODRs)
are given to male students who are 50% of total enrollment (Overrepresentation)
• Males represent less than 30 % of elementary school teachers, yet are 50% of the U.S. population (Underrepresentation)
www.pbisillinois.org

Data Showing Disproportionality
• ODR• Subjective vs. Objective
• ISS/OSS• Special Education
• ED/BD• Interventions
• Over-represented• Under-represented
www.pbisillinois.org


Referrals by Ethnicity
Report #1: Percentage of all enrolled students by ethnicity and percentage of referrals by ethnicity
www.pbisillinois.org

Referrals by Ethnicity
Report #2: Percentage of all enrolled students by ethnicity and percentage of students with referrals by ethnicity:
www.pbisillinois.org

Referrals by Ethnicity
Report #3: Percentage of students within each ethnicity group who have referrals
www.pbisillinois.org

Referrals by Disability
IEPs Non-IEPs
www.pbisillinois.org

Along with Pondering Pete, let’s look at your data?
Program Development & Evaluation: Data Review Worksheet
Tab 1 – Workbook page 15
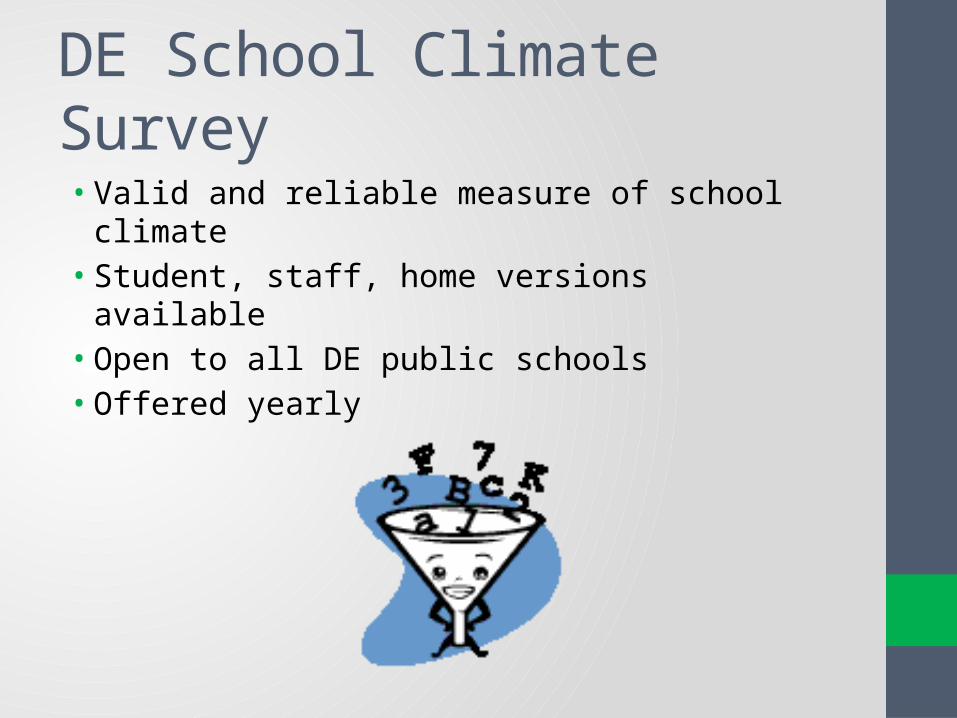
DE School Climate Survey
• Valid and reliable measure of school climate • Student, staff, home versions available• Open to all DE public schools• Offered yearly

Subscales of Delaware School Climate Surveys 2013
Student Survey Teacher/Staff
Survey Home Survey
Part I : School Climate
Teacher-Student Relations
Teacher-Student Relations
Teacher-Student Relations
Student-Student Relations
Student-Student Relations
Student-Student Relations
Respect for Diversity Respect for Diversity Respect for Diversity
Clarity of Expectations Clarity of Expectations Clarity of Expectations
Fairness of Rules Fairness of Rules Fairness of Rules
School Safety School Safety School Safety
Student Engagement School-wide
Student Engagement School-wide
Bullying School-wide Bullying School-wide
Teacher-Home Communications
Teacher-Home Communications
Staff Relations
Total School Climate Total School Climate Total School Climate
Parent Satisfaction
74

PART II: Techniques
Student Survey
Teacher/Staff Survey
Home Survey
Positive Behavior Techniques
Positive Behavior Techniques
Punitive Techniques
Punitive Techniques
Social Emotional Learning Techniques
Social Emotional Learning Techniques
75

Part III: Bullying & IV: Engagement (Individual Level)
Student Survey Teacher/Staff
Survey Home Survey
Bullying Victimization1
Physical Bullying Physical Bullying
Verbal Bullying Verbal Bullying
Social/Relational Bullying
Social/Relational Bullying
Cyberbullying2
Student Engagement
Cognitive & Behavioral
Cognitive & Behavioral
Emotional Emotional
1 Grades 6-12 only for the printed version. Optional for grades 4-5 with computer version. 2 Grades 6-12 only.
76

School Climate Reports • Types of scores reported:
• Standard Score • for comparing school’s scores to those of other
schools, with a score of 100 being average• Average Item Score
• for each subscale: tells us if the score is favorable or unfavorable, irrespective of how it compares to scores for other schools
• Frequency Score • tells us the percentage of respondents who
agreed or disagreed with item

Exploring School Climate Survey Data – Student Version• What are our overall significant strengths and concerns?
• What are the data trends?• By Race • By Gender• By Grade
Do your scores reflect positive or negative perceptions of school climate?

What do we do with all this data?• Data Summaries reviewed monthly with team &
used to make decisions• Designate a data person• Utilize a subgroup to review & present summary
• Share data with staff at least 3-4 times/year• Staff Meetings• Content/grade level team meetings• PLC meetings
• Share highlights with parents & community• School & district newsletters• Community news

Improving Decision-Making
ProblemSolution
From
ToProblem
ProblemSolving Solution
Information
Information

Decision Making
• Is there a problem? • What areas/systems are involved?• Are there many students or a few involved?• What kids of problem behaviors are occurring? • When are these behaviors most likely?• What is the most effective use of our resources to
address this problem?

Going from primary to precise• Primary statements are vague and leave us with
more questions than answers• Precise statements include information about 5
“Wh” questions:– What is the problem and how often is it happening?– Where is it happening?– Who is engaging in the behavior?– When is the problem most likely to occur?– Why is the problem sustaining?

What are the data you need to move from a Primary to a Precise statement?
• What problem behaviors are most common?• ODR per Problem Behavior
• Where are problem behaviors most likely?• ODR per Location
• When are problem behaviors most likely?• ODR per time of day
• Who is engaged in problem behavior?• ODR per student
• Why are problem behaviors sustaining?

From primary to precise: An example
Primary statement:• “ODRs during
December were higher than any month.”
Precise statement:– Minor disrespect and disruption are
increasing and are most likely to occur during the last 15-minutes of classes when students are engaged in independent seat work. This pattern is most common in 7th and 8th grades, involve many students, and appears to be maintained by work avoidance/escape. Attention may also be a function of the behavior- we’re not sure.
From primary to precise:Let’s practice• Based on ODR Data review – Reference worksheet for
overall top 3 behaviors and/or areas of concern identified.
• Select 1 area of concern.• Develop a precise statement that answers the 5 “Wh”
questions.

From primary to precise: Plan of action example
Precise statement:– Minor disrespect and
disruption are increasing and are most likely to occur during the last 15-minutes of classes when students are engaged in independent seat work. This pattern is most common in 7th and 8th grades, involve many students, and appears to be maintained by work avoidance/escape. Attention may also be a function of the behavior- we’re not sure.
Plan of Action• During 7th & 8th grade advisory
periods during the week of November 3-5, staff will review “Be Respectful” lessons. Examples discussed will reflect current scenario.
• Team member representatives from 7&8th grade teams will discuss & brainstorm with their teams classroom management strategies to keep students engaged during the last 15 minutes of class at next PLC meeting on November 6th.

From primary to precise: Plan of action• Revisit your precise statement that answers the 5 “Wh”
questions. • Problem solve a plan of action based on your team’s
precision statement. • WHO is going to do WHAT by WHEN?

From primary to precise: Developing a measurable goal example
• By December 18 (school-wide PBS team meeting), there will be a 5% decrease in minor disrespect and disruption behavior referrals for students in 7th & 8th grades as measured by ODR data.

From primary to precise: Developing a measurable goal• In goals statement include the following: • By WHEN – timeline goal• WHAT will happen – Include MEASUREMENT• HOW will you measure
• Based on your precision statement and action plan, develop a measurable goal.


+ If many students are making same mistake, consider
changing systems ... not students
+ START by teaching, monitoring & recognizing success
…before increasing PUNISHMENT

Key Feature Status Tracker• School-wide Tier 1: Program Development &
Evaluation• Data
• Status• Discuss as a team if components are:• In Place, Partially in place, Not in Place
• Action Plan• Discuss as a team the items Partially in place or
Not in Place• Note activities to be completed, who will do
them and when

Program Development & Evaluation
• Problem-Solving/Leadership Team• Representation – admin & member participation• Meeting schedule• Effective meetings
• Data• Data sources• Data use
• Professional Development & Resources• School Buy-in & commitment• Overview provided to all staff• Parent information• Ongoing PD • Monitoring• Resources – time, funding

Policy & Implementation Commitment• School Improvement Plan includes school-wide efforts to
develop or improve positive behaviors among all students. • Include measurable goals and objectives • Consider use of School Climate Data & ODR Data
• The components of School-wide DE-PBS are implemented with all students (all grades, classrooms, with and without disabilities, etc.)
• Team attendance at professional development including the administration. Maintain that the team leader(s) and administration have received training.

Buy In: Getting Staff and Students on Board • Anecdotal information indicates that 80% buy-in from
staff is critical to successful implementation
• If “Buy-in” is that important how do we get it?
•SHARE INFORMATION & GATHER FEEDBACK!!!

Ideas for Buy-In
• Share data to lay the foundation• Office Discipline Referral Summaries• School Climate Data Results• Attendance Data• DE Strengths and Needs Assessment
• Start small -- target 1-2 areas in need of intervention that effects all staff
• Share research• Student involvement

Research Examples• The interaction between problem behavior and
academics reaches a critical mass in high school (Morrison et al., 2001, Nelson, Benner, Lane, & Smith, 2004).
• “50% of problem behaviors resulting in discipline referrals occur in non-classroom settings (ie. Hallway, cafeteria)” (Nelson, Smith, Colvin, 1995).
• “teachers were trained using precorrection, reinforcement (catch them being goods) for appropriate behaviors, and active supervison … resulted in a 42% reduction in problem behaviors” (Oswald et al., 2005).

Student Involvement• As early as elementary level, include older
students in program implementation• Secondary schools: utilize students on the team,
or form a PBS Student Team• Include students that represent all students
(consider athletes, academics, student government, uninvolved, kids with referrals)
• Use students in teaching lessons, peer-mentoring around PBS, reinforcer ideas, etc.

Staff Kick Off• Secure time with all staff prior to school year• Team to share overview/mini-training with staff
• What is DE-PBS in general? What is School-wide PBS? • Why do we have a PBS System in place?• What does our school’s SWPBS system look like? What are
the expectations, teaching plan, etc.? • What is expected of staff?
• Teaching expectations• Support students to meet expectations• Acknowledging students meeting expectations• System for responding to problem behaviors
Student Kick Off• Secure time with all students (early in the school year)• Team to share overview with all students
• What is School-wide PBS?• Why do we have a PBS System in place?• What does our school’s SWPBS system look like?
• Teach expectations across settings – using creative, age appropriate lessons and activities.
GET EXCITED & HAVE FUN!

Parents/Families Kick Off• Inform families about SWPBS
• What is SWPBS? • Why are we implementing
PBS? • What does PBS look like at
our school?
• Incorporate information in materials shared at the beginning of the school year• Open House• Handbook• Welcome letter
• Plan to share updates throughout the year• Newsletters• Website• Parent-Teacher
Association/Organization
• Remember to collaborate and gather feedback!
Program Monitoring
• Administrators and PBS Team members develop plan to monitor implementation fidelity
• Remember to utilize outcome, effort, and fidelity data• Utilize team member feedback loop between the group
they represent and the SWPBS Team• Plan to gather student feedback

Key Feature Status Tracker• School-wide Tier 1: Program Development &
Evaluation• Professional Development & Resources
• Status• Discuss as a team if components are:• In Place, Partially in place, Not in Place
• Action Plan• Discuss as a team the items Partially in place or
Not in Place• Note activities to be completed, who will do
them and when

Revisiting Data- Additional Sources of Information • Disproportionality Data • Staff & Student Attendance• Retention, Dropout, Graduation Data
• Supported through DE-PBS Project• Delaware Assessment of Strengths and Needs for PBS• School Climate Surveys (staff, student, families)• DE-PBS Key Feature Evaluation


Discipline Data Reporting Tool (DDRT)
• Average referral per day per month• Comparison of year to year• Triangle data – Referrals by Student• Referral rate per 100 students compared to national
average (also useful to use if your population changes drastically)
• Referral rate per 100 students compared to DE Schools trained in PBS

Discipline Data Report ToolTab 1 – Data entry for average referral rates
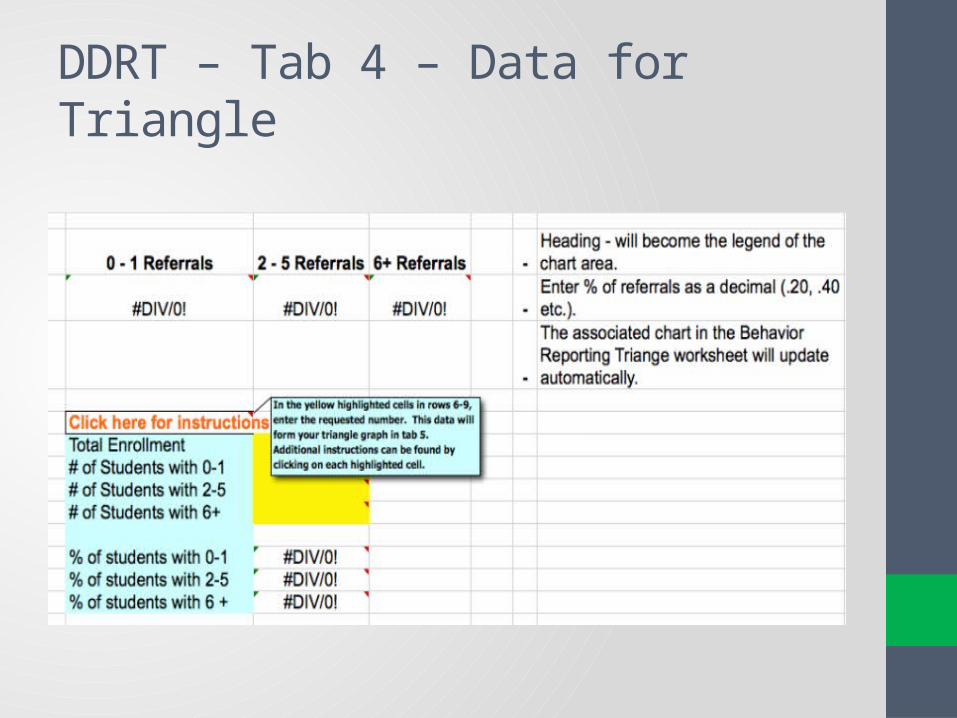
DDRT – Tab 4 – Data for Triangle

DDRT – Tab 6 – Per 100 Student referral rate

Delaware Assessment of Strengths and Needs for Positive Behavior Supports (DASNPBS)
• Aligned to Delaware’s Key Features of Positive Behavior Support
• Each item is drawn from supporting research and theory.
• Designed to help schools assess strengths and needs:• In four areas of comprehensive schoolwide
discipline• 10 items for each component
• In the areas of program development and evaluation• 10 items

DASNPBS Sections
• School-wide Tier 1 - Program Development and Evaluation
• Implementing Schoolwide & Classroom Systems
• Developing Self-Discipline
• Correcting Behavior Problems

Assessment Logistics
Who Should Complete It?• Teachers• Administrators • Other instructional/certified
school staff (i.e. school counselors, psychologists, intervention specialists, etc.)
Who Should Administer It? • School PBS Team
Leader/Team• School Administrator
When to Administer It? • Annually• Utilize staff meetings or In-
service sessions
How to administer it?• Ideally in sections – Select
sections based on need• Online or Paper – Online
recommended

DE-PBS Key Features Evaluation• The DE-PBS Key Feature Evaluation is a tool used to provide
feedback to schools based on their School-wide PBS (SW-PBS) program and implementation across 4 areas: • School-wide Tier 1 - Program Development and
Evaluation • Implementing Schoolwide & Classroom Systems• Developing Self-Discipline• Correcting Behavior Problems
• Onsite school visit includes interviews with Administration, PBS Team Leader(s), Staff, Students

Tomorrow’s AgendaDE-PBS Key Features for SW
• Program Development & Evaluation• Problem-Solving/Leadership Team• Data• Professional Development & Resources
• Developing SW and Classroom Systems to Prevent Problem Behavior• Expectations, Teaching and Recognition• Positive relationships
• Correcting Problem Behaviors• Consistent and clear procedures• Disciplinary encounters used as learning opportunities to teach
problem solving strategies • Developing Self-Discipline

Developing SW and Classroom Systems to Prevent Problem Behavior
• Expectations• Expectation
development• Posting
• Teaching• Kick off• Lesson plans
• Recognition• Matrix• Recognition
delivery• Positive relationships
• Teacher-student • Student-student• School/teacher -
home