ddt v no f y 2004 reviews analysistatistical validation ... · pii: s1359-6446(03)02978-7 an...
TRANSCRIPT

1359-6446/04/$ – see front matter ©2004 Elsevier Ltd. All rights reserved. PII: S1359-6446(03)02978-7
An explicit goal of proteomics is theidentification and (if applicable) quantifica-tion of proteins expressed in a cell or tissue[1]. Apart from emerging technologies such asprotein chips [2] and the mass spectrometric(MS) identification of intact proteins [3] (top-down proteomics), proteomic studiesfrequently depend on MS analysis of peptidesgenerated by proteolysis of single purifiedproteins or protein mixtures. Over the pastfew years, analysis of complex protein mix-tures by tandem MS (MS–MS) has becomewidely used. In this method, complex proteinmixtures are digested with proteases and theresulting peptide samples separated by one-or multi-dimensional liquid chromatography(LC) and analyzed by MS and MS–MS to se-quence the peptides (Figure 1) [4]. If the pep-tides are also encoded with a stable isotopesignature, relative protein abundance withrespect to a control sample can be accuratelydetermined using the same platform [5,6].Each MS–MS spectrum is associated with theamino acid sequence it best represents andthe data obtained from all the spectra in anexperiment are then used to infer the identityand quantity of proteins in a sample mixture.In a typical experiment of this type, thousands
of MS and MS–MS spectra are generated.Sequence database searching of MS–MS spec-tra to determine the sequence of the precur-sor peptide is typically the first and often theonly analysis carried out with such data. It isbeing increasingly recognized that more ex-tensive analysis of proteomic data generatedby LC–MS–MS experiments is required if theresults generated from different experiments,instruments and laboratories are to be pub-lished and related to each other [7–9]. Here,we discuss the need for statistical criteria forthe consistent analysis of large proteomicsdatasets and summarize currently availablebioinformatics tools that support data analysisand processing in high-throughput proteomics-based LC–MS–MS.
Peptide identificationAnalysis of proteomics datasets generatedusing LC–MS–MS usually starts with identifi-cation of the peptides that produce the ac-quired MS–MS spectra. In high-throughputstudies, peptides are usually identified bysequence database searching of uninterpretedMS–MS spectra, and several algorithms havebeen developed for this purpose [10–21](Table 1). In this approach, each acquiredMS–MS spectrum is compared with theoreti-cal spectra obtained from a sequence data-base. The search is typically restricted to onlythose database peptides that have a calculatedmass within a small range of the measuredpeptide mass. Expectation of certain peptideproperties with regard to the proteolytic en-zyme specificity can be used as an additional
Analysis, statistical validation anddissemination of large-scaleproteomics datasets generated bytandem MSAlexey I. Nesvizhskii and Ruedi Aebersold
Alexey I. Nesvizhskii*Ruedi Aebersold
Institute for Systems Biology1441 N 34th Street
SeattleWA 98103, USA
*e-mail: [email protected]
reviewsresearch focus
173
DDT Vol. 9, No. 4 February 2004
Tandem mass spectrometry has been used increasingly for high-throughput
analysis of complex protein samples. A major challenge lies in the consistent,
objective and transparent analysis of the large amounts of data generated
by such experiments and in their dissemination and publication. Here, we
review currently available computational tools and discuss the need for
statistical criteria in the analysis of large proteomics datasets.
www.drugdiscoverytoday.com
▼
constraint during the search. Theoretical spectra are calcu-lated for each of the candidate peptides using commonpeptide fragmentation rules and then the theoretical andacquired MS–MS spectra are compared. Each acquired MS–MSspectrum is thereby assigned the best matching databasepeptide.
The main difference between database search programsis the scoring function used to quantify the degree of simi-larity between the compared spectra. Because the methodinvolves the identification of peptides and not proteins, alltypes of sequence databases can be searched. These includeprotein sequence databases (most commonly searched) aswell as genomic and expressed sequence tag (EST) databases[22,23]. However, it should be noted that the databasesearch approach (in its straightforward use) only enablesidentification of those peptides that are present in thesearched sequence database. It cannot therefore identifypeptides derived from post-translationally modified pro-teins, sequence variants of known proteins, or proteinsfrom partially sequenced genomes. Searching genomic or
EST databases can potentially lead tothe identification of novel proteins ornovel splice variants of known pro-teins. However, owing to their size,searching such databases often takes asignificant amount of time. In addi-tion, other factors such as frame-shifts,incorrectly predicted open readingframes and the poor quality of manyEST sequences further complicate thesearch. In the future, more-refined se-quence databases from ongoing bioin-formatics efforts, such as the AlternativeSplicing Annotation Project [24] andthe Alternative Splicing Database Project(http://www.ebi.ac.uk/asd/), might elim-inate the need for searching MS–MSdata against genomic databases.
An alternative approach to peptideidentification is to determine peptidesequences from MS–MS spectra directlyusing de novo sequencing algorithms[25–33]. Derived peptide sequencescan then be searched against a proteinsequence database using BLAST- orFASTA-type sequence similarity searchalgorithms to infer the identities of theircorresponding proteins [12,25,34].However, currently available de novosequencing programs are computation-ally intensive and require high quality
MS–MS data. Such programs are therefore rarely used in high-throughput studies. They are typically used afterdatabase searching and applied only to a subset of the ac-quired data (high quality MS–MS spectra that did not getassigned a peptide with high confidence using the data-base search approach). In addition to being a method ofprimary peptide identification, de novo sequencing algo-rithms can also be used to simply filter out low-qualityspectra or assist in validation of peptide assignments madeby the database search tools [25]. Hybrid approaches havebeen described that combine the inference of short sequencetags (partial sequences) from MS–MS spectra using de novosequencing-like algorithms with an error-tolerant databasesearch (i.e. a search that allows for one-or-more mis-matches between the peptide represented by the MS–MSspectra and the database sequence) [35–37]. A somewhatdifferent strategy that also involves extraction of sequencetags has been recently proposed [18]. Another interestingapproach is based on pattern recognition of peptide se-quence motifs in MS–MS spectra [38]. It is hoped that these
174
DDT Vol. 9, No. 4 February 2004reviews research focus
www.drugdiscoverytoday.com
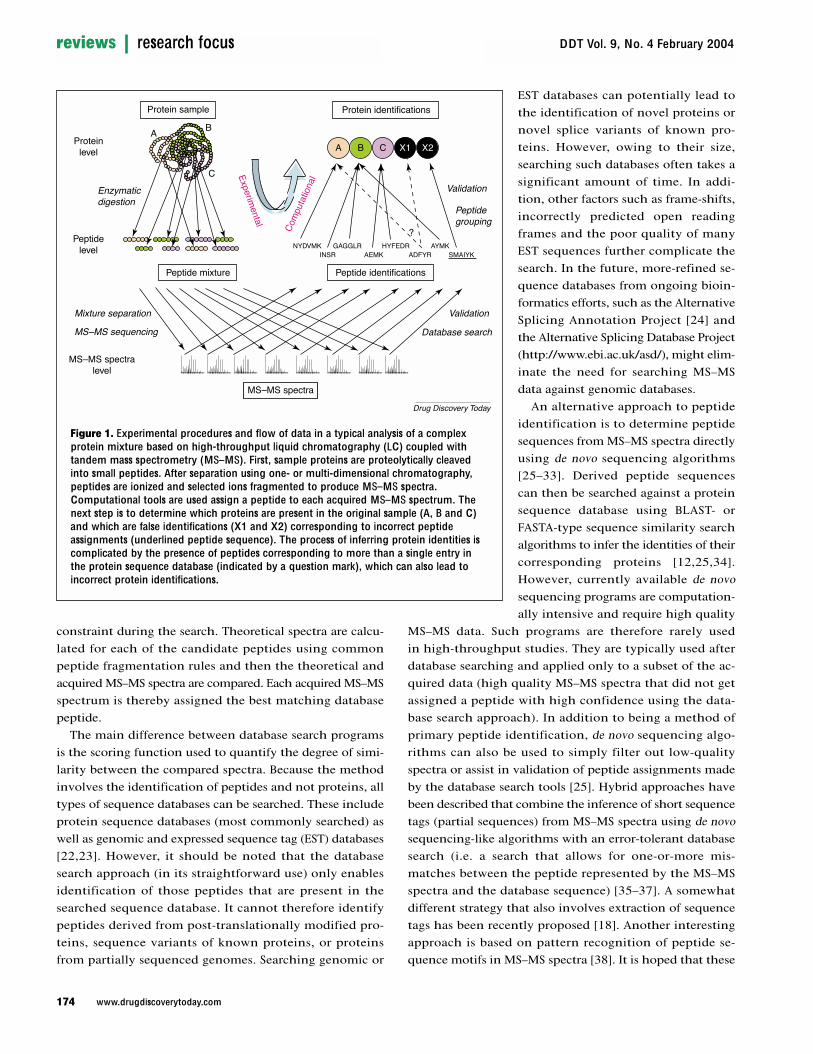
Figure 1. Experimental procedures and flow of data in a typical analysis of a complexprotein mixture based on high-throughput liquid chromatography (LC) coupled withtandem mass spectrometry (MS–MS). First, sample proteins are proteolytically cleavedinto small peptides. After separation using one- or multi-dimensional chromatography,peptides are ionized and selected ions fragmented to produce MS–MS spectra.Computational tools are used assign a peptide to each acquired MS–MS spectrum. Thenext step is to determine which proteins are present in the original sample (A, B and C)and which are false identifications (X1 and X2) corresponding to incorrect peptideassignments (underlined peptide sequence). The process of inferring protein identities iscomplicated by the presence of peptides corresponding to more than a single entry inthe protein sequence database (indicated by a question mark), which can also lead toincorrect protein identifications.
Drug Discovery Today
Protein sample
NYDVMKADFYRINSR
AYMKGAGGLR HYFEDRAEMK SMAIYK
A B C X1 X2A B
C
?
Protein identifications
Proteinlevel
Peptidelevel
MS–MS spectralevel
Peptide mixture Peptide identifications
MS–MS spectra
Experimental
Com
puta
tiona
l
Enzymaticdigestion
Mixture separation
MS–MS sequencing Database search
Validation
Peptidegrouping
Validation

methods and the error-tolerant database search approach[20] will eventually lead to the development of publiclyavailable computational tools for the identification ofpost-translationally modified or mutated peptides that canbe automated for use in a high-throughput environment.Nevertheless, direct database searching will probablycontinue to be used as the primary peptide identificationmethod in most high-throughput LC–MS–MS-based studies.
Validation of peptides identified by databasesearchingAs with many other database search applications, the mainchallenge is not finding the best match in the database butrather how to determine whether this best match assign-ment is correct [39–41]. If all spectra acquired in a typicalLC–MS–MS experiment are searched against a sequencedatabase, and the best match is assumed to be correct, then(without further filtering) a large fraction of the assignedpeptides would be wrong [42]. This situation can arise be-cause the scoring schemes used in current database searchtools are based on a simplified representation of the pep-tide ion fragmentation process. In addition, the chargestate of the peptide ions selected for fragmentation is notalways known with high certainty, and many of the MS–MS
spectra are of low quality. Furthermore, a significant num-ber of high-quality spectra are assigned a wrong peptidebecause their true corresponding peptides are not presentin the searched sequence database.
The sensitivity and specificity of the peptide identifi-cation process can be increased by several methods, includ-ing additional processing of MS–MS spectra before databasesearching [43], clustering of redundant spectra [44,45],removal of low-quality spectra [46,47], and application ofautomated charge-state determination algorithms [48–50].In addition, the development of more-advanced scoringschemes that incorporate additional knowledge of peptidefragmentation chemistry [51,52] should result in furtherimprovements. Nevertheless, the problem of incorrect pep-tide assignments can be only reduced and not completelyeliminated. Therefore, to derive meaningful informationfrom the data, significant effort has to be put into valida-tion of peptide assignments produced by the databasesearch tools [7,8,39]. This applies not only to tools thatthemselves provide no statistically computed confidencemeasures for evaluation of the validity of peptide identifi-cations (i.e. SEQUEST [10]), but also to probability-basedscoring tools such as MASCOT [11]. Manual validation ofdatabase search results is time-consuming and simply not
175
DDT Vol. 9, No. 4 February 2004 reviewsresearch focus
www.drugdiscoverytoday.com
Table 1. Publicly available tools for assigning peptides to tandem mass spectrometry spectra and forstatistical validation of peptide and protein identifications
Program Refs Website
Database search tools
SEQUEST [10] http:/ /www.thermo.com
MASCOT [11] http:/ /www.matrixscience.coma
MS-Tag [12] http:/ /prospector.ucsf.edua
Sonar [13] http:/ /65.219.84.5/service/prowl/sonar.htmla
ProbID [21] http:/ /projects.systemsbiology.net/probidb
X! tandem [26] http:/ /www.proteome.ca/opensource.htmlb
XProteo http:/ /xproteo.com:2698a
De novo sequencing tools
Lutefisk [25] http:/ /www.hairyfatguy.com/Lutefiskb
De Novo [34] http:/ /hto-c.usc.edu:8000/msms/menu/denovo.htma
PEAKS [5] http:/ /www.bioinformaticssolutions.com/Software/peaks/index.phpa
Sequence tag approach
GutenTag [37] http:/ /fields.scripps.edu/GutenTag/
Integrated proteomics platform (multiple tools)
SpectrumMill http:/ /www.chem.agilent.com/
Statistical validation of peptide and protein identifications
PeptideProphet [39] http:/ /www.proteomecenter.org/software.phpb
ProteinProphet [40] http:/ /www.proteomecenter.org/software.phpb
aFree access via the web interface (functionality might be limited).bFree distribution.

feasible for high-throughput analysis of large datasets con-taining hundreds of thousands of spectra. Furthermore,manual validation requires significant expertise in MS andpeptide fragmentation chemistry, which is often not avail-able, and consistent and objective evaluation of the dataare difficult, even by experts.
As an alternative approach, or used in combination withmanual validation, researchers can separate correct fromincorrect peptide assignments by applying ad hoc filteringcriteria based upon database search scores and some prop-erties of the assigned peptides. This task can be facilitatedby software tools such as INTERACT [53], DTASelect [54] or CHOMPER [55], all of which are compatible with both SEQUEST and MASCOT, the two most commonly useddatabase search tools. However, with few exceptions[42,56], false identification error rates resulting from theapplication of filtering criteria are not estimated and notreported. Therefore, comparison of results from differentexperiments or groups is virtually impossible. Such com-parisons are further complicated by the use of differentdatabase search tools for peptide assignment. Thus, consis-tent and reliable interpretation of data to enable the com-parison of results from different experimental groups willrequire robust statistical methods to validate peptide as-signments to MS–MS spectra. Similar advantages have beenalready realized in other high-throughput fields. For example,statistical models have been developed for the estimationof errors in raw DNA sequences obtained using large-scaleDNA sequencing [57].
Several statistical methods for validating peptide assign-ments to MS–MS spectra made by database search toolshave recently been described [39,58–61]. Fenyo and Beavis[60] converted the scores reported by database search toolsinto expectation values similar to those used in the sequencesimilarity search algorithms [62]. If such an approach wereuniversally accepted, the problem of incompatibilitybetween scoring schemes in different search tools wouldbe eliminated. However, expectation values do not enablethe estimation of false-positive error rates resulting fromfiltering of the data. Furthermore, this approach requiressignificant modification of already existing tools, which isunlikely to occur. Instead, peptide assignments can be vali-dated using statistical programs developed on top of exist-ing database search tools. This approach has the additionaladvantage that, in principle, it can use any additionalinformation that discriminates between correct and incor-rect peptide assignments but is not used as a part of thedatabase search scoring scheme. Such additional infor-mation can be obtained directly from the sequences ofassigned peptides, for example, the observed frequency ofmissed cleavage sites in the peptides sequences (internal
residues at which the protein was expected to be cleavedby the proteolytic enzyme), or the separation coordinatesof a peptide based on reverse-phase elution time (reverse-phase chromatography) [63] or pI value (isoelectric focus-ing gels) [64]. Therefore, the peptide identification processcan itself be assisted by knowledge of the protein digestionand peptide separation processes.
Several supervised classification methods for post-data-base search validation of peptide assignments have re-cently been described, with underlying statistical methodsbased on linear discriminant analysis [39], support vectormachines [59] and non-linear function optimization [61].However, it should be noted that fully supervised classifi-cation algorithms might not produce accurate results whenapplied to datasets that are significantly different fromthose used for training. This limits the realistic applicabil-ity of such methods in a high-throughput environmentowing to variations in the quality of acquired MS–MS spec-tra, complexity of the analyzed samples, and differences inthe experimental protocols, among other factors. Thus,rather than being relied upon exclusively, training datasetsshould be used to determine the features that discriminatebetween correct and incorrect peptide assignments fromthe data itself [39].
One statistical model used in the software toolPeptideProphet is based upon use of the expectation maxi-mization algorithm to derive a mixture model of correctand incorrect peptide assignments from the data [39]. Ituses the observed information about each assigned peptidein the dataset, learns to distinguish correct from incorrectpeptide assignments and, finally, computes a probabilityfor each assignment being correct. Peptide assignmentinformation used by the model typically includes databasesearch scores, the difference between measured andtheoretical peptide mass, the number of termini consistentwith the type of enzymatic cleavage used, and the numberof missed cleavage sites. If the database search tool outputsmore than a single score useful for distinguishing correctfrom incorrect peptide assignments, all such scores arecombined into a single score (discriminant score) in such away that correct and incorrect peptide assignments are op-timally discriminated for in every type of mass spectrome-ter. The model also uses additional information whereavailable, such as the presence of a specific amino acid orsequence motif. For example, the presence of cysteineconfers avidin-affinity-purification of peptides containingbiotinylated cysteines [41], and the sequence motif N-X-S/Tdiscriminates peptides containing N-linked glycosylationsites [65]. This can also be extended to include peptide separation coordinates such as elution time [63] or pI value[64]. Finally, because this method learns from the data,
176
DDT Vol. 9, No. 4 February 2004reviews research focus
www.drugdiscoverytoday.com
it can handle variations in sample complexity, data qualityand proteolytic digest efficiency, among other factors.
The advantage of using probabilities as confidence mea-sures to accompany peptide identifications is that theycan be used to estimate both the total number of correctidentifications and the false-positive error rates resultingfrom data filtering using a minimum computed proba-bility as the filtering criteria [39]. This facilitates the com-parison of different types of mass spectrometers or thebenchmarking of various mass spectrometer settings andexperimental procedures to identify those that maximizethe number of correct peptide identifications per sampleor per unit time. More importantly, computed peptideprobabilities enable statistical estimations of the presenceof proteins that correspond to those peptides in the originalsample.
Validation of protein identificationThe goal of a high-throughput proteomics approach is to de-termine the identity of the proteins present in the originalsample. However, because MS–MS spectra are produced frompeptides and not proteins, all conclusions drawn about theprotein content of the original sample are based upon theidentification of peptides. The connectivity betweenpeptides and proteins is usually quite straightforward whenbased on the digestion of purified proteins. This is the casein most studies in which proteins extracted from 2D gels areanalyzed. However, this connectivity is lost when complexprotein samples are digested [40,66]. As a result, inferringprotein identities from the set of identified peptidesbecomes a major challenge (Figure 1). As a first step, peptideassignments must be grouped according to their correspond-ing entries in the protein sequence database. Next, for each
177
DDT Vol. 9, No. 4 February 2004 reviewsresearch focus
www.drugdiscoverytoday.com
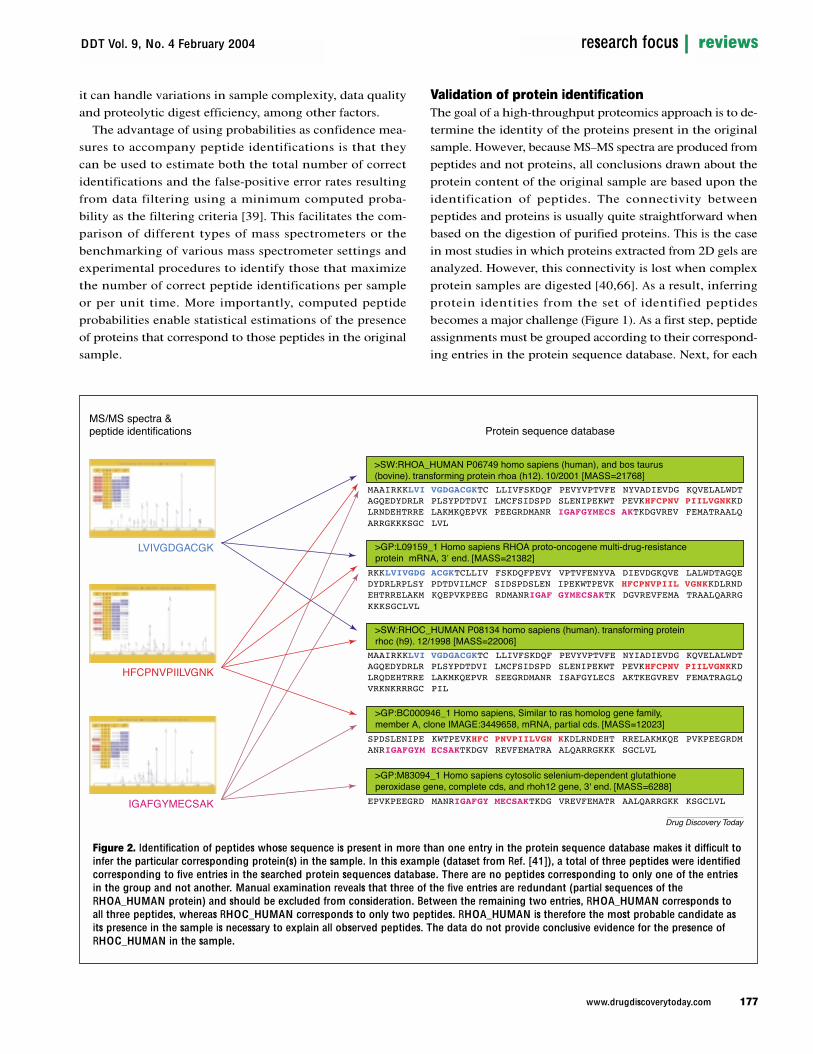
Figure 2. Identification of peptides whose sequence is present in more than one entry in the protein sequence database makes it difficult toinfer the particular corresponding protein(s) in the sample. In this example (dataset from Ref. [41]), a total of three peptides were identifiedcorresponding to five entries in the searched protein sequences database. There are no peptides corresponding to only one of the entriesin the group and not another. Manual examination reveals that three of the five entries are redundant (partial sequences of theRHOA_HUMAN protein) and should be excluded from consideration. Between the remaining two entries, RHOA_HUMAN corresponds toall three peptides, whereas RHOC_HUMAN corresponds to only two peptides. RHOA_HUMAN is therefore the most probable candidate asits presence in the sample is necessary to explain all observed peptides. The data do not provide conclusive evidence for the presence ofRHOC_HUMAN in the sample.
Drug Discovery Today
>SW:RHOA_HUMAN P06749 homo sapiens (human), and bos taurus(bovine). transforming protein rhoa (h12). 10/2001 [MASS=21768]
MAAIRKKLVI VGDGACGKTC LLIVFSKDQF PEVYVPTVFE NYVADIEVDG KQVELALWDTAGQEDYDRLR PLSYPDTDVI LMCFSIDSPD SLENIPEKWT PEVKHFCPNV PIILVGNKKDLRNDEHTRRE LAKMKQEPVK PEEGRDMANR IGAFGYMECS AKTKDGVREV FEMATRAALQARRGKKKSGC LVL
>GP:L09159_1 Homo sapiens RHOA proto-oncogene multi-drug-resistanceprotein mRNA, 3′ end. [MASS=21382]
RKKLVIVGDG ACGKTCLLIV FSKDQFPEVY VPTVFENYVA DIEVDGKQVE LALWDTAGQEDYDRLRPLSY PDTDVILMCF SIDSPDSLEN IPEKWTPEVK HFCPNVPIIL VGNKKDLRNDEHTRRELAKM KQEPVKPEEG RDMANRIGAF GYMECSAKTK DGVREVFEMA TRAALQARRGKKKSGCLVL
>SW:RHOC_HUMAN P08134 homo sapiens (human). transforming proteinrhoc (h9). 12/1998 [MASS=22006]
MAAIRKKLVI VGDGACGKTC LLIVFSKDQF PEVYVPTVFE NYIADIEVDG KQVELALWDTAGQEDYDRLR PLSYPDTDVI LMCFSIDSPD SLENIPEKWT PEVKHFCPNV PIILVGNKKDLRQDEHTRRE LAKMKQEPVR SEEGRDMANR ISAFGYLECS AKTKEGVREV FEMATRAGLQVRKNKRRRGC PIL
>GP:BC000946_1 Homo sapiens, Similar to ras homolog gene family,member A, clone IMAGE:3449658, mRNA, partial cds. [MASS=12023]
SPDSLENIPE KWTPEVKHFC PNVPIILVGN KKDLRNDEHT RRELAKMKQE PVKPEEGRDMANRIGAFGYM ECSAKTKDGV REVFEMATRA ALQARRGKKK SGCLVL
>GP:M83094_1 Homo sapiens cytosolic selenium-dependent glutathioneperoxidase gene, complete cds, and rhoh12 gene, 3' end. [MASS=6288]
EPVKPEEGRD MANRIGAFGY MECSAKTKDG VREVFEMATR AALQARRGKK KSGCLVL
LVIVGDGACGK
HFCPNVPIILVGNK
IGAFGYMECSAK
MS/MS spectra &peptide identifications Protein sequence database

protein, the combined peptide evidence is used to estimatethe likelihood of its presence in the sample.
Assembling peptides into proteins is not straightforward(Figure 2). This challenge is analogous to that of shotgun frag-ment assembly where overlapping short DNA segments mustbe ordered to recreate the original sequence [67]. Determiningthe correct sequence assembly is difficult owing to thepresence of repeats (identical stretches of the DNA sequencepresent at different locations throughout the genome).Similarly, the presence of degenerate peptides, that is,peptides whose sequence is present in more than one entry inthe protein sequence database, makes it difficult to determinethe corresponding protein(s) present in the sample [40]. Suchcases often result from the presence of homologous proteins,splicing variants, or redundant entries in the protein sequencedatabase, and are particularly abundant in large higher eu-karyotic databases [66]. Unfortunately, this problem is oftenoverlooked, and the words ‘protein identification’ and‘peptide identification’ are used almost interchangeably.
Another challenge arises from the non-random group-ing of peptides according to their corresponding proteins(Figure 3) [40]. Correct peptide identifications tend togroup into a relatively small number of proteins. By con-trast, incorrect peptide assignments can be described asrandom matches to entries in a very large protein sequencedatabase. Thus, almost every (high scoring) incorrect pep-tide assignment results in one additional incorrect proteinidentification. As a result, even a relatively small false-positive identification error rate at the peptide level cantranslate into a significant error rate at the protein level. Italso makes detection of correct protein identificationsbased on a single peptide (often the case with low abun-dance proteins) difficult because most of the incorrectprotein identifications only have one corresponding peptidein the dataset.
Some database search tools (e.g. MASCOT) enable theuser to view the results in a format that groups peptides according to their corresponding proteins. However, mostlarge-scale studies generate multiple datasets of MS–MSspectra that are acquired and processed at different times.Thus, to derive a composite list of protein identifications,peptide assignments from multiple experiments must becombined using other means. The software tools INTERACT,DTASelect and CHOMPER can be used to automate thisprocess. However, these tools do not compute any statisti-cal confidence measures for protein identifications. Otherrecently described programs compute some kind of proba-bility-based scores [58,61,68] but do not use any statisticalmodels for resolving degenerate peptides.
The statistical model of Nesvizhskii et al. [40] used inthe software tool ProteinProphet addresses all of the diffi-culties discussed previously. It computes a probability thata protein is present in the sample by combining theprobabilities that corresponding peptides are correct.Individual peptide probabilities are adjusted for observedprotein grouping information. Peptides corresponding tosingle-hit proteins are penalized (but not excluded),whereas those corresponding to multi-hit proteins arerewarded. The amount of adjustment depends on the sam-ple complexity and the number of acquired MS–MS spec-tra, among other factors, and is learned from the datausing the expectation maximization algorithm. Themodel handles degenerate peptides by sharing each suchpeptide among all its corresponding proteins to derive aminimal protein list sufficient to account for the identi-fied peptides. The model reduces redundant database en-tries into a single identification and groups together thoseproteins that are impossible to differentiate on the basisof identified peptides. The model produces accurate prob-abilities of the presence of a protein, with high power to
178
DDT Vol. 9, No. 4 February 2004reviews research focus
www.drugdiscoverytoday.com
Figure 3. Non-random grouping of peptides according to their corresponding proteins. Ten tandem mass spectrometry(MS–MS) spectra were searched against a protein sequencedatabase and each spectrum was assigned the best matchingpeptide with nine out of ten assignments being correct. Theincorrect peptide assignment (black square) results in oneincorrect protein identification (X). Nine correct peptideassignments (colored squares) correspond to only four correctproteins (A, B, C and D). As a result, in this example, a 10%false-positive identification error rate at the peptide level (nine out of ten peptide assignments are correct) translates intoa 20% error rate at the protein level (four out of five proteinidentifications are correct).
Drug Discovery Today
MS_MS spectra &peptide identifications Protein identifications
C B
X
A
D

discriminate between correct and incorrect protein identi-fications including identifications based on a singlepeptide. Furthermore, computed probabilities can be usedto estimate false-positive error rates resulting from datafiltering. This model therefore provides a consistentmeans of publishing large-scale datasets of protein identi-fications [40,41].
Large-scale datasets: filtering and their publicationin the literatureComputational tools for the statistical validation of peptide and protein identifications are of significant valueto high-throughput proteomics. They avoid laborious manual data validation and provide a fast, consistent and transparent means to analyze data. As these tools becomewidely available, and independently tested and understoodby researchers collecting and analyzing the data, theycould provide a standard for the publication and dissemi-nation of large-scale protein identification datasets[8,40,41]. When only the most confident identificationsare desired, such as in the submission of protein identifi-cation data to (not yet existing) public databases, datasetsof protein identifications can be filtered using a high mini-mum-probability threshold (e.g. 0.99). Researchers pub-lishing large-scale datasets in scientific journals should beencouraged to include extended lists of peptide and pro-tein identifications (e.g. all identifications with a >0.5probability of being correct) along with their correspond-ing probabilities [41]. Ideally, publications should also include all supporting data, including MS–MS spectra, al-though the practical aspects of storing and managing largedatasets by scientific journals have yet to be worked out. Ifthis protocol is followed, other researches will have accessto the most complete dataset possible to interpret or usefurther at their discretion. For example, researchers access-ing the published data might be interested in a particularset of proteins, regardless of the statistically estimated levelof confidence for their presence in the sample. In suchcases, the raw MS–MS data can be further interrogatedusing additional computational approaches such as thosebased on de novo sequencing. Often, additional experi-ments will be necessary to confirm the validity of someprotein identifications. However, time and cost considera-tions mean that such experiments might only be possiblefor a small number of proteins. Protein probabilities cantherefore serve as a guide for selection of the most interest-ing candidates.
Computed protein probabilities should also enable theuser to compare different protein identification datasets(e.g. those generated by different research groups studyingthe same biological system) using the total number of
correct protein identifications estimated by the model[39–41]. Datasets can also be compared objectively by spec-ifying a uniform error rate and applying to each dataset thecorresponding minimum probability threshold as the datafilter. Finally, published protein identifications accompa-nied by accurate probabilities will provide maximal infor-mation to higher level computational analyses based onproteomic data, such as those concerned with the identifi-cation of protein–protein interactions or metabolic pathwayreconstruction, provided that protein probabilities are takeninto account.
Concluding remarksSignificant progress in protein chemistry, separation meth-ods and mass spectrometry in the past decade has enableddatasets containing information about thousands of pro-teins to be collected in a matter of weeks or even days.However, the development of computational tools for vali-dation, interpretation and extraction of biological knowl-edge from such datasets has lagged behind. The process ofvalidating datasets of protein identifications obtainedusing high-throughput LC–MS–MS traditionally relied upontime-consuming and often subjective manual verification.In the absence of data analysis standards, published large-scale datasets are of little value to other researchers; eventhe value of the interpreted data is unclear. Researchersinterrogating such datasets cannot easily compare or corre-late the findings with those of their own. Fortunately, theimportance of data analysis using robust statistical criteriais now being realized. Several computational tools havebeen developed that enable the fast, consistent and trans-parent analysis of large-scale proteomics datasets.
Clearly, it is unrealistic in the short term to expect dif-ferent research groups to agree to use the same statisticaltools or approaches to analyze their data. However, it isreasonable for the general research community, particu-larly members of the editorial boards of scientific journals,to request that researchers statistically validate their datausing only those tools that satisfy the following criteria.First, important details of the underlying statistical modelsshould be made available. Second, accuracy of the modelsshould be tested extensively using reference datasets(which can be created specifically for that purpose).Finally, the software tools used should be made availableto the public. This could be achieved on a commercial basisfor a reasonable fee or, where possible, free-of-charge andas open source programs. If widely accepted, together withthe development of MS data representation standards [69],such an approach should facilitate the creation of central-ized databases of peptide and protein identifications andpublic repositories for storing acquired MS data. The idea
179
DDT Vol. 9, No. 4 February 2004 reviewsresearch focus
www.drugdiscoverytoday.com

of merging data from the same organisms – particularly humans – generated in different experiments is particularlyattractive. The combined results could be then applied tothe whole genome – eventually validating all genes thatare expressed on the protein level – or used to elucidateglobal patterns (e.g. tissue specificity) of protein expressionthat would otherwise be missed in analysis of a single ex-periment. Finally, access to data stored in public reposito-ries, especially raw data, will enable those with access to noMS data to become involved in the development of moreadvanced computational methods and software tools.
AcknowledgementsThis work was funded in part by Federal funds from theNational Heart, Lung and Blood Institute at the NationalInstitutes of Health (contract number N01-HV-28179).
References1 Aebersold, R. and Mann, M. (2003) Mass spectrometry-based
proteomics. Nature 422, 198–2072 Zhu, H. and Snyder, M. (2003) Protein chip technology. Curr. Opin.
Chem. Biol. 7, 55–633 Reid, G.E. and McLuckey, S.A. (2002) ‘Top down’ protein
characterization via tandem mass spectrometry. J. Mass Spectrom. 37,663–675
4 Link, A.J. et al. (1999) Direct analysis of protein complexes using massspectrometry. Nat. Biotechnol. 17, 676–682
5 Gygi, S.P. et al. (1999) Quantitative analysis of complex proteinmixtures using isotope-coded affinity tags. Nat. Biotechnol. 17, 994–999
6 Goshe, M.B. and Smith, R.D. (2003) Stable isotope-coded proteomicmass spectrometry. Curr. Opin. Biotechnol. 14, 101–109
7 Burlingame, A.L. (2003) Toward deciphering the knowledge encryptedin large datasets. Mol. Cell. Proteomics 2, 425
8 Patterson, S.D. (2003) Data analysis – the Achilles heel of proteomics.Nat. Biotechnol. 21, 221–222
9 Boguski, M.S. and McIntosh, M.W. (2003) Biomedical informatics forproteomics. Nature 422, 233–237
10 Eng, J.K. et al. (1994) An approach to correlate tandem mass spectraldata of peptides with amino acid sequences in a protein database. J. Am. Soc. Mass Spectrom. 5, 976–989
11 Perkins, D.N. et al. (1999) Probability-based protein identification bysearching sequence databases using mass spectrometry data.Electrophoresis 20, 3551–3567
12 Clauser, K.R. et al. (1999) Role of accurate mass measurement (+/− 10 ppm) in protein identification strategies employing MS orMS/MS and database searching. Anal. Chem. 71, 2871–2882
13 Field, H.I. et al. (2002) RADARS, a bioinformatics solution thatautomates proteome mass spectral analysis, optimizes proteinidentification, and archives data in a relational database. Proteomics 2,36–47
14 Bafna, V. and Edwards, N. (2001) SCOPE: a probabilistic model forscoring tandem mass spectra against a peptide database. Bioinformatics17 (Suppl.), S13–S21
15 Pevzner, P.A. et al. (2001) Efficiency of database search for identificationof mutated and modified proteins via mass spectrometry. Genome Res.11, 290–299
16 Zhang, N. et al. (2002) ProbID: a probabilistic algorithm to identifypeptides through sequence database searching using tandem massspectral data. Proteomics 2, 1406–1412
17 Havilio, M. et al. (2003) Intensity-based statistical scorer for tandemmass spectrometry. Anal. Chem. 75, 435–444
18 Hernandez, P. et al. (2003) Popitam: towards new heuristic strategies toimprove protein identification from tandem mass spectrometry data.Proteomics 3, 870–878
19 Colinge, J. et al. (2003) OLAV: towards high-throughput tandem massspectrometry data identification. Proteomics 3, 1454–1463
20 Sadygov, R.G. and Yates, J.R., III (2003) A hypergeometric probabilitymodel for protein identification and validation using tandem massspectral data and protein sequence databases. Anal. Chem. 75,3792–3798
21 Craig, R. and Beavis, R.C. (2003) A method for reducing the timerequired to match protein sequences with tandem mass spectra. Rapid Commun. Mass Spectrom. 17, 2310–2316
22 Kuster, B. et al. (2001) Mass spectrometry allows direct identification ofproteins in large genomes. Proteomics 1, 641–650
23 Choudhary, J.S. et al. (2001) Interrogating the human genome usinguninterpreted mass spectrometry data. Proteomics 1, 651–667
24 Lee, C. et al. (2003) ASAP: the alternative splicing annotation project.Nucleic Acids Res. 31, 101–105
25 Taylor, J.A. and Johnson, R.C. (2001) Implementation and uses ofautomated de novo peptide sequencing by tandem mass spectrometry.Anal. Chem. 73, 2594–2604
26 Dancik, V. et al. (1999) De novo peptide sequencing via tandem massspectrometry. J. Comput. Biol. 6, 327–342
27 Fernandez-de-Cossio, J. et al. (2000) Automated interpretation of low-energy collision-induced dissociation spectra by SeqMS, a software aidfor de novo sequencing by tandem mass spectrometry. Electrophoresis 21,1694–1699
28 Chen, T. et al. (2001) A dynamic programming approach to de novosequencing via tandem mass spectrometry. J. Comput. Biol. 8, 325–337
29 Lubeck, O. et al. (2002) New computational approaches for de novopeptide sequencing from MS/MS experiments. Proc. IEEE 90, 1868–1874
30 Lu, B.W. and Chen, T. (2003) A suboptimal algorithm for de novopeptide sequencing via tandem mass spectrometry. J. Comput. Biol. 10,1–12
31 Ma, B. et al. (2003) PEAKS: powerful software for peptide de novosequencing by tandem mass spectrometry. Rapid Commun. MassSpectrom. 17, 2337–2342
32 Bafna, V. and Edwards, N. (2003) On de novo interpretation of peptidesequencing via tandem mass spectrometry. In RECOMB 2003, pp. 9–18
33 Cannon, W.R. and Jarmal, K.D. (2003) Improved peptide sequencingusing isotope information inherent in tandem mass spectra. RapidCommun. Mass Spectrom. 17, 1793–1801
34 Shevchenko, A. et al. (2001) Charting the proteomes of organisms withunsequenced genomes by MALDI-quadrupole time-of-flight massspectrometry and BLAST homology searching. Anal. Chem. 73, 1917–1926
35 Mann, M. and Wilm, M. (1994) Error-tolerant identification of peptidesin sequence databases by peptide sequence tags. Anal. Chem. 66,4390–4399
36 Sunyaev, S. et al. (2003) MultiTag: multiple error-tolerant sequence tagsearch for the sequence-similarity identification of proteins by massspectrometry. Anal. Chem. 75, 1307–1315
37 Tabb, D.L. et al. (2003) GutenTag: high-throughput sequence taggingvia an empirically derived fragmentation model. Anal. Chem. 75,6415–6421
38 Liebler, D.C. et al. (2002) Peptide sequence motif analysis of tandemMS data with the SALSA algorithm. Anal. Chem. 74, 203–210
39 Keller, A. et al. (2002) Empirical statistical model to estimate theaccuracy of peptide identifications made by MS/MS and databasesearch. Anal. Chem. 74, 5383–5392
40 Nesvizhskii, A.I. et al. (2003) A statistical model for identifying proteinsby tandem mass spectrometry. Anal. Chem. 75, 4646–4658
41 Von Haller, P.D. et al. (2003) The application of new software tools toquantitative protein profiling via ICAT and tandem mass spectrometry:II. Evaluation of tandem mass spectrometry methodologies for large-scale protein analysis and the application of statistical tools for dataanalysis and interpretation. Mol. Cell. Proteomics 2, 428–442
180
DDT Vol. 9, No. 4 February 2004reviews research focus
www.drugdiscoverytoday.com

42 Keller, A. et al. (2002) Experimental protein mixture for validatingtandem mass spectral analysis. OMICS 6, 207–212
43 Gentzel, M. et al. (2003) Preprocessing of tandem mass spectrometricdata to support automatic protein identification. Proteomics 3,1597–1610
44 Beer, I. et al. (2003) Pep-Miner: high throughput proteomics made easy.In Proc. 50th ASMS Conf. Mass Spectrom. Allied Top., Montreal, Canada
45 Tabb, D.L. et al. (2003) Similarity among tandem mass spectra fromproteomic experiments: detection, significance, and utility. Anal. Chem.75, 2470–2477
46 Moore, R.E. et al. (2000) Method for screening peptide fragment ionmass spectra prior to database searching. J. Am. Soc. Mass Spectrom. 11,422–426
47 Kolker, E. et al. (2003) Initial proteome analysis of modelmicroorganism Haemophilus influenzae Rd strain KW20. J. Bacteriol. 185,4593–4602
48 Sadygov, R.G. et al. (2002) Code developments to improve theefficiency of automated MS/MS spectra interpretation. J. Proteome Res.1, 211–215
49 Perez, R.E. et al. (2002) Peptide precursor charge state determinationdirectly from ion trap MS/MS spectra. In Proc. 50th ASMS Conf. MassSpectrom. Allied Top., Orlando, FL, USA
50 Colinge, J. et al. (2003) Improved peptide charge state assignment.Proteomics 3, 1434–1440
51 Tabb, D.L. et al. (2003) Statistical characterization of ion trap tandemmass spectra from doubly charged tryptic peptides. Anal. Chem. 75,1155–1163
52 Kapp, E.A. et al. (2003) Mining a tandem mass spectrometry database to determine the trends and global factors influencing peptidefragmentation. Anal. Chem. 75, 6251–6254
53 Han, D.K. et al. (2001) Quantitative profiling of differentiation-inducedmicrosomal proteins using isotope-coded affinity tags and massspectrometry. Nat. Biotechnol. 19, 946–951
54 Tabb, D.L. et al. (2002) DTASelect and Contrast: tools for assemblingand comparing protein identifications from shotgun proteomics. J. Proteome Res. 1, 21–26
55 Eddes, J.S. et al. (2002) CHOMPER: a bioinformatic tool for rapidvalidation of tandem mass spectrometry search results associated with
high-throughput proteomic strategies. Proteomics 2, 1097–110356 Peng, J. et al. (2003) Evaluation of multidimensional chromatography
coupled with tandem mass spectrometry (LC/LC-MS/MS) for large scaleprotein analysis: the yeast proteome. J. Proteome Res. 2, 43–50
57 Ewing, B. and Green, P. (1998) Base-calling of automated sequencertraces using phred. II. Error probabilities. Genome Res. 8, 186–194
58 MacCoss, M.J. et al. (2002) Probability-based validation of proteinidentifications using a modified SEQUEST algorithm. Anal. Chem. 74,5593–5599
59 Anderson, D.C. et al. (2003) A new algorithm for the evaluation ofshotgun peptide sequencing in proteomics: support vector machineclassification of peptide MS/MS spectra and SEQUEST scores. J. ProteomeRes. 2, 137–146
60 Fenyo, D. and Beavis, R.C. (2003) A method for assessing the statisticalsignificance of mass spectrometry-based protein identifications usinggeneral scoring schemes. Anal. Chem. 75, 768–774
61 Kislinger, T. et al. (2003) PRISM, a generic large scale proteomicinvestigation strategy for mammals. Mol. Cell. Proteomics 2, 96–106
62 Karlin, S. and Altschul, S.F. (1990) Methods for assessing the statisticalsignificance of molecular sequence features by using general scoringschemes. Proc. Natl. Acad. Sci. U. S. A. 87, 2264–2268
63 Petritis, K. et al. (2003) Use of artificial neural networks for the accurateprediction of peptide liquid chromatography elution times in proteomeanalyses. Anal. Chem. 75, 1039–1048
64 Cargile, B.J. et al. Gel based isoelectric focusing of peptides and theutility of isoelectric point in protein identification. J. Proteome Res.(in press)
65 Zhang, H. et al. (2003) Identification and quantification of N-linkedglycoproteins using hydrazide chemistry, stable isotope labeling andmass spectrometry. Nat. Biotechnol. 21, 660–666
66 Rappsilber, J. and Mann, M. (2002) What does it mean to identify aprotein in proteomics? Trends Biochem. Sci. 27, 74–78
67 Myers, E.W. et al. (2000) A whole-genome assembly of Drosophila.Science 287, 2196–2204
68 Moore, R.E. et al. (2002) Qscore: an algorithm for evaluating SEQUESTdatabase search results. J. Am. Soc. Mass Spectrom. 13, 378–386
69 Orchard, S. et al. (2003) Further advances in the development of a datainterchange standard for proteomics data. Proteomics 3, 2065–2066
181
DDT Vol. 9, No. 4 February 2004 reviewsresearch focus
www.drugdiscoverytoday.com
Want to get your voice heard?
Here is an unrivalled opportunity to put your view forward to some of the key scientists
and business leaders in the field
Letters can cover any topic relating to the pharma industry –
comments, replies to previous letters, practical problems…
Please send all contributions to Dr Steve Carney
e-mail: s.carney @elsevier.com
Publication of letters is subject to editorial discretion