ddt user guide - colorado school of minesgeco.mines.edu/compilerdocs/allinea/ddt/userguide.pdfddt...
TRANSCRIPT

DDT User GuideVersion 2.5

Distributed Debugging Tool v2.5
ContentsContents.......................................................................................................................................................11 Introduction..............................................................................................................................................62 Installation and Configuration.................................................................................................................7
2.1 Installation.........................................................................................................................................72.1.1 Graphical Install.........................................................................................................................72.1.2 Text-mode Install.......................................................................................................................82.1.3 Licence Files..............................................................................................................................92.1.4 Floating Licences.......................................................................................................................9
2.2 Configuration..................................................................................................................................102.2.1 Site Wide Configuration .........................................................................................................12
2.3 Integrating DDT With Queuing Systems.......................................................................................132.3.1 The Template Script.................................................................................................................132.3.2 OpenMPI, Altix, Blue Gene/P and Cray MPT........................................................................142.3.3 MPICH based MPI...................................................................................................................142.3.4 Other MPIs...............................................................................................................................152.3.5 Scalar Programs.......................................................................................................................152.3.6 Defining New Tags..................................................................................................................152.3.7 Configuring Queue Commands...............................................................................................17
2.4 Connecting to remote programs (remote-exec)..............................................................................182.5 Optional Configuration...................................................................................................................19
2.5.1 System......................................................................................................................................192.5.2 Job Submission........................................................................................................................202.5.3 Remote Launch........................................................................................................................202.5.4 Appearance...............................................................................................................................20
2.6 Getting Help ...................................................................................................................................213 Starting DDT..........................................................................................................................................22
3.1 Running a Program.........................................................................................................................223.2 Notes on the MPICH Standard and OpenMPI options..................................................................253.3 Debugging Single-Process Programs ............................................................................................253.4 Debugging OpenMP Programs.......................................................................................................263.5 Debugging Multi-Process Non-MPI programs..............................................................................263.6 Debugging OpenMPI MPMD Programs........................................................................................273.7 Opening A Core File.......................................................................................................................283.8 Attaching To Running Programs....................................................................................................28
3.8.1 Using LaunchMON for high-speed attaching.........................................................................303.8.2 Using DDT Command-Line Arguments.................................................................................30
3.9 Starting A Job In A Queue .............................................................................................................313.10 Using Custom MPI Scripts...........................................................................................................313.11 Starting DDT From A Job Script..................................................................................................333.12 Notes on X Forwarding or VNC for remote users.......................................................................34
4 DDT Overview.......................................................................................................................................364.1 Saving And Loading Sessions........................................................................................................374.2 Source Code....................................................................................................................................374.3 Finding Lost Source Files...............................................................................................................374.4 Finding Code Or Variables.............................................................................................................37
4.4.1 Find File or Function...............................................................................................................374.4.2 Find...........................................................................................................................................384.4.3 Find in Files.............................................................................................................................38
4.5 Jump To Line / Jump To Function.................................................................................................384.6 Editing Source Code.......................................................................................................................39
5 Controlling Program Execution.............................................................................................................405.1 Process Control And Process Groups.............................................................................................40
5.1.1 Detailed View..........................................................................................................................405.1.2 Summary View........................................................................................................................41
© 2009 Allinea Software 1

Distributed Debugging Tool v2.5
5.2 Focus Control..................................................................................................................................415.2.1 Overview of changing focus....................................................................................................425.2.2 Process Group Viewer.............................................................................................................425.2.3 Breakpoints..............................................................................................................................425.2.4 Code Viewer............................................................................................................................425.2.5 Parallel Stack View..................................................................................................................425.2.6 Input and Output (stdin, stdout and stderr).............................................................................425.2.7 Playing and Stepping...............................................................................................................435.2.8 Step Threads Together ............................................................................................................435.2.9 Stepping Threads Window......................................................................................................43
5.3 Hotkeys............................................................................................................................................445.4 Starting, Stopping and Restarting a Program ................................................................................445.5 Stepping Through A Program.........................................................................................................455.6 Stop Messages.................................................................................................................................455.7 Setting Breakpoints.........................................................................................................................45
5.7.1 Using the Source Code Viewer...............................................................................................455.7.2 Using the Add Breakpoint Window........................................................................................455.7.3 Pending Breakpoints................................................................................................................46
5.8 Conditional Breakpoints.................................................................................................................465.9 Suspending Breakpoints.................................................................................................................475.10 Deleting A Breakpoint..................................................................................................................475.11 Loading And Saving Breakpoints.................................................................................................475.12 Default Breakpoints......................................................................................................................47
5.12.1 Stop at exit/_exit....................................................................................................................475.12.2 Stop at abort/fatal MPI Error.................................................................................................475.12.3 Stop on throw (C++ exceptions)...........................................................................................475.12.4 Stop on catch (C++ exceptions)............................................................................................475.12.5 Stop at fork.............................................................................................................................485.12.6 Stop at exec............................................................................................................................48
5.13 Synchronizing Processes ..............................................................................................................485.14 Setting A Watch............................................................................................................................485.15 Examining The Stack Frame .......................................................................................................495.16 Align Stacks .................................................................................................................................495.17 “Where are my processes?” - Viewing Stacks in Parallel...........................................................49
5.17.1 Overview................................................................................................................................495.17.2 The Parallel Stack View in Detail ........................................................................................50
5.18 Browsing Source Code.................................................................................................................515.19 Simultaneously Viewing Multiple Files.......................................................................................525.20 Signal Handling.............................................................................................................................53
6 Variables And Data................................................................................................................................546.1 Current Line....................................................................................................................................546.2 Local Variables...............................................................................................................................546.3 Arbitrary Expressions And Global Variables.................................................................................54
6.3.1 Changing the language of an Expression................................................................................556.4 Help With Fortran Modules............................................................................................................556.5 Viewing Array Data........................................................................................................................566.6 Changing Data Values ...................................................................................................................566.7 Viewing Numbers In Different Bases............................................................................................566.8 Examining Pointers ........................................................................................................................576.9 Multi-Dimensional Arrays in the Variable View...........................................................................576.10 Examining Multi-Dimensional Arrays ........................................................................................57
6.10.1 Expression..............................................................................................................................586.10.2 Dimensions.............................................................................................................................586.10.3 Aggregate Function................................................................................................................586.10.4 Filter.......................................................................................................................................596.10.5 Results....................................................................................................................................596.10.6 Statistics.................................................................................................................................59
© 2009 Allinea Software 2
Distributed Debugging Tool v2.5
6.10.7 Export.....................................................................................................................................596.10.8 Visualisation...........................................................................................................................596.10.9 Auto Update...........................................................................................................................60
6.11 Cross-Process and Cross-Thread Comparison ............................................................................606.12 Assigning MPI Ranks ..................................................................................................................626.13 Viewing Registers ........................................................................................................................626.14 Interacting Directly With The Debugger......................................................................................63
7 Program Input And Output....................................................................................................................647.1 Viewing Standard Output And Error .............................................................................................647.2 Displaying Selected Processes........................................................................................................647.3 Saving Output..................................................................................................................................647.4 Sending Standard Input (DDT-MP) ..............................................................................................64
8 Message Queues ....................................................................................................................................668.1 Viewing The Message Queues.......................................................................................................668.2 Interpreting the Message Queues...................................................................................................678.3 Deadlock..........................................................................................................................................68
9 Memory Debugging...............................................................................................................................699.1 Configuration..................................................................................................................................699.2 Feature Overview............................................................................................................................70
9.2.1 Error reporting..........................................................................................................................709.2.2 Check Validity.........................................................................................................................719.2.3 View Pointer Details................................................................................................................719.2.4 Writing Beyond An Allocated Area........................................................................................729.2.5 Current Memory Usage ..........................................................................................................729.2.6 Memory Statistics....................................................................................................................74
10 Checkpointing......................................................................................................................................7510.1 What Is Checkpointing?................................................................................................................7510.2 Checkpoint Support In DDT.........................................................................................................7510.3 How To Checkpoint......................................................................................................................7510.4 Restoring A Run-time Checkpoint...............................................................................................7610.5 Restoring A Persistent Checkpoint...............................................................................................76
11 Advanced Data Display and C++ STL Support .................................................................................7711.1 Using The Sample Wizard Library...............................................................................................7711.2 Writing A Custom Wizard Library ..............................................................................................78
11.2.1 Theory Of Operation..............................................................................................................7811.2.2 Compiling A New Wizard Library........................................................................................7911.2.3 Using A New Wizard Library...............................................................................................8011.2.4 The VirtualProcess Interface.................................................................................................8011.2.5 The Expression Class.............................................................................................................8111.2.6 Final String-Enabled Wizard Library Example....................................................................82
12 The Licence Server..............................................................................................................................8512.1 Running The Server......................................................................................................................8512.2 Running DDT Clients...................................................................................................................8512.3 Logging.........................................................................................................................................8512.4 Troubleshooting............................................................................................................................8512.5 Adding A New Licence................................................................................................................8612.6 Examples.......................................................................................................................................8612.7 Example Of Access Via A Firewall.............................................................................................8612.8 Querying Current Licence Server Status......................................................................................8712.9 Licence Server Handling Of Lost DDT Clients...........................................................................88
13 Using and Writing Plugins for DDT....................................................................................................8913.1 Supported Plugins.........................................................................................................................8913.2 Installing a Plugin.........................................................................................................................8913.3 Using a Plugin ..............................................................................................................................8913.4 Writing a Plugin ...........................................................................................................................89
A Supported Platforms..............................................................................................................................91B MPI Distribution Notes and Known Issues..........................................................................................92
© 2009 Allinea Software 3

Distributed Debugging Tool v2.5
B.1 Bproc ..............................................................................................................................................92B.2 Bull MPI ........................................................................................................................................92B.3 HP MPI ..........................................................................................................................................92B.4 Intel MPI ........................................................................................................................................92B.5 LAM/MPI ......................................................................................................................................93B.6 MPICH p4 .....................................................................................................................................93B.7 MPICH p4 mpd .............................................................................................................................93B.8 MPICH-GM....................................................................................................................................93B.9 IBM PE ..........................................................................................................................................94B.10 MVAPICH....................................................................................................................................94B.11 NEC MPI .....................................................................................................................................94B.12 OpenMPI .....................................................................................................................................94B.13 Quadrics MPI ..............................................................................................................................94B.14 SCore ...........................................................................................................................................95B.1 Scyld ..............................................................................................................................................96B.2 SGI Altix ........................................................................................................................................96B.3 Sun Clustertools.............................................................................................................................96B.4 Cray XT4 .......................................................................................................................................96
C Compiler Notes and Known Issues.......................................................................................................97C.1 Absoft.............................................................................................................................................97C.2 GNU................................................................................................................................................97C.3 IBM XLC/XLF...............................................................................................................................97C.4 Intel Compilers ..............................................................................................................................98C.5 Pathscale EKO compilers...............................................................................................................98C.6 Portland Group Compilers ............................................................................................................99C.7 Sun Forte Compilers and Solaris DBX .......................................................................................100
D Platform Notes and Known Issues......................................................................................................102D.1 GNU/Linux Systems....................................................................................................................102D.2 IBM AIX Systems .......................................................................................................................102D.3 AMD Opteron and Intel EM64T.................................................................................................102D.4 Intel Itanium.................................................................................................................................103D.5 Intel Xeon/Pentium 32 bit............................................................................................................103D.6 Sun SPARC..................................................................................................................................103D.7 Blue Gene.....................................................................................................................................103D.8 Cell Broadband Engine................................................................................................................104D.8.1 Automatic detection of embedded SPE programs...................................................................104D.8.2 Identify and filter threads by architecture................................................................................104D.8.3 View SPU specific information................................................................................................104D.9 NEC SX8......................................................................................................................................104
E General Troubleshooting and Known Issues......................................................................................105E.1 General Troubleshooting..............................................................................................................105
E.1.1 Problems Starting the DDT GUI...........................................................................................105E.1.1 Problems Starting Scalar Programs......................................................................................105E.1.1 Problems Starting Multi-Process Programs..........................................................................105
E.2 Starting a Program........................................................................................................................106E.2.1 DDT says it can't find your hosts or the executable.............................................................106E.2.2 The progress bar doesn't move and DDT 'times out'............................................................106E.2.3 The progress bar gets close to half the processes connecting and then stops and DDT 'times out'...................................................................................................................................................107E.2.4 Program doesn't start, and you can see a console error stating "QServerSocket: failed to bind or listen to the socket"............................................................................................................107E.2.5 DDT complains about being unable to execute malloc........................................................107E.2.6 ‘The mpi execution environment exited with an error, details follow: Error code: 1 Error Messages: “mprun:mpmd_assemble_rsrcs: Not enough resources available”’ error when trying to start DDT.........................................................................................................................................107
E.3 Attaching.......................................................................................................................................107E.3.1 Running processes don't show up in the attach window......................................................107
© 2009 Allinea Software 4

Distributed Debugging Tool v2.5
E.4 Source Viewer..............................................................................................................................108E.4.1 No variables or line number information..............................................................................108E.4.2 Source code does not appear when you start DDT...............................................................108
E.5 Input/Output..................................................................................................................................108E.5.1 Output to stderr is not displayed...........................................................................................108
E.6 Controlling a Program..................................................................................................................108E.6.1 Program hangs when you use Step Out................................................................................108E.6.2 Program jumps forwards and backwards when stepping through it....................................108E.6.3 DDT sometimes stop responding when using the Step Threads Together option...............108
E.7 Evaluating Variables....................................................................................................................109E.7.1 Some variables cannot be viewed when the program is at the start of a function...............109E.7.2 Incorrect values printed for Fortran array.............................................................................109E.7.3 Evaluating an array of derived types, containing multiple-dimension arrays.....................109E.7.4 Evaluating C++ STL types with the wizard does not work.................................................109
E.8 Memory Debugging......................................................................................................................109E.8.1 The View Pointer Details window says a pointer is valid but doesn't show you which line of code it was allocated on..................................................................................................................109E.8.2 “Dmalloc library has gone recursive” error..........................................................................109E.8.3 “mprotect fails” error when using memory debugging with guard pages...........................110E.8.4 Allocations made before or during MPI_Init show up in Current Memory Usage but have no associated stack back trace........................................................................................................110E.8.5 Deadlock when calling printf or malloc from a signal handler............................................110
E.9 Message Queues...........................................................................................................................110E.9.1 When viewing messages queues after attaching to a process you get a “Cannot find Message Queue DLL” error............................................................................................................110E.9.1 When trying to view my Message Queues using mpich you get no output but also see no errors................................................................................................................................................110
E.10 Miscellaneous.............................................................................................................................111E.10.1 Some features seem to be missing (e.g. The Fortran Module Browser)............................111E.10.2 Application working directory............................................................................................111E.10.3 “One of the debuggers DDT is communicating with has terminated unexpectedly” error.........................................................................................................................................................111
E.11 Obtaining Support......................................................................................................................111F Index.....................................................................................................................................................112
© 2009 Allinea Software 5
Distributed Debugging Tool v2.5
1 IntroductionThe Distributed Debugging Tool (DDT) is an intuitive, scalable, graphical debugger. This document introduces DDT and explains how to use it to its full potential. If you just wish to get started with DDT, you will find that the examples directory of your DDT installation contains a few short example programs. The Allinea website also hosts a number of videos of debugging sessions covering
• Getting started – installing DDT
• Debugging with OpenMP, MPI and Scalar codes
• Examining data
• Using the 3D array viewer
• Running with DDT's integrated memory debugging tool
DDT can be used as a single-process or a multi-process program (MPI) debugger. The availability of these capabilities will depend on the licence that you have - although multi-process licences are always capable of supporting single-process debugging.
Both modes of DDT are capable of debugging multiple threads, including OpenMP codes. DDT provides all the standard debugging features (stack trace, breakpoints, watches, view variables, threads etc.) for every thread running as part of your program, or for every process - even if these processes are distributed across a cluster using an MPI implementation.
DDT can do many tasks beyond the normal capabilities of a debugger – for example the memory debugging feature detects some errors before they have caused a program crash by verifying usage of the system allocator, and the message queue integration with MPI can show the current state of communication between processes in the system.
Multi-process DDT encourages the construction of user-defined groups to manage and apply debugging actions to multiple processes. Once you are comfortable working with groups of processes, everything else becomes simple and intuitive. If you have used a visual debugger before you will find DDT's interface familiar. Using DDT to debug MPI code makes debugging parallel code as easy as debugging serial code.
C, C++, Fortran and Fortran 90/95/2003 are all supported by DDT, along with a large number of platforms, compilers and all known MPI libraries.
© 2009 Allinea Software 6
Distributed Debugging Tool v2.5
2 Installation and ConfigurationThis section describes the first steps necessary before you can begin to debug with DDT.
We begin by describing how to install the software, and then how to configure it.
The steps are simple and short – an ordinary – or root – user can do this.
Configuration can be done by any user for their personal settings, or by a root user who wishes to set the configuration for an entire site (see section 2.2.1 Site Wide Configuration ). DDT's configuration wizard should explain things clearly enough to render reading all of this section unnecessary, if you just wish to get started quickly and if your system is relatively straightforward.
2.1 Installation
DDT may be downloaded from the Allinea website www.allinea.com. Follow the instructions below to install DDT.
2.1.1 Graphical Install
Untar the package and run the installer executable using the commands below.
gunzip < ddt2.5-ARCH.tar | tar xvf -./installer
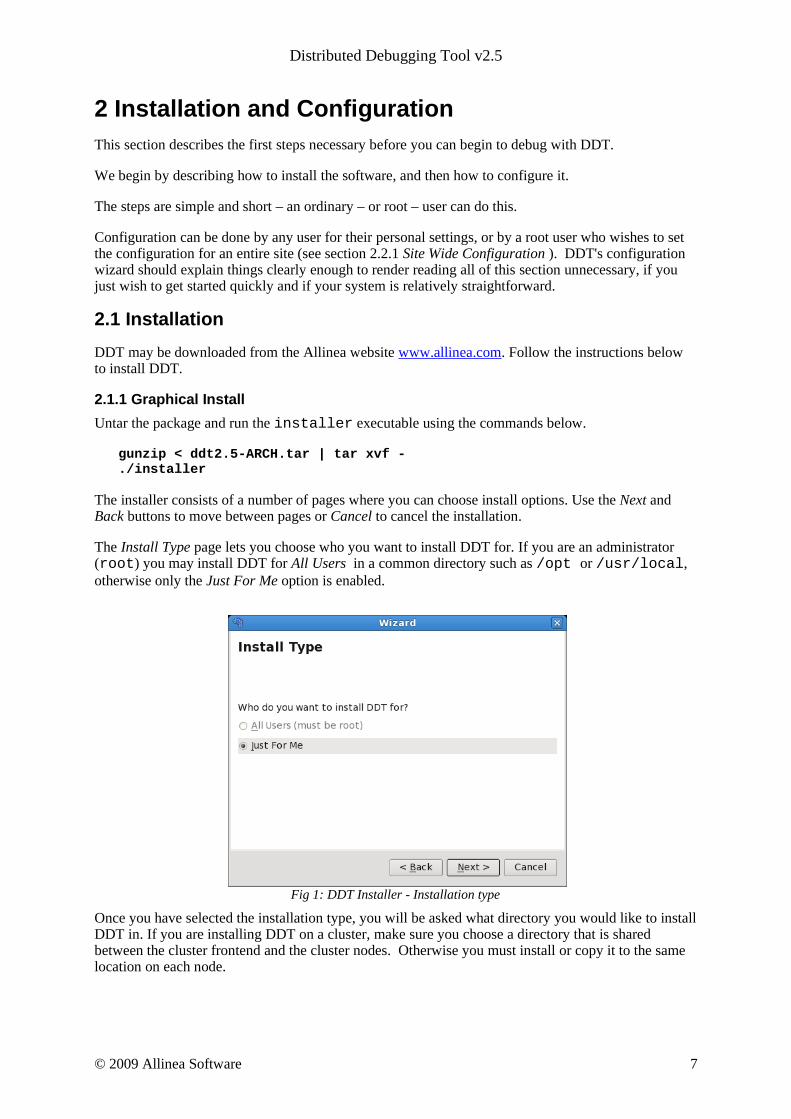
The installer consists of a number of pages where you can choose install options. Use the Next and Back buttons to move between pages or Cancel to cancel the installation.
The Install Type page lets you choose who you want to install DDT for. If you are an administrator (root) you may install DDT for All Users in a common directory such as /opt or /usr/local, otherwise only the Just For Me option is enabled.
Fig 1: DDT Installer - Installation type
Once you have selected the installation type, you will be asked what directory you would like to install DDT in. If you are installing DDT on a cluster, make sure you choose a directory that is shared between the cluster frontend and the cluster nodes. Otherwise you must install or copy it to the same location on each node.
© 2009 Allinea Software 7

Distributed Debugging Tool v2.5
Fig 2: DDT Installer - Installation directory
You will be shown the proregress of the installation on the Install page.
Fig 3: DDT Install in progress
An icon for DDT will be added to your desktop environment's Development menu or CDE's Application Manager .
It is important to follow the instructions in the README file that is contained in the tar file. In particular, you will need a valid licence file – evaluation licences are available from http://www.allinea.com .
Due to the vast number of different site configurations and MPI distributions that are supported by DDT, it is inevitable that sometimes you may need to take further steps to get DDT working. For example, it may be necessary to ensure that environment variables are propagated to remote nodes, and that DDT's libraries and executables are available on the remote nodes.
2.1.2 Text-mode Install
The text-mode install script textinstall.sh is useful if you are installing DDT remotely.
gunzip < ddt2.5-ARCH.tar | tar xvf -./textinstall.sh
© 2009 Allinea Software 8

Distributed Debugging Tool v2.5
Press Enter to read the licence when prompted and then enter the directory where you would like to install DDT. The directory must be accessible on all the nodes in your cluster.
2.1.3 Licence FilesLicence files should be stored as {installation-directory}/Licence, (e.g. /home/bob/ddt/Licence).
If this is inconvenient, the user can specify the location of a licence file using an environment variable, DDT_LICENCE_FILE. For example:
export DDT_LICENCE_FILE=$HOME/SomeOtherLicence
The user also has the choice of using DDT_LICENSE_FILE as the environment variable (American spelling).
The order of precedence when searching for licence files is:
$DDT_LICENCE_FILE $DDT_LICENSE_FILE {installation-directory}/Licence
If you do not have a licence file, the DDT GUI will not start. A warning message will be presented. For remote MPI processes, you will also require the licence to be installed on the nodes. If this licence is not present, the remote nodes will be unable to connect to the GUI.
Time-limited evaluation licences are available from the Allinea website, www.allinea.com.
2.1.4 Floating LicencesFor users with floating licences, the licensing daemon must be started prior to running DDT. It is recommended that this is done as a non-root user – such as nobody or a special unprivileged user created for this purpose.
{installation-directory}/bin/licenceserver &
This will start the daemon, it will serve all floating licences in the current working directory that match Licence* or License*.
The host name, port and MAC (network) address of the licence server will be agreed with you before issuing the licence, and you should ensure that the agreed host and port will be accessible by users.
DDT clients will use a separate client licence file which identifies the host, port, and licence number.
Log files can be generated for accounting purposes.
For more information on the Licence Server please see section 12 of this document.
© 2009 Allinea Software 9
Distributed Debugging Tool v2.5
2.2 Configuration
DDT has a Configuration Wizard to help simplify setting up DDT and choosing the correct options to start your programs. The first time you run DDT after installing it you will see the wizard.
Fig 4. Configuration Wizard
The Configuration Wizard helps you set DDT up to debug programs on your system, whether it is an individual workstation or a four thousand node super-cluster! Most settings will be automatically detected for you, so unless your system administrator has provided a configuration file for you to use, click on Next and follow the simple instructions.
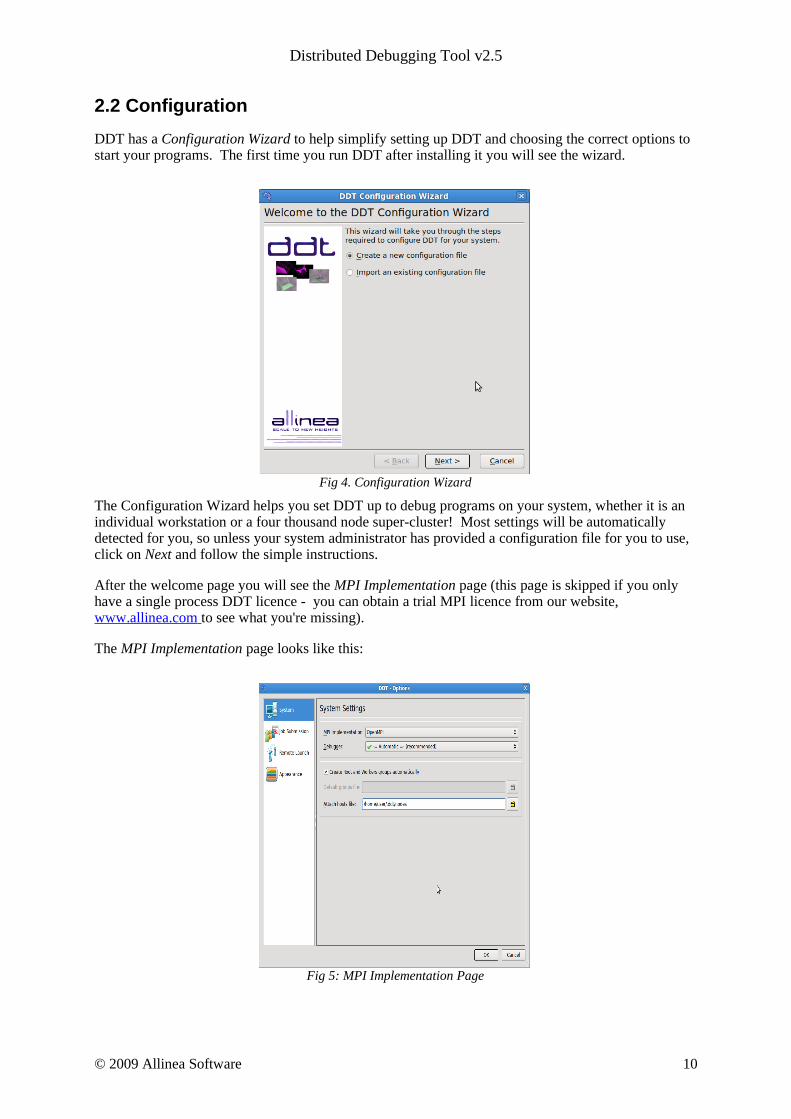
After the welcome page you will see the MPI Implementation page (this page is skipped if you only have a single process DDT licence - you can obtain a trial MPI licence from our website, www.allinea.com to see what you're missing).
The MPI Implementation page looks like this:
Fig 5: MPI Implementation Page
© 2009 Allinea Software 10
Distributed Debugging Tool v2.5
DDT will attempt to auto-detect and highlight your MPI implementation in the list, if this is not successful, please select your MPI implementation manually.
Once you have chosen or accepted an MPI Implementation, click on Next. DDT will now try to find a way to reach remote machines without needing you to type in a password.
Important: If DDT is running in the background (e.g. ddt &) then this process may get stuck (some SSH versions cause this behaviour when asking for a password). If this happens to you, go to the terminal and use the fg or similar command to make DDT a foreground process, or run DDT again, without using &.
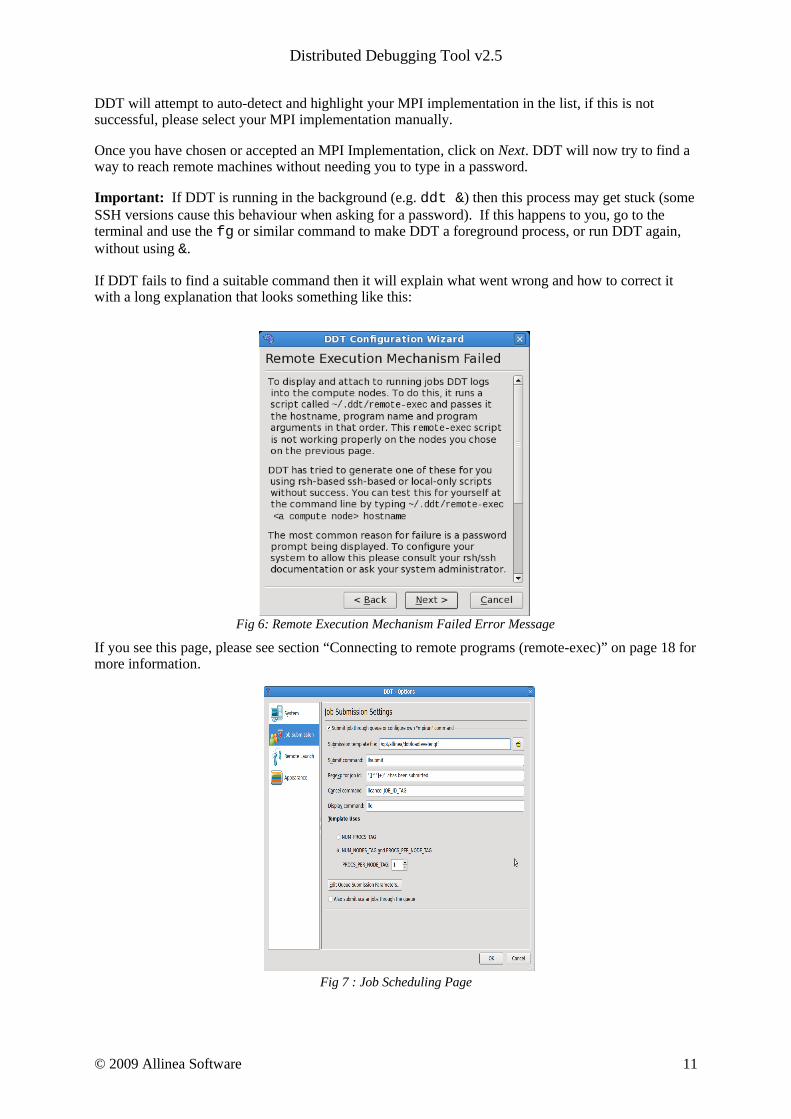
If DDT fails to find a suitable command then it will explain what went wrong and how to correct it with a long explanation that looks something like this:
Fig 6: Remote Execution Mechanism Failed Error Message
If you see this page, please see section “Connecting to remote programs (remote-exec)” on page 18 for more information.
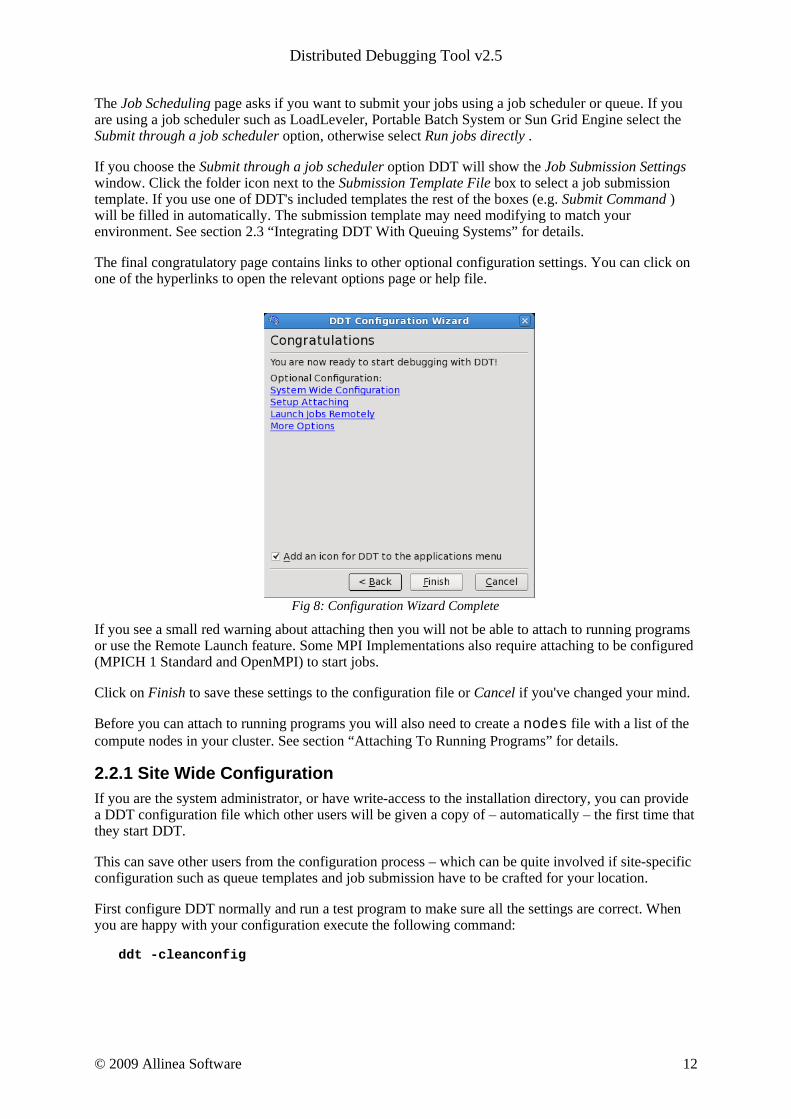
Fig 7 : Job Scheduling Page
© 2009 Allinea Software 11
Distributed Debugging Tool v2.5
The Job Scheduling page asks if you want to submit your jobs using a job scheduler or queue. If you are using a job scheduler such as LoadLeveler, Portable Batch System or Sun Grid Engine select the Submit through a job scheduler option, otherwise select Run jobs directly .
If you choose the Submit through a job scheduler option DDT will show the Job Submission Settings window. Click the folder icon next to the Submission Template File box to select a job submission template. If you use one of DDT's included templates the rest of the boxes (e.g. Submit Command ) will be filled in automatically. The submission template may need modifying to match your environment. See section 2.3 “Integrating DDT With Queuing Systems” for details.
The final congratulatory page contains links to other optional configuration settings. You can click on one of the hyperlinks to open the relevant options page or help file.
Fig 8: Configuration Wizard Complete
If you see a small red warning about attaching then you will not be able to attach to running programs or use the Remote Launch feature. Some MPI Implementations also require attaching to be configured (MPICH 1 Standard and OpenMPI) to start jobs.
Click on Finish to save these settings to the configuration file or Cancel if you've changed your mind.
Before you can attach to running programs you will also need to create a nodes file with a list of the compute nodes in your cluster. See section “Attaching To Running Programs” for details.
2.2.1 Site Wide Configuration If you are the system administrator, or have write-access to the installation directory, you can provide a DDT configuration file which other users will be given a copy of – automatically – the first time that they start DDT.
This can save other users from the configuration process – which can be quite involved if site-specific configuration such as queue templates and job submission have to be crafted for your location.
First configure DDT normally and run a test program to make sure all the settings are correct. When you are happy with your configuration execute the following command:
ddt -cleanconfig
© 2009 Allinea Software 12

Distributed Debugging Tool v2.5
This will remove any user-specific settings (such as the last program you ran) from your configuration file. Then copy the file to your DDT installation directory. This file will then be used as a template for all DDT users.
If you want to use DDT to attach to running jobs you will also need to create a file called nodes in the DDT installation directory with a list of compute nodes you want to attach to. See section “Attaching To Running Programs” for details.
2.3 Integrating DDT With Queuing Systems
DDT can be configured to work with most job submission systems. In the DDT Options window, you should choose Submit job through queue . This displays extra options and switches DDT into queue submission mode.
The basic stages in configuring DDT to work with a queue are:
1. Making a template script, and2. Setting the commands that DDT will use to submit, cancel, and list queue jobs.
Your system administrator may wish to provide a DDT config file containing the correct settings, removing the need for individual users to configure their own settings and scripts.
In this mode, DDT uses a template script to interact with your queue system. The templates subdirectory contains some example scripts that can be modified to meet your needs. {installation-directory}/templates/sample.qtf, demonstrates the process of creating a template file in some detail.
2.3.1 The Template ScriptThe template script is based on the file you would normally use to submit your job - typically a shell script that specifies the resources needed such as number of processes, output files, and executes mpirun, vmirun, poe or similar with your application. The most important difference is that job-specific variables, such as number of processes, number of nodes and program arguments, are replaced by capitalized keyword tags, such as NUM_PROCS_TAG. When DDT prepares your job, it replaces each of these keywords with its value and then submits the new file to your queue.
Each of the tags that will be replaced is listed in the following table – and an example of the text that will be generated when DDT submits your job is given for each.
© 2009 Allinea Software 13

Distributed Debugging Tool v2.5
Tag Purpose After Submission Example
MPIRUN_TAG mpirun binary (can vary with MPI implementation)
/usr/bin/mpirun
AUTO_MPI_ARGUMENTS_TAG Required command line flags for mpirun (can vary with MPI implementation)
-np 4
PROGRAM_TAG Target path and filename /users/ned/a.out
PROGRAM_ARGUMENTS_TAG Arguments to target program -myarg myval
NUM_PROCS_TAG Total number of processes 16
NUM_PROCS_PLUS_ONE_TAG Total number of processes + 1 17
NUM_NODES_TAG Number of compute nodes 8
NUM_NODES_PLUS_ONE_TAG Number of compute nodes + 1 9
PROCS_PER_NODE_TAG Processes per node 2
PROCS_PER_NODE_PLUS_ONE_TAG
Processes per node + 1 3
NUM_THREADS_TAG Number of OpenMP threads per node
4
EXTRA_MPI_ARGUMENTS_TAG Extra mpirun arguments specified in the Run window
-partition DEBUG
WORKING_DIRECTORY_TAG The working directory DDT was launched in
/users/ned
INPUT_FILE_TAG The Input File specified in the Run window
/users/ned/input.dat
DDTPATH_TAG The path to the DDT installation /opt/allinea/ddt
Additionally, any environment variables in the GUI environment ending in “_TAG” are replaced throughout the script by the value of those variables.
2.3.2 OpenMPI, Altix, Blue Gene/P and Cray MPTOrdinarily, your queue script will probably end in a line that starts mpirun with your target executable. You should prefix this line with DDTPATH_TAG/bin/ddt-client. For example, if your script currently has the line:
mpirun -np 16 program_name myarg1 myarg2
You would write:
DDTPATH_TAG/bin/ddt-client MPIRUN_TAG -np 16 program_name myarg1 myarg2
For a template script you use tags in place of the program name, arguments etc. so they can be specified in the DDT GUI rather than editing the queue script each time:
DDTPATH_TAG/bin/ddt-client DDT_DEBUGGER_ARGUMENTS_TAG MPIRUN_TAG -np NUM_PROCS_TAG EXTRA_MPI_ARGUMENTS_TAG PROGRAM_TAG PROGRAM_ARGUMENTS_TAG
2.3.3 MPICH based MPIOrdinarily, your queue script will probably end in a line that starts mpirun with your target executable.
mpirun -np 16 program_name myarg1 myarg2
© 2009 Allinea Software 14

Distributed Debugging Tool v2.5
To make this work with DDT you need to export the TOTALVIEW environment variable, and add the “-tv” parameter to mpirun. e.g.
export TOTALVIEW=DDTPATH_TAG/bin/ddt-debugger-mps
MPIRUN_TAG -np NUM_PROCS_TAG -tv PROGRAM_TAG PROGRAM_ARGUMENTS_TAG
2.3.4 Other MPIsOrdinarily, your queue script will probably end in a line that starts mpirun with your target executable. Your program name should be replaced in this line by DDTPATH_TAG/bin/ddt-debugger. For example, if your script currently has the line:
mpirun -np 16 program_name myarg1 myarg2
You would write:
mpirun -np 16 DDTPATH_TAG/bin/ddt-debugger myarg1 myarg2
For a template script you use tags in place of the program name, arguments etc. so they can be specified in the DDT GUI rather than editing the queue script each time:
MPIRUN_TAG -np NUM_PROCS_TAG EXTRA_MPI_ARGUMENTS_TAG DDTPATH_TAG/bin/ddt-debugger DDT_DEBUGGER_ARGUMENTS_TAG PROGRAM_ARGUMENTS_TAG
Note: don't include PROGRAM_TAG – ddt-debugger will launch your program for you.
2.3.5 Scalar ProgramsTo make your template script work for scalar programs you can add something similar to the following:
if [ $NUM_PROCS_TAG = 1 ]; then DDTPATH_TAG/bin/ddt-client DDT_DEBUGGER_ARGUMENTS_TAG PROGRAM_TAG PROGRAM_ARGUMENTS_TAGCelse mpirun -np NUM_PROCS_TAG DDTPATH_TAG/bin/ddt-debugger DDT_DEBUGGER_ARGUMENTS_TAG PROGRAM_ARGUMENTS_TAGfi
2.3.6 Defining New TagsAs well as the pre-defined tags listed in the table above you can also define new tags in your template script whose values can be specified in the DDT GUI.
Tag definitions have the following format:
EXAMPLE_TAG: { key1=value1, key2=value2, ... }
Where key1, key2, ... are attribute names and value1, value2, ... are the corresponding values.
The tag will be replaced wherever it occurs with the value specified in the DDT GUI, for example:
#PBS –option EXAMPLE_TAG
The following attributes are supported:
© 2009 Allinea Software 15
Distributed Debugging Tool v2.5
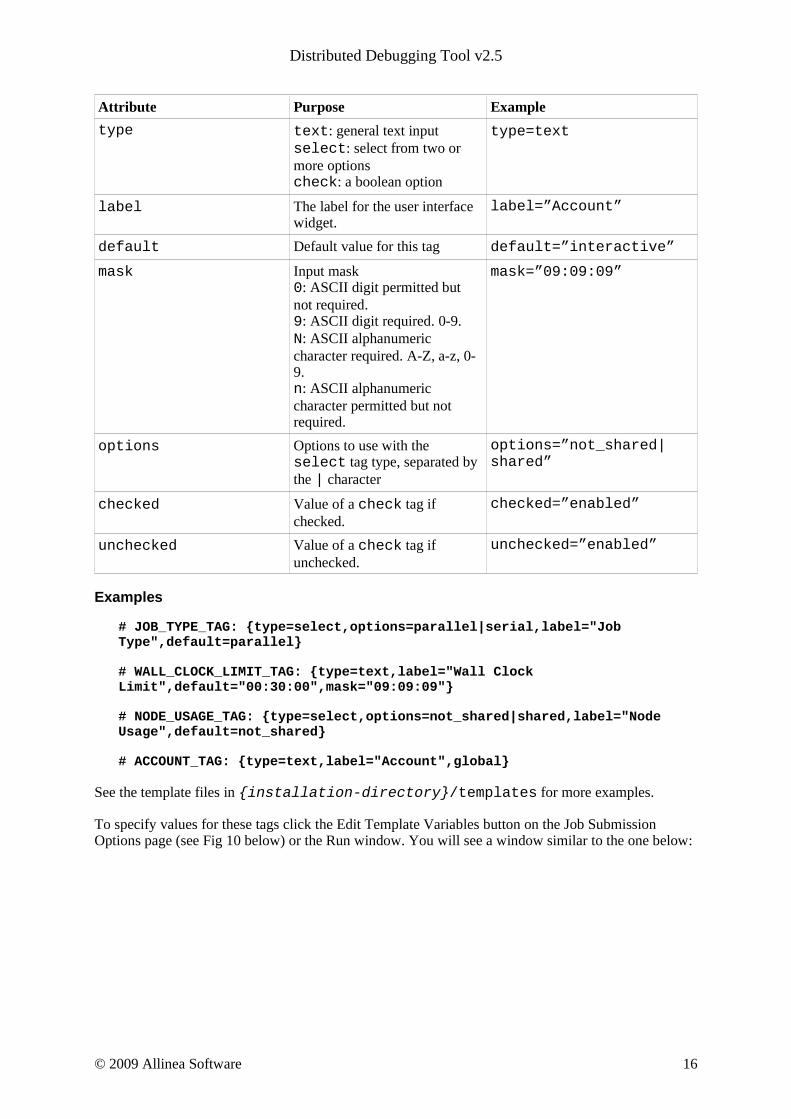
Attribute Purpose Example
type text: general text inputselect: select from two or more optionscheck: a boolean option
type=text
label The label for the user interface widget.
label=”Account”
default Default value for this tag default=”interactive”
mask Input mask0: ASCII digit permitted but not required. 9: ASCII digit required. 0-9.N: ASCII alphanumeric character required. A-Z, a-z, 0-9.n: ASCII alphanumeric character permitted but not required.
mask=”09:09:09”
options Options to use with the select tag type, separated by the | character
options=”not_shared|shared”
checked Value of a check tag if checked.
checked=”enabled”
unchecked Value of a check tag if unchecked.
unchecked=”enabled”
Examples
# JOB_TYPE_TAG: {type=select,options=parallel|serial,label="Job Type",default=parallel}
# WALL_CLOCK_LIMIT_TAG: {type=text,label="Wall Clock Limit",default="00:30:00",mask="09:09:09"}
# NODE_USAGE_TAG: {type=select,options=not_shared|shared,label="Node Usage",default=not_shared}
# ACCOUNT_TAG: {type=text,label="Account",global}
See the template files in {installation-directory}/templates for more examples.
To specify values for these tags click the Edit Template Variables button on the Job Submission Options page (see Fig 10 below) or the Run window. You will see a window similar to the one below:
© 2009 Allinea Software 16

Distributed Debugging Tool v2.5
Fig 9: Queue Submission Parameters Window
The values you specify are substituted for the corresponding tags in the template file when you run a job.
2.3.7 Configuring Queue CommandsOnce you have selected a queue template file, enter submit, display and cancel commands.
When you start the debug session DDT will generate a submission file and append its filename to the submit command you give.
For example, if you normally submit a job by typing job_submit -u myusername -f myfile then in DDT you should enter job_submit -u myusername -f as the submit command.
© 2009 Allinea Software 17
Distributed Debugging Tool v2.5
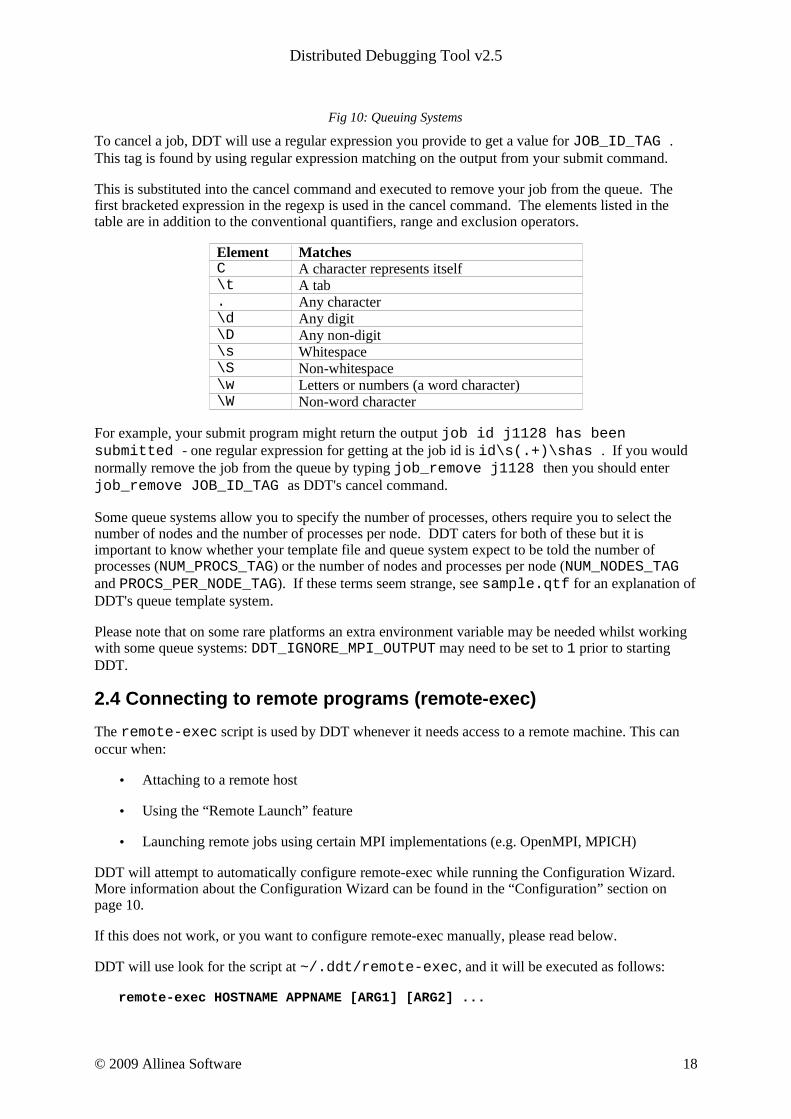
Fig 10: Queuing Systems
To cancel a job, DDT will use a regular expression you provide to get a value for JOB_ID_TAG . This tag is found by using regular expression matching on the output from your submit command.
This is substituted into the cancel command and executed to remove your job from the queue. The first bracketed expression in the regexp is used in the cancel command. The elements listed in the table are in addition to the conventional quantifiers, range and exclusion operators.
Element MatchesC A character represents itself\t A tab. Any character\d Any digit\D Any non-digit\s Whitespace\S Non-whitespace\w Letters or numbers (a word character)\W Non-word character
For example, your submit program might return the output job id j1128 has been submitted - one regular expression for getting at the job id is id\s(.+)\shas . If you would normally remove the job from the queue by typing job_remove j1128 then you should enter job_remove JOB_ID_TAG as DDT's cancel command.
Some queue systems allow you to specify the number of processes, others require you to select the number of nodes and the number of processes per node. DDT caters for both of these but it is important to know whether your template file and queue system expect to be told the number of processes (NUM_PROCS_TAG) or the number of nodes and processes per node (NUM_NODES_TAG and PROCS_PER_NODE_TAG). If these terms seem strange, see sample.qtf for an explanation of DDT's queue template system.
Please note that on some rare platforms an extra environment variable may be needed whilst working with some queue systems: DDT_IGNORE_MPI_OUTPUT may need to be set to 1 prior to starting DDT.
2.4 Connecting to remote programs (remote-exec)
The remote-exec script is used by DDT whenever it needs access to a remote machine. This can occur when:
• Attaching to a remote host
• Using the “Remote Launch” feature
• Launching remote jobs using certain MPI implementations (e.g. OpenMPI, MPICH)
DDT will attempt to automatically configure remote-exec while running the Configuration Wizard. More information about the Configuration Wizard can be found in the “Configuration” section on page 10.
If this does not work, or you want to configure remote-exec manually, please read below.
DDT will use look for the script at ~/.ddt/remote-exec, and it will be executed as follows:
remote-exec HOSTNAME APPNAME [ARG1] [ARG2] ...
© 2009 Allinea Software 18

Distributed Debugging Tool v2.5
The script should start APPNAME on HOSTNAME with the arguments ARG1 ARG2 without further input (no password prompts). Standard output from APPNAME should appear on the standard output of remote-exec. Two example are shown below.
SSH based remote-exec
A remote-exec script using ssh could look as follows:
#!/bin/shssh $*
In order for this to work without prompting for a password, you should generate a public and private SSH key, and ensure that the public key has been added to the ~/.ssh/authorized_keys file on machines you wish to use. See the ssh-keygen manpage for more information.
RSH based remote-exec
A remote-exec script using rsh could look as follows:
#!/bin/shrsh $*
In order for this to work without prompting for a password, you must have set up a .rhosts file in your home directory as explained in the rsh manpage.
Testing
Once you have set up your remote-exec script, it is recommended that you test it from the command line. e.g.
~/.ddt/remote-exec TESTHOST uname -n
Should return the output of uname -n on TESTHOST, without prompting for a password.
If you are having trouble setting up remote-exec, please contact [email protected] for assistance.
2.5 Optional Configuration
In addition to the configuration wizard, DDT also provides an options dialog, which allows you to quickly edit the settings in the configuration wizard, as well as other non-essential preferences. These options are outlined briefly below.
2.5.1 SystemMPI Implementation: Allows you to tell DDT which MPI implementation you are using.
Note: If you are not using DDT to debug MPI programs select none.
Select Debugger: Tells DDT which underlying debugger DDT should use. This should almost always be left as “Automatic”.
Create Root and Workers groups automatically: If this option is checked DDT will automatically create a Root group for rank 0 and a Workers group for ranks 1...N when you start a new MPI session.
Default groups file: Entering a file here allows you to customise the groups displayed by DDT when starting an MPI job. If you do not specify a file DDT will create the default “Root” and “Workers” groups if the previous option is checked.
© 2009 Allinea Software 19
Distributed Debugging Tool v2.5
Note: A groups file can be created by right clicking the process groups panel and selecting “Save groups...” while running your program.
Attach hosts file: When attaching, DDT will fetch a list of processes for each of the hosts listed in this file. This option can also be configured using the configuration wizard.
2.5.2 Job SubmissionThis section allows you to configure DDT to use a custom “mpirun” command, or submit your jobs to a queuing system. For more information on this, see section 2.3 of this user guide.
2.5.3 Remote LaunchThis section allows you to configure DDT to launch scalar programs, or your mpirun command on a remote system. If this option is enabled, DDT will launch your scalar jobs on the specified remote system, rather than the local machine.
Configuring remote launch is not necessary if your “mpirun” command is run on the local machine (even if it launches remote processes itself).
Hostname: Hostname or IP address of the remote system to launch on.
Path to ddt-debugger: The full path to the ddt-debugger binary on the remote system. This
Once you have entered your Remote Launch settings, you can click the “Test Remote Launch” button to test your configuration.
Note: This feature requires that attaching is properly configured in DDT, and that your home directory is accessible by both the remote and local machines.
2.5.4 AppearanceThis section allows you to configure the graphical style of DDT, as well fonts and tab settings for the code viewer.
Look & Feel
This determines the general graphical style of DDT. This includes the appearance of buttons, context menus.
Code Viewer Settings
This allows you to configure the appearance of the DDT code viewer (used to display your source code while debugging)
Tab size: Sets the width of a tab character in the source code display. (A width of 4 means that a tab character will have the same width as 4 space characters.)
Font name: The name of the font used to display your source code. It is recommended that you use a fixed width font.
Font size: The size of the font used to display your source code.
Editor: This is the program DDT will execute if you right click the code viewer and choose “Open file in editor”. This command should launch a graphical editor. If no editor is specified, DDT will attempt to launch a default editor (as configured in your desktop environment).
Override System Font Settings
© 2009 Allinea Software 20
Distributed Debugging Tool v2.5
This setting can be used to change the font and size of all components in DDT (except the code viewer).
2.6 Getting Help
In the event of difficulties - in either installing or using DDT - please consult the appendices to this document or the support and software updates section of our website. This user guide is also available from within DDT by pressing F1.
Support is also available from the support team – they may be contacted at [email protected] – and will be eager to help.
© 2009 Allinea Software 21
Distributed Debugging Tool v2.5
3 Starting DDTAs always, when compiling the program that you wish to debug, you must add the debug flag to your compile command. For the most compilers this is -g. It is also advisable to turn off compiler optimisations as these can make debugging appear strange and unpredictable. If your program is already compiled without debug information you will need to remake the files that you are interested in again.
To start DDT simply type one of the following into a shell window:
ddtddt program_nameddt program_name arguments
Note: You should not attempt to pipe input directly to DDT – for information about how to achieve the effect of sending input to your program, please read the section about program input in this userguide.
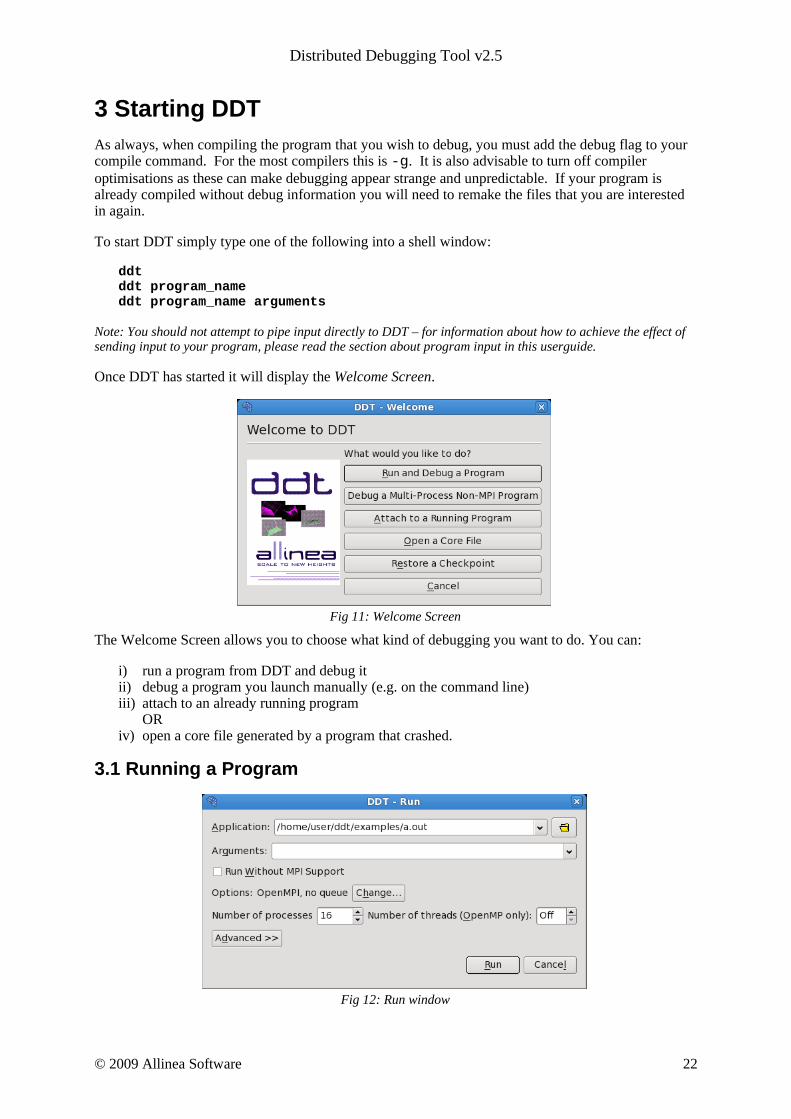
Once DDT has started it will display the Welcome Screen.
Fig 11: Welcome Screen
The Welcome Screen allows you to choose what kind of debugging you want to do. You can:
i) run a program from DDT and debug itii) debug a program you launch manually (e.g. on the command line)iii) attach to an already running program
ORiv) open a core file generated by a program that crashed.
3.1 Running a Program
Fig 12: Run window
© 2009 Allinea Software 22
Distributed Debugging Tool v2.5
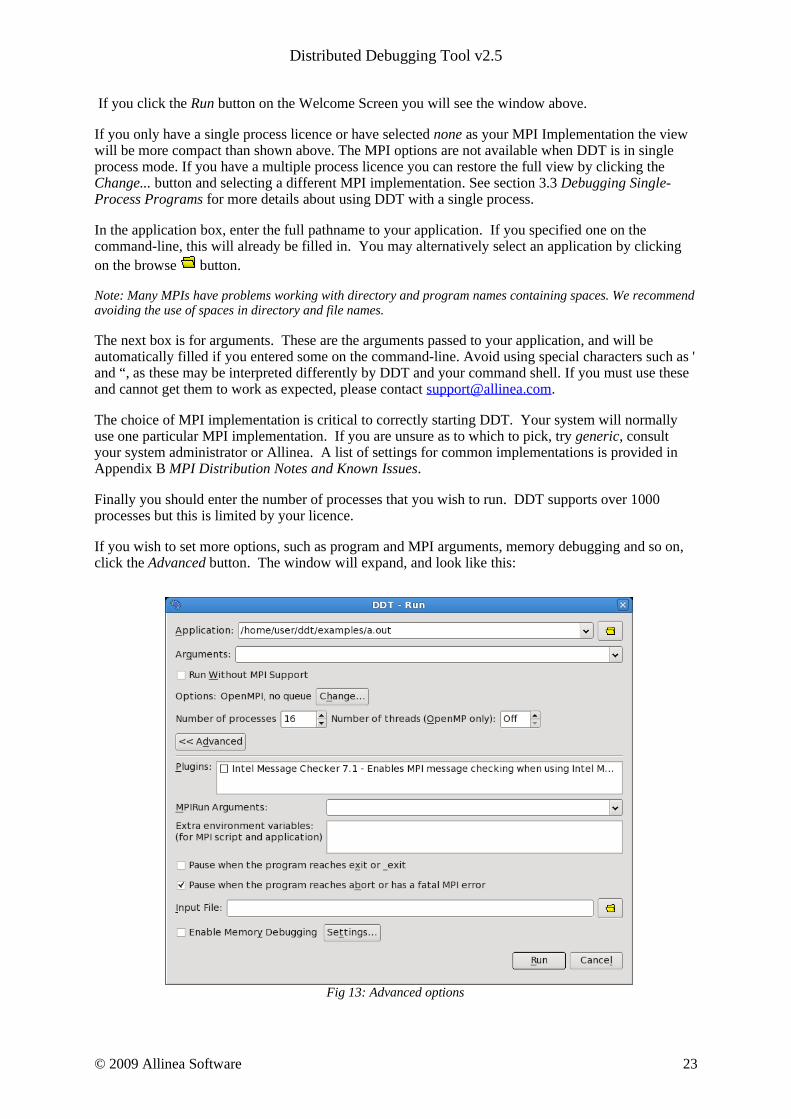
If you click the Run button on the Welcome Screen you will see the window above.
If you only have a single process licence or have selected none as your MPI Implementation the view will be more compact than shown above. The MPI options are not available when DDT is in single process mode. If you have a multiple process licence you can restore the full view by clicking the Change... button and selecting a different MPI implementation. See section 3.3 Debugging Single-Process Programs for more details about using DDT with a single process.
In the application box, enter the full pathname to your application. If you specified one on the command-line, this will already be filled in. You may alternatively select an application by clicking on the browse button.
Note: Many MPIs have problems working with directory and program names containing spaces. We recommend avoiding the use of spaces in directory and file names.
The next box is for arguments. These are the arguments passed to your application, and will be automatically filled if you entered some on the command-line. Avoid using special characters such as ' and “, as these may be interpreted differently by DDT and your command shell. If you must use these and cannot get them to work as expected, please contact [email protected].
The choice of MPI implementation is critical to correctly starting DDT. Your system will normally use one particular MPI implementation. If you are unsure as to which to pick, try generic, consult your system administrator or Allinea. A list of settings for common implementations is provided in Appendix B MPI Distribution Notes and Known Issues.
Finally you should enter the number of processes that you wish to run. DDT supports over 1000 processes but this is limited by your licence.
If you wish to set more options, such as program and MPI arguments, memory debugging and so on, click the Advanced button. The window will expand, and look like this:
Fig 13: Advanced options
© 2009 Allinea Software 23

Distributed Debugging Tool v2.5
The MPIRun arguments box is for arguments that are passed to mpirun or your equivalent (such as scrun on SCore , mprun on Solaris ) – usually prior to your executable name in normal mpirun usage. You can place machine file arguments – if necessary – here. For most users this box can be left empty.
Please note that you should not enter the -np argument as DDT will do this for you.
The plugins box allows you to enable plugins for various third-party libraries, such as the Intel Message Checker or Marmot. See the “Using and Writing Plugins for DDT” section later in this document for more information.
The MPIRun environment should contain environment variables that should be passed to mpirun or its equivalent: some implementations allow you to set extra variables such as MPI_MAX_CLUSTER_SIZE=1 on MPICH. These environment variables may also be passed to your program, depending on which MPI implementation your system uses. Most users will not need to use this box.
If your desired MPI command is not in your PATH, or you wish to use an MPI run command that is not your default one, you can set the environment variable DDTMPIRUN before you start DDT, to run your desired command.
The next two checkboxes allow you to choose whether or not DDT will automatically pause your program when it looks like it is about to finish. If your program reaches one of the functions shown, DDT will give you the option to pause the processes so you can see how they got there. The default setting is to do nothing on a normal exit but stop if there is an MPI error or if abort is called. This allows you to inspect the program state after an error (but before MPI has terminated your job).
The memory debugging options are described in detail in the Memory Debugging section of this document.
Select run to start your program – or submit if working through a queue (see section 2.3 Integrating DDT With Queuing Systems). This will run your program through the debug interface you selected and will allow your MPI implementation to determine which nodes to start which processes on.
Note: If you have a program compiled with Intel ifort or GNU g77 you may not see your code and highlight line when DDT starts. This is because those compilers create a pseudo MAIN function, above the top level of your code. To fix this you can either open your Source Code window and add a breakpoint in your code – then run to that breakpoint, or you can use the Step into function to step into your code.
When your program starts, DDT will attempt to determine the MPI world rank of each process. If this fails, you will see the following error message:
Fig 19: MPI rank error
This means that the number DDT shows for each process may not be the MPI rank of the process. To correct this you can tell DDT to use a variable from your program as the rank for each process – see section 6.12 Assigning MPI Ranks for details.
To end your current debugging session select the End Session menu option from the Session menu. This will close all processes and stop any running code. If any processes remain you may have to
© 2009 Allinea Software 24

Distributed Debugging Tool v2.5
clean them up manually using the kill command (or a command provided with your MPI implementation).
3.2 Notes on the MPICH Standard and OpenMPI options
When using the “MPICH 1 Standard” or “OpenMPI” MPI implementations, DDT will allow mpirun to start all the processes, then attach to them while they're inside MPI_Init.
This method is often faster than the “generic” method, but requires the remote-exec facility in DDT to be correctly configured if processes are being launched on a remote machine. For more information on remote-exec, please see “Connecting to remote programs (remote-exec)” on page 18.
Important: If DDT is running in the background (e.g. ddt &) then this process may get stuck (some SSH versions cause this behaviour when asking for a password). If this happens to you, go to the terminal and use the fg or similar command to make DDT a foreground process, or run DDT again, without using & .
If DDT can't find a password-free way to access the cluster nodes then you will not be able to use the MPICH Standard startup option. Instead, You can use generic , although startup may be slower for large numbers of processes
3.3 Debugging Single-Process Programs
Fig 14: Single-Process Run Window
Users with single-process licences will immediately see the Run Window that is appropriate for single-process applications.
Users with multi-process licences can check the Run Without MPI Support checkbox to run a single process program.
Select the application – either by typing the file name in, or selecting using the browser by clicking the browse button. Arguments can be typed into the supplied box.
If you wish, you can also click on the Advanced button to access some of the features listed above (e.g. Memory Debugging).
Finally click Run to start your program.
Note: If you have a program compiled with Intel ifort or GNU g77 you may not see your code and highlight line when DDT starts. This is because those compilers create a pseudo MAIN function, above the top level of your code. To fix this you can either open your Source Code window and add a breakpoint in your code – then run to that breakpoint, or you can use the Step Into function to step into your code.
To end your current debugging session select the End Session menu option from the Session menu. This will close all processes and stop any running code. If any processes remain you may have to
© 2009 Allinea Software 25
Distributed Debugging Tool v2.5
clean them up manually using the kill command or a command provided with your MPI implementation such as mpkill on Solaris .
3.4 Debugging OpenMP Programs
When running an OpenMP program, set the “Number of threads (OpenMP only)” value to the number of threads you require. DDT will run your program with the OMP_NUM_THREADS environment variable set to the appropriate value.
There are several important points to keep in mind while debugging OpenMP programs:
1. Some OpenMP libraries only create the threads when the first parallel region is reached. Don't worry if you can only see one thread at the start of the program.
2. You cannot step into a parallel region. Instead, tick the “Step threads together” box and use the “Run to here” command to synchronise the threads at a point inside the region – these controls are discussed in more detail in their own sections of this document.
3. You cannot step out of a parallel region. Instead, use “Run to here” to leave it. Most OpenMP libraries work best if you keep the “Step threads together” box ticked until you have left the parallel region. With the Intel OpenMP library, this means you will see the “Stepping Threads” window and will have to click “Skip All” once.
4. Leave “Step threads together” off when you are outside a parallel region (as OpenMP worker threads usually do not follow the same program flow as the main thread).
5. To control threads individually, use the “Focus on Thread” control. This allows you to step and play one thread without affecting the rest. This is helpful when you want to work through a locking situation or to bring a stray thread back to a common point. The Focus controls are discussed in more detail in their own section of this document.
6. Shared OpenMP variables may appear twice in the Locals window. This is one of the many unfortunate side-effects of the complex way OpenMP libraries interfere with your code to produce parallelism. One copy of the variable may have a nonsense value – this is usually easy to recognise. The correct values are shown in the Evaluate and Current Line windows.
7. Parallel regions may be displayed as a new function in the stack views. Many OpenMP libraries implement parallel regions as automatically-generated “outline” functions, and DDT shows you this. To view the value of variables that are not used in the parallel region, you may need to switch to thread 0 and change the stack frame to the function you wrote, rather than the outline function.
8. Stepping often behaves unexpectedly inside parallel regions. Reduction variables usually require some sort of locking between threads, and may even appear to make the current line jump back to the start of the parallel region! Don't worry about this – step over another couple of times and you'll see it comes back to where it belongs.
9. Some compilers optimise parallel loops regardless of the options you specified on the command line. This has many strange effects, including code that appears to move backwards as well as forwards, and variables that have nonsense values because they have been optimised out by the compiler.
If you are using DDT with OpenMP and would like to tell us about experiences, we would appreciate your feedback. Please email [email protected] with the subject title “OpenMP feedback”.
3.5 Debugging Multi-Process Non-MPI programs
DDT can only launch MPI programs and scalar (single process) programs itself. The Debug a Multi-Process Non-MPI Program button on the Welcome Screen allows you to debug multi-process and multi-executable programs. These programs don't necessarily need to be MPI programs. You can debug programs that use other parallel frameworks, or both the client and the server from a client/server application in the same DDT session, for example.
You must run each program you want to debug manually using the ddt-client command, similar to debugging with a scalar debugger like the GNU debugger (gdb). However, unlike a scalar debugger,
© 2009 Allinea Software 26

Distributed Debugging Tool v2.5
you can debug more than one process at the same time in the same DDT session (licence permitting). Each program you run will show up as a new process in the DDT window.
For example to debug both client and server in the same DDT session:
1. Click on the Manual Launch button.2. Select 2 processes.
Fig 15: Manual Launch Window
3. Click the Listen button.4. At the command line run:
ddt-client server &ddt-client client &
The server process will appear as process 0 and the client as process 1 in the DDT window.
Fig 16: Manual Launch Process Groups
After you have run the initial programs you may add extra processes to the DDT session (for example extra clients) using ddt-client in the same way.
ddt-client client2 &
If you check Start debugging after the first process connects you do not need to specify how many processes you want to launch in advance. You can start debugging after the first process connects and add extra processes later as above.
3.6 Debugging OpenMPI MPMD Programs
If you are using OpenMPI, DDT can be used to debug multiple program, multiple data (MPMD) programs. To start an MPMD program in DDT:
1. Create an application context file (as taken by the --app parameter to mpirun, see the OpenMPI documentation for more information).
2. Click the Run button on the Welcome Screen.3. Click the Advanced >> button.4. Type –-app /path/to/my_app_file in the MPIRun Arguments box.5. Click the Run button.
Note: it doesn't matter what executable you select in the Application box.
For MPIs other than OpenMPI MPMD programs are supported through the 'Manual Launch' feature (see previous section).
© 2009 Allinea Software 27

Distributed Debugging Tool v2.5
3.7 Opening A Core File
Fig 17: The Open Core Window
DDT allows you to debug a single core file generated by your application.
To debug using a core file, click the Open a Core File button on the Welcome Screen. This opens the Open Core window, which allows you to select an executable and a core file. Click Open to open the core file and start debugging it.
While DDT is in this mode, you cannot play, pause or step (because there is no process active). You are, however, able to evaluate expressions and browse the variables and stack frames saved in the core file.
The End Session menu option will return DDT to its normal mode of operation.
3.8 Attaching To Running Programs
DDT can attach to running processes on any machine you have access to, whether they are from MPI or scalar jobs, even if they have different executables and source pathnames.
The easiest way to set this up is by following the instructions in the Configuration Wizard, described elsewhere in this document. However, if you wish to set up attaching manually, please see the “Connecting to remote programs (remote-exec)” section on page 18.
Once the script is set up (we advise testing it at the command-line before using DDT) you must also provide a plain text file listing the nodes you want DDT to look for processes to attach to. If you ran the configuration wizard then you may have already made this file during that process, if not then you now need to create it manually. An example of the contents of this list is:
localhostcomp00comp01 comp02comp03
This file can be placed anywhere you have read access to, and may be provided by your system administrator. DDT must be given the location of this file – to do this just set the Attach Hosts File option in the Options window ( Session → Options ). Each host name in this file will be sent to the remote-exec script as the HOSTNAME argument when DDT scans for and attaches to processes.
With the script and the node list configured, clicking the Attach to a Running Program button on the Welcome Screen will show DDT's Attach Window:
© 2009 Allinea Software 28

Distributed Debugging Tool v2.5
Fig 18: Attach Window
Initially the list of processes will be blank while DDT scans the nodes, provided in your node list file, for running processes. When all the nodes have been scanned (or have timed out) the window will appear as shown above. Use the Filter box to find the processes you want to attach to. On non-Linux platforms you will also need to select the application executable you want to attach to. Ensure that the list shows all the processes you wish to debug in your job, and no extra/unnecessary processes. You may modify the list by selecting and removing unwanted processes, or alternatively selecting the processes you wish to attach to and clicking on Attach to Selected Processes. If no processes are selected, DDT uses the whole visible list.
On Linux you may use DDT to attach to multiple processes running different executables. When you select processes with different executables the application box will change to read Multiple applications seleted. DDT will create a process group for each distinct executable
With some supported MPI implementations (e.g. OpenMPI) DDT will show MPI processes as children of the mpirun (or equivalent) command (see figure below). Clicking the mpirun command will automatically select all the MPI child processes.
Fig 18: Attaching with OpenMPi
Some MPI implementations (such as MPICH) create forked (child) processes that are used for communication, but are not part of your job. To avoid displaying and attaching to these, make sure the Hide Forked Children box is ticked. DDT's definition of a forked child is a child process that shares the parent's name. Some MPI implementations create your processes as children of each other. If you cannot see all the processes in your job, try clearing this checkbox and selecting specific processes from the list.
Once you click on the Attach to Selected/Listed Processes button, DDT will use remote-exec to attach a debugger to each process you selected and will proceed to debug your application as if you had started it with DDT. When you end the debug session, DDT will detach from the processes rather than terminating them – this will allow you to attach again later if you wish.
DDT will examine the processes it attaches to and will try to discover the MPI_COMM_WORLD rank of each process. If you have attached to two MPI programs, or a non-MPI program, then you may see the following message:
© 2009 Allinea Software 29
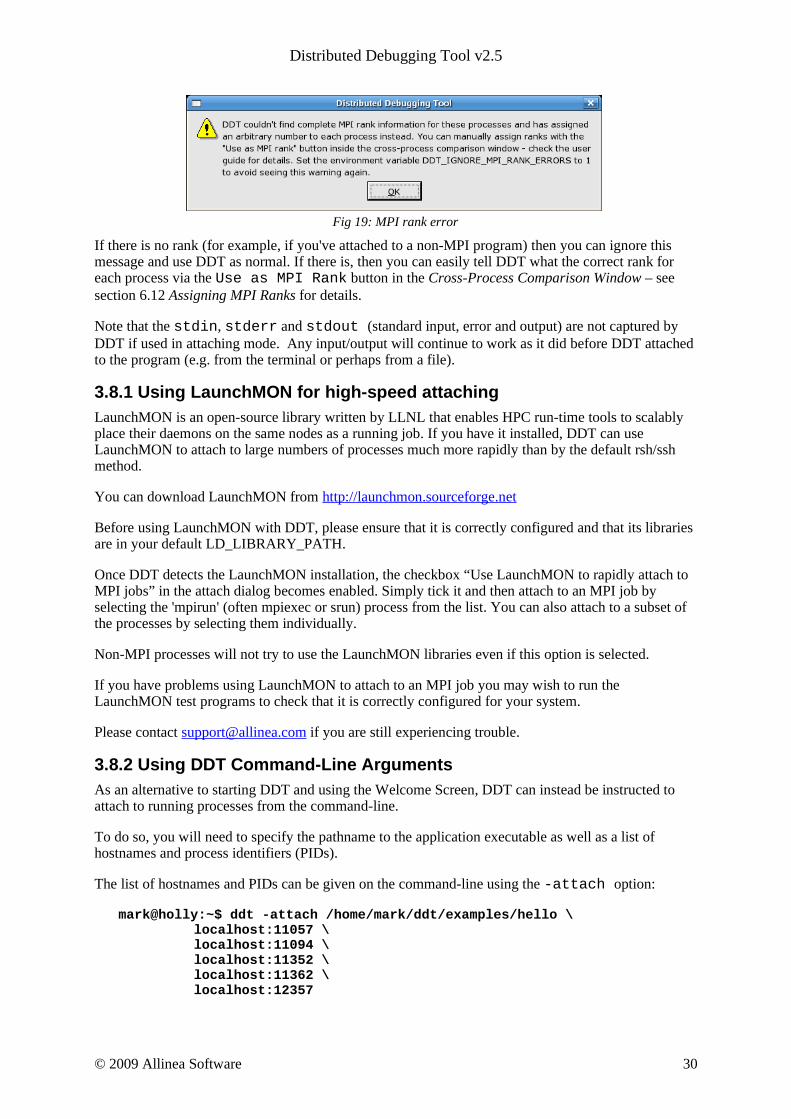
Distributed Debugging Tool v2.5
Fig 19: MPI rank error
If there is no rank (for example, if you've attached to a non-MPI program) then you can ignore this message and use DDT as normal. If there is, then you can easily tell DDT what the correct rank for each process via the Use as MPI Rank button in the Cross-Process Comparison Window – see section 6.12 Assigning MPI Ranks for details.
Note that the stdin, stderr and stdout (standard input, error and output) are not captured by DDT if used in attaching mode. Any input/output will continue to work as it did before DDT attached to the program (e.g. from the terminal or perhaps from a file).
3.8.1 Using LaunchMON for high-speed attachingLaunchMON is an open-source library written by LLNL that enables HPC run-time tools to scalably place their daemons on the same nodes as a running job. If you have it installed, DDT can use LaunchMON to attach to large numbers of processes much more rapidly than by the default rsh/ssh method.
You can download LaunchMON from http://launchmon.sourceforge.net
Before using LaunchMON with DDT, please ensure that it is correctly configured and that its libraries are in your default LD_LIBRARY_PATH.
Once DDT detects the LaunchMON installation, the checkbox “Use LaunchMON to rapidly attach to MPI jobs” in the attach dialog becomes enabled. Simply tick it and then attach to an MPI job by selecting the 'mpirun' (often mpiexec or srun) process from the list. You can also attach to a subset of the processes by selecting them individually.
Non-MPI processes will not try to use the LaunchMON libraries even if this option is selected.
If you have problems using LaunchMON to attach to an MPI job you may wish to run the LaunchMON test programs to check that it is correctly configured for your system.
Please contact [email protected] if you are still experiencing trouble.
3.8.2 Using DDT Command-Line ArgumentsAs an alternative to starting DDT and using the Welcome Screen, DDT can instead be instructed to attach to running processes from the command-line.
To do so, you will need to specify the pathname to the application executable as well as a list of hostnames and process identifiers (PIDs).
The list of hostnames and PIDs can be given on the command-line using the -attach option:
mark@holly:~$ ddt -attach /home/mark/ddt/examples/hello \ localhost:11057 \ localhost:11094 \ localhost:11352 \ localhost:11362 \ localhost:12357
© 2009 Allinea Software 30

Distributed Debugging Tool v2.5
Another command-line possibility is to specify the list of hostnames and PIDs in a file and use the -attach-file option:
mark@holly:~$ cat /home/mark/ddt/examples/hello.list
localhost:11057localhost:11094localhost:11352localhost:11362localhost:12357
mark@holly:~$ ddt -attach-file /home/mark/ddt/examples/hello.list \ /home/mark/ddt/examples/hello
In both cases, if just a number is specified for a hostname:PID pair, then localhost: is assumed.
These command-line options work for both single- and multi-process attaching.
3.9 Starting A Job In A Queue
If DDT has been configured to be integrated with a queue/batch environment, as described in section 2.3 Integrating DDT With Queuing Systems then you may use DDT to launch your job. In this case, a Submit button is presented on the Run Window , instead of the ordinary Run button. Clicking Submit from the Run Window will display the queue status until your job starts. DDT will execute the display command every second and show you the standard output. If your queue display is graphical or interactive then you cannot use it here.
If your job does not start or you decide not to run it, click on Cancel Job . If the regular expression you entered for getting the job id is invalid or if an error is reported then DDT will not be able to remove your job from the queue – it is strongly recommend you check the job has been removed before submitting another as it is possible for a forgotten job to execute on the cluster and either waste resources or interfere with other debug sessions.
Once your job is running, it will connect to DDT and you will be able to debug it.
3.10 Using Custom MPI Scripts
On some systems a custom 'mpirun' replacement is used to start jobs, such as mpiexec. DDT will normally use whatever the default for your MPI implementation is, so for mpich it would look for mpirun and not mpiexec. This section explains how to configure DDT to use a custom mpirun command for job startup.
There are typically two ways you might want to start jobs using a custom script, and DDT supports them both. Firstly, you might pass all the arguments on the command-line, like this:
mpiexec -n 4 /home/mark/program/chains.exe /tmp/mydata
There are several key variables in this line that DDT can fill in for you:
1. The number of processes (4 in the above example)2. The name of your program (/home/mark/program/chains.exe)3. One or more arguments passed to your program (/tmp/mydata)
Everything else, like the name of the command and the format of it's own arguments remains constant. To use a command like this in DDT, we adapt the queue submission system described in the previous section. For this mpiexec example, the settings would be as shown here:
© 2009 Allinea Software 31
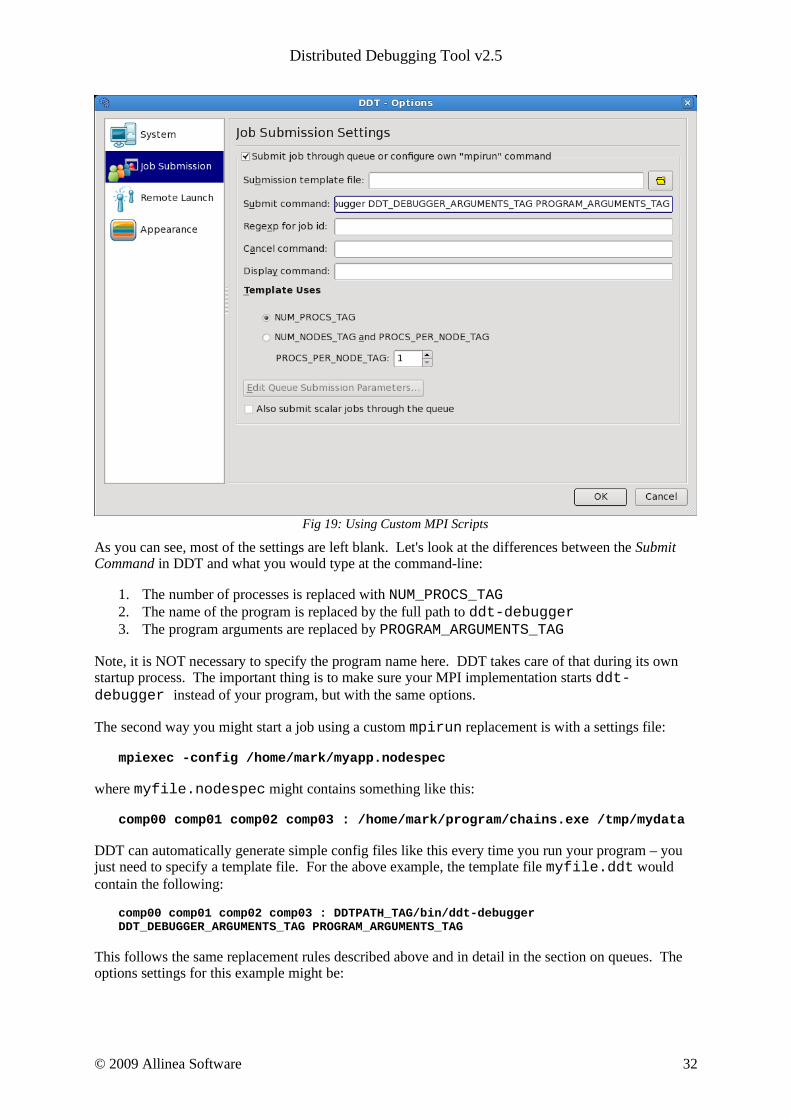
Distributed Debugging Tool v2.5
Fig 19: Using Custom MPI Scripts
As you can see, most of the settings are left blank. Let's look at the differences between the Submit Command in DDT and what you would type at the command-line:
1. The number of processes is replaced with NUM_PROCS_TAG 2. The name of the program is replaced by the full path to ddt-debugger 3. The program arguments are replaced by PROGRAM_ARGUMENTS_TAG
Note, it is NOT necessary to specify the program name here. DDT takes care of that during its own startup process. The important thing is to make sure your MPI implementation starts ddt-debugger instead of your program, but with the same options.
The second way you might start a job using a custom mpirun replacement is with a settings file:
mpiexec -config /home/mark/myapp.nodespec
where myfile.nodespec might contains something like this:
comp00 comp01 comp02 comp03 : /home/mark/program/chains.exe /tmp/mydata
DDT can automatically generate simple config files like this every time you run your program – you just need to specify a template file. For the above example, the template file myfile.ddt would contain the following:
comp00 comp01 comp02 comp03 : DDTPATH_TAG/bin/ddt-debugger DDT_DEBUGGER_ARGUMENTS_TAG PROGRAM_ARGUMENTS_TAG
This follows the same replacement rules described above and in detail in the section on queues. The options settings for this example might be:
© 2009 Allinea Software 32

Distributed Debugging Tool v2.5
Fig 20: Using Substitute MPI Commands
Note the Submit Command and the Submission Template File in particular. DDT will create a new file and append it to the submit command before executing it. So, in this case what would actually be executed might be mpiexec -config /tmp/ddt-temp-0112 or similar. Therefore, any argument like -config must be last on the line, because DDT will add a filename to the end of the line. Other arguments, if there are any, can come first.
We recommend reading the section on queue submission, as there are many features described there that might be useful to you if your system uses a non-standard startup command. If you do use a non-standard command, please email us at [email protected] and let us know about it – you might find the next version supports it out-of-the-box!
3.11 Starting DDT From A Job Script
The usual way of debugging a program with DDT in a queue/batch environment is to configure DDT to submit the program to the queue for you (see section 3.9 Starting a Job In A Queue above).
Some users may wish to start DDT itself from a job script that is submitted to the queue/batch environment. To do this:
1.Configure DDT with the correct MPI implementation.2.Disable queue submission in the DDT options.3.Create a job script that starts DDT using the command ddt -start -once -n NPROCS -- PROGRAM [ARGUMENTS]... where NPROCS is the number of processes to start PROGRAM is the program to runand ARGUMENTS are the arguments to the program4.Submit the job script to the queue.
The -once argument tells DDT to exit when the session ends.
© 2009 Allinea Software 33

Distributed Debugging Tool v2.5
Alternatively you can invoke mpirun or equivalent directly from the job script instead of through DDT using the following commands:
ddt -once -norun -n NPROCS PROGRAM &mpirun -np NPROCS ddt-debugger --ddtwaitforsession [ARGUMENTS]...wait
where NPROCS, PROGRAM, and ARGUMENTS are as above.
3.12 Notes on X Forwarding or VNC for remote users
Many users of DDT choose to display DDT on a machine that is not the actual cluster/machine that is running the DDT GUI, for example when accessing a departmental/facility cluster resource from their desktop/laptop. There are two methods for achieving this: X forwarding and VNC (or similar Unix-supporting remote desktop software).
X forwarding is effective when the network connection is very good. VNC is strongly recommended when the network connection is moderate or slow.
● Apple users accessing a Linux or other Unix machine whilst using a single-button mouse should be advised that pressing the “Command” key and the single mouse button will have the same effect as right clicking on a two button mouse. Right clicking is an important action in DDT: for example in each of the source code browser, the parallel stack view and variable views, right clicking will access some of the important features in DDT.
To use X forwarding and DDT with an Apple on a remote Linux/Unix system, start the X11 server (available in the X11User.pkg), then:
● Set the display variable correctly to allow X applications to display by opening a terminal in OS/X and typing
export DISPLAY=:0
● Then ssh to the remote system from that terminal, with ssh options -X and -C (X forwarding and compression). For example:
ssh -CX [email protected]
● Now start DDT on the remote system and the display will appear on your Mac.
● Windows users can use any one of a number of commercial and open source X servers, but may find VNC a viable alternative (www.realvnc.com) which is available under free and commercial licensing options.
● VNC allows users to access a desktop running on a remote server (eg. a cluster frontend). By setting up an “SSH tunnel” users are usually able to access this remote desktop from anywhere, securely, and, due to its own display protocols, will see a reduction in X11 traffic, which makes DDT very rapid to use remotely.
● To use VNC and DDT, log in to the remote system and set up a tunnel for port 5901 and 5801. On Apple or any Linux/Unix system this is set by options to SSH. For SSH using Putty on Windows, select options in the GUI to set tunnels.
ssh -L 5901:localhost:5901 -L 5801:localhost:5801 [email protected]
● At the remote prompt, start vncserver. If this is the first time you have used VNC it will ask you to set an access password.
vncserver
© 2009 Allinea Software 34
Distributed Debugging Tool v2.5
The output from vncserver will tell you which ports VNC has started on – 5800+n and 5900+n, where “n” is the number given as “hostname:n” in the output. If this number, n, is not 1, then another user is already using VNC on that system, and you should set a new tunnel to these ports by logging in to the same host again and changing the settings to the new ports (or use SSH escape codes to add a tunnel, see the SSH manual pages for details).
● Now, on the local desktop/laptop, either use a browser and access the desktop within the browser by entering the URL http://localhost:5801, or (better) you may use a separate VNC client such as krdc or vncviewer.
krdc localhost:1 or vncviewer localhost:1
If “n” is not 1, as described above, use :2, :3 etc. as appropriate instead.
● Note that a bug in the browser based access method means the “Tab” key does not work correctly in VNC. but krdc or vncviewer users are not affected by this problem.
● VNC also frequently defaults to an old X window manager (twm), this can be changed by editing the ~/.vnc/xstartup file to use KDE or GNOME and restarting the VNC server.
© 2009 Allinea Software 35

Distributed Debugging Tool v2.5
4 DDT OverviewDDT uses a tabbed-document interface – a method of presenting multiple documents that is familiar from many present day applications. This allows you to have many source files open, and to view one (or two, if the Source Code Viewer is 'split') in the full workspace area.
Each component of DDT (labelled and described in the key) is a dockable window, which may be dragged around by a handle (usually on the top or left-hand edge). Components can also be double-clicked, or dragged outside of DDT, to form a new window. You can hide or show most of the components using the View menu. The screen shot shows the default DDT layout.
Key(1) Menu Bar(2) Process Controls(3) Process Groups(4) Project Navigator(5) Source Code(6) Variables and Stack of Current Process/Thread(7) Parallel Stack, IO and Breakpoints(8) Evaluate Window(9) Status Bar
Fig 21: DDT Main Window
© 2009 Allinea Software 36
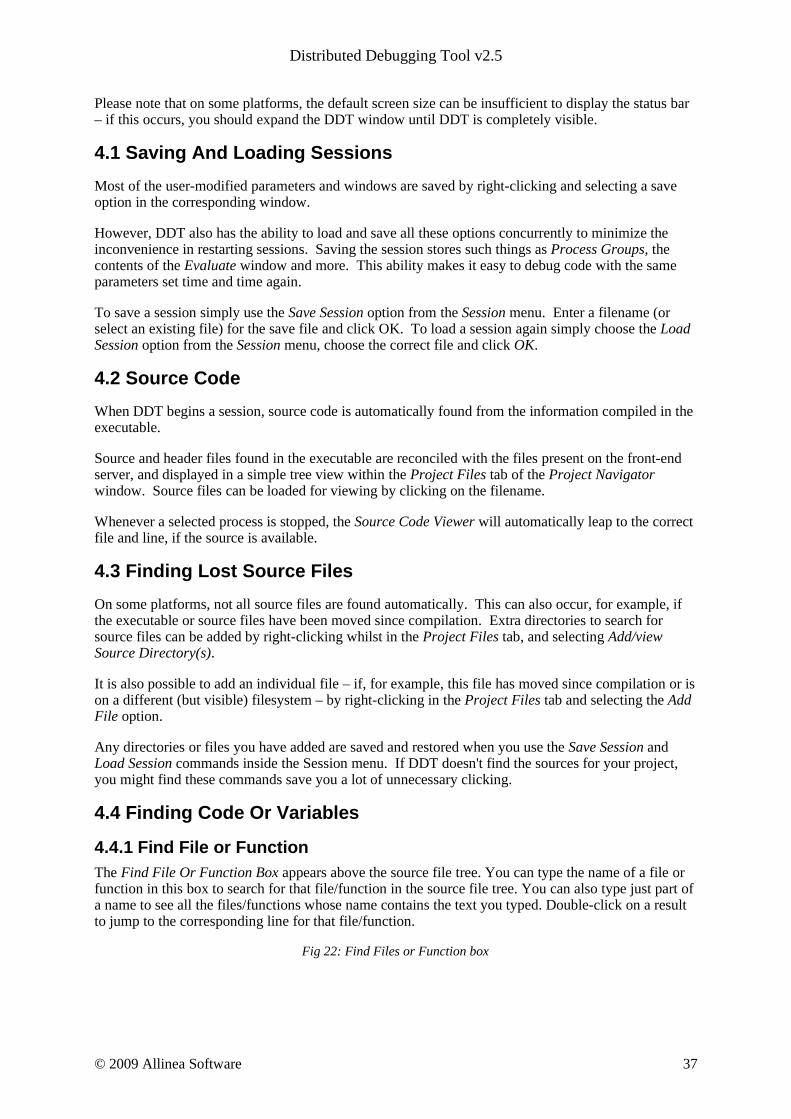
Distributed Debugging Tool v2.5
Please note that on some platforms, the default screen size can be insufficient to display the status bar – if this occurs, you should expand the DDT window until DDT is completely visible.
4.1 Saving And Loading Sessions
Most of the user-modified parameters and windows are saved by right-clicking and selecting a save option in the corresponding window.
However, DDT also has the ability to load and save all these options concurrently to minimize the inconvenience in restarting sessions. Saving the session stores such things as Process Groups, the contents of the Evaluate window and more. This ability makes it easy to debug code with the same parameters set time and time again.
To save a session simply use the Save Session option from the Session menu. Enter a filename (or select an existing file) for the save file and click OK. To load a session again simply choose the Load Session option from the Session menu, choose the correct file and click OK.
4.2 Source Code
When DDT begins a session, source code is automatically found from the information compiled in the executable.
Source and header files found in the executable are reconciled with the files present on the front-end server, and displayed in a simple tree view within the Project Files tab of the Project Navigator window. Source files can be loaded for viewing by clicking on the filename.
Whenever a selected process is stopped, the Source Code Viewer will automatically leap to the correct file and line, if the source is available.
4.3 Finding Lost Source Files
On some platforms, not all source files are found automatically. This can also occur, for example, if the executable or source files have been moved since compilation. Extra directories to search for source files can be added by right-clicking whilst in the Project Files tab, and selecting Add/view Source Directory(s).
It is also possible to add an individual file – if, for example, this file has moved since compilation or is on a different (but visible) filesystem – by right-clicking in the Project Files tab and selecting the Add File option.
Any directories or files you have added are saved and restored when you use the Save Session and Load Session commands inside the Session menu. If DDT doesn't find the sources for your project, you might find these commands save you a lot of unnecessary clicking.
4.4 Finding Code Or Variables
4.4.1 Find File or FunctionThe Find File Or Function Box appears above the source file tree. You can type the name of a file or function in this box to search for that file/function in the source file tree. You can also type just part of a name to see all the files/functions whose name contains the text you typed. Double-click on a result to jump to the corresponding line for that file/function.
Fig 22: Find Files or Function box
© 2009 Allinea Software 37

Distributed Debugging Tool v2.5
4.4.2 FindThe Find window can be found in the Search menu, and can be used to find occurrences of an expression in the currently visible source file.
Fig 23: Find dialog
DDT will search from the current cursor position for the next or previous occurrence of the search term.
Case sensitive: When checked, DDT will perform a case sensitive search (e.g. “Hello” will not match “hello”).
Whole words only: When checked, DDT will only match your search term against whole “words” in the source file. For example “Hello” would not match “HelloWorld” while searching for whole words only.
From beginning: When this is checked, your search will begin from the beginning of the document rather than the cursor.
4.4.3 Find in FilesThe Find In Files window can be found in the Search menu, and can be used to search all source and header files associated with your program. The search results are listed and can be clicked to display the file and line number in the main Source Code Viewer; this can be of particular use for setting a breakpoint at a function.
Fig 24: Find in Files dialog
Case sensitive: When checked, DDT will perform a case sensitive search (e.g. “Hello” will not match “hello”).
Whole words only: When checked, DDT will only match your search term against whole “words” in the source file. For example “Hello” would not match “HelloWorld” while searching for whole words only.
Regular Expression: When checked, DDT will interpret the search term as a regular expression rather than a fixed string. The syntax of the regular expression is identical to that described in the “Configuring Queue Commands” section above.
4.5 Jump To Line / Jump To Function
DDT has a jump to line function which enables the user to go directly to a line of code. This is found in the Search menu. A window will appear in the center of your screen. Enter the line number you
© 2009 Allinea Software 38
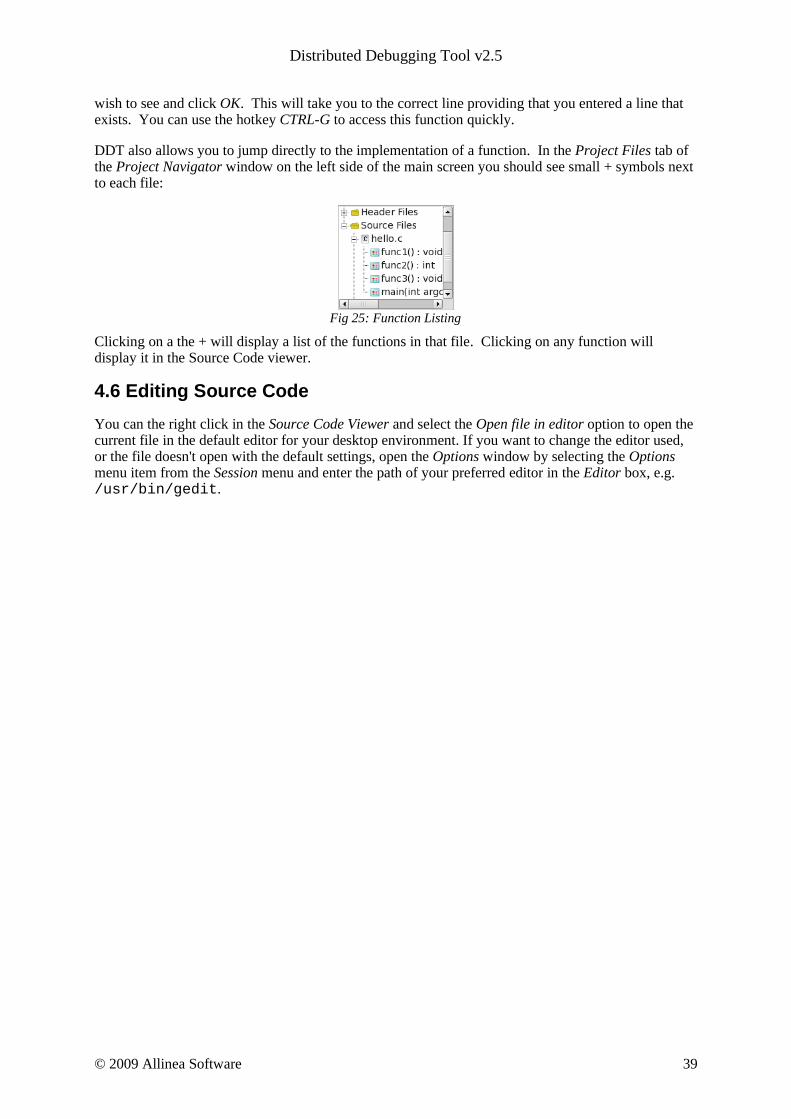
Distributed Debugging Tool v2.5
wish to see and click OK. This will take you to the correct line providing that you entered a line that exists. You can use the hotkey CTRL-G to access this function quickly.
DDT also allows you to jump directly to the implementation of a function. In the Project Files tab of the Project Navigator window on the left side of the main screen you should see small + symbols next to each file:
Fig 25: Function Listing
Clicking on a the + will display a list of the functions in that file. Clicking on any function will display it in the Source Code viewer.
4.6 Editing Source Code
You can the right click in the Source Code Viewer and select the Open file in editor option to open the current file in the default editor for your desktop environment. If you want to change the editor used, or the file doesn't open with the default settings, open the Options window by selecting the Options menu item from the Session menu and enter the path of your preferred editor in the Editor box, e.g. /usr/bin/gedit.
© 2009 Allinea Software 39

Distributed Debugging Tool v2.5
5 Controlling Program ExecutionWhether debugging a multi-process or a single process code, the mechanisms for controlling program execution are very similar.
In multi-process mode, most of the features described in this section are applied using Process Groups, which we describe now. For single process mode, the commands and behaviours are identical, but apply to only a single process – freeing the user from concerns about process groups.
5.1 Process Control And Process Groups
MPI programs are designed to run as more than one process and can span many machines. DDT allows you to group these processes so that actions can be performed on more than one process at a time. The status of processes can be seen at a glance by looking at the Process Group Viewer.
The Process Group Viewer is (by default) at the top of the screen with multi-coloured rows. Each row relates to a group of processes and operations can be performed on the currently highlighted group (e.g. playing, pausing and stepping) by clicking on the toolbar buttons. Switch between groups by clicking on them or their processes - the highlighted group is indicated by a lighter shade. Groups can be created, deleted, or modified by the user at any time, with the exception of the All group, which cannot be modified.
Groups are added by clicking on the Create Group button or from a context-sensitive menu that appears when you right-click on the process group widget. This menu can also be used to rename groups, delete individual processes from a group and jump to the current position of a process in the code viewer. You can load and save the current groups to a file, and you can create sub-groups from the processes currently playing, paused or finished. You can even create a sub-group excluding the members of another group – for example, to take the complement of the “Workers” group, select the All group and choose “Copy, but without Workers”.
You can also use the context menu to switch between the two different ways of viewing the list of groups in DDT – the detailed view and the summary view:
5.1.1 Detailed ViewThe detailed view is ideal for working with smaller numbers of processes. If your program has less than 32 processes, DDT will default to the detailed view. You can switch to this view using the context menu if you wish.
Fig 26 : The Detailed Process Group View
In the detailed view, each process is represented by a square containing its MPI rank (0 through n-1). The squares are colour-coded; red for a paused process, green for a running process and grey for a finished/dead process. Selected processes are highlighted with a lighter shade of their colour and the current process also has a dashed border.
When a single process is selected the local variables are displayed in the Variable Viewer and displayed expressions are evaluated. You can make the Source Code Viewer jump to the file and line for the current stack frame (if available) by double-clicking on a process.
© 2009 Allinea Software 40
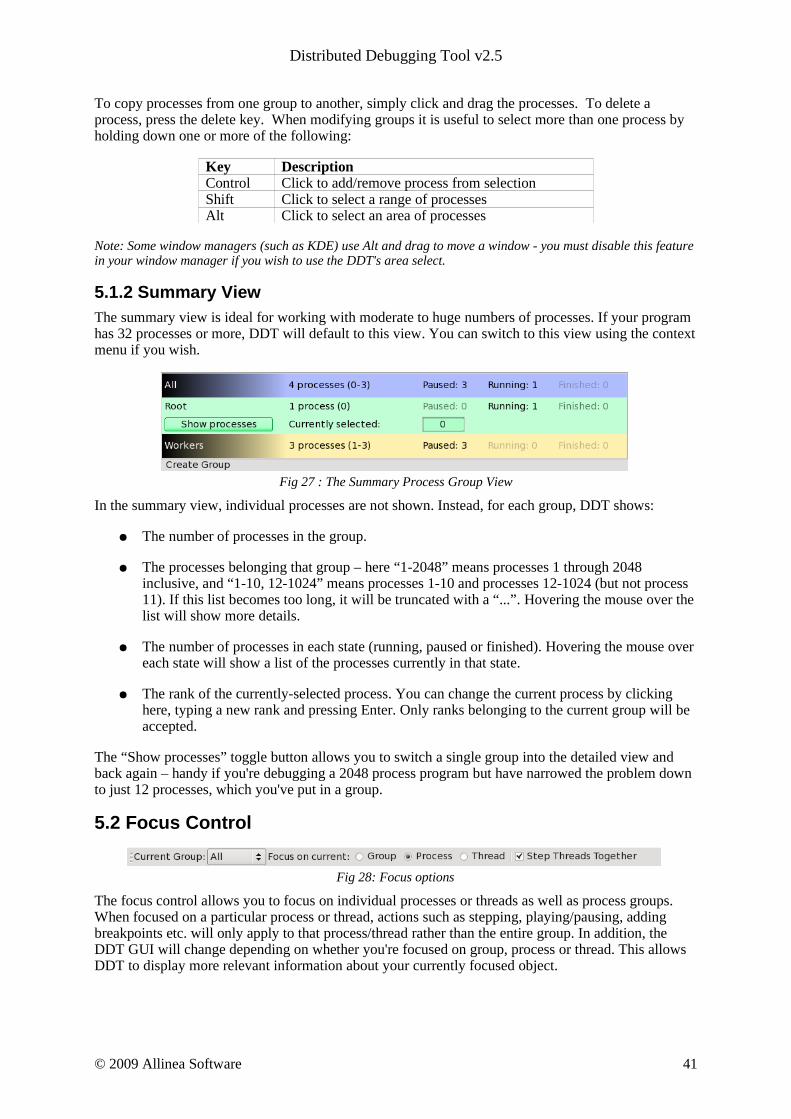
Distributed Debugging Tool v2.5
To copy processes from one group to another, simply click and drag the processes. To delete a process, press the delete key. When modifying groups it is useful to select more than one process by holding down one or more of the following:
Key DescriptionControl Click to add/remove process from selectionShift Click to select a range of processesAlt Click to select an area of processes
Note: Some window managers (such as KDE) use Alt and drag to move a window - you must disable this feature in your window manager if you wish to use the DDT's area select.
5.1.2 Summary ViewThe summary view is ideal for working with moderate to huge numbers of processes. If your program has 32 processes or more, DDT will default to this view. You can switch to this view using the context menu if you wish.
Fig 27 : The Summary Process Group View
In the summary view, individual processes are not shown. Instead, for each group, DDT shows:
● The number of processes in the group.
● The processes belonging that group – here “1-2048” means processes 1 through 2048 inclusive, and “1-10, 12-1024” means processes 1-10 and processes 12-1024 (but not process 11). If this list becomes too long, it will be truncated with a “...”. Hovering the mouse over the list will show more details.
● The number of processes in each state (running, paused or finished). Hovering the mouse over each state will show a list of the processes currently in that state.
● The rank of the currently-selected process. You can change the current process by clicking here, typing a new rank and pressing Enter. Only ranks belonging to the current group will be accepted.
The “Show processes” toggle button allows you to switch a single group into the detailed view and back again – handy if you're debugging a 2048 process program but have narrowed the problem down to just 12 processes, which you've put in a group.
5.2 Focus Control
Fig 28: Focus options
The focus control allows you to focus on individual processes or threads as well as process groups. When focused on a particular process or thread, actions such as stepping, playing/pausing, adding breakpoints etc. will only apply to that process/thread rather than the entire group. In addition, the DDT GUI will change depending on whether you're focused on group, process or thread. This allows DDT to display more relevant information about your currently focused object.
© 2009 Allinea Software 41

Distributed Debugging Tool v2.5
5.2.1 Overview of changing focusFocusing in DDT affects a number of different controls in the DDT main window. These are briefly described below:
Note: Focus controls do not affect DDT windows such as the Multi Dimensional Array Viewer, Memory Debugger, Cross Process Comparison etc.
5.2.2 Process Group ViewerThe changes to the process group viewer amongst the most obvious changes to the DDT GUI. When focus on current group is selected you will see your currently created process groups. When switching to focus on current process or thread you will see the view change to show the processes in the currently selected group, with their corresponding threads.
Fig 29: The Detailed Process Group View Focused on a Process
If there are 32 threads or more, DDT will default to showing the threads using a summary view (as in the Process Group View). The view mode can also be changed using the context menu.
5.2.3 BreakpointsThe breakpoints tab in DDT will be filtered to only display breakpoints relevant to your current group, process, thread. When focused on a process, The breakpoint tab will display which thread the breakpoint belongs to. If you are focused on a group, the tab will display both the process and the thread the breakpoint belongs to.
5.2.4 Code ViewerThe code viewer in DDT shows a backtrace of where each thread is in the call stack. This will also be filtered by the currently focused item, for example when focused on a particular process, you will only see the backtrace for the threads in that process.
Also, when adding breakpoints using the code viewer, they will be added for the group, process or thread that is currently focused.
5.2.5 Parallel Stack ViewThe parallel stack view can also be filtered by focusing on a particular process group, process or thread.
5.2.6 Input and Output (stdin, stdout and stderr)Switching focus will also affect how the Input/Output tab functions in DDT. Input and output is done on a per-process basis, so focusing on a thread has the same effect as focusing on the thread's parent process.
When focused on a group, stdin input will be sent to each process in that group, whereas focusing on a process (or a thread) will send the input only to that process.
Similarly, stdout and stderr output is shown from all process in a focused group, whereas selecting a single process (or thread) will filter the output to that process. Filtering can also be controlled using the combo box on the Input/Output tab.
Note: Some MPI statup methods such as MPICH Standard register stdin, stdout and stderr through process 0 only, which will prevent this feature from working.
© 2009 Allinea Software 42

Distributed Debugging Tool v2.5
5.2.7 Playing and SteppingThe behaviour of playing, stepping and the Run to here feature are also affected by your currently focused item. When focused on a process group, the entire group will be affected, whereas focusing on a thread will mean that only current thread will be executed. The same goes for processes, but with an additional option which is explained below.
5.2.8 Step Threads Together
The step threads together feature in DDT is only available when focused on process. If this option is enabled then DDT will attempt to synchronise the threads in the current process when performing actions such as stepping, pausing and using “Run to here”.
For example, if you have a process with 2 threads and you choose “Run to here”, DDT will pause your program when either of the threads reaches the specified line. If “Step threads together is selected” DDT will attempt to run both of the threads to the specified line before pausing the program.
Important note: You should always use “Step threads together” and “Run to here” to enter or move within OpenMP parallel regions. With many compilers it is also advisable to use “Step threads together” when leaving a parallel region, otherwise threads can get “left behind” inside system-specific locking libraries and may not enter the next parallel region on the first attempt.
5.2.9 Stepping Threads WindowWhen using the step threads together feature it is not always possible for all threads to synchronise at their target. There are two main reasons for this:
1. One or more threads may branch into a different section of code (and hence never reach the target). This is especially common in OpenMP codes, where worker threads are created and remain in holding functions during sequential regions.
2. As most of DDT's supported debug interfaces cannot run arbitrary groups of threads together, DDT simulates this behaviour by running each thread in turn. This is usually not a problem, but can be if, for example, thread 1 is running, but waiting for thread 2 (which is not currently running). DDT will attempt to resolve this automatically but cannot always do so.
If either of these conditions occur, the Stepping Threads Window will appear, displaying the threads which have not yet reached their target.
Fig 30: The Stepping Threads Window
The stepping threads window also displays the status of threads, which may be one of the following:
● Done: The thread has reached it target (and has been paused).
© 2009 Allinea Software 43
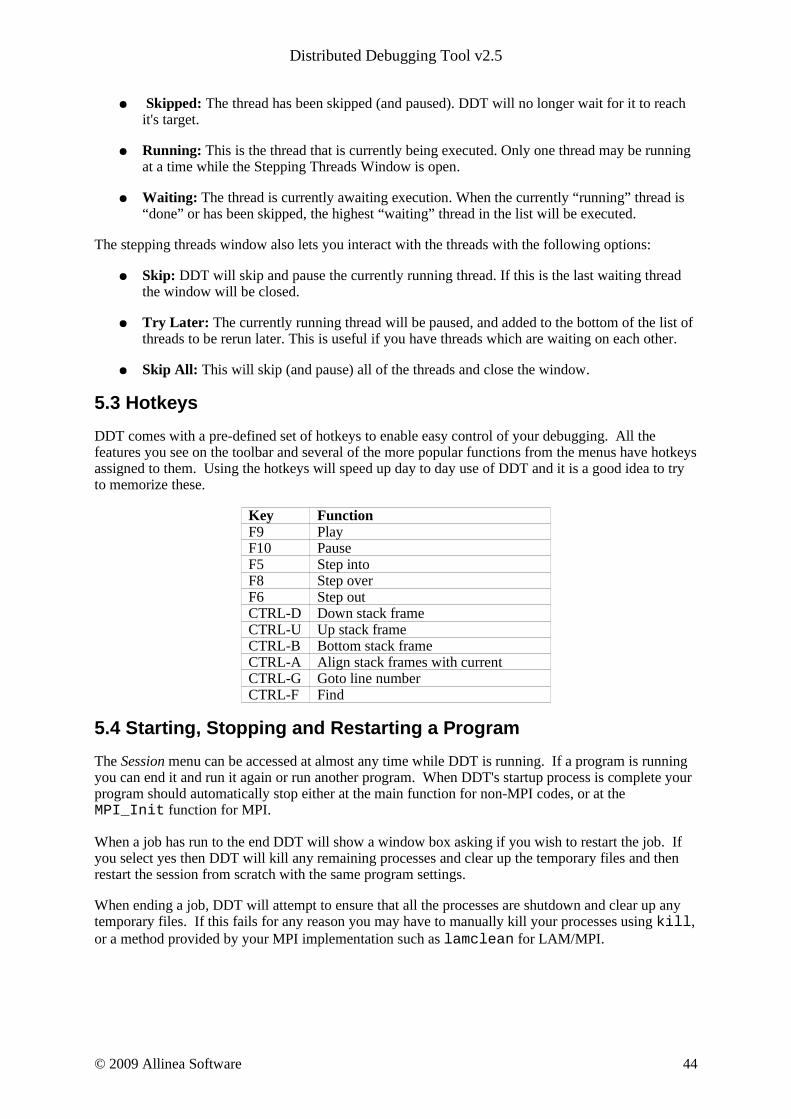
Distributed Debugging Tool v2.5
● Skipped: The thread has been skipped (and paused). DDT will no longer wait for it to reach it's target.
● Running: This is the thread that is currently being executed. Only one thread may be running at a time while the Stepping Threads Window is open.
● Waiting: The thread is currently awaiting execution. When the currently “running” thread is “done” or has been skipped, the highest “waiting” thread in the list will be executed.
The stepping threads window also lets you interact with the threads with the following options:
● Skip: DDT will skip and pause the currently running thread. If this is the last waiting thread the window will be closed.
● Try Later: The currently running thread will be paused, and added to the bottom of the list of threads to be rerun later. This is useful if you have threads which are waiting on each other.
● Skip All: This will skip (and pause) all of the threads and close the window.
5.3 Hotkeys
DDT comes with a pre-defined set of hotkeys to enable easy control of your debugging. All the features you see on the toolbar and several of the more popular functions from the menus have hotkeys assigned to them. Using the hotkeys will speed up day to day use of DDT and it is a good idea to try to memorize these.
Key FunctionF9 PlayF10 PauseF5 Step intoF8 Step overF6 Step outCTRL-D Down stack frameCTRL-U Up stack frameCTRL-B Bottom stack frameCTRL-A Align stack frames with currentCTRL-G Goto line numberCTRL-F Find
5.4 Starting, Stopping and Restarting a Program
The Session menu can be accessed at almost any time while DDT is running. If a program is running you can end it and run it again or run another program. When DDT's startup process is complete your program should automatically stop either at the main function for non-MPI codes, or at the MPI_Init function for MPI.
When a job has run to the end DDT will show a window box asking if you wish to restart the job. If you select yes then DDT will kill any remaining processes and clear up the temporary files and then restart the session from scratch with the same program settings.
When ending a job, DDT will attempt to ensure that all the processes are shutdown and clear up any temporary files. If this fails for any reason you may have to manually kill your processes using kill, or a method provided by your MPI implementation such as lamclean for LAM/MPI.
© 2009 Allinea Software 44
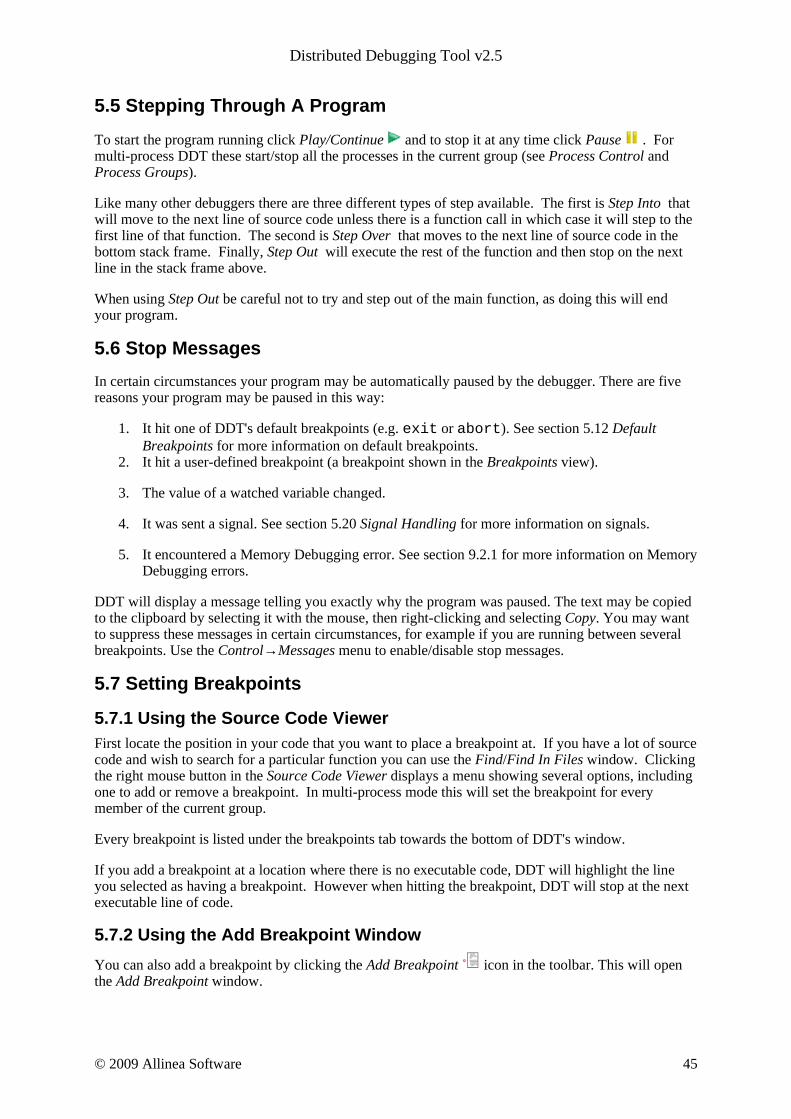
Distributed Debugging Tool v2.5
5.5 Stepping Through A Program
To start the program running click Play/Continue and to stop it at any time click Pause . For multi-process DDT these start/stop all the processes in the current group (see Process Control and Process Groups).
Like many other debuggers there are three different types of step available. The first is Step Into that will move to the next line of source code unless there is a function call in which case it will step to the first line of that function. The second is Step Over that moves to the next line of source code in the bottom stack frame. Finally, Step Out will execute the rest of the function and then stop on the next line in the stack frame above.
When using Step Out be careful not to try and step out of the main function, as doing this will end your program.
5.6 Stop Messages
In certain circumstances your program may be automatically paused by the debugger. There are five reasons your program may be paused in this way:
1. It hit one of DDT's default breakpoints (e.g. exit or abort). See section 5.12 Default Breakpoints for more information on default breakpoints.
2. It hit a user-defined breakpoint (a breakpoint shown in the Breakpoints view).
3. The value of a watched variable changed.
4. It was sent a signal. See section 5.20 Signal Handling for more information on signals.
5. It encountered a Memory Debugging error. See section 9.2.1 for more information on Memory Debugging errors.
DDT will display a message telling you exactly why the program was paused. The text may be copied to the clipboard by selecting it with the mouse, then right-clicking and selecting Copy. You may want to suppress these messages in certain circumstances, for example if you are running between several breakpoints. Use the Control→Messages menu to enable/disable stop messages.
5.7 Setting Breakpoints
5.7.1 Using the Source Code ViewerFirst locate the position in your code that you want to place a breakpoint at. If you have a lot of source code and wish to search for a particular function you can use the Find/Find In Files window. Clicking the right mouse button in the Source Code Viewer displays a menu showing several options, including one to add or remove a breakpoint. In multi-process mode this will set the breakpoint for every member of the current group.
Every breakpoint is listed under the breakpoints tab towards the bottom of DDT's window.
If you add a breakpoint at a location where there is no executable code, DDT will highlight the line you selected as having a breakpoint. However when hitting the breakpoint, DDT will stop at the next executable line of code.
5.7.2 Using the Add Breakpoint Window
You can also add a breakpoint by clicking the Add Breakpoint icon in the toolbar. This will open the Add Breakpoint window.
© 2009 Allinea Software 45
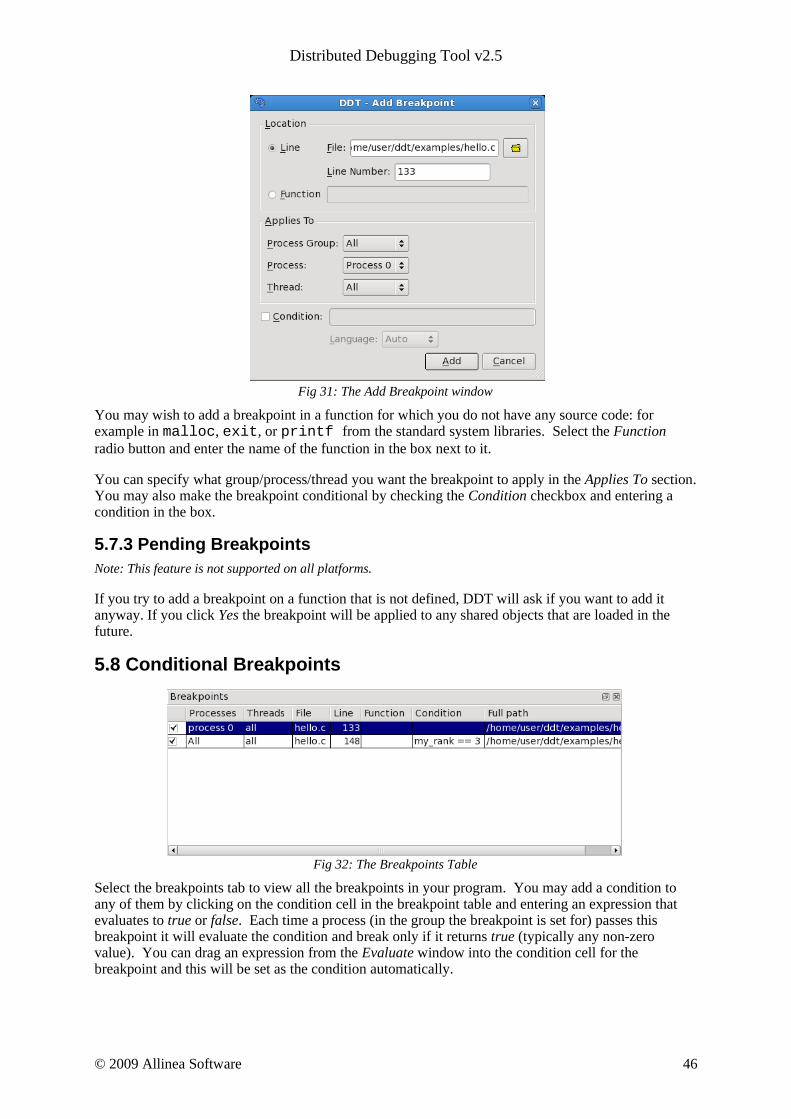
Distributed Debugging Tool v2.5
Fig 31: The Add Breakpoint window
You may wish to add a breakpoint in a function for which you do not have any source code: for example in malloc, exit, or printf from the standard system libraries. Select the Function radio button and enter the name of the function in the box next to it.
You can specify what group/process/thread you want the breakpoint to apply in the Applies To section. You may also make the breakpoint conditional by checking the Condition checkbox and entering a condition in the box.
5.7.3 Pending BreakpointsNote: This feature is not supported on all platforms.
If you try to add a breakpoint on a function that is not defined, DDT will ask if you want to add it anyway. If you click Yes the breakpoint will be applied to any shared objects that are loaded in the future.
5.8 Conditional Breakpoints
Fig 32: The Breakpoints Table
Select the breakpoints tab to view all the breakpoints in your program. You may add a condition to any of them by clicking on the condition cell in the breakpoint table and entering an expression that evaluates to true or false. Each time a process (in the group the breakpoint is set for) passes this breakpoint it will evaluate the condition and break only if it returns true (typically any non-zero value). You can drag an expression from the Evaluate window into the condition cell for the breakpoint and this will be set as the condition automatically.
© 2009 Allinea Software 46
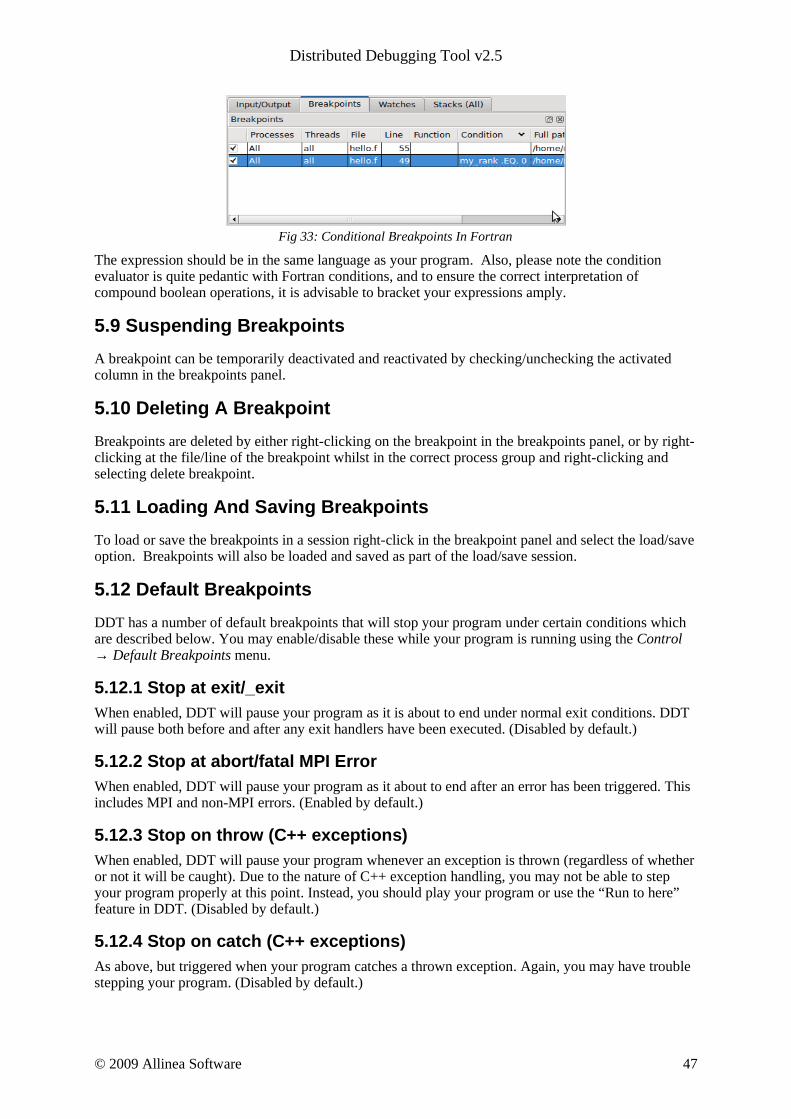
Distributed Debugging Tool v2.5
Fig 33: Conditional Breakpoints In Fortran
The expression should be in the same language as your program. Also, please note the condition evaluator is quite pedantic with Fortran conditions, and to ensure the correct interpretation of compound boolean operations, it is advisable to bracket your expressions amply.
5.9 Suspending Breakpoints
A breakpoint can be temporarily deactivated and reactivated by checking/unchecking the activated column in the breakpoints panel.
5.10 Deleting A Breakpoint
Breakpoints are deleted by either right-clicking on the breakpoint in the breakpoints panel, or by right-clicking at the file/line of the breakpoint whilst in the correct process group and right-clicking and selecting delete breakpoint.
5.11 Loading And Saving Breakpoints
To load or save the breakpoints in a session right-click in the breakpoint panel and select the load/save option. Breakpoints will also be loaded and saved as part of the load/save session.
5.12 Default Breakpoints
DDT has a number of default breakpoints that will stop your program under certain conditions which are described below. You may enable/disable these while your program is running using the Control → Default Breakpoints menu.
5.12.1 Stop at exit/_exitWhen enabled, DDT will pause your program as it is about to end under normal exit conditions. DDT will pause both before and after any exit handlers have been executed. (Disabled by default.)
5.12.2 Stop at abort/fatal MPI ErrorWhen enabled, DDT will pause your program as it about to end after an error has been triggered. This includes MPI and non-MPI errors. (Enabled by default.)
5.12.3 Stop on throw (C++ exceptions)When enabled, DDT will pause your program whenever an exception is thrown (regardless of whether or not it will be caught). Due to the nature of C++ exception handling, you may not be able to step your program properly at this point. Instead, you should play your program or use the “Run to here” feature in DDT. (Disabled by default.)
5.12.4 Stop on catch (C++ exceptions)As above, but triggered when your program catches a thrown exception. Again, you may have trouble stepping your program. (Disabled by default.)
© 2009 Allinea Software 47

Distributed Debugging Tool v2.5
5.12.5 Stop at forkDDT will stop whenever your program forks (i.e. calls the fork system call to create a copy of the current process). The new process is added to your existing DDT session and can be debugged along with the original process.
5.12.6 Stop at execWhen your program calls the exec system call, DDT will stop at the main function (or program body for Fortran) of the new executable.
5.13 Synchronizing Processes
If the processes in a process group are stopped at different points in the code and you wish to re-synchronize them to a particular line of code this can be done by right-clicking on the line at which you wish to synchronize them to and selecting Run To Here. This effectively sets all the processes in the selected group running and puts a break point at the line at which you choose to synchronize the processes at, ignoring any breakpoints that the processes may encounter before they have synchronized at the specified line.
If you choose to synchronize your code at a point where all processes do not reach then the processes that cannot get to this point will run to the end.
Note: Though this ignores breakpoints while synchronizing the groups it will not actually remove the breakpoints.
Note: If a process is already at the line which you choose to synchronize at, the process will still be set to run. Be sure that your process will revisit the line, or alternatively synchronize to the line immediately after the current line.
5.14 Setting A Watch
Fig 34: The Watches Table
A watchpoint is a type of breakpoint that monitors a variable's value and causes a break once the value is changed.
Fig 30: Program Stopped At Watchpoint “beingWatched”
Unlike breakpoints, it is not set on a line in the Source Code Viewer. Instead you must drag a variable from either the Variables Window or the Evaluate Window into the Watches Table. It is not generally
© 2009 Allinea Software 48
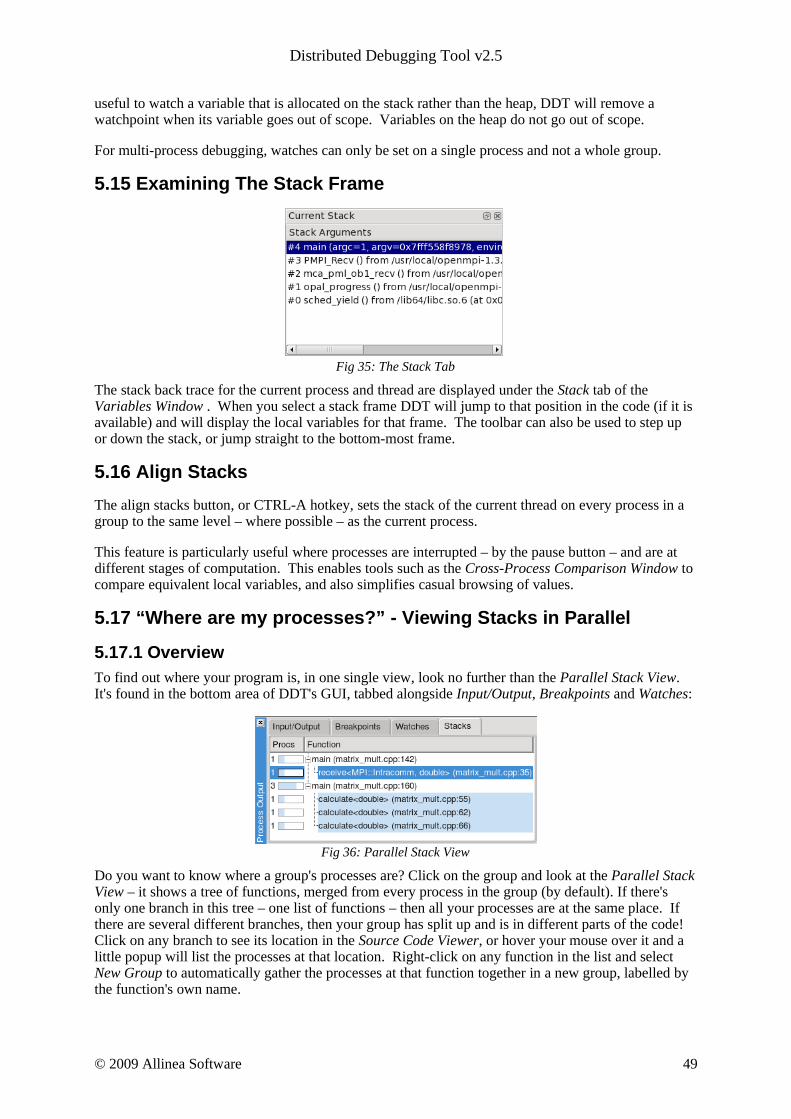
Distributed Debugging Tool v2.5
useful to watch a variable that is allocated on the stack rather than the heap, DDT will remove a watchpoint when its variable goes out of scope. Variables on the heap do not go out of scope.
For multi-process debugging, watches can only be set on a single process and not a whole group.
5.15 Examining The Stack Frame
Fig 35: The Stack Tab
The stack back trace for the current process and thread are displayed under the Stack tab of the Variables Window . When you select a stack frame DDT will jump to that position in the code (if it is available) and will display the local variables for that frame. The toolbar can also be used to step up or down the stack, or jump straight to the bottom-most frame.
5.16 Align Stacks
The align stacks button, or CTRL-A hotkey, sets the stack of the current thread on every process in a group to the same level – where possible – as the current process.
This feature is particularly useful where processes are interrupted – by the pause button – and are at different stages of computation. This enables tools such as the Cross-Process Comparison Window to compare equivalent local variables, and also simplifies casual browsing of values.
5.17 “Where are my processes?” - Viewing Stacks in Parallel
5.17.1 OverviewTo find out where your program is, in one single view, look no further than the Parallel Stack View. It's found in the bottom area of DDT's GUI, tabbed alongside Input/Output, Breakpoints and Watches:
Fig 36: Parallel Stack View
Do you want to know where a group's processes are? Click on the group and look at the Parallel Stack View – it shows a tree of functions, merged from every process in the group (by default). If there's only one branch in this tree – one list of functions – then all your processes are at the same place. If there are several different branches, then your group has split up and is in different parts of the code! Click on any branch to see its location in the Source Code Viewer, or hover your mouse over it and a little popup will list the processes at that location. Right-click on any function in the list and select New Group to automatically gather the processes at that function together in a new group, labelled by the function's own name.
© 2009 Allinea Software 49

Distributed Debugging Tool v2.5
The best way to learn about the Parallel Stack View is to simply use it to explore your program. Click on it and see what happens. Create groups with it, and watch what happens to it as you step processes through your code. The Parallel Stack View's ability to display and select large numbers of processes based on their location in your code is invaluable when dealing with moderate to large numbers of processes.
5.17.2 The Parallel Stack View in Detail The Parallel Stack View takes over much of the work of the Stack display, but instead of just showing the current process, this view combines the call trees (commonly called stacks) from many processes and displays them together. The call tree of a process is the list of functions (strictly speaking frames or locations within a function) that lead to the current position in the source code. For example, if main() calls read_input(), and read_input() calls open_file(), and you stop the program inside open_file(), then the call tree will look like this:
main() read_input() open_file()
If a function was compiled with debug information (usually -g) then DDT adds extra information, telling you the exact source file and line number that your code is on. Any functions without debug information are greyed-out and are not shown by default. Functions without debug information are typically library calls or memory allocation subroutines and are not generally of interest. To see the entire list of functions, right-click on one and choose Show Children from the pop-up menu.
You can click on any function to select it as the 'current' function in DDT. If it was compiled with debug information, then DDT will also display its source code in the main window, and its local variables and so on in the other windows.
One of the most important features of the Parallel Stack View is its ability to show the position of many processes at once. Right-click on the view to toggle between:
1. Viewing all the processes in your program at once2. Viewing all the processes in the current group at once (default)3. Viewing only the current process
The function that DDT is currently displaying and using for the variable views is highlighted in dark blue. Clicking on another function in the Parallel Stack View will select another frame for the source code and variable views. It will also update the Stack display, since these two controls are complementary. If the processes are at several different locations, then only the current process' location will be shown in dark blue. The other processes' locations will be shown in a light blue:
Fig 37: Current Frame Highlighting in Parallel Stack View
In the example above, the program's processes are at two different locations. One process is calling PMPI_Recv from the main function, at hello.c line 154, and the other 15 processes are all inside a function called func2, specifically at line 33 of hello.c. All these processes reached this line of func2 in the same way – first main called func1 on line 128 of hello.c, and then func1 called func2 on line 42 of hello.c. Clicking on any of these functions will show the exact line of source code, and will display the state of the variables in that function when the call was made.
There are two optional columns in the Parallel Stack View. The first, Procs shows the number of processes at each location. The second, Threads, shows the number of threads at each location. By default, only the number of processes is shown. Right-click to turn these columns on and off. Note that in a normal, single-threaded MPI application, each process has one thread and these two columns will show identical information.
© 2009 Allinea Software 50

Distributed Debugging Tool v2.5
Hovering the mouse over any function in the Parallel Stack View displays the full path of the filename, and a list of the process ranks that are at that location in the code:
Fig 38: Parallel Stack View tool tip
DDT is at its most intuitive when each process group is a collection of processes doing a similar task. The Parallel Stack View is invaluable in creating and managing these groups. Simply right-click on any function in the combined call tree and choose the New Group option. This will create a new process group that contains only the processes sharing that location in code. By default DDT uses the name of the function for the group, or the name of the function with the file and line number if it's necessary to distinguish the group further.
5.18 Browsing Source Code
Source code will be automatically displayed – when a process is stopped, when you select a process or change position in the stack.
DDT highlights lines of the source code to show where your program currently is. Lines that contain processes from the current group are shaded in that group's colour. Lines only containing processes from other groups are shaded in grey.
This pattern is repeated in the focus on process and thread modes. For example, when you focus on a process, DDT highlights lines containing that process in the group colour, and other processes from that group in grey.
DDT also highlights lines of code that are on the stack – functions that your program will return to when it has finished executing the current one. These are drawn with a faded look to distinguish them from the currently-executing lines.
You can hover the mouse over any highlighted line to see which processes/threads are currently on that line. This information is presented in a variety of ways, depending on the current focus setting:
Focus on Group
A list of groups that are on the selected line, along with the processes in them on this line, and a list of threads from the current process on the selected line.
Focus on Process
A list of the processes from the current group that are on this line, along with the threads from the current process on the selected line.
Focus on Thread
A list of threads from the current process on the selected line.
The tooltip distinguishes between processes and threads that are currently executing that line, and ones that are on the stack by grouping them under the headings “On the stack” and “On this line”.
Variables and Functions
© 2009 Allinea Software 51

Distributed Debugging Tool v2.5
Right-clicking on a variable or function name in the Source Code Viewer will make DDT check whether there is a matching variable or function, and then display extra information and options in a sub-menu.
In the case of a variable, the type and value are displayed, along with options to view the variable in the Cross-Process Comparison Window (CPC) or the Multi-Dimensional Array Viewer (MDA), or to drop the variable into the Evaluate Window – each of which are described in the next chapter.
Fig 39: Right-Click Menu – Variable Options
In the case of a function, it is also possible to add a breakpoint in the function, or to the source code of the function when available.
Fig 40: Right-Click Menu – Function Options
5.19 Simultaneously Viewing Multiple Files
DDT presents a tabbed pane view of source files, but occasionally it may be useful to view two files simultaneously – whilst tracking two different processes for example.
Inside the code viewing panel, right-click to split the view. This will bring a second tabbed pane which can be viewed beneath the first one. When viewing further files, the currently 'active' panel will display the file. Click on one of the views to make it active.
The split view can be reset to a single view by right-clicking in the code panel and deselecting the split view option.
© 2009 Allinea Software 52

Distributed Debugging Tool v2.5
Fig 41: Horizontal Alignment Of Multiple Source Files
5.20 Signal Handling
DDT will stop a process if it encounters one of the standard signals such as
SIGSEGV – Segmentation fault The process has attempted to access memory that is not valid for that process. Often this will be caused by reading beyond the bounds of an array, or from a pointer that has not been allocated yet. The DDT Memory Debugging feature may help to resolve this problem.
SIGFPE – Floating Point ExceptionThis is raised typically for integer division by zero, or dividing the most negative number by -1. Whether or not this occurs is Operating System dependent, and not part of the POSIX standard. Linux platforms will raise this.Note that floating point division by zero will not necessarily cause this exception to be raised, behaviour is compiler dependent. The special value Inf or -Inf may be generated for the data, and the process would not be stopped.
SIGPIPE - Broken PipeA broken pipe has been detected whilst writing.
SIGILL – Illegal Instruction
Note that SIGUSR1, SIGUSR2, SIGCHLD, SIG63 and SIG64 are passed directly through to the user process without being intercepted by DDT.
© 2009 Allinea Software 53
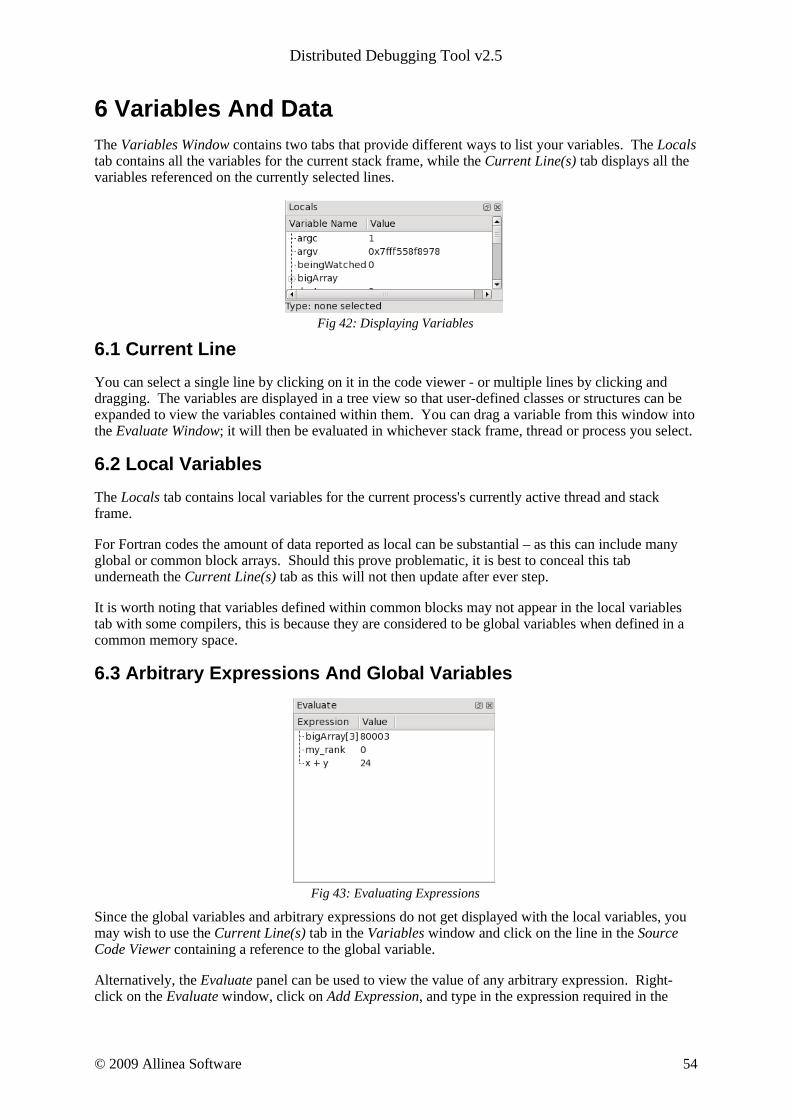
Distributed Debugging Tool v2.5
6 Variables And DataThe Variables Window contains two tabs that provide different ways to list your variables. The Locals tab contains all the variables for the current stack frame, while the Current Line(s) tab displays all the variables referenced on the currently selected lines.
Fig 42: Displaying Variables
6.1 Current Line
You can select a single line by clicking on it in the code viewer - or multiple lines by clicking and dragging. The variables are displayed in a tree view so that user-defined classes or structures can be expanded to view the variables contained within them. You can drag a variable from this window into the Evaluate Window; it will then be evaluated in whichever stack frame, thread or process you select.
6.2 Local Variables
The Locals tab contains local variables for the current process's currently active thread and stack frame.
For Fortran codes the amount of data reported as local can be substantial – as this can include many global or common block arrays. Should this prove problematic, it is best to conceal this tab underneath the Current Line(s) tab as this will not then update after ever step.
It is worth noting that variables defined within common blocks may not appear in the local variables tab with some compilers, this is because they are considered to be global variables when defined in a common memory space.
6.3 Arbitrary Expressions And Global Variables
Fig 43: Evaluating Expressions
Since the global variables and arbitrary expressions do not get displayed with the local variables, you may wish to use the Current Line(s) tab in the Variables window and click on the line in the Source Code Viewer containing a reference to the global variable.
Alternatively, the Evaluate panel can be used to view the value of any arbitrary expression. Right-click on the Evaluate window, click on Add Expression, and type in the expression required in the
© 2009 Allinea Software 54

Distributed Debugging Tool v2.5
current source file language. This value of the expression will be displayed for the current process and stack/thread, and is updated after every step.
Note: at the time of writing DDT does not apply the usual rules of precedence to logical Fortran expressions, such as “x .ge. 32 .and. x .le. 45”. For now, please bracket such expressions thoroughly: “(x .ge. 32) .and. (x .le. 45)”. It is also worth noting that although the Fortran syntax allows you to use keywords as variable names, DDT will not be able to evaluate such variables on most platforms. Please contact [email protected] if this is a problem for you.
6.3.1 Changing the language of an ExpressionOrdinarily, expressions in the Evaluate window and Locals/Current windows are evaluated in the language of the current stack frame. This may not always be appropriate – for example a pointer to user defined structure may be passed as value within a Fortran section of code, and you may wish to view the fields of the C structure. Alternatively, you may wish to view a global value in a C++ class whilst your process is in a Fortran subroutine.
You can change the language that DDT uses for your expressions by right clicking on the expression, and clicking “Change Type/Language” - selecting the appropriate language for the expression. To restore the default behaviour, change this back to “Auto”.
6.4 Help With Fortran Modules
An executable containing Fortran modules presents a special set of problems for developers:
if there are many modules, each of which contains many procedures and variables (each of which can have the same name as something else in a separate Fortran module), keeping track of which name refers to which entity can become difficult
when the Locals or Current Line(s) tabs (within the Variables window) display one of these variables, to which Fortran module does the variable belong?
how do you refer to a particular module variable in the Evaluate window? how do you quickly jump to the source code for a particular Fortran module procedure?
To help with this, DDT provides a Fortran Modules tab in the Project Navigator window.
When DDT begins a session, Fortran module membership is automatically found from the information compiled into the executable.
A list of Fortran modules found is displayed in a simple tree view within the Fortran Modules tab of the Project Navigator window.
Each of these modules can be “expanded” (by clicking on the '+' symbol to the left of the module name) to display the list of member procedures, member variables and the current values of those member variables.
Clicking on one of the displayed procedure names will cause the Source Code Viewer to jump to that procedure's location in the source code. In addition, the return-type of the procedure will be displayed at the bottom of the Fortran Modules tab – Fortran subroutines will have a return-type of VOID ().
Similarly, clicking on one of the displayed variable names will cause the type of that variable to be displayed at the bottom of the Fortran Modules tab.
A module variable can be dragged and dropped into the Evaluate window. Here, all of the usual Evaluate window functionality applies to the module variable. To help with variable identification in the Evaluate window, module variable names are prefixed with the Fortran module name and two colons ::.
© 2009 Allinea Software 55

Distributed Debugging Tool v2.5
Right-clicking within the Fortran Modules tab will bring up a context menu. For variables, choices on this menu will include sending the variable to the Evaluate window, the Multi-Dimensional Array Viewer and the Cross-Process Comparison Viewer.
Some caveats apply to the information displayed within the Fortran Modules tab:
1. The Fortran Modules tab will not be displayed if the underlying debugger does not support the retrieval and manipulation of Fortran module data
2. The Fortran Modules tab will display an empty module list if the Fortran modules debug data is not present or in a format understood by DDT.
Note: The GNU Fortran compilers (g77, gfortran) and the sun compiler suite do not provide Fortran modules debug data in a format understood by DDT.
One limitation of the Fortran Modules tab is that the modules debug data compiled into the executable does not include any indication of the module USE hierarchy (e.g. if module A USEs module B, the inherited members of module B are not shown under the data displayed for module A). Consequently, the Fortran Modules tab shows the module USE hierarchy in a flattened form, one level deep.
6.5 Viewing Array Data
Fortran users may find that it is not possible to view the upper bounds of an array. This is due to a lack of information from the compiler. In these circumstances DDT will display the array with a size of 0, or simply <unknown_bounds>. It is still possible to view the contents of the array however using the Evaluate window to view array(1), array(2), etc. as separate entries.
To tell DDT the size of the array right-click on the array and select the Edit Type... menu option. This will open a window like the one below. Enter the real type of the array in the New Type box.
Fig 44 : Edit Type window
Alternatively the MDA can be used to view the entire array.
6.6 Changing Data Values
In the Evaluate window, the value of an expression may be set by right-clicking and selecting Edit Value. This will allow you to change the value of the expression for the current process, current group, or for all processes.
Note: The variable must exist in the current stack frame for each process you wish to assign the value to.
6.7 Viewing Numbers In Different Bases
When you are viewing an integer numerical expression you may right-click on the value and use the View As sub menu to change which base the value is displayed in. The View As → Default option displays the value in its original (default) base.
© 2009 Allinea Software 56
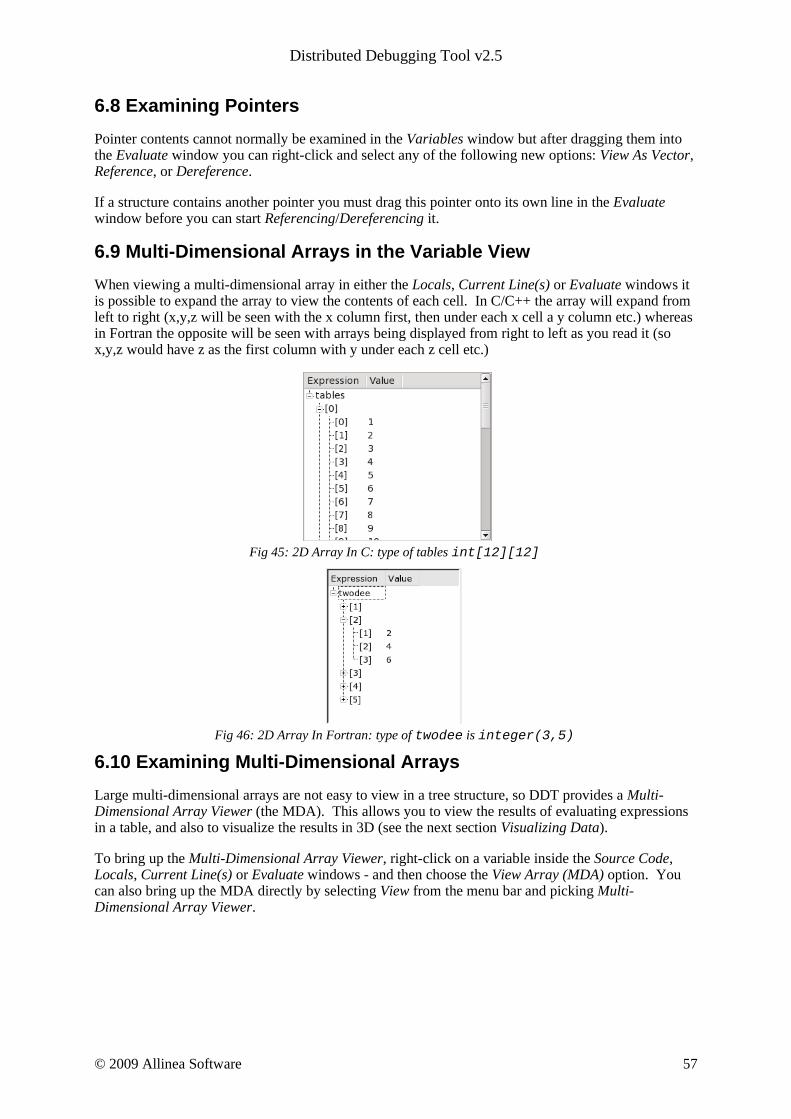
Distributed Debugging Tool v2.5
6.8 Examining Pointers
Pointer contents cannot normally be examined in the Variables window but after dragging them into the Evaluate window you can right-click and select any of the following new options: View As Vector, Reference, or Dereference.
If a structure contains another pointer you must drag this pointer onto its own line in the Evaluate window before you can start Referencing/Dereferencing it.
6.9 Multi-Dimensional Arrays in the Variable View
When viewing a multi-dimensional array in either the Locals, Current Line(s) or Evaluate windows it is possible to expand the array to view the contents of each cell. In C/C++ the array will expand from left to right (x,y,z will be seen with the x column first, then under each x cell a y column etc.) whereas in Fortran the opposite will be seen with arrays being displayed from right to left as you read it (so x,y,z would have z as the first column with y under each z cell etc.)
Fig 45: 2D Array In C: type of tables int[12][12]
Fig 46: 2D Array In Fortran: type of twodee is integer(3,5)
6.10 Examining Multi-Dimensional Arrays
Large multi-dimensional arrays are not easy to view in a tree structure, so DDT provides a Multi-Dimensional Array Viewer (the MDA). This allows you to view the results of evaluating expressions in a table, and also to visualize the results in 3D (see the next section Visualizing Data).
To bring up the Multi-Dimensional Array Viewer, right-click on a variable inside the Source Code, Locals, Current Line(s) or Evaluate windows - and then choose the View Array (MDA) option. You can also bring up the MDA directly by selecting View from the menu bar and picking Multi-Dimensional Array Viewer.
© 2009 Allinea Software 57

Distributed Debugging Tool v2.5
Fig 47: Multi-Dimensional Array Viewer
6.10.1 ExpressionAt the top of the MDA are controls allowing you to change the expression, and the range over which it is to be evaluated. You can view the whole array or any slice of data by entering an expression involving i , j , k , etc. (e.g. A($i,$j,$k) in Fortran, or myArray[$i][$j][$k] in C/C++).
If you brought up the MDA by right clicking on a variable, it will automatically set the expression and ranges based on the type of the variable or array in question, but these default values can be modified.
6.10.2 DimensionsDDT will create controls for each of the dimensions you enter in the expression. These controls allow you to specify the minimum and maximum indices (inclusive) for a particular dimension in the expression. You can also specify whether you want to plot the dimension horizontally (Columns) or vertically (Rows). Alternatively, the Aggregate option allows you to calculate the Sum, Product, Average, etc. over the dimension.
6.10.3 Aggregate FunctionIf you have selected the Aggregate option for one or more dimensions you need to specify the Aggregate Function , i.e. the function that will be applied to each set of values in the dimension.
© 2009 Allinea Software 58
Distributed Debugging Tool v2.5
6.10.4 FilterYou can choose to show only the values that meet a particular criterion. To enable this feature make sure the Filter check box is checked. Select an operator from the drop down list and finally a value for comparison.
6.10.5 ResultsClick the Evaluate button to populate the results table. Note: you may click the Cancel button to cancel the evaluation before it finishes.
You may scroll around the table using the horizontal and vertical scroll bars. When you scroll to a new position DDT will retrieve the values for that part of the table.
6.10.6 StatisticsThe Statistics tab displays information which may be of interest, such as the range of the values in the table, and the number of special numerical values, such as nan or inf.
6.10.7 ExportYou may export the contents of the results table to a file in the Comma Separated Values (CSV) format that can be plotted or analysed in your favourite spreadsheet program.
6.10.8 VisualisationIf your system is OpenGL-capable then a 2-D slice of an array, or table of expressions, may be displayed as a surface in 3-D space through the Multi-Dimensional Array (MDA) Viewer. You can only plot one or two dimensions at a time – if your table has more than two dimensions the Visualise button will be disabled. After filling the table of the MDA Viewer with values (see previous section), click Visualise to open a 3-D view of the surface. To display surfaces from two or more different processes on the same plot simply select another process in the main process group window and click Evaluate in the MDA window, and when the values are ready, click Visualize again. The surfaces displayed on the graph may be hidden and shown using the checkboxes on the right-hand side of the window.
The graph may be moved and rotated using the mouse and a number of extra options are available from the window toolbar.
The mouse controls are:
Hold down the left button and drag the mouse to rotate the graph.
Hold down the right button to zoom - drag the mouse forwards to zoom in and backwards to zoom out.
Hold the middle button and drag the mouse to move the graph.
Please note: DDT requires OpenGL to run. If your machine does not have hardware OpenGL support, software emulation libraries such as MesaGL are also supported.
© 2009 Allinea Software 59

Distributed Debugging Tool v2.5
Fig 48 : DDT Visualization
The toolbar and menu offer options to configure lighting and other effects, including the ability to save an image of the surface as it currently appears. There is even a stereo vision mode that works with red-blue glasses to give a convincing impression of depth and form. Contact Allinea if you need to get hold of some 3D glasses.
6.10.9 Auto UpdateIf you check the Auto Update check box the results table will be automatically updated as you switch between processes/threads and step through the code.
Note: you cannot use the Export or Visualise options while the Auto Update option is enabled.
6.11 Cross-Process and Cross-Thread Comparison
The Cross-Process Comparison and Cross-Thread Comparison windows can be used to analyze expressions calculated on each of the processes in the current process group. Each window displays information in three ways: raw comparison, statistically, and graphically.
© 2009 Allinea Software 60
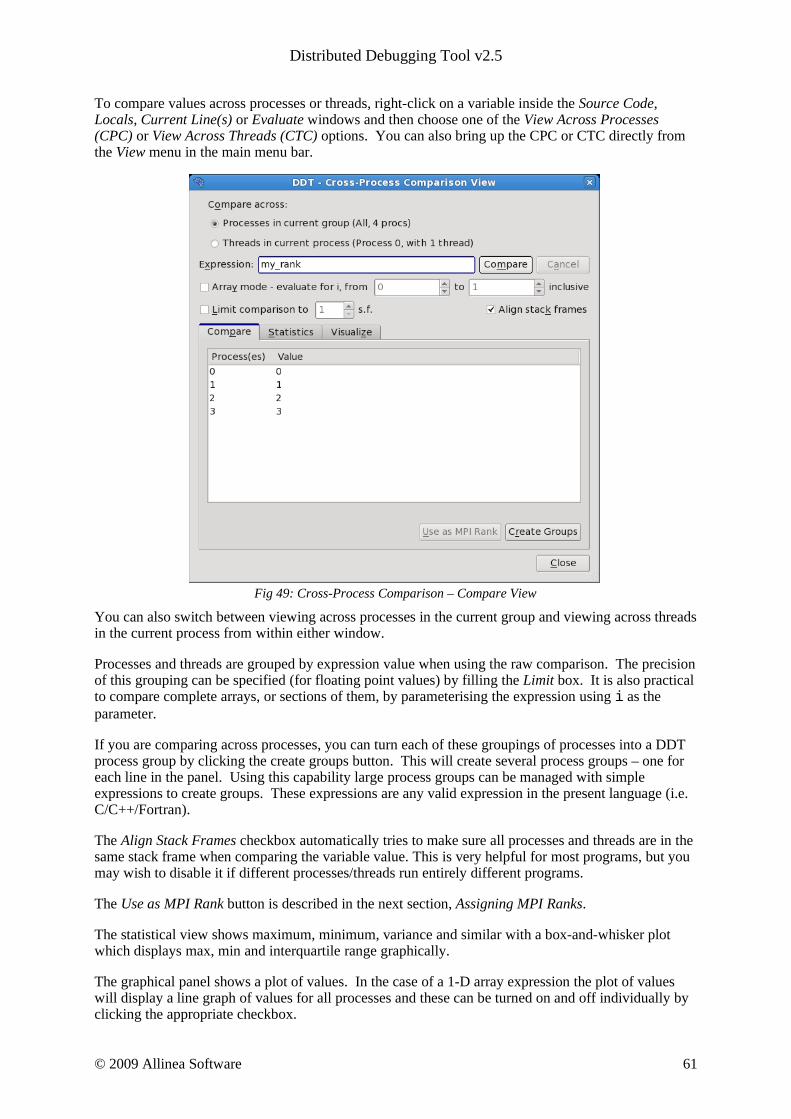
Distributed Debugging Tool v2.5
To compare values across processes or threads, right-click on a variable inside the Source Code, Locals, Current Line(s) or Evaluate windows and then choose one of the View Across Processes (CPC) or View Across Threads (CTC) options. You can also bring up the CPC or CTC directly from the View menu in the main menu bar.
Fig 49: Cross-Process Comparison – Compare View
You can also switch between viewing across processes in the current group and viewing across threads in the current process from within either window.
Processes and threads are grouped by expression value when using the raw comparison. The precision of this grouping can be specified (for floating point values) by filling the Limit box. It is also practical to compare complete arrays, or sections of them, by parameterising the expression using i as the parameter.
If you are comparing across processes, you can turn each of these groupings of processes into a DDT process group by clicking the create groups button. This will create several process groups – one for each line in the panel. Using this capability large process groups can be managed with simple expressions to create groups. These expressions are any valid expression in the present language (i.e. C/C++/Fortran).
The Align Stack Frames checkbox automatically tries to make sure all processes and threads are in the same stack frame when comparing the variable value. This is very helpful for most programs, but you may wish to disable it if different processes/threads run entirely different programs.
The Use as MPI Rank button is described in the next section, Assigning MPI Ranks.
The statistical view shows maximum, minimum, variance and similar with a box-and-whisker plot which displays max, min and interquartile range graphically.
The graphical panel shows a plot of values. In the case of a 1-D array expression the plot of values will display a line graph of values for all processes and these can be turned on and off individually by clicking the appropriate checkbox.
© 2009 Allinea Software 61

Distributed Debugging Tool v2.5
Fig 50: Cross-Process Comparison – Visualize View
6.12 Assigning MPI Ranks
Sometimes, DDT cannot detect the MPI rank for each of your processes. This might be because you are using an experimental MPI version, or because you have attached to a running program, or only part of a running program. Whatever the reason, it is easy to tell DDT what each process should be called.
To begin, choose a variable that holds the MPI world rank for each process, or an expression that calculates it. Use the Cross-Process Comparison window to evaluate the expression across all the processes. If the variable is valid, the Use as MPI Rank button will be enabled. Click on it; DDT will immediately relabel all its processes with these new values.
What makes a variable or expression valid? These criteria must be met:
1. It must be an integer2. Every process must have a unique number afterwards
These are the only restrictions. As you can see, there is no need to use the MPI rank if you have an alternate numbering scheme that makes more sense in your application. In fact you can relabel only a few of the processes and not all, if you prefer, so long as afterwards every process still has a unique number.
6.13 Viewing Registers
To view the values of machine registers on the currently selected process, select the Registers window from the View pull-down menu. These values will be updated after each instruction, change in thread or change in stack frame.
© 2009 Allinea Software 62

Distributed Debugging Tool v2.5
Fig 51: Register View
6.14 Interacting Directly With The Debugger
Fig 52: Raw Command Window
DDT provides a Raw Command window that will allow you to send commands directly to the debugger interface. This window bypasses DDT and its book-keeping - if you set a breakpoint here, DDT will not list this in the breakpoint list, for example.
Be careful with this window; we recommend you only use it where the graphical interface does not provide the information or control you require. Sending commands such as quit or kill may cause the interface to stop responding to DDT.
Each command is sent to a group of processes (selected from within the window box - not necessarily the current group). To communicate with a single process, create a new group and drag that process into it.
The Raw Command window will not work with running processes and requires all processes in the chosen group to be paused.
© 2009 Allinea Software 63

Distributed Debugging Tool v2.5
7 Program Input And OutputDDT collects and displays output from all processes under the Input/Output tab. Both standard output and error are shown, although on most MPI implementations, error is not buffered but output is and consequently can be delayed.
7.1 Viewing Standard Output And Error
Fig 53: Standard Output Window
The Input/Output tab is at the bottom of the screen (by default).
The output may be selected and copied to the X-clipboard.
7.2 Displaying Selected Processes
By right-clicking the mouse you can choose whether to view output for the current process, the current process group if no process is selected, or for all processes. You also have the option to copy a selection to the clipboard.
MPI users should note that most MPI implementations place their own restrictions on program output. Some buffer it all until MPI_Finalize is called, others may ignore it or send it all through to one process. If your program needs to emit output as it runs, Allinea suggest writing to a file.
All users should note that many systems buffer stdout but not stderr. If you do not see your stdout appearing immediately, try adding an fflush(stdout) or equivalent to your code.
7.3 Saving Output
By right-clicking on the text it is possible to save it to a file.
7.4 Sending Standard Input (DDT-MP)
DDT provides an Input File box in the Run window. Using this box you may select the file you wish to use as the input file. DDT will automatically insert the correct arguments to your MPI implementation to cause your file to be piped into your MPI job.
Alternatively in DDT you may enter the arguments directly in the MPIRun Arguments box . For example if using MPI directly from the command-line you would normally use an option to the mpirun such as -stdin filename , then you may add the same options to the MPIRun Arguments box when starting your DDT session in the Run window Advanced options.
It is also possible to enter input from the keyboard instead of from a file. Using this mode you would start your program as normal, then run to the point where your program executes its scanf function or similar. You should then change to the Input/Output tab and type in the input you wish to send, the program will then continue executing.
© 2009 Allinea Software 64
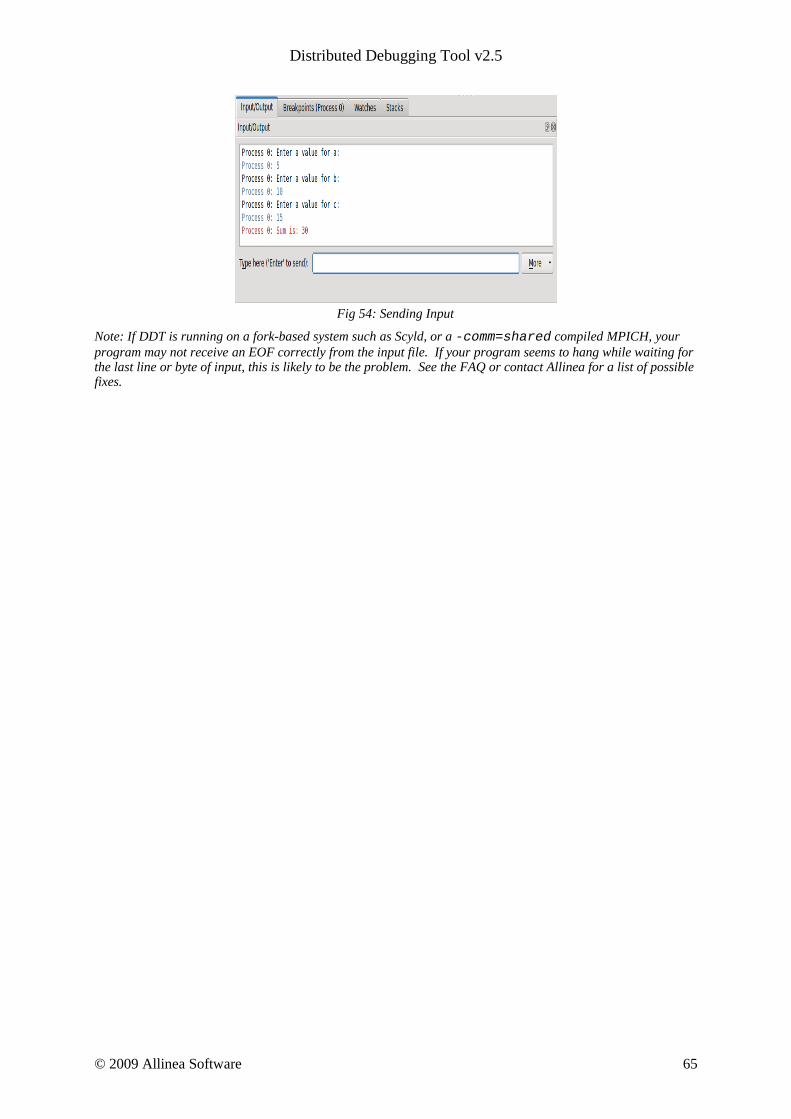
Distributed Debugging Tool v2.5
Fig 54: Sending Input
Note: If DDT is running on a fork-based system such as Scyld, or a -comm=shared compiled MPICH, your program may not receive an EOF correctly from the input file. If your program seems to hang while waiting for the last line or byte of input, this is likely to be the problem. See the FAQ or contact Allinea for a list of possible fixes.
© 2009 Allinea Software 65
Distributed Debugging Tool v2.5
8 Message Queues DDT's Message Queue debugging feature shows the status of the internal message buffers of MPI – for example showing the messages that have been sent by a process but not yet received by the target. This capability relies on the MPI implementation supporting this via a debugging support library: the majority of MPIs do this.
You can use DDT to detect common errors such as deadlock – where all processes are waiting for each other, or for detecting when messages are present that are unexpected, which can correspond to two processes disagreeing about the state of progress through a program.
8.1 Viewing The Message Queues
Open the Message Queues window by selecting Message Queues from the View menu.
When the window appears you can click Update to get the current queue information. Please note that this will stop all running processes. While DDT is gathering the data a window box will be displayed and you can cancel the request at any time.
DDT will automatically load the message queue support library from your MPI implementation (provided one exists). If it fails, an error message will be shown.
If an error is shown then the library may not exist, and you will need to compile the debug interface for your MPI implementation. In MPICH this is done by using -–enable-debug when running configure. LAM and OpenMPI 1.2.4 automatically compile the library.
It may also be necessary to specifically include the path to the support library in the LD_LIBRARY_PATH, or if this is not convenient you can set the environment variable, DDT_QUEUE_DLL, to the absolute pathname of the library itself (e.g. /usr/local/mpich-1.2.7/lib/libtvmpich.so).
If you experience problems connecting to the message queue library when attaching to a process see the FAQ for possible solutions.
© 2009 Allinea Software 66
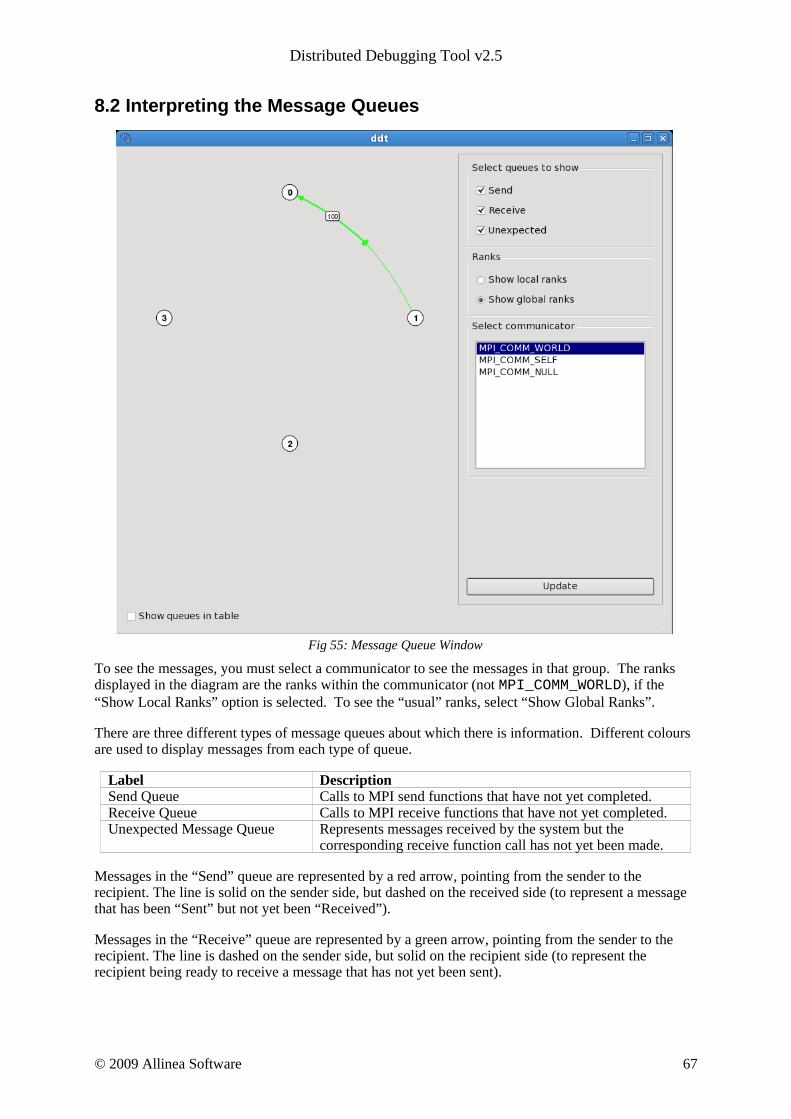
Distributed Debugging Tool v2.5
8.2 Interpreting the Message Queues
Fig 55: Message Queue Window
To see the messages, you must select a communicator to see the messages in that group. The ranks displayed in the diagram are the ranks within the communicator (not MPI_COMM_WORLD), if the “Show Local Ranks” option is selected. To see the “usual” ranks, select “Show Global Ranks”.
There are three different types of message queues about which there is information. Different colours are used to display messages from each type of queue.
Label DescriptionSend Queue Calls to MPI send functions that have not yet completed.Receive Queue Calls to MPI receive functions that have not yet completed.Unexpected Message Queue Represents messages received by the system but the
corresponding receive function call has not yet been made.
Messages in the “Send” queue are represented by a red arrow, pointing from the sender to the recipient. The line is solid on the sender side, but dashed on the received side (to represent a message that has been “Sent” but not yet been “Received”).
Messages in the “Receive” queue are represented by a green arrow, pointing from the sender to the recipient. The line is dashed on the sender side, but solid on the recipient side (to represent the recipient being ready to receive a message that has not yet been sent).
© 2009 Allinea Software 67

Distributed Debugging Tool v2.5
Messages in the “Unexpected” queue are represented by a dashed blue arrow, pointing from sender of the unexpected message to the recipient.
Please note that the quality and availability of message queue data can vary considerably between MPI implementations – some of the data can therefore be incomplete.
8.3 Deadlock
If you see a loop in the graph, it can be because of deadlock – every process waiting to receive from the preceding process in the loop. For synchronous communications (eg. MPI_Ssend) then this is invariably a problem. For other types of communication it can be the case (eg. with MPI_Send) that, for example, messages are “in the ether” or in some O/S buffer and the send part of the communication is complete but the receive hasn't started. If the loop persists after playing the processes and interrupting them again, this indicates a likely deadlock.
© 2009 Allinea Software 68

Distributed Debugging Tool v2.5
9 Memory DebuggingDDT has powerful parallel memory debugging capabilities. At the back end, DDT interfaces with a modified version of the dmalloc library. This powerful, cross-platform library intercepts memory allocation and deallocation calls and performs lots of complex heap- and bounds- checking. DDT makes it easy to use, even across tens or hundreds of parallel processes.
9.1 Configuration
To enable memory debugging within DDT, from the Run window click on the Advanced button to display the Memory Debugging options. You can turn memory debugging on and off with the Enable Memory Debugging checkbox. Next to this box is a Memory Debugging Settings button. Click on this to open the Memory Debugging Options window, shown here:
Fig 56: Memory Debugging Options
To use memory debugging with DDT you only need to understand the two controls at the top:
1. Preload the memory debugging library - when this is checked, DDT will automatically load the memory debugging library. This is usually the most appropriate setting. If you have linked against one of DDT's memory debugging libraries yourself then you can deselect this option. DDT can only preload the memory debugging library when you start a program through DDT and if it uses shared libraries. It is not possible to preload for statically-linked programs. You will have to re-link your program with the appropriate dmalloc library in ddt/lib/32 or ddt/lib/64 before running in DDT. If you attach to a running process, this setting has no effect. You can still use memory debugging when you attach, but you will have to manually link your program against one of the libdmalloc*.so versions in one of DDT's lib/32 and lib/64 directories and set the DMALLOC_OPTIONS environment variable before running your program.
© 2009 Allinea Software 69
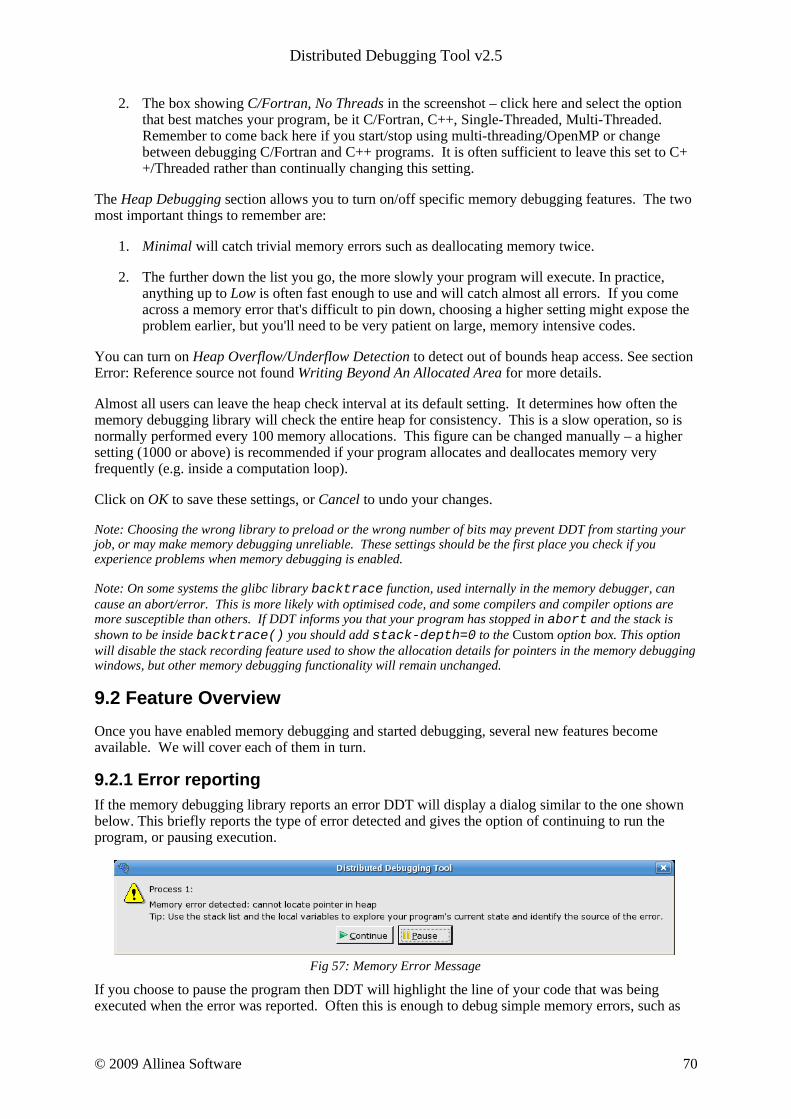
Distributed Debugging Tool v2.5
2. The box showing C/Fortran, No Threads in the screenshot – click here and select the option that best matches your program, be it C/Fortran, C++, Single-Threaded, Multi-Threaded. Remember to come back here if you start/stop using multi-threading/OpenMP or change between debugging C/Fortran and C++ programs. It is often sufficient to leave this set to C++/Threaded rather than continually changing this setting.
The Heap Debugging section allows you to turn on/off specific memory debugging features. The two most important things to remember are:
1. Minimal will catch trivial memory errors such as deallocating memory twice.
2. The further down the list you go, the more slowly your program will execute. In practice, anything up to Low is often fast enough to use and will catch almost all errors. If you come across a memory error that's difficult to pin down, choosing a higher setting might expose the problem earlier, but you'll need to be very patient on large, memory intensive codes.
You can turn on Heap Overflow/Underflow Detection to detect out of bounds heap access. See section Error: Reference source not found Writing Beyond An Allocated Area for more details.
Almost all users can leave the heap check interval at its default setting. It determines how often the memory debugging library will check the entire heap for consistency. This is a slow operation, so is normally performed every 100 memory allocations. This figure can be changed manually – a higher setting (1000 or above) is recommended if your program allocates and deallocates memory very frequently (e.g. inside a computation loop).
Click on OK to save these settings, or Cancel to undo your changes.
Note: Choosing the wrong library to preload or the wrong number of bits may prevent DDT from starting your job, or may make memory debugging unreliable. These settings should be the first place you check if you experience problems when memory debugging is enabled.
Note: On some systems the glibc library backtrace function, used internally in the memory debugger, can cause an abort/error. This is more likely with optimised code, and some compilers and compiler options are more susceptible than others. If DDT informs you that your program has stopped in abort and the stack is shown to be inside backtrace() you should add stack-depth=0 to the Custom option box. This option will disable the stack recording feature used to show the allocation details for pointers in the memory debugging windows, but other memory debugging functionality will remain unchanged.
9.2 Feature Overview
Once you have enabled memory debugging and started debugging, several new features become available. We will cover each of them in turn.
9.2.1 Error reportingIf the memory debugging library reports an error DDT will display a dialog similar to the one shown below. This briefly reports the type of error detected and gives the option of continuing to run the program, or pausing execution.
Fig 57: Memory Error Message
If you choose to pause the program then DDT will highlight the line of your code that was being executed when the error was reported. Often this is enough to debug simple memory errors, such as
© 2009 Allinea Software 70

Distributed Debugging Tool v2.5
freeing or dereferencing an unallocated variable, iterating past the end of an array and so on. If it is not clear, you may find yourself checking some of the variables and pointers referenced to see whether they're valid and which line they were allocated on, which brings us to:
9.2.2 Check ValidityAny of the variables or expressions in the Evaluate window can be right-clicked on to bring up a menu. If memory debugging is enabled, Check pointer Is Valid will be available. Clicking on this will pop up a message telling you whether or the expression points to valid memory allocated on the heap1.
Fig 58: Invalid memory message
This is particularly useful for checking function arguments, and key variables when things seem to be going awry. Of course, just because memory is valid doesn't mean it is the same type as you were expecting, or of the same size, or the same dimensions and so on. To help you discover this we take you back to the place the memory was first allocated with our next feature:
9.2.3 View Pointer DetailsAlong side Check Validity in the expression context menu is View Pointer Details. This will display the amount of memory allocated to the pointer and which part of your code originally allocated that memory:
Fig 59: Pointer details
Clicking on any of the stack frames will display the relevant section of your code, so you can see where you allocated the variable in the first place. Should you want to check dynamic values at the time of allocation, you can now place a breakpoint here and use the Restart Session function to re-run the program from the start while keeping your breakpoints, evaluated expressions and so on.
1 Memory allocated on the heap refers to memory allocated by malloc, ALLOCATE, new and so on. A pointer may also point to a local variable, in which case DDT will tell you it does not point to data on the heap. This can be useful, since a common error is taking a pointer to a local variable that later goes out of scope.
© 2009 Allinea Software 71
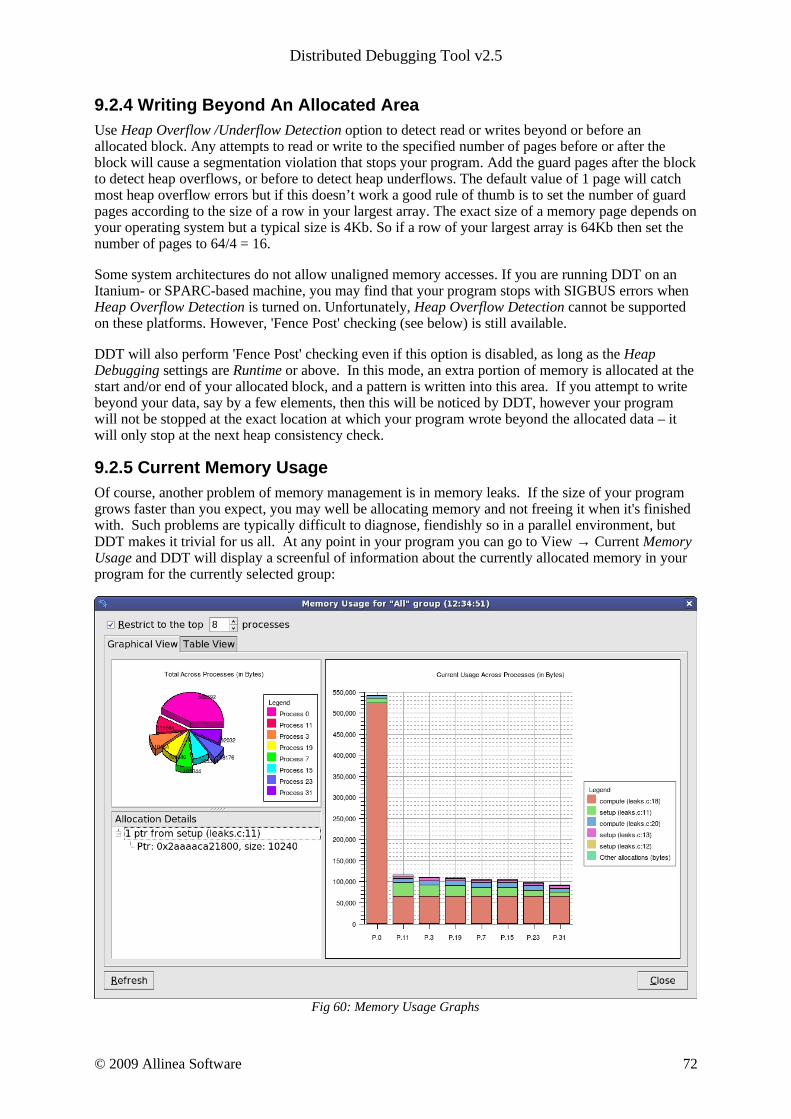
Distributed Debugging Tool v2.5
9.2.4 Writing Beyond An Allocated AreaUse Heap Overflow /Underflow Detection option to detect read or writes beyond or before an allocated block. Any attempts to read or write to the specified number of pages before or after the block will cause a segmentation violation that stops your program. Add the guard pages after the block to detect heap overflows, or before to detect heap underflows. The default value of 1 page will catch most heap overflow errors but if this doesn’t work a good rule of thumb is to set the number of guard pages according to the size of a row in your largest array. The exact size of a memory page depends on your operating system but a typical size is 4Kb. So if a row of your largest array is 64Kb then set the number of pages to 64/4 = 16.
Some system architectures do not allow unaligned memory accesses. If you are running DDT on an Itanium- or SPARC-based machine, you may find that your program stops with SIGBUS errors when Heap Overflow Detection is turned on. Unfortunately, Heap Overflow Detection cannot be supported on these platforms. However, 'Fence Post' checking (see below) is still available.
DDT will also perform 'Fence Post' checking even if this option is disabled, as long as the Heap Debugging settings are Runtime or above. In this mode, an extra portion of memory is allocated at the start and/or end of your allocated block, and a pattern is written into this area. If you attempt to write beyond your data, say by a few elements, then this will be noticed by DDT, however your program will not be stopped at the exact location at which your program wrote beyond the allocated data – it will only stop at the next heap consistency check.
9.2.5 Current Memory Usage Of course, another problem of memory management is in memory leaks. If the size of your program grows faster than you expect, you may well be allocating memory and not freeing it when it's finished with. Such problems are typically difficult to diagnose, fiendishly so in a parallel environment, but DDT makes it trivial for us all. At any point in your program you can go to View → Current Memory Usage and DDT will display a screenful of information about the currently allocated memory in your program for the currently selected group:
Fig 60: Memory Usage Graphs
© 2009 Allinea Software 72
Distributed Debugging Tool v2.5
The pie chart gives an at-a-glance comparison of the total memory allocated to each process. This gives an indication of the balance of memory allocations; any one process taking an unusually large amount of memory should be easily identifiable here.
The stacked bar chart on the right is where the most interesting information starts. Each process is represented by a bar, and each bar broken down into blocks of colour that represent the cumulative size of each allocation. Let's break that down a bit. Say your program contains a loop that allocates a hundred bytes that is never freed. That's not a lot of memory. But if that loop is executed ten million times, you're looking at a gigabyte of memory being leaked! This chart groups memory allocations by the return address. For practical purposes, this means that each block of colour represents the total memory currently allocated from a particular line of code. There are 6 blocks in total. The first 5 represent the 5 lines of code with the most memory allocated, and the 6th (at the top) represents the rest of the allocated memory, wherever it is from.
As you can see, large allocations (if your program is close to the end, or these grow, then they are severe memory leaks) show up as large blocks of colour. Typically, if the memory leak does not make it into the top 5 allocations under any circumstances then it isn't that big a deal – although if you are still concerned you can view the data in the Table View yourself.
If any block of colour interests you, click on it. This will display detailed information about the memory allocations that make it up in the bottom-left pane. Scanning down this list gives you a good idea of what size allocations were made, how many and where from. Clicking on any one of these will display the 'Pointer Details' view described above, showing you exactly where that pointer was allocated from in your code.
Some compilers wrap memory allocations inside many other functions. In this case DDT may find, for example, that all Fortran 90 allocations are inside the same routine. This can also happen if you have written your own wrapper for memory allocation functions. In these circumstances you will see one large block in the main view and will have to click on it to see the list of the memory allocations inside it. You can expect to see a smarter way around this in future versions!
Another valuable use of this window is to run the program for a while, refresh the window, run it for a bit longer, refresh the window and so on – if you pick the points at which to refresh (e.g. after units of work are complete) you can watch as the memory load of the different processes in your job fluctuates and will easily spot any areas that grow and grow – these are problematic leaks.
Naturally it occurs to you that some of this information is of interest for balance and other purposes. DDT goes one step further and provides you with our next feature:
© 2009 Allinea Software 73
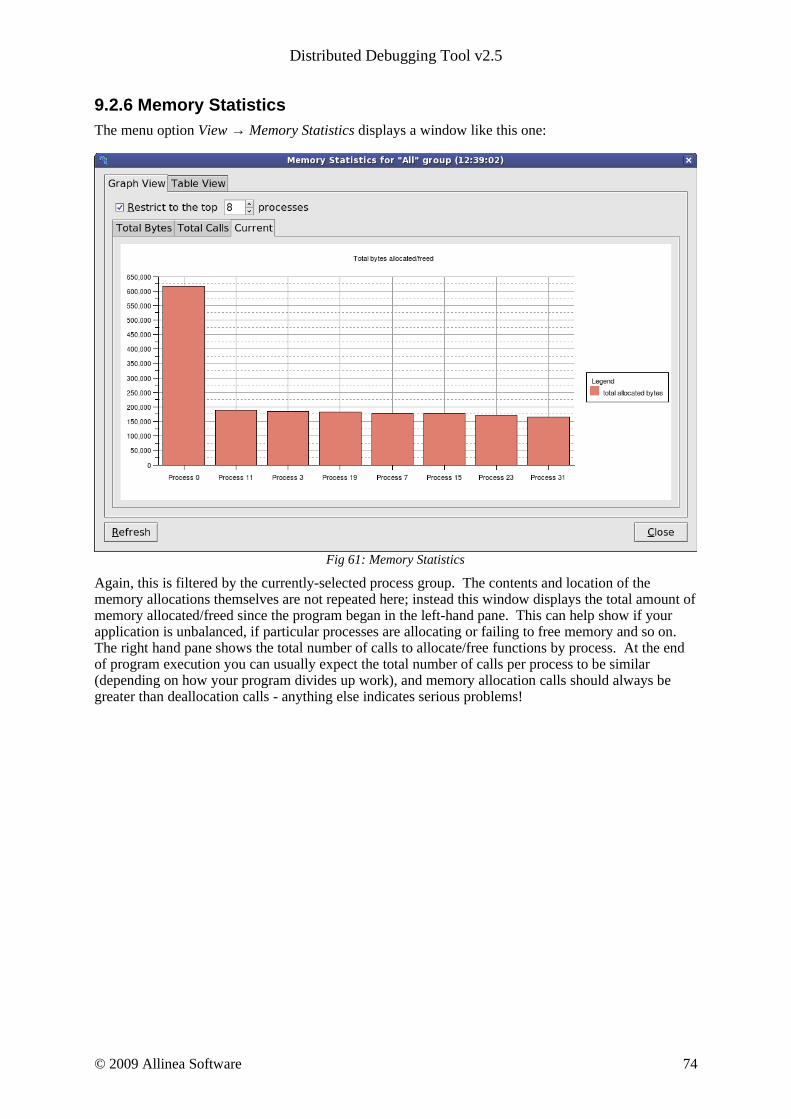
Distributed Debugging Tool v2.5
9.2.6 Memory Statistics
The menu option View → Memory Statistics displays a window like this one:
Fig 61: Memory Statistics
Again, this is filtered by the currently-selected process group. The contents and location of the memory allocations themselves are not repeated here; instead this window displays the total amount of memory allocated/freed since the program began in the left-hand pane. This can help show if your application is unbalanced, if particular processes are allocating or failing to free memory and so on. The right hand pane shows the total number of calls to allocate/free functions by process. At the end of program execution you can usually expect the total number of calls per process to be similar (depending on how your program divides up work), and memory allocation calls should always be greater than deallocation calls - anything else indicates serious problems!
© 2009 Allinea Software 74

Distributed Debugging Tool v2.5
10 Checkpointing
10.1 What Is Checkpointing?
A program's entire state (or a practical subset thereof) may be recorded to disk/memory as a checkpoint. The program may later be restored from the checkpoint and will resume execution from the recorded state.
Sometimes you are not sure what information you need to diagnose a bug until it is too late to get it. For example, a program may crash because a variable has a particular unexpected value. You want to know where the variable was set to that value but it is too late to set a watch on it. However if you have an earlier checkpoint of the program you can restore the checkpoint, set the watch, and then let it fail again.
10.2 Checkpoint Support In DDT
DDT supports two types of checkpointing:
● Run-time checkpoints are stored in memory. They are valid for the life time of a session but are lost when the session is ended.
● Persistent checkpoints are stored on disk. When you restore a persistent checkpoint DDT will start a new session.
DDT includes three checkpoint providers:
● The gdb checkpoint provider is available on all Linux platforms. It supports run-time checkpoints only. It has no special support for MPI programs so restoring a checkpoint across an MPI function call may fail. It does not support threads and will fail if your program is linked with a threading library (e.g. libpthread), even if your program is only using one thread at the time of the checkpoint.
● The BLCR checkpoint provider support persistent checkpoints for single process programs using the Berkley Lab Checkpoint/Restart library. Your program must be linked with the BLCR library. See section 4.2 Making an application checkpointable of the BLCR user guide.Note: if you restart a BLCR checkpoint made in DDT at the command line the process(es) will be stopped (as if they had been sent SIGSTOP). Pass the --cont option to cr_restart to avoid this.
● The experimental OpenMPI checkpoint provider supports persistent checkpoints and has explicit MPI support. To work with DDT the ompi-checkpoint and ompi-restart commands must support the -prd argument. You must pass some arguments to mpirun before you can checkpoint your OpenMPI program in DDT. Click the Advanced >> button in the Run window then add the arguments below to the MPIRun Arguments box: -am ft-enable-cr -gmca opal_cr_enable_prd 1
10.3 How To Checkpoint
To checkpoint your program, click the Checkpoint button on the tool bar . The first time you click the button you will be asked to select a checkpoint provider. If no checkpoint providers support the current MPI and debugger an error message will be displayed instead. See the previous section for a list of available checkpoint providers in DDT.
When the checkpoint has completed a new window will open displaying the name of the new checkpoint.
© 2009 Allinea Software 75

Distributed Debugging Tool v2.5
10.4 Restoring A Run-time Checkpoint
To restore a run-time checkpoint, click the Restore Checkpoint button on the tool bar . A new window will open with a list of available checkpoints. Select a checkpoint then click the Ok button.
The program state will be restored to the checkpoint. The Parallel Stack View, Locals View, etc. will all be updated with the new program state.
You may also restore a permanent checkpoint in the same way, however this will require a session restart and you will be warned accordingly.
10.5 Restoring A Persistent Checkpoint
To restore a persistent checkpoint, click the Restore Checkpoint button on the Welcome screen or select the Restore Checkpoint menu item from the Session menu. The Restore Checkpoint window will open.
Fig 62: Restore Checkpoint Window
You can select from a list of checkpoints automatically discovered by DDT. You may also choose to load a checkpoint from a file if the checkpoint you want to restore is not listed.
Once you have selected a checkpoint click the OK button. DDT will start a new session, restoring your program from your selected checkpoint.
© 2009 Allinea Software 76

Distributed Debugging Tool v2.5
11 Advanced Data Display and C++ STL Support With the DDT Wizard facility, DDT can take advantage of a user-provided shared-library (a.k.a. 'Wizard Library') to customise debugging behaviour. A Wizard Library can be used by DDT to improve the display of data structures ( Evaluate Expressions ) which are difficult to automatically navigate without specialist domain knowledge.
An example where this would be useful is for the display of C++ data structures which are templates, or involve inheritance (e.g. the C++ Standard Library container classes, the Trolltech Qt library, etc.). The interface is not specific to C++ and as such other languages, such as C, can work with the provided API.
DDT comes with a sample Wizard Library for the following C++ Standard Library classes:
• vector• deque• list• pair• set• multiset• map• multimap• string
Please note that if your compiler version differs from that which is standard with the DDT installation, you may need to recompile the wizard library. Source and the makefile are provided for this purpose with the DDT installation.
11.1 Using The Sample Wizard Library
The sample Wizard Library works with target programs compiled with GNU GCC.
To use the sample Wizard Library, send a variable to the Evaluate window. Either:
● select a line in the Source Code Viewer, right-click the mouse whilst the cursor is over the variable and choose the Add To Evaluations option, or
● select a line in the Source Code Viewer, select the variable in the Current Line(s) window and drag it into the Evaluate window, or
● select the variable in the Locals window and drag it into the Evaluate window
Once in the Evaluate window, select the variable and right-click the mouse. From the pop-up menu that appears, select the Evaluate with Wizard option.
This should lead to a re-display of the value of the variable, this time evaluated by the Wizard Library rather than by DDT itself.
To re-display the value of the variable as it was before the Wizard Library was used, right-click the variable again and select Evaluate without Wizard from the pop-up menu.
As an example, suppose a C++ program contained the following code:
string s = “hello world”;
Without evaluation by the Wizard Library, the Evaluate window displays something like the following:
© 2009 Allinea Software 77

Distributed Debugging Tool v2.5
Fig 63: Evaluating Without Wizard
After evaluation with the Wizard Library, the display changes to the following:
Fig 64: Evaluating With Wizard
11.2 Writing A Custom Wizard Library
Full source code for the sample Wizard Library is included with the DDT distribution. However, that is in excess of 1400 lines of code and comments. To explain how to write your own, the following sections will cover writing a small example Wizard Library that works just for the C++ Standard Library string class.
11.2.1 Theory Of OperationA Wizard Library must support the following interface:
typedef VirtualProcess*(*CurrentFun)(); extern "C"{ void* initialize(CurrentFun); Expression evaluate(const std::string&);}
When DDT has to evaluate an expression using the a Wizard Library, each evaluation causes a call to the Wizard Library's initialize() function followed by a call to the evaluate() function.
The initialize() function takes one argument, which is a pointer to a DDT function to call whenever the Wizard Library requires access to a handle for the current VirtualProcess .
The VirtualProcess handle is required by the Wizard Library's evaluate() function to allow it to make calls back into DDT in order to service the evaluation request.
The evaluate() function takes one argument, which is a constant-reference to a string containing the expression to be evaluated. The function must perform some calculations and record the results inside an Expression before returning that back to DDT.
DDT will examine the returned Expression and display the contents as the value of the expression in the Evaluate window.
© 2009 Allinea Software 78

Distributed Debugging Tool v2.5
So, an example of a minimal (and fairly useless) Wizard Library would look like:
#include <Interface.h> #include <iostream>#include <string> using namespace std; typedef VirtualProcess*(*CurrentFun)(); static CurrentFun current = 0; extern "C"{ void* initialize(CurrentFun _current); Expression evaluate(const string& e);} void* initialize(CurrentFun _current){ current = _current; return (void*) 1;} Expression evaluate(const string& e){ cerr << "evaluate(" << e << ")" << endl; Expression r(e); try { VirtualProcess* v(current()); if (v) { // Normally do some real work here, but just print out // a diagnostic for now ... cerr << "evaluate(" << e << "): acquired handle" << endl; } } catch (...) { cerr << "evaluate(" << e << "): unknown exception caught"<< endl; } cerr << "evaluate(" << e << "): return" << endl; return r;}
11.2.2 Compiling A New Wizard LibraryTwo steps are required to build a new Wizard Library:
● create an object file from the source code, and● link the object file and another, Expression.o , to create the Wizard Library
© 2009 Allinea Software 79

Distributed Debugging Tool v2.5
Expression.o contains the required code to handle Expression s and is provided with the DDT distribution.
The following example builds a Wizard Library using GNU g++:
$ g++ -c -pipe -Wall -W -g -fPIC -I. -o example1.o example1.cpp$ g++ -shared -Wl,-E -Wl,-soname,libwizardexample1.so.1 -o \ libwizardexample1.so.1.0.0 Expression.o example1.o
11.2.3 Using A New Wizard LibraryDDT uses an environment variable, DDT_WIZARD_DLL , to indicate the location of the Wizard Library (if any) to use. Assuming your Wizard Library has been compiled as above under {installation-directory} /wizard , the following Bourne-shell commands will DDT to run and use the new Wizard Library on an example your_test_program binary.
$ DDT_WIZARD_DLL={installation-directory}/wizard/libwizardexample1.so.1.0.0$ export DDT_WIZARD_DLL$ ddt your_test_program
11.2.4 The VirtualProcess InterfaceDDT provides the Wizard Library with a VirtualProcess interface for each target process being debugged. Although there may be many of these VirtualProcess instances, only the one corresponding to the current target process is available when the Wizard Library is invoked by DDT.
As seen in the example above, the current VirtualProcess is retrieved using the 'get current' function-pointer passed into the Wizard Library during DDT's call of the initialize() function:
... VirtualProcess* v(current()); if (v) ...
The VirtualProcess interface contains the following methods:
virtual std::string readType(const std::string expression); virtual Expression readExpression(const std::string expression);
readType() sends an expression back into DDT and returns a textual representation (according to the underlying debugger, that is) of the type associated with that expression. This can be used to determine how to process the original evaluate() request from DDT.
readExpression() send an expression back into DDT and returns an Expression representing the results of evaluating that expression.
The following code modifies a section of our first example, by reading the type of the expression sent in by DDT and then sending the expression back into DDT for evaluation. This is somewhat of a waste of time, in that it is acting as a 'Loopback Wizard' and adding no extra value!
ostream& operator<< (ostream& strm, const Expression& e){ strm << "{ name = '" << e.getDisplayName() << "', value = '" << e.getValue() << "' } "; return strm;}
© 2009 Allinea Software 80

Distributed Debugging Tool v2.5
Expression evaluate(const string& e){ cerr << "evaluate(" << e << ")" << endl; Expression r(e); try { VirtualProcess* v(current()); if (v) { string eType(v->readType(e)); cerr << "evaluate(" << e << "): type = '" << eType << "'" << endl; const Expression eResult(v->readExpression(e)); cerr << "evaluate(" << e << "): result = " << eResult << endl; r = eResult; } } catch (...) { cerr << "evaluate(" << e << "): unknown exception caught"<< endl; } cerr << "evaluate(" << e << "): return" << endl; return r;}
After building this example and running DDT on a test program containing the following code:
string s = "hello world"; int i = 42;
the following is output when both variables are evaluated with the 'Null Wizard':
evaluate(i)evaluate(i): type = 'int'evaluate(i): result = { name = 'i', value = '42' }evaluate(i): returnevaluate(s)evaluate(s): type = 'string'evaluate(s): result = { name = 's', value = '' }evaluate(s): return
DDT reports the type and value of the integer variable i , as you would expect. The type of the string variable s proves no problem either. However, the value of the string variable s can not be determined – which is why a Wizard Library is required!
11.2.5 The Expression ClassThe results of an evaluation are returned using the Expression class. Simple Expression s consist of a couple of strings:
© 2009 Allinea Software 81
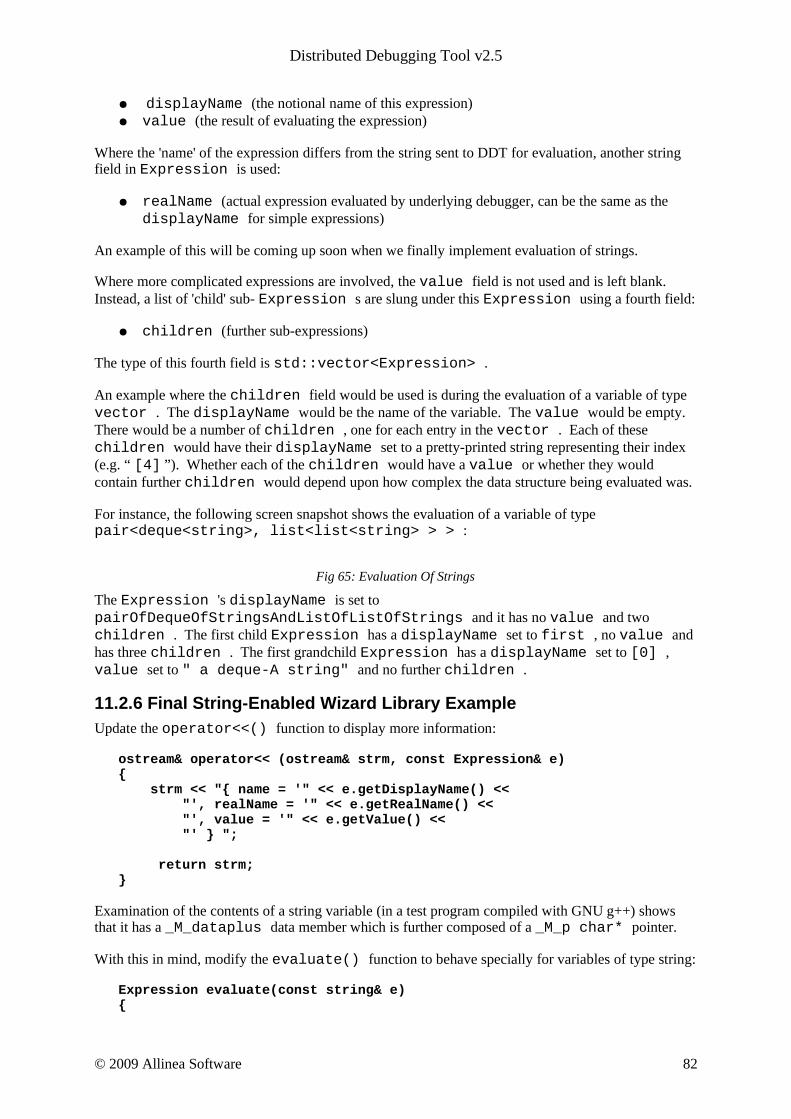
Distributed Debugging Tool v2.5
● displayName (the notional name of this expression) ● value (the result of evaluating the expression)
Where the 'name' of the expression differs from the string sent to DDT for evaluation, another string field in Expression is used:
● realName (actual expression evaluated by underlying debugger, can be the same as the displayName for simple expressions)
An example of this will be coming up soon when we finally implement evaluation of strings.
Where more complicated expressions are involved, the value field is not used and is left blank. Instead, a list of 'child' sub- Expression s are slung under this Expression using a fourth field:
● children (further sub-expressions)
The type of this fourth field is std::vector<Expression> .
An example where the children field would be used is during the evaluation of a variable of type vector . The displayName would be the name of the variable. The value would be empty. There would be a number of children , one for each entry in the vector . Each of these children would have their displayName set to a pretty-printed string representing their index (e.g. “ [4] ”). Whether each of the children would have a value or whether they would contain further children would depend upon how complex the data structure being evaluated was.
For instance, the following screen snapshot shows the evaluation of a variable of type pair<deque<string>, list<list<string> > > :
Fig 65: Evaluation Of Strings
The Expression 's displayName is set to pairOfDequeOfStringsAndListOfListOfStrings and it has no value and two children . The first child Expression has a displayName set to first , no value and has three children . The first grandchild Expression has a displayName set to [0] , value set to " a deque-A string" and no further children .
11.2.6 Final String-Enabled Wizard Library ExampleUpdate the operator<<() function to display more information:
ostream& operator<< (ostream& strm, const Expression& e){ strm << "{ name = '" << e.getDisplayName() << "', realName = '" << e.getRealName() << "', value = '" << e.getValue() << "' } "; return strm;}
Examination of the contents of a string variable (in a test program compiled with GNU g++) shows that it has a _M_dataplus data member which is further composed of a _M_p char* pointer.
With this in mind, modify the evaluate() function to behave specially for variables of type string:
Expression evaluate(const string& e){
© 2009 Allinea Software 82

Distributed Debugging Tool v2.5
cerr << "evaluate(" << e << ")" << endl; Expression r(e); try { VirtualProcess* v(current()); if (v) { string eType(v->readType(e)); cerr << "evaluate(" << e << "): type = '" << eType << "'" << endl; if (eType == "string") { Expression eResult(v->readExpression(e + "._M_dataplus._M_p")); // Want the pretty-printed name to be the name of // the string itself. eResult.setDisplayName(e); r = eResult; } else { const Expression eResult(v->readExpression(e)); r = eResult; } cerr << "evaluate(" << e << "): result = " << r << endl; } } catch (...) { cerr << "evaluate(" << e << "): unknown exception caught"<< endl; } cerr << "evaluate(" << e << "): return" << endl; return r;}
© 2009 Allinea Software 83

Distributed Debugging Tool v2.5
When DDT is run on the test program using a Wizard Library with this code, evaluating the integer and string variables leads to the following output:
evaluate(i)evaluate(i): type = 'int'evaluate(i): result = { name = 'i', realName = 'i', value = '1' }evaluate(i): returnevaluate(s)evaluate(s): type = 'string'evaluate(s): result = { name = 's', realName = 's._M_dataplus._M_p', value = '0x8061014 "hello world"' }evaluate(s): return
Notice that the Expression for the string evaluation has different values for the displayName and realName fields.
Single-stepping the test program yields the following output:
evaluate(i)evaluate(i): type = 'int'evaluate(i): result = { name = 'i', realName = 'i', value = '1' }evaluate(i): returnevaluate(s._M_dataplus._M_p)evaluate(s._M_dataplus._M_p): type = 'char *'evaluate(s._M_dataplus._M_p): result = { name = 's._M_dataplus._M_p', realName = 's._M_dataplus._M_p', value = '0x8061014 "hello world"' }evaluate(s._M_dataplus._M_p): return
What is happening here is that DDT has decided to re-evaluate each variable after the single-step operation has occurred, and has recognised that the string variable's displayName and realName differ. The realName string is sent back to the Wizard Library for evaluation and matched up to the original variable in the Evaluate window upon reply.
© 2009 Allinea Software 84
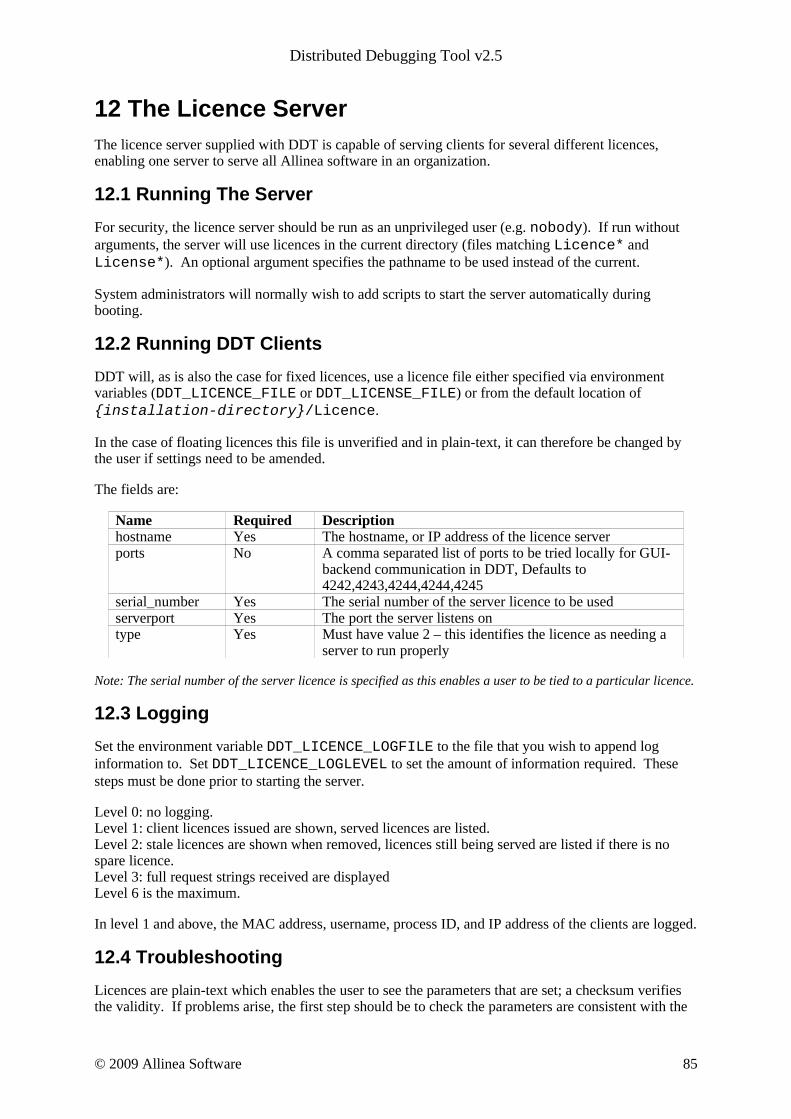
Distributed Debugging Tool v2.5
12 The Licence ServerThe licence server supplied with DDT is capable of serving clients for several different licences, enabling one server to serve all Allinea software in an organization.
12.1 Running The Server
For security, the licence server should be run as an unprivileged user (e.g. nobody). If run without arguments, the server will use licences in the current directory (files matching Licence* and License*). An optional argument specifies the pathname to be used instead of the current.
System administrators will normally wish to add scripts to start the server automatically during booting.
12.2 Running DDT Clients
DDT will, as is also the case for fixed licences, use a licence file either specified via environment variables (DDT_LICENCE_FILE or DDT_LICENSE_FILE) or from the default location of {installation-directory}/Licence.
In the case of floating licences this file is unverified and in plain-text, it can therefore be changed by the user if settings need to be amended.
The fields are:
Name Required Descriptionhostname Yes The hostname, or IP address of the licence serverports No A comma separated list of ports to be tried locally for GUI-
backend communication in DDT, Defaults to 4242,4243,4244,4244,4245
serial_number Yes The serial number of the server licence to be usedserverport Yes The port the server listens ontype Yes Must have value 2 – this identifies the licence as needing a
server to run properly
Note: The serial number of the server licence is specified as this enables a user to be tied to a particular licence.
12.3 Logging
Set the environment variable DDT_LICENCE_LOGFILE to the file that you wish to append log information to. Set DDT_LICENCE_LOGLEVEL to set the amount of information required. These steps must be done prior to starting the server.
Level 0: no logging.Level 1: client licences issued are shown, served licences are listed.Level 2: stale licences are shown when removed, licences still being served are listed if there is no spare licence.Level 3: full request strings received are displayedLevel 6 is the maximum.
In level 1 and above, the MAC address, username, process ID, and IP address of the clients are logged.
12.4 Troubleshooting
Licences are plain-text which enables the user to see the parameters that are set; a checksum verifies the validity. If problems arise, the first step should be to check the parameters are consistent with the
© 2009 Allinea Software 85

Distributed Debugging Tool v2.5
machine that is being used (MAC and IP address), and that, for example, the number of users is as expected.
12.5 Adding A New Licence
To add a new licence to be served, copy the file to the directory where the existing licences are served and restart the server. Existing clients should not experience disruption, if the restart is completed within a minute or two.
12.6 Examples
In this example, a dedicated licence server machine exists but uses the same filesystem as the client machines, and DDT is installed at /opt/software/ddt.
To run the licenceserver as nobody, serving all licences in /opt/software/ddt, and logging most events to the /tmp/licence.ddt.log.
% su – nobodyPassword:% export DDT_LICENCE_LOGFILE=/tmp/licence.ddt.log% export DDT_LICENCE_LOGLEVEL=2% cd /opt/software/ddt% ./bin/licenceserver /opt/software/ddt/ &% exit
Serving the floating licences from the same directory as a normal DDT installation is possible as the licence server will ignore licences that are not server licences.
If the server licence is file /opt/software/Licence.server.physics and is served by the machine server.physics.acme.edu , at port 4252, the licence would look like:
type=3serial_number=1014max_processes=48expires=2004-04-01 00:00:00support_expires=2004-04-01 00:00:00 mac=00:E0:81:03:6C:DBinterface=eth0debuggers=gdbserverport=4252 max_users=2beat=60retry_limit=4hash=P5I:?L,FS=[CCTB<IW4hash2=c18101680ae9f8863266d4aa7544de58562ea858
Then the client licence could be stored at /opt/software/Licence and contain:
type=2serial_number=1014hostname=server.physics.acme.eduserverport=4252
12.7 Example Of Access Via A Firewall
SSH forwarding can be used to reach machines that are beyond a firewall, for example the remote user would start:
ssh -C -L 4252:server.physics.acme.edu:4242 login.physics.acme.edu
© 2009 Allinea Software 86
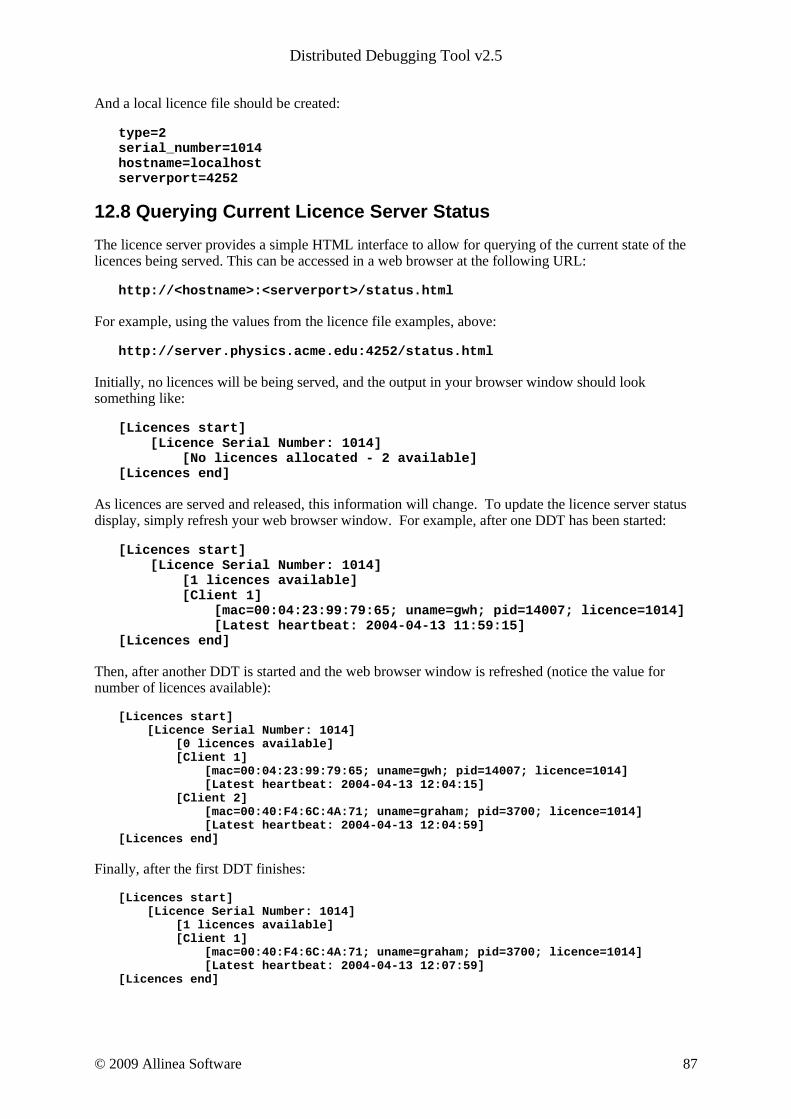
Distributed Debugging Tool v2.5
And a local licence file should be created:
type=2serial_number=1014hostname=localhostserverport=4252
12.8 Querying Current Licence Server Status
The licence server provides a simple HTML interface to allow for querying of the current state of the licences being served. This can be accessed in a web browser at the following URL:
http://<hostname>:<serverport>/status.html
For example, using the values from the licence file examples, above:
http://server.physics.acme.edu:4252/status.html
Initially, no licences will be being served, and the output in your browser window should look something like:
[Licences start] [Licence Serial Number: 1014] [No licences allocated - 2 available][Licences end]
As licences are served and released, this information will change. To update the licence server status display, simply refresh your web browser window. For example, after one DDT has been started:
[Licences start] [Licence Serial Number: 1014] [1 licences available] [Client 1] [mac=00:04:23:99:79:65; uname=gwh; pid=14007; licence=1014] [Latest heartbeat: 2004-04-13 11:59:15][Licences end]
Then, after another DDT is started and the web browser window is refreshed (notice the value for number of licences available):
[Licences start] [Licence Serial Number: 1014] [0 licences available] [Client 1] [mac=00:04:23:99:79:65; uname=gwh; pid=14007; licence=1014] [Latest heartbeat: 2004-04-13 12:04:15] [Client 2] [mac=00:40:F4:6C:4A:71; uname=graham; pid=3700; licence=1014] [Latest heartbeat: 2004-04-13 12:04:59][Licences end]
Finally, after the first DDT finishes:
[Licences start] [Licence Serial Number: 1014] [1 licences available] [Client 1] [mac=00:40:F4:6C:4A:71; uname=graham; pid=3700; licence=1014] [Latest heartbeat: 2004-04-13 12:07:59][Licences end]
© 2009 Allinea Software 87

Distributed Debugging Tool v2.5
12.9 Licence Server Handling Of Lost DDT Clients
Should the licence server lose communication with a particular instance of a DDT client, the licence allocated to that particular DDT client will be made unavailable for new DDT clients until a certain timeout period has expired. The length of this timeout period can be calculated from the licence server file values for beat and retry_limit:
lost_client_timeout_period = (beat seconds) * (retry_limit + 1)
So, for the example licence files above, the timeout period would be:
60 * (4 + 1) = 300 seconds
During this timeout period, details of the 'lost' DDT client will continue to be output by the licence server status display. As long as additional licences are available, new DDT clients can be started. However, once all of these additional licences have been allocated, new DDT clients will be refused a licence while this timeout period is active.
After this timeout period has expired, the licence server status will continue to display details of the 'lost' DDT client until another DDT client is started. The licence server will grant a licence to the new DDT client and the licence server status display will then reflect the details of the new DDT client.
© 2009 Allinea Software 88

Distributed Debugging Tool v2.5
13 Using and Writing Plugins for DDT
13.1 Supported Plugins
At the time of release, DDT supports plugins for two MPI correctness-checking libraries:
● Intel Message Checker, part of the Intel Trace Analyzer and Collector (Commercial with free evaluation: http://www.intel.com/cd/software/products/asmo-na/eng/306321.htm) version 7.1
● Marmot (Open source: http://www.hlrs.de/organization/amt/projects/marmot), support expected in version 2.2 and above.
13.2 Installing a Plugin
To install a plugin, locate the XML DDT plugin file provided by your application vendor and copy it to:
{ ddt-installation directory}/plugins/
It will then appear in DDT's list of available plugins on the DDT - Run dialog.
Each plugin takes the form of an XML file in this directory. These files are usually provided by third-party vendors to enable their application to integrate with DDT. A plugin for the Intel Message Checker (part of the Intel Trace Analyser and Collector) is included with the DDT distribution.
13.3 Using a Plugin
To activate a plugin in DDT, simply click on the checkbox next to it in the window, then run your application. Plugins may automatically perform one or more of the following actions:
● Load a particular dynamic library into your program
● Pause your program and show a message when a certain event such as a warning or error occurs
● Start extra, optionally hidden MPI processes (see the Writing Plugins section for more details on this)
If DDT says it cannot load one of the plugins you have selected, check that the application is correctly installed, and that the paths inside the XML plugin file match the installation path of the application.
13.4 Writing a Plugin
Writing a plugin for DDT is easy. All that is needed is an XML plugin file that looks something like this:
<plugin name="Sample v1.0" description = "A sample plugin that demonstrates DDT's plugin interface."> <preload name="samplelib1" /> <preload name="samplelib2" /> <environment name="SUPPRESS_LOG" value="1" /> <environment name="ANOTHER_VAR" value="some value" /> <breakpoint location="sample_log" action="log" message_variable="message" /> <breakpoint location="sample_err" action="message_box" message_variable="message" />
© 2009 Allinea Software 89

Distributed Debugging Tool v2.5
<extra_control_process hide="last" /> </plugin>
Only the surrounding “plugin” tag is required – all the other tags are entirely optional. A complete description of each appears in the table below. If you are interested in providing a plugin for DDT as part of your application bundle, we will be happy to provide you with any assistance you need getting up and running. Contact [email protected] for more information.
Tag Attribute Descriptionplugin name The plugin's unique name. This should
include the application/library the plugin is for, and its version. This is shown in the DDT – Run dialog.
plugin description A short snippet of text to describe the purpose of the plugin/application to the user. This is also shown in the DDT – Run dialog.
preload name Instructs DDT to preload a shared library of this name into the user's application. The shared library must be locatable using LD_LIBRARY_PATH, or the OS will not be able to load it.
environment name Instructs DDT to set a particular environment variable before running the user's application.
environment value The value that this environment variable should be set to.
breakpoint location Instructs DDT to add a breakpoint at this location in the code. The location may be in a preloaded shared library (see above). Typically this will be a function name, or a fully-qualified C++ namespace and class name. C++ class members must include their signature and be enclosed in single quotes, e.g.'MyNamespace::DebugServer::breakpointOnError(char*)'
breakpoint action Only “message_box” is supported in this release. Other settings will cause DDT to stop at the breakpoint but take no action.
breakpoint message_variable A char* or const char* variable that contains a message to be shown to the user. DDT will group identical messages from different processes together before displaying them to the user in a message box.
extra_control_process hide Instructs DDT to start one more MPI process than the user requested. The optional 'hide' attribute can be “first” or “last”, and will cause DDT to hide the first or last process in MPI_COMM_WORLD from the user. This process will be allowed to execute whenever at least one other MPI process is executing, and messages or breakpoints (see above) occurring in this process will appear to come from all processes at once.This is only necessary for tools such as Marmot that use an extra MPI process to perform various runtime checks on the rest of the MPI program.
© 2009 Allinea Software 90

Distributed Debugging Tool v2.5
A Supported PlatformsA full list of supported platforms and configurations is maintained on the Allinea website. It is likely that MPI distributions supported on one platform will work immediately on other platforms.
Platform Operating Systems MPI CompilersIntel/AMD x86AMD Opteron (32+64) Intel Itanium 2Intel EM64TIBM Power
RHEL 4, 5; SUSE 9, 10; SLES 9, 10; Fedora 4, 5; Ubuntu 8.04
All known MPIs – including but not limited to:SGI Altix , Bproc , Bull MPI 1 and 2, LAM-MPI, MPICH, Myricom MPICH-GM and MPICH-MX, OpenMPI, Quadrics MPI, Scali MPI Connect, SCore , Scyld, Intel MPI, Slurm MVAPICH (IBGD 1.8.1 and above)
GNU, Absoft , Intel, Pathscale, and Portland
Cell Broadband Engine Fedora Core 7 As above Cell BE SDK 3.0
IBM Power AIX 5.2 and above IBM PE, MPICH Native, GNU
Sun Sparc Solaris 9 and above Sun Clustertools 5 and above
Native – Studio 11
Sun Solaris Opteron Solaris 10 and above Sun Clustertools 6, 7 and MPICH
Native – Studio 11/12, GNU
Cray XT4 SLES 9, 10 (frontend)
Native
Blue Gene/P SLES 10 (frontend) Native Native, GNUNEC SX8 SUPER-UX 15.1
(backend only)Native Native
© 2009 Allinea Software 91

Distributed Debugging Tool v2.5
B MPI Distribution Notes and Known IssuesThis appendix has brief notes on many of the MPI distributions supported by DDT. Advice on settings and problems particular to a distribution are given here.
B.1 Bproc
By default, the p4 interface will be chosen. If you wish to use GM (Myrinet), place -gm in the MPIRun Arguments, and this will be used instead. Select Generic as the MPI implementation.
B.2 Bull MPI
There are two versions of MPI supported for Bull: MPI 1, and MPI 2. Inifiniband users should always select Bull MPI 2, other users will need to check which version of Bull MPI is installed.
Select Bull MPI or Bull MPI 1 for Bull MPI 1, or Bull MPI 2 for Bull MPI 2from the MPI implementations list. In the Advanced settings, you may also wish to specify the partition that you wish to use – by adding
-p partition_name
You should ensure that prun, the command used to launch jobs, is in your PATH before starting DDT.
B.3 HP MPI
Select HP MPI as the MPI implementation.
A number of HP MPI users have reported a preference to using mpirun -f jobconfigfile instead of mpirun -np 10 a.out for their particular system. It is possible to configure DDT to support this configuration – using the support for batch (queuing) systems.
The role of the queue template file is analogous to the -f jobconfigfile.
If your job config file normally contains:
-h node01 -np 2 a.out-h node02 -np 2 a.out
Then your template file should contain:
-h node01 -np PROCS_PER_NODE_TAG /usr/local/ddt/bin/ddt-debugger-h node02 -np PROCS_PER_NODE_TAG /usr/local/ddt/bin/ddt-debugger
and the Submit Command box should be filled with
mpirun -f
Select the Template uses NUM_NODES_TAG and PROCS_PER_NODE_TAG radio button. After this has been configured by clicking OK, you will be able to start jobs. Note that the Run button is replaced with Submit, and that the number of processes box is replaced by Number of Nodes.
B.4 Intel MPI
Select Intel MPI from the MPI implementation list. DDT has been tested with Intel MPI 2.0 and 3.0.
© 2009 Allinea Software 92

Distributed Debugging Tool v2.5
DDT also supports the Intel Message Checker tool that is included in the Intel Trace Analyser and Collector software. A plugin for the Intel Trace Analyser and Collector version 7.1 is provided in DDT's plugins directory. Once you have installed the Intel Trace Analyser and Collector, you should make sure that the following directories are in your LD_LIBRARY_PATH:
{path to intel install directory}/itac/7.1/lib
{path to intel install directory}/itac/7.1/slib
The Intel Message Checker only works if you are using the Intel MPI. Make sure Intel's mpiexec is in your path, and that your application was compiled against Intel's MPI, then launch DDT, check the plugin checkbox and debug your application as usual. If one of the above steps has been missed out, DDT may report an error and say that the plugin could not be loaded.
Once you are debugging with the plugin loaded, DDT will automatically pause the application whenever Intel Message Checker detects an error. The Intel Message Checker log can be seen in the standard error (stderr) window.
Note that the Intel Message Checker will abort the job after 1 error by default. You can modify this by adding -genv VT_CHECK_MAX_ERRORS 0 to the MPIRun arguments in the advanced section of DDT's Run dialog – see Intel's documentation for more details on this and other environment variable modifiers.
B.5 LAM/MPI
No reported issues with this distribution. Select LAM-MPI as the MPI implementation.
B.6 MPICH p4
Choose MPICH Standard as the MPI implementation.
On some AIX systems you may need to use Generic instead.
B.7 MPICH p4 mpd
This daemon based distribution passes a limited set of arguments and environments to the job programs. If the daemons do not start with the correct environment for DDT to start, then the environment passed to the ddt-debugger backend daemons will be insufficient to start.
It should be possible to avoid these problems if .bashrc or .tcshrc/.cshrc are correct. However, if unable to resolve these problems, you can pass HOME and LD_LIBRARY_PATH, plus any other environment variables that you need, such as LM_LICENSE_FILE if you're using the Portland debugger, manually. This is achieved by adding -MPDENV -HOME= {homedir} LD_LIBRARY_PATH= {ld-library-path} to the Arguments area of the Run window. Alternatively from the command-line you may simply write:
$DDT {program-name} -MPDENV- HOME=$HOME LD_LIBRARY_PATH=$LD_LIBRARY_PATH
and your shell will fill in these values for you.
Choose MPICH Standard as the MPI implementation.
B.8 MPICH-GM
No known issues.
© 2009 Allinea Software 93

Distributed Debugging Tool v2.5
B.9 IBM PE
If you are able to use poe outside of a queuing system, set the environment variable DDTMPIRUN to the full pathname of poe. If your poe does not take the standard mpirun arguments (e.g. -np xx), it is advisable to write a wrapper script called mpirun which will invoke poe with the arguments you want.
In the present release of DDT, it is sometimes necessary to set the DDT_DONT_GET_RANK variable to 1 for MPI debugging. Without this, processes will not be able to start.
A sample Loadleveller script, which starts debugging jobs on IBM AIX (POE) systems is included in the {installation-directory} /templates directory. When working with Loadleveller, it is necessary to set the environment variable DDT_IGNORE_MPI_OUTPUT to 1 .
Select IBM PE as the MPI implementation.
B.10 MVAPICH
Versions of the Mellanox IBGD prior to 1.8.1 do not work with debuggers, due to a kernel bug with Infiniband drivers. DDT has been tested successfully with IBGD 1.8.1 running mvapich 0.9.5. Select Generic as the MPI interface. You will need to specify the hosts on which to launch your job to mvapich's mpirun by using the -hostfile filename or individually as per the mvapich documentation in the MPIrun Arguments box, which is available by pressing the Advanced button on the Run window.
B.11 NEC MPI
This implementation has been known to forcefully kill DDT when the MPI job finishes. This makes it impossible to use DDT's Session → Restart. If this affects you, please contact [email protected].
Select Generic as the MPI implementation.
B.12 OpenMPI
DDT has been tested with OpenMPI 1.0.1, 1.1, 1.2, 1.2.4. Select OpenMPI from the list of MPI implementations.
Message Queues are not supported by this MPI in version 1.2 or earlier. To use Message Queue debugging, please install OpenMPI 1.2.4 or later.
OpenMPI 1.2.4 must be compiled with “--enable-debug” as a configure option, but this is expected to not be necessary for any subsequent versions of OpenMPI.
The version of OpenMPI packaged with Ubuntu has the OpenMPI debug libraries stripped. This prevents the Message Queues feature of DDT from working.
If OpenMPI is compiled with optimisations enabled some of the functions that makes up the debug interface between OpenMPI and DDT may be optimised away entirely. If you think this may be happening to you try using the OpenMPI (Compatibility) MPI implementation setting instead.
B.13 Quadrics MPI
Older versions of the Quadrics MPI stack contained a bug that prevented DDT from starting large jobs reliably. If you experience problems using DDT on this platform, please make sure you have installed the latest version, and then contact [email protected].
© 2009 Allinea Software 94

Distributed Debugging Tool v2.5
Select Generic as the MPI implementation.
B.14 SCore
DDT is supported by SCore versions 5.8.2 and above, some earlier versions can also support DDT by applying a minor patch. DDT can be launched either within a scout session, or using a queue.
For versions up to and including 5.8.2 a glitch in SCore prevents arguments being passed to programs during debugging; a patch is available for this which is easy to apply. Contact Allinea if this issue affects you.
There are several methods to start DDT on an SCore system and your administrator should recommend one for use with your cluster. Allinea recommend using a Sun GridEngine and provide a queue template file for this system. However, we have found the following method to work on single-user mode clusters:
1. Make sure your home directory is mounted on each cluster node
2. Create a host file containing a list of the computer nodes your intend to run the job on
3. Start a scout session: scout -F host.list
4. Start DDT at the prompt: ddt
5. Make sure DDT is configured for SCore mode, with the correct number of processes. Use the MPI Argument nodes=MxN to specify the number of processes per node and number of nodes, as documented for scrun. Make sure to multiply these numbers when selecting the number of processes for DDT! Both must be specified for single-user mode Score systems
6. Click on Start
Note that the first release of Score 5.6.0 shipped with a flaw in scrun.exe – this prevents DDT shutting down a job correctly. The scout session must be closed and reopened between DDT sessions on these systems. This only affects single-user mode Score 5.6.0 installs.
If environment variables are not being propagated to remote nodes, we suggest moving {installation-directory}/bin/ddt-debugger to {installation-directory}/bin/ddt-debugger.bin, and creating a replacement executable shell script which sets the correct environment variables before running ddt-debugger.bin – for example:
#!/bin/sh. ./bashrc{installation-directory}/bin/ddt-debugger.bin $*
Choose SCore as the MPI implementation.
Note also that the number of processors chosen must equal the number of processors declared in the Scout host file; if you choose fewer, or more, the job will not start in DDT.
To attach to an SCore job, DDT can in some circumstances be blocked by the signals ( SIGSTOP ) which SCore sends to the user job. If this occurs, the progress bar will stop at some point whilst attaching and make no further progress. To resolve the problem, send a SIGCONT to all processes in the job. This can be achieved by the following command:
doall kill SIGCONT -1
where doall is a command which executes the kill on every node in the job.
© 2009 Allinea Software 95
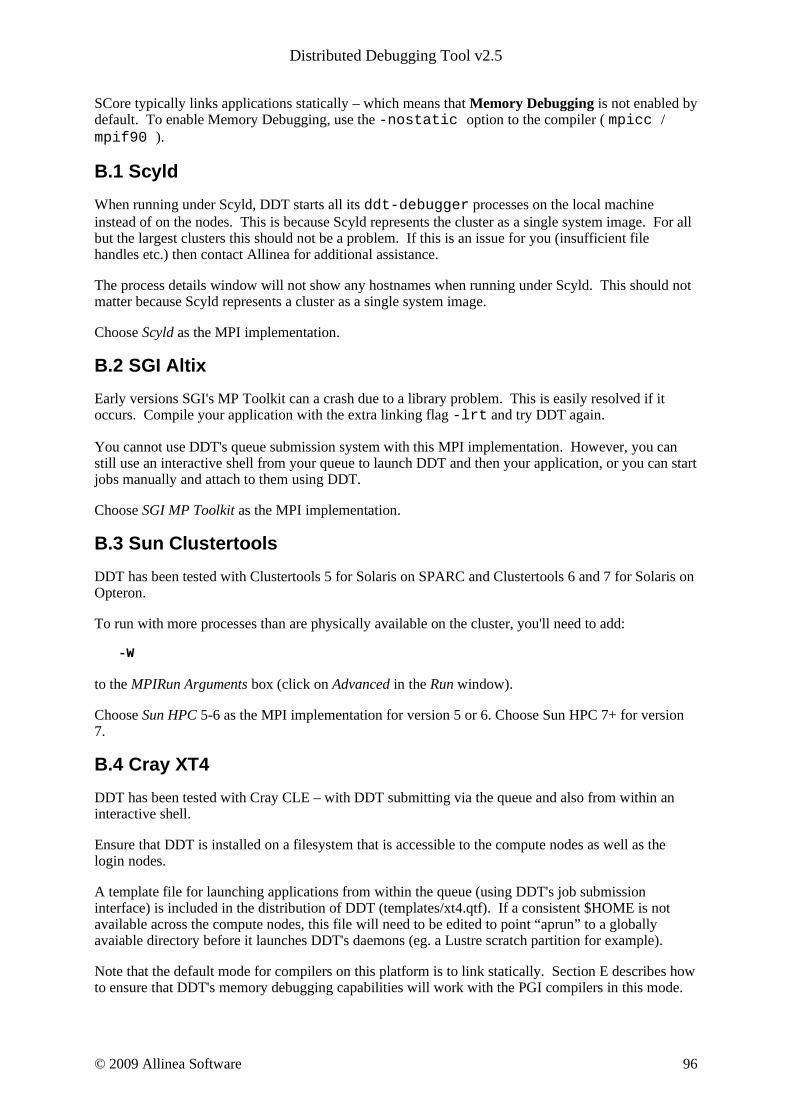
Distributed Debugging Tool v2.5
SCore typically links applications statically – which means that Memory Debugging is not enabled by default. To enable Memory Debugging, use the -nostatic option to the compiler ( mpicc / mpif90 ).
B.1 Scyld
When running under Scyld, DDT starts all its ddt-debugger processes on the local machine instead of on the nodes. This is because Scyld represents the cluster as a single system image. For all but the largest clusters this should not be a problem. If this is an issue for you (insufficient file handles etc.) then contact Allinea for additional assistance.
The process details window will not show any hostnames when running under Scyld. This should not matter because Scyld represents a cluster as a single system image.
Choose Scyld as the MPI implementation.
B.2 SGI Altix
Early versions SGI's MP Toolkit can a crash due to a library problem. This is easily resolved if it occurs. Compile your application with the extra linking flag -lrt and try DDT again.
You cannot use DDT's queue submission system with this MPI implementation. However, you can still use an interactive shell from your queue to launch DDT and then your application, or you can start jobs manually and attach to them using DDT.
Choose SGI MP Toolkit as the MPI implementation.
B.3 Sun Clustertools
DDT has been tested with Clustertools 5 for Solaris on SPARC and Clustertools 6 and 7 for Solaris on Opteron.
To run with more processes than are physically available on the cluster, you'll need to add:
-W
to the MPIRun Arguments box (click on Advanced in the Run window).
Choose Sun HPC 5-6 as the MPI implementation for version 5 or 6. Choose Sun HPC 7+ for version 7.
B.4 Cray XT4
DDT has been tested with Cray CLE – with DDT submitting via the queue and also from within an interactive shell.
Ensure that DDT is installed on a filesystem that is accessible to the compute nodes as well as the login nodes.
A template file for launching applications from within the queue (using DDT's job submission interface) is included in the distribution of DDT (templates/xt4.qtf). If a consistent $HOME is not available across the compute nodes, this file will need to be edited to point “aprun” to a globally avaiable directory before it launches DDT's daemons (eg. a Lustre scratch partition for example).
Note that the default mode for compilers on this platform is to link statically. Section E describes how to ensure that DDT's memory debugging capabilities will work with the PGI compilers in this mode.
© 2009 Allinea Software 96

Distributed Debugging Tool v2.5
C Compiler Notes and Known IssuesAlways compile with a minimal amount of, or no, optimization - some compilers reorder instruction execution and omit debug information when compiled with optimization turned on.
Some MPI implementations such as MPICH 1.2.5, require you to compile your code with the same compiler family as the implementation was compiled with. For example, if your copy of MPICH was compiled up using the Intel compilers, you should also compile your programs using the Intel compilers.
C.1 Absoft
If you are using C-style include statements in your program the line numbers reported by DDT may be incorrect. To fix this problem replace the #include directives with an INCLUDE statement.
C.2 GNU
The compiler flag -fomit-frame-pointer should never be used in an application which you intend to debug. Doing so will mean DDT cannot properly discover your stack frames and you will be unable to see which lines of code your program has stopped at.
For GNU C++, large projects can often result in vast debug information size, which can lead to large memory usage by DDT's backend debuggers – for example each instance of an STL class used in different object files will result in the compiler generating the same information in each object file. This large memory usage can result in excessive thrashing of the disks due to using swap memory – and this becomes even more noticeable for SMP systems where two processors or more share the same memory resource. For SMP systems, if a severe performance issue is noted whilst debugging with DDT we suggest forcing the MPI to use only one CPU per node. Allinea are happy to advise users of how to achieve this with most common MPIs.
C.3 IBM XLC/XLF
It is advisable to use the -qfullpath option to the IBM compilers (XLC/XLF) in order for source files to be found automatically by DDT when they are in directories other than that containing the executable. This flag has been known to fail for mpxlf95, and so there may be circumstances when you must right click in the project navigator and add additional paths to scan for source files.
Module data items behave differently between 32 and 64 bit mode, with 32-bit mode generally enabling access to more module variables than 64-bit mode.
Arrays with many dimensions may take several seconds to display in the Locals, Current Line and Evaluate views. If you experience this with your code, please contact [email protected].
A bug in XLC 7.0.0.0 could cause the stack to become corrupt, making debugging impossible. This is fixed in releases 7.0.0.2 and above.
A bug in the XLF compiler means that to view pointer details or check pointer validity, you may have to right-click on the pointer in the evaluate panel and choose Dereference. DDT will now say that the “<expression cannot be evaluated>”, but View Pointer Details will now work as expected.
Missing debug information in the binaries produced by XLF can prevent DDT from showing the values in Fortran pointers and allocatable arrays correctly, and assumed-size arrays cannot be shown at all. Please update to the latest compiler version before reporting this to [email protected].
Sometimes, when a process is paused inside a system or library call, DDT will be unable to display the stack, or the position of the program in the Code view. To get around this, it is sometimes necessary to
© 2009 Allinea Software 97

Distributed Debugging Tool v2.5
select a known line of code and choose Run to here. If this bug affects you, please contact [email protected].
Evaluating functions is not supported on the AIX or Linux on Power platforms.
DDT has been tested against the C compiler xlc version 7.0 and Fortran/Fortran 90 version 9.1 – on both Linux and AIX. Note that xlC (C++) is not fully supported on AIX.
To view Fortran assumed size arrays in DDT you must first right click on the variable, select Edit Type.., and enter the type of the variable with its bounds (e.g. integer arr(5) ).
C.4 Intel Compilers
The recommended debugger for this compiler is Automatic. DDT has been tested with versions 8.1, 9.0 and 10.
Known issues: IFC can generate unexpected location information for variables when compiled with -save option, leading to incorrect data values. It is recommended that the -save option is not used.
A bug in the Intel 8.1 compiler can prevent DDT from displaying some variables inside module subroutines. If this affects you, please email [email protected].
Some compiler optimizations performed when -ax options are specified to IFC/ICC can result in programs which cannot be debugged. This is due to the reuse by the compiler of the frame-pointer, which makes DDT unable to obtain a stack trace.
The Intel compiler doesn't always provide enough information to correctly determine the bounds of some Fortran arrays when they are passed as parameters, in particular the lower-bound of assumed-shape arrays.
The Intel OpenMP compiler will always optimise parallel regions, regardless of any -O0 settings. This means that your code may jump around unexpectedly while stepping inside such regions, and that any variables which may have been optimised out by the compiler may be shown with nonsense values. There have also been problems reported in viewing thread-private data structures and arrays. If these affect you, please contact [email protected] .
Files with a .F or .F90 extension are automatically preprocessed by the Intel compiler. This can also be turned on with the the -fpp command-line option. Unfortunately, the Intel compiler does not include the correct location of the source file in the executable produced when preprocessing is used. If your Fortran file does not make use of macros and doesn't need preprocessing, you can simply rename its extension to .f or .f90 and/or remove the “-fpp” flag from the compile line instead. Alternatively, you can help DDT discover the source file by right clicking in the Project Files window and then selecting Add/view source directory and adding the correct directory.
OpenMP debugging is not supported with versions 8.x of the Intel compiler.
Some versions of the compiler emit incorrect debug information for OpenMP programs which may cause some OpenMP variables to show as <not allocated>.
If you do not see stack traces for allocations in the View Pointer Details window try re-compiling your program with the -fp argument (this enables frame pointers).
C.5 Pathscale EKO compilers
The recommended debugger for this compiler is Automatic; DDT has been tested with version 2.2.1 and 2.3 of this compiler suite.
© 2009 Allinea Software 98

Distributed Debugging Tool v2.5
Notes for version 1.4: Fortran pointers are reported as their values, not addresses, so do not need to be dereferenced. This may also occur with later versions.
Known issues with Pathscale 2.5: The default Fortran compiler options do not generate enough information for DDT to show where memory was allocated from – View Pointer Details will not show which line of source code memory was allocated from. To enable this, please use version 2.3 of the compiler and compile and link with the following flags:
-Wl,--export-dynamic -TENV:frame_pointer=ON -funwind-tables
For C programs, simply compiling with -g is sufficient.
When using the Fortran compiler, you may have to place breakpoints in myfile.i instead of myfile.f90 or myfile.F90. We are currently investigating this; please let us know if it applies to your code.
In some 64-bit codes the compiler fails to include the proper augmentation data in the DWARF FDEs, which can cause back-end debuggers to crash.
Procedure names in modules often have extra information appended to them. This does not otherwise affect the operation of DDT with the Pathscale compiler.
OpenMP debugging is not supported with versions 2.x of this compiler. If you need to debug OpenMP Pathscale codes, please obtain the 3.0 release version and contact [email protected] for the latest information on related problems and workarounds.
Some version of the Pathscale compiler emit incorrect line number information. This may cause DDT to show your program on a different line to the one expected.
The Pathscale 3.1 OpenMP library has an issue which makes it incompatible with programs that call the fork system call on some machines.
Some version of the Pathscale compiler (e.g. 3.1) do not emit complete DWARF debugging information for typedef'ed structures. These may show up in DDT with a void type instead of the expected type.
C.6 Portland Group Compilers
DDT has been tested with Portland Tools 4, 5, 6 and 7.1-4.
Known issues with Portland 5.2 and 6.0: Assumed shape arrays can have wrong dimensions (Portland reference TPR 301). The View Pointer Details window cannot show which line of code memory was allocated from in Fortran codes with the 64-bit version of this complier.
Known issues with Portland 6/7: Included files in Fortran 90 generate incorrect debug information with respect to file and line information. The information gives line numbers which refer to line numbers from the included file but give the including file as the file.
Known Issue: All versions. When using memory debugging with statically linked PGI executables (-Bstatic) because of the in-built ordering of library linkage for F77/F90, you will need to add a localrc file to your PGI installation which defines the correct linkage when using DDT and (static) memory debugging. To your {pgi-path}/bin/localrc append the following:
switch -Bstaticddt is help(Link for DDT memory debugging with static binding) helpgroup(linker) append(LDARGS=--eh-frame-hdr –z muldefs)
© 2009 Allinea Software 99
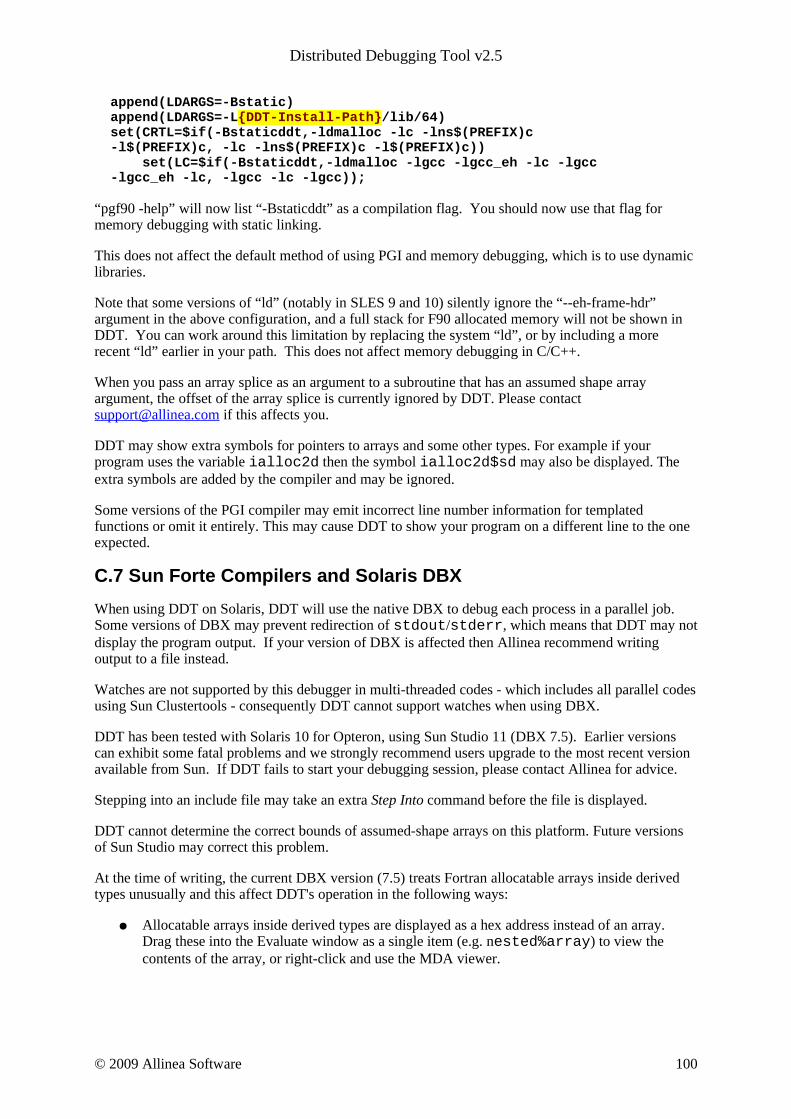
Distributed Debugging Tool v2.5
append(LDARGS=-Bstatic) append(LDARGS=-L{DDT-Install-Path}/lib/64) set(CRTL=$if(-Bstaticddt,-ldmalloc -lc -lns$(PREFIX)c -l$(PREFIX)c, -lc -lns$(PREFIX)c -l$(PREFIX)c)) set(LC=$if(-Bstaticddt,-ldmalloc -lgcc -lgcc_eh -lc -lgcc -lgcc_eh -lc, -lgcc -lc -lgcc));
“pgf90 -help” will now list “-Bstaticddt” as a compilation flag. You should now use that flag for memory debugging with static linking.
This does not affect the default method of using PGI and memory debugging, which is to use dynamic libraries.
Note that some versions of “ld” (notably in SLES 9 and 10) silently ignore the “--eh-frame-hdr” argument in the above configuration, and a full stack for F90 allocated memory will not be shown in DDT. You can work around this limitation by replacing the system “ld”, or by including a more recent “ld” earlier in your path. This does not affect memory debugging in C/C++.
When you pass an array splice as an argument to a subroutine that has an assumed shape array argument, the offset of the array splice is currently ignored by DDT. Please contact [email protected] if this affects you.
DDT may show extra symbols for pointers to arrays and some other types. For example if your program uses the variable ialloc2d then the symbol ialloc2d$sd may also be displayed. The extra symbols are added by the compiler and may be ignored.
Some versions of the PGI compiler may emit incorrect line number information for templated functions or omit it entirely. This may cause DDT to show your program on a different line to the one expected.
C.7 Sun Forte Compilers and Solaris DBX
When using DDT on Solaris, DDT will use the native DBX to debug each process in a parallel job. Some versions of DBX may prevent redirection of stdout/stderr, which means that DDT may not display the program output. If your version of DBX is affected then Allinea recommend writing output to a file instead.
Watches are not supported by this debugger in multi-threaded codes - which includes all parallel codes using Sun Clustertools - consequently DDT cannot support watches when using DBX.
DDT has been tested with Solaris 10 for Opteron, using Sun Studio 11 (DBX 7.5). Earlier versions can exhibit some fatal problems and we strongly recommend users upgrade to the most recent version available from Sun. If DDT fails to start your debugging session, please contact Allinea for advice.
Stepping into an include file may take an extra Step Into command before the file is displayed.
DDT cannot determine the correct bounds of assumed-shape arrays on this platform. Future versions of Sun Studio may correct this problem.
At the time of writing, the current DBX version (7.5) treats Fortran allocatable arrays inside derived types unusually and this affect DDT's operation in the following ways:
● Allocatable arrays inside derived types are displayed as a hex address instead of an array. Drag these into the Evaluate window as a single item (e.g. nested%array) to view the contents of the array, or right-click and use the MDA viewer.
© 2009 Allinea Software 100
Distributed Debugging Tool v2.5
● Very large allocatable arrays inside derived types cannot be limited in the Evaluate window at all – instead of displaying the first 200 (or so) elements DDT will not display any. Right-click on the array and use the MDA viewer to inspect its contents.
© 2009 Allinea Software 101

Distributed Debugging Tool v2.5
D Platform Notes and Known IssuesThis page notes any particular issues affecting platforms. If a supported machine is not listed on this page, it is because there is no known issue.
D.1 GNU/Linux Systems
Some 64-bit GNU/Linux systems which have a bug in the GNU C library (specifically libthread_db.so.1) which can crash the debugger when debugging multi-threaded programs. Check with your Linux distribution for a fix. As a workaround you can try compiling your program as a statically linked executable using the -static compiler flag.
Some GNU/Linux distributions (e.g. RHEL 4) that use the Native POSIX Threads Library (NPTL) do not provide a static NPTL library. Instead the static threads library uses LinuxThreads instead. The thread debugging library (libthread_db.so.1) may not include support for LinuxThreads so you will be unable to debug statically linked multi-threaded programs on these distributions. We recommend you do not compile your programs as statically linked executables unless unavoidable.
Attaching to a stopped process does not work with some Linux kernel versions (e.g. the one shipped with Fedora 7) due to a kernel bug. This stops DDT automatically attaching to forked processes (when Stop on fork is enabled).
Some older versions of the Linux kernel have a bug which make it slow to read large variables on the stack, e.g. arrays. When memory debugging is enabled it is even slower due to way the kernel memory management subsystem is implemented. This issue only occurs on 32-bit platforms.
DDT may hang when restoring a GDB checkpoint on RHEL 4. This is due to a deadlock in the GNU C Library. At the time of writing there is no available fix.
D.2 IBM AIX Systems
The Step Threads Together and Focus on Thread features are unavailable on AIX due to a lack of operating system support.
When stepping through certain system library calls the program may run freely instead. This is presently known to occur with the memset library call. This is due to a limitation of the Power architecture.
Similarly DDT may fail to stop when a watchpoint is modified after a call to certain library calls. This is also due to a limitation of the Power architecture.
A sample Loadleveller script, which starts debugging jobs on IBM AIX (POE) systems is included in the {installation-directory} /templates directory.
If you have problems starting a job in DDT try the Generic MPI implementation as well.
D.3 AMD Opteron and Intel EM64T
When using a 64-bit operating system please note that it is essential to use the 64-bit version of DDT on this platform. This applies regardless of whether the debugged program is 32-bit or 64-bit.
Multi-threaded and OpenMP debugging are not supported on Linux 2.4.x 64-bit kernels, such as SuSE 9.0. Please use a 2.6.x 64-bit kernel, such as found in SuSE 9.3 and above.
© 2009 Allinea Software 102
Distributed Debugging Tool v2.5
D.4 Intel Itanium
Ptrace, the kernel's debugging interface, in early 2.4.x kernels did not support rapid reading of all registers in one single system call – and the Itanium has a lot of registers! Moreover, a kernel lock prevents multiple processors in an SMP Itanium from entering this system call simultaneously – and so it is possible to experience very slow debugging on early systems. Affected systems include Redhat 2.1 and 3 AS. SuSE 9.0 does not suffer from this.
A second error, corrected in late 2005 by 2.6.15.x and higher kernels concerned reading memory – some reads for MPI codes can take 10 times longer than an ordinary single processor job – due to an erroneous memory page searching algorithm. It is unlikely, but still plausible that users could observe this behaviour whilst debugging large data chunks.
For SGI Altix Itanium clusters, early versions SGI's MP Toolkit can a crash due to a library problem. This is easily resolved. Compile your application with the extra linking flag -lrt and try DDT again.
Heap Overflow Detection is not supported on Itanium-based machines. You may find that your program stops with SIGBUS errors when this option is turned on. However, 'Fence Post' checking is still available.
D.5 Intel Xeon/Pentium 32 bit
On some 32-bit Linux kernels, reading addresses above 0x80000000 takes an order of magnitude longer than usual. This can cause normal debugging operations, such as listing the local variables or getting the stack to take far longer than usual when DDT's guard pages are enabled. It can even cause DDT to report that the process or underlying debugger has stopped responding. You can work around this by disabling guard pages during debugging, or by setting the environment variable DDT_PROCESS_TIMEOUT to 0. Future kernel revisions may address this issue.
OpenMP debugging is not supported on old Linux kernels. Supported systems include Redhat 9, SuSE 9.3 and above.
D.6 Sun SPARC
Heap Overflow Detection is not supported on SPARC-based machines. You may find that your program stops with SIGBUS errors when this option is turned on. However, 'Fence Post' checking is still available.
Members of structures are not shown in the Local Variables view (STRUCT is shown as the value instead). Drag the variable to the Evaluate window to see the members.
D.7 Blue Gene
To run DDT for Blue Gene we recommend you install the V1R2 update from IBM available from https://www-304.ibm.com/systems/support/bluegene/index.html
DDT must be installed in a directory that is visible from the front end node(s), the service nodes and the I/O nodes.
If your Blue Gene does not allow the I/O nodes to connect directly to ports on the front end then DDT must be run from a service node rather than the front end. Login to the service node using:
ssh -Y bgsn
then run DDT from the command line:
© 2009 Allinea Software 103
Distributed Debugging Tool v2.5
bgsn$ /gps/fs2/frontend-2/ddt-2.4/bin/ddt
Message queue debugging and attaching to running processes are not supported on the Blue Gene architecture.
D.8 Cell Broadband Engine
D.8.1 Automatic detection of embedded SPE programs
DDT will automatically search for embedded SPE programs in every PPE program. The source files for embedded SPE programs will show up in the Project Files tab of the roject Navigator window. If you set a breakpoint in an SPE program that has not been loaded, it will be added to the program when it is loaded.
Note: If the same program is loaded multiple times the breakpoint will only be added to the first instance.
D.8.2 Identify and filter threads by architecture
DDT will show a small PPU/SPU overlay icon for each thread in a process. You can right click on the Threads view to show only PPU or SPU threads.
D.8.3 View SPU specific information
The SPU Information window shows information about the state of the SPE running a particular thread. There are five views:
● DMA MFC DMA status
● Event SPU event facility status
● Mailbox SPU mailbox facility status
● Proxy-DMA MFC Proxy-DMA status
● Signal SPU signal notification facility status
D.9 NEC SX8
See the SX8 Configuration Guide. If you did not have this file please contact support@allinea for a copy.
© 2009 Allinea Software 104
Distributed Debugging Tool v2.5
E General Troubleshooting and Known IssuesIf you have any problems with DDT, please take a look at the topics in this section – you might just find the answer you're looking for. Equally, it's worth checking the support pages of the www.allinea.com and making sure you have the latest version of DDT.
E.1 General Troubleshooting
E.1.1 Problems Starting the DDT GUIIf DDT is unable to start this is usually due to one of three reasons:
● DDT cannot connect to an X server. If you are running on a remote machine, make sure that your DISPLAY variable is set appropriately and that you can run simple X applications such as xterm from the same command-line.
● The licence file is invalid – in this case DDT will issue an error message. You should verify that you have a licence file, that it is in a file called Licence in DDT's directory and check that the date inside it is still valid. If DDT still refuses to start, please contact Allinea.
● You are using a licence server, but DDT cannot connect to it. See the section on licence servers for more information on troubleshooting these problems.
E.1.1 Problems Starting Scalar ProgramsThere are a number of possible sources for problems. The most common is – for users with a multi-process licence – that the Run Without MPI Support check box has not been checked . If DDT reports a problem with MPI and you know your program is not using MPI, then this is usually the cause. If you HAVE checked this box and DDT still mentions MPI then we would very much like to hear from you!
Other potential problems are:
● A previous DDT session is still running, or has not released resources required for the new session. Usually this can be resolved by killing stale processes. The most obvious symptom of this is a delay of approximately 60 seconds and a message stating that not all processes connected. You may also see, in the terminal, a QServerSocket message
● The target program does not exist or is not executable
● The selected debugger cannot be found
● The selected debugger has crashed
● DDT's backend daemon – ddt-debugger – is missing from DDT's bin directory – in this case you should check your installation, and contact Allinea for further assistance.
E.1.1 Problems Starting Multi-Process ProgramsIf you encounter problems whilst starting an MPI program with DDT, the first step is to establish that it is possible to run a single-process (non-MPI) program such as a trivial "Hello, World!" - and resolve such issues that may arise. After this, attempt to run a multi-process job – and the symptoms will often allow a reasonable diagnosis to be made.
In the first instance, verify that MPI is installed correctly by running a job outside of DDT, such as the example in DDT's examples directory.
mpirun -np 8 ./a.out
© 2009 Allinea Software 105
Distributed Debugging Tool v2.5
Verify that mpirun is in the PATH, or the environment variable DDTMPIRUN is set to the full pathname of mpirun.
If the progress bar does not report that at least process 0 has connected, then the remote ddt-debugger daemons cannot be started or cannot connect to the GUI.
The majority of such problems are caused by environment variables not propagating to the remote nodes whilst starting a job. To a large extent, the solution to these problems depend on the MPI implementation that is being used. In the simplest case, for rsh based systems such as a default MPICH installation, correct configuration can be verified by rsh-ing to a node and examining the environment. It is worthwhile rsh-ing with the env command to the node as this will not see any environment variables set inside the .profile command. For example if your nodes use a .profile instead of a .bashrc for each user then you may well see a different output when running rsh node env than when you run rsh node and then run env inside the new shell.
If only one, or very few, processes connect, it may be because you have not chosen the correct MPI implementation. Please examine the list and look carefully at the options. Should no other suitable MPI be found, please contact Allinea for advice.
If a large number of processes are reported by the status bar to have connected, then it is possible that some have failed to start due to resource exhaustion, timing out, or, unusually, an unexplained crash. You should verify again that MPI is still working, as some MPI distributions do not release all semaphore resources correctly (for example MPICH on Redhat with SMP support built in).
To check for time-out problems, set the DDT_NO_TIMEOUT environment variable to 1 before launching the GUI and see if further progress is made. This is not a solution, but aids the diagnosis. If all processes now start, please contact Allinea for further long-term advice.
E.2 Starting a Program
E.2.1 DDT says it can't find your hosts or the executableThis can happen when attempting to attach to a process running on other machines. Ensure that the host name(s) that DDT complains about are reachable using ping. If DDT fails to find the executable, ensure that it is available in the same directory on every machine. If you haven't already, then try using the Configuration Wizard to set up DDT's attach feature.
E.2.2 The progress bar doesn't move and DDT 'times out'It's possible that the program ddt-debugger hasn't been started by mpirun or has aborted. You can log onto your nodes and confirm this by looking at the process list before clicking Ok when DDT times out. Ensure ddt-debugger has all the libraries it needs and that it can run successfully on the nodes using mpirun.
Alternatively, there may be one or more processes (ddt-debugger, mpirun, rsh) which could not be terminated. This can happen if DDT is killed during its startup or due to MPI implementation issues. You will have to kill the processes manually, using ps x to get the process ids and then kill or kill -9 to terminate them.
This issue can also arise for mpich-p4mpd, and the solution is explained in Appendix B MPI Distribution Notes and Known Issues.
If your intended mpirun command is not in your PATH, you may either add it to your PATH or set the environment variable DDTMPIRUN to contain the full pathname of the correct mpirun.
If your home directory is not accessible by all the nodes in your cluster then your jobs may fail to start in this fashion. To resolve the problem open the file ~/.ddt/config.ddt in a text editor. Change
© 2009 Allinea Software 106

Distributed Debugging Tool v2.5
the shared directory option in the [startup] section so it points to a directory that is available and shared by all the nodes. If no such directory exists, change the use session cookies option to no instead.
E.2.3 The progress bar gets close to half the processes connecting and then stops and DDT 'times out'This is likely to be caused by a dual-processor configured MPI distribution. Make sure you have selected smp-mpich or scyld as your MPI implementation in the DDT Options window. If this doesn't help, see Appendix B MPI Distribution Notes and Known Issues for a workaround and email [email protected] for further assistance.
E.2.4 Program doesn't start, and you can see a console error stating "QServerSocket: failed to bind or listen to the socket"Ordinarily this message is not a sign of a problem - it is emitted when another DDT session, is running and consequently the DDT master uses another socket instead. However, if you know this not to be the case and your program is not starting, it's likely that a previous run of DDT has been unable to terminate and release resources completely. This is known to occur occasionally for MPICH-GM. If this happens, run /usr/bin/killall -9 ddt-debugger on your nodes - you can actually use mpirun to do this for you.
E.2.5 DDT complains about being unable to execute mallocShould this error message occur, often due to back-end debugger failure, it is possible to bypass this step. Set the environment variable DDT_DONT_GET_RANK to 1 on the nodes and this will force DDT to guess ranks, which may resolve the problem.
Sometimes this error is shown when DDT could not start your program at all. Check the arguments, memory debugging settings, library paths and so on have the values you would expect and then contact [email protected] for more help.
E.2.6 ‘The mpi execution environment exited with an error, details follow: Error code: 1 Error Messages: “mprun:mpmd_assemble_rsrcs: Not enough resources available”’ error when trying to start DDTThis error occurs when running DDT on a Solaris machine. If you select more processes than you have processors in your machine then mprun is not able to allocate the resources needed. To fix this simply add the argument -W to the MPI Arguments box, this will tell mprun to wrap the processes and will enable you to start your desired number of processes in DDT.
E.3 Attaching
E.3.1 Running processes don't show up in the attach windowThis is usually a problem with either your remote-exec script or your node list file. First check that the entry in your node list file corresponds with either localhost (if you're running on your local machine) or with the output of hostname on the desired machine.
Secondly try running remote-exec manually ie. remote-exec ls and check the output of this. If this fails then there is a problem with your remote-exec script. If rsh is still being used in your script check that you can rsh to the desired machine. Otherwise check that you can attach to your machine in the way specified in the remote-exec script. If you still experience problems with your script then contact Allinea for assistance.
© 2009 Allinea Software 107
Distributed Debugging Tool v2.5
E.4 Source Viewer
E.4.1 No variables or line number informationYou should compile your programs with debug information included, this flag is usually –g.
E.4.2 Source code does not appear when you start DDTIf you cannot see any text at all, perhaps the default selected font is not installed on your system. Go into the Session → Options window and choose a fixed width font such as Courier and you should now be able to see the code.
If you see a screen of text telling you that DDT could not find your source files, follow the instructions given. If you still cannot get DDT to show your source code, check that the code is available on the same machine as you are running DDT on, and that the correct file and directory permissions are set. If some files are missing, and others found, try adding source directories and rescanning – see section Error: Reference source not found for further instruction.
If the problem persists, contact [email protected].
E.5 Input/Output
E.5.1 Output to stderr is not displayedDDT automatically captures anything written to stdout / stderr and displays it. Some shells (such as csh and debuggers (such as dbx on Solaris) do not support this feature in which case you may see your stderr mixed with stdout, or you may not see it at all. In any case we strongly recommend writing program output to files instead, since the MPI specification does not cover stdout / stderr behaviour.
E.6 Controlling a Program
E.6.1 Program hangs when you use Step OutYou should not use the Step Out feature from the main function of your program. This will cause the debugger to hang. With some debuggers DDT will return a time-out error. Make sure you only use Step Out inside functions.
Some back-end debug interfaces have been known to behave unpredictably when told to Step Out. If you suspect this is the problem, check you can leave the function by putting a breakpoint on the next executable statement and pressing Play instead. If this works, and Step Out doesn't, please [email protected].
E.6.2 Program jumps forwards and backwards when stepping through itIf you have compiled with any sort of optimisations, the compiler will shuffle your programs instructions into a more efficient order. This is what you are seeing. We always recommend compiling with -O0 when debugging, which disables this behaviour and other optimisations.
If you are using the Intel OpenMP compiler, then the compiler will generate code that appears to jump in and out of the parallel blocks regardless of your -O0 setting. Stepping inside parallel blocks is therefore not recommended for the faint-hearted!
E.6.3 DDT sometimes stop responding when using the Step Threads Together optionDDT may stop responding if a thread exits when the Step Threads Together option is enabled. This is most likely to occur on Linux platforms using NPTL threads. This might happen if you tried to Run to
© 2009 Allinea Software 108
Distributed Debugging Tool v2.5
here to a line that was never reached – in which case your program ran all the way to the end and then exited.
A workaround is to set a breakpoint at the last statement executed by the thread and turn off Step Threads Together when the thread stops at the breakpoint. If this problem affects you please contact [email protected] .
E.7 Evaluating Variables
E.7.1 Some variables cannot be viewed when the program is at the start of a functionSome compilers produce faulty debug information, forcing DDT to enter a function during the prologue . In this region, which appears to be the first line of the function, some variables have not been initialised yet. To view all the variables with their correct values, it may be necessary to run or step to the next line of the function.
E.7.2 Incorrect values printed for Fortran arrayPointers to non-contiguous array blocks (allocatable arrays using strides) are not supported. If this issue affects you, please email [email protected] for a workaround or fix.
There are also many compiler limitations that can cause this. See section E for details.
E.7.3 Evaluating an array of derived types, containing multiple-dimension arraysThe Locals , Current Line and Evaluate views will probably not show the contents of these multi-dimensional arrays inside an array of derived types. However, you can view the contents of the array by clicking on its name and dragging it into the evaluate window as an item on its own, or by using the MDA
E.7.4 Evaluating C++ STL types with the wizard does not workThe example wizard distributed with DDT only works for programs compiled with the GNU C++ compiler.
E.8 Memory Debugging
E.8.1 The View Pointer Details window says a pointer is valid but doesn't show you which line of code it was allocated onThe Pathscale and PGI compilers have known issues that can cause this – please see the compiler notes in section C of this appendix for more details.
The Intel compiler may need the -fp argument to allow you to see stack traces on some machines.
If this happens with another compiler, please contact [email protected] with the vendor and version number of your compiler.
E.8.2 “Dmalloc library has gone recursive” errorSome threading libraries allocate memory before making threading locks available. This affects DDT's memory debugging, which tries to lock memory allocation calls. You can try adjusting the number of unlocked calls that are allowed at the start of the program by choosing the Custom settings in the Memory Debugging Settings window and entering lockon= value , where common choices for value range from 1 to 20. If this doesn't help, please contact [email protected].
© 2009 Allinea Software 109
Distributed Debugging Tool v2.5
E.8.3 “mprotect fails” error when using memory debugging with guard pagesThis can happen if your program makes more than 32768 allocations – a limit in the kernel prevents DDT from allocating more protected regions than this. You can set this limit manually by logging in as root and executing echo 1048576 >/proc/sys/vm/max_map_count , or another limit of your choice.
E.8.4 Allocations made before or during MPI_Init show up in Current Memory Usage but have no associated stack back traceMemory allocations that are made before or during MPI_Init appear in Current Memory Usage along with any allocations made afterwards. However the call stack at the time of the allocation is not recorded for these allocations and will not show up in the Current Memory Usage window.
E.8.5 Deadlock when calling printf or malloc from a signal handlerThe memory allocation library calls (e.g. malloc) provided by the memory debugging library are not async-signal-safe unlike the implementations in recent versions of the GNU C library. POSIX does not require malloc to be async-signal-safe but some programs may expect this behaviour. For example a program that calls printf from a signal handler may deadlock when memory debugging is enabled in DDT since the C library implementation of printf may call malloc.
The web page below has a table of the functions that may be safely called from an asynchronous signal handler:
http://www.opengroup.org/onlinepubs/009695399/functions/xsh_chap02_04.html#tag_02_04_03
E.9 Message Queues
E.9.1 When viewing messages queues after attaching to a process you get a “Cannot find Message Queue DLL” errorDDT can only detect the message queue library automatically when the program is started from within DDT. If you want to debug message queues when attaching, set the DDT_QUEUE_DLL environment variable explicitly before you start DDT. For example:
DDT_QUEUE_DLL=/usr/local/mpich/lib/libtvmpich.so ddt
Your MPI documentation should give you the file name for your implementation. The files needed for LAM and MPICH are:
LAM – liblam_totalview.so MPICH – libtvmpich.so
Some MPIs will need to be configured with a specific command-line option to turn on message queue debugging. For example, MPICH must be configured with the --enable-debug argument.
E.9.1 When trying to view my Message Queues using mpich you get no output but also see no errorsThis is a known problem on the Opteron/EM64T system with 64/32bit compatibility. If the DDT binary is 64-bit, but your target application is 32-bit, then the MPI message queue support library needs to be 32-bit also – and most MPI implementations do not support this configuration. Contact Allinea for further advice to obtain a 32-bit binary of DDT.
© 2009 Allinea Software 110
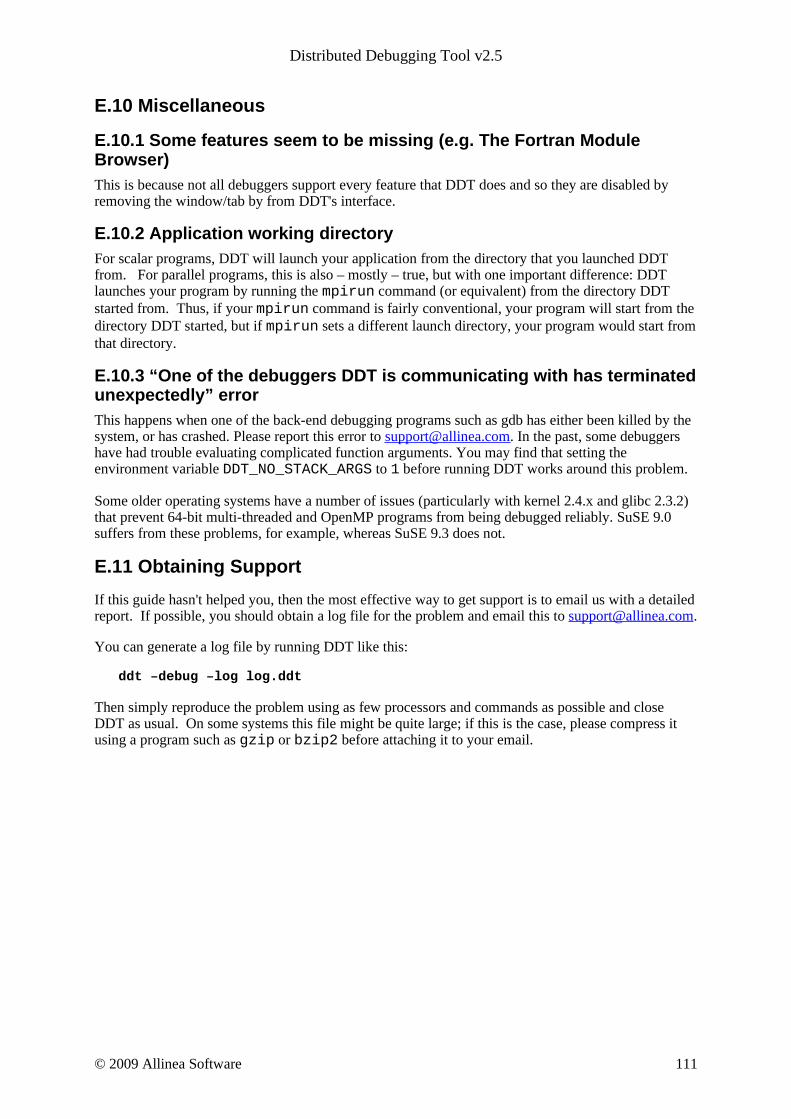
Distributed Debugging Tool v2.5
E.10 Miscellaneous
E.10.1 Some features seem to be missing (e.g. The Fortran Module Browser)This is because not all debuggers support every feature that DDT does and so they are disabled by removing the window/tab by from DDT's interface.
E.10.2 Application working directoryFor scalar programs, DDT will launch your application from the directory that you launched DDT from. For parallel programs, this is also – mostly – true, but with one important difference: DDT launches your program by running the mpirun command (or equivalent) from the directory DDT started from. Thus, if your mpirun command is fairly conventional, your program will start from the directory DDT started, but if mpirun sets a different launch directory, your program would start from that directory.
E.10.3 “One of the debuggers DDT is communicating with has terminated unexpectedly” errorThis happens when one of the back-end debugging programs such as gdb has either been killed by the system, or has crashed. Please report this error to [email protected]. In the past, some debuggers have had trouble evaluating complicated function arguments. You may find that setting the environment variable DDT_NO_STACK_ARGS to 1 before running DDT works around this problem.
Some older operating systems have a number of issues (particularly with kernel 2.4.x and glibc 2.3.2) that prevent 64-bit multi-threaded and OpenMP programs from being debugged reliably. SuSE 9.0 suffers from these problems, for example, whereas SuSE 9.3 does not.
E.11 Obtaining Support
If this guide hasn't helped you, then the most effective way to get support is to email us with a detailed report. If possible, you should obtain a log file for the problem and email this to [email protected].
You can generate a log file by running DDT like this:
ddt –debug –log log.ddt
Then simply reproduce the problem using as few processors and commands as possible and close DDT as usual. On some systems this file might be quite large; if this is the case, please compress it using a program such as gzip or bzip2 before attaching it to your email.
© 2009 Allinea Software 111

Distributed Debugging Tool v2.5
F IndexAIX..............................................................................................................................................91, 94, 102Align Stacks..............................................................................................................................................49Altix...........................................................................................................................................................91Apple.........................................................................................................................................................34Arguments.................................................................................................................................................23Arrays........................................................................................................................................................57Attaching...................................................................................................................................................28
Command Line......................................................................................................................................30Hosts File...............................................................................................................................................28
Backtrace...................................................................................................................................................49Bounds Checking......................................................................................................................................69Bproc.........................................................................................................................................................92Breakpoints................................................................................................................................................45
Conditional............................................................................................................................................46Deleting.................................................................................................................................................47Saving....................................................................................................................................................47
Bull MPI....................................................................................................................................................92C++ STL....................................................................................................................................................77Configuration......................................................................................................................................10, 25Configuration.................................................................................................................................................
Site Wide...............................................................................................................................................12Consistency Checking...................................................................................................................................
Heap.......................................................................................................................................................70Core Files...................................................................................................................................................28Cray XT4...................................................................................................................................................96Cross-Process Comparison.......................................................................................................................60Data................................................................................................................................................................
Changing...............................................................................................................................................56Editor.........................................................................................................................................................20End Session...............................................................................................................................................24Features..........................................................................................................................................................
Overview.................................................................................................................................................6Fence Post Checking.........................................................................................................................72, 103Floating Licences........................................................................................................................................9Font............................................................................................................................................................20Fortran Modules........................................................................................................................................55Function Listing........................................................................................................................................39Guard Pages.............................................................................................................................................103Heap Overflow .................................................................................................................................72, 103Hotkeys......................................................................................................................................................44HP MPI......................................................................................................................................................92IBM PE......................................................................................................................................................94Inf...............................................................................................................................................................53Input...........................................................................................................................................................64Installation...................................................................................................................................................7
Graphical.................................................................................................................................................7Text-Mode...............................................................................................................................................8
Intel Compilers....................................................................................................................................24, 98Intel Message Checker..............................................................................................................................93Intel MPI....................................................................................................................................................92Irix.............................................................................................................................................................96Job Submission..........................................................................................................................................31
Cancelling..............................................................................................................................................31Configuration........................................................................................................................................13
© 2009 Allinea Software 112

Distributed Debugging Tool v2.5
Regular Expression.........................................................................................................................18, 31Jump To Line.............................................................................................................................................38
Double Clicking....................................................................................................................................40LAM/MPI..................................................................................................................................................93Licensing.......................................................................................................................................................
Licence Files............................................................................................................................................9Licence Server.......................................................................................................................................85Multi Process Licence...........................................................................................................................23Single Process Licence..........................................................................................................................25
Log File...................................................................................................................................................111Main Window................................................................................................................................................
Overview...............................................................................................................................................36Memory Debugging..................................................................................................................................69
Check Validity.......................................................................................................................................71Configuration........................................................................................................................................69Libraries.................................................................................................................................................69Memory Statistics..................................................................................................................................74mprotect fails.......................................................................................................................................110
Memory Usage..........................................................................................................................................72Message Queues........................................................................................................................................66MPI................................................................................................................................................................
Configuration........................................................................................................................................10MPI Rank..............................................................................................................................................40MPI Ranks.............................................................................................................................................62mpirun....................................................................................................................................................24Troubleshooting..................................................................................................................................105
MPICH......................................................................................................................................................25GM.........................................................................................................................................................93p4...........................................................................................................................................................93p4 mpd...................................................................................................................................................93
Multi-Dimensional Arrays........................................................................................................................57MVAPICH.................................................................................................................................................94NEC MPI...................................................................................................................................................94OpenGL.....................................................................................................................................................59OpenMP.........................................................................................................................................................
OMP_NUM_THREADS......................................................................................................................26OpenMPI...................................................................................................................................................94Opteron..............................................................................................................................................91, 110Parallel Stack View...................................................................................................................................50Pointers......................................................................................................................................................57Portland Group..........................................................................................................................................99Process Groups..........................................................................................................................................40
Deleting.................................................................................................................................................40Quadrics MPI............................................................................................................................................94Raw Command..........................................................................................................................................63Registers........................................................................................................................................................
Viewing.................................................................................................................................................62Remote Users............................................................................................................................................34Restarting...................................................................................................................................................44Running a Program...................................................................................................................................22SCore.............................................................................................................................................24, 91, 95SCore.............................................................................................................................................................
scrun......................................................................................................................................................24Scyld..........................................................................................................................................................96Search........................................................................................................................................................38Session...........................................................................................................................................................
Saving....................................................................................................................................................37
© 2009 Allinea Software 113
Distributed Debugging Tool v2.5
Session Menu............................................................................................................................................44SGI.............................................................................................................................................................96Signal Handling.........................................................................................................................................53
Division by zero....................................................................................................................................53Floating Point Exception.......................................................................................................................53Segmentation fault................................................................................................................................53SIGFPE..................................................................................................................................................53SIGILL..................................................................................................................................................53SIGPIPE................................................................................................................................................53SIGSEGV..............................................................................................................................................53SIGUSR1...............................................................................................................................................53SIGUSR2...............................................................................................................................................53
Single Stepping.........................................................................................................................................45SMP...............................................................................................................................................................
Performance..................................................................................................................................97, 105Solaris...................................................................................................................24, 26, 91, 100, 107, 108Solaris DBX............................................................................................................................................100Source Code........................................................................................................................................37, 51Source Code...................................................................................................................................................
Editing...................................................................................................................................................39Missing Files.........................................................................................................................................37Searching...............................................................................................................................................38
Stack Frame...............................................................................................................................................49Standard Error...........................................................................................................................................64Standard Output.........................................................................................................................................64Starting......................................................................................................................................................44Starting DDT.............................................................................................................................................22Step Threads Together..............................................................................................................................43Stopping.....................................................................................................................................................44Sun Clustertools................................................................................................................................91, 100Support......................................................................................................................................................21Synchronizing Processes...........................................................................................................................48Tab size......................................................................................................................................................20Variables..............................................................................................................................................39, 54Variables........................................................................................................................................................
Searching...............................................................................................................................................38VNC...........................................................................................................................................................34Watchpoints...............................................................................................................................................48Welcome Screen........................................................................................................................................22Wizard.......................................................................................................................................................77
Creating a custom wizard library..........................................................................................................78Using a custom wizard library..............................................................................................................80
X forwarding.............................................................................................................................................34X11..........................................................................................................................................................105
© 2009 Allinea Software 114