ddos interactions
TRANSCRIPT

8/8/2019 DDOS Interactions
http://slidepdf.com/reader/full/ddos-interactions 1/11
Analyzing Interaction Between Distributed
Denial of Service Attacks And Mitigation Technologies
W. J. Blackert, D. M. Gregg, A. K. Castner,
E. M. Kyle, R. L. Hom, R. M. Jokerst
The Johns Hopkins UniversityApplied Physics Laboratory
Abstract
Under sponsorship of the Defense Advanced Research Projects Agency’s (DARPA) Fault Tolerant Networks
(FTN) program, The Johns Hopkins University Applied Physics Laboratory (JHU/APL) has been conducting the
Distributed Denial of Service Defense Attack Tradeoff Analysis (DDOS-DATA). DDOS-DATA’s goal is to
analyze Distributed Denial of Service (DDOS) attacks
and mitigation technologies to develop an understanding of how well mitigation technologies perform and how
they can be combined to limit the potential attack space.
This paper provides an overview of the DDOS-DATA
project and discusses analysis results for the Proof of Work, Rate Limiting, and Active Monitor mitigation
technologies considered both individually and when
deployed in combinations.
1. Introduction
Distributed Denial of Service (DDOS) attacks disrupt
and deny legitimate computer and network resourceusage through compromised hosts that monopolize
resources. Mitigation technologies have been developed
to defend against DDOS attacks, but there is little
understanding of the fundamental relationships between
DDOS attacks, mitigation strategies, and attacker performance. Without a solid understanding of these
fundamental relationships, it is difficult to determine the
ability of mitigation technologies to address the DDOS
problem or how mitigation technologies can successfully be deployed together.
JHU/APL, under the sponsorship of DARPA’s FTN
program [1], is currently analyzing DDOS attacks andmitigation technologies. DDOS-DATA’s goal is to use
analysis to quantify how well mitigation technologies
work, how attackers can adapt to defeat mitigation
technologies, and how different mitigation technologies
can be combined.
2. Approach
There are a variety of options for analyzing computer
network attacks and mitigation strategies. Closed form
analysis may be the most desirable form, but can requiremany simplifying assumptions. The resulting models
provide valuable first-order insights but detailed analysis
using them is limited. An alternative approach is a real
world test bed, which is an excellent approach tounderstand attack dynamics. However, a test bed can be
limited in its ability to vary key parameters (e.g., the
packet forwarding speed of a router) and size limitationscan restrict the analysis of DDOS attacks that may use
hundreds of nodes. Modeling and simulation provides an
approach with several advantages over closed form andreal world test bed analysis: the ability to vary key
parameters that may not be easily modifiable in a test
bed, the ability to easily repeat a given analysis scenario,
and the use of models without debilitating
simplifications. However, successfully using modelingand simulation requires model validation, which can be
very time consuming. In addition, careful consideration
must be given to the trade between model fidelity andmodel run time.
Analysis using modeling and simulation requires an in
depth understanding of how attacks and mitigation
technologies function. At JHU/APL we accomplishedthis through literature surveys, code examination, and
experimentation in the JHU/APL Information Operations
(IO) Laboratory. Through this process, key parameters
and behaviors are identified that then drive model
requirements and design.We use OPNET Modeler, a commercial discrete event
network simulation package, for model development.
Development requires enhancing existing OPNETmodels (e.g., to build the target network model) or
creating models from scratch (e.g., to build the attack and
mitigation models). Because computer network attacksoften exploit nuances in protocol implementations and
because existing OPNET models adhere to the protocol
0-7695-1897-4/03/$17.00 (C) 2003 IEEE

8/8/2019 DDOS Interactions
http://slidepdf.com/reader/full/ddos-interactions 2/11
specifications, they are typically not susceptible to attack
without enhancements.
Model verification and validation are critical to the
modeling process. Without them, it is simply not
possible to derive value from the results. Verificationensures that the model correctly implements the
developer’s intent (i.e., “Did I implement it right?”).
Validation takes many forms but often compares themodel to the real system ensuring correct model behavior
(i.e., “Did I implement the right thing?”).
After the models have been constructed, verified, and
validated, our analysis (Figure 1) begins. We examinethe target network under benign (i.e., no attack)
conditions, under attack conditions, and under attack
conditions with mitigation technologies in place.
Mitigat
Tune Attack
Mitigat
Tune Attack
Baseline
No
Mitigation
Combined
Mitigation&
Tuning
Mitigation
Tuning
• No Attack
• Confirm PDS of Zero• Timing Values for
later comparison
• Attack
• No MitigationTechnology Active
• Tune Server
• Attack
• Many MitigationTechnologies Active
• Tune Performance
• Attack
• MitigationTechnology Active
• Modify Attacks
Figure 1 Analysis Flow
3. The System
This paper presents analysis results for a 500+ node
target network, three mitigation technologies (discussed
below), and a specific attack scenario. Currently
underway, however, is construction of a larger 1000+node target network, additional mitigation technologies,
and expanded attacker capabilities. This work is
scheduled for completion in August 2003.
3.1 Target Network
The 500+ node target network is based on a subset of
the JHU/APL Intranet. The network consists of five edge
switches interfaced to a central switch. This core switch,in turn, connects to a router allowing the supported hoststo communicate with APL servers and the Internet. The
target network model is constructed from OPNET node
models.Data collection and traffic analysis from the live
network was used to guide traffic model development.
The primary types of traffic flowing across the network
are web access, e-mail, file sharing and transfer, and
system management functions. Existing OPNET models
(e.g., in the case of web access) and custom models were
used to model this traffic. The custom models generate
client traffic using continuous time Markov processes.
Each process represents the transmitted packet size andthe transition arcs represent the times between
transmitting packets. The server is modeled using the
same technique or by randomly selecting a response (e.g., packet number and size) based on the received packet
size [2].
3.2 Mitigation Technologies
Because it continues to pose a threat and manymitigation technologies are designed to counter it, we are
initially focusing on technologies mitigating the TCP
SYN flood attack.1 [3] We have analyzed three mitigationtechnologies: rate-limiting, active monitoring, and Proof
of Work. Figure 2 indicates notional deployment
locations for the technologies.
Active
Monitor
Rate
Limiting
Proof - of - Work
Active
Monitor
Rate
Proof - of - Work
Inbound
OutboundClients
Servers
Figure 2 Notional Mitigation Technology Deployment
Active Monitors observe and classify traffic and then
free resources consumed by attacks. One example of anActive Monitor, which we have modeled, is the synkill
software developed at Purdue CERIAS [4]. Synkill
observes traffic at a protected server to determine if TCP
connection initiation is being performed correctly. Anunsuccessful handshake (i.e., one where no response is
received from the SYN-ACK packet) is an indication that
the initial SYN packet originated from an attacker instead
of a legitimate client (which would have responded to theSYN-ACK). All subsequent traffic from a BAD (i.e.,attack) node is reset thereby freeing server resources for
legitimate use.
Rate limiting, such as the committed access rate(CAR) available in Cisco products, limits the flow of
predefined packet types. For example, the flow of SYN
packets can be limited to a subset of the available
1 These findings are applicable to other stateful resource attacks.
0-7695-1897-4/03/$17.00 (C) 2003 IEEE
8/8/2019 DDOS Interactions
http://slidepdf.com/reader/full/ddos-interactions 3/11
bandwidth. This constrains the attacker’s ability to
consume bandwidth in a limitless fashion. The Rate
Limiter can be configured to filter packets that are either
entering (“inbound”) or leaving (“outbound”) a router
(Figure 2).Proof of Work (or client puzzle) technologies require
client payment in return for using the server. In DDOS-
DATA, the Proof of Work system conditionally requiresthe user to solve a cryptographic puzzle (essentially
making payment in CPU cycles) [5]. While this puzzle is
straightforward to solve, finding the solution results in a
small delay. This delay slows down resource acquisition by an attacker, mitigating an attack.
3.3 The Attacker
The DDOS-DATA attack model provides a genericattack generation capability. The attacker can generate
TCP, User Datagram Protocol (UDP), or Internet Control
Message Protocol (ICMP) packets with analyst specified
field values (e.g., a SYN Packet) and timing. The attack start and end times are also configurable. Since theanalysis focus is on the mitigation technology and
attacker performance, we have elected not to model the
DDOS zombie control channels or distribution, insteadchoosing to assume that the zombies have already been
deployed.
4. Verification and Validation
Verification and validation activities were conducted
for all models developed by JHU/APL [2]. In addition,overall traffic loading of the network was validated.
4.1 Target Network
Because the target network model was constructed
with OPNET models, no verification activities took
place. To validate target network traffic models, we
compared live data with model traffic levels. We basedthe target network traffic load on the busiest hour in 24
hours of collected JHU/APL traffic. Validating this
model compares two values. The first is the traffic
volume between clients and servers. Table 1 comparesthe test bed data transfer size with results averaged over
37 model runs for the two key protocols: the file transfer
(due to its relative volume) and the intranet Web traffic(because the internal Web server will be the attacker’s
target). The mismatch in Intranet Web Requests occurs
because OPNET is using a fixed Web request size.
However, because the analysis will rely on the creation of
a socket and the length of the connection, this value is of secondary importance to the amount of data transferred.
The other modeled protocols either match well or
underestimate the amount of transferred data.
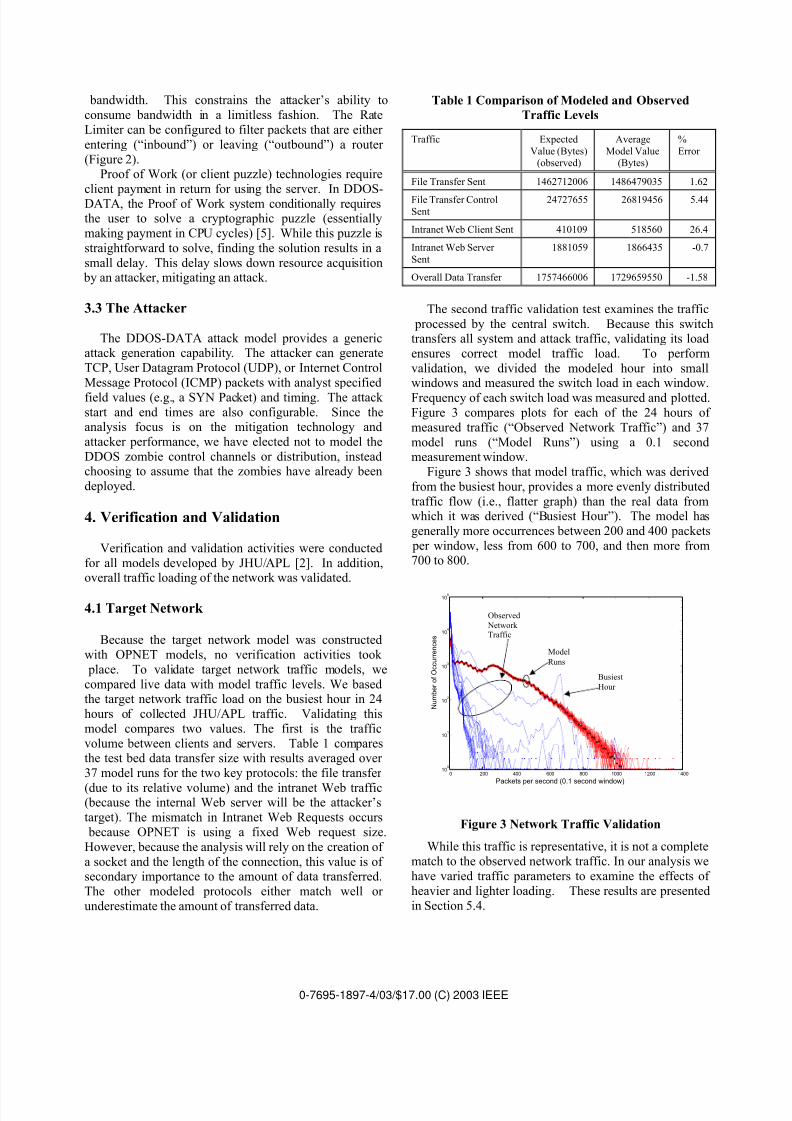
Table 1 Comparison of Modeled and Observed
Traffic Levels
Traffic Expected
Value (Bytes)(observed)
Average
Model Value(Bytes)
%
Error
File Transfer Sent 1462712006 1486479035 1.62
File Transfer ControlSent
24727655 26819456 5.44
Intranet Web Client Sent 410109 518560 26.4
Intranet Web Server
Sent
1881059 1866435 -0.7
Overall Data Transfer 1757466006 1729659550 -1.58
The second traffic validation test examines the traffic
processed by the central switch. Because this switchtransfers all system and attack traffic, validating its load
ensures correct model traffic load. To perform
validation, we divided the modeled hour into smallwindows and measured the switch load in each window.
Frequency of each switch load was measured and plotted.
Figure 3 compares plots for each of the 24 hours of
measured traffic (“Observed Network Traffic”) and 37
model runs (“Model Runs”) using a 0.1 secondmeasurement window.
Figure 3 shows that model traffic, which was derived
from the busiest hour, provides a more evenly distributed
traffic flow (i.e., flatter graph) than the real data fromwhich it was derived (“Busiest Hour”). The model has
generally more occurrences between 200 and 400 packets
per window, less from 600 to 700, and then more from700 to 800.
0 200 400 600 800 1000 1200 140010
0
101
102
103
104
105
Packets per second (0.1 second window)
N u m b e r o f O c c u r r e n c e s
Model
Runs
Busiest
Hour
Observed
Network Traffic
Figure 3 Network Traffic Validation
While this traffic is representative, it is not a complete
match to the observed network traffic. In our analysis we
have varied traffic parameters to examine the effects of
heavier and lighter loading. These results are presented
in Section 5.4.
0-7695-1897-4/03/$17.00 (C) 2003 IEEE

8/8/2019 DDOS Interactions
http://slidepdf.com/reader/full/ddos-interactions 4/11
4.2 Mitigation Technology
Verification tests were performed on all mitigation
technology models. Rate Limiting is provided here as anexample. For a thorough discussion on mitigation model
verification and validation, see [2].When building the Rate Limiter model, we first
implemented the CAR algorithm in Matlab. To verify
the OPNET Model, we compared results from the twomodels. The Rate Limiter limits traffic by using a
“bucket” filled with tokens. Tokens are added to the
bucket at the normal traffic rate and removed whenever
traffic is passed. The buckets allow traffic tomomentarily flow in excess of the normal rate. Figure 4
compares Matlab and OPNET model bucket sizes when
the Rate Limiter is subjected to a continuous 100 packets per second flow but the normal rate is 500 packets per
second.
0 1 2 3 4 5 6 7 8 9 100
1
2
3
4
5
6
7
8 x 10
4
time (sec)
b u c k e t s i z e ( b i t s )
average normal bucket size -- Matlab
average excess bucket size -- Matlab
average normal bucket size -- OPNET
average excess bucket size -- OPNET
Figure 4 Rate Limiter Verification
Results validation compares the model with real world
system performance. To validate the Rate Limiter model,
a test network was configured in both the JHU/APL IO
Laboratory and the OPNET model. The Rate Limiter was configured to pass a normal flow of 8,000 bits per
second and was subjected to an attacker transmitting data
at 48,000 bits per second. Figure 5 compares the number
of packets dropped by the Rate Limiter in the IO
Laboratory test bed and an equivalent model. The results
show that both systems drop packets similarly.
0 1 2 3 4 5 6 7 8 9 100
100
200
300
400
500
600
700
800
time (sec)
n u m b e r o f d r o p
p e d p a c k e t s
Testbed
Model
Figure 5 Validation of Rate Limiter Process
4.3 Attacker
Attack model verification compares model output with
expected behaviors (e.g., packet transmission times, packet contents, attack start and end times). For
example, the attack model is configured to transmit TCP
SYN packets at a specific rate. OPNET’s debug mode
was used to confirm packet content and intertransmissiontime.
Attack model validation is performed by comparing
model results to results obtained in JHU/APL’s IO
Laboratory test bed. We set up a test bed with four
different subnets and installed the Stacheldraht DDOSattack tool on all nodes except the victim. These nodes
included Linux, Solaris, and BSD machines. The attack rate from each attack node and the attack rate seen by thevictim were recorded. The test bed network was then
modeled in OPNET as shown in Figure 6.
Figure 6 Attacker Validation Network
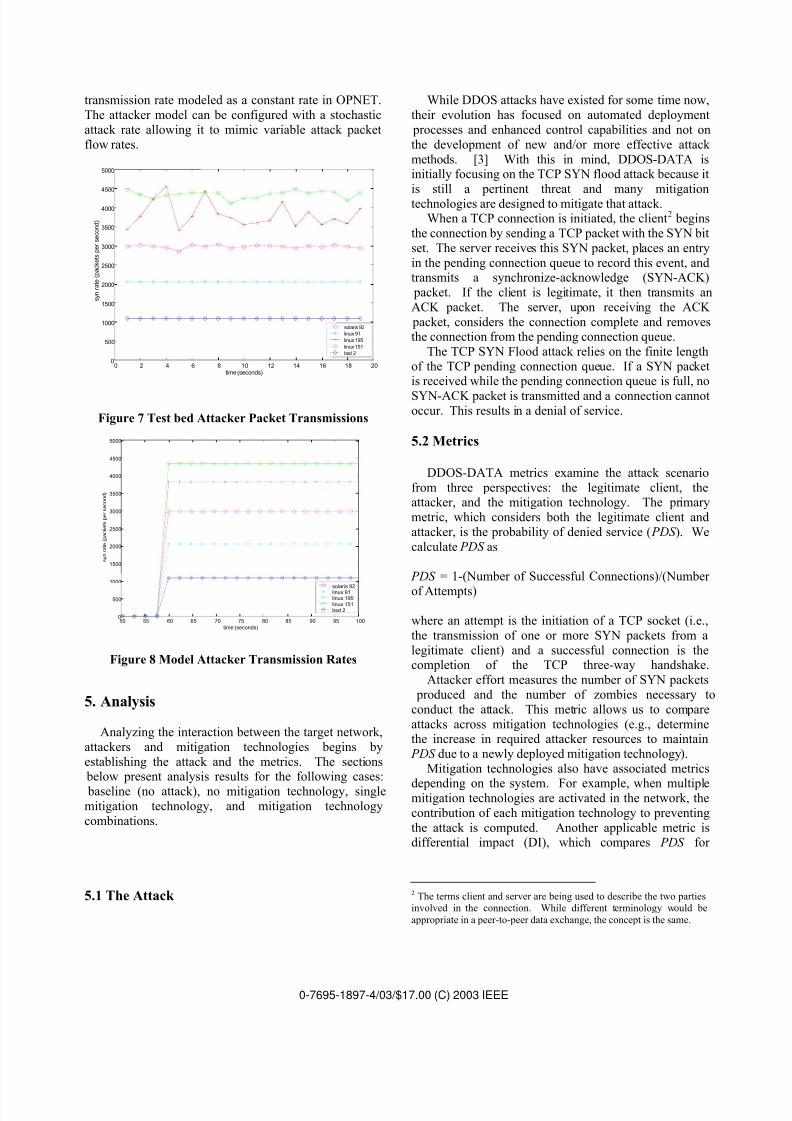
The attack rate for each test bed node is relativelyconstant, as shown in Figure 7. Figure 8 shows the attack
0-7695-1897-4/03/$17.00 (C) 2003 IEEE
8/8/2019 DDOS Interactions
http://slidepdf.com/reader/full/ddos-interactions 5/11
transmission rate modeled as a constant rate in OPNET.
The attacker model can be configured with a stochastic
attack rate allowing it to mimic variable attack packet
flow rates.
0 2 4 6 8 10 12 14 16 18 20 0
500
1000
1500
2000
2500
3000
3500
4000
4500
5000
s y n r a t e ( p a c k e t s p e r s e c o n d )
time (seconds)
solaris 92
linux 91
linux 195
linux 151
bsd 2
Figure 7 Test bed Attacker Packet Transmissions
50 55 60 65 70 75 80 85 90 95 1000
500
1000
1500
2000
2500
3000
3500
4000
4500
5000
s y n r a t e ( p a c k e t s p e r s e c o n d )
time (seconds)
solaris 92linux 91linux 195linux 151bsd 2
Figure 8 Model Attacker Transmission Rates
5. Analysis
Analyzing the interaction between the target network,
attackers and mitigation technologies begins by
establishing the attack and the metrics. The sections below present analysis results for the following cases:
baseline (no attack), no mitigation technology, single
mitigation technology, and mitigation technology
combinations.
5.1 The Attack
While DDOS attacks have existed for some time now,
their evolution has focused on automated deployment
processes and enhanced control capabilities and not on
the development of new and/or more effective attack
methods. [3] With this in mind, DDOS-DATA isinitially focusing on the TCP SYN flood attack because it
is still a pertinent threat and many mitigation
technologies are designed to mitigate that attack.When a TCP connection is initiated, the client2 begins
the connection by sending a TCP packet with the SYN bit
set. The server receives this SYN packet, places an entry
in the pending connection queue to record this event, andtransmits a synchronize-acknowledge (SYN-ACK)
packet. If the client is legitimate, it then transmits an
ACK packet. The server, upon receiving the ACK
packet, considers the connection complete and removesthe connection from the pending connection queue.
The TCP SYN Flood attack relies on the finite length
of the TCP pending connection queue. If a SYN packetis received while the pending connection queue is full, no
SYN-ACK packet is transmitted and a connection cannotoccur. This results in a denial of service.
5.2 Metrics
DDOS-DATA metrics examine the attack scenario
from three perspectives: the legitimate client, theattacker, and the mitigation technology. The primary
metric, which considers both the legitimate client and
attacker, is the probability of denied service ( PDS ). We
calculate PDS as
PDS = 1-(Number of Successful Connections)/(Number
of Attempts)
where an attempt is the initiation of a TCP socket (i.e.,
the transmission of one or more SYN packets from a
legitimate client) and a successful connection is thecompletion of the TCP three-way handshake.
Attacker effort measures the number of SYN packets
produced and the number of zombies necessary to
conduct the attack. This metric allows us to compare
attacks across mitigation technologies (e.g., determinethe increase in required attacker resources to maintain
PDS due to a newly deployed mitigation technology).
Mitigation technologies also have associated metrics
depending on the system. For example, when multiplemitigation technologies are activated in the network, the
contribution of each mitigation technology to preventing
the attack is computed. Another applicable metric isdifferential impact (DI), which compares PDS for
2 The terms client and server are being used to describe the two partiesinvolved in the connection. While different terminology would be
appropriate in a peer-to-peer data exchange, the concept is the same.
0-7695-1897-4/03/$17.00 (C) 2003 IEEE

8/8/2019 DDOS Interactions
http://slidepdf.com/reader/full/ddos-interactions 6/11
multiple mitigation techniques with PDS for a single
mitigation technique.
5.3 Target Network Analysis Parameters
A large variety of parameters drive the target
network’s traffic levels and overall behavior. Traffic isgenerated by either the continuous time Markov Models
described in Subsection 3.1 or OPNET applicationmodels. The parameters used to drive the continuous
time Markov models are too numerous to publish here.Table 2 presents traffic parameters that drive web client
and server behavior
Table 2 Web Traffic Parameters
Parameter Value
Internet Web First
Object Size
Lognormal(2.17e3,1.59)
Internet Web Other
Object Size
Lognormal(2.63e3,1.55)
Internet Number of
Objects
Weibull(0.172,0.6763)
Intranet InterRequest
Time
Exponential(mean =
1390.1)
Intranet InterRequest
Time
Exponential(mean =
231.6)
Server parameters and attacker parameters also
influence system behavior. Table 3 summarizes key
analysis parameters.
Table 3 Analysis Parameters
Parameter ValueAttack Start Time 4500 sec
Attack End Time 5500 sec
TCP PendingConnection Queue Size
39 or 8192
TCP Connection
Retransmission
Attempts
Based
TCP Connection
Retransmission Number
of Attempts
3
5.4 Baseline
Baseline model runs (i.e., no attack, no mitigation)confirm that there is no denied service when no attack is
present in our 500+ node target network. After verifying
this, we subjected the network with no active mitigation
technology to an attack. Initially, a pending connectionqueue size of 39 (consistent with systems present on the
network) was used. These runs show that a single
attacker using a 1000 packets per second SYN flood
attack causes a PDS of 0.97 (averaged over 40 runs3).
Next, we increased the connection queue size to 81924
[6]. The resulting PDS profile is shown in Figure 9. The
two vertical lines denote the start and end of the attack and the circles represent PDS in a one second window
averaged over the forty model runs. When these values
are averaged, the resulting PDS is 0.68.
4000 4500 5000 5500 6000 6500 70000
0.1
0.2
0.3
0.4
0.5
0.6
0.7
0.8
0.9
1
Time (sec)
A v e r a g e P r o b a b i l i t y o f D e n i e d S e r v i c e
40 Runs8192 Connection QueueNo Mitigation
Figure 9 Average PDS as a Function of Time for
8192 Queue
To investigate the impact of traffic load changes, this
analysis was repeated with heavier and lighter trafficloading. Heavier traffic loading was obtained by
activating an additional five file transfers throughout the
network. Traffic for the existing file transfer and all other applications remained unchanged. This results in five
times the traffic volume. For lighter traffic loading, we
disabled all traffic except the Internet/Intranet Webapplications. (Web traffic is required for PDS calculations.) This results in one one-hundredth the
traffic loading.
Model runs were made for light and heavy traffic
loading and PDS was calculated during the attack period. PDS was calculated for each model run and then
averaged over the set of runs. Table 4 shows average
PDS for normal, light, and heavy traffic. Results indicatethat the difference in average PDS for normal and heavy
traffic is less than 2 percent and the difference between
normal and light is less than 5 percent. While these
results suggest a dependence on traffic loading, the
differences are small and we have elected to focus our analysis on mitigation technology.
3 Runtime constraints have forced the number of model runs to vary
across analyses. As time permits, additional runs are being performed.4 A stateful resource attack’s severity can be reduced by providing more
resources.
0-7695-1897-4/03/$17.00 (C) 2003 IEEE

8/8/2019 DDOS Interactions
http://slidepdf.com/reader/full/ddos-interactions 7/11
Table 4 Average PDS for Variable Traffic Conditions
Traffic Type
Average PDS
Standard
Deviation
Number
of Runs
Normal 0.681 0.143 30
Light 0.637 0.126 50
Heavy 0.675 0.134 40
5.5 Active Monitor
To investigate the impact of adding an Active
Monitor, we again used a Pending Connection Queue of
39 and a TCP SYN flood attack of 1000 packets per
second. The average PDS drops from 0.97 to 0.81 over the course of the attack.
Figure 10 shows average PDS as a function of time for
this case. While average PDS is decreased, it nowcontinues beyond the end of the attack when the Active
Monitor is enabled. This deviates from the behavior
shown in Figure 9.Further investigation reveals that the Active Monitor
may misclassify nodes under certain circumstances. In
particular, when the pending connection queue on the
server is full, spoofed SYN packets will be dropped by
the server, no SYN-ACK packet will be sent, and theclient will not respond. Since the Active Monitor
observes the SYN packet but does not observe a
completed handshake, the node is classified as BAD.
When the client does attempt to gain service, theconnection is reset by the Active Monitor. Eventually,
the Active Monitor will observe enough traffic after it
resets the connection to reclassify the node. This
accounts for the drop in PDS shown in Figure 10 as afunction of time. Figure 11 shows the average number of
misclassified nodes as a function of time for this case.5
There are two timing parameters associated with the
Active Monitor. The staleness timer determines themaximum amount of time traffic cannot be observed
before a node is reclassified as NEW. The expire timer is
the amount of time a system waits before it classifies anode as BAD and resets the connection. We have
analyzed the performance impact of varying the expire
timeout. Our results show that a shorter expire timeoutcan cause PDS to decrease because attack connections
are more quickly reset by the Active Monitor. However,
making the expire timeout too short can actually cause PDS to increase as long-delay links are timed out and
misclassified before they can complete the three wayhandshake.
5 This misclassification behavior can be avoided if the Active Monitor
checks that a SYN-ACK is sent by the server before a node can be
classified as BAD. Furthermore, nodes will be reclassified morequickly if they request service at a faster rate. The authors of [4] are
aware of these issues.
1 A pending connection queue of 39 shows similar results.4000 4500 5000 5500 6000 6500 70000
0.1
0.2
0.3
0.4
0.5
0.6
0.7
0.8
0.9
1
Time (sec)
A v e r a g e P r o b a b i l i t y o
f D e n i e d S e r v i c e 50 Runs
39 Connection Queue
Active Monitor Active
A t t a c k S t a r t
A t t a c k E n d
Figure 10 Average PDS for Active Monitor Against
TCP SYN Flood Attack
4000 4500 5000 5500 6000 6500 70000
5
10
15
20
25
30
Time (sec) 4000 4500 5000 5500 6000 6500 70000
5
10
15
20
25
30
Time (sec)
A v e r a g e N u m b e r o f M i s c l a s s i f i e d N o d e s
50 Runs
39 Connection Queue
Active Monitor Active
A t t a c k S t a r t
A t t a c k E n d
Figure 11 Average Number of Nodes Misclassified by
the Active Monitor
5.6 Rate Limiter
Using data derived from the JHU/APL network, the
Rate Limiter model was initially configured to pass one
SYN packet every 16.7 seconds to the server. The
Pending Connection Queue was configured to 8192 and
the network was subjected to the 1000 packet per secondattack between 4500 and 5500 seconds, as before6.
Figure 12 presents PDS as a function of time for thisscenario. Recalling that PDS for a network with no RateLimiter and this attacker is 0.68, PDS actually increases
to 100% with Rate Limiting. Examination of the data
reveals that indiscriminately dropping SYN packetsdestined for the server causes legitimate SYN packets to
be dropped, resulting in an increase in PDS .
6 A pending connection queue of 39 gives similar results.
0-7695-1897-4/03/$17.00 (C) 2003 IEEE

8/8/2019 DDOS Interactions
http://slidepdf.com/reader/full/ddos-interactions 8/11
1 A pending connection queue of 39 shows similar results.4000 4500 5000 5500 6000 6500 7000
0
0.1
0.2
0.3
0.4
0.5
0.6
0.7
0.8
0.9
1
Time (sec)
A v e r a g e P r o b a b i l i t y o f D e n i e d S e r v i c e
42 Runs
8192 Connection Queue
Rate Limiter Active
A t t a c k S t a r t
A t t a c k E n d
Figure 12 Average PDS with Outbound Rate Limiting
and 1000 pps Attack
Next we modified the rate limiting rules so that each
input to the core router was limited (an inboundconfiguration as discussed in Subsection 3.2). Using the
same attack as before, and configuring the Rate Limiter
to pass SYN packets as appropriate for each interface, the
attack was run and PDS computed. Figure 13 shows PDS as a function of time for all hosts trying to use the
attacked web server.
Figure 13 shows that PDS , calculated over 1 second
windows, varies between 0 and 1 during the attack. Toexplain this change, PDS was re-calculated for two cases.
The first (Figure 14) was for hosts that used the same
router interface as the attacker. These hosts had a PDS of 1.0 during the attack. The second (Figure 15) is for hosts
using other interfaces. These hosts had a PDS of 0.0 for the attack. This finding suggest that while the Rate
Limiter, in this configuration, may increase the denied
service of legitimate traffic that shares the network pathused by the attacker, it does protect users who do not
share this path.
4000 4500 5000 5500 6000 6500 70000
0.1
0.2
0.3
0.4
0.5
0.6
0.7
0.8
0.9
1
Time (sec)
A v e r a g e P r o b a b i l i t y
o f D e n i e d S e r v i c e
41 Runs
8192 Connection Queue
Rate Limiter Active
A t t a c k S t a r t
A t t a c k E n d
Figure 13 Average PDS as a Function of Time for
Inbound Rate Limiting (All Hosts)
4000 4500 5000 5500 6000 6500 70000
0.1
0.2
0.3
0.4
0.5
0.6
0.7
0.8
0.9
1
Time sec
A v e r a g e P r o b a b i l i t y o f D e n i e d S e r v i c e 41 Runs
8192 Connection Queue
Rate Limiter Active
A t t a c k S t a r t
A t t a c k E n d
Figure 14 Average PDS for Clients Sharing an
Interface with the Attacker
5.7 Proof of Work
A server using the Proof of Work technology andconsidering itself under attack will require clients to
perform work before they are granted resources (i.e.,
space in the pending connection queue). In this
implementation, the work is solving a cryptographic puzzle. The server will request that a puzzle be solved
when its pending connection queue exceeds a certainlevel (defined by the pending connection queue length
minus the defense threshold). It is assumed that thelegitimate clients are aware of the Proof of Work
technology and will first request access to the server via
the Proof of Work protocol. The server’s response tothese requests determines if the client can immediately
request the resource or must first solve a puzzle.
0-7695-1897-4/03/$17.00 (C) 2003 IEEE

8/8/2019 DDOS Interactions
http://slidepdf.com/reader/full/ddos-interactions 9/11
4000 4500 5000 5500 6000 6500 70000
0.1
0.2
0.3
0.4
0.5
0.6
0.7
0.8
0.9
1
Time (sec)
A v e r a g e P r o b a b i l i t y
o f D e n i e d S e r v i c e
41 Runs
8192 Connection Queue
Rate Limiter Active
A t t a c k S t a r t
A t t a c k E n d
Figure 15 Average PDS for Clients that do not Share
the Attacker’s Interface
We first subjected the internal web server, equipped
with Proof of Work, to the 1000 SYN per second SYN
flood attack previously described. Since the attacker does not know about the Proof of Work protocol, they are
not properly requesting permission to use the server and
their SYN packets are simply dropped. This results in a PDS of zero for this attack.
If the attacker is aware of the Proof of Work process,
they would modify their attack. The simplest
modification is to attempt a SYN flood while accounting
for the Proof of Work protocol. The attacker, in this
case, asks for permission to use the server and, if necessary, will attempt to solve the puzzle. Examination
of the model output for this case reveals zero PDS . The
attacker will initially fill up the pending connection
queue as it is given approval to submit requests for resources. However, when only defense threshold slots
remain available, the server begins to request that puzzles
be solved before resources can be requested. Theattacker is then required to solve many puzzles (one for
each request) and their CPU becomes increasingly
overwhelmed. Our analysis shows that the attacker’s
ability to send attack packets decreases, lightening theattack, and allowing service to continue for legitimate
clients (i.e., PDS is zero).
Since the puzzle process overwhelms the attacker’sability to send packets, an attacker would seek to solve
the puzzles more quickly perhaps by distributing the
work load across multiple systems. To examine this, the
model was configured to use 450 low rate attackers each producing an attack every 0.45 seconds (for a net attack
of 1000 packets per second). The results of this attack
are shown in Figure 16. The average PDS is 0.66, which
is comparable to the 0.68 for the baseline attack.
4000 4500 5000 5500 6000 6500 70000
0.1
0.2
0.3
0.4
0.5
0.6
0.7
0.8
0.9
1
Time (sec)
A v e r a g e P r o b a b i l i t y
o f D e n i e d S e r v i c e
40 Runs8192 Connection QueueProof of Work Activated
Figure 16 Average PDS for Distributed Proof of Work
Attacker (8192 Pending Connection Queue)
5.8 Active Monitor and Rate Limiter
Our results show that the Active Monitor, by itself,
reduces PDS to 0.01 from 0.68 during a 1000-pps SYN
flood. Although PDS is reduced, the attacker bandwidth
remains unconstrained. To investigate the impact of increasing bandwidth allocated to this service while
another mitigation technology is present, the Active
Monitor and the Rate Limiter were activated and the RateLimiter normal traffic rate was varied. Figure 17 shows
average PDS as a function of the Rate Limiter normal
rate for the Rate Limiter, by itself, and with the Active
Monitor. In both scenarios, average PDS remains above
0.99 until the normal rate reaches 100,000 (312.5 SYN packets per second). However, as the normal rate reaches
100,000, PDS drops more sharply in the multiple-
mitigation case (average PDS drops to 0.68, as comparedto 0.84). In both scenarios, the effect of the Rate Limiter
lessens as normal rate increases and the effect of the Rate
Limiter on PDS disappears when the normal rate exceedsthe attack rate (i.e., the Rate Limiter passes all attack
packets). In the multiple-mitigation case, the PDS
limiting value is the average PDS shown previously for
the Active Monitor case (average PDS of 0.01).
The effect of combining the two mitigations illustratesthe tradeoff between reduced PDS and restricted attacker
bandwidth. In particular, reducing attacker bandwidth by
about one-third introduces a PDS of 0.4, and reducing
attacker bandwidth by about two-thirds introduces a PDS
of 0.68. The latter case produces an average PDS comparable to the nominal value with no mitigation
technology in place. Thus, the advantage of reducedattacker bandwidth is gained without decreasing the level
of available service. Of course, the attacker could
increase the attack rate, filling the available bandwidth. If
this occurred, then this scenario reduces to the Rate
Limiter one attacker case previously analyzed.
0-7695-1897-4/03/$17.00 (C) 2003 IEEE

8/8/2019 DDOS Interactions
http://slidepdf.com/reader/full/ddos-interactions 10/11
20 200 2000 20000 200000 20000000
0.1
0.2
0.3
0.4
0.5
0.6
0.7
0.8
0.9
1
Normal Rate (bits per sec)
A v e r a g e P r o b a b i l i t y o f D e n i e d S e r v i c e
Active Monitor & Rate Limiter Rate Limiter
PDS -- No Mitigation Technology
PDS -- Active Monitor Activated
40 Runs8192 Connection QueueRate Limiter Activated
Active Monitor Activated
Figure 17 Average PDS as a Function of Rate Limiter
Normal Rate
5.9 Proof of Work and Active Monitor
The Proof of Work process requires clients to use their real addresses to request Proof of Work puzzles, which
must be solved before a connection is allowed. This
process eliminates an attacker’s ability to spoof the
source address of attack packets. As previously
discussed, the primary weakness of the Active Monitor ismisclassification resulting from an attacker spoofing
legitimate client addresses. Given this information, it
seems that the two mitigation strategies may have a
synergistic effect in lowering PDS during an attack.A distributed Proof of Work attack of about 1000 pps
is launched against the internal Web server. In this case,
Proof of Work and the Active Monitor are activated.With a queue size of 8192, the average PDS over the
entire attack period is 0, as shown in Figure 18. This
result is consistent with earlier Active Monitor results
with this queue size. With a queue size of 39, as shown in
Figure 19, average PDS over the entire period isapproximately 0, much lower than the resulting PDS of
0.81 using only the Active Monitor. In this example, the
attacker is unable to send spoofed attack packets withlegitimate client addresses. Consequently, the
misclassification problem is removed and the Active
Monitor proves much more capable at mitigating theattack.
4000 4500 5000 5500 6000 6500 70000
0.1
0.2
0.3
0.4
0.5
0.6
0.7
0.8
0.9
1
Time (sec)
A v e r a g e P r o b a b i l i t y o f D e n i e d S e r v i c e
40 Runs
8192 Connection Queue
Proof of Work Activated
Active Monitor Activated
Figure 18 Average Probability of Denied Service for
Proof of Work and Active Monitor (8192 Queue)
4000 4500 5000 5500 6000 6500 70000
0.1
0.2
0.3
0.4
0.5
0.6
0.7
0.8
0.9
1
Time (sec)
A v e r a g e P r o b a b i l i t y o f D e n i e d S e r v i c e
40 Runs39 Connection QueueProof of Work ActivatedActive Monitor Activated
Figure 19 Average PDS for Proof of Work and Active
Monitor (39 Queue)
When a TCP SYN packet is transmitted without prior payment to a server protected by the Proof of Work
mitigation technology, the server simply discards the
packet. While this mitigation feature is effective againstthe baseline attack, it does interfere with the three-way
handshake. Because the Active Monitor monitors this
handshake, an attacker could conceivably use this to their
advantage. To investigate this, the combination of Proof
of Work and Active Monitor was subjected to a modifiedattack. The attacker generates a stream of spoofed SYN
packets directed at the server. The server’s Proof of Work
process discards these attack packets because they did notmake a Proof of Work request. However, because the
Active Monitor is not aware of the Proof of Work
process, it interpreted unacknowledged SYN packets as
an attack and classifies the source addresses as BAD.Thus, the attacker can send an attack packet to the server
for each node the attacker wishes to deny service. When
the misclassified nodes make a connection attempt, the
connection is reset, resulting in a denial of service.
0-7695-1897-4/03/$17.00 (C) 2003 IEEE

8/8/2019 DDOS Interactions
http://slidepdf.com/reader/full/ddos-interactions 11/11
Average PDS for the targeted clients, as shown in Figure
20, is 0.69 for the first 1000 seconds after the attack
began and is 0.31 from 5500 seconds until the end of the
simulation. As in the case of the baseline attack, PDS
declines after the attack because the Active Monitor eventually reclassified the victim nodes as GOOD after it
observed legitimate TCP traffic from them.
This attack is effective because the Active Monitor and Proof of Work mitigation strategies do not coordinate
efforts that interfere with each other’s observed data. If
the Active Monitor only monitored connections approved
by the Proof of Work process, then this attack would not be effective. In this case, an attack that is ineffective
against a mitigation technology (Proof of Work) is made
effective by the addition of the Active Monitor.
4000 4500 5000 5500 6000 6500 70000
0.1
0.2
0.3
0.4
0.5
0.6
0.7
0.8
0.9
1
Time (sec)
A v e r a g e P r o b a b i l i t y o f D e n i e d S e r v i c e
40 Runs39 Connection QueueActive Monitor Activated
Proof of Work Activated
Figure 20 Average PDS Over 100-Second Windows
with Proof of Work and Active Monitor and
6. Conclusions
DDOS-DATA is examining the relationship between
mitigation technologies and computer network attacks.By using analysis, we are developing a detailed
understanding of the interaction between DDOS
mitigation technologies and attackers. This type of
understanding is critical to breaking the reactionary cycle
that currently exists between attackers and defenders.Modeling and Simulation is useful for performing
these analyses. When using Modeling and Simulation,
verification and validation are both necessary and critical
to the analysis. Without these activities, the validity of any conclusions drawn from the analysis is in question.
Our initial study conclusions are:
• It is important that systems be tuned to best
defend themselves against attacks beforemitigation technologies are applied.
• Mitigation techniques that seek to classify nodes
must consider that an attacker can use that
misclassification to their advantage.
Classification schemes should account for data
loss (e.g., packets lost in the network) to as great
an extent as possible.
• Blind Rate Limiting techniques can reduce
DDOS effects for those links not involved in theattack. However, they can amplify effects for
clients who share communication links with theattacker.
• Requiring a client to make a payment can be an
effective countermeasure against DOS attackers.However, these mechanisms can be overcome
by subjecting the system to a distributed attack
that spreads the payment mechanism throughoutthe network.
• Mitigation technologies can be successfully
combined but only when they either shareinformation or when they are designed to not
interfere with each other. Otherwise combining
systems may introduce vulnerabilities or increase attack effectiveness.
8. References
1. http://www.iaands.org/FTN_Main.htm provides
information on the DARPA Fault Tolerant
Networks Program2. JHU/APL Report “Distributed Denial of Service
Defense Attack Tradeoff Analysis Verification
and Validation Report,” September 2002, VS-02-
104.
3. “CERT/CC Overview Incident and VulnerabilityTrends,” CERT Coordination Center, Pittsburgh,
PA. 2002. http://www.cert.org/present/cert-
overview-trends/4. Schuba, C.L., et. al, “Analysis of Denial of
Service Attack on TCP,” Proceedings. 1997 IEEE
Symposium on Security and Privacy; Los
Alamitos, CA, USA: IEEE Computer Society.Press, 1997, p. 208-223
5. Juels, A. and Brainard, J., “Client Puzzles: A
Cryptographic Countermeasure Against
Connection Depletion Attacks,” Proceedings of
the 1999 Network and Distributed SystemSecurity Symposium; Reston, VA, USA, 1999. p.
151-165 6. Gregg, D. M. , et. al., “Characterizing stateful
resource attacks using modeling and simulation,”Quality and Reliability Engineering International
(Wiley)18, no. 3, (May-June 2002) : p. 251-60.