dcpp steam generator replacement project d.13 traffic … · los traffic conditions multi-lane ......
TRANSCRIPT

DCPP Steam Generator Replacement Project D.13 TRAFFIC AND CIRCULATION
August 2005 D.13-1 Final EIR
D.13 Traffic and Circulation This section addresses how traffic caused by the Proposed Project would directly or indirectly affect traffic and circulation on the roadways in the vicinity of DCPP. Section D.13.1 identifies the roadway segments most likely to be affected, the behavior of existing traffic in the area, and how the existing per-formance of the roads is currently classified. Section D.13.2 describes the regulations that govern large loads on the roadways and how work may be conducted within the traveled lanes. Sections D.13.3 through D.13.5 describe how the Proposed Project and alternatives would impact local on-road traffic. Trans-portation of radioactive materials and logistics of activities affecting marine vessels in Port San Luis are described previously in Section D.12, System and Transportation Safety.
D.13.1 Environmental Setting for the Proposed Project
D.13.1.1 Roadway and Intersection Classification Circulation conditions are often described in terms of levels of service (LOS). LOS is a means of describ-ing the existing amount of traffic on a roadway versus the design capacity of the roadway. The design capacity of a roadway is defined as the maximum rate of vehicle travel (e.g., vehicles per hour) that can reasonably be expected along a section of roadway. Capacity is dependent on a number of variables in-cluding road classification and number of lanes, road condition, terrain, and weather and driver charac-teristics. LOS is generally a function of the ratio of traffic volume (V) to the capacity (C) of the roadway or intersection. The LOS rating uses qualitative measures that characterize operational conditions within a traffic stream and their perception by motorists. These measures include freedom of movement, speed and travel time, traffic interruptions, types of vehicle, comfort, and convenience.
Trucks and other large or heavy vehicles (e.g., wider than normal vehicles, slower moving tractors) impact LOS by occupying more roadway space and by having reduced operating qualities as compared to passenger cars. Because heavy vehicles accelerate more slowly than passenger cars, gaps form in traffic flows that affect the efficiency of the roadway. Also, intersections present a number of variables that can influence LOS, including curb parking, transit buses, turn lanes, signal spacing, pedestrians, and signal timing.
The Highway Capacity Manual (HCM) (TRB, 1994) is widely used in traffic studies for predicting LOS for a range of roadways and intersections. The HCM established LOS classifications depending on roadway volume to capacity (V/C) ratios for different types of roadways and for intersections; these are given in Table D.13-1. The LOS of a roadway is described using a scale ranging from A to F, with A indicating excellent traffic flow quality and F indicating stop-and-go traffic. Level E is normally associated with the maximum design capacity that a roadway or intersection can accommodate. LOS A, B, and C are generally considered satisfactory. LOS D is considered tolerable in urban areas during peak hours due to the high cost of improving roadways to LOS C.
For divided highways, the LOS classifications are based on the vehicle density, which is a measure that quantifies the proximity of vehicles to each other within the traffic stream and indicates the degree of maneuverability within the traffic stream (TRB, 1994).

DCPP Steam Generator Replacement Project D.13 TRAFFIC AND CIRCULATION
Final EIR D.13-2 August 2005
Table D.13-1. LOS vs. Volume to Capacity Ratios for Different Types of Roadways V/C
LOS Traffic Conditions Multi-Lane Freeways*
2-Lane Highways** Arterials Intersections
A Free-flow conditions with unimpeded maneuverability. Stopped delay at signalized intersections is minimal.
0.30 0.15-0.26 0.00-0.60 <0.60
B In the range of stable flow, but the presence of other users in the traffic streams begins to be noticeable.
0.50 0.27-0.42 0.61-0.70 0.60-0.69
C In the range of stable flow, but marks the beginning of the flow in which the operation of individual users becomes significantly affected by interactions with others in the traffic stream.
0.71 0.43-0.63 0.71-0.80 0.70-0.79
D High-density but stable flow. Speed and freedom to maneuver are severely restricted, and the driver experiences poor level of comfort.
0.89 0.64-0.99 0.81-0.90 0.80-0.89
E Near capacity. Operations with significant delays and low average speeds.
1.00 1.00 and over
0.91-1.00 0.90-0.99
F Forced or breakdown flow. Operations with extremely low speeds, high delay.
— — >1.00 1.00 and over
Sources: TRB, 1994 and Caltrans, 2002. * V/C for 65 mph vehicle speed. ** V/C for level terrain, when passing is allowed.
As discussed above, LOS is determined not only by traffic volumes but also by a number of roadway con-ditions and intersection details. Determining a roadway’s potential to present a traffic flow problem is a time-consuming process; therefore, a screening approach is often utilized. The screening approach involves comparing the roadway class with a traffic volume level for each LOS. The screening levels are developed by making generic assumptions for the data input in the HCM calculations. The screening approach, however, is used for roadways and not for intersections.
Table D.13-2 shows the screening traffic volume levels for determination of LOS for roadways in the area. This table has been adopted by Santa Barbara County for screening of traffic impacts. San Luis Obispo County does not have a screening approach similar to Santa Barbara County. However, past EIRs for San Luis Obispo County, including those for the Avila Beach (ADL, 1997), Guadalupe Oil Field Remediation (ADL, 1998) projects, and Diablo Canyon Independent Spent Fuel Storage Installation proj-ects (MRS, 2003), have successfully used a screening approach to determine LOS. The roadway capac-ities listed in the table are “rule of thumb” figures. Some factors that affect these capacities are intersections (numbers and configuration), degrees of access control, roadway grades, design geometries (horizontal and vertical alignment standards), sight distance, level of truck and bus traffic, and level of pedestrian and bicycle traffic.
Table D.13-2. LOS Screening Classifications and Roadway Daily Volumes LOS Classes
Roadway Class Number of Lanes A B C D E
Freeway 4 29,600 49,600 59,200 66,600 74,000 Arterial 4 23,900 27,900 31,900 35,900 39,900 Arterial 2 12,000 14,000 16,000 18,000 20,000 CollectorMajor 2 9,600 11,200 12,800 14,400 16,000 Collector 2 7,100 8,200 9,400 10,600 11,800 Source: Avila Beach EIR (ADL, 1997).

DCPP Steam Generator Replacement Project D.13 TRAFFIC AND CIRCULATION
August 2005 D.13-3 Final EIR
LOS values are often developed by county engineering and public works departments to address impacts of development projects on future roadway requirements. These analyses are normally conducted as part of a community plan, such as the County of San Luis Obispo Annual Resource Summary Report (SLO County, 2003). The analyses generally utilize the detailed approach given in the HCM and include both roadways and intersections. When these types of detailed analysis are available for roadways within the study area, the LOS classifications from the more detailed approach is used over the screening LOS level approach.
Special studies have been conducted on Avila Beach Drive, which has special LOS criteria that were adopted in 1994. The special criteria were a result of a Wilbur Smith Associates study, which showed liberal capacity values using car following techniques (WSA, 1992). Avila Beach Drive operates with high peaks of traffic due to weekend and summer peak season tourist and beach enthusiasts. Therefore, special LOS criteria have been developed which represent a compromise analysis of off-season and in-season loading. These criteria are:
• Week-long volume taken the second week in May; • Count location taken west of San Luis Bay Drive; • An average peak hour load is determined from an average value of Monday thru Friday 3:00 p.m.
to 6:00 p.m. volumes.
Capacity for Avila Beach Drive is based on two-way flow criteria as follows (peak hour volumes):
• LOS A < 985 vehicles per hour (vph); • LOS B < 1130 vph; • LOS C < 1280 vph; • LOS D < 1440 vph; • LOS E < 1615 vph.
Avila Beach Drive can be assumed to have the capacity of a two-lane collector roadway, because the hourly capacity values are roughly 10 percent of daily values for a typical two-lane collector roadway (as in Table D.13-2). Traffic volumes during peak and non-peak months and times of the year (specifically summer periods) are considered because previous studies indicate that traffic in Avila Beach could be 50 to 100 percent higher on summer weekends (WSA, 1992 and TPG, 2001).
D.13.1.2 Existing Conditions The existing circulation system within the DCPP site consists of a single private two-lane paved road (Diablo Canyon Road, also know as the DCPP Access Road) that begins at Avila Beach Drive (approx-imately 7 miles southeast of DCPP) (see Figure B-1). The DCPP Access Gate prevents public traffic from entering the site and using the road. Immediately after leaving the Access Gate, the DCPP Access Road follows the topography northwest of Point San Luis. After circumventing Point San Luis, the pri-mary road proceeds northwest, parallel to the coastline until it reaches the DCPP site.
The DCPP Access Road accommodates the existing 1,400 DCPP permanent employees that use approx-imately 900 vehicles (the San Luis Obispo County Transportation Management Association [TMA] provides vanpools for DCPP employees). During planned DCPP outage periods, which last an average of 30 to 40 days3 months, an average of 1,285 up to 1,100 outage support personnel also use the DCPP Access Road to travel to DCPP. Planned outages occur every 18 to 21 months for each of the two DCPP reactors, thus an outage occurs every 9 to 11 months. During this period, DCPP Access Road experi-ences up to 2,000 2,200 round trips per day, or up to 4,0004,400 one-way trips per day. The most recent traffic counts for the Avila Beach area roadways that were used in the preparation of this analy-

DCPP Steam Generator Replacement Project D.13 TRAFFIC AND CIRCULATION
Final EIR D.13-4 August 2005
sis were collected outside of the planned outage periods (e.g., May and July of 2002-2003), and there-fore these traffic counts do not account for the planned outage-related traffic.
A primary road remains paved north of DCPP for a short distance and then becomes an unpaved road. There are several other unpaved roads on the PG&E property. These unpaved roads, however, do not provide primary access for DCPP employees and are not used to any noticeable degree. An unpaved road extends to the northerly boundary of the DCPP property that is shared with Montaña De Oro State Park. There is a secured gate across this road at the northern boundary.
Regional access to DCPP from U.S. Highway 101 is via the Avila Beach area, which is served by a rel-atively sparse network of two-lane rural roadways. Only two routes connect to Highway 101 interchanges: Avila Beach Drive and San Luis Bay Drive. These two routes, west of the freeway, join into a single roadway leading to Avila Beach and Port San Luis. Other roadways in the study area are generally classified as collectors or minor roadways.
The area roadways are shown in Figure D.13-1. Project area existing and future traffic conditions are summarized in Table D.13-3.
Avila Beach Drive. Avila Beach Drive is a winding, 4.5-mile, two-lane roadway from Highway 101 to its terminus at Port San Luis. East of Cave Landing Road, Avila Beach Drive maintains minimal shoulders as the roadway width is constrained on the south by steep rocky slopes and on the north by the parallel San Luis Obispo Creek. A short section of Avila Beach Drive is widened to accommodate a left turn bay for eastbound vehicles turning north on San Luis Bay Drive. Additional left turn bays exist on the segment of Avila Beach Drive at Cave Landing Road and Ontario Road. West of Cave Landing Road, Avila Beach Drive maintains left-turn pockets at all intersecting collector roadways and generally accommodates summer peak parking demands along both shoulders.
Avila Beach Drive is listed as a collector roadway in San Luis Obispo County’s General Plan (San Luis Bay – Coastal Area Plan, 1997) and as an arterial road in San Luis Obispo County’s Avila Circulation Study (TPG, 2001). For the purposes of this EIR, Avila Beach Drive is considered a collector roadway because its curves and lack of passing lanes give it a lower capacity than that of a typical arterial road. In addition, the LOS peak hour volumes established by San Luis Obispo County are indicative of a two-lane collector roadway.
The 2003 San Luis Obispo County Annual Resource Summary Report (SLO County, 2003) indicates that Avila Beach Drive has no current recommended Level of Severity1 classification; however, this road-way is listed as a road with increasing traffic volumes, which may lead to a future Level of Severity recom-mendation from the County.
San Luis Bay Drive. San Luis Bay Drive begins just east of Highway 101 and terminates with a stop-sign controlled intersection at Avila Beach Drive, approximately 2.8 miles east of the DCPP security gate. The intersection with Avila Beach Drive is approximately 1.4 miles southwest of the interchange with Highway 101. San Luis Bay Drive is listed as a collector roadway by the San Luis Obispo County General Plan. San Luis Bay Drive is a two-lane roadway, and is generally used by trips originating or ter-minating north of Avila Beach, primarily in San Luis Obispo. Shoulders along San Luis Bay Drive are not wide enough to allow for parking. 1 San Luis Obispo County has the following road classifications. Level of Severity I: When traffic projections indi-
cate that roadway level of service “D” will occur within five years. Level of Severity II: When traffic projec-tions indicate that roadway level of service “D” will occur within two years. Level of Severity III: When cal-culation of existing traffic flows indicates a roadway level of service “D.”

DCPP Steam Generator Replacement Project D.13 TRAFFIC AND CIRCULATION
August 2005 D.13-5 Final EIR
Figure D.13-1. Project Area Roadway System CLICK HERE TO VIEW

DCPP Steam Generator Replacement Project D.13 TRAFFIC AND CIRCULATION
Final EIR D.13-6 August 2005
This page intentionally blank.

DCPP Steam Generator Replacement Project D.13 TRAFFIC AND CIRCULATION
August 2005 D.13-7 Final EIR
Other Collector Roadways. Collector roadways in the study area include Front Street, San Luis Street, San Miguel Street, Cave Landing Road, See Canyon Road, and Monte Road. Front, San Luis, and San Miguel Streets are located in central Avila Beach. Front Street is located between the beach on the south and commercial shops on the north, beginning at Avila Beach Drive and proceeding to the east. San Luis Street and San Miguel Street provide access from Avila Beach Drive to the commercial and parking facilities in Avila Beach.
D.13.1.3 Existing Roadway Performance Existing traffic circulation and roadway operating conditions for the Proposed Project area were com-piled for the roadways and intersections along the transportation routes in the vicinity of the Proposed Project. Average daily traffic (ADT) and peak hour traffic flow measurements were used to classify the road segments according to the LOS shown in Table D.13-2 or as produced from area documents as dis-cussed above. Information was obtained for Highway 101 from the California Department of Transpor-tation (Caltrans) and for major roads and arterial roads from the San Luis Obispo County Public Works and Engineering Departments. For areas where peak hour traffic data was not available, it was assumed to be 10 percent of ADT. Table D.13-3 lists the segments of each route that could be affected by the project, along with the corresponding traffic volumes, LOS classification, and volume-to-capacity ratios. The Applicant estimates existing daily plant traffic at 900 vehicles per day (vpd) with 1,285 1,100 more vehicles during maintenance power outages, which occur every 9 to 11 months for an average of 30 to 40 days3 months.
Some local roads in the vicinity of Avila Beach and several stretches of Highway 101 (see Tables D.13-3 and D.13-4) that could be affected by the Proposed Project currently show poor LOS levels. These exist-ing conditions include:
• Stretches of Highway 101: LOS D or E • Avila Beach Drive: LOS C or D (during summer peak periods) • Los Osos Valley Road near Diablo Canyon’s alternate evacuation route: LOS D.
The sections of Highway 101 with the heaviest traffic include the junctions with Highway 135 (LOS D), south Pismo Beach (LOS D or E), Shell Beach and Avila Beach Drive (LOS D), San Luis Bay Drive, Higuera Street, and Los Osos Valley Road (LOS E). The worst traffic in the area is experienced on Highway 101 in San Luis Obispo at the Madonna Road/Route 227 Junction and at the Marsh Street exit (LOS E to F) (Caltrans, 2003).
D.13.1.4 Seasonal, Weekly, and Hourly Variations Avila Beach experiences significant variations in traffic depending on the time of the year and weekend or non-weekend period. Avila Beach Drive and San Luis Bay Drive experience heavy weekend traffic during summer months, when traffic is approximately 20 percent greater than non-summer weekends and 50 percent greater than summer weekdays (SLO County Traffic Volume Report; TPG, 2001). San Luis Obispo County bases LOS calculations on non-summer weekday traffic volumes (the month of May peak levels). The existing traffic volume for Avila Beach Drive near San Luis Bay Drive, according to County calculations (3-hour average during weekdays in the month of May), is about 8,200 vpd, or LOS A (SLO County, 2003).
The Avila Beach Drive segment west of San Luis Bay Drive and east of San Luis Street carries the largest traffic volumes in the area, typically ranging from approximately 12,000 vpd during summer weekends to 8,100 vpd on non-summer weekdays (see Table D.13-3). During summer weekdays, traffic volumes are fairly balanced between San Luis Bay Drive and Avila Beach Drive, with approximately
DCPP Steam Generator Replacement Project D.13 TRAFFIC AND CIRCULATION
Final EIR D.13-8 August 2005
6,700 to 7,000 vpd utilizing each roadway; during the peak weekends, however, about 60 percent of traffic utilizes Avila Beach Drive and 40 percent uses San Luis Bay Drive (DKS Associates, 1990). Historical data indicates that peak hour traffic can range up to about 1,400 trips, or LOS D during summer week-ends, and down to below 170 hourly trips during winter weekdays (SLO County, 2004). All historical LOS ratings that are worse than LOS A occur between May and August, during the evening peak hour period, or during the weekend.
Distinct inbound (westbound) and outbound (eastbound) peaks are prevalent on San Luis Bay Drive and Avila Beach Drive over a summer weekend: the inbound peak typically occurs between 11:00 a.m. and 1:00 p.m. while the outbound peaks are between 2:00 p.m. and 4:00 p.m. (TPG, 2001 and DKS Associ-ates, 1990). Overall in the Avila Beach area, two-way volumes peak between 1:00 p.m. and 3:00 p.m. on weekends, when approximately 11 percent of the total 24-hour traffic utilizes the roadways (DKS Associates, 1990). Avila Beach Drive traffic counts conducted for a non-summer week in May exhibit two different peaks. The non-summer a.m. peak hour occurred at 6 a.m., while the p.m. peak hour was evident at 6 p.m. These hours correspond to the traffic peaks for Diablo Canyon Road (DCPP Access Road), which are between 5 a.m. and 7 a.m. in the morning, and between 4:00 p.m. and 6:00 p.m. in the afternoon (Unocal, 1998). San Luis Bay Drive exhibited a similar non-summer weekday trend except the p.m. peak occurred earlier in the day, between 3:00 p.m. and 4:00 p.m.
D.13.1.5 Future Conditions The anticipated future conditions of the roadways are shown in Table D.13-3 and described here because the Proposed Project would not take place immediately upon approval and steam generator replacement activity would not begin to peak until 2008.
Annual population growth in California is about 1.8 percent (based on the years 1990–2000), which is comparable to San Luis Obispo’s 1.4 percent growth rate between 1990 and 2000 (U.S. Census, 2000). Avila Beach and Avila Valley experienced an annual growth of 2.4 percent between 1980 and 2000. Traffic growth numbers in the Avila Beach area are mostly dependent on the increase in tourist visits, and not directly on the population growth in the area itself. An increase in the number of tourist visits to the Avila Beach area would most likely depend on the population growth in San Luis Obispo County.
San Luis Obispo County traffic counts for the Avila Beach area during the last five to seven years are considered anomalous due to the restricted beach access and reduced number of visitors during the Avila Beach Remediation Project, and therefore these numbers were not used. The San Luis Obispo County traffic models estimated annual growth rates between 1.2 and 1.6 percent based on information from the Caltrans Route Concept Report (Caltrans, 2001). Therefore, for prediction of future traffic conditions, a 1.4 percent annual traffic growth was used for the local Avila Beach roads.
The Caltrans Route Concept Report for the relevant sections of Highway 101 between the Santa Barbara County Line and the South San Luis Obispo Urban Area (Caltrans sub-segment 4), indicates that High-way 101 is currently operating at LOS C and D for non-peak and peak periods, respectively, and is antici-pated to be operating at LOS F by the year 2020. The San Luis Obispo County traffic model estimates also predict the future traffic and population growth, which is done for the Caltrans planning documents (Caltrans, 2001). The Route Concept Report, however, does not examine highway segments in terms of interchanges.

DCPP Steam Generator Replacement Project D.13 TRAFFIC AND CIRCULATION
August 2005 D.13-9 Final EIR
Table D.13-3. Existing and Future Traffic Conditions in the Project Area Existing Traffic Future Traffic
Road/Route ADT Peak Hour
Peak Hour LOS, V/C
ADT
Peak Hour
Peak Hour LOS, V/C
Diablo Canyon Road (Access Road) a 1,800 180 A, 0.11 1,8001,903 180190 A, 0.110.12 Avila Beach Dr. e/o Diablo Canyon Road (Access Road) 5,622 616 A, 0.38 5,944 651 A, 0.40 Avila Beach Dr. w/o Diablo Canyon Road (Access Road) 3,373 355 A, 0.22 3,566 375 A, 0.23 Avila Beach Dr. w/o San Luis Bay Dr. peak b 11,986 1,172 C, 0.73 12,671 1,239 C, 0.77 Avila Beach Dr. w/o San Luis Bay Dr. 8,177 805 A, 0.50 8,645 851 A, 0.53 San Luis Bay Drive n/o Avila Beach Dr. 6,532 625 A, 0.39 6,906 661 A, 0.41 San Luis Bay Drive w/o Ontario Rd. 6,936 699 A, 0.43 7,333 739 A, 0.46 Shell Beach Road s/o Avila Beach Dr. 4,945 429 A, 0.27 5,228 454 A, 0.28 San Miguel s/o Avila Beach Dr. 1,512 178 A, 0.11 1,598 188 A, 0.12 Front St. e/o Avila Beach Dr. 5,781 709 A, 0.44 6,112 750 A, 0.46 Source: SLO County, 2004. Notes: Peak hour LOS calculated based on the criteria developed specifically for Avila Beach areausing Santa Barbara County thresholds or
Highway Capacity Software. V/C = the volume to capacity ratio for peak hour traffic, capacity is based on roadway class with LOS of E; ADT = Average Daily Traffic. e/o = “east of”; w/o = “west of”; n/o = “north of”; s/o = “south of” a Diablo Canyon Road ADT is comprised with 900 vehicles carrying 1,400 DCPP permanent employees. Traffic on this private road is dependent
only on DCPP activities and would not follow the normal population growth trends in the area. b Traffic data for peak season - during summer.
Highway 101 traffic data from Caltrans is available for the past seven years for each segment between inter-changes (exits). This data was used to make a more detailed estimate of the annual traffic growth rates over the last seven years. These annual growth rates were used to extrapolate the existing traffic counts and estimate future traffic conditions in the area for the next three to four years. It was assumed that traffic volumes on Highway 101 in the area would grow at the same rate as they have been growing for the last seven years. Future traffic conditions on Highway 101 are shown in Table D.13-4.
Table D.13-4. Existing and Future Traffic Conditions on Highway 101 in the Project Vicinity Existing Traffic Future Traffic
Highway 101 Section ADT Daily LOS Peak Hour ADT
Daily LOS Peak Hour
Santa Maria, Jct. Rte. 166 W., Main St. 58,000 C 6,500 59,644 D 6,6846,500 Santa Maria, Donovan Rd. 55,000 C 6,500 58,211 C 6,8796,500 Jct. Rte. 135 S., North Santa Maria 61,000 D 6,300 68,621 DE 7,0876,300 Santa Barbara/SLO County 61,000 D 6,300 68,621 DE 7,0876,300 Jct. Rte. 166 East 53,000 C 4,700 58,799 C 5,2144,700 Tefft St. 53,000 C 4,900 58,014 C 5,3644,900 Los Berros Rd. 53,000 C 6,200 54,654 C 6,3946,200 Arroyo Grande, Bridge St. 48,000 B 5,800 44,219 B 5,3435,800 Jct. Rte. 227 N., Grand Ave. 49,000 B 6,100 43,355 B 5,3976,100 Arroyo Grande, Brisco Rd. 53,000 C 6,600 54,654 C 6,8066,600 Pismo Beach, Oak Park Rd. 61,000 D 7,800 68,200 DE 8,7217,800 Pismo Beach, Pismo Oaks 69,000 E 8,800 76,780 F 9,7928,800 Pismo Beach, Villa Creek 56,000 C 8,600 58,877 C 9,0428,600

DCPP Steam Generator Replacement Project D.13 TRAFFIC AND CIRCULATION
Final EIR D.13-10 August 2005
Table D.13-4. Existing and Future Traffic Conditions on Highway 101 in the Project Vicinity Existing Traffic Future Traffic
Highway 101 Section ADT Daily LOS Peak Hour ADT
Daily LOS Peak Hour
Jct. Rte. 1 South 56,000 C 4,850 53,676 C 4,6494,850 North Shell Beach 65,000 D 8,200 69,820 E 8,8088,200 Avila Beach Drive 60,000 D 7,100 69,001 E 8,1657,100 San Luis Bay Dr. 72,000 E 8,700 76,071 F 9,1928,700 Higuera St. 72,000 E 8,300 78,913 F 9,0978,300 Los Osos Rd. 56,000 C 5,600 57,648 C 5,7655,600 Madonna Rd. 77,000 F 8,800 108,298 F 12,3778,800 Jct. Rte. 227 S.; Marsh St. 75,000 F 8,500 129,784 F 14,7098,500 Jct. Rte. 1 North, Osos St. 64,000 D 7,300 81,653 F 9,3147,300 California Blvd. 56,000 C 6,200 73,797 E 8,1706,200 Grand Ave. 42,000 B 4,700 47,318 B 5,2954,700 Buena Vista 49,000 B 5,400 58,754 C 6,4755,400 North City Limits 49,000 B 5,400 58,217 C 6,4165,400 Jct. Rte. 58 East, Santa Margarita Creek 39,000 B 4,200 40,080 B 4,3164,200 Source: Caltrans, 2003. Notes: LOS calculated using Santa Barbara County thresholds or Highway Capacity Software. V/C = the volume to capacity ratio, capacity is based on roadway class with LOS of E; ADT = Average Daily Traffic.
D.13.1.6 Proposed Roadway Projects According to the San Luis Obispo County Department of Public Works and Transportation there is only one roadway project planned in Avila Beach for the foreseeable future. The project would entail replace-ment of San Luis Bay Drive bridge with a bridge wide enough to accommodate a left turn lane; widen-ing of Avila Beach Drive to accommodate a right turn lane and a left turn lane onto San Luis Bay Drive; widening of shoulders to two to four feet; incorporation of the Bob Jones Bike Trial beneath the bridge; and installation of a traffic signal at the intersection of San Luis Bay Drive and Avila Beach Drive (Gaglione, 2004). This project is tentatively planned to be finished in 2006 or the beginning of 2007, and therefore, would not interfere with the Proposed Project.
According to Caltrans (Caltrans, 2004), there are several projects involving Highway 101 in the project vicinity that are being constructed currently. However, there are no major highway projects that are planned to be constructed beyond 2007 in San Luis Obispo County.
D.13.2 Applicable Regulations, Plans, and Standards Transportation system requirements relevant to the Proposed Project are derived from policies and plans of San Luis Obispo County and Caltrans. Proposed Project activities could temporarily affect access, traffic flow, and parking on public streets within unincorporated San Luis Obispo County and the Port San Luis Harbor District. The Applicant and/or the construction contractor would need to obtain en-croachment permits or similar legal agreements from these agencies before commencing project activ-ities. Such permits are needed where project activities could require the use of the public right-of-way. For the Proposed Project or any of the alternatives, these closure or encroachment permits would likely be issued by San Luis Obispo County, the Port San Luis Harbor District, or Caltrans.

DCPP Steam Generator Replacement Project D.13 TRAFFIC AND CIRCULATION
August 2005 D.13-11 Final EIR
Federal and State Standards Caltrans maintains the State highway system, including Highway 101, which provides the main vehicle access to the area. Maximum load limits for trucks and safety requirements for oversized vehicles are generally regulated by Caltrans for operation on highways. Should the Proposed Project need to encroach upon traveled lanes of a State highway (i.e., Highway 101), Caltrans would be responsible for issuing permits to allow such activities.
Local Ordinances and Policies San Luis Obispo County regulates vehicle weight and speed limits, safety, parking and other traffic issues through Official Traffic Regulation Codes (2004). In addition, San Luis Obispo County outlines poli-cies and standards in the Circulation Element of the San Luis Obispo County General Plan. The stand-ards provide guidance in defining whether the Proposed Project would be consistent with established roadway capacity levels and roadway LOS. Project consistency with roadway standards is based on the number of ADTs contributed by the project, the potential for exceeding acceptable design capacities, and the estimated future volumes for roadways in the project area. The County established LOS C as the accepted level of service for roads in the Avila Beach area (SLO County, 1995). CEQA thresholds for transportation impacts have not been specified by the County, however, the County has approved numerous environmental documents using the criteria detailed in the section below.
D.13.3 Environmental Impacts and Mitigation Measures for the Proposed Project
D.13.3.1 Definition and Use of Significance Criteria The criteria below are based on a review of the CEQA Guidelines checklist, CEQA documents prepared in San Luis Obispo County, and input from relevant government agencies.
Transportation/circulation impacts caused by the Proposed Project would be considered significant if:
• Project traffic would increase the peak hour V/C ratio of a roadway by more than the value pro-vided in Table D.13-5 or add at least 5, 10, or 15 trips to a roadway performing at LOS F, E or D, respectively.
• Project activities would reduce the number of travel lanes during peak traffic periods for roadways with peak hour LOS D or worse, resulting in a disruption of traffic flow and/or traffic congestion.
• Project activities change average daily LOS of road-ways under Caltrans jurisdiction to below D, or con-tributes over 100 peak hour trips to a roadway with LOS E or F would require mitigation.
• Project activities would restrict the movements of emer-gency vehicles (police cars, fire trucks, ambulances, and paramedic units) with no reasonable alternative access.
Table D.13-5. Significance Criteria for Traffic and Circulation on Local Roads
Peak Hour LOS (with project)
Increase in Peak Hour V/C is Greater Than
Hourly Trips
Added A 0.20 – B 0.15 – C 0.10 – D – 15 E – 10 F – 5

DCPP Steam Generator Replacement Project D.13 TRAFFIC AND CIRCULATION
Final EIR D.13-12 August 2005
• Project activities would increase demand for and/or reduce the supply of parking spaces with no provi-sions for accommodating the resulting parking deficiencies.
• Project activities would increase roadway wear in the project vicinity as a result of heavy truck or con-struction equipment movements or trenching operations, resulting in noticeable deterioration of pave-ment or roadway surfaces.
D.13.3.2 Replacement Steam Generator Transport
Impact T-1: RSG transport may damage roadway/parking infrastructure and would temporarily increase local traffic
Transport of the RSGs from Port San Luis to the DCPP would use approximately 1,500 feet of Avila Beach Drive and approximately 200 feet of Diablo Canyon Road (DCPP Access Road) to the DCPP Access Gate (see Figures B-1 or B-11). From the Access Gate the transport route would be located within the boundaries of the DCPP property, off-limits to the general public. Four round trips would be required to transport RSGs for Unit 2 in 2007, with four additional round trips to transport the RSGs for Unit 1 in 2008. The transporter trips and additional project support trips along a 1,500-foot portion of Avila Beach Drive, at night if necessary (as per the Applicant), are not expected to cause significant impacts because the 1,500-foot section of Avila Beach Drive experiences low traffic volumes even during peak summer periods.
The number of additional personnel that would be required during RSG offloading at the Port San Luis and transport was estimated at 30 workers, which would be in addition to the 1,400 DCPP personnel working at DCPP during non-outage periods. It is assumed that during the RSG offloading at Port San Luis, these transport workers would make two-round-trips per day to Port San Luis (60 daily one-way trips) or to DCPP. The peak day scenario on Avila Beach Drive west of Diablo Canyon Road would occur when all 30 workers travel to Port San Luis in addition to the RSG transporter trips, for a total of 6876 one-way trips. It is assumed that any support equipment to handle the RSGs at Port San Luis would be delivered to Port San Luis before the RSGs arrive and would not contribute to the peak traffic.
Transport would occur during non-outage periods and during at the end of the non-peak tourist season, September through November (see Project Description), when the local roads are at LOS A and are antici-pated to remain at this LOS in the future (see Table D.13-3).
The ground transporters used to move the RSGs from Port San Luis to the RSG storage facility would be platform trailers specifically designed to move heavy loads. These trailers have multiple wheels to allow the weight of the load to be spread out over a large area thereby decreasing the impact to the road and underlying utilities. Additionally, the weight of the RSG would be controlled through hydraulic distribution and leveling equipment on the trailer. Thus, no road damage is anticipated.
The Port San Luis parking lot would be used by the transporter to access Avila Beach Drive. Because parking lot pavement often is not designed to the same standards as roadway pavement, damage to the Port San Luis parking lot pavement is possible, but unlikely to occur. In order to address this potential impact PG&E proposes to use mats and other ground reinforcing methods to distribute weight, and steel plates may be used under the barge ramps to protect the underlying asphalt (see Section B.6). The impact is expected to be less than significant due to PG&E’s efforts to protect the parking lot surface and because of the limited activities (eight transporter round-trips at maximum) and the transporter design that distributes the weight of the steam generators. However, a mitigation measure is suggested below in order to ensure that any unforeseen damage to pavement is repaired.

DCPP Steam Generator Replacement Project D.13 TRAFFIC AND CIRCULATION
August 2005 D.13-13 Final EIR
Since road damage from transport is not anticipated, and the addition of 30–34 round-trips (60–68 one-way trips) to local roads during a non-peak season, and during a non-outage period is well below normal outage period traffic, Impact T-1 would be considered adverse but less than significant (Class III).
Mitigation Measures for Impact T-1, RSG transport may damage roadway/parking infrastructure and would temporarily increase local traffic
T-1a Repair any damage to pavement from the transporter. The Applicant shall repair and bear any costs of repair of any significant damage to pavement (e.g., road or parking lots) that results from the transportation of the RSGs. The repairs shall bring the pavement to the pre-project or better condition.
D.13.3.3 Replacement Steam Generator Staging and Preparation
Impact T-2: Staging and preparation would temporarily increase local traffic
Approximately 100 to 700 workers would be needed during the RSG staging and preparation periods that occur prior to the actual outage. In addition to the project-related personnel accessing the DCPP, there would be additional trucks delivering materials to construct necessary temporary staging facilities. The Applicant did not provide information on the number of trucks needed to deliver materials. It was esti-mated that 10 trucks per day (for a total of 20 daily one-way trips) would be needed to deliver the mate-rials. Therefore, additional worst case traffic is estimated to be 710 round trips per day (1,420 one-way daily trips or 142 peak hour trips typically estimated as 10 percent of the average daily traffic). Staging and preparation is expected to occur before the outage period, therefore there would be no outage-related traffic during this phase. Although the highest numbers of project-related workers are not cur-rently anticipated to be needed during peak tourism season, the possibility of unanticipated changes in the project schedule is considered here.
Tables D.13-6 and D.13-7 show how the phase of Replacement Steam Generator Staging and Prepara-tion project would affect future traffic on the local roads and Highway 101. The addition of 142 trips to the peak hour traffic on Avila Beach Drive would add over 15 trips to this roadwayincrease the V/C ratio on this roadway by more than 0.1. Under the anticipated future conditions, Avila Beach Drive west of San Luis Bay Drive is expected to perform at LOS C during the peak hour. The addition of 142 peak hour trips toAn increase of the V/C by more than 0.1 on a this roadway would worsen from LOS C to LOS D. Using the significance criteria in Table D.13-5, the addition of more than 15 trips to a roadway that would perform at LOS D with the project would be considered potentially significant. This impact occurs because Avila Beach Drive and San Luis Bay Drive provide the only local access to Highway 101.
Several Highway 101 segments operate at below LOS D. Caltrans strives to operate its highway facilities between LOS C and D (Caltrans 2002). Because the project could potentially contribute over 100 peak hour trips to Highway 101, this impact would be considered significant.
Scheduling project worker trips to avoid peak times, as in Mitigation Measures T-2a and T-2b, would reduce this impact less than significant levels (Class II).

DCPP Steam Generator Replacement Project D.13 TRAFFIC AND CIRCULATION
Final EIR D.13-14 August 2005
Mitigation Measures for Impact T-2, Staging and Preparation would temporarily increase local traffic.
T-2a Avoid travel during peak season on Avila Beach Drive and other local surface roads. The Applicant shall develop an alternative project schedule that would restrict project-related person-nel from travel on Avila Beach Drive during peak season (e.g., May to AugustOctober), evening peak hours of between 4:00 p.m. and 6:00 p.m. In addition, all project-related traffic shall be restricted from travel on Avila Beach Drive during peak season (e.g., May to OctoberAugust) weekends between the hours of 10:00 a.m. and 5:00 p.m.
To achieve this, the Applicant shall not schedule project employee shift changes between 4:00 p.m. and 7:00 p.m. during May to October period, during weekdays. The Applicant shall not schedule project-related or outage-related employee shift changes between the hours of 10:00 a.m. and 5:00 p.m. during May to October period, during weekends.
T-2b Avoid travel during peak time on Highway 101. The Applicant shall develop an alternative project schedule that would restrict the project-related personnel from travel on Highway 101 during peak hours of operation. Typically, morning peak hours are between 6:00 a.m. and 8:00 a.m. and evening peak hours are between 4:00 p.m. and 5:30 p.m.
To achieve this, in addition to the shift change restrictions stated in Mitigation Measure T-2a, the Applicant shall schedule project employee shift changes outside of period between 6:00 a.m. and 8:00 a.m. during weekdays.

DCPP Steam Generator Replacement Project D.13 TRAFFIC AND CIRCULATION
August 2005 D.13-15 Final EIR
Table D.13-6. Existing, Future, and Worst Case Project Traffic Conditions in the Project Area Existing Future Traffic Future with Project Traffic Road/Route (Class) ADT LOS, V/C Peak Hr ADT LOS, V/C Peak Hr
Project ADT ADT LOS, V/C Peak Hr
Increase in V/C
Diablo Canyon Road a 1,800 A, 0.11 180 1,903 A, 0.12 190 4,100 6,003 A, 0.37 605 0.26
Avila Beach Dr. e/o Diablo Canyon Dr. (Access Road) 5,622 A, 0.38 616
5,944 A, 0.40 651 4,100 10,044 D, 0.67 1,076 0.26
Avila Beach Dr. w/o Diablo Canyon Dr. (Access Road) 3,373 A, 0.22 355
3,566 A, 0.23 375 68 c 3,634 A, 0.24 391 0.01
Avila Beach Dr. w/o San Luis Bay Dr. peak b 11,986 C, 0.73 1,172 12,671 C, 0.77 1,239 4,100 16,771 F,1.04 1,677 0.27
Avila Beach Dr. w/o San Luis Bay Dr. 8,177 A, 0.50 805 8,645 A, 0.53 851 4,100 12,745 F, 0.79 1,280 0.27
San Luis Bay Drive n/o Avila Beach Dr. 6,532 A, 0.39 625 6,906 A, 0.41 661 4,100 11,006 E, 0.67 1,086 0.26
San Luis Bay Drive w/o Ontario Rd. 6,936 A, 0.43 699 7,333 A, 0.46 739 4,100 11,433 E, 0.72 1,166 0.26
Shell Beach Road s/o Avila Beach Dr. 4,945 A, 0.27 429 5,228 A, 0.28 454 0 d 5,228 A, 0.29 464 0.01
San Miguel s/o Avila Beach Dr. 1,512 A, 0.11 178 1,598 A, 0.12 188 1,367 e 2,965 A, 0.20 329 0.09
Front St. e/o Avila Beach Dr. 5,781 A, 0.44 709 6,112 A, 0.46 750 683 e 6,795 A, 0.52 835 0.05

DCPP Steam Generator Replacement Project D.13 TRAFFIC AND CIRCULATION
Final EIR D.13-16 August 2005
Table D.13-6. Future and Project Traffic Conditions in the Project Area during Staging and Preparation Future Traffic (2008) Future with Project Traffic
Road/Route ADT Peak Hour
Peak Hour
LOS, V/C Project
ADT
Project Peak Hour ADT
Peak Hour
Peak Hour
LOS, V/C
Increase in Peak
Hour V/C Diablo Canyon Road a 1,800 180 A, 0.11 1,420 142 3,220 322 A, 0.20 0.09 Avila Beach Dr e/o Diablo Canyon Dr c (Access Rd)
5,944 651 A, 0.40 1,420 142 7,364 793 A, 0.49 0.09
Avila Beach Dr w/o San Luis Bay Dr peak b
12,671 1,239 C, 0.77 1,420 142 14,091 1,381 D, 0.86 0.09
Avila Beach Dr w/o San Luis Bay Dr
8,645 851 A, 0.53 1,420 142 10,065 993 B, 0.61 0.09
San Luis Bay Drive n/o Avila Beach Dr
6,906 661 A, 0.41 1,420 142 8,326 803 A, 0.50 0.09
San Luis Bay Drive w/o Ontario Rd.
7,333 739 A, 0.46 1,420 142 8,753 881 A, 0.55 0.09
Shell Beach Road s/o Avila Beach Dr
5,228 454 A, 0.28 0 0 5,228 454 A, 0.28 0.00
San Miguel s/o Avila Beach Dr
1,598 188 A, 0.12 473 47 2,072 236 A, 0.15 0.03
Front St. e/o Avila Beach Dr
6,112 750 A, 0.46 237 24 6,348 773 A, 0.48 0.01
Source: San Luis Obispo County Traffic Volumes, which includes data from 1993-2003. Notes: For existing traffic see Table D.13-3. LOS calculated using Santa Barbara County thresholds or Highway Capacity Software. V/C = the volume to capacity ratio, capacity is based on roadway class with LOS of E; ADT = Average Daily Traffic. e/o = “east of”; w/o = “west of”; n/o = “north of”; s/o = “south of” a Diablo Canyon Road ADT is comprised of 900 vehicles carrying 1,400 DCPP permanent employees. Traffic on this private road is dependent
only on DCPP activities and would not follow the normal population growth trends in the area. b Peak Season - during summer. c. Additional trips on Avila Beach Drive west of Diablo Canyon Road would be Transporter-related trips during the RSG Transport phase:
Transporter and support workers. Avila Beach Drive is not impacted during Staging and Preparation phase and thus is not mentioned here. d Shell Beach Road is assumed to not be used by the project traffic. e San Miguel Road and Front Street are assumed to experience only a portion of the project trips (e.g., lunch trips, trips to convenience store
during the day).
D.13.3.4 Original Steam Generator Removal, Transport, and Storage Impact T-3: Steam generator replacement activities would temporarily increase local traffic
The worst case circulation scenario would occur if the original steam generator removal, transport and storage phase would occur during the peak tourist season, which occurs during the period from May through October. During this phase, the Proposed Project circulation impacts would be from commuter vehicles of the personnel assisting in the removal and transport of the OSGs to the proposed onsite storage facility (900 to 950 workers, see Figure B-15), in addition to the outage personnel (1,2851,100 workers) and the permanent DCPP personnel (1,400 workers), for a total of 3,6353,450 workers, or 2,2352,050 addi-tional workers over non-outage conditions.
Within the peak tourist season, the peak traffic occurs during the summer months. Historically, the planned refueling outages did not occur during the summer (the only one outage that occurred during the sum-mer period was in August 1986; no scheduled outages have occurred during the summer period since

DCPP Steam Generator Replacement Project D.13 TRAFFIC AND CIRCULATION
August 2005 D.13-17 Final EIR
then). Also, the project-related outage is longer than the normal planned outage (75-80 days vs. 30-40 days). Therefore, the typical summer time traffic in the Avila Beach area does not include the planned outage-related traffic.
The Applicant plans to conduct this phase of the Proposed Project outside of the peak tourist season. However, it is reasonable to assume that the Proposed Project schedule could change and the project-related outage could occur during the summer.
Offsite transport of the OSGs would not occur under the Proposed Project. Worst case traffic would occur during the 3-month75- to 80-day outage period when project-related personnel for the Proposed Project would travel to DCPP in addition to the outage personnel, and if this project phase would overlap with the peak tourist season, a significant impact is expected (see Tables D.13-8 and D-13-9).
The Applicant has stated that it would incorporate alternate work hours for the workers during the outage period to accommodate the short-term increase in worker traffic, but did not provide details on scheduling.
For this analysis, it was assumed that unless additional mitigation is implemented, 10 percent of the additional project-related trips would occur during the peak hour. The addition of 20595 round trips to the peak hour traffic on Avila Beach Drive would increase the V/C ratio on this roadway by more than 0.2 0.1 and would be considered significant (see Table D.13-68). Avoiding project-related travel during peak tourist season and peak hours would be required under Mitigation Measure T-2a. This measure and implementation of trip reduction measures identified below would avoid the potentially significant impact to Avila Beach Drive and other local roads and reduce the impact to local roads (Class II) to a less than significant level. Under anticipated future conditions, Avila Beach Drive west of San Luis Bay Drive is expected to perform at LOS C during the peak hour. An increase of the V/C by more than 0.2 on a roadway at LOS A [e.g., Diablo Canyon Road (Access Road), Avila Beach Drive east of Diablo Canyon Drive (Access Road)], would be considered a potentially significant impact (Class II), and implementation of Mitigation Measures T-3a and T-3b would be necessary to reduce this impact to a less than significant level.
Other roads in the area are expected to be at LOS B or worse during the peak travel time without the Proposed Project. An increase of the V/C by more than 0.2 on these roads would be considered a poten-tially significant impact (Class II) that would warrant additional mitigation. Implementation of Mitigation Measures T-3a and T-3b would reduce this impact to a less than significant level.
Additionally, several segments of Highway 101 are expected to operate at LOS E or worse without the Proposed Project (see Table D.13-7). It was assumed that 20 percent of the project-related traffic comes to the project site from the south on Highway 101, and 80 percent comes from the north (e.g., San Luis Obispo). The addition of over 100320 to 410 peak hour trips to Highway 101 segments that are at LOS E or F (see Table D.13-9) would be considered a potentially significant impact (Class II) that could be mitigated to less than significant level through implementation of Mitigation Measure T-2b (identified above) and the following mitigation measure.
Mitigation Measures for Impact T-3, Steam generator replacement activities would temporarily increase local traffic
T-3a Develop a trip reduction program. The Applicant shall develop a trip reduction program for the Proposed Project. The goal of this program shall be to achieve a 50 percent reduction of project-related vehicle trips during all steam generator replacement activities that overlap with outage periods or normal operation. With such 50 percent reduction, not more than 3,160 vehicles
DCPP Steam Generator Replacement Project D.13 TRAFFIC AND CIRCULATION
Final EIR D.13-18 August 2005
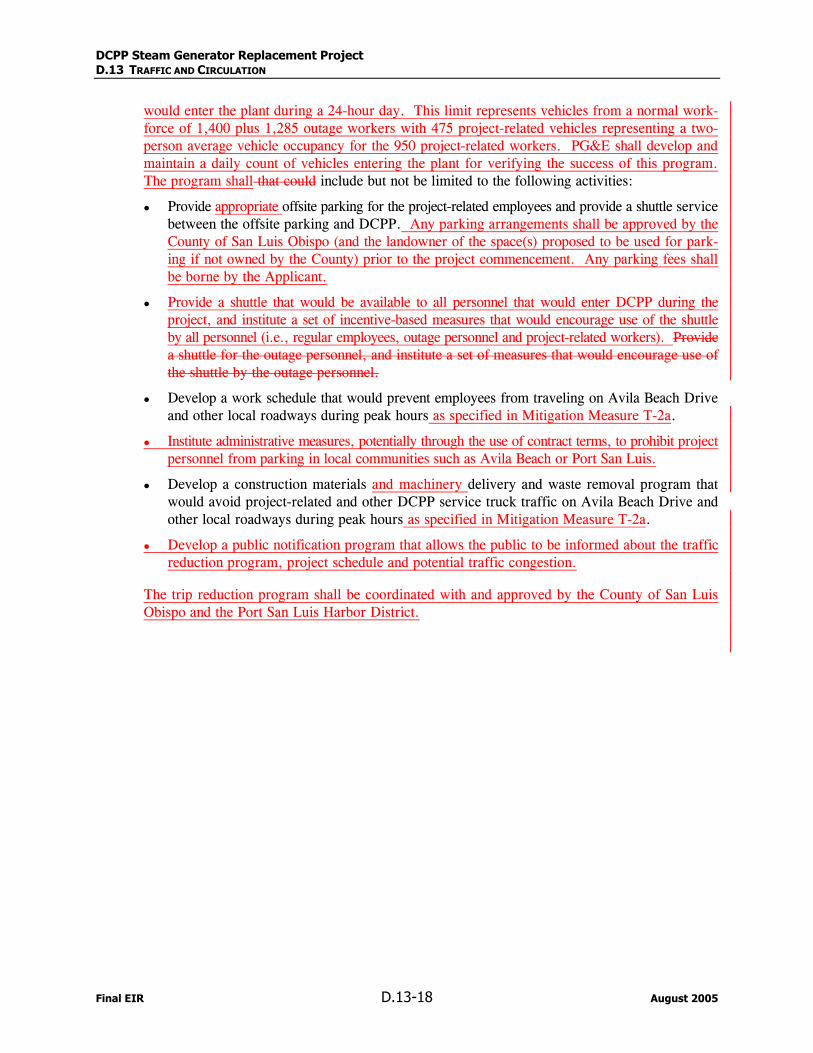
would enter the plant during a 24-hour day. This limit represents vehicles from a normal work-force of 1,400 plus 1,285 outage workers with 475 project-related vehicles representing a two-person average vehicle occupancy for the 950 project-related workers. PG&E shall develop and maintain a daily count of vehicles entering the plant for verifying the success of this program. The program shall that could include but not be limited to the following activities:
Provide appropriate offsite parking for the project-related employees and provide a shuttle service between the offsite parking and DCPP. Any parking arrangements shall be approved by the County of San Luis Obispo (and the landowner of the space(s) proposed to be used for park-ing if not owned by the County) prior to the project commencement. Any parking fees shall be borne by the Applicant.
Provide a shuttle that would be available to all personnel that would enter DCPP during the project, and institute a set of incentive-based measures that would encourage use of the shuttle by all personnel (i.e., regular employees, outage personnel and project-related workers). Provide a shuttle for the outage personnel, and institute a set of measures that would encourage use of the shuttle by the outage personnel.
Develop a work schedule that would prevent employees from traveling on Avila Beach Drive and other local roadways during peak hours as specified in Mitigation Measure T-2a.
Institute administrative measures, potentially through the use of contract terms, to prohibit project personnel from parking in local communities such as Avila Beach or Port San Luis.
Develop a construction materials and machinery delivery and waste removal program that would avoid project-related and other DCPP service truck traffic on Avila Beach Drive and other local roadways during peak hours as specified in Mitigation Measure T-2a.
Develop a public notification program that allows the public to be informed about the traffic reduction program, project schedule and potential traffic congestion.
The trip reduction program shall be coordinated with and approved by the County of San Luis Obispo and the Port San Luis Harbor District.
DCPP Steam Generator Replacement Project D.13 TRAFFIC AND CIRCULATION
August 2005 D.13-19 Final EIR
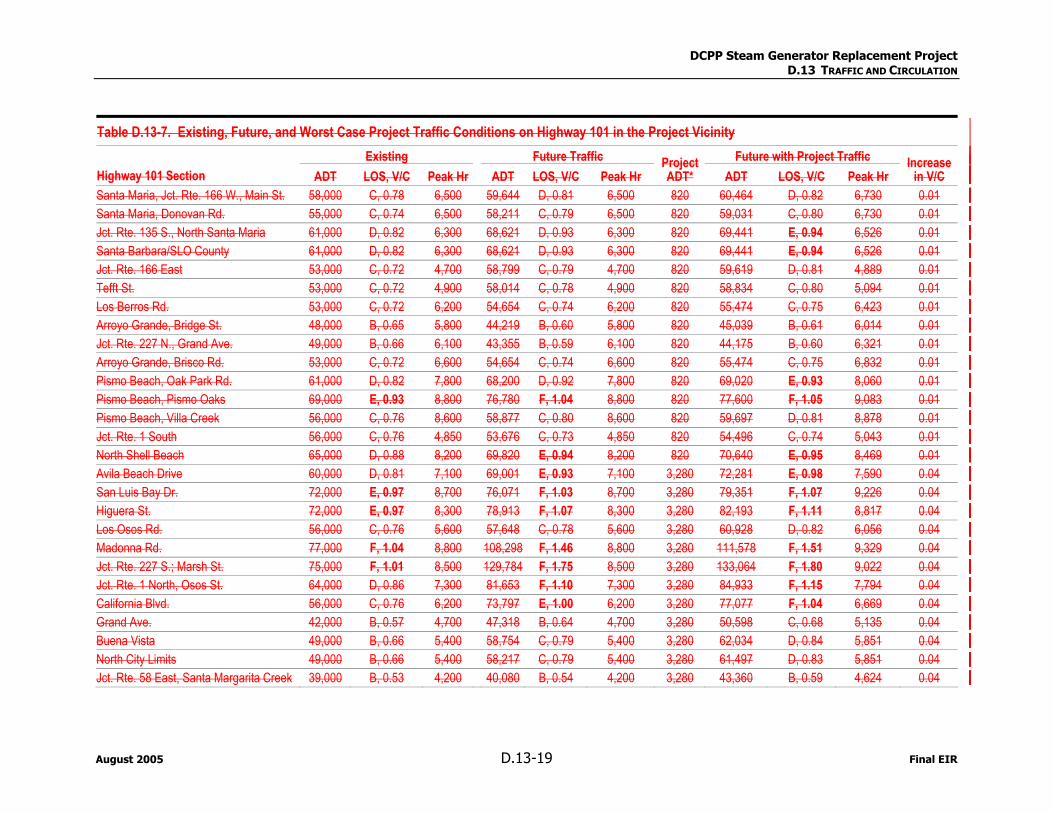
Table D.13-7. Existing, Future, and Worst Case Project Traffic Conditions on Highway 101 in the Project Vicinity Existing Future Traffic Future with Project Traffic Highway 101 Section ADT LOS, V/C Peak Hr ADT LOS, V/C Peak Hr
Project ADT* ADT LOS, V/C Peak Hr
Increase in V/C
Santa Maria, Jct. Rte. 166 W., Main St. 58,000 C, 0.78 6,500 59,644 D, 0.81 6,500 820 60,464 D, 0.82 6,730 0.01 Santa Maria, Donovan Rd. 55,000 C, 0.74 6,500 58,211 C, 0.79 6,500 820 59,031 C, 0.80 6,730 0.01 Jct. Rte. 135 S., North Santa Maria 61,000 D, 0.82 6,300 68,621 D, 0.93 6,300 820 69,441 E, 0.94 6,526 0.01 Santa Barbara/SLO County 61,000 D, 0.82 6,300 68,621 D, 0.93 6,300 820 69,441 E, 0.94 6,526 0.01 Jct. Rte. 166 East 53,000 C, 0.72 4,700 58,799 C, 0.79 4,700 820 59,619 D, 0.81 4,889 0.01 Tefft St. 53,000 C, 0.72 4,900 58,014 C, 0.78 4,900 820 58,834 C, 0.80 5,094 0.01 Los Berros Rd. 53,000 C, 0.72 6,200 54,654 C, 0.74 6,200 820 55,474 C, 0.75 6,423 0.01 Arroyo Grande, Bridge St. 48,000 B, 0.65 5,800 44,219 B, 0.60 5,800 820 45,039 B, 0.61 6,014 0.01 Jct. Rte. 227 N., Grand Ave. 49,000 B, 0.66 6,100 43,355 B, 0.59 6,100 820 44,175 B, 0.60 6,321 0.01 Arroyo Grande, Brisco Rd. 53,000 C, 0.72 6,600 54,654 C, 0.74 6,600 820 55,474 C, 0.75 6,832 0.01 Pismo Beach, Oak Park Rd. 61,000 D, 0.82 7,800 68,200 D, 0.92 7,800 820 69,020 E, 0.93 8,060 0.01 Pismo Beach, Pismo Oaks 69,000 E, 0.93 8,800 76,780 F, 1.04 8,800 820 77,600 F, 1.05 9,083 0.01 Pismo Beach, Villa Creek 56,000 C, 0.76 8,600 58,877 C, 0.80 8,600 820 59,697 D, 0.81 8,878 0.01 Jct. Rte. 1 South 56,000 C, 0.76 4,850 53,676 C, 0.73 4,850 820 54,496 C, 0.74 5,043 0.01 North Shell Beach 65,000 D, 0.88 8,200 69,820 E, 0.94 8,200 820 70,640 E, 0.95 8,469 0.01 Avila Beach Drive 60,000 D, 0.81 7,100 69,001 E, 0.93 7,100 3,280 72,281 E, 0.98 7,590 0.04 San Luis Bay Dr. 72,000 E, 0.97 8,700 76,071 F, 1.03 8,700 3,280 79,351 F, 1.07 9,226 0.04 Higuera St. 72,000 E, 0.97 8,300 78,913 F, 1.07 8,300 3,280 82,193 F, 1.11 8,817 0.04 Los Osos Rd. 56,000 C, 0.76 5,600 57,648 C, 0.78 5,600 3,280 60,928 D, 0.82 6,056 0.04 Madonna Rd. 77,000 F, 1.04 8,800 108,298 F, 1.46 8,800 3,280 111,578 F, 1.51 9,329 0.04 Jct. Rte. 227 S.; Marsh St. 75,000 F, 1.01 8,500 129,784 F, 1.75 8,500 3,280 133,064 F, 1.80 9,022 0.04 Jct. Rte. 1 North, Osos St. 64,000 D, 0.86 7,300 81,653 F, 1.10 7,300 3,280 84,933 F, 1.15 7,794 0.04 California Blvd. 56,000 C, 0.76 6,200 73,797 E, 1.00 6,200 3,280 77,077 F, 1.04 6,669 0.04 Grand Ave. 42,000 B, 0.57 4,700 47,318 B, 0.64 4,700 3,280 50,598 C, 0.68 5,135 0.04 Buena Vista 49,000 B, 0.66 5,400 58,754 C, 0.79 5,400 3,280 62,034 D, 0.84 5,851 0.04 North City Limits 49,000 B, 0.66 5,400 58,217 C, 0.79 5,400 3,280 61,497 D, 0.83 5,851 0.04 Jct. Rte. 58 East, Santa Margarita Creek 39,000 B, 0.53 4,200 40,080 B, 0.54 4,200 3,280 43,360 B, 0.59 4,624 0.04

DCPP Steam Generator Replacement Project D.13 TRAFFIC AND CIRCULATION
Final EIR D.13-20 August 2005
Table D.13-7. Future and Project Highway Conditions in the Project Area during Staging and Preparation Future Traffic (2008) Project Future with Project Traffic
Highway 101 Section ADT Daily LOS
Peak Hour ADT
Peak Hour ADT
Daily LOS
Peak Hour
Santa Maria, Jct. Rte. 166 W., Main St. 59,644 D 6,684 1,420 142 61,064 D 6,826 Santa Maria, Donovan Rd. 58,211 C 6,879 1,420 142 59,631 D 7,021 Jct. Rte. 135 S., North Santa Maria 68,621 E 7,087 1,420 142 70,041 E 7,229 Santa Barbara/SLO County 68,621 E 7,087 1,420 142 70,041 E 7,229 Jct. Rte. 166 East 58,799 C 5,214 1,420 142 60,219 D 5,356 Tefft St. 58,014 C 5,364 1,420 142 59,434 D 5,506 Los Berros Rd. 54,654 C 6,394 1,420 142 56,074 C 6,536 Arroyo Grande, Bridge St. 44,219 B 5,343 1,420 142 45,639 B 5,485 Jct Rte 227 N., Grand Ave. 43,355 B 5,397 1,420 142 44,775 B 5,539 Arroyo Grande, Brisco Rd. 54,654 C 6,806 1,420 142 56,074 C 6,948 Pismo Beach, Oak Park Rd. 68,200 E 8,721 1,420 142 69,620 E 8,863 Pismo Beach, Pismo Oaks 76,780 F 9,792 1,420 142 78,200 F 9,934 Pismo Beach, Villa Creek 58,877 C 9,042 1,420 142 60,297 D 9,184 Jct. Rte. 1 South 53,676 C 4,649 1,420 142 55,096 C 4,791 North Shell Beach 69,820 E 8,808 1,420 142 71,240 E 8,950 Avila Beach Drive 69,001 E 8,165 1,420 142 70,421 E 8,307 San Luis Bay Drive 76,071 F 9,192 1,420 142 77,491 F 9,334 Higuera St. 78,913 F 9,097 1,420 142 80,333 F 9,239 Los Osos Rd. 57,648 C 5,765 1,420 142 59,068 C 5,907 Madonna Rd. 108,298 F 12,377 1,420 142 109,718 F 12,519 Jct Rte 227 S; Marsh St. 129,784 F 14,709 1,420 142 131,204 F 14,851 Jct Rte 1 North, Osos St. 81,653 F 9,314 1,420 142 83,073 F 9,456 California Blvd. 73,797 E 8,170 1,420 142 75,217 F 8,312 Grand Ave. 47,318 B 5,295 1,420 142 48,738 B 5,437 Buena Vista 58,754 C 6,475 1,420 142 60,174 D 6,617 North City Limits 58,217 C 6,416 1,420 142 59,637 D 6,558 Jct. Rte. 58 East, Santa Margarita Creek 40,080 B 4,316 1,420 142 41,812 B 4,458 Source: Caltrans, 2004. Notes: For existing traffic see Table D.13-4. LOS calculated using Santa Barbara County thresholds or Highway Capacity Software. ADT = Average Daily Traffic.

DCPP Steam Generator Replacement Project D.13 TRAFFIC AND CIRCULATION
August 2005 D.13-21 Final EIR
Table D.13-8. Future and Project Traffic Conditions in the Project Area during OSG Removal, Transport, and Storage
Future Traffic (2008) Future Traffic with Outage
Traffic Future with Outage and Project
Traffic
Road/Route ADT Peak
Hr
Peak hour
LOS, V/C ADT Peak Hr Peak hour LOS, V/C
Project ADT
Project Peak Hour ADT Peak Hour
Peak Hr LOS, V/C
Increase in Peak
Hour V/C Diablo Canyon Road a 1,800 180 A, 0.11 4,370 437 A, 0.27 1,900 190 6,270 627 A, 0.39 0.12
Avila Beach Dr. e/o Diablo Canyon Dr. (Access Road) 5,944 651 A, 0.40 8,514 908 A, 0.56 1,900 190 10,414 1,098 B, 0.68 0.12
Avila Beach Dr. w/o San Luis Bay Dr. peak b 12,671 1,239 C, 0.77 15,241 1,496 E, 0.93 1,900 190 17,141 1,686 F, 1.04 0.12
Avila Beach Dr. w/o San Luis Bay Dr. 8,645 851 A, 0.53 11,215 1,108 B, 0.69 1,900 190 13,115 1,298 C, 0.80 0.12
San Luis Bay Drive n/o Avila Beach Dr. 6,906 661 A, 0.41 9,476 918 A, 0.57 1,900 190 11,376 1,108 B, 0.69 0.12
San Luis Bay Drive w/o Ontario Rd. 7,333 739 A, 0.46 9,903 996 A, 0.62 1,900 190 11,803 1,186 C, 0.73 0.12
Shell Beach Road s/o Avila Beach Dr. 5,228 454 A, 0.28 5,228 454 A, 0.28 0 0 5,228 454 A, 0.28 0.00
San Miguel s/o Avila Beach Dr. 1,598 188 A, 0.12 1,598 188 A, 0.12 633 63 2,232 252 A, 0.16 0.04
Front St. e/o Avila Beach Dr. 6,112 750 A, 0.46 6,112 750 A, 0.46 317 32 6,428 781 A, 0.48 0.02 Source: San Luis Obispo County Traffic Volumes, which includes data from 1993-2003. Notes: For existing traffic see Table D.13-3. LOS calculated using Santa Barbara County thresholds or Highway Capacity Software. V/C = the volume to capacity ratio, capacity is based on roadway class with LOS of E; ADT = Average Daily Traffic. e/o = “east of”; w/o = “west of”; n/o = “north of”; s/o = “south of” a. Diablo Canyon Road ADT is comprised of 900 vehicles carrying 1,400 DCPP permanent employees. Traffic on this private road is dependent only on DCPP activities and would not follow the
normal population growth trends in the area. b. Peak Season - during summer. c. Shell Beach Road is assumed to not be used by the project traffic d. San Miguel Road and Front Street are assumed to experience only a portion of the project trips (e.g., lunch trips, trips to convenience store during the day).

DCPP Steam Generator Replacement Project D.13 TRAFFIC AND CIRCULATION
August 2005 D.13-22 Final EIR
Table D.13-9. Future and Project Highway Conditions in the Project Area during OSG Removal, Transport, and Storage Future Traffic (2008) Project Future with Project Traffic
Highway 101 Section ADT Daily LOS
Peak Hour ADT Peak Hour ADT
Daily LOS
Peak Hour
Santa Maria, Jct. Rte. 166 W., Main St. 59,644 D 6,684 1,900 190 61,544 D 6,874 Santa Maria, Donovan Rd. 58,211 C 6,879 1,900 190 60,111 D 7,069 Jct. Rte. 135 S., North Santa Maria 68,621 E 7,087 1,900 190 70,521 E 7,277 Santa Barbara/SLO County 68,621 E 7,087 1,900 190 70,521 E 7,277 Jct. Rte. 166 East 58,799 C 5,214 1,900 190 60,699 D 5,404 Tefft St. 58,014 C 5,364 1,900 190 59,914 D 5,554 Los Berros Rd. 54,654 C 6,394 1,900 190 56,554 C 6,584 Arroyo Grande, Bridge St. 44,219 B 5,343 1,900 190 46,119 B 5,533 Jct. Rte. 227 N., Grand Ave. 43,355 B 5,397 1,900 190 45,255 B 5,587 Arroyo Grande, Brisco Rd. 54,654 C 6,806 1,900 190 56,554 C 6,996 Pismo Beach, Oak Park Rd. 68,200 E 8,721 1,900 190 70,100 E 8,911 Pismo Beach, Pismo Oaks 76,780 F 9,792 1,900 190 78,680 F 9,982 Pismo Beach, Villa Creek 58,877 C 9,042 1,900 190 60,777 D 9,232 Jct. Rte. 1 South 53,676 C 4,649 1,900 190 55,576 C 4,839 North Shell Beach 69,820 E 8,808 1,900 190 71,720 E 8,998 Avila Beach Drive 69,001 E 8,165 1,900 190 70,901 E 8,355 San Luis Bay Dr. 76,071 F 9,192 1,900 190 77,971 F 9,382 Higuera St. 78,913 F 9,097 1,900 190 80,813 F 9,287 Los Osos Rd. 57,648 C 5,765 1,900 190 59,548 D 5,955 Madonna Rd. 108,298 F 12,377 1,900 190 110,198 F 12,567 Jct. Rte. 227 S.; Marsh St. 129,784 F 14,709 1,900 190 131,684 F 14,899 Jct. Rte. 1 North, Osos St. 81,653 F 9,314 1,900 190 83,553 F 9,504 California Blvd. 73,797 E 8,170 1,900 190 75,697 F 8,360 Grand Ave. 47,318 B 5,295 1,900 190 49,218 B 5,485 Buena Vista 58,754 C 6,475 1,900 190 60,654 D 6,665 North City Limits 58,217 C 6,416 1,900 190 60,117 D 6,606 Jct. Rte. 58 East, Santa Margarita Creek 40,080 B 4,316 1,900 190 41,980 B 4,506 Source: Caltrans, 2004. Notes: For existing traffic see Table D.13-4. LOS calculated using Santa Barbara County thresholds or Highway Capacity Software. ADT = Average Daily Traffic.

DCPP Steam Generator Replacement Project D.13 TRAFFIC AND CIRCULATION
August 2005 D.13-23 Final EIR
T-3b Avoid travel during peak season on Avila Beach Drive and San Luis Bay Drive. The Appli-cant shall develop an alternative project schedule that would restrict project-related personnel from travel on Avila Beach Drive and San Luis Bay Drive during peak season (e.g., May to August) evening peak hours of between 4:00 p.m. and 7:00 p.m. In addition, all project-related and outage traffic shall be restricted from travel on Avila Beach Drive and San Luis Bay Drive during peak season (e.g., May to August) weekends between the hours of 10:00 a.m. and 5:00 p.m.
D.13.3.5 Replacement Steam Generator Installation During RSG installation, the same worst-case number of personnel would travel to DCPP as during the OSG removal, transport and storage phase described under Impact T-3. This means that in addition to 1,400 permanent DCPP employees, 1,285 1,100 outage personnel and 900 to 950 project-related employees would access the site, causing a total of 2,2352,050 additional personnel over normal oper-ations, or 4,100 4,470 additional one-way trips per day, which would be 950 round-trips or 1,900 additional one-way trips over operation during a planned outage. Therefore, circulation impacts would be the same as for Impact T-3. With implementation of Mitigation Measures T-3a, and T-2a3b, andincluding T-2b, as described above, the adverse effects of the Proposed Project would be reduced to a less than significant level (Class II).
Should the Proposed Project be allowed to proceed as proposed, DCPP would continue to operate as it is in the existing conditions past the useful life of the OSGs and up to the end of the current operating licenses that expire in 2021 and 2025. This means that 900 daily round-trips due to normal operations, and additional 1,2851,100 daily round-trips due to periodic outages would continue to occur. Because there would be no permanent increase in traffic with the Proposed Project, the return to service would not generate additional traffic.
D.13.4 Environmental Impacts and Mitigation Measures for the Alternatives
D.13.4.1 Replacement Steam Generator Offloading Alternative There would be no new transportation impacts associated with offloading the RSGs at the DCPP Intake Cove. However, this alternative would be preferred over the Proposed Project because it would elimi-nate the potential less than significant impacts associated with transporting the steam generators along Avila Beach Drive to the DCPP Access Road.
D.13.4.2 Temporary Staging Area Alternatives The TSA alternatives involve different TSA locations within DCPP. Potential impacts associated with these alternatives would be identical to the Proposed Project. There would be no additional transportation impacts from any of the TSA alternatives.
D.13.4.3 Original Steam Generator Storage Facility Location Alternatives The OSG Storage Facility alternatives involve different OSG Storage Facility locations within DCPP. Potential impacts associated with these alternatives would be identical to the Proposed Project. There would be no additional transportation impacts from the OSG Storage Facility alternatives.

DCPP Steam Generator Replacement Project D.13 TRAFFIC AND CIRCULATION
Final EIR D.13-24 August 2005
D.13.4.4 Original Steam Generator Offsite Disposal Alternative This alternative would involve transportation of the OSGs to a disposal location outside of the DCPP. Transportation impacts would be similar to Impact T-1. Under this alternative, the OSGs would be loaded onto a transporter at DCPP, and a transporter would haul the OSGs to the Intake Cove or Port San Luis areas. At these locations, the OSGs would likely be loaded onto a barge and transported to a disposal location. The same number of additional personnel (30) would be needed to accomplish the trans-port activity. Transportation impacts to the local roads would be from addition of 30 round-trips per day (60 one-way trips per day). For the Port San Luis option, transportation along Avila Beach Drive and along Diablo Canyon Road would include 8 transporter round-trips between DCPP and Port San Luis. With regard to the Intake Cove, this option would eliminate the potential less than significant impacts associated with transporting the steam generators along Avila Beach Drive to the DCPP Access Road. Overall, the effect of this transport activity would be adverse but not significant (Class III).
D.13.5 Environmental Impacts of the No Project Alternative Existing traffic in the vicinity of DCPP on the Access Road, Avila Beach Drive, San Luis Bay Drive, and other area roadways would be reduced under the No Project Alternative, and the roadways would expe-rience an improved level of service due to the shutdown of routine DCPP operations prior to the NRC license expiration dates. This would cause a beneficial impact to local roadway performance (Class IV).
The No Project Alternative would also involve construction of new generation and transmission facilities elsewhere. The exact location, technology or design is not known at this time. However, this alterna-tive is likely to have significant circulation impacts. Construction of the new facilities would occur over several years, and would involve a large number of construction personnel that would likely affect the roads in the area where the new facilities would be sited. Transmission and generation system enhance-ment options would not have substantial circulation impacts because there would be little, if any, new con-struction, and long-term operation of replacement facilities would not normally lead to permanently large increases in vehicle trips. Impacts associated with the construction and operation of new genera-tion facilities would likely be significant in the absence of mitigation, but could likely be mitigated to a less than significant level because of the short-term duration of construction and limited size of opera-tional workforces. Additional environmental review would be required with the siting and construction of new generation facilities.

DCPP Steam Generator Replacement Project D.13 TRAFFIC AND CIRCULATION
August 2005 D.13-25 Final EIR
D.13.6 Mitigation Monitoring, Compliance, and Reporting Table Table D.13-8 10 shows the mitigation monitoring, compliance, and reporting program for Traffic and Circulation.
Table D.13-810. Mitigation Monitoring Program – Traffic and Circulation
IMPACT T-1 RSG transport may damage roadway/parking infrastructure and would temporarily increase local traffic (Class III)
MITIGATION MEASURE T-1a: Repair any damage to pavement from the transporter. The Applicant shall repair and bear any costs of repair of any significant damage to pavement (e.g., road or parking lots) that results from the transportation of the RSGs. The repairs shall bring the pavement to the pre-project or better condition.
Location Implementation of the measure would affect Avila Beach Drive, Diablo Canyon Road, and any paved roads or parking lots within the Port San Luis. Monitoring and photo documenta-tion shall be done at the Port’s parking lot and along the transporter route.
Monitoring / Reporting Action Conduct site visits to assess the road and parking lot conditions before and after the transport, use photo documentation to assess the pre- and post-project pavement conditions. To ensure compliance, conduct a site visit after the repairs (if any) are reported as completed.
Effectiveness Criteria If the damaged pavement (if any) appears as good or better after the repairs (if any) are com-pleted, the measure is effective.
Responsible Agency CPUC shall assign a qualified environmental monitor, that is also approved by the Harbor District to review the monitoring reports and establish and implement an enforcement action if the measure is not effective.
Timing Review before commencing RSG transportation, conduct site visits during Project implementation.
IMPACT T-2 Staging and preparation would temporarily increase local traffic (Class II) MITIGATION MEASURE T-2a: Avoid travel during peak season on Avila Beach Drive and other local surface
roads. The Applicant shall develop an alternative project schedule that would restrict the project-related personnel from travel on Avila Beach Drive during peak season (e.g., May to AugustOctober), evening peak hours of between 4:00 p.m. and 7:00 p.m. In addition, all project-related traffic shall be restricted from travel on Avila Beach Drive during peak season (e.g., May to AugustOctober) weekends between the hours of 10:00 a.m. and 5:00 p.m. To achieve this, the Applicant shall not schedule project employee shift changes between 4:00 p.m. and 7:00 p.m. during May to October period, during weekdays. The Applicant shall not schedule project-related or outage-related employee shift changes between the hours of 10:00 a.m. and 5:00 p.m. during May to October period, during weekends.
Location Implementation of the measure would affect Avila Beach transportation system. Monitoring shall be done at the DCPP secured Access Gate on Diablo Canyon Road.
Monitoring / Reporting Action Review and approval of the alternative project schedule/shift change orders by CPUC. Conduct site visits during the project implementation to ensure compliance.
Effectiveness Criteria If the Applicant demonstrates approved observable shift schedulefewer than ten project-related vehicles pass through the Access Gate during any peak hour, the measure is effective.
Responsible Agency CPUC shall assign a qualified environmental monitor, review the monitoring reports, and establish and implement an enforcement action if the measures are not effective.
Timing Review the alternative schedule before commencing RSG staging and preparation, conduct site visits during project implementation.
MITIGATION MEASURE T-2b: Avoid travel during peak time on Highway 101. The Applicant shall develop an alterna-tive project schedule that would restrict the project-related personnel from travel on Highway 101 during peak hours of operation. Typically, morning peak hours are between 6:00 a.m. and 8:00 a.m. and evening peak hours are between 4:00 p.m. and 5:30 p.m.

DCPP Steam Generator Replacement Project D.13 TRAFFIC AND CIRCULATION
Final EIR D.13-26 August 2005
Table D.13-810. Mitigation Monitoring Program – Traffic and Circulation To achieve this, in addition to the shift change restrictions stated in Mitigation Measure T-2a, the Applicant shall schedule project employee shift changes outside of period between 6:00 a.m. and 8:00 a.m. during weekdays.
Location Implementation of the measure would affect Highway 101 in Avila Beach vicinity. Monitoring shall be done at the DCPP Access Gate on Diablo Canyon Road.
Monitoring / Reporting Action Review and approval of the alternative project schedule by CPUC. Site visits during the project implementation to ensure compliance.
Effectiveness Criteria If the Applicant demonstrates approved observable shift schedulefewer than ten project-related vehicles pass through the Access Gate during any peak hour, the measure is effective.
Responsible Agency CPUC shall assign a qualified environmental monitor, review the monitoring reports, and estab-lish and implement an enforcement action if the measures are not effective.
Timing Review the alternative schedule before commencing RSG staging and preparation, conduct site visits during project implementation.
IMPACT T-3 Steam generator replacement activities would temporarily increase local traffic (Class II)
MITIGATION MEASURE T-3a: Develop a trip reduction program. The Applicant shall develop a trip reduction program for the Proposed Project. The goal of this program shall be to achieve a 50 percent reduction of project-related vehicle trips during all steam generator replacement activities that overlap with outage periods or normal operation. With such 50 percent reduction, not more than 3,160 vehicles would enter the plant during a 24-hour day. This limit represents vehicles from a normal workforce of 1,400 plus 1,285 outage workers with 475 project-related vehicles representing atwo-person average vehicle occupancy for the 950 project-related workers. PG&E shall developand maintain a daily count of vehicles entering the plant for verifying the success of this program. The program shall that could include but not be limited to the following activities: • Provide appropriate offsite parking for the project-related employees and provide a shuttle service
between the offsite parking and DCPP. Any parking arrangements shall be approved by the County of San Luis Obispo (and the landowner of the space(s) proposed to be used for parking if not owned by the County) prior to the project commencement. Any parking fees shall be borne by the Applicant.
• Provide a shuttle that would be available to all personnel that would enter DCPP during the proj-ect, and institute a set of incentive-based measures that would encourage use of the shuttle by all personnel (i.e., regular employees, outage personnel and project-related workers).Provide a shuttle for the outage personnel, and institute a set of measures that would encourage use of the shuttle by the outage personnel.
• Develop a work schedule that would prevent employees traveling on Avila Beach Drive and otherlocal roadways during peak hours as specified in Mitigation Measure T-2a.
• Institute administrative measures, potentially through the use of contract terms, to prohibit the project personnel from parking in the local communities such as Avila Beach or Port of San Luis.
• Develop a construction materials and machinery delivery and waste removal program that would avoid project-related and other DCPP service truck traffic on Avila Beach Drive and other local roadways during peak hours as specified in Mitigation Measure T-2a.
• Develop a public notification program that allows the public to be informed about the traffic reduc-tion program, project schedule and potential traffic congestion.
The trip reduction program shall be coordinated with and approved by the County of San Luis Obispo and the Port San Luis Harbor District.
Location Monitoring visits shall be done to the alternative offsite parking sites. Review the DCPP docu-mentation directing work and shift change schedules.
Monitoring / Reporting Action Review and approval of the trip reduction and traffic control program by CPUC. Site visits to ensure implementation.
Effectiveness Criteria If the total daily number of vehicles entering the plant is no more than 3,16050 percent of the project-related employees use the provided shuttle on the regular basis, the measure is effective.

DCPP Steam Generator Replacement Project D.13 TRAFFIC AND CIRCULATION
August 2005 D.13-27 Final EIR
Table D.13-810. Mitigation Monitoring Program – Traffic and Circulation Responsible Agency CPUC shall assign a qualified environmental monitor, review the monitoring reports and establish
and implement an enforcement action if the measures are not effective, coordination with County of San Luis Obispo and the Port San Luis Harbor District.
Timing Review and approve the trip reduction program before the project commencement. During the OSGs removal, transportation, and storage.
MITIGATION MEASURE T-3b: Avoid travel during peak season on Avila Beach Drive and San Luis Bay Drive. The Applicant shall develop an alternative project schedule that would restrict the project-related and outage personnel from travel on Avila Beach Drive and San Luis Bay Drive during peak season (e.g., May to August) evening peak hours of between 4:00 p.m. and 7:00 p.m. In addition, all project-related and outage traffic shall be restricted from travel on Avila Beach Drive and San Luis Bay Drive during peak season (e.g., May to August) weekends betweenthe hours of 10:00 a.m. and 5:00 p.m.
Location Implementation of the measure would affect Avila Beach transportation system. Monitoring shall be done at the DCPP secured Access Gate on Diablo Canyon Road
Monitoring / Reporting Action Review and approval of the alternative project schedule. Site visits during the project imple-mentation to ensure compliance
Effectiveness Criteria If fewer than ten project-related vehicles pass through the Access Gate during any peak hour, the measure is effective
Responsible Agency CPUC shall assign a qualified environmental monitor, review the monitoring reports and establish and implement an enforcement action if the measures are not effective
Timing Review the alternative schedule before commencing OSG removal, conduct site visits during project implementation

DCPP Steam Generator Replacement Project D.13 TRAFFIC AND CIRCULATION
Final EIR D.13-28 August 2005
D.13.7 References ADL (Arthur D. Little). 1997. Unocal Avila Beach Cleanup Project. Public Draft EIR. SCH# 95071094.
November.
_____. 1998. Guadalupe Oil Field Remediation and Abandonment Project. Final EIR. SCH# 96051053. March.
Caltrans (California Department of Transportation). 2001. Transportation Concept Report. Administrative Draft. September.
_____. 2002. Guide for the preparation of Traffic Impact Studies.
_____. 2003. Traffic and Vehicle Data Systems Unit. All Traffic Volumes on California State Highway System. http://www.dot.ca.gov/hq/traffops/saferesr/trafdata/2003all/r101i.htm. Accessed November 5.
_____. 2004. “Statement of Ongoing Projects as of October 20, 2004.” http://www.dot.ca.gov/hq/construc/socfiles/alldistoct04.pdf. Accessed November 29.
DKS Associates. 1990. Avila Circulation Study. Prepared for San Luis Obispo County, Port San Luis Harbor District and San Luis Bay Estates. Revised February.
Gaglione, Rosemarie. 2004. Personal communication via email from Rosemarie Gaglione, Traffic Engi-neer, San Luis Obispo County, Public Works Department. November 30.
MRS (Marine Research Specialists). 2003. Diablo Canyon Independent Spent Fuel Storage Installation. Public Draft EIR. SCH# 2002031155. September.
SLO County (San Luis Obispo County). 1988. Land Use Element and Local Coastal Plan, San Luis Bay. February 28.
_____. 1995. San Luis Obispo County Ordinance 2702.
_____. 2003. Annual Resource Summary Report.
_____. 2004. Public Works Department. Traffic and Transportation Division. Traffic Counts. http://www.slocountytraffic.org. Accessed November 8 2004.
TPG (TPG Consulting). 2001. Avila Circulation Study. Prepared for San Luis Obispo County Public Works Department.
TRB (Transportation Research Board). 1994. Highway Capacity Manual. Special Report 209. 3rd Edition.
Unocal. 1998. Avila Beach Remediation Project Implementation Plan. Traffic Control Plan. August 1998.
U.S. Census Bureau. 2000. State Population Predictions. California State. http://www.census.gov/popest/states/asrh/SC-EST2003-02.html. Accessed November 9, 2004.
WSA (Wilbur Smith Associates). 1992. Avila Beach Drive Resource Capacity Study. September 25.