dcmslink 2.10 for analyst - thermo fisher...
TRANSCRIPT
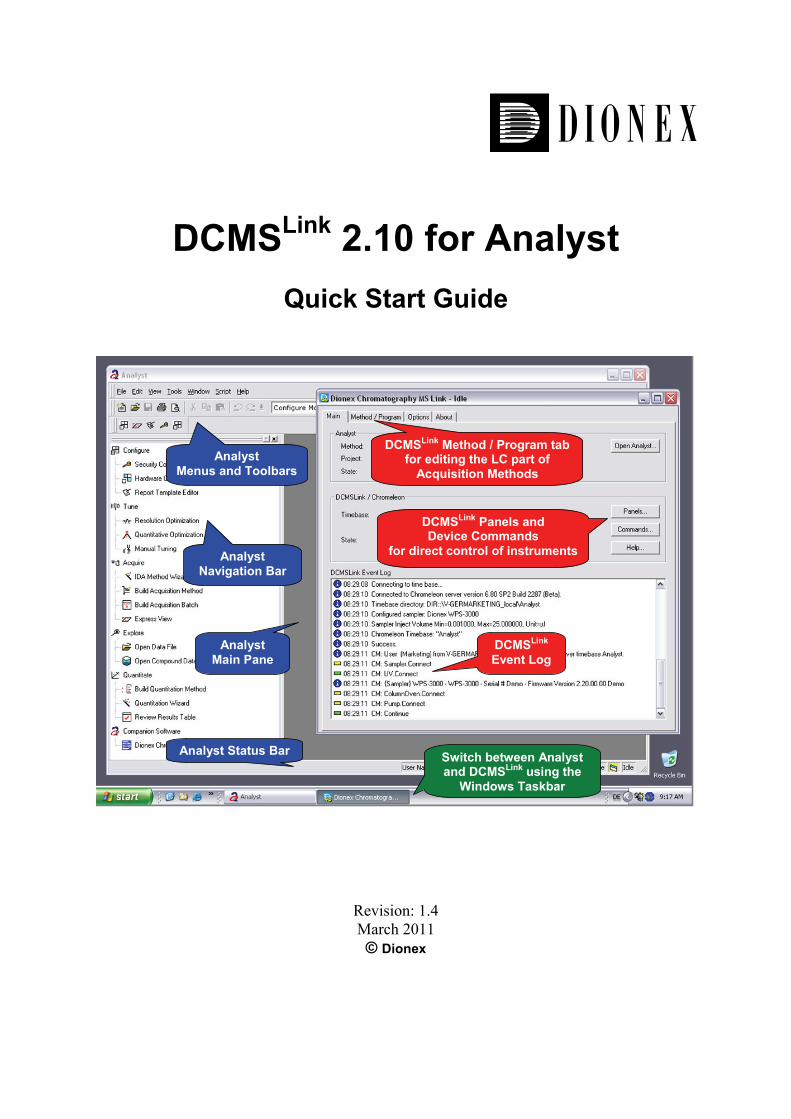
DCMSLink 2.10 for Analyst
Quick Start Guide
Analyst Navigation Bar
Analyst Main Pane
Analyst Status Bar
DCMSLink
Event Log
Analyst Menus and Toolbars
DCMSLink Panels and Device Commands
for direct control of instruments
DCMSLink Method / Program tab for editing the LC part of
Acquisition Methods
Switch between Analyst and DCMSLink using the
Windows Taskbar
Revision: 1.4 March 2011 © Dionex
DCMSLink 2.10 for Analyst Quick Start Guide
2
Table of Contents 1 Abbreviations / Glossary .................................................................................................. 3
2 Introduction ....................................................................................................................... 4 2.1 Scope .......................................................................................................................... 4 2.2 Document Conventions .............................................................................................. 5 2.3 Other Resources ......................................................................................................... 5 2.4 What is DCMSLink? .................................................................................................... 6
2.4.1 Instrument Control ......................................................................................... 6 2.4.2 Data Acquisition and Storage ........................................................................ 6 2.4.3 Data Processing and Reporting...................................................................... 7 2.4.4 DCMSLink and Chromeleon............................................................................ 7
3 How To… ........................................................................................................................... 8 3.1 Starting the Software.................................................................................................. 8 3.2 Equilibrating the System .......................................................................................... 10
3.2.1 Manual Equilibration/Operation – via Panels.............................................. 10 3.2.2 Manual Equilibration/Operation – via Control Commands......................... 15 3.2.3 Automated Equilibration.............................................................................. 16
3.3 Creating / Editing Acquisition Methods .................................................................. 18 3.3.1 Creating a New Acquisition Method for Samples ....................................... 19 3.3.2 Editing an Existing Acquisition Method for Samples ................................. 22 3.3.3 Creating / Editing a Standby Program ......................................................... 26
3.4 Creating / Editing an Acquisition Batch (Sample Set)............................................. 27 3.5 Starting an Acquisition (Analysis) ........................................................................... 34 3.6 Monitoring the Running Samples ............................................................................ 36
3.6.1 Monitoring Detector Signals and Other Channel Data................................ 36 3.6.2 Monitoring Other System Properties – Using the Software Application
Status Window............................................................................................. 36 3.7 Stop / Standby / Shutdown....................................................................................... 38
3.7.1 Stopping a Sample or a Sequence / Queue .................................................. 38 3.7.2 Initiating Standby Mode / Shutdown ........................................................... 39
3.8 Viewing Chromatography Data ............................................................................... 40 3.8.1 Viewing 2D Channel Data ........................................................................... 40 3.8.2 Viewing 3D Data from Photo Diode Array Detectors................................. 41
4 Appendix A – Simulated MS.......................................................................................... 42 4.1 Creating a new Hardware Profile with Simulated MS............................................. 42 4.2 Creating a new Acquisition Method with Simulated MS ........................................ 43
DCMSLink 2.10 for Analyst Quick Start Guide
3
1 Abbreviations / Glossary
Below is a list of abbreviations and terms that are used throughout the document and which may need explanation.
Abbreviation / Term Description
AB Applied Biosystems
Acquisition Batch A set of samples to be analyzed – this is the Analyst term for what is called a Sequence (SEQ) in Chromeleon. The Acquisition Batch must be submitted to the Queue to start the analysis.
Acquisition Method A file that contains instrument commands. An Analyst Acquisition Method for LC-MS (or IC-MS) contains an MS part (settings for the mass spectrometer) and an LC part (settings for the IC or LC front end – also referred to as Program (PGM))
Chromeleon (CM) Dionex Chromeleon Chromatography Management System – a full featured chromatography data system.
DCMSLink is based on Chromeleon technology, i.e., it installs and uses certain portions of Chromeleon.
Chromeleon Server This is the portion of DCMSLink that handles the data acquisition and communication with the connected chromatography modules.
Chromeleon Xpress A limited version of Chromeleon that allows instrument control and monitoring via software Panel Tabsets.
DCMSLink Dionex Chromatography Mass Spectrometry Link – An interface software for controlling a wide range of Dionex chromatography instruments from various MS software, e.g. from Analyst.
MS Mass Spectrometry or Mass Spectrometer
Panel / Software Panel DCMSLink / Chromeleon use this graphical user interface for direct control of instruments and monitoring the running sample. Not to be confused with the physical control panels on the instruments.
Panel Tabset A collection of Panels that is suitable for a given combination of chromatography modules.
Program (PGM) A file that contains instrument commands – This is the DCMSLink terminology for the LC part of the Analyst Acquisition Method.
PDA Photo Diode Array (detector)
Queue The Analyst Queue is the list of the samples that has been submitted (waiting for) analysis. The “Queue Manager” is the window where the Queue can be monitored and controlled (e.g. start/stop). (Analogous with the Chromeleon Batch.)
Sequence (SEQ) A set of samples to be analyzed – this is the DCMSLink / Chromeleon term for what is called Acquisition Batch in Analyst.
Server Configuration This is the DCMSLink window where the Timebase (instrument system) can be configured. Also referred to as “Device Configuration”. Analogous with the Analyst Hardware Configuration.
Timebase (TB) A complete set of chromatography modules that share the same system time – this DCMSLink term is analogous with the Analyst Hardware Profile.
A Timebase must be created and configured during the installation of DCMSLink.
DCMSLink 2.10 for Analyst Quick Start Guide
4
2 Introduction
2.1 Scope
The Quick Start Guide gives an overview of what DCMSLink for Analyst is, and provides step-by-step instructions about how to control and acquire data from Dionex instruments via the Analyst® software. The guide is designed to provide quick reference for the basic operation.
Note: The screen captures and the step-by-step instructions in this guide were created using version 2.0 of DCMSLink and version 1.4.2 of the Analyst software. They are however applicable to current versions of DCMSLink and version 1.5.1 of Analyst. Small deviations are possible, nevertheless.
Note: This guide provides some basic information about how to use the Analyst software with focus on controlling the LC (or IC) front-end. For using DCMSLink with Analyst efficiently and for controlling the MS, the user must be familiar with the operation of Analyst and the MS.
The information contained in this guide is subject to change without notice and should not be construed as a commitment by Dionex. Dionex assumes no responsibility for any errors that may appear in this document. This document is believed to be complete and accurate at the time of publication. In no event shall Dionex be liable for incidental or consequential damages in connection with or arising from the use of this document.
Dionex cannot be held liable for any damage, material or otherwise, resulting from inappropriate or improper use of the software. If there is any question regarding appropriate usage, contact Dionex before proceeding.
CHROMELEON® and UltiMate® are registered trademarks of Dionex. All other trade or company names mentioned are subject to the copyright and the property and trademark rights of the respective companies.
All rights reserved, including those for photomechanical reproduction and storage on electronic media. No part of this publication may be copied or distributed, transmitted, transcribed, stored in a retrieval system, or transmitted into any human or computer language, in any form or by any means, electronic, mechanical, magnetic, manual, or otherwise, or disclosed to third parties without the express written permission of Dionex.
DCMSLink 2.10 for Analyst Quick Start Guide
5
2.2 Document Conventions
At various points throughout the manual, messages of particular importance are indicated by certain symbols:
Tip: Indicates general information, as well as information intended to optimize performance.
Important: Indicates that failure to take note of the accompanying information could cause wrong results or may result in damage to the controlled instruments.
2.3 Other Resources
The following documents provide further details about installing, configuring and using the software.
Document Description
Installation Guide - Describes all the requirements for installing DCMSLink (e.g. PC and operating system requirements). - Lists the supported instruments. - Gives step-by-step instructions for installing and configuring DCMSLink for Analyst.
Troubleshooting Guide Provides reference information about: - Status indicators - Known issues and limitations - DOs and DON’Ts for preventing problems Lists and provides remedies for: - Error messages - Typical problems Describes how to Collect Data for Troubleshooting by Dionex.
Release Notes Describes what is new in each DCMSLink for Analyst release
Migration of Methods Describes how to modify instrument methods (Program scripts, PGM files), which were created in Chromeleon before they can be used with DCMSLink for Analyst and vice versa.
Online Help Provides general information and context sensitive help about the various options available in DCMSLink.
Tip: After installing DCMSLink, the above resources and this Quick Start Guide can be easily accessed at any time from the Start menu: Start > All Programs > Dionex > DCMSLink > Documentation. (The documents are installed in the “Documentation” folder in the DCMSLink installation folder, i.e. in C:\DCMSLink. They are also available on the installation CD in the “Additional Documents” folder.)
Tip: For consulting, training, and implementation services, contact your local Dionex support and service center.
DCMSLink 2.10 for Analyst Quick Start Guide
6
2.4 What is DCMSLink?
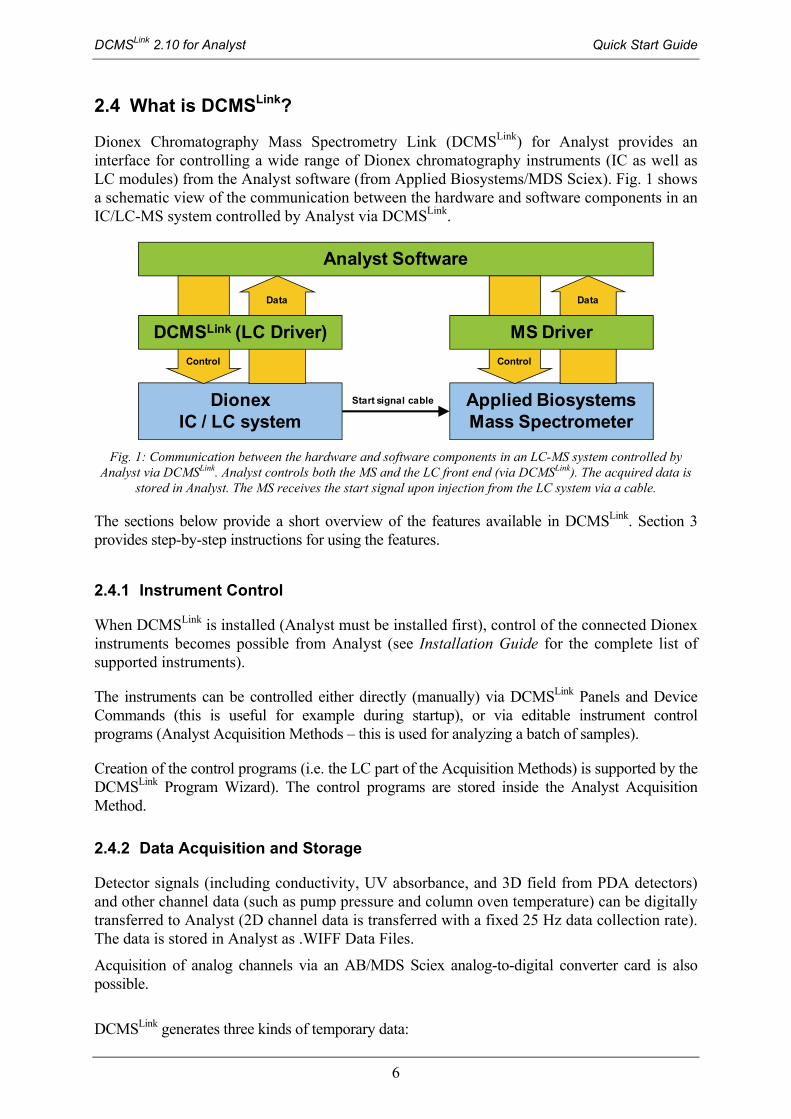
Dionex Chromatography Mass Spectrometry Link (DCMSLink) for Analyst provides an interface for controlling a wide range of Dionex chromatography instruments (IC as well as LC modules) from the Analyst software (from Applied Biosystems/MDS Sciex). Fig. 1 shows a schematic view of the communication between the hardware and software components in an IC/LC-MS system controlled by Analyst via DCMSLink.
Analyst Software
Applied Biosystems Mass Spectrometer
Dionex IC / LC system
Start signal cable
Control
Data
DCMSLink (LC Driver)
Control
Data
MS Driver
Fig. 1: Communication between the hardware and software components in an LC-MS system controlled by
Analyst via DCMSLink. Analyst controls both the MS and the LC front end (via DCMSLink). The acquired data is stored in Analyst. The MS receives the start signal upon injection from the LC system via a cable.
The sections below provide a short overview of the features available in DCMSLink. Section 3 provides step-by-step instructions for using the features.
2.4.1 Instrument Control
When DCMSLink is installed (Analyst must be installed first), control of the connected Dionex instruments becomes possible from Analyst (see Installation Guide for the complete list of supported instruments).
The instruments can be controlled either directly (manually) via DCMSLink Panels and Device Commands (this is useful for example during startup), or via editable instrument control programs (Analyst Acquisition Methods – this is used for analyzing a batch of samples).
Creation of the control programs (i.e. the LC part of the Acquisition Methods) is supported by the DCMSLink Program Wizard). The control programs are stored inside the Analyst Acquisition Method.
2.4.2 Data Acquisition and Storage
Detector signals (including conductivity, UV absorbance, and 3D field from PDA detectors) and other channel data (such as pump pressure and column oven temperature) can be digitally transferred to Analyst (2D channel data is transferred with a fixed 25 Hz data collection rate). The data is stored in Analyst as .WIFF Data Files.
Acquisition of analog channels via an AB/MDS Sciex analog-to-digital converter card is also possible.
DCMSLink generates three kinds of temporary data:
DCMSLink 2.10 for Analyst Quick Start Guide
7
- Chromeleon sequences – saved under a local Datasource.
- Chromeleon Audit Trail – also saved under the local Datasource
- DCMSLink daily log files – saved under “C:\DCMSLink\Logfiles\” folder
DCMSLink can automatically delete this temporary data after some time. The following choices are available:
- Older than 1 day: This option keeps the temporary files at minimum. However, troubleshooting is only possible for the current and the previous calendar day.
- Older than 30 days: This is the recommended choice. It allows troubleshooting for the last 30 days. The temporary files are then automatically deleted.
- Never (do not delete): Choose this option only if you use DCMSLink and Chromeleon in parallel. In this case, you will have to manually manage the samples/sequences in Chromeleon and delete superfluous Audit Trail and DCMSLink log files.
2.4.2.1 Limitations with Analyst QS 2.0
As the required software interface is not available in Analyst QS 2.0, digital data acquisition is not supported for this version of Analyst.
The signals can be viewed online (i.e. during acquisition) in DCMSLink panels, but this data will not be transferred to Analyst.
Signals from instruments with analog outputs can nevertheless be recorded via an AB/MDS Sciex analog-to-digital converter card (as it was the case for version 1.1 of DCMSLink for Analyst). Note however, that some Dionex detectors have no analog output (e.g. the UVD 170(U)). If analog data acquisition is required, please verify the availability of analog outputs in the instrument’s documentation.
2.4.3 Data Processing and Reporting
Analyst is used for processing and reporting the data / results.
2.4.4 DCMSLink and Chromeleon
DCMSLink is based on Chromeleon technology, i.e., it installs and uses certain portions of the Dionex Chromeleon Chromatography Management System such as the Chromeleon Server, the Chromeleon Server Configuration tool, Control Panels, and the Program Editor. Installation qualification is also managed via Chromeleon tools.
If the use of other Chromeleon features is desired, the corresponding Chromeleon licenses have to be purchased and applied. The Troubleshooting Guide contains hints about working with Chromeleon and DCMSLink.
DCMSLink 2.10 for Analyst Quick Start Guide
8
3 How To…
The sections below provide step-by-step instructions on how to perform common tasks such as equilibrating the system, creating an Acquisition Method, creating and running an Acquisition Batch and reviewing the chromatography data.
3.1 Starting the Software
Important: Analyst software, DCMSLink, the chromatography instruments and the mass spectrometer must be properly installed and configured first. In particular, DCMSLink must be added to the Analyst Hardware Profile and the chromatography instrument drivers must be added to the Chromeleon Server Configuration. The Hardware Profile containing DCMSLink must be active.
Tip: The steps for installing and configuring DCMSLink and the chromatography instruments are described in the Installation Guide and the hardware manuals.
To start the Analyst software and DCMSLink:
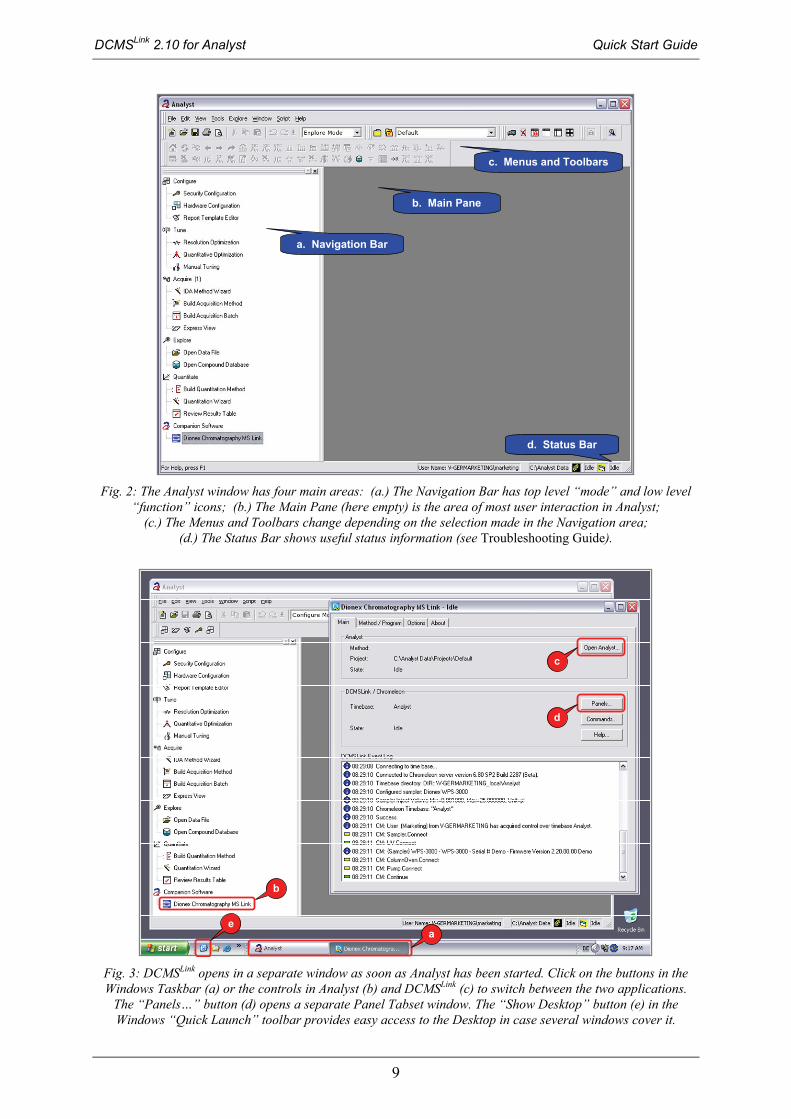
1. Start the Analyst software, for example by choosing: Start > All Programs > Applied Biosystems MDS Sciex > Analyst 1.x.x. Note, that the Analyst window has four main areas as described in Fig. 2
2. DCMSLink opens automatically in a separate window, Fig. 3
Tip: If DCMSLink does not start automatically, it may not have been added to the currently active Analyst Hardware Profile, or the Hardware Profile may not be active. For instructions, see the Installation Guide.
Important: Do not close the DCMSLink window while Analyst is running, especially not during ongoing analysis. Closing the DCMSLink window can cause communication problems and will interrupt running analyses.
3. The “Panels…” button on the DCMSLink Main tab (Fig. 3d) opens a separate (maximized) Panel Tabset window for direct control and monitoring the front-end, see section 3.2.1.
Tip: The Panels can also be opened before Analyst using the “Chromeleon” shortcut in the Start > All Programs > DCMSLink or with the desktop icon. Note however, that this works only, if the “Start Server at System Start” option has been enabled as described in the Installation Guide.
4. Use the Windows Taskbar to switch between the applications, Fig. 3 (a), or use the controls in the Analyst Navigation Bar (b) and on the DCMSLink Main page (c).
Tip: The “Show Desktop” button (Fig. 3e) in the Windows “Quick Launch” toolbar or the “Windows logo key” + D keyboard shortcut provide easy access to the Desktop icons in case several windows cover them.
DCMSLink 2.10 for Analyst Quick Start Guide
9
a. Navigation Bar
b. Main Pane
d. Status Bar
c. Menus and Toolbars
Fig. 2: The Analyst window has four main areas: (a.) The Navigation Bar has top level “mode” and low level
“function” icons; (b.) The Main Pane (here empty) is the area of most user interaction in Analyst; (c.) The Menus and Toolbars change depending on the selection made in the Navigation area;
(d.) The Status Bar shows useful status information (see Troubleshooting Guide).
a
b
c
d
e
Fig. 3: DCMSLink opens in a separate window as soon as Analyst has been started. Click on the buttons in the Windows Taskbar (a) or the controls in Analyst (b) and DCMSLink (c) to switch between the two applications.
The “Panels…” button (d) opens a separate Panel Tabset window. The “Show Desktop” button (e) in the Windows “Quick Launch” toolbar provides easy access to the Desktop in case several windows cover it.

DCMSLink 2.10 for Analyst Quick Start Guide
10
3.2 Equilibrating the System
Important: Before you start up your system, you should be familiar with the related recommendations for your MS and LC/IC modules!
There are two principal ways of equilibrating the LC system
Automatic equilibration using the Analyst Equilibrate command (see section 3.2.3). To use this, an Acquisition Method with LC part must have already been created.
Manually setting and monitoring the desired parameters. There are two options for this:
via software Panels (see section 3.2.1),
via Control Commands (see section 3.2.2).
Important: When DCMSLink is connected to the chromatography instruments, their (physical) control panels are disabled. Control the instruments via the software Panels or Device Commands provided by DCMSLink!
3.2.1 Manual Equilibration/Operation – via Panels
DCMSLink provides easy to use Panel Tabsets (collection of software Panels) for direct interaction with the connected Dionex instruments, Fig. 4. The Panels allow easy monitoring of the system (e.g. to see the current UV signal, flow rate, background conductivity, and pressure) and provide easy means to control all the common instrument properties (e.g. flow on/off, purge, pressure limits, detector wavelength, EG concentration setpoint, suppressor current, etc.).
Tip: The actual instrument configuration will determine which Panels and controls are included in the Panel Tabset. Older instruments and rare combination of modules may not be (fully) supported. In this case: - use Control Commands for direct control of the modules (section 3.2.2) - use the Status Window to monitor selected properties (section 3.6.2)
Basic Operation of the Panels:
1. On the DCMSLink “Main” tab click on the Panels… button, Fig. 3d, or double-click on the “Chromeleon” icon on the Desktop or via the Start > All Programs > DCMSLink menu.
2. A Panel Tabset opens in a maximized window, Fig. 4.
Tip: Panels are best viewed in a maximized window. This ensures that all the controls on the panels are visible.

DCMSLink 2.10 for Analyst Quick Start Guide
11
3. A dialog box may appear asking whether you want to take over the control of the Timebase. Answer Yes.
Tip: This is necessary, because the Analyst software has control over the Timebase most of the time. In order to perform manual actions through the Panels the control must be taken explicitly. Analyst may take the control back automatically, when it needs it. In this case, some controls on the panel become inactive (grayed out). To take the control back press the “Take Control” button on the Home Panel of UltiMate 3000 systems, Fig. 4a. For IC systems, the corresponding button is called “Local Control – Take”, see Fig. 5.
It is possible to use the panels (i.e. for monitoring the front-end) during an ongoing data acquisition started from Analyst. However, it is not recommended to take the control and interfere with the ongoing run.
4. To access module specific properties use the tabs in the top row of the screen, Fig. 6a.
5. Use the controls on the Panels to make the necessary settings, Fig. 4b.
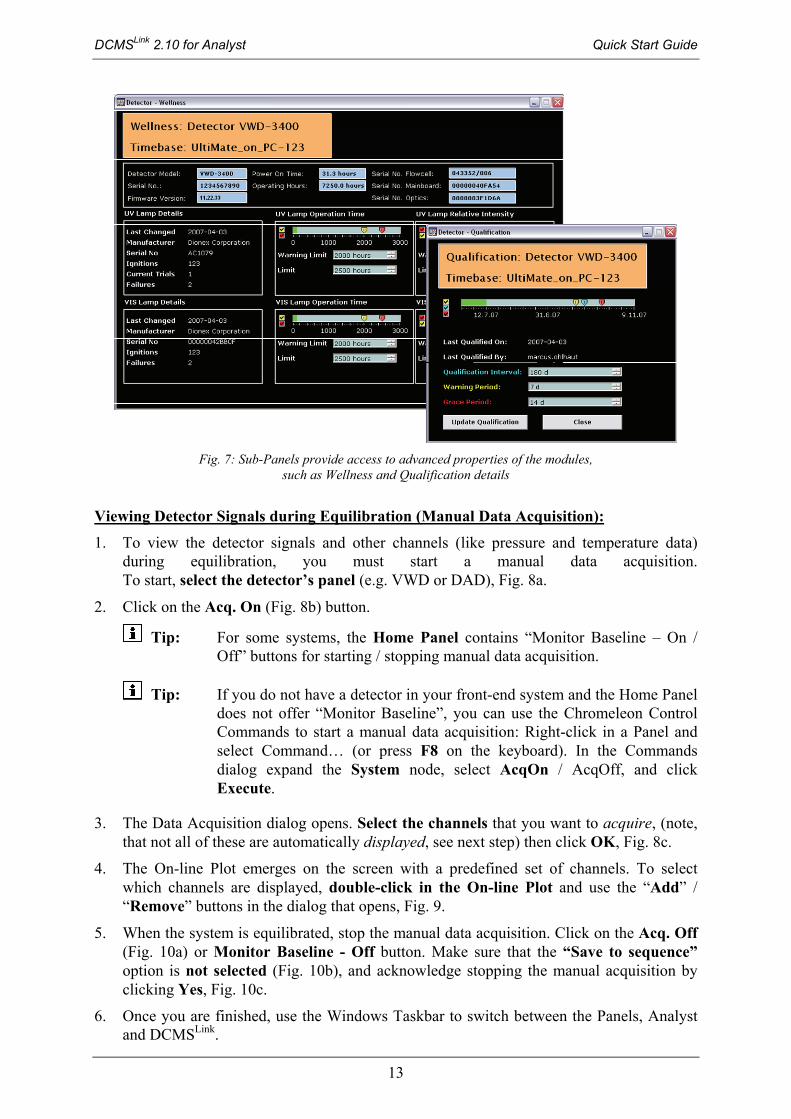
6. Advanced properties of the modules, such as Qualification data, can be reached via Sub-Panels, Fig. 6b and Fig. 7.
The “Home” tab provides an overview of the most important system properties
a. Should some controls became inactive, press “Take Control”
b. Use the various
controls to set the desired parameters
Fig. 4: Panels allow easy monitoring and control of the common parameters of the connected chromatography
modules. The Home Panel provides an overview of the most important parameters.
DCMSLink 2.10 for Analyst Quick Start Guide
12
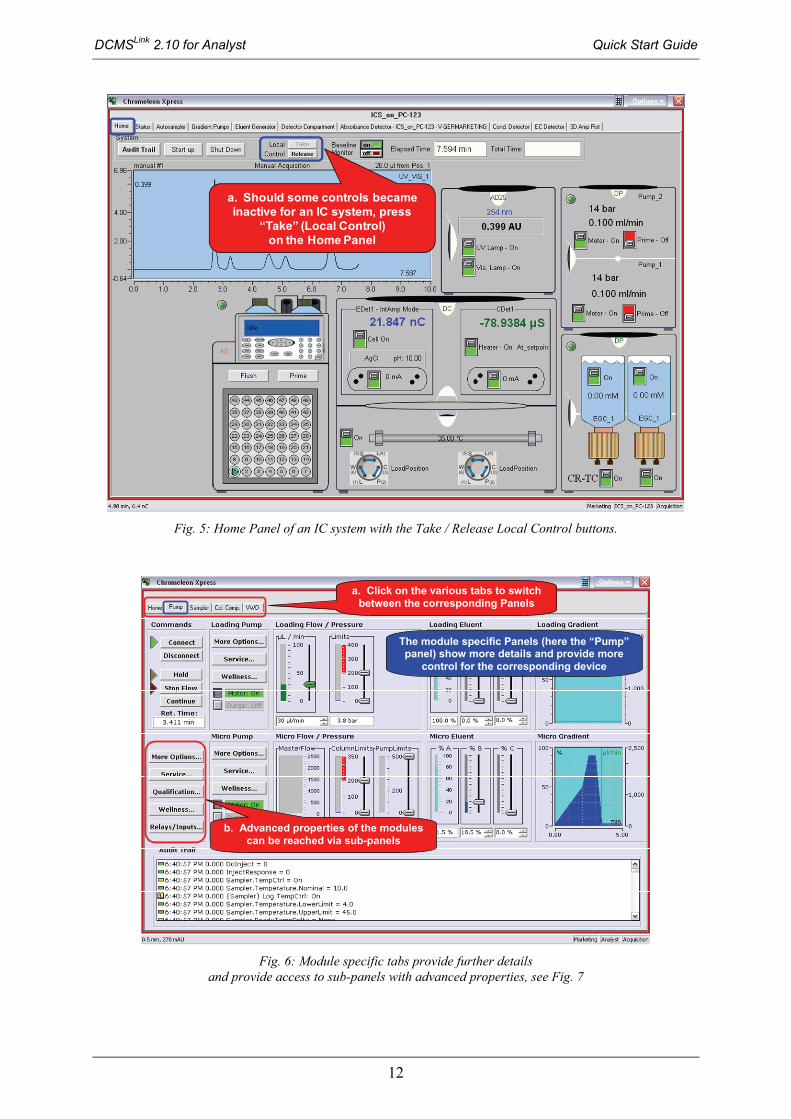
a. Should some controls became inactive for an IC system, press
“Take” (Local Control) on the Home Panel
Fig. 5: Home Panel of an IC system with the Take / Release Local Control buttons.
a. Click on the various tabs to switch
between the corresponding Panels
The module specific Panels (here the “Pump” panel) show more details and provide more
control for the corresponding device
b. Advanced properties of the modules can be reached via sub-panels
Fig. 6: Module specific tabs provide further details
and provide access to sub-panels with advanced properties, see Fig. 7
DCMSLink 2.10 for Analyst Quick Start Guide
13
Fig. 7: Sub-Panels provide access to advanced properties of the modules,
such as Wellness and Qualification details
Viewing Detector Signals during Equilibration (Manual Data Acquisition):
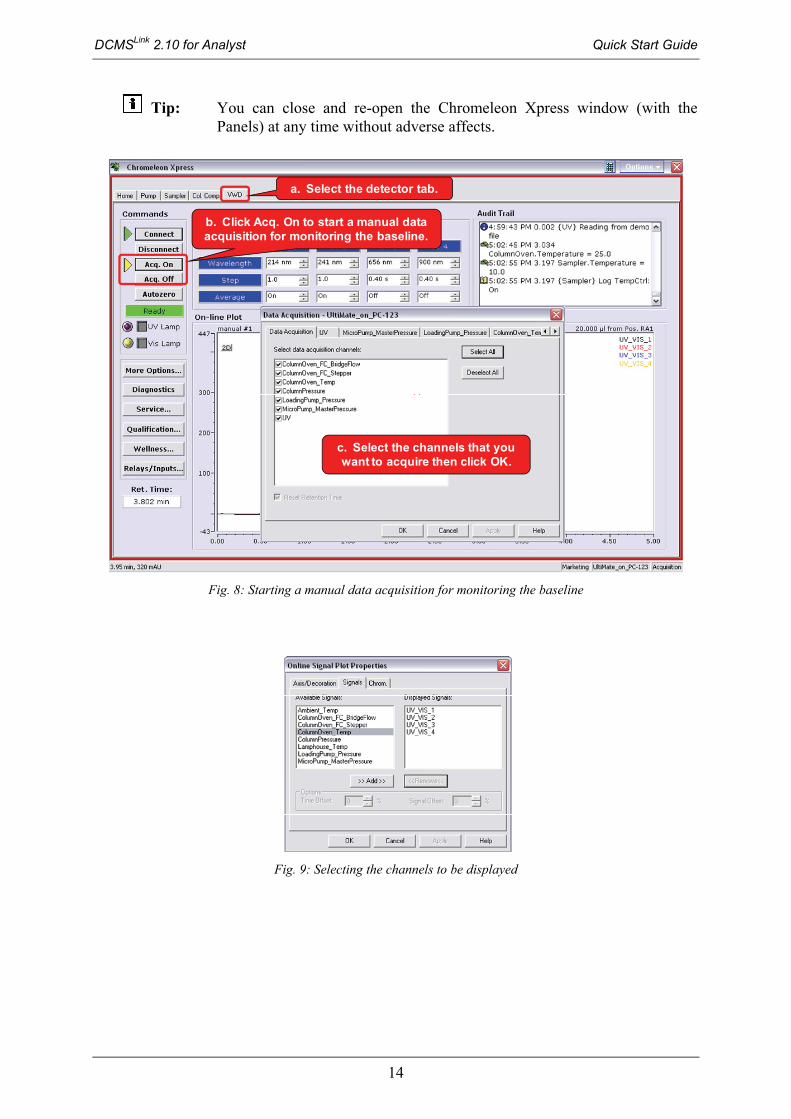
1. To view the detector signals and other channels (like pressure and temperature data) during equilibration, you must start a manual data acquisition. To start, select the detector’s panel (e.g. VWD or DAD), Fig. 8a.
2. Click on the Acq. On (Fig. 8b) button.
Tip: For some systems, the Home Panel contains “Monitor Baseline – On / Off” buttons for starting / stopping manual data acquisition.
Tip: If you do not have a detector in your front-end system and the Home Panel does not offer “Monitor Baseline”, you can use the Chromeleon Control Commands to start a manual data acquisition: Right-click in a Panel and select Command… (or press F8 on the keyboard). In the Commands dialog expand the System node, select AcqOn / AcqOff, and click Execute.
3. The Data Acquisition dialog opens. Select the channels that you want to acquire, (note, that not all of these are automatically displayed, see next step) then click OK, Fig. 8c.
4. The On-line Plot emerges on the screen with a predefined set of channels. To select which channels are displayed, double-click in the On-line Plot and use the “Add” / “Remove” buttons in the dialog that opens, Fig. 9.
5. When the system is equilibrated, stop the manual data acquisition. Click on the Acq. Off (Fig. 10a) or Monitor Baseline - Off button. Make sure that the “Save to sequence” option is not selected (Fig. 10b), and acknowledge stopping the manual acquisition by clicking Yes, Fig. 10c.
6. Once you are finished, use the Windows Taskbar to switch between the Panels, Analyst and DCMSLink.
DCMSLink 2.10 for Analyst Quick Start Guide
14
Tip: You can close and re-open the Chromeleon Xpress window (with the Panels) at any time without adverse affects.
b. Click Acq. On to start a manual data acquisition for monitoring the baseline.
a. Select the detector tab.
c. Select the channels that you want to acquire then click OK.
Fig. 8: Starting a manual data acquisition for monitoring the baseline
Fig. 9: Selecting the channels to be displayed

DCMSLink 2.10 for Analyst Quick Start Guide
15
a. Click Acq. Off when you have seen enough of the baseline.
b. Deselect the Save to sequence option.
c. Acknowledge stopping the manual acquisition.
Fig. 10: Stopping the manual data acquisition
3.2.2 Manual Equilibration/Operation – via Control Commands
While Panels provide easy to use interface for setting the most common instrument properties, Device Commands provide access for all the (numerous!) properties of the modules via a compact dialog, Fig. 11. This way of manual operation is only recommended for advanced use, i.e. when advanced parameters are not available via Panels.
Manually equilibrating the system using Control Commands:
1. There are two ways to open the Commands dialog:
- On the DCMSLink “Main” page click on the Commands… button
- In a Panel, right-click and choose Command… from the context menu or press the F8 key on your keyboard.
2. The Commands dialog box opens allowing you to monitor and control all properties of your instruments.
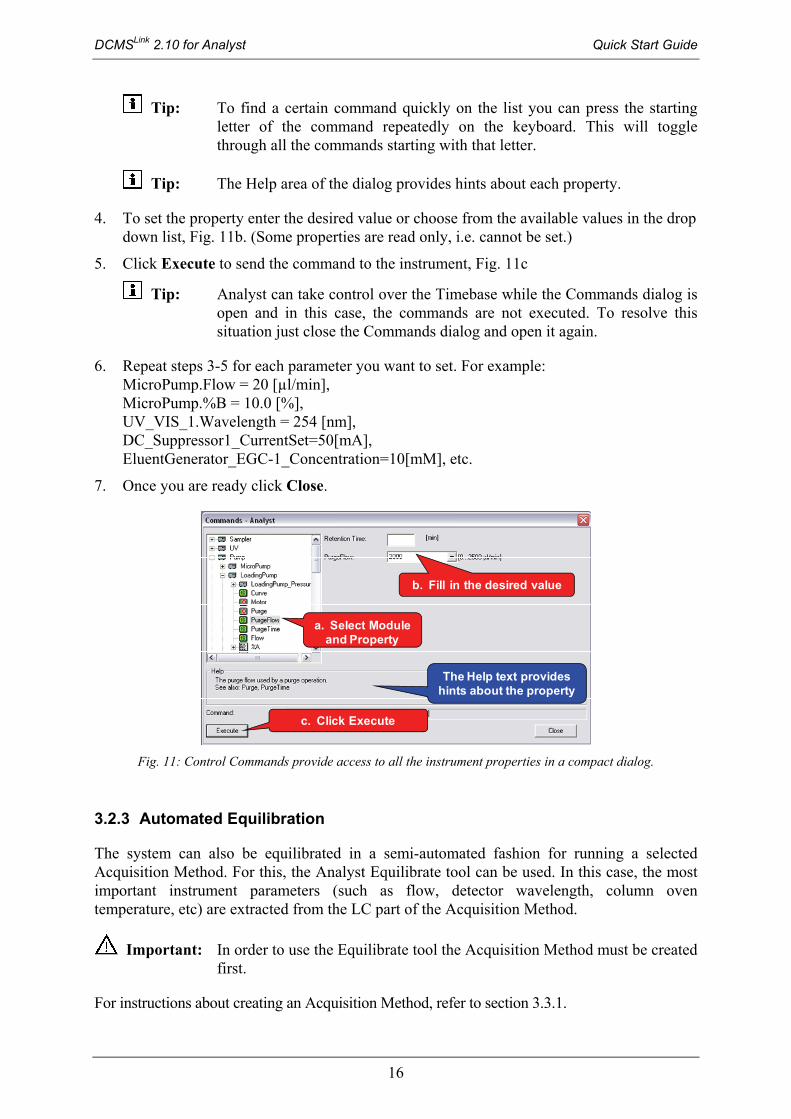
3. In the selection area use the tree control to select the module and the property you want set or check Fig. 11a.
Tip: Right clicking in the selection area shows a context menu where Normal, Advanced, and Expert view modes can be selected. Normal mode displays only the frequently used properties, while Expert mode displays all the properties.
DCMSLink 2.10 for Analyst Quick Start Guide
16
Tip: To find a certain command quickly on the list you can press the starting letter of the command repeatedly on the keyboard. This will toggle through all the commands starting with that letter.
Tip: The Help area of the dialog provides hints about each property.
4. To set the property enter the desired value or choose from the available values in the drop down list, Fig. 11b. (Some properties are read only, i.e. cannot be set.)
5. Click Execute to send the command to the instrument, Fig. 11c
Tip: Analyst can take control over the Timebase while the Commands dialog is open and in this case, the commands are not executed. To resolve this situation just close the Commands dialog and open it again.
6. Repeat steps 3-5 for each parameter you want to set. For example: MicroPump.Flow = 20 [µl/min], MicroPump.%B = 10.0 [%], UV_VIS_1.Wavelength = 254 [nm], DC_Suppressor1_CurrentSet=50[mA], EluentGenerator_EGC-1_Concentration=10[mM], etc.
7. Once you are ready click Close.
b. Fill in the desired value
a. Select Module and Property
c. Click Execute
The Help text provides hints about the property
Fig. 11: Control Commands provide access to all the instrument properties in a compact dialog.
3.2.3 Automated Equilibration
The system can also be equilibrated in a semi-automated fashion for running a selected Acquisition Method. For this, the Analyst Equilibrate tool can be used. In this case, the most important instrument parameters (such as flow, detector wavelength, column oven temperature, etc) are extracted from the LC part of the Acquisition Method.
Important: In order to use the Equilibrate tool the Acquisition Method must be created first.
For instructions about creating an Acquisition Method, refer to section 3.3.1.
DCMSLink 2.10 for Analyst Quick Start Guide
17
To automatically equilibrate the system for a certain Acquisition Method:
1. Make sure that the Analyst Queue Manager is active. If not, in the navigation area select Acquire mode, then in the menu bar choose View > Sample Queue.
2. In the Analyst menu bar, choose Acquire > Equilibrate.
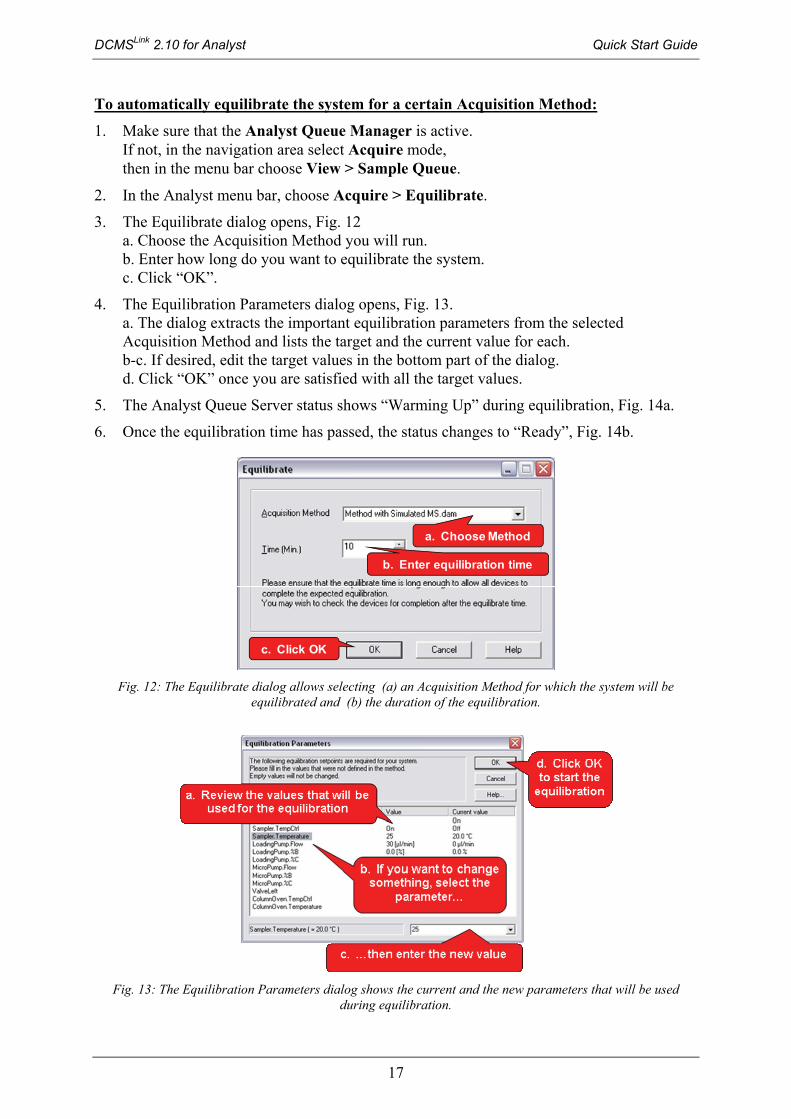
3. The Equilibrate dialog opens, Fig. 12 a. Choose the Acquisition Method you will run. b. Enter how long do you want to equilibrate the system. c. Click “OK”.
4. The Equilibration Parameters dialog opens, Fig. 13. a. The dialog extracts the important equilibration parameters from the selected Acquisition Method and lists the target and the current value for each. b-c. If desired, edit the target values in the bottom part of the dialog. d. Click “OK” once you are satisfied with all the target values.
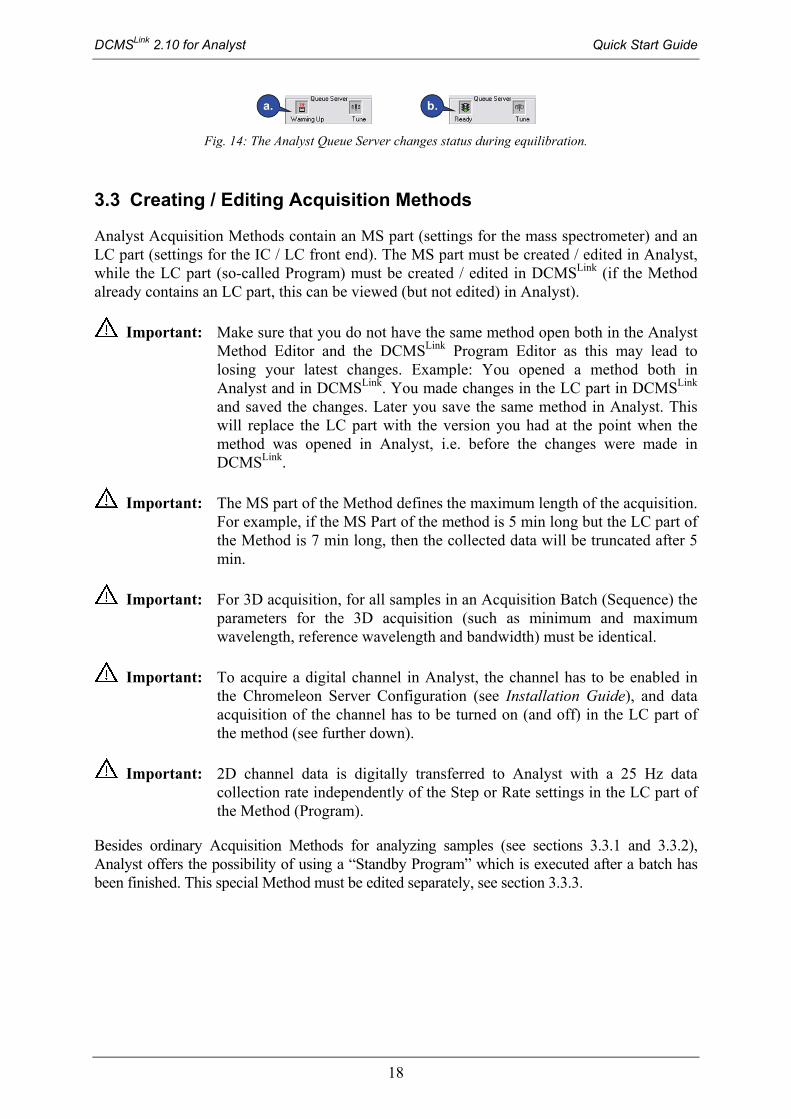
5. The Analyst Queue Server status shows “Warming Up” during equilibration, Fig. 14a.
6. Once the equilibration time has passed, the status changes to “Ready”, Fig. 14b.
a. Choose Method
b. Enter equilibration time
c. Click OK
Fig. 12: The Equilibrate dialog allows selecting (a) an Acquisition Method for which the system will be
equilibrated and (b) the duration of the equilibration.
Fig. 13: The Equilibration Parameters dialog shows the current and the new parameters that will be used
during equilibration.
DCMSLink 2.10 for Analyst Quick Start Guide
18
a. b.
Fig. 14: The Analyst Queue Server changes status during equilibration.
3.3 Creating / Editing Acquisition Methods
Analyst Acquisition Methods contain an MS part (settings for the mass spectrometer) and an LC part (settings for the IC / LC front end). The MS part must be created / edited in Analyst, while the LC part (so-called Program) must be created / edited in DCMSLink (if the Method already contains an LC part, this can be viewed (but not edited) in Analyst).
Important: Make sure that you do not have the same method open both in the Analyst Method Editor and the DCMSLink Program Editor as this may lead to losing your latest changes. Example: You opened a method both in Analyst and in DCMSLink. You made changes in the LC part in DCMSLink and saved the changes. Later you save the same method in Analyst. This will replace the LC part with the version you had at the point when the method was opened in Analyst, i.e. before the changes were made in DCMSLink.
Important: The MS part of the Method defines the maximum length of the acquisition. For example, if the MS Part of the method is 5 min long but the LC part of the Method is 7 min long, then the collected data will be truncated after 5 min.
Important: For 3D acquisition, for all samples in an Acquisition Batch (Sequence) the parameters for the 3D acquisition (such as minimum and maximum wavelength, reference wavelength and bandwidth) must be identical.
Important: To acquire a digital channel in Analyst, the channel has to be enabled in the Chromeleon Server Configuration (see Installation Guide), and data acquisition of the channel has to be turned on (and off) in the LC part of the method (see further down).
Important: 2D channel data is digitally transferred to Analyst with a 25 Hz data collection rate independently of the Step or Rate settings in the LC part of the Method (Program).
Besides ordinary Acquisition Methods for analyzing samples (see sections 3.3.1 and 3.3.2), Analyst offers the possibility of using a “Standby Program” which is executed after a batch has been finished. This special Method must be edited separately, see section 3.3.3.
DCMSLink 2.10 for Analyst Quick Start Guide
19
3.3.1 Creating a New Acquisition Method for Samples
Creating the MS part of the Method
Tip: Appendix A provides instructions for creating an Acquisition Method with a simulated MS, e.g. for testing the LC front end without having a properly configured mass spectrometer connected to the system.
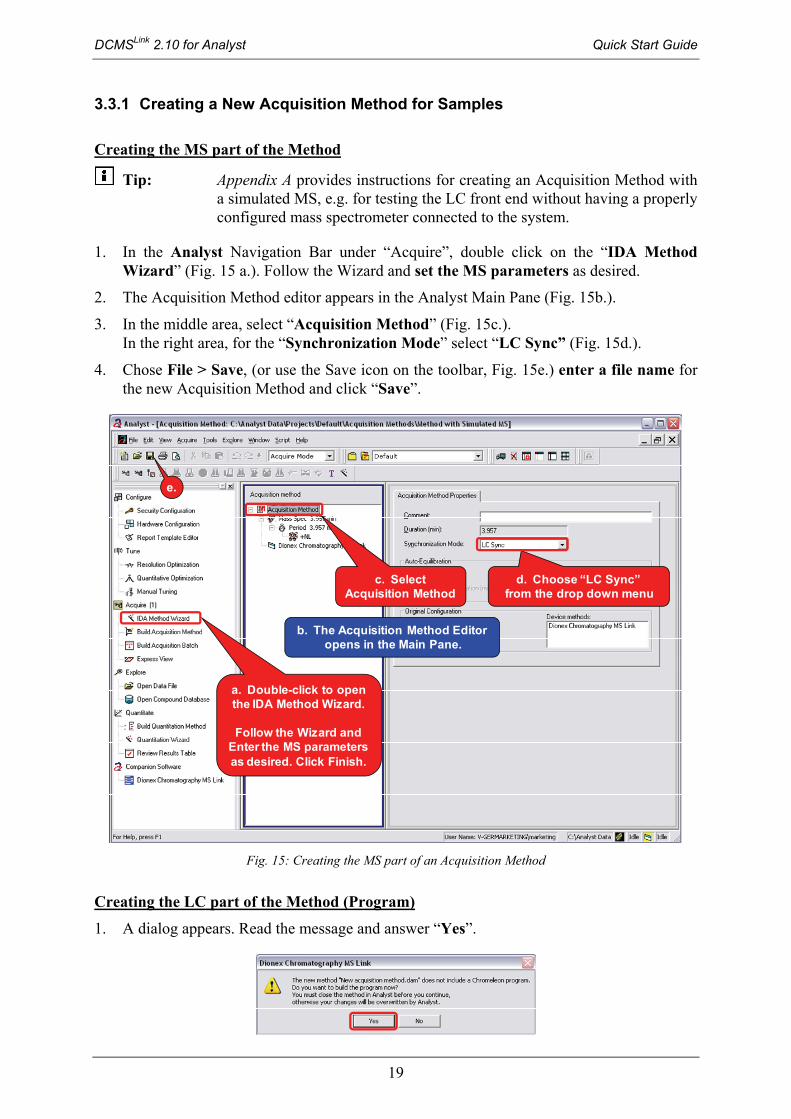
1. In the Analyst Navigation Bar under “Acquire”, double click on the “IDA Method Wizard” (Fig. 15 a.). Follow the Wizard and set the MS parameters as desired.
2. The Acquisition Method editor appears in the Analyst Main Pane (Fig. 15b.).
3. In the middle area, select “Acquisition Method” (Fig. 15c.). In the right area, for the “Synchronization Mode” select “LC Sync” (Fig. 15d.).
4. Chose File > Save, (or use the Save icon on the toolbar, Fig. 15e.) enter a file name for the new Acquisition Method and click “Save”.
a. Double-click to open the IDA Method Wizard.
Follow the Wizard and Enter the MS parameters as desired. Click Finish.
c. Select Acquisition Method
d. Choose “LC Sync”from the drop down menu
b. The Acquisition Method Editoropens in the Main Pane.
e.
Fig. 15: Creating the MS part of an Acquisition Method
Creating the LC part of the Method (Program)
1. A dialog appears. Read the message and answer “Yes”.
DCMSLink 2.10 for Analyst Quick Start Guide
20
2. The DCMSLink Program Wizard appears
3. Close the Method in Analyst and switch back to the DCMSLink Program Wizard (as suggested by the message above).
4. Go through the Wizard pages (Fig. 16) to generate the LC part of the Acquisition Method. Make sure you select the channels that you want to acquire and store in Analyst.
Tip: The “Inject Options” Wizard page is specific for DCMSLink for Analyst. It was first added in DCMSLink 2.7.x to support Cliquid 2.0. The functionality has changed in DCMSLink 2.8. It allows now specifying a default injection volume and limits, which are now also used in the Analyst Batch Editor. If you have created Acquisition Methods using DCMSLink 2.7.x with the “Use this Volume” option enabled, review the LC part of your Methods and remove any “Volume = …” commands.
5. At the end, click “Finish”.
6. The LC part of the Method appears in the DCMSLink “Method / Program” tab, (Fig. 17).
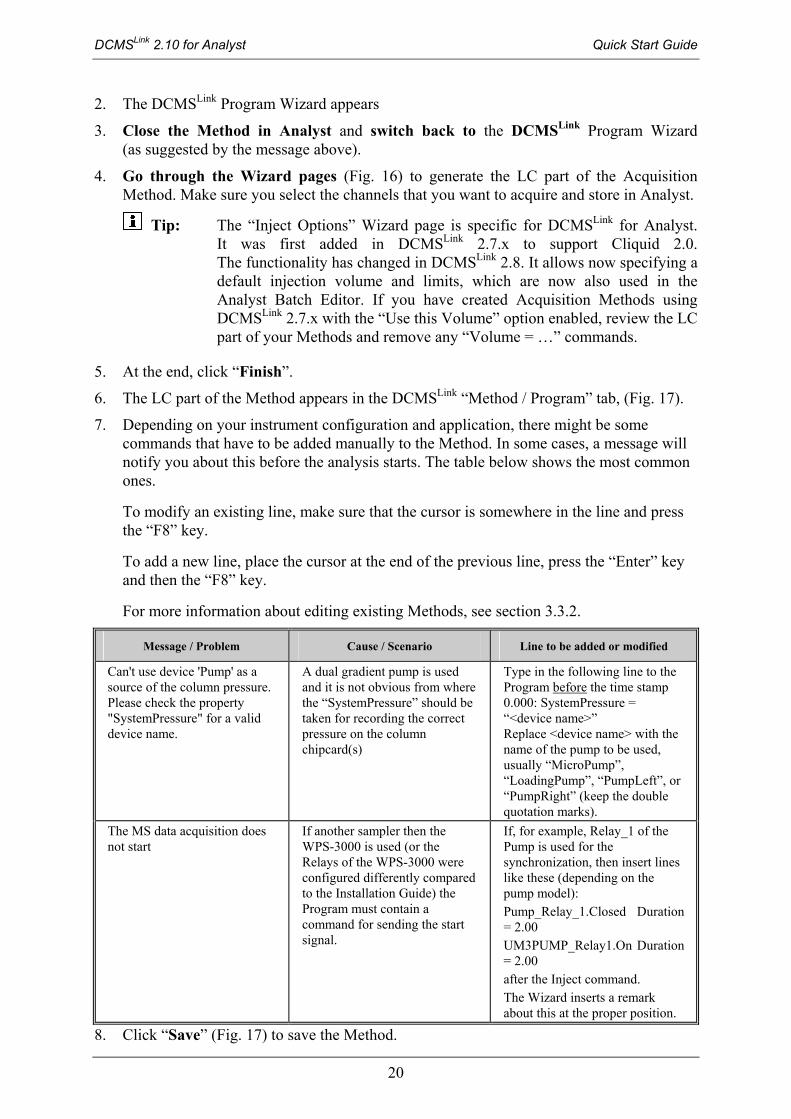
7. Depending on your instrument configuration and application, there might be some commands that have to be added manually to the Method. In some cases, a message will notify you about this before the analysis starts. The table below shows the most common ones.
To modify an existing line, make sure that the cursor is somewhere in the line and press the “F8” key.
To add a new line, place the cursor at the end of the previous line, press the “Enter” key and then the “F8” key.
For more information about editing existing Methods, see section 3.3.2.
Message / Problem Cause / Scenario Line to be added or modified
Can't use device 'Pump' as a source of the column pressure. Please check the property "SystemPressure" for a valid device name.
A dual gradient pump is used and it is not obvious from where the “SystemPressure” should be taken for recording the correct pressure on the column chipcard(s)
Type in the following line to the Program before the time stamp 0.000: SystemPressure = “<device name>” Replace <device name> with the name of the pump to be used, usually “MicroPump”, “LoadingPump”, “PumpLeft”, or “PumpRight” (keep the double quotation marks).
The MS data acquisition does not start
If another sampler then the WPS-3000 is used (or the Relays of the WPS-3000 were configured differently compared to the Installation Guide) the Program must contain a command for sending the start signal.
If, for example, Relay_1 of the Pump is used for the synchronization, then insert lines like these (depending on the pump model): Pump_Relay_1.Closed Duration = 2.00 UM3PUMP_Relay1.On Duration = 2.00 after the Inject command. The Wizard inserts a remark about this at the proper position.
8. Click “Save” (Fig. 17) to save the Method.

DCMSLink 2.10 for Analyst Quick Start Guide
21
Select all the acquisition channels that you want to
store in Analyst!
Fig. 16: A few examples of the Program Wizard pages Fig. 16: A few examples of the Program Wizard pages
The method opens in the DCMSLink “Method / Program” tab page
Click “Save”
Fig. 17: The LC part of the new method opens in the DCMSLink “Method / Program” tab page.

DCMSLink 2.10 for Analyst Quick Start Guide
22
3.3.2 Editing an Existing Acquisition Method for Samples
Editing the MS part of the Method
1. In the Analyst menu bar, choose File > Open. The Open dialog appears.
2. For “Files of Type” select “Acquisition Method”.
3. Select the Method and click “OK”
4. Edit the MS parameters as necessary.
5. Finally choose File > Save.
6. Close the Method.
Important: Closing the method in Analyst before editing the LC part in DCMSLink is important. Having the same Method open in both software can lead to data loss.
Editing the LC part of the Method (Program)
1. In the DCMSLink “Method / Program” tab choose your Method from the “Method” drop down list, Fig. 18a.
2. The Method opens in Commands view, i.e. as a chronological list of instrument commands, Fig. 18b.
a. Choose your Method from the drop down list
b. The method opens in “Commands” view
c. Right click in the line you want to edit and choose
“Command…” or press F8
c. Right click in the line you want to edit and choose
“Command…” or press F8
d.
Fig. 18: Start editing the LC part of a method by selecting it form the dropdown list. Single parameters can be
easily edited in Commands view.
DCMSLink 2.10 for Analyst Quick Start Guide
23
The “Method / Program” tab offers various means of editing the Method. These include: - Editing specific lines in Commands view - Editing parameters for a certain module in Device views - Replacing the entire Program using the Wizard - Importing the Method (Program) from Chromeleon These and the other options available in the “Method / Program” tab are described below.
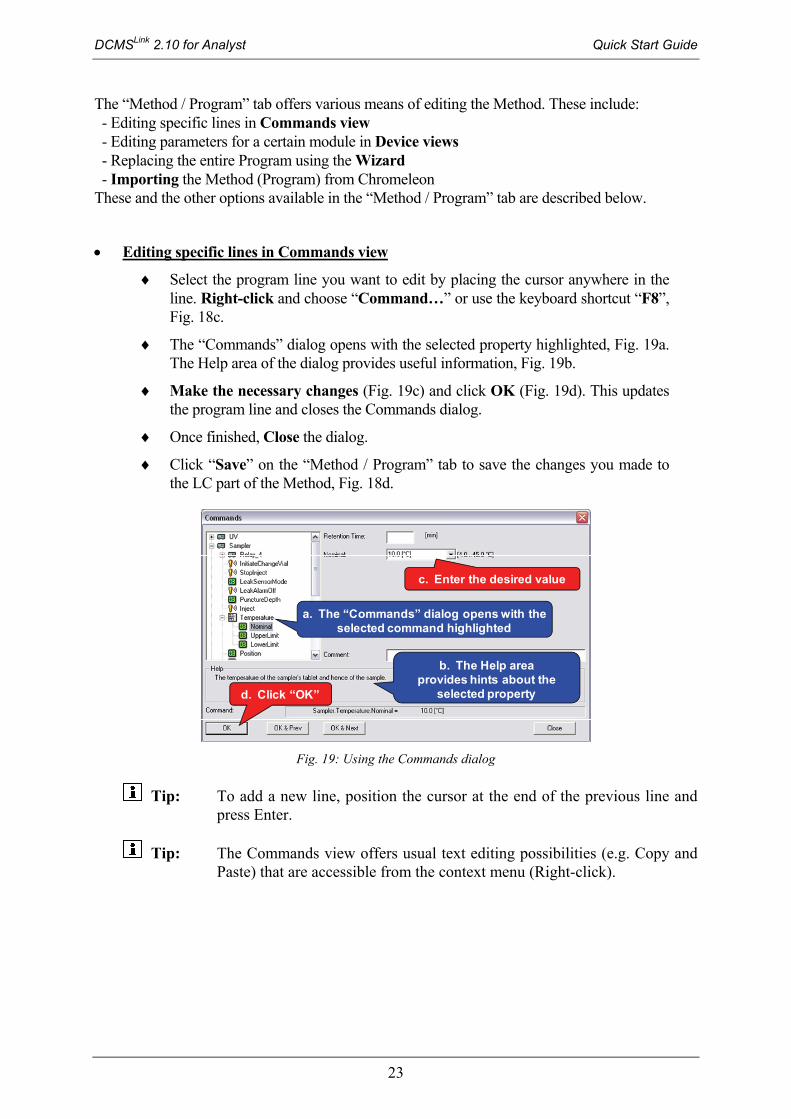
Editing specific lines in Commands view
Select the program line you want to edit by placing the cursor anywhere in the line. Right-click and choose “Command…” or use the keyboard shortcut “F8”, Fig. 18c.
The “Commands” dialog opens with the selected property highlighted, Fig. 19a. The Help area of the dialog provides useful information, Fig. 19b.
Make the necessary changes (Fig. 19c) and click OK (Fig. 19d). This updates the program line and closes the Commands dialog.
Once finished, Close the dialog.
Click “Save” on the “Method / Program” tab to save the changes you made to the LC part of the Method, Fig. 18d.
c. Enter the desired value
d. Click “OK”
b. The Help area provides hints about the
selected property
a. The “Commands” dialog opens with the selected command highlighted
Fig. 19: Using the Commands dialog
Tip: To add a new line, position the cursor at the end of the previous line and press Enter.
Tip: The Commands view offers usual text editing possibilities (e.g. Copy and Paste) that are accessible from the context menu (Right-click).

DCMSLink 2.10 for Analyst Quick Start Guide
24
Editing parameters for a certain module in Device views
Compared to the Commands view (Fig. 18), Device views (Fig. 20) provides a different user interface: Instead of a chronological list of commands, only the parameters for the selected device are displayed as dialogs/tables on various tab pages. Device views are similar to the Wizard pages that were used for creating the Method, Fig. 16.
Use the device buttons on the left side of the “Method / Program” tab to select a device, such as the pump or the detector, Fig. 20a.
The view changes from Commands view to Device view, Fig. 20b.
Make the necessary changes, Fig. 20c.
Click “Save” to save the changes you made to the LC part of the Method, Fig. 20d.
Important: Changing the timing for one device will NOT automatically change the timing for other devices. For example shortening the gradient will not automatically shorten the acquisition times.
b. The view changes to “Device view”: In this
only the parameters for the selected device are displayed, as they were
shown in the Wizard when the Method was
generated.
d.
a. Choose one of the Device Buttons
c. Edit the parameters as needed
Fig. 20: Editing parameters for a certain module (the Pump in this example) in “Device views”
DCMSLink 2.10 for Analyst Quick Start Guide
25
Replacing the entire Program using the Wizard
Occasionally (e.g. if the instrument configuration has been changed considerably) it can be necessary to replace the currently stored LC part of the Method with a completely new one. It is possible then to use the Wizard for this.
Click on the “Wizard…” button on the “Method / Program” tab.
A dialog warns you that the currently open Method will be overwritten. Acknowledge this by clicking “Yes”.
The DCMSLink Program Wizard will open and guide you through the Method generation, as it did during generation of the Method (3.3.1).
Click “Save” to replace the LC part of the Method with the new one you have just generated.
Importing a Program from Chromeleon
This option is useful if Chromeleon has been previously used for controlling the LC front end and there are Programs available that you want to use now with DCMSLink. Note, that you must adjust the imported Programs before you can use them in DCMSLink. (Synchronization commands must be added – this can be triggered by switching to Device views and changing any parameter after the import). For more information, refer to the “DCMSLink for Analyst - Migration of Methods” document.
Exporting a Program to Chromeleon
This option is useful if DCMSLink has been previously used for controlling the LC front end and there are Programs available that you want to use now with Chromeleon. Note, that you must adjust the exported programs (the synchronization commands have to be removed) before you can use them in Chromeleon. For more information, refer to the “DCMSLink for Analyst - Migration of Methods” document.
Checking the Program Once you have finished editing the LC part of the Method you should check it for syntax and semantic (logical) errors.
Click on the “Check” button on the “Method / Program” tab.
DCMSLink checks the Program for possible problems and reports them, including short explanations, in the “Check Results” dialog. They are categorized as Errors and Warnings according to their severity:
- Errors must be fixed, before the Method can be used. - Warnings can be acknowledged without fixing the cause.
Important: There are error conditions which cannot be detected at this early stage, only later, when the acquisition is about to start.
DCMSLink 2.10 for Analyst Quick Start Guide
26
Tip: The Troubleshooting Guide provides hints about the most common error messages and problems.
Tip: You can copy the content of the “Check Results” window by using the context menu or by using standard Windows keyboard shortcuts, i.e. Ctrl + A (Select All), Ctrl + C (Copy). This can be useful for correcting the issues or when asking for support.
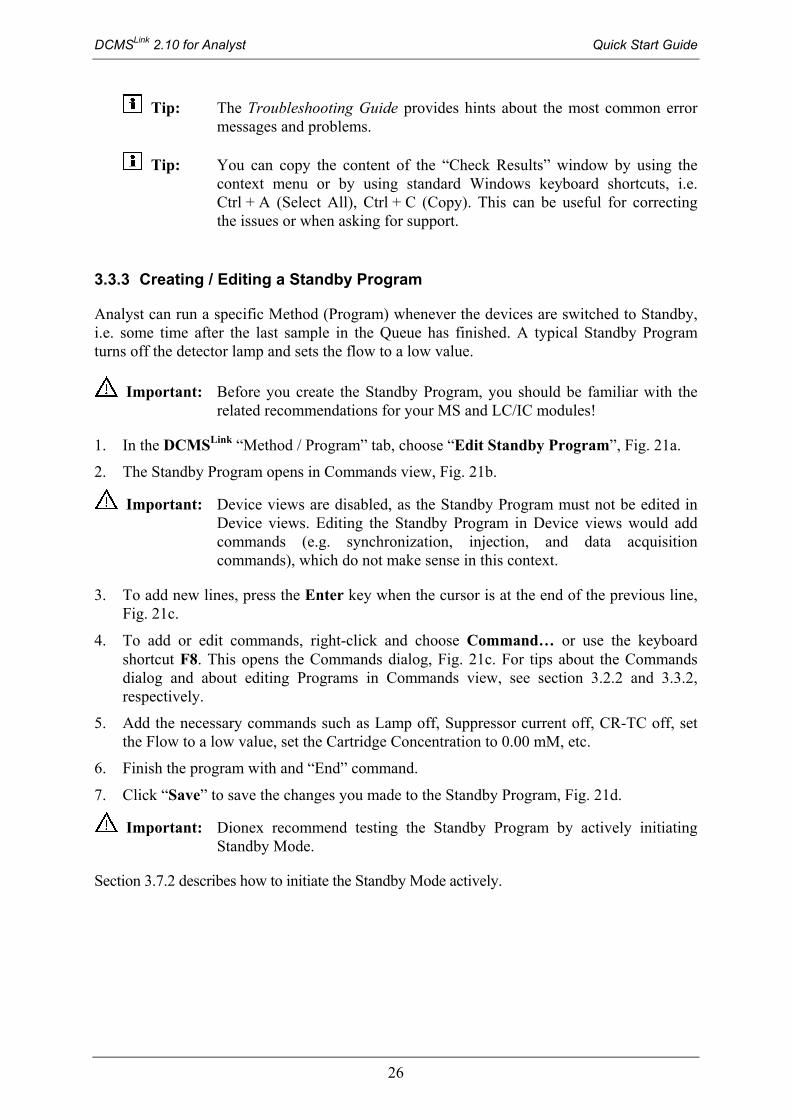
3.3.3 Creating / Editing a Standby Program
Analyst can run a specific Method (Program) whenever the devices are switched to Standby, i.e. some time after the last sample in the Queue has finished. A typical Standby Program turns off the detector lamp and sets the flow to a low value.
Important: Before you create the Standby Program, you should be familiar with the related recommendations for your MS and LC/IC modules!
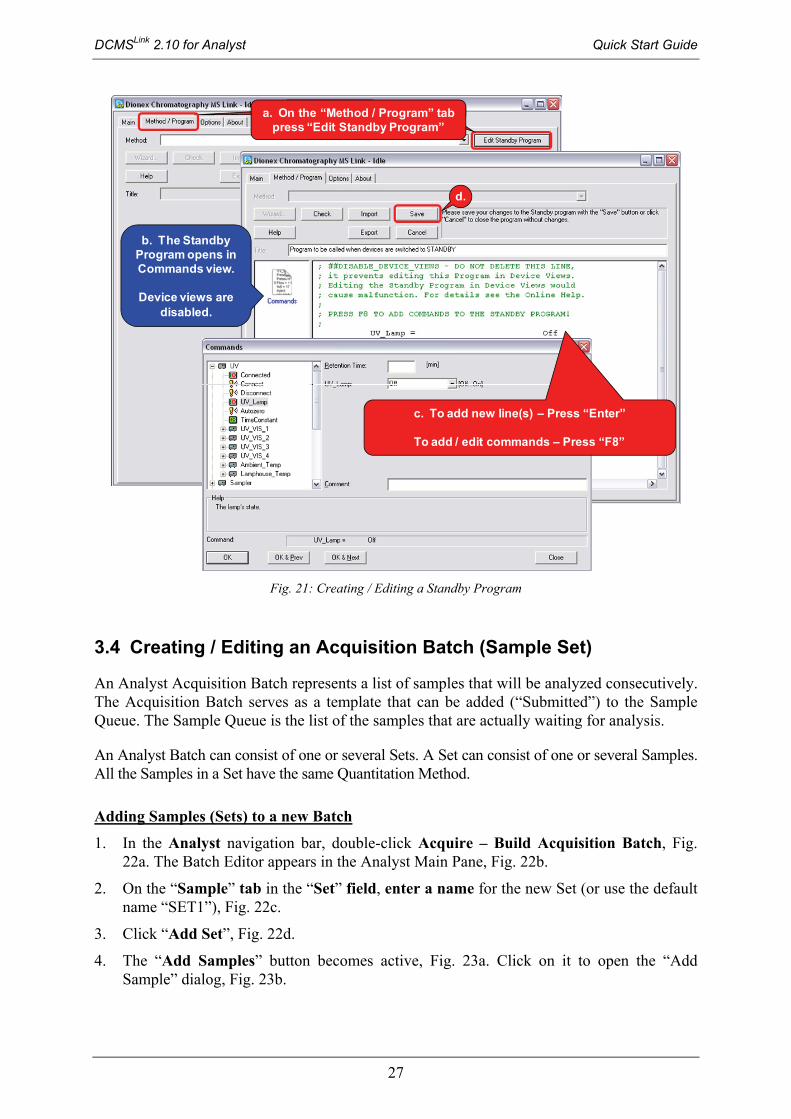
1. In the DCMSLink “Method / Program” tab, choose “Edit Standby Program”, Fig. 21a.
2. The Standby Program opens in Commands view, Fig. 21b.
Important: Device views are disabled, as the Standby Program must not be edited in Device views. Editing the Standby Program in Device views would add commands (e.g. synchronization, injection, and data acquisition commands), which do not make sense in this context.
3. To add new lines, press the Enter key when the cursor is at the end of the previous line, Fig. 21c.
4. To add or edit commands, right-click and choose Command… or use the keyboard shortcut F8. This opens the Commands dialog, Fig. 21c. For tips about the Commands dialog and about editing Programs in Commands view, see section 3.2.2 and 3.3.2, respectively.
5. Add the necessary commands such as Lamp off, Suppressor current off, CR-TC off, set the Flow to a low value, set the Cartridge Concentration to 0.00 mM, etc.
6. Finish the program with and “End” command.
7. Click “Save” to save the changes you made to the Standby Program, Fig. 21d.
Important: Dionex recommend testing the Standby Program by actively initiating Standby Mode.
Section 3.7.2 describes how to initiate the Standby Mode actively.
DCMSLink 2.10 for Analyst Quick Start Guide
27
b. The Standby Program opens in Commands view.
Device views are disabled.
c. To add new line(s) – Press “Enter”
To add / edit commands – Press “F8”
a. On the “Method / Program” tab press “Edit Standby Program”
d.
Fig. 21: Creating / Editing a Standby Program
3.4 Creating / Editing an Acquisition Batch (Sample Set)
An Analyst Acquisition Batch represents a list of samples that will be analyzed consecutively. The Acquisition Batch serves as a template that can be added (“Submitted”) to the Sample Queue. The Sample Queue is the list of the samples that are actually waiting for analysis.
An Analyst Batch can consist of one or several Sets. A Set can consist of one or several Samples. All the Samples in a Set have the same Quantitation Method.
Adding Samples (Sets) to a new Batch
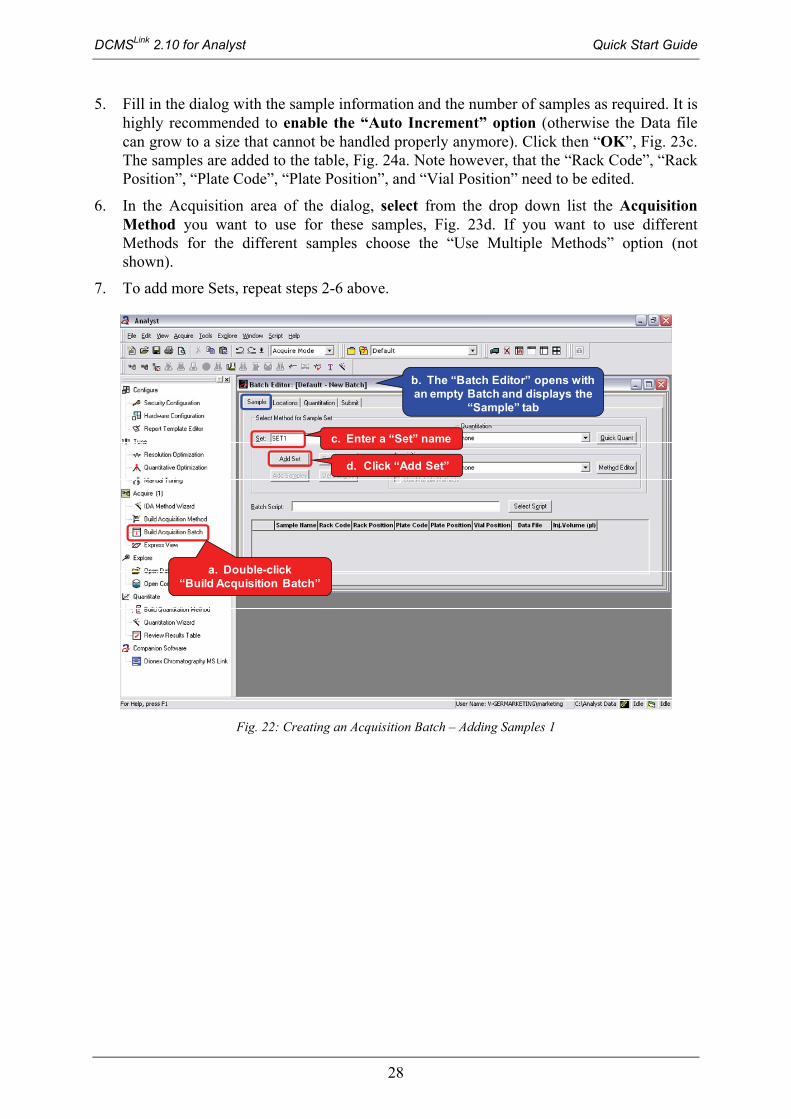
1. In the Analyst navigation bar, double-click Acquire – Build Acquisition Batch, Fig. 22a. The Batch Editor appears in the Analyst Main Pane, Fig. 22b.
2. On the “Sample” tab in the “Set” field, enter a name for the new Set (or use the default name “SET1”), Fig. 22c.
3. Click “Add Set”, Fig. 22d.
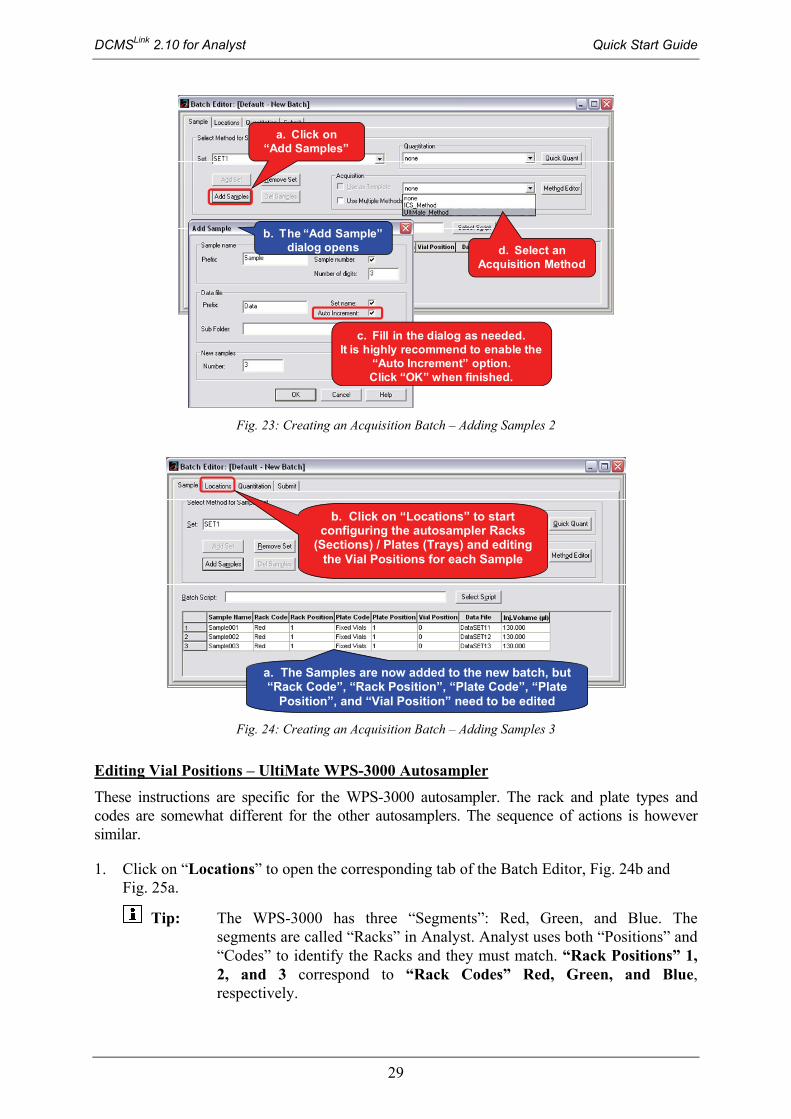
4. The “Add Samples” button becomes active, Fig. 23a. Click on it to open the “Add Sample” dialog, Fig. 23b.
DCMSLink 2.10 for Analyst Quick Start Guide
28
5. Fill in the dialog with the sample information and the number of samples as required. It is highly recommended to enable the “Auto Increment” option (otherwise the Data file can grow to a size that cannot be handled properly anymore). Click then “OK”, Fig. 23c. The samples are added to the table, Fig. 24a. Note however, that the “Rack Code”, “Rack Position”, “Plate Code”, “Plate Position”, and “Vial Position” need to be edited.
6. In the Acquisition area of the dialog, select from the drop down list the Acquisition Method you want to use for these samples, Fig. 23d. If you want to use different Methods for the different samples choose the “Use Multiple Methods” option (not shown).
7. To add more Sets, repeat steps 2-6 above.
a. Double-click “Build Acquisition Batch”
b. The “Batch Editor” opens with an empty Batch and displays the
“Sample” tab
d. Click “Add Set”
c. Enter a “Set” name
Fig. 22: Creating an Acquisition Batch – Adding Samples 1
DCMSLink 2.10 for Analyst Quick Start Guide
29
d. Select an Acquisition Method
a. Click on “Add Samples”
b. The “Add Sample” dialog opens
c. Fill in the dialog as needed. It is highly recommend to enable the
“Auto Increment” option. Click “OK” when finished.
Fig. 23: Creating an Acquisition Batch – Adding Samples 2
a. The Samples are now added to the new batch, but “Rack Code”, “Rack Position”, “Plate Code”, “Plate
Position”, and “Vial Position” need to be edited
b. Click on “Locations” to start configuring the autosampler Racks
(Sections) / Plates (Trays) and editing the Vial Positions for each Sample
Fig. 24: Creating an Acquisition Batch – Adding Samples 3
Editing Vial Positions – UltiMate WPS-3000 Autosampler
These instructions are specific for the WPS-3000 autosampler. The rack and plate types and codes are somewhat different for the other autosamplers. The sequence of actions is however similar.
1. Click on “Locations” to open the corresponding tab of the Batch Editor, Fig. 24b and Fig. 25a.
Tip: The WPS-3000 has three “Segments”: Red, Green, and Blue. The segments are called “Racks” in Analyst. Analyst uses both “Positions” and “Codes” to identify the Racks and they must match. “Rack Positions” 1, 2, and 3 correspond to “Rack Codes” Red, Green, and Blue, respectively.

DCMSLink 2.10 for Analyst Quick Start Guide
30
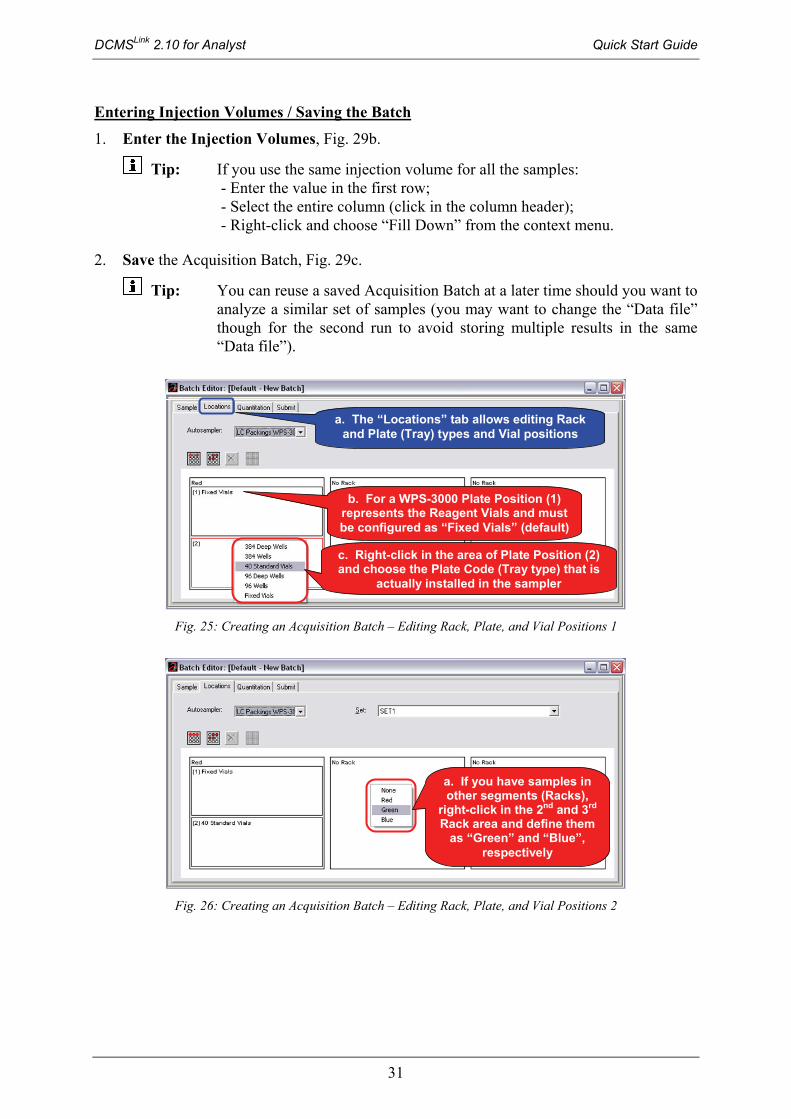
Each segment of the WPS-3000 has two areas: one for a couple of “Wash Vials” and one for an exchangeable sample tray. These areas are called “Plates” in Analyst. Analyst uses both “Positions” and “Codes” to identify the Plates and they must match: - “Plate Position 1” corresponds to the “Reagent Vials”. This area must be configured with “Plate Code” = “Fixed Vials”. - “Plate Position 2” corresponds to the exchangeable sample tray. The “Plate Code” selected for this must match the sample tray that is physically placed in the instrument. This in turn must agree with what is configured in the “Server Configuration”. The procedure below ensures that matching values will be entered into the Acquisition Batch.
Tip: For the ASI-100 sampler Plate Position 1 and 2 has the opposite role, i.e. Plate Position 1 represents the exchangeable sample tray.
2. For “Plate 1” keep the default setting (“Fixed Vials”), Fig. 25b.
3. For “Plate 2” right-click in the area and choose the rack type (“Plate Code”) that is actually installed in the sampler, Fig. 25c.
4. If you placed samples in other segments, right-click in the 2nd and 3rd Rack area and define them as “Green” and “Blue”, respectively, Fig. 26a. Repeat the two steps above to choose rack type (“Plate Code”).
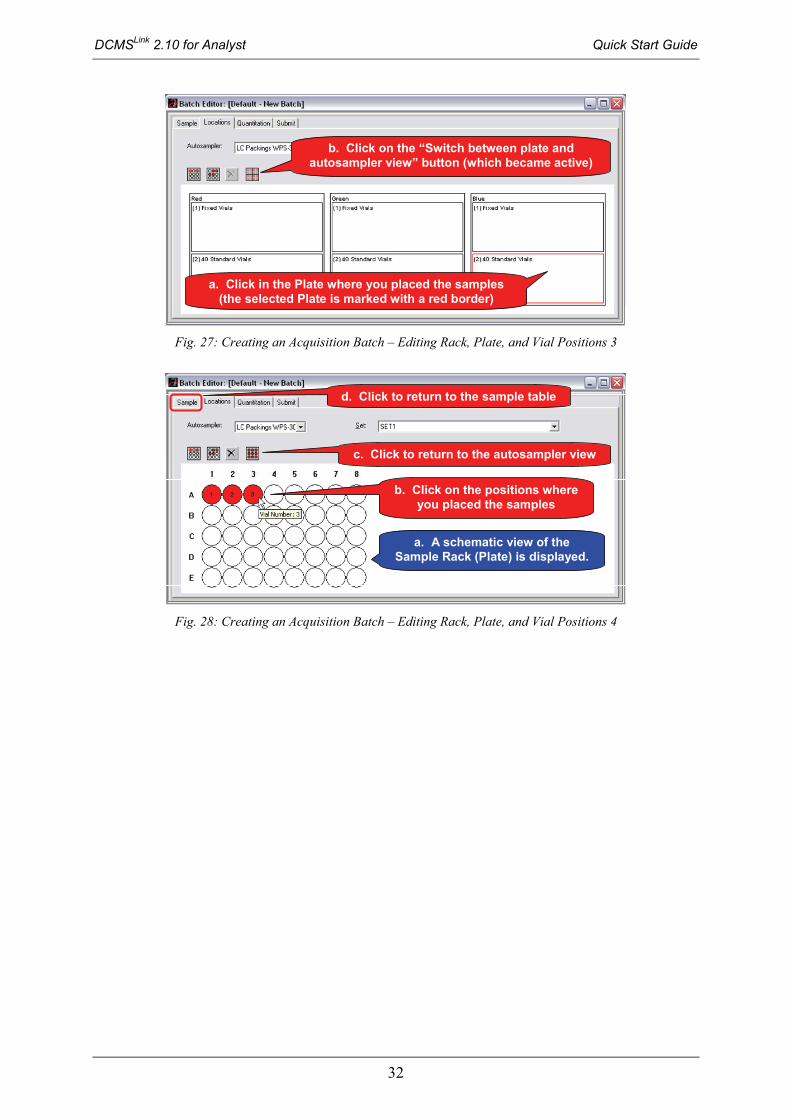
5. Click in the Plate where you placed the samples, Fig. 27a. The selected Plate becomes marked with a red border.
6. Click on the “Switch between plate and autosampler view” button, Fig. 27b. A schematic view of the vials is displayed, Fig. 28a.
7. Click on the vial positions in the order as they are physically placed in the autosampler, Fig. 28b.
Tip: - Another click on an already selected vial removes the selection. - To indicate multiple injections from the same vial Ctrl+Click.
8. If you placed samples in several Plates, click on the “Switch between plate and autosampler view” button to return to the Plate view, Fig. 28c. Repeat the three steps above for the other Plates.
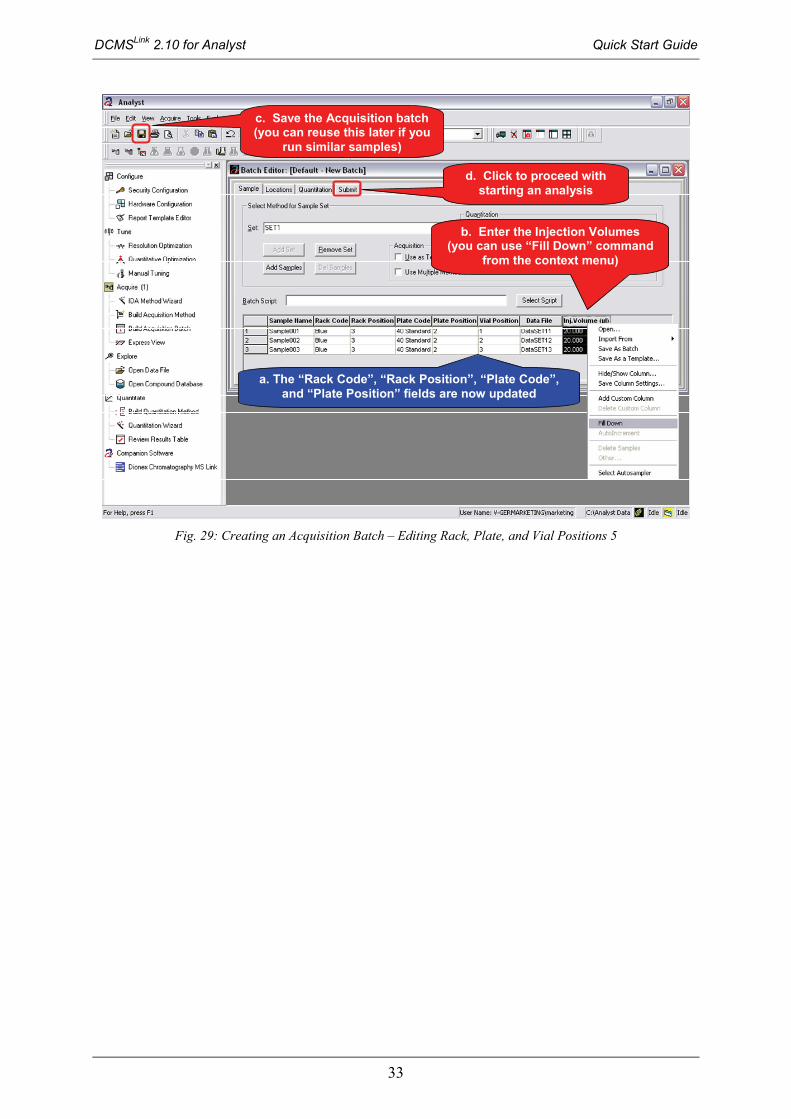
9. Once finished, activate the “Sample” tab, Fig. 28d. “Rack Code”, “Rack Position”, “Plate Code”, and “Plate Position” are now filled in based on the previous steps, Fig. 29a.
Note: The WPS-3000 tray type (plate) can be changed in the Chromeleon Xpress panel without changing the Server Configuration. If the used trays (plates) in Analyst (location tab of the build acquisition tab) and in Chromeleon Xpress (sampler panel) are different but the injection position is available for both trays (plates), the injection continues. If the injection position is not available, the injection is rejected.
DCMSLink 2.10 for Analyst Quick Start Guide
31
Entering Injection Volumes / Saving the Batch
1. Enter the Injection Volumes, Fig. 29b.
Tip: If you use the same injection volume for all the samples: - Enter the value in the first row; - Select the entire column (click in the column header); - Right-click and choose “Fill Down” from the context menu.
2. Save the Acquisition Batch, Fig. 29c.
Tip: You can reuse a saved Acquisition Batch at a later time should you want to analyze a similar set of samples (you may want to change the “Data file” though for the second run to avoid storing multiple results in the same “Data file”).
c. Right-click in the area of Plate Position (2) and choose the Plate Code (Tray type) that is
actually installed in the sampler
a. The “Locations” tab allows editing Rack and Plate (Tray) types and Vial positions
b. For a WPS-3000 Plate Position (1) represents the Reagent Vials and must be configured as “Fixed Vials” (default)
Fig. 25: Creating an Acquisition Batch – Editing Rack, Plate, and Vial Positions 1
a. If you have samples in other segments (Racks),
right-click in the 2nd and 3rd Rack area and define them
as “Green” and “Blue”, respectively
Fig. 26: Creating an Acquisition Batch – Editing Rack, Plate, and Vial Positions 2
DCMSLink 2.10 for Analyst Quick Start Guide
32
b. Click on the “Switch between plate and autosampler view” button (which became active)
a. Click in the Plate where you placed the samples (the selected Plate is marked with a red border)
Fig. 27: Creating an Acquisition Batch – Editing Rack, Plate, and Vial Positions 3
a. A schematic view of the Sample Rack (Plate) is displayed.
b. Click on the positions where you placed the samples
c. Click to return to the autosampler view
d. Click to return to the sample table
Fig. 28: Creating an Acquisition Batch – Editing Rack, Plate, and Vial Positions 4
DCMSLink 2.10 for Analyst Quick Start Guide
33
a. The “Rack Code”, “Rack Position”, “Plate Code”, and “Plate Position” fields are now updated
b. Enter the Injection Volumes (you can use “Fill Down” command
from the context menu)
c. Save the Acquisition batch (you can reuse this later if you
run similar samples)
d. Click to proceed with starting an analysis
Fig. 29: Creating an Acquisition Batch – Editing Rack, Plate, and Vial Positions 5

DCMSLink 2.10 for Analyst Quick Start Guide
34
3.5 Starting an Acquisition (Analysis)
Before an analysis (a data acquisition) can be started, the samples (saved in the Acquisition Batch, see previous section) must first be added (“Submitted”) to the “Sample Queue”. The Queue is the list of the samples that are actually waiting for analysis. The “Queue Manager” is the window where the Queue can be monitored.
Adding the Samples to the Queue
3. Activate the “Submit” tab of the Batch Editor, Fig. 29d.
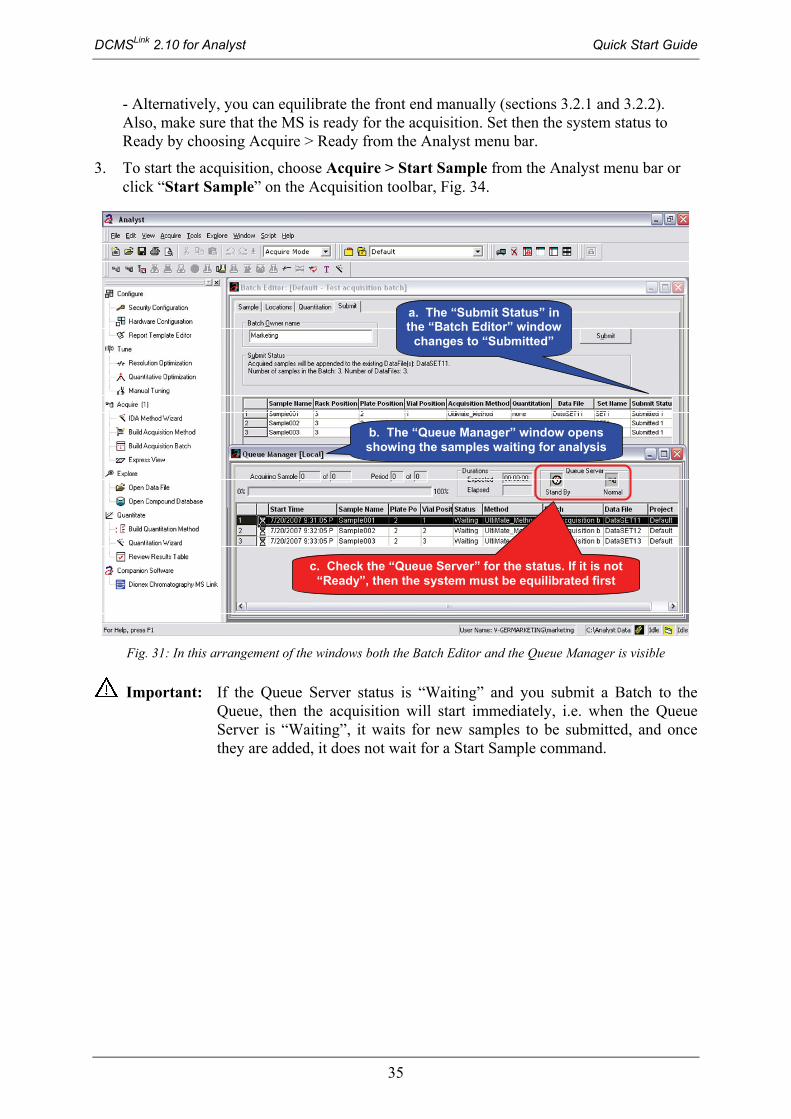
4. Click “Submit” to add the samples to the Sample Queue, Fig. 30a. The “Submit Status” changes to “Submitted”, Fig. 31a
a. Click “Submit” to add the samples listed in the Batch to the Queue
b. Choose “View” > “Sample Queue” to open the “Queue Manager” window
Fig. 30: Submitting samples to the Queue and opening the Queue Manager
Starting Data Acquisition
1. Select View > Sample Queue (Fig. 30b) to open the Queue Manager window (Fig. 31b)
Tip: The windows may open in a maximized fashion, so the Queue Manager may cover the Batch Editor in contrast to Fig. 31, where the windows are arranged in a way that both are visible.
2. Check the “Queue Server” for the system status, Fig. 31. It must be “Ready” (Fig. 14b) before you can start the data acquisition. - If it is not, you should equilibrate the system as described in section 3.2.3 “Automated Equilibration”.
DCMSLink 2.10 for Analyst Quick Start Guide
35
- Alternatively, you can equilibrate the front end manually (sections 3.2.1 and 3.2.2). Also, make sure that the MS is ready for the acquisition. Set then the system status to Ready by choosing Acquire > Ready from the Analyst menu bar.
3. To start the acquisition, choose Acquire > Start Sample from the Analyst menu bar or click “Start Sample” on the Acquisition toolbar, Fig. 34.
b. The “Queue Manager” window opens showing the samples waiting for analysis
a. The “Submit Status” in the “Batch Editor” window
changes to “Submitted”
c. Check the “Queue Server” for the status. If it is not “Ready”, then the system must be equilibrated first
Fig. 31: In this arrangement of the windows both the Batch Editor and the Queue Manager is visible
Important: If the Queue Server status is “Waiting” and you submit a Batch to the Queue, then the acquisition will start immediately, i.e. when the Queue Server is “Waiting”, it waits for new samples to be submitted, and once they are added, it does not wait for a Start Sample command.
DCMSLink 2.10 for Analyst Quick Start Guide
36
3.6 Monitoring the Running Samples
3.6.1 Monitoring Detector Signals and Other Channel Data
There are two options for viewing detector signals (and other channel data, like temperature and pressure signals) from the running samples:
Via DCMSLink Panels – this is the recommended way, if the focus is on the front-end signals and system parameters. To open the Panels, click on the “Panels” button on the DCMSLink Main tab, or double-click on the “Chromeleon” desktop shortcut icon. For more information about using the Panels, see section 3.2.1.
Via Analyst – use this method if viewing the MS signal is (also) important. For more information, see section 3.8.
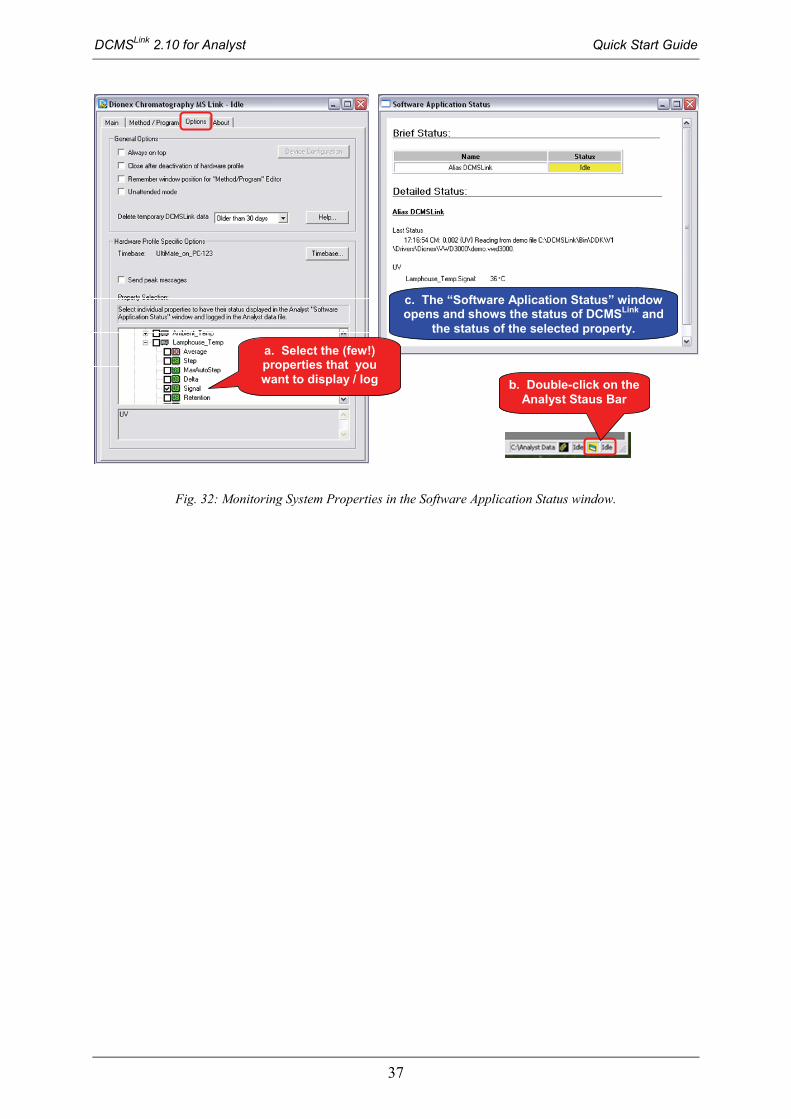
3.6.2 Monitoring Other System Properties – Using the Software Application Status Window
Most properties of the front-end system can be easily monitored via Panels (or sub-panels). In addition, there is an alternative method for monitoring selected system properties in the Analyst “Software Application Status” window. This can be useful if:
The properties have to be recorded (they are logged with 1 sec interval to the Analyst Data file).
A couple of advanced properties from different modules have to be monitored. (It would not be possible to monitor all of them at the same time using Panels, as they are show on different (sub)-panels.)
The Panels are not available (older instruments and rare combination of modules may not be (fully) supported by Panels).
Monitoring System Properties in the Software Application Status window
1. On the DCMSLink Options tab select the properties that you want to monitor / record, Fig. 32a.
Important: Do not select more than a few properties, as this can lead to problems when opening the Analyst Data file.
2. Double click on the Analyst Status Bar (in the low-right corner of the Analyst window), Fig. 32b.
3. The Analyst “Software Application Status” window opens and shows general status information about DCMSLink and the status of the selected properties, Fig. 32c.
DCMSLink 2.10 for Analyst Quick Start Guide
37
b. Double-click on the Analyst Staus Bar
a. Select the (few!) properties that you want to display / log
c. The “Software Aplication Status” window opens and shows the status of DCMSLink and
the status of the selected property.
Fig. 32: Monitoring System Properties in the Software Application Status window.
DCMSLink 2.10 for Analyst Quick Start Guide
38
3.7 Stop / Standby / Shutdown
3.7.1 Stopping a Sample or a Sequence / Queue
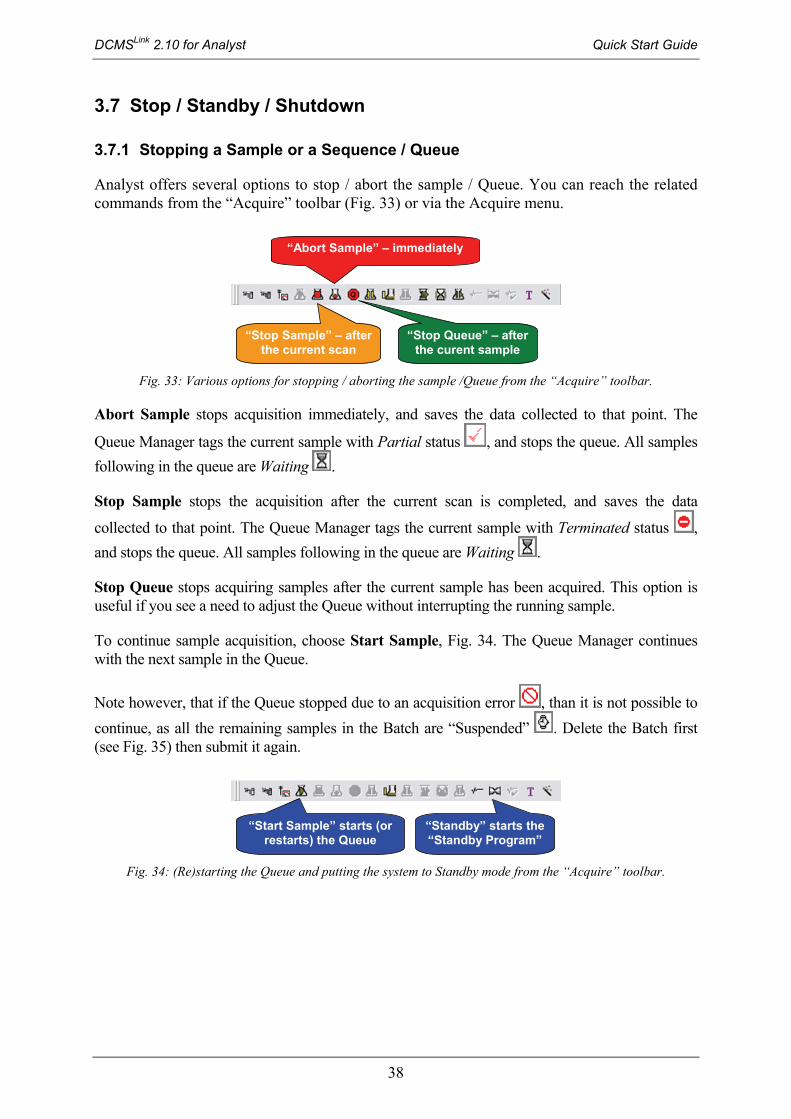
Analyst offers several options to stop / abort the sample / Queue. You can reach the related commands from the “Acquire” toolbar (Fig. 33) or via the Acquire menu.
“Stop Queue” – after the curent sample
“Abort Sample” – immediately
“Stop Sample” – after the current scan
Fig. 33: Various options for stopping / aborting the sample /Queue from the “Acquire” toolbar.
Abort Sample stops acquisition immediately, and saves the data collected to that point. The
Queue Manager tags the current sample with Partial status , and stops the queue. All samples
following in the queue are Waiting .
Stop Sample stops the acquisition after the current scan is completed, and saves the data
collected to that point. The Queue Manager tags the current sample with Terminated status ,
and stops the queue. All samples following in the queue are Waiting .
Stop Queue stops acquiring samples after the current sample has been acquired. This option is useful if you see a need to adjust the Queue without interrupting the running sample.
To continue sample acquisition, choose Start Sample, Fig. 34. The Queue Manager continues with the next sample in the Queue.
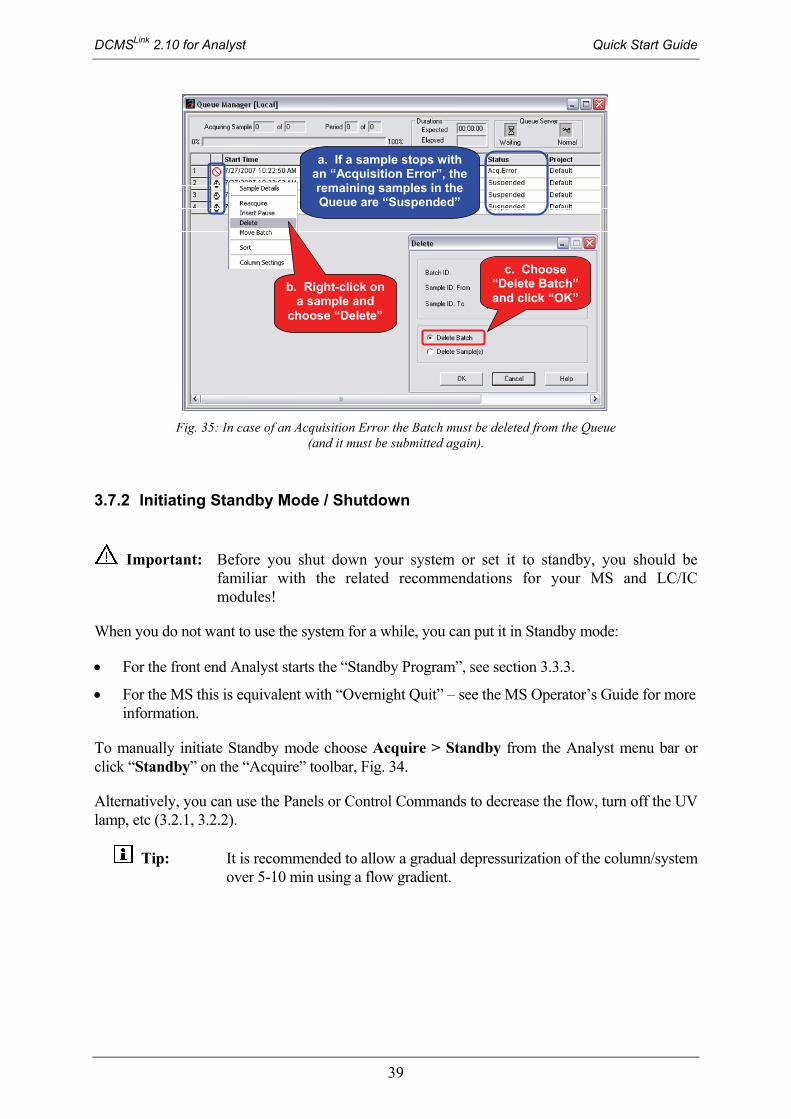
Note however, that if the Queue stopped due to an acquisition error , than it is not possible to
continue, as all the remaining samples in the Batch are “Suspended” . Delete the Batch first (see Fig. 35) then submit it again.
“Start Sample” starts (or
restarts) the Queue “Standby” starts the “Standby Program”
Fig. 34: (Re)starting the Queue and putting the system to Standby mode from the “Acquire” toolbar.
DCMSLink 2.10 for Analyst Quick Start Guide
39
a. If a sample stops with an “Acquisition Error”, the remaining samples in the Queue are “Suspended”
c. Choose “Delete Batch” and click “OK”
b. Right-click on a sample and
choose “Delete”
Fig. 35: In case of an Acquisition Error the Batch must be deleted from the Queue
(and it must be submitted again).
3.7.2 Initiating Standby Mode / Shutdown
Important: Before you shut down your system or set it to standby, you should be familiar with the related recommendations for your MS and LC/IC modules!
When you do not want to use the system for a while, you can put it in Standby mode:
For the front end Analyst starts the “Standby Program”, see section 3.3.3.
For the MS this is equivalent with “Overnight Quit” – see the MS Operator’s Guide for more information.
To manually initiate Standby mode choose Acquire > Standby from the Analyst menu bar or click “Standby” on the “Acquire” toolbar, Fig. 34.
Alternatively, you can use the Panels or Control Commands to decrease the flow, turn off the UV lamp, etc (3.2.1, 3.2.2).
Tip: It is recommended to allow a gradual depressurization of the column/system over 5-10 min using a flow gradient.

DCMSLink 2.10 for Analyst Quick Start Guide
40
3.8 Viewing Chromatography Data
This section describes how to view the 2D and 3D chromatography data that had been sent from DCMSLink to Analyst.
Tip: Data from the currently running sample can be viewed in the same way; however, the Contour Plot can only displayed once the acquisition is finished.
3.8.1 Viewing 2D Channel Data
1. In the Navigation Bar double click on “Open Data File”, Fig. 36a.
2. Choose the WIFF file (and the sample) you want to open and click “OK” (not shown).
3. Once the data file is opened, right-click in the Pane with the MS results (TIC) and select “Show ADC Data…” from the context menu, Fig. 36b.
4. In the “Select ADC Channel” dialog make your selection, Fig. 36c, and click “OK”.
5. The selected Channel is displayed in a new Pane, Fig. 36d.
d. The selected Channel opens in a new Pane
b. Right-click and choose “Show ADC Data…”
a.
c. Select the ADC Channel that you want to view
Fig. 36: Viewing digitally acquired 2D channel data in Analyst
DCMSLink 2.10 for Analyst Quick Start Guide
41
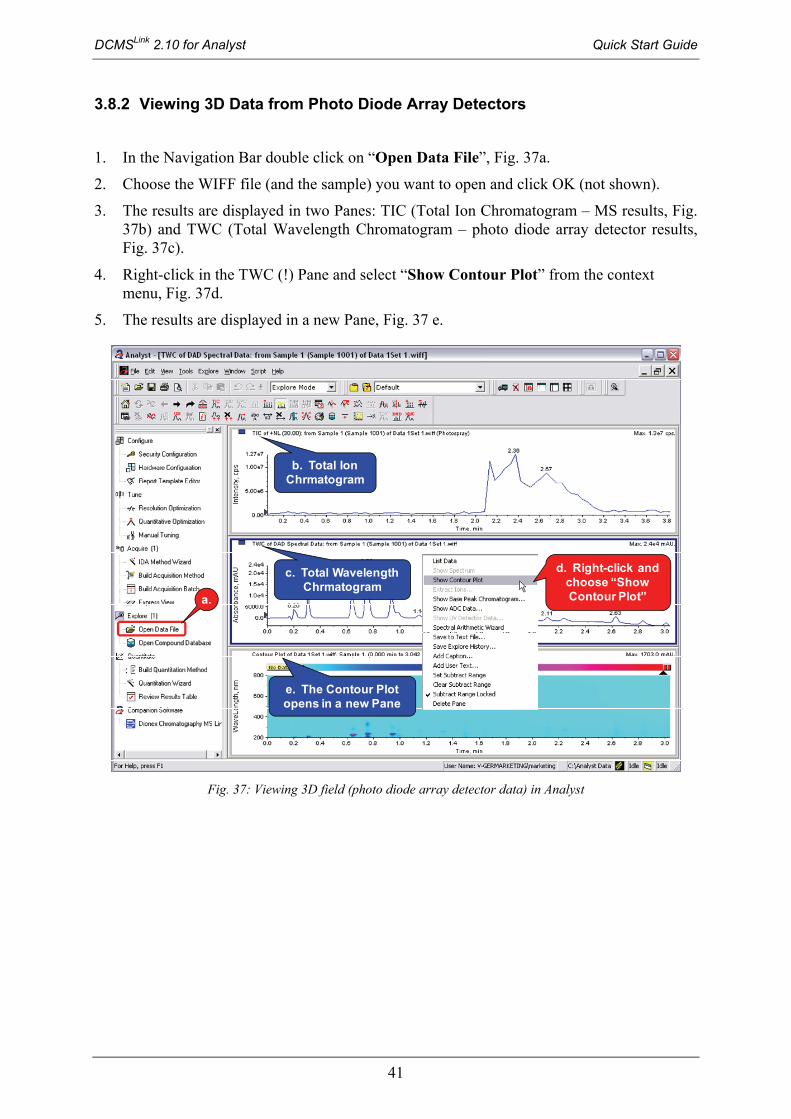
3.8.2 Viewing 3D Data from Photo Diode Array Detectors
1. In the Navigation Bar double click on “Open Data File”, Fig. 37a.
2. Choose the WIFF file (and the sample) you want to open and click OK (not shown).
3. The results are displayed in two Panes: TIC (Total Ion Chromatogram – MS results, Fig. 37b) and TWC (Total Wavelength Chromatogram – photo diode array detector results, Fig. 37c).
4. Right-click in the TWC (!) Pane and select “Show Contour Plot” from the context menu, Fig. 37d.
5. The results are displayed in a new Pane, Fig. 37 e.
e. The Contour Plot opens in a new Pane
d. Right-click and choose “Show Contour Plot”a.
b. Total Ion Chrmatogram
c. Total Wavelength Chrmatogram
Fig. 37: Viewing 3D field (photo diode array detector data) in Analyst
DCMSLink 2.10 for Analyst Quick Start Guide
42
4 Appendix A – Simulated MS
This appendix describes how to set up an Analyst Hardware Profile and how to create an Acquisition Method with a Simulated MS. This is useful for example, when the LC front end must be tested without having a properly configured mass spectrometer available, or when the LC system is operated standalone.
4.1 Creating a new Hardware Profile with Simulated MS
Creating a new Hardware Profile
1. In the Analyst Navigation Bar (under “Configure”), double click “Hardware Configuration”. The “Hardware Configuration Editor” opens.
2. Click “New Profile…”. The “Create New Hardware Profile” dialog opens.
3. Enter a Profile Name (e.g. LC with Simulated MS).
Adding the Simulated MS to the Hardware Profile
1. Click “Add Device…”. The “Available Devices” dialog opens.
2. Choose “Mass Spectrometer” from the drop down list. In Analyst 1.5.x: select “Mass Spectrometer QTrap” from the list of Devices. Click “OK”.
3. In the “Create New Hardware Profile” dialog, make sure that “Mass Spectrometer …” is selected and click “Setup Device…”. The “Mass Spectrometer” dialog opens.
4. On the Configuration tab, enter an Alias (e.g. Simulated MS).
5. On the Communication tab, click “Advanced…”. The “Advanced Settings” dialog opens.
6. Activate Simulation Mode.
7. Leave all other settings as they were by default. Click “OK”, “OK”, “OK”.
Adding DCMSLink to the Hardware Profile
1. In the “Hardware Configuration Editor”, make sure that the new Hardware Profile is selected, then click “Edit Profile…”. The “Edit Hardware Profile” dialog opens.
2. Click “Add Device…”. The “Available Devices” dialog opens.
3. Choose “Software Application” from the drop down list and click “OK”.
4. In the “Edit Hardware Profile” dialog, make sure that “Software Application” is selected and click “Setup Device…”. The “Software Application Settings” dialog opens.
5. Make sure that “Dionex Chromatography MS Link” is selected. Enter an Alias name (e.g. DCMSLink). Do NOT select “Simulate device”.
6. Click “OK”, “OK”.
DCMSLink 2.10 for Analyst Quick Start Guide
43
Activating the Hardware Profile
1. Make sure that the new Hardware Profile is selected, then click “Activate Profile”.
2. If the “Connect to Timebase” dialog appears, choose the Timebase under “My Computer”. Click “OK”.
3. Finally, “Close” the “Hardware Configuration Editor” dialog.
4.2 Creating a new Acquisition Method with Simulated MS
Creating the MS part of the Method
1. In the Analyst Navigation Bar under “Acquire”, double click on the “IDA Method Wizard”.
2. On the first page of the wizard under “Type of IDA Experiment”, choose the “Neutral Loss…” option.
3. Click “Next” on this and all the following Wizard pages. Click “Finish” at the end.
4. The Acquisition Method editor appears in the Analyst Main Pane.
5. In the middle area, select “Acquisition Method”. In the right area, for the “Synchronization Mode” select “LC Sync”.
6. In the middle area right click on “IDA Criteria” and choose “Delete this IDA Criteria”. Then right click on “+EPI” and choose “Delete this experiment”.
7. In the middle area, select “Mass Spec”. In the right area, for the “Duration” enter the run time of your choice.
8. Chose File > Save, enter a file name for the new Acquisition Method (e.g. Method with Simulated MS) and click “Save”.
Creating the LC part of the Method
1. A dialog appears: The new method "…" does not include a Chromeleon program. Do you want to build the program now? You must close the method in Analyst before you continue, otherwise your changes will be overwritten by Analyst. Answer “Yes”.
2. The DCMSLink Program Wizard appears
3. Close the Method in Analyst and switch back to the DCMSLink Program Wizard.
4. Go through the Wizard pages to generate the LC part of the Acquisition Method. At the end, click “Finish”.
5. The LC part of the Method appears in the DCMSLink Method / Program tab Click “Save” and confirm with “Yes” to save the changes.