dcms sectors economic estimates · department for culture, ... dcms aims to continuously improve...
TRANSCRIPT

DCMS Sectors Economic Estimates
August 2016
Department for Culture, Media and Sport Economic estimates of DCMS Sectors
2
Contents
Chapter 1 – Introduction ...................................................................................................... 3
Chapter 2 – Key Findings .................................................................................................... 5
Chapter 3 – GVA ................................................................................................................. 7
Chapter 4 – Exports and Imports of Services .................................................................... 10
Chapter 5 – Enterprises ..................................................................................................... 16
Chapter 6 – Summary and Next Steps .............................................................................. 19
Annex A – Tourism Satellite Account 2014 ...................................................................... 21
Annex B – Background Note ........................................................................................... 26

Department for Culture, Media and Sport Economic estimates of DCMS Sectors
3
Chapter 1 – Introduction
Released: 4 August 2016 Geographic Coverage: United Kingdom
Background
This release provides an estimate of the contribution of DCMS sectors to the UK economy, measured by gross value added (GVA) (2010 - 2015), exports of services (2010 - 2014), imports of services (2013 - 2014) and number of enterprises (2008 - 2014). The DCMS sectors cover:
Creative Industries
Cultural Sector
Digital Sector
Gambling
Sport
Telecoms
Tourism
A definition for each sector is available in the associated methodology note, along with details of methods and data limitations. There is significant overlap between DCMS sectors so users should be aware that the estimate for “all DCMS sectors” is lower than the sum of the individual sectors. This release supersedes the publication in September 2015 where an estimate for DCMS sectors was produced. It is the first time it has been possible to look at the changes over time for all DCMS sectors in a consistent way, and the first official estimates across sectors for the range of additional measures presented in this report. DCMS is grateful to the Office for National Statistics for all their support with this work.
Limitations
The estimates set out in this report differ from those previously published by DCMS for a number of sector. Office for Civil Society – Responsibility for the Office for Civil Society was transferred from Cabinet Office to DMCS on 21 July 2016. The Office for Civil Society leads cross-government work in support of the voluntary, community and social enterprise sector (VCSE). The estimates included in this report do not currently attempt to measure the value of this sector (though some elements will be included through the sectors which are covered e.g. Sport and Culture). Creative Industries – Estimates in this report are experimental, but it is intended this approach will replace the previous methodology, subject to user feedback. There is no difference between the two sources for data on exports and number of enterprises. Sport - For the purposes of this publication the statistical definition of sport has been used, this incorporates only those 4-digit SIC codes which are predominately sport (see methodology note Table 2.1). DCMS also publishes estimates of sport based on the EU
Department for Culture, Media and Sport Economic estimates of DCMS Sectors
4
agreed Vilnius definition. The Vilnius definition is a more comprehensive measure of sport which considers the contribution of sport across of range of industries, for example sport advertising, and sport related construction. The DCMS Sport Satellite Account, based on the EU agreed methodology, should continue to be used as the best headline measure of sport’s contribution to the UK economy. Tourism – Estimates for tourism used in this publication are based on a different methodology to all other sectors, as they are taken from the Tourism Satellite Account. This is an internationally recommended methodology for measurement of the contribution of tourism to the economy. 2015 GVA - For 2015, the GVA data is taken from the output measure of GVA to allow consistency with the sector measures. This is aligned to average GVA up to and including 2014 (last Supply Use balanced year) but then uses growth in the output measure as a proxy for GVA beyond that. The 2015 figure therefore differs from National Account GVA at current basic prices (series named ABML).
Estimates have been constructed from ONS Official Statistics which use international classifications, this is an important element of the methodology due to availability of data and to enable international comparability. However, as a result there are substantial limitations to the underlying classifications. As the balance and make-up of the economy changes the international classifications are less able to provide the detail for important elements of the UK economy related to DCMS sectors, and therefore best fit SIC codes have been used to produce these estimates.
More details of limitations are available in the methodology note.
Feedback and consultation
DCMS aims to continuously improve the quality of estimates and better meet user needs. DCMS welcomes feedback on this experimental release and will be publishing a request for user feedback on specific topics, including the definition of Culture, on 9 August. Feedback and responses should be sent to DCMS via email at [email protected] by 14 October 2016.
Department for Culture, Media and Sport Economic estimates of DCMS Sectors
5
Chapter 2 – Key Findings
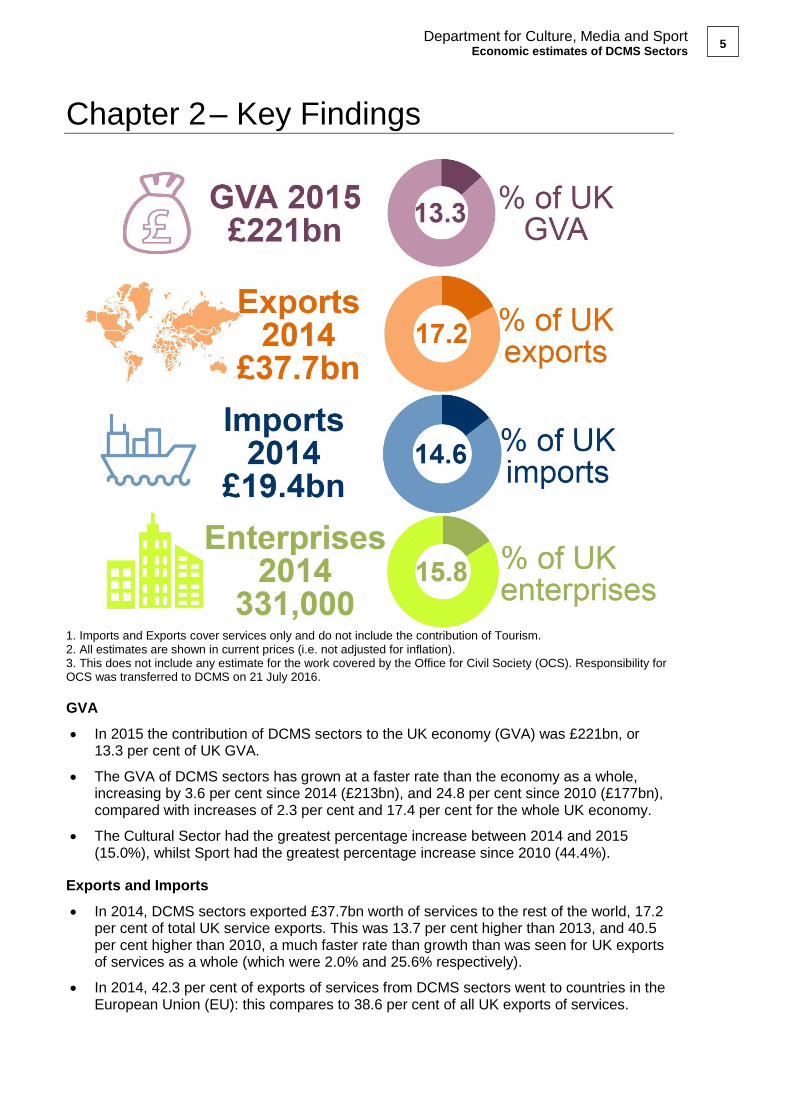
1. Imports and Exports cover services only and do not include the contribution of Tourism. 2. All estimates are shown in current prices (i.e. not adjusted for inflation). 3. This does not include any estimate for the work covered by the Office for Civil Society (OCS). Responsibility for OCS was transferred to DCMS on 21 July 2016.
GVA
In 2015 the contribution of DCMS sectors to the UK economy (GVA) was £221bn, or 13.3 per cent of UK GVA.
The GVA of DCMS sectors has grown at a faster rate than the economy as a whole, increasing by 3.6 per cent since 2014 (£213bn), and 24.8 per cent since 2010 (£177bn), compared with increases of 2.3 per cent and 17.4 per cent for the whole UK economy.
The Cultural Sector had the greatest percentage increase between 2014 and 2015 (15.0%), whilst Sport had the greatest percentage increase since 2010 (44.4%).
Exports and Imports
In 2014, DCMS sectors exported £37.7bn worth of services to the rest of the world, 17.2 per cent of total UK service exports. This was 13.7 per cent higher than 2013, and 40.5 per cent higher than 2010, a much faster rate than growth than was seen for UK exports of services as a whole (which were 2.0% and 25.6% respectively).
In 2014, 42.3 per cent of exports of services from DCMS sectors went to countries in the European Union (EU): this compares to 38.6 per cent of all UK exports of services.

Department for Culture, Media and Sport Economic estimates of DCMS Sectors
6
In 2014, DCMS sectors imported £19.4bn worth of services from the rest of the world, 14.6 per cent of total UK imports of services. This was a 9.0 per cent increase from 2013, compared with a 0.5 per cent decrease for the UK as a whole.
In 2014, 53.7 per cent of imports of services for DCMS sectors came from countries in the European Union (EU), this compares to 47.8 per cent of total UK service imports.
Number of enterprises
In 2014, DCMS sectors accounted for 15.8 per cent of all UK enterprises, approximately 331 thousand enterprises. The number of enterprises in all DCMS sectors has increased by 4.1 per cent between 2013 and 2014, and by 19.5 per cent since 2008.
The Digital Sector had the largest growth in number of enterprises, increasing by 5.7 per cent between 2013 and 2014. A number of sectors had a reduction in the number of enterprises. The Gambling sector had the largest decrease since 2008 (29.1%). Tourism had the largest decrease since 2013 (11.4%)
Figure 2.1: Key economic measures as per cent of UK totals
Department for Culture, Media and Sport Economic estimates of DCMS Sectors
7
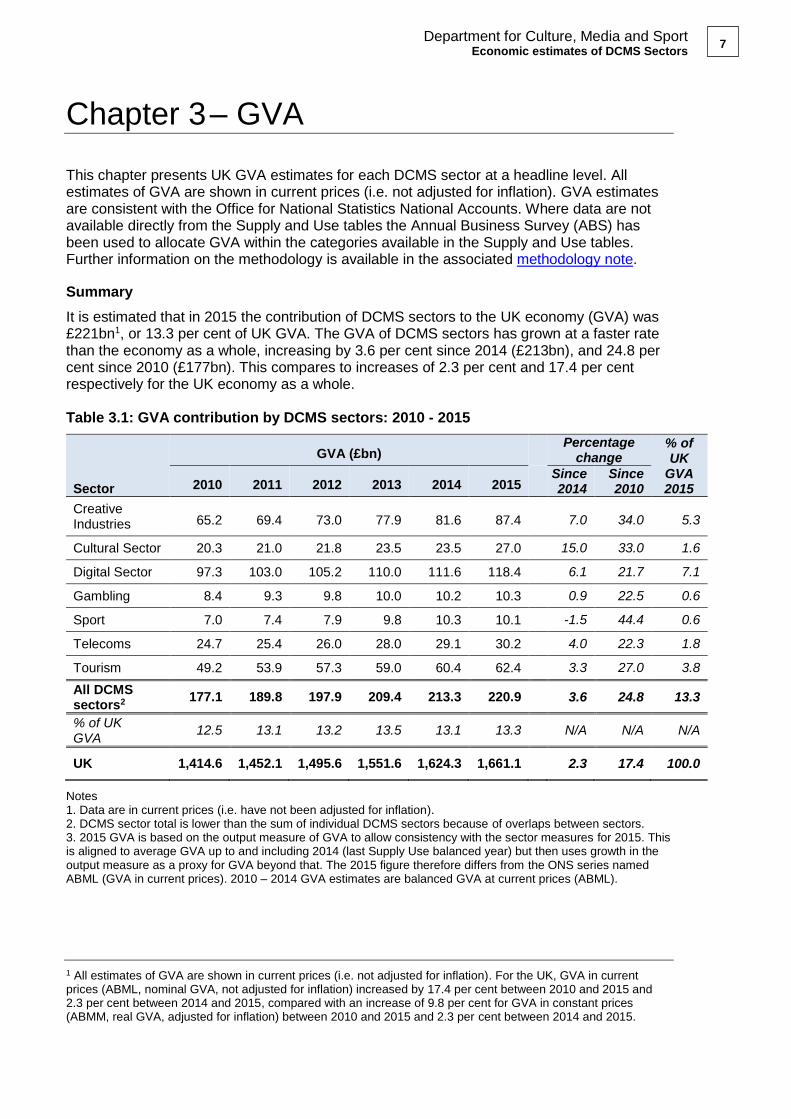
Chapter 3 – GVA
This chapter presents UK GVA estimates for each DCMS sector at a headline level. All estimates of GVA are shown in current prices (i.e. not adjusted for inflation). GVA estimates are consistent with the Office for National Statistics National Accounts. Where data are not available directly from the Supply and Use tables the Annual Business Survey (ABS) has been used to allocate GVA within the categories available in the Supply and Use tables. Further information on the methodology is available in the associated methodology note.
Summary
It is estimated that in 2015 the contribution of DCMS sectors to the UK economy (GVA) was £221bn1, or 13.3 per cent of UK GVA. The GVA of DCMS sectors has grown at a faster rate than the economy as a whole, increasing by 3.6 per cent since 2014 (£213bn), and 24.8 per cent since 2010 (£177bn). This compares to increases of 2.3 per cent and 17.4 per cent respectively for the UK economy as a whole. Table 3.1: GVA contribution by DCMS sectors: 2010 - 2015
Sector
GVA (£bn) Percentage
change % of UK
GVA 2015 2010 2011 2012 2013 2014 2015
Since 2014
Since 2010
Creative Industries 65.2 69.4 73.0 77.9 81.6 87.4
7.0 34.0 5.3
Cultural Sector 20.3 21.0 21.8 23.5 23.5 27.0 15.0 33.0 1.6
Digital Sector 97.3 103.0 105.2 110.0 111.6 118.4 6.1 21.7 7.1
Gambling 8.4 9.3 9.8 10.0 10.2 10.3 0.9 22.5 0.6
Sport 7.0 7.4 7.9 9.8 10.3 10.1 -1.5 44.4 0.6
Telecoms 24.7 25.4 26.0 28.0 29.1 30.2 4.0 22.3 1.8
Tourism 49.2 53.9 57.3 59.0 60.4 62.4 3.3 27.0 3.8
All DCMS sectors2
177.1 189.8 197.9 209.4 213.3 220.9 3.6 24.8 13.3
% of UK GVA
12.5 13.1 13.2 13.5 13.1 13.3 N/A N/A N/A
UK 1,414.6 1,452.1 1,495.6 1,551.6 1,624.3 1,661.1 2.3 17.4 100.0
Notes 1. Data are in current prices (i.e. have not been adjusted for inflation). 2. DCMS sector total is lower than the sum of individual DCMS sectors because of overlaps between sectors. 3. 2015 GVA is based on the output measure of GVA to allow consistency with the sector measures for 2015. This is aligned to average GVA up to and including 2014 (last Supply Use balanced year) but then uses growth in the output measure as a proxy for GVA beyond that. The 2015 figure therefore differs from the ONS series named ABML (GVA in current prices). 2010 – 2014 GVA estimates are balanced GVA at current prices (ABML).
1 All estimates of GVA are shown in current prices (i.e. not adjusted for inflation). For the UK, GVA in current prices (ABML, nominal GVA, not adjusted for inflation) increased by 17.4 per cent between 2010 and 2015 and 2.3 per cent between 2014 and 2015, compared with an increase of 9.8 per cent for GVA in constant prices (ABMM, real GVA, adjusted for inflation) between 2010 and 2015 and 2.3 per cent between 2014 and 2015.

Department for Culture, Media and Sport Economic estimates of DCMS Sectors
8
Figure 3.1: GVA contribution by DCMS sectors: 2010 – 2015
The Cultural Sector had the greatest percentage increase between 2014 and 2015 (15.0%), whilst Sport had the greatest percentage increase since 2010 (44.4%), despite a small decrease between 2014 and 2015 (of 1.5%). Creative Industries had the second greatest increase over the past five years (34.0%). Figures 3.2 and 3.3 show the growth rate for DCMS sectors as a whole and for each DCMS sector.
Figure 3.2: Indexed growth in GVA (2010 =100) in DCMS sectors and UK: 2010-2015
Department for Culture, Media and Sport Economic estimates of DCMS Sectors
9
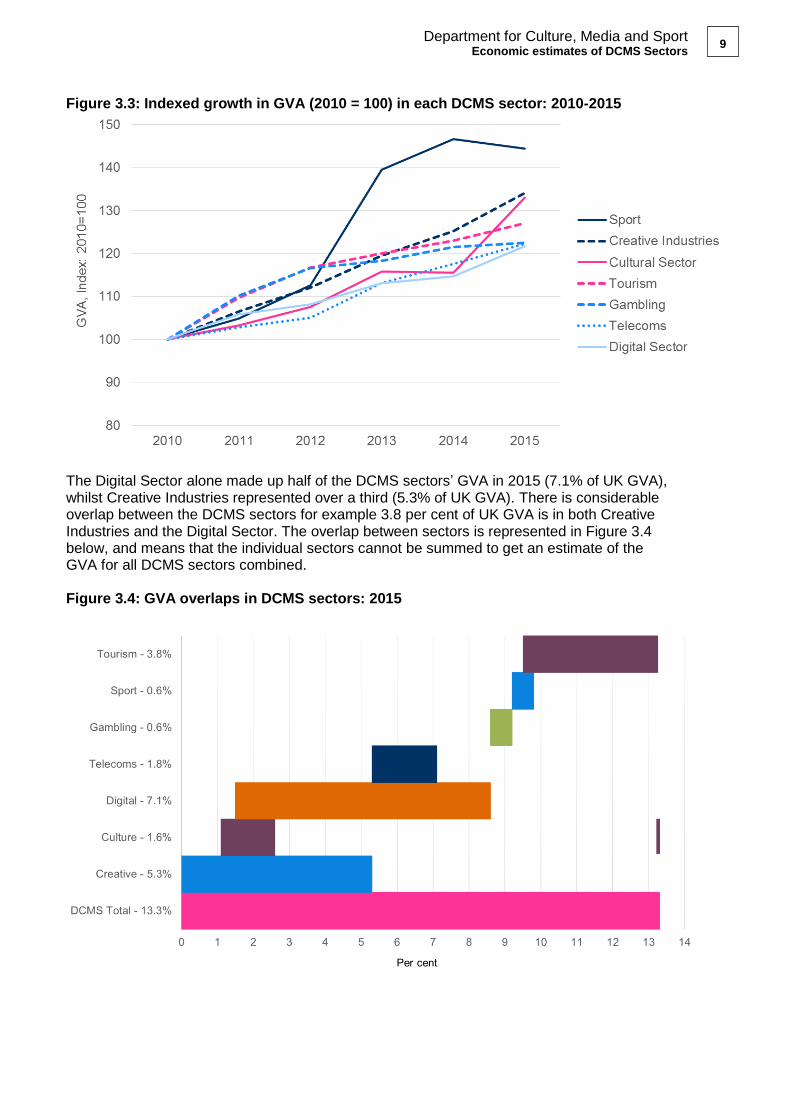
Figure 3.3: Indexed growth in GVA (2010 = 100) in each DCMS sector: 2010-2015
The Digital Sector alone made up half of the DCMS sectors’ GVA in 2015 (7.1% of UK GVA), whilst Creative Industries represented over a third (5.3% of UK GVA). There is considerable overlap between the DCMS sectors for example 3.8 per cent of UK GVA is in both Creative Industries and the Digital Sector. The overlap between sectors is represented in Figure 3.4 below, and means that the individual sectors cannot be summed to get an estimate of the GVA for all DCMS sectors combined. Figure 3.4: GVA overlaps in DCMS sectors: 2015

Department for Culture, Media and Sport Economic estimates of DCMS Sectors
10
Chapter 4 – Exports and Imports of Services
This section provides estimates of exports and imports of services from and to DCMS sectors. Estimates are given in current prices (i.e. not adjusted for inflation) and are based on data from the International Trade in Services survey, except estimates for Tourism, which are based on the International Passenger Survey. Further information on methodology is available in the methodology note. Latest data available for exports and imports are for 2014. 4.1 Exports In 2014, DCMS sectors exported £37.7bn worth of services to the rest of the world: 17.2 per cent of total UK service exports. This was a 13.7 per cent increase from 2013, and a 40.5 per cent increase since 2010. Growth in service exports for DCMS sectors has been greater than in service exports by all UK industries: the value of services exported by all UK industries increased by 2.0 per cent between 2013 and 2014, and by 25.6 per cent compared to 2010. Table 4.1: Exports of services by DCMS sectors: 2010 to 2014
DCMS sectors
Exports of services (£bn) Percentage of UK total
Percentage change
2010 2011 2012 2013 2014 2014 Since 2013
Since 2010
Creative Industries 14.7 15.5 17.3 17.9 19.8 9.1 10.9 34.6
Cultural Sector 5.1 4.6 4.9 4.8 5.4 2.5 13.6 6.8
Digital Sector 23.0 23.6 26.1 27.6 31.8 14.5 15.2 38.1
Gambling 0.2 0.2 0.1 0.3 0.2 0.1 -50.9 -11.9
Sport 0.9 1.3 1.1 1.4 1.8 0.8 27.6 90.9
Telecoms 4.6 4.6 5.2 6.3 6.8 3.1 8.4 46.9
DCMS sector total2 26.8 27.9 30.7 33.1 37.7 17.2 13.7 40.5
UK total (ONS Balance of Payments, Pink Book)
174.1 188.8 197.5 214.5 218.8 NA 2.0 25.6
DCMS sectors as a percentage of UK total
15.4% 14.8% 15.5% 15.4% 17.2% NA NA NA
Notes 1. Data are in current prices (i.e. have not been adjusted for inflation). 2. DCMS sector total is lower than the sum of individual DCMS sectors because of overlaps between sectors. 3. DCMS sector total does not included tourism as it is not possible to split services and goods. In 2014, the UK Tourism sector exported £21.8bn worth of goods and services to the rest of the world. This accounted for 4.3 per cent of total UK exports of goods and services (see section 4.1.3).
Department for Culture, Media and Sport Economic estimates of DCMS Sectors
11
Figure 4.1: Index of value of exports of services, 2010 - 2014, DCMS sectors and UK (2010 = 100)
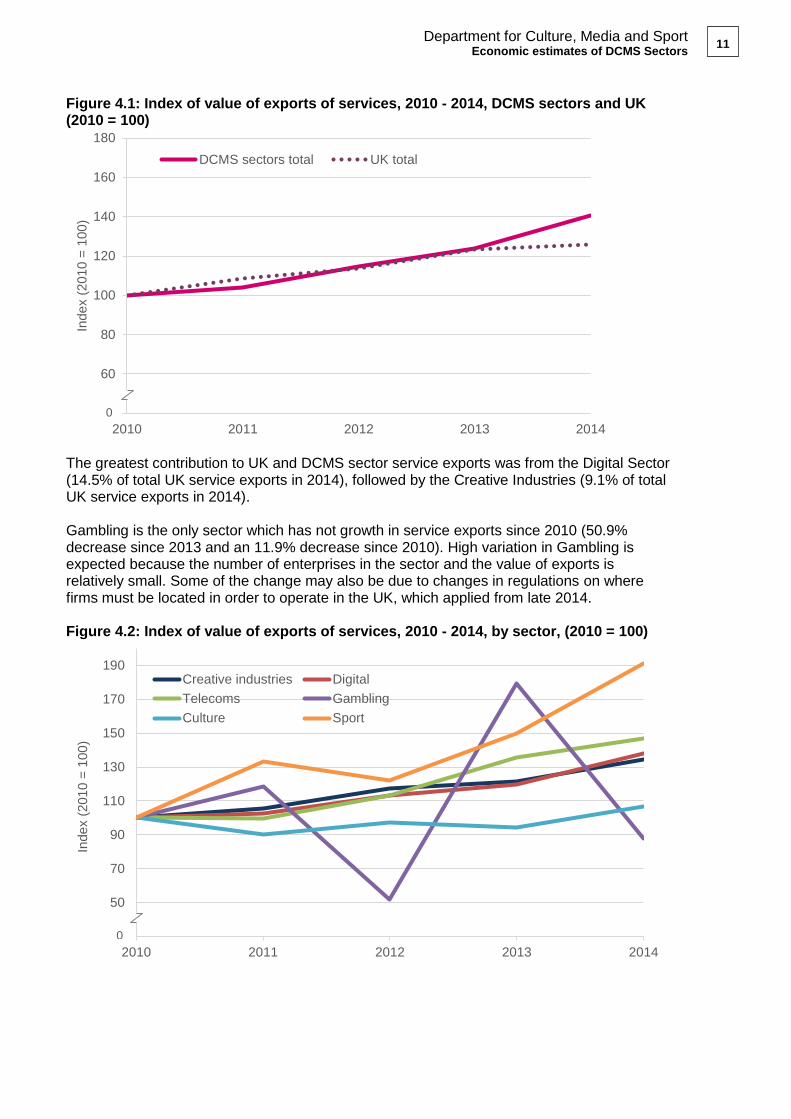
The greatest contribution to UK and DCMS sector service exports was from the Digital Sector (14.5% of total UK service exports in 2014), followed by the Creative Industries (9.1% of total UK service exports in 2014). Gambling is the only sector which has not growth in service exports since 2010 (50.9% decrease since 2013 and an 11.9% decrease since 2010). High variation in Gambling is expected because the number of enterprises in the sector and the value of exports is relatively small. Some of the change may also be due to changes in regulations on where firms must be located in order to operate in the UK, which applied from late 2014. Figure 4.2: Index of value of exports of services, 2010 - 2014, by sector, (2010 = 100)
40
60
80
100
120
140
160
180
2010 2011 2012 2013 2014
Index (
2010 =
100)
DCMS sectors total UK total
30
50
70
90
110
130
150
170
190
2010 2011 2012 2013 2014
Index (
2010 =
100)
Creative industries Digital
Telecoms Gambling
Culture Sport
0
0
Department for Culture, Media and Sport Economic estimates of DCMS Sectors
12
4.1.2 Exports by continent and EU
Data on service exports are available by continent for 2013 and 2014. More than half of exports of services from DCMS sectors in 2014 went to Europe: 56.6 per cent (£21.3bn) (Table 4.2). This compares to 50.9 per cent of total UK service exports in 2014. Exports of services to the EU account for 42.3 per cent of exports of services from DCMS sectors in 2014: this compares to 38.6 per cent of total UK service exports (Table 4.3). Table 4.2: Exports of services by continent: 2014
DCMS sectors
Exports of services (£m)
Africa America Asia Australasia Europe World
Creative Industries 407 5,526 2,039 356 11,356 19,809
Cultural Sector 150 1,648 396 111 3,059 5,401
Digital Sector 1,314 8,554 3,039 604 18,064 31,755
Gambling 3 30 11 6 121 171
Sport 151 355 573 16 694 1,791
Telecoms 678 1,037 1,053 193 3,796 6,779
DCMS sector total 1,527 9,711 4,237 661 21,294 37,654
% of DCMS sector total 4.1% 25.8% 11.3% 1.8% 56.6% 100%
Notes 1. Data are in current prices (i.e have not been adjusted for inflation). 2. DCMS sector total is lower than the sum of individual DCMS sectors because of overlaps between sectors. 3. America includes Canada, USA, Central America and South America. 4. Sum of continents does not equal world figure due to omission of some areas from specific continents, see methodology note.
Table 4.3: Exports of services EU versus non-EU: 2014
Exports of services (£m) Exports of services (%)
EU Rest of World EU Rest of World
Creative Industries 8,421 11,389 42.5 57.5
Cultural Sector 2,534 2,867 46.9 53.1
Digital Sector 13,860 17,895 43.6 56.4
Gambling 42 129 24.5 75.5
Sport 601 1,190 33.5 66.5
Telecoms 3,311 3,469 48.8 51.2
DCMS sector total 15,927 21,728 42.3 57.7
UK Total 84,439 134,321 38.6 61.4
Notes 1. Data are in current prices (i.e have not been adjusted for inflation). 2. DCMS sector total is lower than the sum of individual DCMS sectors because of overlaps between sectors. 3. For definition of EU, see methodology note. 4. In line with ONS estimates Gibraltar has not been included in the EU total. This has very limited impact on most sectors, but is significant for Gambling, leading to a large difference between the EU and Europe estimates for this sector.
Department for Culture, Media and Sport Economic estimates of DCMS Sectors
13
More data on exports of services for the Digital Sector and Creative Industries, presented by Standard Industrial Classification code, are available in an ad hoc statistic release published by DCMS in April 20162.
4.1.3 Exports by the Tourism sector
Estimates of exports for Tourism are based on data from the International Passenger Survey. It is assumed that exports of tourism is equal to the spend by overseas residents during visits to the UK. These figures represent exports of services and exports of goods combined and therefore are not directly comparable with the exports of services figures presented in the rest of this chapter. In 2014, the UK Tourism sector exported £21.8bn to the world. This accounted for 4.3 per cent of total UK exports of goods and services (up from 3.8 per cent in 2010). The value of exports by the Tourism sector increased by 2.8 per cent between 2013 and 2014 and by 29.3 per cent compared to 2010: meanwhile, the value of total UK exports (goods and services) has decreased by 1.2 per cent since 2013 and by 15.2 per cent since 20103. Visitors from countries in the European Union were responsible for 43.7 per cent of Tourism exports in 2014 (£9.6bn). Table 4.4: Tourism exports by market: 2013 to 2014
Market Exports (£m) % of UK Tourism exports
2013 2014 2013 2014
EU 9,188 9,551 43.2 43.7
Rest of world (World without EU)
12,070 12,298
56.8 56.3
World 21,258 21,849 NA NA
Notes 1. Data are in current prices (i.e have not been adjusted for inflation). 2. For a definition of EU see methodology note.
4.2 Imports
In 2014, DCMS sectors imported £19.4bn worth of services from the rest of the world: 14.6 per cent of total UK imports of services. This was a 9.0 per cent increase from 2013.
2 https://www.gov.uk/government/statistical-data-sets/ad-hoc-statistical-analysis-201617-quarter-1
3 Estimates from Pink Book 2016

Department for Culture, Media and Sport Economic estimates of DCMS Sectors
14
Table 4.5: Imports of services by DCMS sectors: 2013 to 2014
DCMS sectors
Imports of services (£bn)
Percentage change
since 2013
Percentage of UK total
2014 2013 2014
Creative Industries 7.9 8.7 9.7 6.6
Cultural Sector 2.4 2.5 4.9 1.9
Digital Sector 15.7 17.0 8.4 12.8
Gambling 0.2 0.2 -13.6 0.2
Sport 0.5 0.7 45.4 0.6
Telecoms 4.2 5.1 20.9 3.9
DCMS sectors total2 17.8 19.4 9.0 14.6
UK total (ONS Balance of Payments, Pink Book) 133.1 132.4 -0.5 100.0
DCMS sectors as a percentage of UK total 13.3% 14.6% NA NA
Notes 1. Data are in current prices i.e. have not been adjusted for inflation. 2. DCMS sector total is lower than the sum of individual DCMS sectors because of overlaps between sectors. 3. DCMS sector total does not included tourism as it is not possible to split services and goods. In 2014, the UK
Tourism sector imported £35.5bn worth of goods and services from the rest of the world.
4.2.2 Imports by continent and EU
Data on imports of services are available by continent for 2014. More than half of imports of services to DCMS sectors in 2014 came from Europe: 62.9 per cent (£12.2bn) (Table 4.6). 53.7 per cent of imports of services for DCMS sectors came from countries in the European Union (EU) in 2014: this compares to 47.8 per cent of total UK service imports (Table 4.7). Table 4.6: Imports of services by continent: 2014
DCMS sectors Imports of services (£m)
Africa America Asia Australasia Europe World
Creative Industries 97 2,408 1,032 333 4,821 8,707
Cultural Sector 37 944 114 218 1173 2,486
Digital Sector 463 3,649 2,020 407 10,431 16,998
Gambling 2 83 3 1 110 199
Sport 2 65 14 3 655 740
Telecoms 254 487 504 43 3,834 5,125
DCMS sectors total 479 4,092 2,135 424 12,184 19,358
Percentage of DCMS sector total
2.5% 21.1% 11.0% 2.2% 62.9% 100.0%
Notes 1. Data are in current prices (i.e. have not been adjusted for inflation). 2. DCMS sector total is lower than the sum of individual DCMS sectors because of overlaps between sectors. 3. America includes Canada, USA, Central America and South America. 4. Sum of continents does not equal world figure due to omission of some areas from specific continents.
Department for Culture, Media and Sport Economic estimates of DCMS Sectors
15
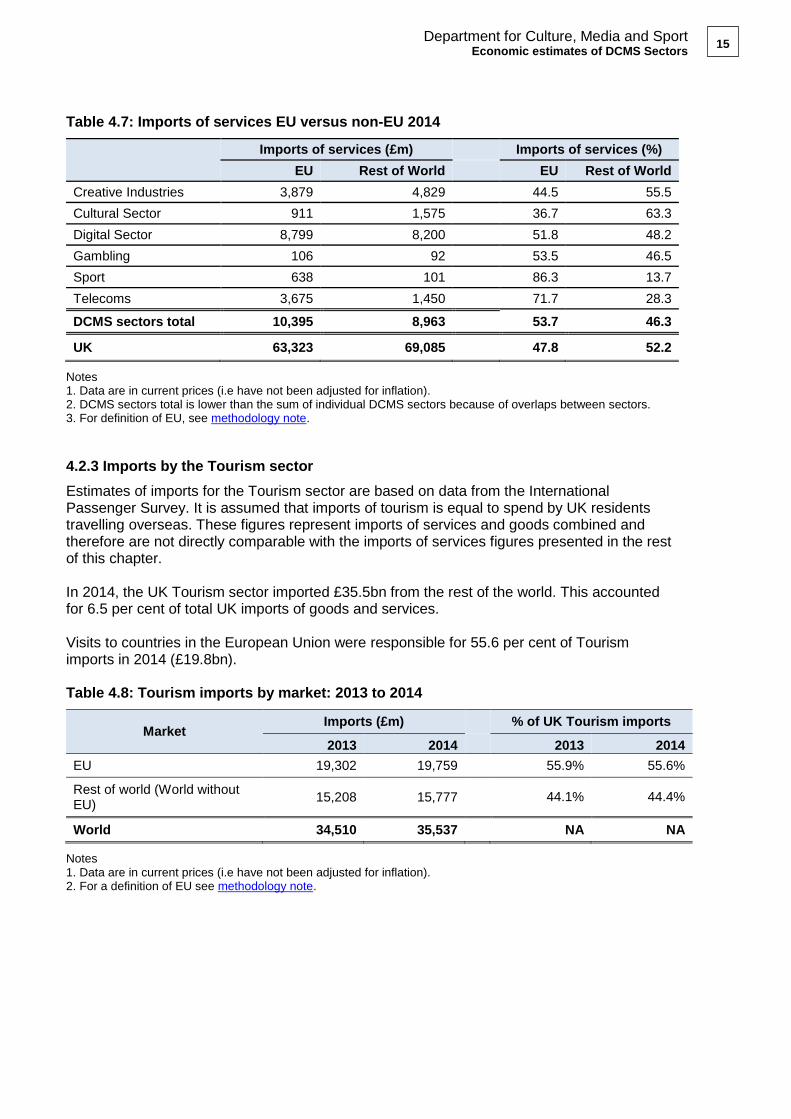
Table 4.7: Imports of services EU versus non-EU 2014
Imports of services (£m) Imports of services (%)
EU Rest of World EU Rest of World
Creative Industries 3,879 4,829 44.5 55.5
Cultural Sector 911 1,575 36.7 63.3
Digital Sector 8,799 8,200 51.8 48.2
Gambling 106 92 53.5 46.5
Sport 638 101 86.3 13.7
Telecoms 3,675 1,450 71.7 28.3
DCMS sectors total 10,395 8,963 53.7 46.3
UK 63,323 69,085 47.8 52.2
Notes 1. Data are in current prices (i.e have not been adjusted for inflation). 2. DCMS sectors total is lower than the sum of individual DCMS sectors because of overlaps between sectors. 3. For definition of EU, see methodology note.
4.2.3 Imports by the Tourism sector
Estimates of imports for the Tourism sector are based on data from the International Passenger Survey. It is assumed that imports of tourism is equal to spend by UK residents travelling overseas. These figures represent imports of services and goods combined and therefore are not directly comparable with the imports of services figures presented in the rest of this chapter. In 2014, the UK Tourism sector imported £35.5bn from the rest of the world. This accounted for 6.5 per cent of total UK imports of goods and services. Visits to countries in the European Union were responsible for 55.6 per cent of Tourism imports in 2014 (£19.8bn). Table 4.8: Tourism imports by market: 2013 to 2014
Market Imports (£m) % of UK Tourism imports
2013 2014 2013 2014
EU 19,302 19,759 55.9% 55.6%
Rest of world (World without EU)
15,208 15,777
44.1% 44.4%
World 34,510 35,537 NA NA
Notes 1. Data are in current prices (i.e have not been adjusted for inflation). 2. For a definition of EU see methodology note.
Department for Culture, Media and Sport Economic estimates of DCMS Sectors
16
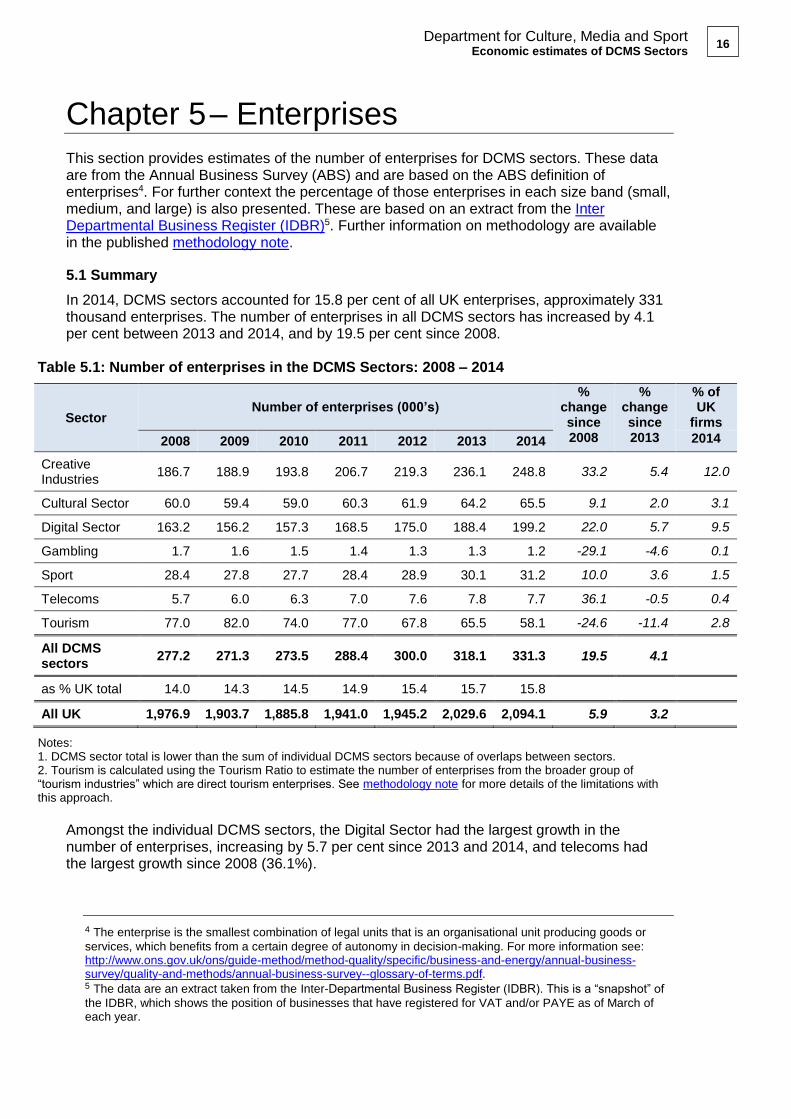
Chapter 5 – Enterprises
This section provides estimates of the number of enterprises for DCMS sectors. These data are from the Annual Business Survey (ABS) and are based on the ABS definition of enterprises4. For further context the percentage of those enterprises in each size band (small, medium, and large) is also presented. These are based on an extract from the Inter Departmental Business Register (IDBR)5. Further information on methodology are available in the published methodology note.
5.1 Summary
In 2014, DCMS sectors accounted for 15.8 per cent of all UK enterprises, approximately 331 thousand enterprises. The number of enterprises in all DCMS sectors has increased by 4.1 per cent between 2013 and 2014, and by 19.5 per cent since 2008.
Table 5.1: Number of enterprises in the DCMS Sectors: 2008 – 2014
Sector Number of enterprises (000’s)
% change since 2008
% change since 2013
% of UK
firms
2008 2009 2010 2011 2012 2013 2014 2014
Creative Industries
186.7 188.9 193.8 206.7 219.3 236.1 248.8 33.2 5.4 12.0
Cultural Sector 60.0 59.4 59.0 60.3 61.9 64.2 65.5 9.1 2.0 3.1
Digital Sector 163.2 156.2 157.3 168.5 175.0 188.4 199.2 22.0 5.7 9.5
Gambling 1.7 1.6 1.5 1.4 1.3 1.3 1.2 -29.1 -4.6 0.1
Sport 28.4 27.8 27.7 28.4 28.9 30.1 31.2 10.0 3.6 1.5
Telecoms 5.7 6.0 6.3 7.0 7.6 7.8 7.7 36.1 -0.5 0.4
Tourism 77.0 82.0 74.0 77.0 67.8 65.5 58.1 -24.6 -11.4 2.8
All DCMS sectors
277.2 271.3 273.5 288.4 300.0 318.1 331.3 19.5 4.1
as % UK total 14.0 14.3 14.5 14.9 15.4 15.7 15.8
All UK 1,976.9 1,903.7 1,885.8 1,941.0 1,945.2 2,029.6 2,094.1 5.9 3.2
Notes: 1. DCMS sector total is lower than the sum of individual DCMS sectors because of overlaps between sectors. 2. Tourism is calculated using the Tourism Ratio to estimate the number of enterprises from the broader group of “tourism industries” which are direct tourism enterprises. See methodology note for more details of the limitations with this approach.
Amongst the individual DCMS sectors, the Digital Sector had the largest growth in the number of enterprises, increasing by 5.7 per cent since 2013 and 2014, and telecoms had the largest growth since 2008 (36.1%).
4 The enterprise is the smallest combination of legal units that is an organisational unit producing goods or
services, which benefits from a certain degree of autonomy in decision-making. For more information see: http://www.ons.gov.uk/ons/guide-method/method-quality/specific/business-and-energy/annual-business-survey/quality-and-methods/annual-business-survey--glossary-of-terms.pdf. 5 The data are an extract taken from the Inter-Departmental Business Register (IDBR). This is a “snapshot” of
the IDBR, which shows the position of businesses that have registered for VAT and/or PAYE as of March of each year.

Department for Culture, Media and Sport Economic estimates of DCMS Sectors
17
Between 2013 and 2014, Tourism, Gambling and Telecommunications sectors have had a reduction in the number of enterprises. The Gambling sector had the largest decrease in the number of enterprises since 2008 (a fall of 29.1 per cent) and 2013 (a fall of 4.6 per cent). Figure 5.1: Number of enterprises by DCMS Sector, 2008 to 2014 (2008 = 100)
5.2 Size of enterprise by employment band
Information on size of enterprise by employment band is also given for context6. It shows that there is significant variation across DCMS sectors, and that generally DCMS sectors have more smaller enterprises than the UK business population as a whole. Table 5.2: Size of enterprises in DCMS sectors by employment band (%): 2014
Enterprise size by employment band (%)
Sector 0-4 5-9 10-49 50-249 250+ Total
Creative Industries 89.0 5.7 4.4 0.8 0.2 100
Culture 89.5 5.7 3.9 0.8 0.2 100
Digital 87.9 5.7 5.2 1.0 0.2 100
Gambling 47.2 21.6 22 6.4 2.8 100
Sport 66.0 16.0 15.1 2.2 0.8 100
Telecoms 81.1 8.0 8.2 2.0 0.6 100
All DCMS sectors 85.3 7.3 6.1 1.1 0.3 100
All UK (total) 75.7 12.6 9.6 1.7 0.4 100
DCMS sectors as a percentage of UK total
16.1 8.3 9.1 9.2 9.3
Notes: 1. DCMS sector total is lower than the sum of individual DCMS sectors because of overlaps among sectors.
6 Tourism is shown separately as it is produced on a different basis.
0
20
40
60
80
100
120
140
160
2008 2009 2010 2011 2012 2013 2014
Index (
2008 =
100)
Telecoms
CreativeIndustriesDigital
Sport
Culture
Gambling
Department for Culture, Media and Sport Economic estimates of DCMS Sectors
18
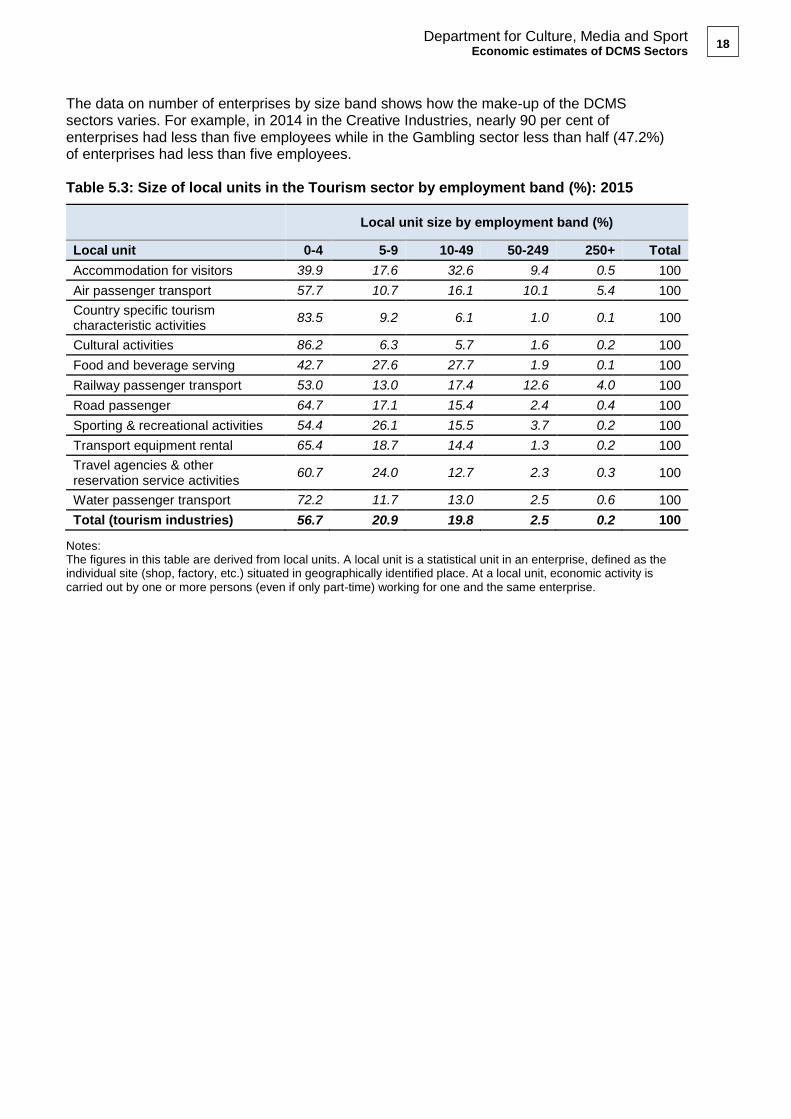
The data on number of enterprises by size band shows how the make-up of the DCMS sectors varies. For example, in 2014 in the Creative Industries, nearly 90 per cent of enterprises had less than five employees while in the Gambling sector less than half (47.2%) of enterprises had less than five employees. Table 5.3: Size of local units in the Tourism sector by employment band (%): 2015
Local unit size by employment band (%)
Local unit 0-4 5-9 10-49 50-249 250+ Total
Accommodation for visitors 39.9 17.6 32.6 9.4 0.5 100
Air passenger transport 57.7 10.7 16.1 10.1 5.4 100
Country specific tourism characteristic activities
83.5 9.2 6.1 1.0 0.1 100
Cultural activities 86.2 6.3 5.7 1.6 0.2 100
Food and beverage serving 42.7 27.6 27.7 1.9 0.1 100
Railway passenger transport 53.0 13.0 17.4 12.6 4.0 100
Road passenger 64.7 17.1 15.4 2.4 0.4 100
Sporting & recreational activities 54.4 26.1 15.5 3.7 0.2 100
Transport equipment rental 65.4 18.7 14.4 1.3 0.2 100
Travel agencies & other reservation service activities
60.7 24.0 12.7 2.3 0.3 100
Water passenger transport 72.2 11.7 13.0 2.5 0.6 100
Total (tourism industries) 56.7 20.9 19.8 2.5 0.2 100
Notes: The figures in this table are derived from local units. A local unit is a statistical unit in an enterprise, defined as the individual site (shop, factory, etc.) situated in geographically identified place. At a local unit, economic activity is carried out by one or more persons (even if only part-time) working for one and the same enterprise.

Department for Culture, Media and Sport Economic estimates of DCMS Sectors
19
Chapter 6 – Summary and Next Steps
This publication brings together a range of economic measures for DCMS sectors for the first time. It is the first time it has been possible to compare the different sectors on a basis which is consistent with each other and the rest of the UK. It also enables better consideration of changes over time. The results show the importance of DCMS sectors and in particular highlight the fact that the sectors which DCMS has policy responsibility for are growing at a faster rate than the rest of the economy. Over the period 2010 to 2015, there has been particularly strong growth in the contribution which the Creative Industries and Sport have made to the economy (GVA). Sport had the greatest percentage increase since 2010 (44.4%) and Creative Industries had the second greatest increase over the past five years (34.0%). While growth in exports of services since 2010 has been particularly strong for Sport and Telecoms. With the increasing importance of understanding the UK’s relationship with the rest of the EU it is valuable to see imports and exports of services broken down by EU and non-EU countries. In 2014, 42.3 per cent of exports of services from DCMS sectors went to countries in the European Union (EU) compared with 38.6 per cent of total UK exports of services. Finally, the data on number of enterprises shows how the make-up of the DCMS sectors varies. For example, in 2014 in the Creative Industries, nearly 90 per cent of enterprises had less than five employees while in the Gambling sector less than half (47.2%) of enterprises had less than five employees. This additional understanding of the sectors should support decision makers in understanding the issues different sectors face and the impact of policy changes for each sector. While huge progress has been made in order to produce these estimates, DCMS will continue to take forward work to develop the outputs further:
Employment - In August 2016, DCMS will publish estimates of numbers of jobs for each DCMS sector as well as all DCMS sectors. This publication will include breakdowns for EU and non-EU nationals, employed/self-employed and region.
Contribution of VCSE – DCMS is looking to include the value of the sectors which the Office for Civil Society have responsibility for; volunteering, community and social enterprise (VCSE).
Feedback - Views on this publication are welcomed from users, in particular in response to the request for feedback which will be published on 9 August. Responses should be provided to [email protected] by October 14 2016. These will feed into decisions on future publications of economic estimates for DCMS sectors (including Creative Industries Economic Estimates planned for publication in December 2016).
Sport Satellite Account - DCMS will publish an updated Sport Satellite Account by the end of 2016.
Exports of goods - the current publication includes exports of services only. Work is underway to produce estimates of exports of goods for DCMS sectors.
Productivity - understanding of productivity is of critical importance to understanding the economic impact of DCMS sectors. The improved methodology for GVA and jobs adopted in this report should support further development enabling DCMS to publish estimates of productivity for DCMS sectors in future.

Department for Culture, Media and Sport Economic estimates of DCMS Sectors
20
Deflators – DCMS will work with ONS to produce estimates of deflators for DCMS sectors. This will allow estimates to be adjusted for inflation (constant prices/real terms estimates). This is also important in the measurement of productivity, to ensure any observed changes in productivity are real rather than a result of inflation.
Feedback on this report and proposed developments is welcomed via email to [email protected]. The next publication of DCMS Sectors Economic Estimates will be in Autumn 2017, once the latest balanced Supply Use Tables are available. The date will be announced via the DCMS statistical release calendar nearer the time.
Department for Culture, Media and Sport Economic estimates of DCMS Sectors
21
Annex A – Tourism Satellite Account 2014
A1 Introduction
The UK Tourism Satellite Account (UK-TSA) provides economic information about the demand for goods and services associated with tourism, and their contribution to the UK economy.
The TSA estimates gross value added (GVA) and the number of jobs for (direct) tourism. Alongside this, the TSA also includes the number of enterprises in the tourism industries. Tourism is not an industry defined in National Accounts, but rather defined by the characteristics of the consumer in terms of whether they are a tourist or resident. This, therefore, differs from “traditional” industries such as manufacturing and agriculture which are defined by the goods and services produced themselves and means that a different methodology must be employed for estimates relating to tourism.
The is produced by UK-TSA the Tourism Intelligence Unit (TIU) in the Office for National Statistics (ONS) on behalf of the Department for Culture, Media and Sport (DCMS). The latest data are published on the ONS website. The TIU were also responsible for previous UK-TSAs covering 2008 to 2013. The previous release (2013) is available here.
The UK-TSA sets out the contributions that tourism makes to the economy of the UK as a whole and to individual “tourism industries” in particular. The “tourism industries” are a wider selection of Standard Industrial Classification and should not be used to measure the value of tourism to the UK economy. This is because such industries invariably serve tourists and non-tourists alike and therefore the UK-TSA includes a series of Tourism Ratios which are used to estimate the proportions of products supplied in the UK that are consumed by tourists. A more detailed methodology is available here.
This annex summarises headline findings for the 2014 Tourism Satellite Account, covering:
Tourism Direct Gross Value Added (which includes a ‘nowcasted’ estimate of the
2015 TD-GVA),
Tourism expenditure in the UK
Tourism direct employment estimates
Additional information is available in the accompanying tables, which are published on the ONS website.
All estimates are in current prices, that is, they have not been adjusted for inflation.
A2 Tourism Direct Gross Value Added
Tourism Direct Gross Value Added (TDGVA) indicates the output of the UK tourism industries
that is driven directly by tourism spend. In 2015 TDGVA was £62.4 billion7, and was
7 Figures for 2015 GVA have been ‘Nowcasted’, details of the approach are outlined in the methodology note.

Department for Culture, Media and Sport Economic estimates of DCMS Sectors
22
responsible for 3.8 per cent of the UK economy. The value of TDGVA increased by 3.3 per
cent when compared to 2014 when it was £60.4 billion (see Figure A.1).
Figure A.1: Tourism Direct GVA, 2010 – 2015 (£bns)
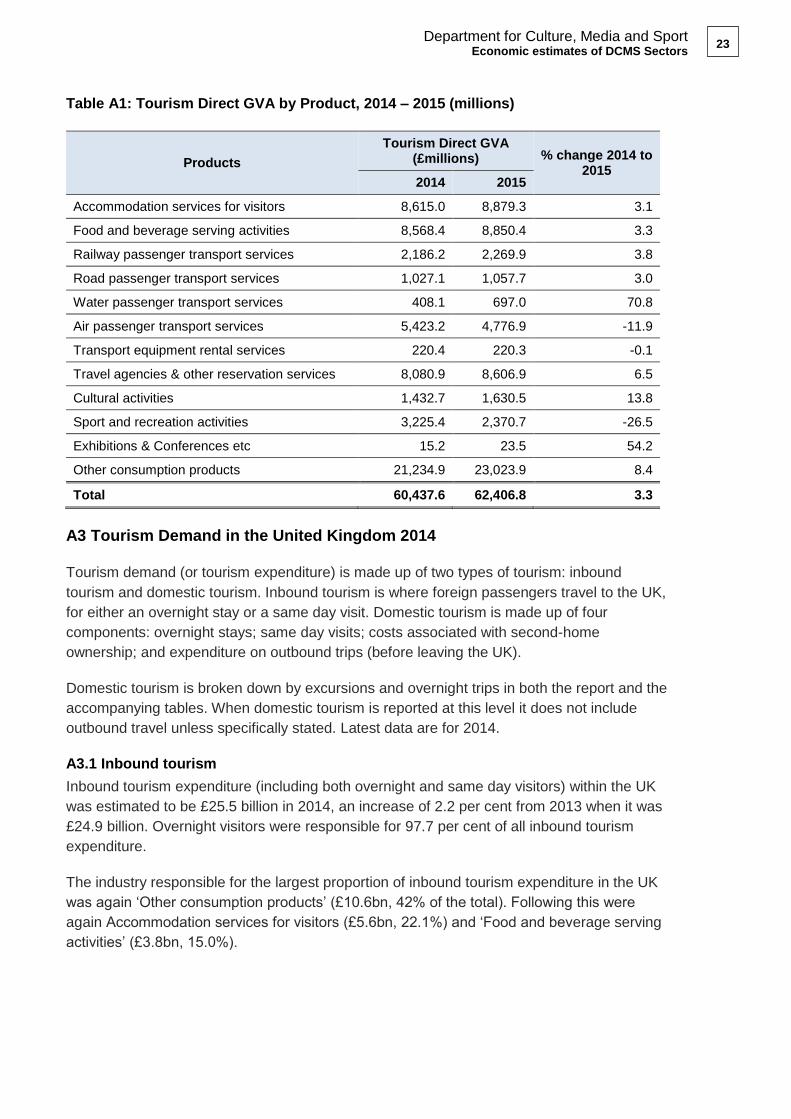
The main contributor to TDGVA was ‘other consumption products’ (£23.0bn and 36.9%) which refers to the proportion of output from non-tourism industries that is accounted for by tourism spend (see Table A.1). This includes activities such as non-food shopping or expenditure on personal transport and other activities not included within the tourism industries. The next highest category was ‘Accommodation services for visitors (£8.9bn, 14.2%) and ‘Food and beverage serving activities’ (£8.9bn, 14.2%).
‘Water passenger transport services’ saw the largest percentage change between 2014 and 2015 (up 70.8 per cent from £0.4bn to £0.7bn), although this category is still one of the smallest contributors to TDGVA, making up just 1.1 per cent of the overall tourism direct GVA.
49.1
62.4
0
10
20
30
40
50
60
70
2010 2011 2012 2013 2014 2015
Tourism
Direct
GV
A (
£bill
ions)
Year
Department for Culture, Media and Sport Economic estimates of DCMS Sectors
23
Table A1: Tourism Direct GVA by Product, 2014 – 2015 (millions)
A3 Tourism Demand in the United Kingdom 2014
Tourism demand (or tourism expenditure) is made up of two types of tourism: inbound
tourism and domestic tourism. Inbound tourism is where foreign passengers travel to the UK,
for either an overnight stay or a same day visit. Domestic tourism is made up of four
components: overnight stays; same day visits; costs associated with second-home
ownership; and expenditure on outbound trips (before leaving the UK).
Domestic tourism is broken down by excursions and overnight trips in both the report and the
accompanying tables. When domestic tourism is reported at this level it does not include
outbound travel unless specifically stated. Latest data are for 2014.
A3.1 Inbound tourism
Inbound tourism expenditure (including both overnight and same day visitors) within the UK
was estimated to be £25.5 billion in 2014, an increase of 2.2 per cent from 2013 when it was
£24.9 billion. Overnight visitors were responsible for 97.7 per cent of all inbound tourism
expenditure.
The industry responsible for the largest proportion of inbound tourism expenditure in the UK
was again ‘Other consumption products’ (£10.6bn, 42% of the total). Following this were
again Accommodation services for visitors (£5.6bn, 22.1%) and ‘Food and beverage serving
activities’ (£3.8bn, 15.0%).
Products
Tourism Direct GVA (£millions) % change 2014 to
2015 2014 2015
Accommodation services for visitors 8,615.0 8,879.3 3.1
Food and beverage serving activities 8,568.4 8,850.4 3.3
Railway passenger transport services 2,186.2 2,269.9 3.8
Road passenger transport services 1,027.1 1,057.7 3.0
Water passenger transport services 408.1 697.0 70.8
Air passenger transport services 5,423.2 4,776.9 -11.9
Transport equipment rental services 220.4 220.3 -0.1
Travel agencies & other reservation services 8,080.9 8,606.9 6.5
Cultural activities 1,432.7 1,630.5 13.8
Sport and recreation activities 3,225.4 2,370.7 -26.5
Exhibitions & Conferences etc 15.2 23.5 54.2
Other consumption products 21,234.9 23,023.9 8.4
Total 60,437.6 62,406.8 3.3

Department for Culture, Media and Sport Economic estimates of DCMS Sectors
24
A3.2 Domestic tourism
Domestic tourism describes the activities of a UK resident visiting another part of the UK, and
this can include tourism trips with an overnight stay and tourism visits without an overnight
stay (a same day visit). Alongside this, there is also domestic tourism expenditure that takes
place within the UK and is associated with UK residents making an overseas visit – this
domestic outbound tourism often involves some expenditure on the UK territory before
leaving the country. This can include spend at ports or expenditure on outbound flights on UK
carriers and this is all accounted for within this release.
Domestic tourism expenditure within the UK was £105.1 billion in 2014, a 0.2 per cent
increase on 2013 when it was £104.9 billion.
Again, ‘Other consumption products’ were responsible for the largest proportion of domestic
tourism expenditure in 2014 (£33.4bn, 31.7%).
‘Sport and recreation activities’ saw the largest increase between 2013 and 2014, increasing
by 54.9 per cent to £4.9 billion. A number of industries saw a large decrease, ‘Exhibitions &
conferences etc.’ decreased by 63.1 per cent (to £0.2bn) and ‘Water passenger transport
services’ decreased by 48.2 per cent (to £0.7bn), however these industries were small to
begin with and both contribute less than one percent of the overall total.
Additional information on tourism expenditure can be found in the accompanying tables.
A4 Tourism Direct Employment
Tourism direct employment is defined as the number of jobs that is are directly supported by
tourism consumption across the tourism industries. The 2015 figures have been estimated
using previous data, and this has been outlined further on in this chapter.
In 2014, there were 1.4 million people directly employed in tourism, a 10.7 per cent decrease
on the previous year, when there were 1.6 million people directly employed in tourism.
Again, ‘other consumption products’ were responsible for the largest proportion of
employment (0.4 million, 29.3%), followed by ‘Food and beverage serving activities’ were
responsible for the highest proportion of jobs (0.3 million, 24.4%) and ‘Accommodation
services for visitors’ (0.3 million, 19.2%).
Employment decreased in the vast majority of the tourism industries between 2013 and 2014,
with the exceptions of ‘Sport and recreation activities’ (an increase of 67.5% to 0.1 million
jobs), ‘Railway passenger transport services’ (which increased by 16.1% to 0.03 million jobs)
and ‘Water passenger transport services’ (an increase of 4.1% to 2,000 jobs).
As some of the industries are small there is a lot of volatility in estimates.

Department for Culture, Media and Sport Economic estimates of DCMS Sectors
25
Table A2: Direct tourism jobs by group, 2013 - 2014
A4.1. Tourism Direct Employment, 2015
Tourism total employment is provided in the accompanying tables. Tourism ratios are applied to these figures to produce a tourism direct employment figure by tourism characteristic activity category. The same tourism ratio is applied to the employed and self-employed split of the total employment data to provide an employed/self-employed tourism direct employment figure. Further information on the approach can be found in the methodology note. Based on these estimates, in 2015 there were 1.5 million people directly employed in tourism, a 3.1 per cent increase on the previous year.
A4.2 Number of enterprises
Figures on the number of enterprises in the ‘tourism industries’ (which differs from direct tourism’)8 are available in the accompanying tables. Additional analysis has been undertaken on these figures using the tourism ratios in order to obtain an approximate estimate of ‘tourism direct’ number of enterprises and is included in Chapter 5 of this report.
8 The ‘tourism industries’ are a broad category that can be used to define tourism, which ratios are applied to in order to obtain direct tourism estimates.
Products
Tourism Direct Employment (000s) % change 2013 to
2014 2013 2014
Accommodation services for visitors 341.9 275.4 -19.4
Food and beverage serving activities 442.3 349.4 -21.0
Railway passenger transport services 24.1 28.0 16.1
Road passenger transport services 69.2 54.5 -21.3
Water passenger transport services 2.2 2.3 4.1
Air passenger transport services 50.7 41.2 -18.8
Transport equipment rental services 1.5 0.9 -38.7
Travel agencies & other reservation services 96.0 86.7 -9.7
Cultural activities 78.6 46.0 -41.5
Sport and recreation activities 76.6 128.3 67.5
Exhibitions & Conferences etc 0.7 0.3 -61.4
Other consumption products 420.0 419.2 -0.2
Total 1,603.9 1,432.0 -10.7

Department for Culture, Media and Sport Economic estimates of DCMS Sectors
26
Annex B – Background Note
1. The next update to these statistics will be published in Autumn 2017, once the
National Accounts have been published.
2. The responsible statistician for this release is Penny Allen. For enquiries on this release, please contact Penny on 0207 211 2380 or [email protected].
3. For general enquiries contact:
Department for Culture Media and Sport 100 Parliament Street London SW1A 2BQ Telephone: 020 7211 6000
4. DCMS statisticians can be followed on Twitter via @DCMSInsight.
5. DCMS would like to thank the Office for National Statistics (ONS) for their support in the development of this output.
6. The Economic estimates of DCMS Sectors release is an experimental Official Statistics publication and has been produced to the standards set out in the Code of Practice for Official Statistics. For more information, see http://www.statisticsauthority.gov.uk/ assessment/code-of-practice/code-of-practice-for-official-statistics.pdf. Details of the pre-release access arrangements for this dataset have been published alongside this release.
© Crown copyright 2016 You may re-use this information (not including logos) free of charge in any format or medium, under the terms of the Open Government Licence. To view this licence, visit www.nationalarchives.gov.uk/doc/open-government-licence/ or write to the Information Policy Team, The National Archives, Kew, London TW9 4DU, or email: [email protected].