dc offset thesis - final draft - doc - denver, colorado · analysis!of!dc!offset!in!ios!devices!...
TRANSCRIPT

ANALYSIS OF DC OFFSET IN iOS DEVICES
FOR USE IN AUDIO FORENSIC EXAMINATIONS
by
Daniel Bradley Fuller
B.S., Middle Tennessee State University, 2006
A thesis submitted to the
Faculty of the Graduate School of the
University of Colorado Denver in partial fulfillment
of the requirements for the degree of
Master of Science
Media Forensics
2013

ii
© 2013 by Daniel Bradley Fuller
All Rights Reserved

iii
This thesis for the Master of Science degree by
Daniel Bradley Fuller
has been approved for the
College of Arts and Media MSRA in Media Forensics
by
Catalin Grigoras
Jeff M. Smith
Marcus K. Rogers
May 4, 2013
iii
Fuller, Daniel Bradley (M.S. Media Forensics) Analysis of DC Offset for iOS Devices for Use in Audio Forensic Examinations Thesis directed by Professor Catalin Grigoras
ABSTRACT Due to the physical properties of electronic components, DC offset will occur to some extent in all audio recordings. DC offset is the effect of direct current on an audio recording, and causes the audio signal to no longer oscillate around the absolute zero quantization level. The mean amplitude of a recording is calculated to determine the global amount of DC offset. Measuring the offset, its change over time, and its standard deviation can be used during forensic examination to aid in determining the authenticity of a recording as well as for exclusionary purposes when multiple recorders could possibly be the source of a recording. The scope of this thesis is to measure the DC offset that occurs in recordings made by Apple mobile devices running on iOS, to quantify the uniqueness of this offset within this family of devices as well as against previously tested audio recording devices, and to see if different hardware and apps affect the offset. To accurately determine this, multiple apps were tested in conjunction with the built-‐in microphone, the Apple EarPods that come with the iPhone 5, and the Apple Earphones that come with previous iPhone models. Furthermore, all recordings were made in laboratory conditions with a minimum amount of outside noise, only the app making the current recording was open, Auto-‐Brightness was switched off, and all outside connectivity (wireless, Bluetooth, 3G, 4G, LTE) was turned off. The form and content of this abstract are approved. I recommend its publication.
Approved: Catalin Grigoras

iv
DEDICATION
I dedicate this thesis to my family, Tom, Josie and Lauren, and my fiancée, Emily Vinson. This would not have been possible without your love and support. You have provided me with the strength and encouragement needed to bring me to where I am today.

v
ACKNOWLEDGEMENT
First and foremost I would like to thank and acknowledge Jeff Smith. Without a timely placed email, I would have never had my interests peeked by the possibility of working in the field of Media Forensics. I would like to thank Catalin Grigoras for all of his wisdom and encouragement he has provided since I arrived in Denver back in August of 2011. I would like to thank Marcus Rogers for agreeing to be a member of my Thesis Defense Committee as well as provide great insight into the vast world of Computer Forensics. I would like to thank Zeno Geradts for giving me the opportunity to be an intern at the Netherlands Forensic Institute, and providing the freedom and resources to work on my thesis. I would like to thank Bruce Koenig and Doug Lacey for providing me with an advanced copy of their research in the field of DC offset research. I would like to thank Rachel Friedman for helping me with additional research while working towards completing her M.S. in Forensic Science at Marshall University. It is such an honor to have had the support of each and every one of you. I am proud to have had the chance to work with all of you, and am so grateful for all the help you have provided me throughout the process of receiving my M.S.

vi
Table of Contents
List of Figures .......................................................................................................................................... viii
List of Tables ............................................................................................................................................. xii
List of Abbreviations ............................................................................................................................. xiii
Chapter
1. Introduction ............................................................................................................................................. 1
2. Prior Research ........................................................................................................................................ 7
2.1 Nine Digital Recorders ..................................................................................................................... 7
2.2 Audio Compression Algorithms ................................................................................................... 9
2.3 Acoustic Consistency ...................................................................................................................... 11
4.1 SuperNote Versus MicPro ............................................................................................................ 22
4.2 DC Offset and Standard Deviation ............................................................................................ 23
4.3 Calculations Based on Window Sizes ...................................................................................... 25
4.4 Histograms ......................................................................................................................................... 28
5. Comparisons and Conclusions ...................................................................................................... 31
5.1 DC Offset .............................................................................................................................................. 31
5.2 Standard Deviation ......................................................................................................................... 35

vii
5.3 Histograms ......................................................................................................................................... 36
5.4 Conclusions ........................................................................................................................................ 37
5.5 Additional Notes & Future Research ....................................................................................... 39
Appendix: Plots and Measurements ............................................................................................... 42
References ............................................................................................................................................... 105

viii
List of Figures
Figure 1 – Signal without DC Offset – iPhone 5 – Built-‐In -‐ Camera App ........................... 3
Figure 2 –Signal with DC Offset – iPhone 5 – Built-‐In -‐ SuperNote ...................................... 4
Figure 3 –Alesis PalmTrack – WAV & 35 MP3 CBRs -‐ DC Offset Means .......................... 11
Figure 4 – Average Standard Deviation Versus Time .............................................................. 13
Figure 5 -‐ Formula for Standard Deviation .................................................................................. 21
Figure 6 -‐ DC Offset Mean and in Windows -‐ SuperNote vs. MicPro ................................. 23
Figure 7 -‐ SD of DC Offset Windows and QL -‐ SuperNote vs MicPro ................................. 23
Figure 8 -‐ DC Offset Mean -‐ Built-‐In vs External Microphones ............................................ 24
Figure 9 -‐ SD of Amplitude -‐ Built-‐In vs External Microphones .......................................... 24
Figure 10 -‐ SD of DC Offset Windows ............................................................................................. 26
Figure 11 -‐ DC Offset Mean and for Windows ............................................................................ 27
Figure 12 -‐ SD at 1-‐Minute Intervals -‐ iPhone 5 – EarPods ................................................... 28
Figure 13 -‐ SD at 1-‐Minute Intervals -‐ iPad 2 -‐ Built-‐In .......................................................... 28
Figure 14 -‐ iPhone 5 -‐ EarPods – Waveform ............................................................................... 29
Figure 15 -‐ iPhone 5 -‐ Built-‐In – Waveform ................................................................................. 30
Figure 16 -‐ Histograms -‐ iPhone 5 -‐ EarPods .............................................................................. 30
Figure 17 -‐ Histogram -‐ iPad 1 -‐ Built-‐In Mic .............................................................................. 30
Figure 18 -‐ iPhone 5 -‐ EarPods -‐ DC Offset Plots ....................................................................... 33
Figure 19 -‐ SuperNote -‐ Test 1 -‐ DC Offset Plots ........................................................................ 43
Figure 20 -‐ SuperNote -‐ Test 1 -‐ Histograms ............................................................................... 44

ix
Figure 21 -‐ SuperNote -‐ Test 2 -‐ DC Offset Plots ........................................................................ 45
Figure 22 -‐ SuperNote -‐ Test 2 -‐ Histograms ............................................................................... 46
Figure 23 -‐ MicPro -‐ Test 1 -‐ DC Offset Plots ............................................................................... 47
Figure 24 -‐ MicPro -‐ Test 1 -‐ Histograms ...................................................................................... 48
Figure 25 -‐ MicPro -‐ Test 2 -‐ DC Offset Plots ............................................................................... 49
Figure 26 -‐ MicPro -‐ Test 2 -‐ Histograms ...................................................................................... 50
Figure 27 -‐ iPhone 5 -‐ Built-‐In -‐ DC Offset Plots ......................................................................... 51
Figure 28 -‐ iPhone 5 – Built-‐In -‐ Histograms ............................................................................... 52
Figure 29 -‐ iPhone 5 -‐ Built-‐In -‐ SD Windows ............................................................................. 53
Figure 30 -‐ iPhone 5 -‐ Earphones -‐ DC Offset Plots .................................................................. 54
Figure 31 -‐ iPhone 5 -‐ Earphones -‐ Histograms ......................................................................... 55
Figure 32 -‐ iPhone 5 -‐ Earphones -‐ SD Windows ...................................................................... 56
Figure 33 -‐ iPhone 5 -‐ EarPods -‐ DC Offset Plots ....................................................................... 57
Figure 34 -‐ iPhone 5 -‐ Earpods -‐ Histograms .............................................................................. 58
Figure 35 -‐ iPhone 5 -‐ EarPods -‐ SD Windows ............................................................................ 59
Figure 36 -‐ iPhone 4S -‐ Built-‐In -‐ DC Offset Plots ...................................................................... 60
Figure 37 -‐ iPhone 4S -‐ Built-‐In -‐ Histograms ............................................................................. 61
Figure 38 -‐ iPhone 4S -‐ Built-‐In -‐ SD Windows ........................................................................... 62
Figure 39 -‐ iPhone 4S -‐ Earphones -‐ DC Offset Plots ................................................................ 63
Figure 40 -‐ iPhone 4S -‐ Earphones -‐ Histograms ....................................................................... 64
Figure 41 -‐ iPhone 4S -‐ Earphones -‐ SD Windows .................................................................... 65
Figure 42 -‐ iPhone 4S -‐ EarPods -‐ DC Offset Plots ..................................................................... 66

x
Figure 43 -‐ iPhone 4S -‐ EarPods -‐ Histograms ............................................................................ 67
Figure 44 -‐ iPhone 4S -‐ EarPods -‐ SD Windows ......................................................................... 68
Figure 45 -‐ iPhone 4 -‐ Built-‐In -‐ DC Offset Plots ......................................................................... 69
Figure 46 -‐ iPhone 4 -‐ Built-‐In -‐ Histograms ............................................................................... 70
Figure 47 -‐ iPhone 4 -‐ Built-‐In -‐ SD Windows ............................................................................. 71
Figure 48 -‐ iPhone 4 -‐ Earphones -‐ DC Offset Plots .................................................................. 72
Figure 49 -‐ iPhone 4 -‐ Earphones -‐ Histograms ......................................................................... 73
Figure 50 -‐ iPhone 4 -‐ Earphones -‐ SD Windows ...................................................................... 74
Figure 51 -‐ iPhone 4 -‐ EarPods -‐ DC Offset Plots ....................................................................... 75
Figure 52 -‐ iPhone 4 -‐ EarPods -‐ Histograms .............................................................................. 76
Figure 53 -‐ iPhone 4 -‐ EarPods -‐ SD Windows ............................................................................ 77
Figure 54 -‐ iPhone 3GS -‐ Built-‐In -‐ DC Offset Plots ................................................................... 78
Figure 55 -‐ iPhone 3GS -‐ Built-‐In -‐ Histograms .......................................................................... 79
Figure 56 -‐ iPhone 3GS -‐ Built-‐In -‐ SD Windows ........................................................................ 80
Figure 57 -‐ iPhone 3GS -‐ Earphones -‐ DC Offset Plots ............................................................. 81
Figure 58 -‐ iPhone 3GS -‐ Earphones -‐ Histograms .................................................................... 82
Figure 59 -‐ iPhone 3GS -‐ Earphones -‐ SD Windows ................................................................. 83
Figure 60 -‐ iPhone 3GS -‐ EarPods -‐ DC Offset Plots .................................................................. 84
Figure 61 -‐ iPhone 3GS -‐ EarPods -‐ Histograms ......................................................................... 85
Figure 62 -‐ iPhone 3GS -‐ EarPods -‐ SD Windows ...................................................................... 86
Figure 63 -‐ iPad 2 -‐ Built-‐In -‐ DC Plots ........................................................................................... 87
Figure 64 -‐ iPad 2 -‐ Built-‐In -‐ Histograms ..................................................................................... 88

xi
Figure 65 -‐ iPad 2 -‐ Built-‐In -‐ SD Windows .................................................................................. 89
Figure 66 -‐ iPad 2 -‐ Earphones -‐ DC Offset Plots ....................................................................... 90
Figure 67 -‐ iPad 2 -‐ Earphones -‐ Histograms .............................................................................. 91
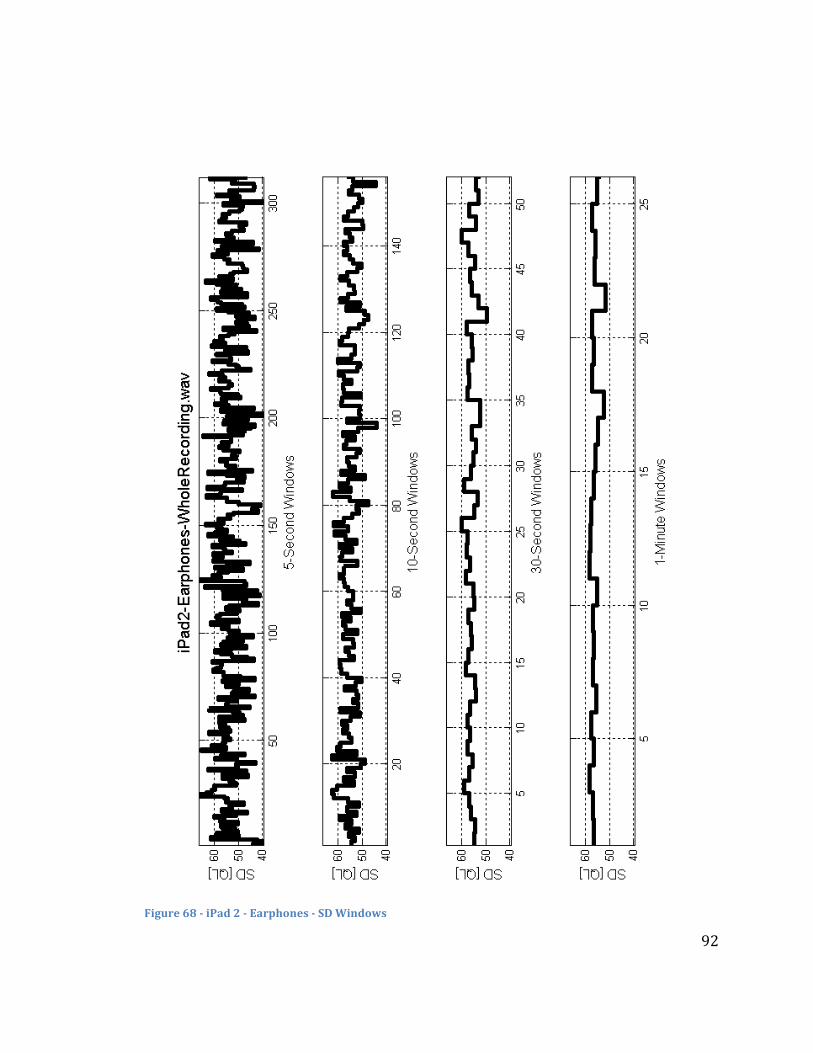
Figure 68 -‐ iPad 2 -‐ Earphones -‐ SD Windows ............................................................................ 92
Figure 69 -‐ iPad 2 -‐ EarPods -‐ DC Offset Plots ............................................................................ 93
Figure 70 -‐ iPad 2 -‐ EarPods -‐ Histograms ................................................................................... 94
Figure 71 -‐ iPad 2 -‐ EarPods -‐ SD Windows ................................................................................. 95
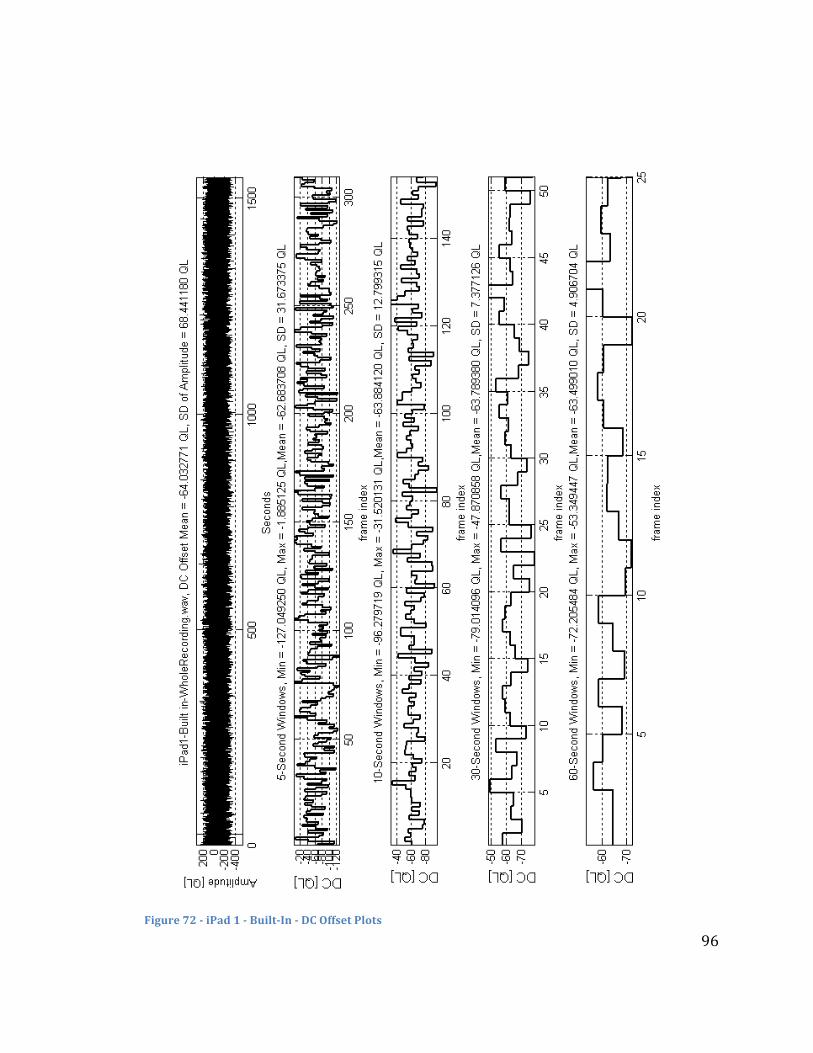
Figure 72 -‐ iPad 1 -‐ Built-‐In -‐ DC Offset Plots .............................................................................. 96
Figure 73 -‐ iPad 2 -‐ Built-‐In -‐ Histograms ..................................................................................... 97
Figure 74 -‐ iPad 2 -‐ Built-‐In -‐ SD Windows .................................................................................. 98
Figure 75 -‐ iPad 2 -‐ Earphones -‐ DC Offset Plots ....................................................................... 99
Figure 76 -‐ iPad 2 -‐ Earphones -‐ Histograms ........................................................................... 100
Figure 77 -‐ iPad 2 -‐ Earphones -‐ SD Windows ......................................................................... 101
Figure 78 -‐ iPad 2 -‐ EarPods -‐ DC Offset Plots ......................................................................... 102
Figure 79 -‐ iPad 2 -‐ EarPods -‐ Histograms ................................................................................ 103
Figure 80 -‐ iPad 2 -‐ EarPods -‐ SD Windows .............................................................................. 104

xii
List of Tables
Table 1 -‐ Ten Microphone Setups ....................................................................................................... 8
Table 2 -‐ Transcoding Formats ......................................................................................................... 10
Table 3 -‐ iOS Software Versions ........................................................................................................ 16
Table 4 -‐ Recording Formats .............................................................................................................. 19
Table 5 -‐ DS-‐330 DC Offset Mean – Inconsistent Environment ........................................... 32
Table 6 -‐ DS-‐330 and SME DM-‐40 DC Offset Mean -‐ Consistent Environment ............. 32

xiii
List of Abbreviations Abbreviation ADPCM Adaptive Differential Pulse-‐Code Modulation AES Audio Engineering Society CLA Compression Level Analysis DC Direct Current DSP Digital Signal Processing DSS Digital Speech Standard ENF Electric Network Frequency LTAS Long-‐Term Average Spectrum MP3 MPEG-‐1/MPEG-‐2 Audio Layer III PCM Pulse-‐Code Modulation QL Quantization Level SD Standard Deviation WMA Windows Media Audio

1
1. Introduction
In the field of audio forensics, there are numerous tests that may be performed
during the authentication of a recording. These include examination of a digital
recording’s file structure, critical listening, waveform analysis, electric network
frequency (ENF) comparison, and a myriad of other forms of analysis. One of the
most recent types of examination comes in the form of measuring the affect of the
direct current (DC) on the audio signal. This effect is known as DC bias, more often
referred to as DC offset, and from this point on only referred to as such. As per
Federal Standard 1037C, bias is known as:[1]
• A systematic deviation of a value from a reference value • The amount by which the average of a set of values departs from a reference
value In the case of DC offset, the effect of the DC current on an audio recording appears as
a negative or positive departure of the audio waveform from equal distribution
around the x-‐axis, otherwise known as the absolute zero quantization level (QL).
When an audio recording is made, the recording device must use electrical energy.
Either an external power supply or an internal battery provides this energy, and it
will be present to some extent in the audio recording via the current running
through the device. This presence may manifest itself in a number of ways, among
which include AC hum, ENF, noise, etc. One form of energy that is always present in
a recording is the direct current running through the recording device, and exists in

2
both analog and digital recordings. The addition of the direct current to the audio
signal is referred to as DC offset, and will affect the audio waveform by making it no
longer centered around the absolute zero QL. This will result in a positive or
negative shift of the waveform from the x-‐axis, and when the global DC offset, also
known as DC offset mean, is calculated, the resulting value will be either positive or
negative because of this shift from the x-‐axis. To calculate the DC offset, we measure
the mean amplitude of the audio recording. An ideal audio recording would have a
DC offset mean value of zero, but this is technically impossible due to the nature of
complex waveforms. We must work with audio recordings in an environment such
as MATLAB to accurately calculate the amount of DC offset. For this study, QL
values were chosen as the unit of measurement to calculate the DC offset because
they are the smallest form of measurement available when measuring the amplitude
of digital audio.
Due to the nature of digital audio, the number of available QLs per sample in a
recording is determined by the recording format’s bit depth, and the amount of
samples per second of audio is determined by the sample rate. For example, CD
quality audio is of the WAV PCM (pulse-‐code modulation) format, and has a bit
depth of 16 and sample rate of 44.1 kHz. This means that one second of audio
contains 44,100 samples, and each sample has 65,536 possible QL values, with
65,536 being the equivalent of 2^16. Because of the compressions and rarefactions
in acoustic energy, digital audio waveforms will analogously go between the zero-‐

3
crossing (no acoustic energy), the peak (the compression), back through the zero-‐
crossing, the trough (the rarefaction), and repeat until the end of the acoustic
energy. Therefore, digital audio must be signed in accordance to the positive and
negative aspects of this energy. As such, the QL values will range from -‐32,768 to
32767 for a 16-‐bit recording, and confirms that the DC offset can be either a positive
or negative QL value. When calculating the mean amplitude, the sum of all the QLs
is divided by the amount of samples. It should be noted that DC offset can also be
calculated in dB and percent, but for higher accuracy and precision it is best to use
QLs.
In Figure 1 and Figure 2, we see an example of an audio signal exhibiting no
apparent DC offset followed by an audio signal exhibiting a negative DC offset. We
say no apparent DC offset because there will always be some amount of offset for a
complex audio waveform even when DC offset correction has been applied to the
digital audio. From this point on, a signal that has no apparent offset will be said to
have no offset for the sake of simplicity. The signal containing no offset fluctuates
around the absolute zero QL, while the audio signal seen in Figure 2 lies below the
zero QL. The signal in Figure 2 oscillates in such a way that the signal is centered at
approximately -‐60 QL.
Figure 1 – Signal without DC Offset – iPhone 5 – Built-‐In -‐ Camera App

4
Figure 2 –Signal with DC Offset – iPhone 5 – Built-‐In -‐ SuperNote
So how does this affect the forensic examination of digital audio recordings?
Because DC offset is quantifiable on a very small and exact scale, it may be useful
during the authentication of a recording. There will be high uniformity between any
two products of the same type due to the assembly line nature of mass-‐produced
items, which dictates that any differences should be nominal between devices of the
same model. As such, there should be some degree of uniqueness in the DC offset
that manifests itself in these devices’ recordings due to companies using different
manufacturing processes and parts between their various audio recording products.
In today’s digital society, we are deluged with a massive amount of products that
incorporate digital audio recording such as digital handheld recorders, tablets,
mobile phones and video cameras. This research focuses on a subset of these
devices, Apple’s line of mobile iDevices. iDevices can be considered any of their
products running on the mobile operating system, iOS. These include all iPhones,
iPads, iPod Touches, and Apple TVs. This study is not concerned with the Apple TV,
as it is not portable, and it is not capable of recording audio.

5
This particular research study aims to quantify the uniqueness of the DC offset
present in these iDevices. iOS comes packaged with the ability to record digital
audio via the Voice Memos and Camera apps by using the built-‐in microphone or an
external microphone such as the one present on the EarPods that are included with
the iPhone 5. Along with the ability to take photos, the Camera app is capable of
capturing video with audio and this research tested for DC offset when using the
Camera app’s video/audio recorder. There are also many third party apps and
microphones that are capable of recording audio, and multiple ones were tested to
see if they affect the DC offset. Similar to any number of digital handheld recorders,
iDevices can be a source of digital evidence. This research is meant to measure and
examine the DC offset that is present in recordings made by various iDevices, to
determine the usability of these measurements for the purpose of forensic
examination, and if these measurements are at all unique when compared against
previously tested digital audio recorders.
Test recordings were made using various apps and three different microphones.
The DC offset values measured for these iDevice recordings were also compared
against devices tested in previous research. To perform these tests, the DC offset
mean and standard deviation (SD) of the amplitude were measured per recording as
well as the DC offset and its SD in four different sized windows. Histograms were
made of the amplitude per recording and the four DC offset window sizes. The SD of
the amplitude was measured in 4 window sizes. In addition, the minimum,

6
maximum, mean, and SD of the DC offset were calculated for all window sizes. As
mentioned before, QL values were chosen as the unit of measure for DC offset
values. Likewise, all SD values are measured in QLs.
Once measured, DC offset can be used to for exclusionary purposes. It should only
be used as such because the value is only relatively unique, and it is possible that
other audio recorders may exhibit similar DC offset values. Therefore, we must be
able to distinguish between inter-‐ and intra-‐variability. For this study, two sets of
inter-‐ and intra-‐variability were examined. In the first set, it was necessary to
determine the inter-‐variability among all tested iDevices, and the intra-‐variability
between recordings made with the same iDevice. In the second set, the inter-‐
variability was examined between recordings made by the iDevices and from
devices tested in previous research. Likewise, the intra-‐variability was examined
for recordings made by devices of the same make and model. As the inter-‐
variability increases, it becomes increasingly easier to distinguish between
recordings coming from different devices. In the same manner, as intra-‐variability
decreases, it becomes more difficult to distinguish between these recordings. It may
also be possible to determine if a recording has been edited by measuring the DC
offset at frequent intervals in a recording.

7
2. Prior Research
DC offset is a relatively unexplored form of measurement when used in forensic
analysis, and there have only been a few studies on its effectiveness when used in
audio forensics. The primary contributors in this line of research are Bruce Koenig,
Doug Lacey, Catalin Grigoras, Jeff Smith, and Suzana Galic Price who have had their
research published in the field of audio forensics and DC offset research.[2][3]
Furthermore, a poster presentation was given by the Author at the 46th Audio
Engineering Society (AES) International Conference held in Denver, Colorado in
June of 2012.[4] To date, there have been three research studies specific to DC offset
in digital audio recordings, two published and one a white paper awaiting
publication; all were conducted using handheld digital audio recorders.
2.1 Nine Digital Recorders
The first published research study, Evaluation of the Average DC Offset Values for
Nine Small Digital Audio Recorders, was conducted by Koenig et al. The nine devices
tested were:
• Olympus DS-‐330 • Olympus SME DM-‐40 • Olympus VN-‐3100PC • Olympus VN-‐8100PC • Olympus WS-‐600S • Olympus WS-‐700M • Philips LFH0642/27

8
• Sony ICD-‐PX312 • Sony ICD-‐UX512
These recorders were given all new batteries, date and time were set, all recording
modification features were switched off, microphone sensitivity was turned to the
highest setting, and internal memory was chosen to store the recordings. Four input
sources were selected for each recorder: the internal microphone, two different
external microphones, and no input by using a dummy plug inserted into the
microphone jack. Ten tests were conducted using these settings listed in Table 1.
Table 1 -‐ Ten Microphone Setups
Test
Microphone(s) Audio Input Analyzed Length (sec)
1 None N/A 60 2 Internal Live Male Talker 60 3 Sony ME52W Pre-‐Recorded Male Talker 60 4 Sony ME515 Pre-‐Recorded Male Talker 60 5 None N/A 60 6 Internal Pre-‐Recorded Male Talker 60 7 Sony ME52W Pre-‐Recorded Male Talker 60 8 Sony ME515 Pre-‐Recorded Male Talker 60 9 None N/A 60 10 Internal FM News Radio 1200
The initial test by Koenig et al. compared the DC offset mean calculated by five
programs, and measured in multiple formats. It was found that only MATLAB and a
WinHex script designed to analyze audio sample amplitudes were able to provide
accurately measured values, and that the offset should be measured in QL values for
best accuracy. Further testing revealed that SD values for amplitude of a recording

9
most likely vary dependent on the audio information being recorded. It was also
found that microphone identification would probably not be possible due to very
small variations between the average DC offset values when comparing recordings
made with the same microphone and with different microphones. Additionally, the
SDs of the DC offsets between the nine recorders were inconsistent. It was
recommended by the authors that further tests were needed for recordings made in
different environments, with longer record times, and using more microphone and
recorder pairings.[5]
2.2 Audio Compression Algorithms
The poster presentation by Fuller, How Audio Compression Algorithms Affect DC
Offset in Audio Recordings, tested the following five handheld digital audio
recorders:
• Alesis PalmTrack • Olympus DM-‐520 • Olympus WS-‐700M • Tascam DR-‐07 • Zoom H2
This research tested how transcoding from 44.1 kHz/16-‐bit WAV PCM to the MP3
(MPEG-‐1/MPEG-‐2 Audio Layer III) and WMA (Windows Media Audio) formats
might affect DC offset. Adobe Audition was used for transcoding, and MATLAB was
used to for all calculations and measurements. Three recordings were made using
each recorder in a relatively silent environment for a total of 15 recordings.

10
Audition was then used to remove handling noise from the beginning and end of the
recordings, and for transcoding the audio files. The files were transcoded into both
constant bit rate (CBR) and variable bit rate (VBR) MP3s and WMAs. The encoding
settings were as follows:
Table 2 -‐ Transcoding Formats
Encoding Type Bit Rates Sample Rates Bit Depth Quality Rating CBR MP3 32-‐320 kbps 11,025 – 44,100 Hz N/A N/A VBR MP3 N/A N/A N/A 10-‐100 CBR WMA 32-‐320 kbps 44,100 Hz 16 bit VBR WMA N/A 44,100 Hz 16 bit 10-‐98
Because MATLAB only works with audio in the WAV format, the recordings had to
be transcoded back to 44.1 kHz/16-‐bit WAV PCM. The average DC offset for each
recording was calculated using the three DC offset means of the three original WAV
recordings. Next, the DC offset mean was calculated for all transcoded recordings,
and the values were plotted for each recorder and encoding type. An example can
be seen in Figure 3 showing the three recordings’ DC offset means as solid lines, and
their subsequent values when transcoded to all CBR MP3 settings. Similarly, the SD
of the amplitude was calculated for all transcoded recordings, and it was found
transcoding did not affect the waveform amplitude. The SD of the DC offset mean
values was calculated per recorder and encoding type to determine the variance
around the average DC offset mean. The final calculation took the maximum
difference between the DC offset mean for each pairing of recorder and encoding

11
type. Upon comparison of all measurements and calculations, the following
conclusions were presented:[6]
• Waveform amplitude is negligibly affected by audio compression algorithms • DC offset is slightly affected by audio compression algorithms with the effects
increasing as the quality decreases. • The amount the audio compression algorithms affected the recordings varied
between recorders • The effects on the DC offset by the audio compression algorithms were
relatively small with all but one DC offset mean having a difference of less 0.5 QL from the original WAV recordings.
• DC offset should be used for exclusionary purposes in forensic analysis
Figure 3 –Alesis PalmTrack – WAV & 35 MP3 CBRs -‐ DC Offset Means
2.3 Acoustic Consistency
Koenig and Lacey’s most recent study, The Average DC Offset Values for Small Digital
Audio Recorders in an Acoustically-‐Consistent Environment, is a follow-‐up to the

12
research discussed in 2.1 Nine Digital Recorders. In this research, the same nine
devices were tested, and the following conditions were employed for all recordings:
• 30 minute recordings • The same acoustic environment • The same audio information • Consistent microphone positions
This is an improvement from the prior study, as a known base for comparison is
established for all recordings made under these particular conditions. Five audio
formats were tested, and the average DC offset mean per recorder and their SDs
were taken for 1-‐, 2-‐, 3-‐, 6-‐, 10-‐, 15-‐, and 30-‐minute segments.
The SD values for all nine recorders as well as for six of the recorders, excluding the
three oldest, were combined and averaged, and these values were plotted over time.
Figure 4 shows that after approximately 10 minutes the variation in the SD begins to
level off. The authors concluded that, among the tested recorders and settings, the
majority of the DC offset values had a very limited range of -‐0.59104 to 0.01604
except for the recorders capable of recording in the DSS (Digital Speech Standard)
format. Additionally, differentiating between recordings made using the recorders
and settings in this range would be extremely difficult. It was also found that SD
decreased as recording length increased, and the SD dropped more than 75% from
the 30-‐second recordings to the 30-‐minute recordings. Furthermore, variations in
the SD by plus or minus 1 QL were typical for approximately 68% of the recordings,
and this percentage jumped to 99.7% for variations of plus or minus 3 QLs. Among

13
the formats tested, only DSS and ADPCM (Adaptive Differential Pulse-‐Code
Modulation) had SD values that remained relatively high compared to the other
formats. It was concluded that this is probably due to being older digital audio
formats.
Figure 4 – Average Standard Deviation Versus Time
The final conclusions of this study point to previous mentioned assertions that DC
offset should only be used for exclusionary purposes, and that DC offset values
should remain consistent if the recording environment and settings for a recorder
do not change. It is also noted that duplicating the conditions of a recording when
creating an exemplar for forensic examination may be very difficult due to factors
such as the environment, speech amplitude, the original recorder, location of sound

14
sources, etc. The authors recommend that further studies be conducted in different
environments, enabling various recording features such as voice activation, using
different recorder and microphones, changing the placement of the source and/or
recorder, using multiple copies of the same make of recorder.[7]

15
3. Materials and Methodology
To determine the uniqueness of DC offset among iDevices, multiple models were
selected for this research, and multiple input sources and apps were used to make
the audio recordings. Three mono input sources and seven apps were chosen to test
their possible affect on the DC offset present in seven iDevices. In addition to each
iDevice’s built-‐in microphone, the EarPods included with the iPhone 5 and the Apple
Earphones, both employing a remote and microphone, were chosen as external
microphones. Additionally, a third party electret microphone, the Olympus ME15,
was chosen for testing, but could not interface correctly with any of the iDevices,
and was excluded from further testing. The seven selected iDevices were as follows:
• iPhone 5 • iPhone 4S • iPhone 4 • iPhone 3GS • iPad 2 • iPad 1 • iPod Touch 2nd Generation
Along with the iOS included Voice Memos and Camera apps, five third party apps
were selected for testing:
• SuperNote by ClearSky Apps • VoiceRecord by BejBej Apps • QuickVoice by nFinity Inc • iTalk by Griffin • MicPro by 24/7 Apps
These apps were chosen for a number of reasons:

16
• They were free • They were relatively popular on the App Store • They could export recorded audio
The primary reason for multiple apps was to test if any differences in digital signal
processing (DSP) might affect the DC offset. It should be noted that certain iDevice
models are not capable of running some of these apps due to hardware and software
limitations. The iPad 1 and iPod Touch do not contain a built-‐in camera, so the
Camera app does not appear on these models. Both the iPad 1 and iPad 2 do not
come with the Voice Memos app, as it is not included in their iOS software bundle.
Finally, the iPod Touch is only capable of recording audio by means of an external
microphone, as there is no built in microphone in the 2nd generation iPod Touches.
Table 3 lists the various iOS software versions per iDevice.
Table 3 -‐ iOS Software Versions
iDevice iOS Version iPhone 5 6.1.2 iPhone 4S 6.1.2 iPhone 4 6.0.1 iPhone 3GS 6.1.2 iPad 2 6.1.2 iPad 1 5.1.1 iPod Touch 4.2.1
Before the bulk of audio was recorded, each app was tested for any possible changes
it might make to the DC offset. These tests revealed that both the Voice Memos and
Camera app apply DSP at some stage in the recording process that removes the DC
offset from recordings. Further testing of the third party apps revealed that only

17
SuperNote and MicPro did not use DSP to remove the DC offset. Once these results
were discovered, the next step was to determine whether or not the DC offset was
affected by these two apps. Initial testing revealed that both apps exhibited very
similar results when making test recordings in the same environment and for
approximately the same length of time. It was concluded that one app, SuperNote,
would be selected to perform the rest of the test recordings. The following sections
will discuss these results along with all other tests. SuperNote was selected for its
ability to easily name and export recordings as well as having smaller file sizes due
to a lower sampling rate of 16 kHz. Additionally, the iPod Touch was found to be
useless for any further testing, as the version of iOS running on it was not
compatible with any of the third party apps, and the iOS apps use DSP to remove the
DC offset.
Prior to recording, all iDevices were fully charged to ensure proper power
distribution, and all apps were closed save for the one performing the recording.
Additionally, Airplane Mode was enabled to ensure no outside connectivity could be
made during the recording process, and Auto-‐Brightness was turned off. An
approximately twenty-‐five minute long recording was made per each iDevice and
microphone pairing. This recording length was chosen based on the previously
mentioned research study where it was found that fluctuation in the SD reduced as
recording length increased, and the SD dropped significantly for recordings over 10
minutes in length.[8] Accordingly, the DC offset mean for longer recordings will be

18
more consistent than for shorter recordings when acquired from the same recorder,
settings, and environment.
The recordings were made in a near-‐ideal acoustic environment to minimize the
possibility of any transients, voices, external noises, etc. being introduced into the
recording process. To achieve this, a small room was selected that contained many
acoustically absorbent materials, the lights were turned off to avoid florescent hum,
and studio-‐grade acoustic foam was used to surround the various iDevices.
Furthermore, the iDevices were placed as close together as possible, and not moved
during the entire recording process. For all recordings made using the iDevices’
built-‐in microphones, recordings were made simultaneously. For recordings made
using the external microphones, only three iDevices could be used at a time, as there
were only one set of EarPods, and two sets of Earphones available for testing. The
recordings made to determine if SuperNote and MicPro affect the DC offset were
made using the iPhone 5 and its built-‐in microphone. These recordings were
approximately 2 minutes in length, and recorded in the same conditions. It should
be noted that some audio recording apps allow for a recording to be paused and
continued ad infinitum, but this function was not tested due to the DC offset possibly
being affected by handling noise and DSP.
After the recording process was complete, the recordings were transferred to a
Windows workstation running MediaInfo, WinHex, Adobe Audition 3.0.1 and

19
MATLAB r2010b Version 7.11.0.584. MediaInfo and WinHex were necessary to
determine recording format information, Audition was needed to perform minor
editing and conversion to WAV, and MATLAB was used for processing the WAV files
and performing all scientific calculations. iTunes and iPhoto were capable of
transferring the recordings made with Camera and Voice Memos, but were unable to
transfer any of the third party apps’ recordings. To retrieve these recordings, some
of the apps were capable of creating a private network to share their recordings,
including SuperNote, and others had to send their recordings by email. Once all test
recordings were retrieved, their recording formats were examined in MediaInfo.
WinHex and Audition were used to confirm these findings. The results can be seen
in Table 4.
Table 4 -‐ Recording Formats
App Format Sample Rate Bit Rate Channels Camera MPEG-‐4, AAC 44.1 kHz 63 kb/s Mono Voice Memos MPEG-‐4, AAC 44.1 kHz 63 kb/s Mono SuperNote AIFF, ADPCM 16 kHz 64 kb/s Mono iTalk AIFF, PCM 44.1 kHz 705 kb/s Mono Voice Record MPEG-‐4, AAC 48 kHz 108 kb/s Mono MicPro AIFF, ADPCM 44.1 kHz 352 kb/s Stereo QuickVoice CAF 16 kHz 256 kb/s Mono
Adobe Audition was then used to truncate any handling noise at the beginning and
end of the recordings. To prevent inaccuracies when calculating the DC offset, these
edits were performed at or as close to zero-‐crossings as possible. To make sure the
transcoding process did not affect the DC offset, a test recording was analyzed with

20
Audition. This test recording had the DC offset measured in Audition prior to
transcoding, and then measured again once transcoded. Measuring the DC offset in
Audition was necessary, as MATLAB does not work with any of the apps’ recording
formats. However, it should be noted that Audition calculates the offset value as a
percentage, and was only used for determining if transcoding adversely affects DC
offset. It was then determined that transcoding in Audition would not change the
audio files, so all recordings were converted to WAV and brought into MATLAB for
measurements and calculations. The edited SuperNote recordings were converted
to 16 kHz/16-‐bit/mono WAV PCM uncompressed files. The MicPro recordings were
converted to 44.1 kHz/16-‐bit/mono WAV PCM uncompressed files, as their native
sample rate is 44.1 kHz.
The two main types of calculation performed were mean and SD. The mean is
simply calculated by summing all QL values and dividing by the number of samples.
SD is calculated as the square root of the variance. Figure 5 shows the formula used
to calculate the SD. The variance is found by taking the difference between each
sample’s QL and the DC offset mean, squaring each value, summing the resultant
values, and then averaging the sum. Once calculated, the SD allows us to find the
‘normal’ range of values for a particular set of values. When calculating the SD of
amplitude for a recording made in a silent environment, values that fall outside of
this range would be loud transient sounds such as claps, door slams, coughs, etc.

21
Figure 5 -‐ Formula for Standard Deviation
A script was written in MATLAB that calculated the following information:
• Plot of the waveform • The DC offset • The SD of the amplitude • The minimum and maximum amplitude • Plots of the DC offset values for four window sizes
o 5-‐seconds o 10-‐seconds o 30-‐seconds o 1-‐minute
• The mean for these four sets of DC offset values • The SD for these four sets of DC offset values • The minimum and maximum of these 4 sets of DC offset values • Histogram plots of the amplitude and 4 sets of DC offset values • Plots of the SD of the amplitude in four window sizes
o 5-‐seconds o 10-‐seconds o 30-‐seconds o 1-‐minute
All this information can be seen in the plots found in Appendix: Plots and
Measurements. The following sections analyze the results of these tests, and make
in depth comparisons between the various iDevices as well as the results found in
previous studies of digital audio recorders.

22
4. Results
4.1 SuperNote Versus MicPro
To begin with, it was necessary to make comparisons between recordings made by
SuperNote and MicPro to determine whether or not the apps would have any effect
on the DC offset introduced onto a recording. Two recordings were made per
recorder, approximately two minutes in length, and all truncations and transcoding
were performed as previously mentioned in 3 Materials and Methodology.
MATLAB was then used to calculate the DC offset and SDs, and the resulting values
can be referenced below in Figure 6 and Figure 7. It should be noted that the
recordings made with SuperNote were slightly shorter than those made by MicPro,
and after truncating handling noise, the length of the second SuperNote recording
dropped below two minutes. This resulted in the inability to calculate an SD value
for the DC offset in 1-‐minute window because there was only one full window, and
can be seen in Figure 7. Appendix: Plots and Measurements can be referenced for
visual comparison between the plots for these four recordings. Based on the results
of the calculations performed, it was found that there were no significant differences
between the recordings to necessitate making further recordings with both devices.
All subsequent recordings were made using SuperNote.

23
Figure 6 -‐ DC Offset Mean and in Windows -‐ SuperNote vs. MicPro
Figure 7 -‐ SD of DC Offset Windows and QL -‐ SuperNote vs MicPro
4.2 DC Offset and Standard Deviation

24
Figure 8 -‐ DC Offset Mean -‐ Built-‐In vs External Microphones
Figure 9 -‐ SD of Amplitude -‐ Built-‐In vs External Microphones
Figure 8 and Figure 9 graph the DC offset mean and SD of the amplitude, and can be
used for comparisons between the recordings made with the built-‐in microphones

25
and external microphones. When reading Figure 8, make sure to note that the y-‐axis
is flipped for easier comprehension. We separate the values for the internal
microphone from the external microphones because the external microphones may
induce their own effects onto the recorded audio signal. When looking at these two
figures, we see that the DC offset mean is higher for all recorders using the built-‐in
microphone except for the iPhone 3GS, which is approximately 5 QL higher, and all
SD values are lower for the external microphones. All SD values are relatively close
except for the recordings made with two iPads when using their built-‐in
microphones. This is most likely attributed to slightly higher overall amplitudes in
these two recordings.
4.3 Calculations Based on Window Sizes
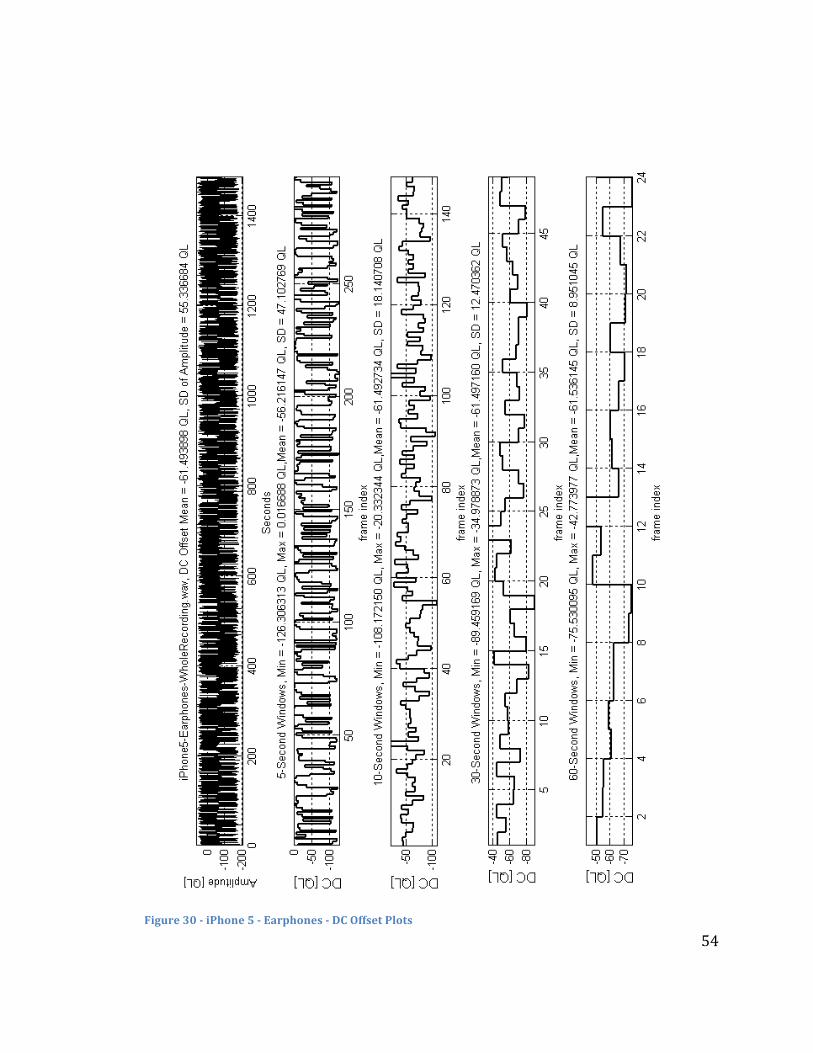
In addition to measuring the DC offset and SD over an entire recording, it is
important to look at how these values change over time, and how the accuracy of
these measurements change depending on the size of the data measured. For this
study, calculations were made using 5-‐, 10-‐, 30-‐, and 60-‐second DC offset mean
window sizes, whose plots can be seen in Appendix: Plots and Measurements.
Additionally, the SD, mean, minimum, and maximum values were calculated per
window size. Initial results found that as the window size increased, the SD
significantly dropped, and can be seen in Figure 10. This drop in the SD indicates
that increased window sizes can provide more accurate results. Furthermore, we

26
can see that the SD dropped uniformly for all the iDevice and microphone pairings.
When averaged, the SD of the DC offset in 1-‐minute windows came to 5.8148 QL.
Figure 10 -‐ SD of DC Offset Windows
Accordingly, the minimum and maximum values for the DC offset per window size
decreased as the window size increased. In addition, the mean of the DC offsets per
window size stayed very close to the DC offset mean value per recording except for
the 5-‐second window values. Figure 11 shows of these results with the x-‐axis going
from lowest to highest DC offset mean. This tells us that measuring the DC offset in
windows will result in relatively consistent values independent of window size.

27
Figure 11 -‐ DC Offset Mean and for Windows
The SD of the amplitude for these recordings stayed relatively consistent, as can be
seen in Figure 12, where the SD fluctuates around the average SD value of 54.8000
QL by a few QLs when measured in 1-‐minute windows. Analogous results were
found for the majority of the recordings, and only the recording made using the iPad
2 and built-‐in microphone had much larger fluctuations, as seen in Figure 13. This
may be attributed to the amplitude of the audio signal slightly decreasing over time.
Further examples for all recordings, including 5-‐, 10-‐, 30-‐, and 60-‐second window
plots, can be observed in Appendix: Plots and Measurements.

28
Figure 12 -‐ SD at 1-‐Minute Intervals -‐ iPhone 5 – EarPods
Figure 13 -‐ SD at 1-‐Minute Intervals -‐ iPad 2 -‐ Built-‐In
4.4 Histograms
Histograms were made for the amplitude and for the DC offset mean per window
size. Correlations can be made between the minimum and maximum QL values for
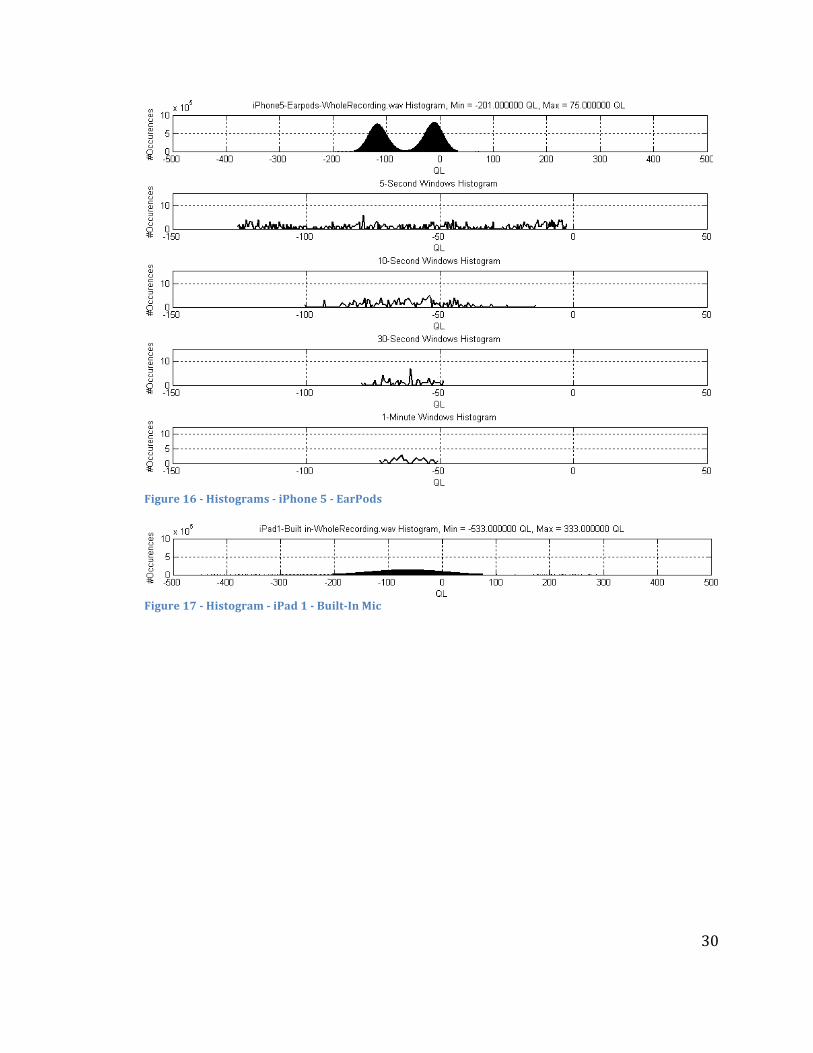
these sets of data, by comparing the histograms seen in Figure 16 against the values
found in Figure 18 for the iPhone 5. Furthermore, the minimum and maximum QL
values of each recording are included with the histogram of the amplitude, and
correlate to the plot of the waveform as seen in Figure 14. Like results can be seen
when comparing the plots indexed in Appendix: Plots and Measurements.
Figure 14 -‐ iPhone 5 -‐ EarPods – Waveform

29
When viewing the waveform seen above in Figure 14, we can observe that it does
not oscillate uniformly. A more obvious example can be seen in Figure 15 of a
shorter recording made by the iPhone 5 using the built-‐in microphone, where there
appears to be two main QL distributions. The histogram plot of the waveform, as
seen in Figure 16, verifies this irregular fluctuation, and shows us two primary
peaks. Depending on the iDevice and microphone pairing, the histogram plot of the
amplitude changes between the various recordings. The recordings made using the
built-‐in microphone all exhibited a histogram with a wide distribution rather than a
strong peak, as seen in Figure 17. Only recordings made with the external
microphones exhibited a histogram containing two peaks, and not all iDevices
revealed these results. Both the iPhone 4S and iPad 2 had wide histograms for all
three microphone pairings. These results can be further observed in Appendix:
Plots and Measurements. It should be noted that test recordings were made to
examine if these irregular fluctuations in the waveform oscillation remain in
recordings where higher amplitude information is being recorded, but it could not
be determined due to the density of the waveform.
Figure 15 -‐ iPhone 5 -‐ Built-‐In – Waveform
30
Figure 16 -‐ Histograms -‐ iPhone 5 -‐ EarPods
Figure 17 -‐ Histogram -‐ iPad 1 -‐ Built-‐In Mic

31
5. Comparisons and Conclusions
For the following sections, refer to Appendix: Plots and Measurements for easier
comparison between the recordings’ plots.
5.1 DC Offset
The most apparent similarity between the DC offset mean values is that they all
occur between -‐70.4947 and -‐60.0564 QL, and as mentioned before tend to be
higher for the built-‐in microphones. In the studies described in 2 Prior Research,
DC offset mean values were measured for a total of 14 recorders, with values
ranging from approximately -‐64.538 QL to 23.444 QL between them.[9][10][11]
This establishes a baseline for comparison, and lets us know that there can be
overlap between various types of digital audio recorders. However, while this range
technically encompasses multiple devices, it is actually the result of multiple test
recordings made using an Olympus DS-‐330 in the DSS format.[12] This particular
recorder, as well as the DSS format, exhibits an extremely wide range of offset
values between its various recording settings, while other devices tested in these
different studies were much more consistent and actually comprised a much smaller
range. Excluding the DS-‐330 and Olympus SME DM-‐40 recorders’ DC offset means
when using the DSS format, the range dropped between -‐10.2495 and 11.30 QLs for
all other recorders tested in these studies. The following two tables show the
results of this previous research found by Koenig et al. for these two recorders using

32
the DSS format with the results outside the non-‐DSS range highlighted in
red.[13][14] The majority of the DC offset mean values for these devices varied even
less, and fell within a range of less than 5 QL values of 0 QL.[15][16][17]
Table 5 -‐ DS-‐330 DC Offset Mean – Inconsistent Environment
Test/Mode/Mic DC Offset Mean T1/DSS-‐SP/NoMic -‐5.575 T1/DSS-‐LP/NoMic -‐1.292 T2/DSS-‐SP/IntMic 15.787 T2/DSS-‐LP/IntMic -‐64.538 T3/DSS-‐SP/ME52WMic 16.062 T3/DSS-‐LP/ME52WMic -‐20.591 T4/DSS-‐SP/ME51SMic 22.307 T4/DSS-‐LP/ME51SMic -‐37.458 T5/DSS-‐SP/NoMic -‐5.535 T5/DSS-‐LP/NoMic -‐1.260 T6/DSS-‐SP/IntMic 12.914 T6/DSS-‐LP/IntMic 4.201 T7/DSS-‐SP/ME52WMic 6.932 T7/DSS-‐LP/ME52WMic 23.444 T8/DSS-‐SP/ME51SMic 6.662 T8/DSS-‐LP/ME51SMic 0.054 T9/DSS-‐SP/NoMic -‐5.516 T9/DSS-‐LP/NoMic -‐1.256 T10/DSS-‐SP/IntMic -‐5.601 T10/DSS-‐LP/IntMic -‐10.919
Table 6 -‐ DS-‐330 and SME DM-‐40 DC Offset Mean -‐ Consistent Environment
Recorder Mode DC Offset Mean DS-‐330 SP 4.21283
LP -‐34.28392 SME DM-‐40 SP 5.78800
LP -‐36.38407

33
Along with the average DC offset for the entire length of the recording, we must look
at it over shorter periods of time, as it is possible that a recording coming in for
forensic examination may be closer to one minute rather than twenty or more.
Figure 18 shows how the DC offset varies between the four different window sizes.
Upon inspection of these plots, as well as the other plots found in Appendix: Plots
and Measurements, it becomes apparent that there is variation in the DC offset
over time despite the relative consistency in the amplitude of the audio waveform.
Figure 18 -‐ iPhone 5 -‐ EarPods -‐ DC Offset Plots
When observing the amount of fluctuation between these windows in Figure 18, we
see offset values ranging between -‐125.8323 QL and -‐2.9099 QL for the 5-‐second
windows, and the range is reduced between -‐69.3397 QL to -‐46.8481 QL for 1-‐

34
minute windows. Despite this wide fluctuation, the different windows’ mean values
remains relatively consistent between the various iDevice and microphone pairings
when compared to the corresponding DC offset mean of the recordings’ amplitude.
This can be confirmed by the graph seen in Figure 11.
This points us towards the observation that larger windows provide stronger
results. However, there is most likely an ideal window size. When comparing the
DC offset mean values for all recordings against the mean for their correlating
window sizes we find that there is very little variation among the values. The
largest difference found was approximately 6 QL between the DC offset mean of the
iPad 1 and Earphones pairing and the 5-‐second window mean value. Two other
differences were found of approximately 5 QL, and occurred between the DC offset
mean of the iPhone 5 and Earphones pairing, and the DC offset mean of the iPhone
3GS and EarPods pairing when compared against their respective 5-‐second window
mean values. This can be confirmed in Figure 11 as the line graph of the 5-‐second
window mean values significantly deviates from the other four lines. With this in
mind, it becomes apparent that we should use window sizes greater than five
seconds. When looking at the difference between the DC offset mean and the other
three window sizes, we observe a much smaller difference with the largest value
being 0.5338 QL when comparing the DC offset mean of the iPad 1 built-‐in
microphone recording against the 1-‐minute window mean value.

35
5.2 Standard Deviation
In addition to measuring the DC offset for a recording, it is also very important to
measure the SD of this offset as it changes over time and the SD of the amplitude.
Calculating the SD of the DC offset over time allows us to observe the amount of
intra-‐variability that occurs in the DC offset of the recording, and lets us determine
the usefulness of the DC offset value for forensic examination. If intra-‐variability is
low, then the DC offset will remain relatively consistent throughout a recording.
This allows the DC offset mean value to be useful in forensic examination as the
value should be consistent for all recordings made by a particular recorder and
microphone combination. DC offset may not be useful for a recording that exhibits
high intra-‐variability throughout a recording, as the DC offset amount may
irregularly fluctuate within a wide range of values. The SD of the amplitude was
calculated to corroborate that the recordings were all made under the same
laboratory conditions. Therefore the range of the recordings’ amplitudes should all
be relatively close, and their SDs should be very similar in value. It is recommended
that SD of the amplitude be excluded from forensic examination due to its
dependence on the recorded audio signal.
In 4.3 Calculations Based on Window Sizes, it was observed that the SDs of the
four DC offset window sizes decreased as the window size increased, and this was
consistent for all iDevices. It was found that the average SD of the 1-‐minute DC
offset windows came to 5.8148 QL, and the range of these values was spread

36
between 3.2788 and 9.5896 QL. This consistency indicates that the intra-‐variability
of each iDevice’s DC offset should remain relatively low, and as such makes the DC
offset mean useful in forensic examination. In correlation with the values measured
for the DC offset mean and average per window size, as seen Figure 11, it appears
that the 1-‐minute window size may be the most valuable in forensic examination,
and that the 5-‐second window size is too small to provide useful results. It was also
observed that the SD values when using the Earphones were higher for all
recordings except for the iPad 2. This indicates that the Earphones may have the
most adverse effect of the DC offset independent of the recording device.
In previous studies, the largest SD of the DC offset mean values was found to be
19.49 QL for the Olympus DS-‐330.[18] This indicates that the DC offset in iDevices is
significantly different than that found in these previously tested digital audio
recorders. Furthermore, all other SDs found in these previous studies were much
lower than those found for the Olympus DS-‐330. Unfortunately, these values were
calculated in a different manner than in this study, and as such cannot be directly
compared to the results found here.
5.3 Histograms
In Appendix: Plots and Measurements, we can observe and compare histogram
plots from all the recordings. These histograms provide visual correlation between
the DC offset, and the SD. All amplitude and DC offset window histograms have the

37
same respective X and Y scale so they may be viewed and compared with greater
ease and in equal proportion. The histograms that contain two peaks correlate with
the waveforms that appear to have two main QL distributions such as that seen in
Figure 16. As mentioned before, the histograms that do not have two peaks have a
wide distribution rather than a strong peak.
The most apparent observation that can be drawn from the DC offset window
histograms is the relatively wide dispersion of the values. For all window sizes,
there are no particularly strong reoccurring values. However, as the window size
increases these values become less spread out, and tighten around the DC offset
mean value. Correlation can be seen between this trend and the corresponding
plots of the DC offset windows and their minimum, maximum, mean, and SD values.
Furthermore, the amplitude histograms, which contain two peaks, are relatively
equally spread around the DC offset mean value. These histograms containing two
peaks correlate with the waveforms that have two strong QL distributions, and
examples can be seen when comparing the plots for the iPhone 5, 4, and 3GS and
iPad 1 when using the external microphones.
5.4 Conclusions
The measurements and comparisons conducted in this research point to a few main
conclusions regarding the use of DC offset in forensic examination, and whether or

38
not iDevices exhibit any unique traits when compared with other digital audio
recorders. With respect to previous findings that DC offset traits can be similar
across multiple recording devices, it is still recommended that any measurements
be only used for exclusionary purposes. Furthermore, when used in the forensic
examination of audio, these tests should only comprise a part of the analysis, and
many other forms of inquiry should be performed such as spectral analysis,
waveform analysis, ENF analysis, long-‐term average spectrum (LTAS), compression
level analysis (CLA), etc.[19]
For all tested iDevices, it was found that the DC offset mean remained relatively
consistent between the various iDevice and microphone pairings. Similarly, the SD
of the amplitude for these recordings fell within a comparably small range, save for
the iPad 2 when using the built-‐in microphone, which indicates that all recordings
had very similar recorded audio signal amplitudes. When measured in 1-‐minute
windows, it was found that the SD of the DC offset had very minor variations among
the tested iDevices. These findings lead to the conclusion that there should be
relatively low intra-‐variability of the DC offset values between recordings made by
the tested iDevices. When compared with measurements taken from previous
research, we can conclude that these iDevices are relatively unique as there is nearly
zero overlap when comparing DC offset and SD values. It can also be said that while
having a relatively low intra-‐variability between iDevices, there is a high inter-‐
variability when compared to other devices. Furthermore, the low intra-‐variability

39
of the DC offset mean and SD values will likely increase as the recording length
becomes shorter. Finally, it should be noted that certain iDevice and microphone
pairings might be more identifiable when analyzing the histogram of their QLs.
5.5 Additional Notes & Future Research
While many of the apps tested in this research used DSP to perform DC offset
removal, they still exhibit an extremely small amount of offset due to the complexity
of the resulting recorded waveform. There may also be other visible effects of the
recording process when viewing the waveform. For example, a video recording
made with the Camera app will result with an audio waveform that does not actually
begin at the first sample. In effect this means that the waveform remains at a
constant 0 QL until the app starts feeding audio information into the video
recording. Such manifestations may be useful when trying to identify a particular
recording, and further research needs to be conducted on this issue.
As with any research, there is always the need to conduct more studies. This is
especially true for DC offset, as it is a relatively unexplored form of measurement
when used in the forensic examination of digital audio recordings. One of the most
important parts of the research of DC offset is making test recordings with as many
devices as possible, and there are a plethora of devices that have yet to be tested.
This is compounded by the possibility of numerous recording settings and formats

40
per recording device. Since a large portion of the population owns mobile phones
and other devices capable of recording audio, it is important to test devices that are
not typical handheld digital audio recorders. In addition to the iDevices tested in
this research, there are still many more that are capable of recording audio as well
as a numerous other smart phones.
Along with the need to test new devices, real world examples need to be taken into
account. Ideal conditions will not be the norm when digital audio evidence is being
tested in a forensic lab, and research must be conducted that addresses this issue.
One such study has been performed, but concluded that a wide variety of tests still
need to be performed in a variety of environments, with longer recording lengths,
and with a larger variety of recorders and microphones.[20] This thesis expands on
these ideas by testing a number of new recording devices, and making recordings at
longer lengths. However, research still needs to be done with recordings that mimic
real world conditions that include room noise, handling noise, start and stops, etc. It
may also be beneficial to test how the energy going into a recorder may affect the DC
offset. The type of battery, the charge of a battery, and if the recorder is powered by
an AC power supply all might impose their own effects on a recorder.
In addition to testing new devices and in different environments, future research
should incorporate a wider range of calculations such as those used in this study.
The use of histograms can help analyze the range of DC offset values, and better

41
visualize the waveform for comparison. Measuring the DC offset and SD in windows
can let an examiner see how much fluctuation occurs throughout a recordings, and
can be useful in comparisons between other recorders and recordings. Along with
incorporating more calculations, the results of DC offset research should be
aggregated for easier use in forensic audio examination.

42
Appendix: Plots and Measurements
This section provides plots of the waveform, DC offset in windows, histograms of the
amplitude and DC offset in windows, and SD of the amplitude in windows for all
recordings. Along with these plots, various calculated values are included per
recording. Among these are, the values for the DC offset mean, SD of the amplitude,
the mean of the DC offset values for the various window sizes, the SD of these offset
values, and minimum and maximum values for the amplitude and the DC offset
values in windows.

43
Figure 19 -‐ SuperNote -‐ Test 1 -‐ DC Offset Plots

44
Figure 20 -‐ SuperNote -‐ Test 1 -‐ Histograms

45
Figure 21 -‐ SuperNote -‐ Test 2 -‐ DC Offset Plots

46
Figure 22 -‐ SuperNote -‐ Test 2 -‐ Histograms

47
Figure 23 -‐ MicPro -‐ Test 1 -‐ DC Offset Plots

48
Figure 24 -‐ MicPro -‐ Test 1 -‐ Histograms

49
Figure 25 -‐ MicPro -‐ Test 2 -‐ DC Offset Plots

50
Figure 26 -‐ MicPro -‐ Test 2 -‐ Histograms

51
Figure 27 -‐ iPhone 5 -‐ Built-‐In -‐ DC Offset Plots

52
Figure 28 -‐ iPhone 5 – Built-‐In -‐ Histograms

53
Figure 29 -‐ iPhone 5 -‐ Built-‐In -‐ SD Windows
54
Figure 30 -‐ iPhone 5 -‐ Earphones -‐ DC Offset Plots

55
Figure 31 -‐ iPhone 5 -‐ Earphones -‐ Histograms

56
Figure 32 -‐ iPhone 5 -‐ Earphones -‐ SD Windows

57
Figure 33 -‐ iPhone 5 -‐ EarPods -‐ DC Offset Plots

58
Figure 34 -‐ iPhone 5 -‐ Earpods -‐ Histograms

59
Figure 35 -‐ iPhone 5 -‐ EarPods -‐ SD Windows

60
Figure 36 -‐ iPhone 4S -‐ Built-‐In -‐ DC Offset Plots

61
Figure 37 -‐ iPhone 4S -‐ Built-‐In -‐ Histograms

62
Figure 38 -‐ iPhone 4S -‐ Built-‐In -‐ SD Windows

63
Figure 39 -‐ iPhone 4S -‐ Earphones -‐ DC Offset Plots

64
Figure 40 -‐ iPhone 4S -‐ Earphones -‐ Histograms

65
Figure 41 -‐ iPhone 4S -‐ Earphones -‐ SD Windows

66
Figure 42 -‐ iPhone 4S -‐ EarPods -‐ DC Offset Plots

67
Figure 43 -‐ iPhone 4S -‐ EarPods -‐ Histograms
68
Figure 44 -‐ iPhone 4S -‐ EarPods -‐ SD Windows

69
Figure 45 -‐ iPhone 4 -‐ Built-‐In -‐ DC Offset Plots

70
Figure 46 -‐ iPhone 4 -‐ Built-‐In -‐ Histograms

71
Figure 47 -‐ iPhone 4 -‐ Built-‐In -‐ SD Windows

72
Figure 48 -‐ iPhone 4 -‐ Earphones -‐ DC Offset Plots

73
Figure 49 -‐ iPhone 4 -‐ Earphones -‐ Histograms

74
Figure 50 -‐ iPhone 4 -‐ Earphones -‐ SD Windows

75
Figure 51 -‐ iPhone 4 -‐ EarPods -‐ DC Offset Plots

76
Figure 52 -‐ iPhone 4 -‐ EarPods -‐ Histograms

77
Figure 53 -‐ iPhone 4 -‐ EarPods -‐ SD Windows

78
Figure 54 -‐ iPhone 3GS -‐ Built-‐In -‐ DC Offset Plots

79
Figure 55 -‐ iPhone 3GS -‐ Built-‐In -‐ Histograms

80
Figure 56 -‐ iPhone 3GS -‐ Built-‐In -‐ SD Windows

81
Figure 57 -‐ iPhone 3GS -‐ Earphones -‐ DC Offset Plots

82
Figure 58 -‐ iPhone 3GS -‐ Earphones -‐ Histograms

83
Figure 59 -‐ iPhone 3GS -‐ Earphones -‐ SD Windows

84
Figure 60 -‐ iPhone 3GS -‐ EarPods -‐ DC Offset Plots

85
Figure 61 -‐ iPhone 3GS -‐ EarPods -‐ Histograms

86
Figure 62 -‐ iPhone 3GS -‐ EarPods -‐ SD Windows

87
Figure 63 -‐ iPad 2 -‐ Built-‐In -‐ DC Plots

88
Figure 64 -‐ iPad 2 -‐ Built-‐In -‐ Histograms

89
Figure 65 -‐ iPad 2 -‐ Built-‐In -‐ SD Windows

90
Figure 66 -‐ iPad 2 -‐ Earphones -‐ DC Offset Plots

91
Figure 67 -‐ iPad 2 -‐ Earphones -‐ Histograms
92
Figure 68 -‐ iPad 2 -‐ Earphones -‐ SD Windows

93
Figure 69 -‐ iPad 2 -‐ EarPods -‐ DC Offset Plots

94
Figure 70 -‐ iPad 2 -‐ EarPods -‐ Histograms

95
Figure 71 -‐ iPad 2 -‐ EarPods -‐ SD Windows
96
Figure 72 -‐ iPad 1 -‐ Built-‐In -‐ DC Offset Plots

97
Figure 73 -‐ iPad 2 -‐ Built-‐In -‐ Histograms

98
Figure 74 -‐ iPad 2 -‐ Built-‐In -‐ SD Windows

99
Figure 75 -‐ iPad 2 -‐ Earphones -‐ DC Offset Plots

100
Figure 76 -‐ iPad 2 -‐ Earphones -‐ Histograms

101
Figure 77 -‐ iPad 2 -‐ Earphones -‐ SD Windows

102
Figure 78 -‐ iPad 2 -‐ EarPods -‐ DC Offset Plots

103
Figure 79 -‐ iPad 2 -‐ EarPods -‐ Histograms

104
Figure 80 -‐ iPad 2 -‐ EarPods -‐ SD Windows

105
References
1. National Communications Standard. (1996) Federal Standard 1037C: Bias. Retrieved April 2013, from http://www.its.bldrdoc.gov/fs-‐1037/dir-‐004/_0587.htm
2. Koenig, Bruce E. et al. (2012) Evaluation of the Average DC Offset Values for Nine Small Digital Audio Recorders. AES International Conference. Denver.
3. Koenig, Bruce E. and Lacey, Doug S. (2013). The Average DC Offset Values for
Small Digital Audio Recorders in an Acoustically-‐Consistent Environment. 4. Fuller, Daniel B. (2012) How Audio Compression Algorithms Affect DC Offset in
Audio Recordings. AES International Conference. Denver. 5. Koenig, Bruce E. et al. (2012) Evaluation of the Average DC Offset Values for Nine
Small Digital Audio Recorders. AES International Conference. Denver. 2-‐9. 6. Fuller, Daniel B. (2012) How Audio Compression Algorithms Affect DC Offset in
Audio Recordings. AES International Conference. Denver. 7. Koenig, Bruce E. and Lacey, Doug S. (2013). The Average DC Offset Values for
Small Digital Audio Recorders in an Acoustically-‐Consistent Environment. 8. Koenig, Bruce E. and Lacey, Doug S. (2013). The Average DC Offset Values for
Small Digital Audio Recorders in an Acoustically-‐Consistent Environment. 4-‐5. 9. Koenig, Bruce E. et al. (2012) Evaluation of the Average DC Offset Values for Nine
Small Digital Audio Recorders. AES International Conference. Denver. 5. 10. Koenig, Bruce E. and Lacey, Doug S. (2013). The Average DC Offset Values for
Small Digital Audio Recorders in an Acoustically-‐Consistent Environment. 4. 11. Fuller, Daniel B. (2012) How Audio Compression Algorithms Affect DC Offset in
Audio Recordings. AES International Conference. Denver. 12. Koenig, Bruce E. et al. (2012) Evaluation of the Average DC Offset Values for Nine
Small Digital Audio Recorders. AES International Conference. Denver. 5.

106
13. Koenig, Bruce E. et al. (2012) Evaluation of the Average DC Offset Values for Nine
Small Digital Audio Recorders. AES International Conference. Denver. 5. 14. Koenig, Bruce E. and Lacey, Doug S. (2013). The Average DC Offset Values for
Small Digital Audio Recorders in an Acoustically-‐Consistent Environment. 4. 15. Koenig, Bruce E. et al. (2012) Evaluation of the Average DC Offset Values for Nine
Small Digital Audio Recorders. AES International Conference. Denver. 5. 16. Fuller, Daniel B. (2012) How Audio Compression Algorithms Affect DC Offset in
Audio Recordings. AES International Conference. Denver. 17. Koenig, Bruce E. and Lacey, Doug S. (2013). The Average DC Offset Values for
Small Digital Audio Recorders in an Acoustically-‐Consistent Environment. 18. Koenig, Bruce E. et al. (2012) Evaluation of the Average DC Offset Values for Nine
Small Digital Audio Recorders. AES International Conference. Denver. 5. 19. Grigoras, Catalin. Rappaport, Daniel. Smith, Jeff M. (2012) Analytical Framework
for Digital Audio Authentication. AES International Conference. Denver. 20. Koenig, Bruce E. et al. (2012) Evaluation of the Average DC Offset Values for Nine
Small Digital Audio Recorders. AES International Conference. Denver. 9.