dc department of corrections facts and figures september 201o · 2018-11-21 ·...
TRANSCRIPT

DC Department of Corrections Facts and Figures
September 2018

FY 2013 FY 2014 FY 2015 FY 2016 FY 2017 FY 2018
$137M
$137M
$140M
$136M
$151M
$136M
$151M
$141M $147M
$152M
$146M
DC Department of CorrectionsOperating Budget and Net Expenditure
The Department of Corrections provides housing, security,and inmate services at the DOC facilities for some inmatesunder Federal jurisdiction and is reimbursed for such services.FY 2018 data reflects revised budget and estimatedexpenditures.Budget information and narratives can be accessed at:http://cfo.dc.gov
FY 2013 FY 2014 FY 2015 FY 2016 FY 2017 FY 2018
1,1621,247
894 937 939 932
Department of Corrections Full TimeEmployees
Security
Health
Inmate Support
Inmate Services
Facility
Executive
IT
Community Corrections
HR
Management
OCFO
62%
12%
7%
5%
3%
3%
2%
2%
2%
2%
1%
FY 2018 Budget by Service
6 < 7 8 9 10 11 12 13 14 15 >
24.5%
37.5%
12.4%
4.8%
7.9%6.1%
3.2%2.1%
0.8% 0.6%
FY 2018 FTE Distribution by Grade
Budget Expenditure
FY 2014 FY 2015 FY 2016 FY 2017 FY 2018
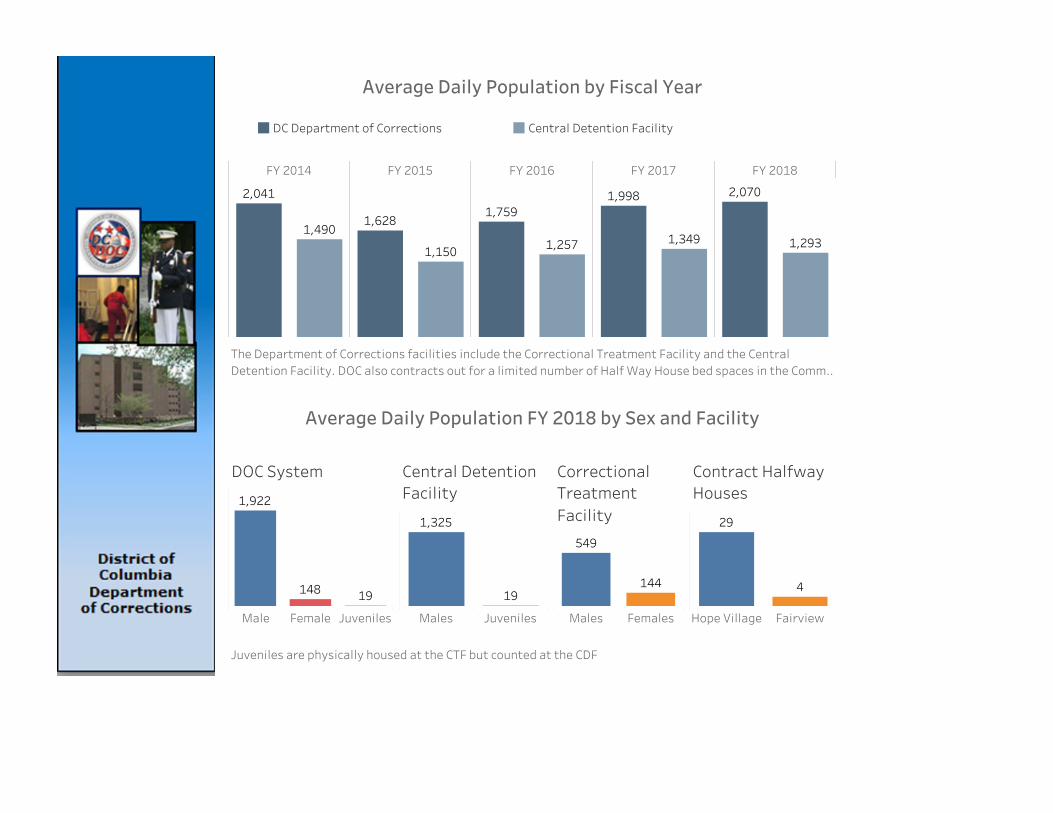
2,041
1,4901,628
1,150
1,759
1,257
1,998
1,349
2,070
1,293
Male FemaleJuveniles
1,922
148 19
DOC System
Males Juveniles
1,325
19
Central DetentionFacility
Hope Village Fairview
29
4
Contract HalfwayHouses
Males Females
549
144
CorrectionalTreatmentFacility
The Department of Corrections facilities include the Correctional Treatment Facility and the CentralDetention Facility. DOC also contracts out for a limited number of Half Way House bed spaces in the Comm..
Average Daily Population FY 2018 by Sex and Facility
Juveniles are physically housed at the CTF but counted at the CDF
Average Daily Population by Fiscal Year
DC Department of Corrections Central Detention Facility

The Department of Corrections facilities include the Correctional Treatment Facility and the CentralDetention Facility. DOC also contracts out for a limited number of Half Way House bed spaces in theCommunity.
Average Daily Population CY 2018 by Sex and Facility
Juveniles are physically housed at the CTF but counted at the CDF
2014 2015 2016 2017 2018
1,928
1,4001,618
1,145
1,781
1,263
2,054
1,353
2,069
1,281
Hope Village Fairview
30
4
Contract HalfwayHouses
Males Females
557
139
CorrectionalTreatment Facility
Male Female Juveniles
1,928
143 18
DOC System
Males Juveniles
1,323
18
CentralDetentionFacility
Average Daily Population by Calendar Year
DC Department of Corrections Central Detention Facility

1 wk or less 1 wk to 1 mo 1 to 3 mo 3 to 6 mo 6 to 9 mo 9 to 12 mo more than 1 yr
37.6%
42.7% 28.0%
19.5% 19.0%
15.9%
12.6%
9.6%
5.2%
1.7%
2.6%
1.3%
3.6%
0.8%
FY 2018 Releases by Length of Stay
The overall Average LOS for all released Inmates was 72.2 days. Men: The average LOS was 77.1 days and the median LOSwas 21.6 days ; 57.1% of men released stayed fewer than 31 days. Women: The average LOS was 41.9 days and the medianLOS was 13.5 days ; 70.1% of women released stayed fewer than 31 days.
FY2014 FY2015 FY2016 FY2017 FY201811,245 11,577 10,114 10,414 11,277 11,020 11,974 11,852 11,516 11,584
Fiscal Year Intakes and Releases
1 wk or less 1 wk to 1 mo 1 to 3 mo 3 to 6 mo 6 to 9 mo 9 to 12 mo more than 1 yr
42.3%
38.1%
27.9%
18.5%
17.3%
18.8% 13.1%
8.3% 1.9%
5.0%
1.5%
2.9%
0.9%
3.7%
CY 2018 Releases by Length of Stay
2014 2015 2016 2017 201810,603 11,007 10,521 10,104 11,560 11,000 11,953 11,827 8,768 8,772
Calendar Year Intakes and Releases
The overall Average LOS for all released Inmates was 73.6 days. Men: The average LOS was 56.6 days and the median LOSwas 21.9 days ; 56.6 % of men released stayed fewer than 31 days. Women: The average LOS was 42.1 days and themedian LOS was 13.7 days ; 70.2% of women released stayed fewer than 31 days.
DOC Intakes and ReleasesIntakes Releases

6.8%
93.2%
African American
Hispanic
Other
White
Asian 0%
3%
4%
5%
88%
Inmate Population by Race
Christian Faiths Muslim Atheist\Denies Other Major Religions Other Faiths\Beliefs Did Not Declare
16.8%2.3%9.0%2.2%27.1%42.6%
Religious Affiliation of Intakes FY 2018
63.5% of men and 53.6% of women in custody report having at least a High School Diploma or a GED. All data is self reported by inmates in DOCcustody. This information is based on a one day population snapshot.
High School G.E.D. Not Declared College None
21.1%
6.3%
19.0%
11.3%
42.3%
3.7%5.7%
27.0%28.1%
35.4%
Self Declared Education Levels for Inmates
The category Otherincludes NativeAmericans and thosewho have declared theirrace as Other or notdeclared a race.
Under 21
21 - 30
31 - 40
41 - 50
51 - 60
Over 61 2.8%
11.9%
18.2%
41.3%
24.5%
4.9%
38.5%
28.0%
15.8%
5.7%
9.5%
2.8%
Age Distribution of Inmates
Blacks are overrepresented compared to the DC population which is 47.7% Black. Whites,Hispanics, and Asians are under-represented compared to the DC population which is 44.6% White,10.9% Hispanic, 4.1% Asian and 0.8% Other.DC Population Data from www.census.gov
All data is self reported by intakes to DOC custody between October 1, 2017 and September 30,2018. The category Other Major Religions includesother faiths such as Jewish, Buddhist, Hindu and Rastafarian which occur infrequently among intakes.
Inmate Demographics
F M

Less than 3 days
3 - 31 days
31 - 91 days
3 - 6 months
6 - 9 months
9 - 12 months
More than 1 year 2.8%
1.4%
5.6%
16.9%
33.1%
31.0%
9.2%
Women
Less than 3 days
3 - 31 days
31 - 91 days
3 - 6 months
6 - 9 months
9 - 12 months
More than 1 year 14.0%
7.2%
11.4%
20.5%
22.8%
20.0%
4.1%
Men
Length of Stay Distribution for Inmates in Custody
The median LOS for men in custody is 102.8 days and for women in custody is 43.4 days.
•Other indicates other charges.•Pretrial Felon (PF) means at least one unresolved legal matter exists and indicates the most serious offense requiring detention is a felony.•Pretrial Misdemeanant (PM) means at least one unresolved legal matter exists and indicates that the individual has no felony offenses.•Parole Violator (PV) indicates an individual who has violated conditions of parole, probation or release.•Sentenced Felon (SF) indicates the inmate is serving at least one sentence and indicates the most serious offense requiring detention is a felony.•Sentenced Misdemeanant (SM) indicates the inmate is serving at least one sentence and indicates that the inmate has no felony offenses.•Writ/Hold (WH) individuals may have other charges (typically in transit, fugitive) requiring legal resolution. Only 4% of all inmates are detained solely on a writ.
This information is based on a one day population snapshot
OT PF PM PV SF SM WH
0%
10%
20%
30%
40%
50%
60%
70%
% of Inmates
0
50
100
150
200
250
Avg. LOS in Days
0.7% 0.1%
0.463.3
48.8%
2.7%
94.2
221.4
0.7%
4.4%
12.821.5
14.5%
0.7%
142.0
149.6
8.7%
1.1%
82.6
267.2
9.3%
1.5%
48.6
80.8
6.8%0.0%
250.4
213.5
Percent of Inmates in Custody by Legal Status and Average Length of Stay in Days
Average LOS for all men in custody is 192.1 days and the overall Average LOS for all women in custody is 78 day.
M
F

USMS
Assault
Drug Offenses
Failure to Appear
Parole Violation
Property Crime
Other & White Collar
Traffic
Fugitive
Weapons
Crimes against Persons
Homicide & Kidnapping
Public Order
Arson
Burglary
Writ
Escape
Rape/Sex Abuse
20.4%
19.0%
14.8%
14.1%
7.0%
5.6%
3.5%
3.5%
2.1%
1.4%
1.4%
1.4%
1.4%
1.4%
0.7%
0.7%
0.7%
0.7%
20.6%
13.0%
10.9%
6.0%
3.1%
6.2%
5.4%
3.4%
1.8%
7.4%
0.7%
6.0%
0.6%
0.1%
6.8%
5.4%
0.4%
2.1%
Offense by Most Serious Active Charge Men and Women
The FY 2018 one year re-incarceration rate was 18.1% for all inmates. Non-federal inmates who are re-incarcerated have a significantlyhigher incidence of mental illness, but are similar to federal offenders who are re-incarcerated in most other attributes.
1 Time 2 Times 3 or more
81.9%
14.0%4.1%
Q4 FY18 Re-Incarceration RateFY 2018 Releases by Frequency of Release
F M
Approximately 35.3% of menin custody are incarceratedon violent or dangerousoffenses (per DC Code 22Section 4501).
Approximately 23.2% of women incustody are incarcerated onviolent or dangerous offenses(per DC Code 22 Section 4501).
This information is based on a one day population snapshot