dc arcs
DESCRIPTION
Presentation on DC Arcing in microgrids by Aditya ShekharTRANSCRIPT

Aditya Shekhar (TU Delft) Electric Arcs in DC Systems June 25, 2015 1 / 35
Electric Arcs in DC SystemsCharacterization, Detection and Extinction
Delft University of Technology
Aditya Shekhar
June 25, 2015
Outline
1 Load-side Series Arc Detection in Low Voltage DC Microgrids
Proposed Arc Detection Algorithm
Choice of Filter Time Constants
Impact of Circuit Parameters
Experimental Validation
2 Bus Transfer Switching with HVDC GIS Disconnector
Experimental Setup and Simulation Model
Parameter Estimation
Recovery and Re-strike Voltage
Analysis of Bus Transfer Experiments
3 The Big Picture
Aditya Shekhar (TU Delft) Electric Arcs in DC Systems June 25, 2015 2 / 35

Next Subsection
1 Load-side Series Arc Detection in Low Voltage DC Microgrids
Proposed Arc Detection Algorithm
Choice of Filter Time Constants
Impact of Circuit Parameters
Experimental Validation
2 Bus Transfer Switching with HVDC GIS Disconnector
Experimental Setup and Simulation Model
Parameter Estimation
Recovery and Re-strike Voltage
Analysis of Bus Transfer Experiments
3 The Big Picture
Aditya Shekhar (TU Delft) Electric Arcs in DC Systems June 25, 2015 3 / 35

Fundamental Concept
Iarc
Ldc
Vdc
Rdc Rarc
Cload
LOAD
Vload
Equivalent Circuit−1 0 1 2 3 4 5 6 7 8 9 10
50
60
70
80
90
100
110
Time (ms)
Load
Vol
tage
(V
) Initial electrode dependentvoltage drop to be detected
Measured load voltage: drop of 13.3 V.
• Detection of series arcs from load voltage drop (plug out).
• Selectivity in parallel load.
Aditya Shekhar (TU Delft) Electric Arcs in DC Systems June 25, 2015 4 / 35

Proposed Arc Detection Algorithm
Vload
1
1
ss
If ΔV > Vdetect
–
+
ΔV
Detach load to eliminate arc
1
1
sf
Vflp
Vslp
Fast Low Pass Filter
Slow Low Pass Filter
Band Pass Filter
Aditya Shekhar (TU Delft) Electric Arcs in DC Systems June 25, 2015 5 / 35
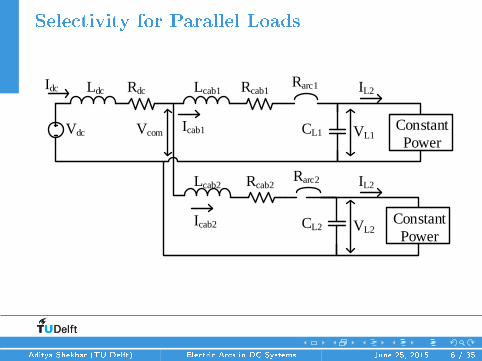
Selectivity for Parallel Loads
Idc Ldc
Vdc
Rdc Rcab1
Rcab2
Rarc1
Rarc2
Icab1 CL1
CL2Icab2
Constant
Power
Constant
Power
Lcab1
Lcab2 IL2
IL2
Vcom VL1
VL2
Aditya Shekhar (TU Delft) Electric Arcs in DC Systems June 25, 2015 6 / 35

Validation - Simulation Results
−1 0 1 2 3 4 5 6 7 8 9 100
1
2
3
4
5
Time (ms)
Cur
rent
(A
)
Load Current 1Load Current 2
−1 0 1 2 3 4 5 6 7 8 9 1075
80
85
90
95
100
105
Time (ms)
Vol
tage
(V)
Load 1 VoltageLoad 2 VoltageV
slp, Load 1
Vflp
, Load 1
Load 2 keeps running
Arc extinguished
Arc detected
Vdetect
=10 V
τflp
=0.0001 s
Load 1 selectively ramped to zero on arc detection
τslp
= 0.001 s
Aditya Shekhar (TU Delft) Electric Arcs in DC Systems June 25, 2015 7 / 35

Next Subsection
1 Load-side Series Arc Detection in Low Voltage DC Microgrids
Proposed Arc Detection Algorithm
Choice of Filter Time Constants
Impact of Circuit Parameters
Experimental Validation
2 Bus Transfer Switching with HVDC GIS Disconnector
Experimental Setup and Simulation Model
Parameter Estimation
Recovery and Re-strike Voltage
Analysis of Bus Transfer Experiments
3 The Big Picture
Aditya Shekhar (TU Delft) Electric Arcs in DC Systems June 25, 2015 8 / 35
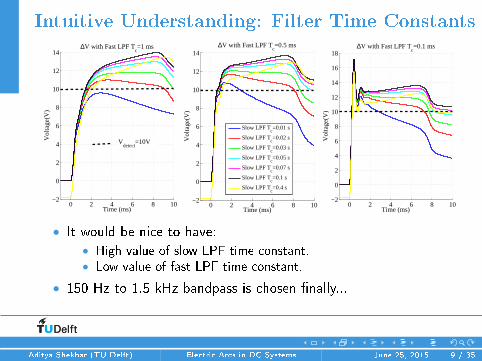
Intuitive Understanding: Filter Time Constants
0 2 4 6 8 10−2
0
2
4
6
8
10
12
14
Time (ms)
Vol
tage
(V)
∆V with Fast LPF Tc=1 ms
0 2 4 6 8 10−2
0
2
4
6
8
10
12
14
Time (ms)
Vol
tage
(V)
∆V with Fast LPF Tc=0.5 ms
0 2 4 6 8 10−2
0
2
4
6
8
10
12
14
16
18
Time (ms)
Vol
tage
(V)
∆V with Fast LPF Tc=0.1 ms
Slow LPF Tc=0.01 s
Slow LPF Tc=0.02 s
Slow LPF Tc=0.03 s
Slow LPF Tc=0.05 s
Slow LPF Tc=0.07 s
Slow LPF Tc=0.1 s
Slow LPF Tc=0.4 s
Vdetect
=10V
• It would be nice to have:• High value of slow LPF time constant.• Low value of fast LPF time constant.
• 150 Hz to 1.5 kHz bandpass is chosen nally...
Aditya Shekhar (TU Delft) Electric Arcs in DC Systems June 25, 2015 9 / 35

Next Subsection
1 Load-side Series Arc Detection in Low Voltage DC Microgrids
Proposed Arc Detection Algorithm
Choice of Filter Time Constants
Impact of Circuit Parameters
Experimental Validation
2 Bus Transfer Switching with HVDC GIS Disconnector
Experimental Setup and Simulation Model
Parameter Estimation
Recovery and Re-strike Voltage
Analysis of Bus Transfer Experiments
3 The Big Picture
Aditya Shekhar (TU Delft) Electric Arcs in DC Systems June 25, 2015 10 / 35
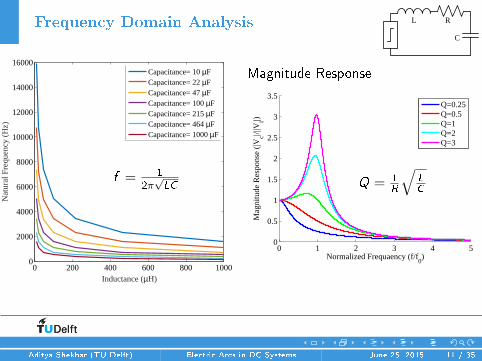
Frequency Domain Analysis
0 200 400 600 800 10000
2000
4000
6000
8000
10000
12000
14000
16000
Inductance (µH)
Nat
ural
Fre
quen
cy (
Hz)
Capacitance= 10 µFCapacitance= 22 µFCapacitance= 47 µFCapacitance= 100 µFCapacitance= 215 µFCapacitance= 464 µFCapacitance= 1000 µF
Magnitude Response
0 1 2 3 4 50
0.5
1
1.5
2
2.5
3
3.5
Normalized Frequaency (f/f0)
Mag
nitu
de R
espo
nse
(|Vc|/|
|Vi|)
Q=0.25Q=0.5Q=1Q=2Q=3
Aditya Shekhar (TU Delft) Electric Arcs in DC Systems June 25, 2015 11 / 35
RL
C
f = 1
2π√LC Q = 1
R
√L
C

Detection Voltage at Discrete BPF Output
0.5 0.501 0.502 0.503 0.504 0.5050
5
10
15
Time (s)
Vol
tage
(V)
Grid Inductance=47 µH, Resistance=0.125 Ω
0.5 0.501 0.502 0.503 0.504 0.5050
5
10
15
Time (s)
Vol
tage
(V)
Grid Inductance=100 µH, Resistance=0.25 Ω
0.5 0.501 0.502 0.503 0.504 0.5050
5
10
15
Time (s)
Vol
tage
(V)
Grid Inductance=216 µH, Resistance=0.5 Ω
0.5 0.501 0.502 0.503 0.504 0.5050
5
10
15
Time (s)
Vol
tage
(V)
Grid Inductance=465 µH, Resistance=1 Ω
0.5 0.501 0.502 0.503 0.504 0.5050
5
10
15
Time (s)
Vol
tage
(V)
Grid Inductance=1000 µH, Resistance=2 Ω
Load Capacitance=10 µFLoad Capacitance=22 µFLoad Capacitance=47 µFLoad Capacitance=100 µFLoad Capacitance=216 µFLoad Capacitance=465 µFLoad Capacitance=1000 µF
Aditya Shekhar (TU Delft) Electric Arcs in DC Systems June 25, 2015 12 / 35
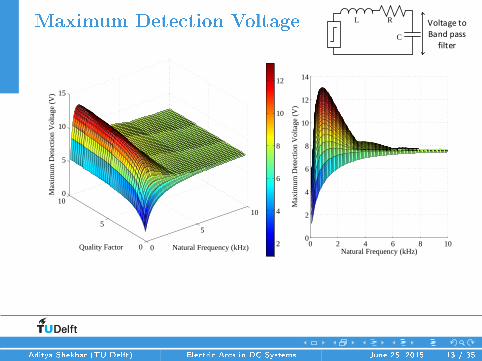
Maximum Detection Voltage
0
5
10
0
5
100
5
10
15
Natural Frequency (kHz)Quality Factor
Max
imum
Det
ectio
n V
olta
ge (
V)
0 2 4 6 8 100
2
4
6
8
10
12
14
Natural Frequency (kHz)
Max
imum
Det
ectio
n V
olta
ge (
V)
2
4
6
8
10
12
Aditya Shekhar (TU Delft) Electric Arcs in DC Systems June 25, 2015 13 / 35
RL
C
Voltage to Band pass
filter
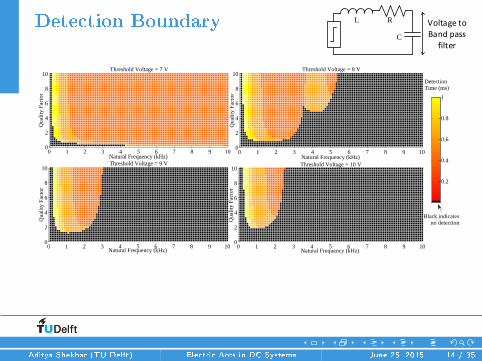
Detection Boundary
0 1 2 3 4 5 6 7 8 9 100
2
4
6
8
10
Natural Frequency (kHz)
Qua
lity
Fact
or
Threshold Voltage = 7 V
0 1 2 3 4 5 6 7 8 9 100
2
4
6
8
10
Natural Frequency (kHz)
Qua
lity
Fact
or
Threshold Voltage = 8 V
0 1 2 3 4 5 6 7 8 9 100
2
4
6
8
10
Natural Frequency (kHz)
Qua
lity
Fact
or
Threshold Voltage = 9 V
0 1 2 3 4 5 6 7 8 9 100
2
4
6
8
10
Natural Frequency (kHz)
Qua
lity
Fact
or
Threshold Voltage = 10 V
0.2
0.4
0.6
0.8
1
DetectionTime (ms)
Black indicates no detection
Aditya Shekhar (TU Delft) Electric Arcs in DC Systems June 25, 2015 14 / 35
RL
C
Voltage to Band pass
filter

Next Subsection
1 Load-side Series Arc Detection in Low Voltage DC Microgrids
Proposed Arc Detection Algorithm
Choice of Filter Time Constants
Impact of Circuit Parameters
Experimental Validation
2 Bus Transfer Switching with HVDC GIS Disconnector
Experimental Setup and Simulation Model
Parameter Estimation
Recovery and Re-strike Voltage
Analysis of Bus Transfer Experiments
3 The Big Picture
Aditya Shekhar (TU Delft) Electric Arcs in DC Systems June 25, 2015 15 / 35

Real Time Arc Detection
−4 −2 0 2 4 6 870
80
90
100
Time (ms)
Vol
tage
(V
)Threshold Voltage = 6 V
0
2
4
Vol
tage
(V
)
−4 −2 0 2 4 6 870
80
90
100
Time (ms)
Vol
tage
(V
)
Threshold Voltage = 7 V
0
2
4
Vol
tage
(V
)
−4 −2 0 2 4 6 870
80
90
100
Time (ms)
Vol
tage
(V
)
Threshold Voltage = 8 V
0
2
4V
olta
ge (
V)
Voltage Across Load CapacitorDetection Signal from C2000
−5 0 5 1070
75
80
85
90
95
100
Time (ms)
Vol
tage
(V
)
Threshold Voltage = 9 V
0
1
2
3
4
Vol
tage
(V
)
Tdetect
=2 ms
Tdetect
=2.5 ms Tdetect
=2.8 ms
Tdetect
=1.25 ms
6.2 ms 5.5 ms
4.2 ms 2.3 ms
Aditya Shekhar (TU Delft) Electric Arcs in DC Systems June 25, 2015 16 / 35
Iarc
Ldc
Vdc
Rdc Rarc
Cload
LOAD
Vload

Next Subsection
1 Load-side Series Arc Detection in Low Voltage DC Microgrids
Proposed Arc Detection Algorithm
Choice of Filter Time Constants
Impact of Circuit Parameters
Experimental Validation
2 Bus Transfer Switching with HVDC GIS Disconnector
Experimental Setup and Simulation Model
Parameter Estimation
Recovery and Re-strike Voltage
Analysis of Bus Transfer Experiments
3 The Big Picture
Aditya Shekhar (TU Delft) Electric Arcs in DC Systems June 25, 2015 17 / 35

Bus Transfer in HVDC Substations
Feeder 1 Feeder 1 Feeder 1Feeder 2 Feeder 2 Feeder 2
DS1 DS1 DS1DS2 DS2 DS2
Before making DS2, current
(green) flows from feeder 1 to
feeder 2 via busbar coupling (BC).
With both DS1 and DS2 closed,
parallel buses share current from
feeder 1 to feeder 2
After breaking DS1, current (red)
flows from feeder 1 to feeder 2 via
busbar coupling (BC).
BC BC BC
R1
R2
L1
L2
VDS
Itot
I2
I1
Vbus
Aditya Shekhar (TU Delft) Electric Arcs in DC Systems June 25, 2015 18 / 35

Experimental Setup
Bus 1
InductanceBus 2
Inductance
GIS
Disconnector
Oscilloscope
Box
Motor
Controller
Power
Supply
Manual
Grounding
Stick
Automatic
Grounding
Stick
Control
Room
Aditya Shekhar (TU Delft) Electric Arcs in DC Systems June 25, 2015 19 / 35
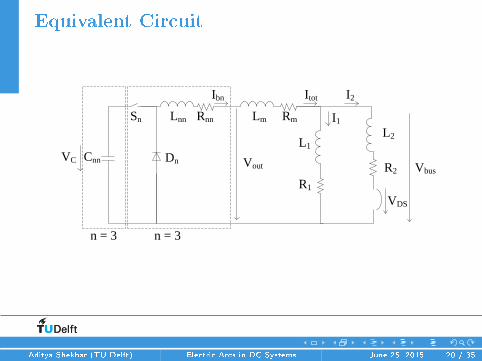
Equivalent Circuit
Lnn
CnnVC
Rm
R1
R2
L1
L2
VDS
Itot I2
I1
Vbus
Lm
Dn
Sn
n = 3 n = 3
Vout
Rnn
Ibn
Aditya Shekhar (TU Delft) Electric Arcs in DC Systems June 25, 2015 20 / 35
Next Subsection
1 Load-side Series Arc Detection in Low Voltage DC Microgrids
Proposed Arc Detection Algorithm
Choice of Filter Time Constants
Impact of Circuit Parameters
Experimental Validation
2 Bus Transfer Switching with HVDC GIS Disconnector
Experimental Setup and Simulation Model
Parameter Estimation
Recovery and Re-strike Voltage
Analysis of Bus Transfer Experiments
3 The Big Picture
Aditya Shekhar (TU Delft) Electric Arcs in DC Systems June 25, 2015 21 / 35
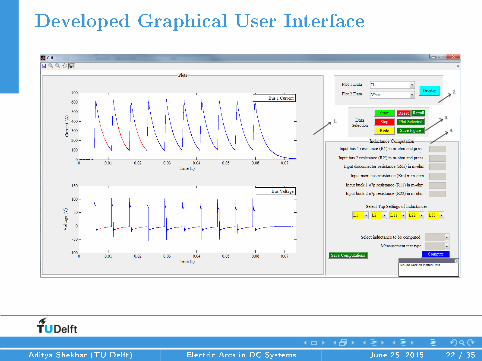
Developed Graphical User Interface
1.3.
2.
4.
Aditya Shekhar (TU Delft) Electric Arcs in DC Systems June 25, 2015 22 / 35

Equivalent Circuits for AnalysisInductances with GIS Open
Lnn
Rm
R1
L1
Itot
I1
Lm
Vout Vbus
Rnn
Currents and voltages are falling
exponentials.
Inductances with GIS Closed
L11
Rm
R1
R2L1
L2
VDS
Itot I2
I1
Vbus
Lm
Lds
Rds
R11
Currents and voltages are sum of
two exponentials.
Aditya Shekhar (TU Delft) Electric Arcs in DC Systems June 25, 2015 23 / 35
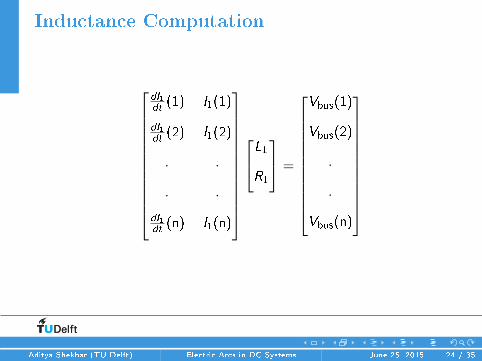
Inductance Computation
dI1dt(1) I1(1)
dI1dt(2) I1(2)
. .
. .
dI1dt(n) I1(n)
L1R1
=
Vbus(1)
Vbus(2)
.
.
Vbus(n)
Aditya Shekhar (TU Delft) Electric Arcs in DC Systems June 25, 2015 24 / 35

Inductance of GIS Disconnector
0 0.5 1 1.5 2 2.5 3 3.5 4 4.5
x 10−4
−1.2
−1
−0.8
−0.6
−0.4
−0.2
0
0.2
Time (s)
Vol
tage
(V
)
Lds
VdsL
dI2
dt+ RI2
LdI2
dt
RI2
• Voltage Drop across this due to current gradient must be
removed to estimate the actual arc voltage.
Aditya Shekhar (TU Delft) Electric Arcs in DC Systems June 25, 2015 25 / 35

Corrected Arc Voltage
7.4 7.5 7.6 7.7 7.8 7.9 8 8.1 8.2 8.3 8.4
x 10−3
0
0.1
0.2
0.3
0.4
0.5
0.6
0.7
0.8
Time (s)
Vo
lta
ge
(p
.u.)
Disconnector VoltageU
arc,fast
Uarc,lp
Restrike
Aditya Shekhar (TU Delft) Electric Arcs in DC Systems June 25, 2015 26 / 35

Comparison of Measured and Simulated Results
0 0.005 0.01 0.015 0.02 0.025 0.03 0.035 0.04 0.0450
200
400
600
800T
ota
l C
urr
en
t (A
)
Time (s)
0 0.005 0.01 0.015 0.02 0.025 0.03 0.035 0.04 0.045−100
−50
0
50
100
150
200
Bu
s V
olta
ge
(V
)
Time (s)
0 0.005 0.01 0.015 0.02 0.025 0.03 0.035 0.04 0.0451100
1200
1300
1400
1500
Ca
pa
cito
r V
olta
ge
(V
)
Time (s)
0 0.005 0.01 0.015 0.02 0.025 0.03 0.035 0.04 0.0450
100
200
300
400
Vo
lta
ge
(V
)
Time (s)
Simulated CurrentMeasured Current
Simulated Bus VoltageMeasured Bus Voltage
Simulated Capacitor VoltageMeasured Capacitor Voltage
Simulated Buck Output VoltageMeasured Buck Output Voltage
Aditya Shekhar (TU Delft) Electric Arcs in DC Systems June 25, 2015 27 / 35

Next Subsection
1 Load-side Series Arc Detection in Low Voltage DC Microgrids
Proposed Arc Detection Algorithm
Choice of Filter Time Constants
Impact of Circuit Parameters
Experimental Validation
2 Bus Transfer Switching with HVDC GIS Disconnector
Experimental Setup and Simulation Model
Parameter Estimation
Recovery and Re-strike Voltage
Analysis of Bus Transfer Experiments
3 The Big Picture
Aditya Shekhar (TU Delft) Electric Arcs in DC Systems June 25, 2015 28 / 35

Derived Analytical Expression
Recovery voltage is the voltage that appears across the electrodes ofthe GIS disconnector at the instant of arc extinction.
Restrike Voltage is the voltage across the disconnector just be-fore the instant of arc reignition.
Vbus =
(Itot
τm− I1
τ1
)(Lm
(1
Lin+ 1
Lm
))−(∑3
n=1Pn
Lnn
)VC − Itot
τm+∑3
n=1
(Ibn
τnn
)1
Lm− Lm
(1
Lm+ 1
L1
)(1
Lin+ 1
Lm
)
Aditya Shekhar (TU Delft) Electric Arcs in DC Systems June 25, 2015 29 / 35

Eect of Capacitor Voltage and Source
Inductance
4 4.5 5−200
0
200
400
600
800
1000
1200
Bus
Vol
tage
(V
)
Time (ms)
(a)
4 4.5 5−200
0
200
400
600
800
1000
1200
Bus
Vol
tage
(V
)
Time (ms)
(b)
4 4.5 5−200
0
200
400
600
800
1000
1200
Bus
Vol
tage
(V
)
Time (ms)
(c)
L
nn=0.1 mH
Lnn
=0.2 mH
Lnn
=0.5 mH
Lnn
=1.5 mH
Lnn
=5.5 mH
Aditya Shekhar (TU Delft) Electric Arcs in DC Systems June 25, 2015 30 / 35
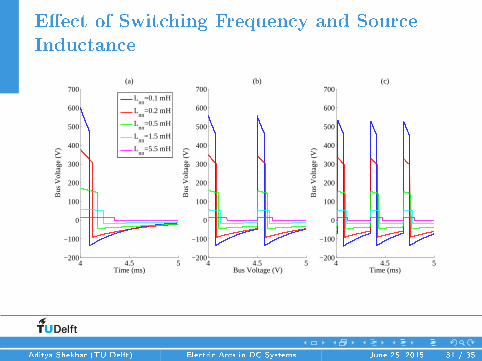
Eect of Switching Frequency and Source
Inductance
4 4.5 5−200
−100
0
100
200
300
400
500
600
700
Bus
Vol
tage
(V
)
Time (ms)
(a)
4 4.5 5−200
−100
0
100
200
300
400
500
600
700
Bus
Vol
tage
(V
)
Bus Voltage (V)
(b)
4 4.5 5−200
−100
0
100
200
300
400
500
600
700
Bus
Vol
tage
(V
)
Time (ms)
(c)
L
nn=0.1 mH
Lnn
=0.2 mH
Lnn
=0.5 mH
Lnn
=1.5 mH
Lnn
=5.5 mH
Aditya Shekhar (TU Delft) Electric Arcs in DC Systems June 25, 2015 31 / 35

Next Subsection
1 Load-side Series Arc Detection in Low Voltage DC Microgrids
Proposed Arc Detection Algorithm
Choice of Filter Time Constants
Impact of Circuit Parameters
Experimental Validation
2 Bus Transfer Switching with HVDC GIS Disconnector
Experimental Setup and Simulation Model
Parameter Estimation
Recovery and Re-strike Voltage
Analysis of Bus Transfer Experiments
3 The Big Picture
Aditya Shekhar (TU Delft) Electric Arcs in DC Systems June 25, 2015 32 / 35

Graphical User Interface Developed for Analysis
Aditya Shekhar (TU Delft) Electric Arcs in DC Systems June 25, 2015 33 / 35

The Big Picture???
Aditya Shekhar (TU Delft) Electric Arcs in DC Systems June 25, 2015 34 / 35

Thank You!
Aditya Shekhar (TU Delft) Electric Arcs in DC Systems June 25, 2015 35 / 35