dbs ar 4c cover ar · balance at 1 january 2011 8,533 247 ... domiciled in the republic of...
TRANSCRIPT

p93FINANCIAL STATEMENTS | DBS ANNUAL REPORT 2012
FINANCIALSTATEMENTS
DBS GROUP HOLDINGS LTD AND ITS SUBSIDIARIES
94 CONSOLIDATED INCOME STATEMENT95 CONSOLIDATED STATEMENT OF
COMPREHENSIVE INCOME96 BALANCE SHEETS97 CONSOLIDATED STATEMENT OF CHANGES IN EQUITY98 CONSOLIDATED CASH FLOW STATEMENT
NOTES TO THE FINANCIAL STATEMENTS99 Domicile and Activities Summary of Signifi cant Accounting Policies108 Critical Accounting Estimates109 Effects on Financial Statements on Adoption
of New or Revised FRS Income Statement110 Net Interest Income Net Fee and Commission Income111 Net Trading Income Net Loss from Financial Instruments
Designated at Fair Value Net Income from Financial Investments Other Income Employee Benefi ts Other Expenses Allowances for Credit and Other Losses113 Income Tax Expense Earnings Per Ordinary Share
Balance Sheet: Assets114 Measurement Basis of Financial Instruments116 Cash and Balances with Central Banks Singapore Government Securities and Treasury Bills Financial Assets at Fair Value through Profi t or Loss117 Loans and Advances to Customers119 Financial Investments Securities Pledged and Transferred120 Subsidiaries and Other Controlled Entities121 Joint Ventures Investments in Associates122 Goodwill on Consolidation123 Properties and Other Fixed Assets125 Deferred Tax Assets/Liabilities 126 Other Assets
Balance Sheet: Liabilities126 Due to Non-Bank Customers Financial Liabilities at Fair Value through Profi t or Loss Other Liabilities Other Debt Securities in Issue128 Subordinated Term Debts
Balance Sheet: Share Capital and Reserves129 Share Capital and Treasury Shares130 Other Reserves and Revenue Reserves133 Non-controlling Interests
Off-Balance Sheet Information133 Contingent Liabilities and Commitments134 Financial Derivatives
Additional Information137 Share-based Compensation Plans139 Related Party Transactions Fair Value of Financial Instruments144 Credit Risk152 Market Risk153 Liquidity Risk157 Capital Management Segment Reporting DBS BANK LTD
160 INCOME STATEMENT161 STATEMENT OF COMPREHENSIVE INCOME162 BALANCE SHEET163 NOTES TO THE SUPPLEMENTARY FINANCIAL
STATEMENTS
165 DIRECTORS’ REPORT169 STATEMENT BY THE DIRECTORS170 INDEPENDENT AUDITOR’S REPORT
p94 DBS ANNUAL REPORT 2012 | FINANCIAL STATEMENTS
for the year ended 31 December 2012
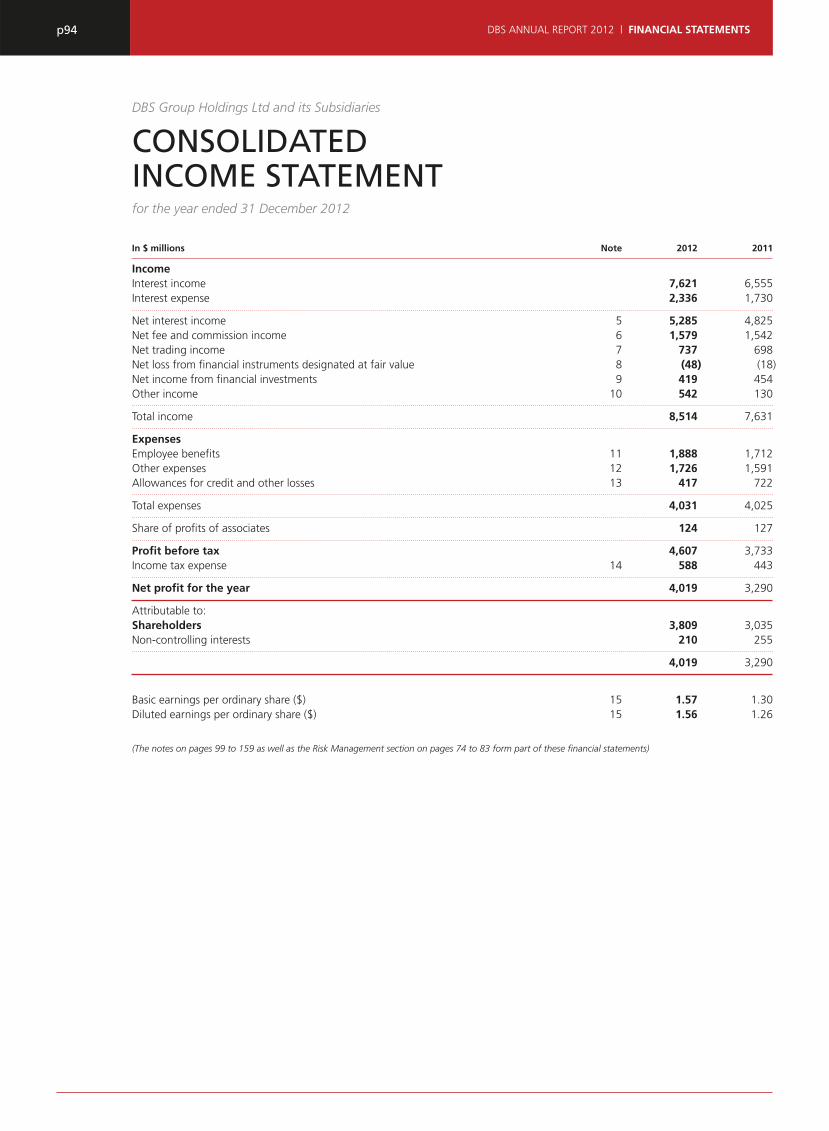
DBS Group Holdings Ltd and its Subsidiaries
CONSOLIDATED INCOME STATEMENT
In $ millions Note 2012 2011
IncomeInterest income 7,621 6,555Interest expense 2,336 1,730
Net interest income 5 5,285 4,825Net fee and commission income 6 1,579 1,542Net trading income 7 737 698Net loss from fi nancial instruments designated at fair value 8 (48) (18)Net income from fi nancial investments 9 419 454Other income 10 542 130
Total income 8,514 7,631
ExpensesEmployee benefi ts 11 1,888 1,712Other expenses 12 1,726 1,591Allowances for credit and other losses 13 417 722
Total expenses 4,031 4,025
Share of profi ts of associates 124 127
Profi t before tax 4,607 3,733Income tax expense 14 588 443
Net profi t for the year 4,019 3,290
Attributable to:Shareholders 3,809 3,035Non-controlling interests 210 255
4,019 3,290
Basic earnings per ordinary share ($) 15 1.57 1.30Diluted earnings per ordinary share ($) 15 1.56 1.26
(The notes on pages 99 to 159 as well as the Risk Management section on pages 74 to 83 form part of these fi nancial statements)
p95FINANCIAL STATEMENTS | DBS ANNUAL REPORT 2012
for the year ended 31 December 2012
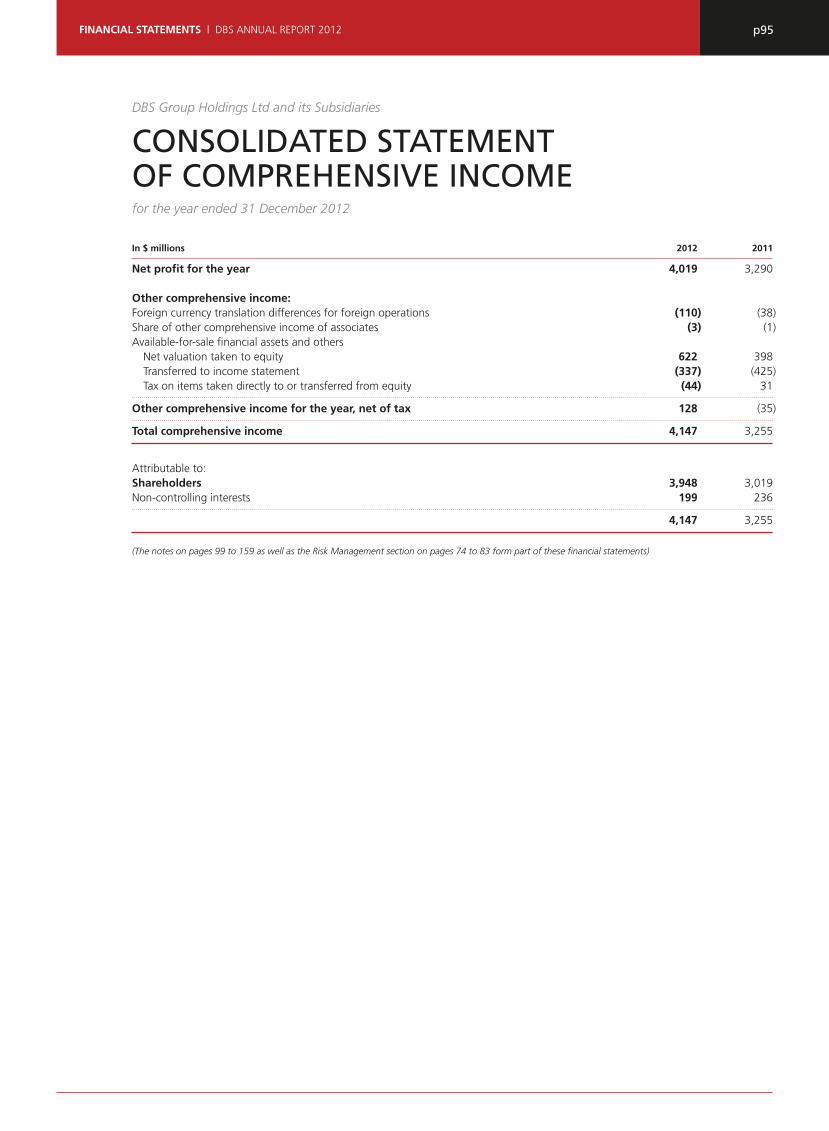
DBS Group Holdings Ltd and its Subsidiaries
CONSOLIDATED STATEMENTOF COMPREHENSIVE INCOME
In $ millions 2012 2011
Net profi t for the year 4,019 3,290
Other comprehensive income:Foreign currency translation differences for foreign operations (110) (38)Share of other comprehensive income of associates (3) (1)Available-for-sale fi nancial assets and others Net valuation taken to equity 622 398 Transferred to income statement (337) (425) Tax on items taken directly to or transferred from equity (44) 31
Other comprehensive income for the year, net of tax 128 (35)
Total comprehensive income 4,147 3,255
Attributable to:Shareholders 3,948 3,019 Non-controlling interests 199 236
4,147 3,255
(The notes on pages 99 to 159 as well as the Risk Management section on pages 74 to 83 form part of these fi nancial statements)

p96 DBS ANNUAL REPORT 2012 | FINANCIAL STATEMENTS
DBS Group Holdings Ltd and its Subsidiaries
at 31 December 2012
BALANCESHEETS
Group CompanyIn $ millions Note 2012 2011 2012 2011
AssetsCash and balances with central banks 17 17,772 25,304 Singapore Government securities and treasury bills 18 12,092 12,503 Due from banks 28,808 25,571 Financial assets at fair value through profi t or loss 19 11,540 11,927 Positive fair values for fi nancial derivatives 39 17,280 21,164 Loans and advances to customers 20 209,395 194,275 Financial investments 21 35,567 30,491 Securities pledged and transferred 22 4,397 2,634 Subsidiaries 23 – – 11,159 10,957 Investments in associates 25 1,236 949 Goodwill on consolidation 26 4,802 4,802 Properties and other fi xed assets 27 945 976 Investment properties 27 497 372 Deferred tax assets 28 91 149 Other assets 29 8,611 9,730 – 18
Total assets 353,033 340,847 11,159 10,975
LiabilitiesDue to banks 25,162 27,601 Due to non-bank customers 30 241,165 218,992 Financial liabilities at fair value through profi t or loss 31 7,849 11,912 Negative fair values for fi nancial derivatives 39 17,532 22,207 Bills payable 316 254 Current tax liabilities 824 837 Deferred tax liabilities 28 30 30 Other liabilities 32 8,416 10,287 8 6 Other debt securities in issue 33 10,236 10,354 Subordinated term debts 34 5,505 5,304
Total liabilities 317,035 307,778 8 6
Net assets 35,998 33,069 11,151 10,969
EquityShare capital 35 9,645 9,350 9,645 9,350Treasury shares 35 (103) (154) (71) (115)Other reserves 36 7,229 7,075 101 86Revenue reserves 36 14,966 12,523 1,476 1,648
Shareholders' funds 31,737 28,794 11,151 10,969 Non-controlling interests 37 4,261 4,275
Total equity 35,998 33,069 11,151 10,969
(The notes on pages 99 to 159 as well as the Risk Management section on pages 74 to 83 form part of these fi nancial statements)
p97FINANCIAL STATEMENTS | DBS ANNUAL REPORT 2012
for the year ended 31 December 2012
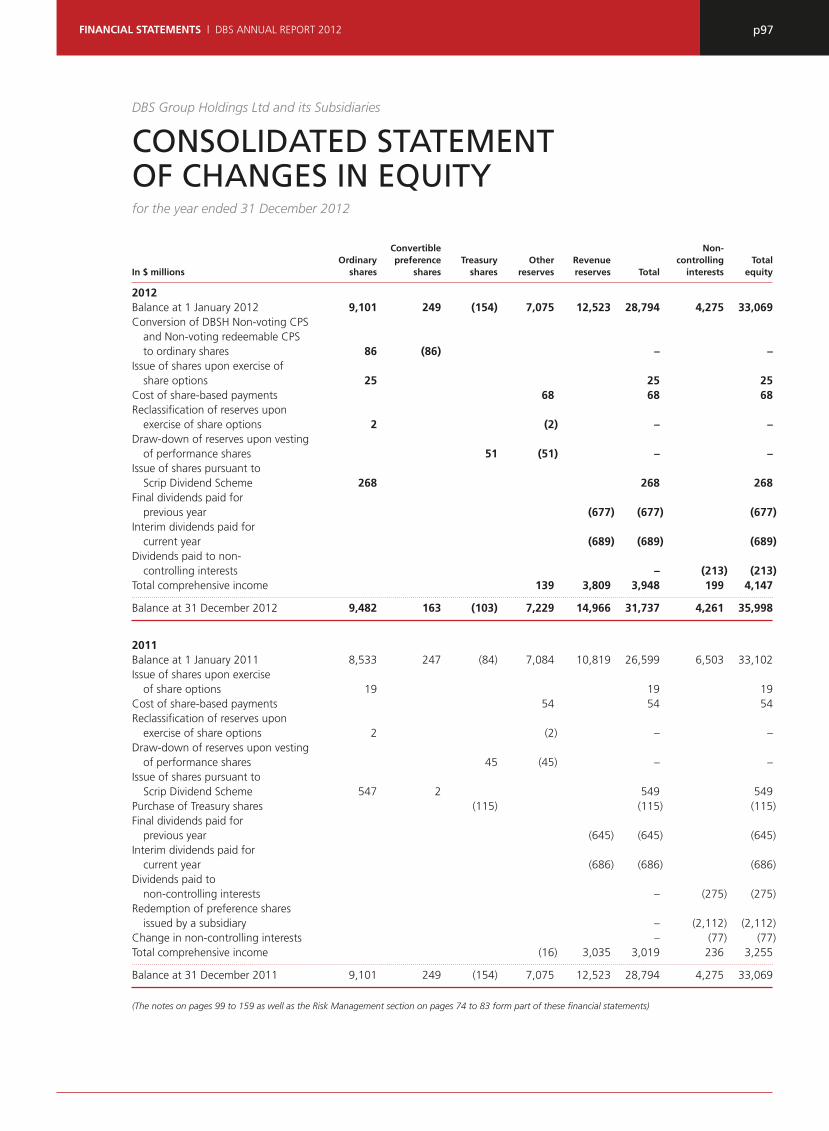
DBS Group Holdings Ltd and its Subsidiaries
CONSOLIDATED STATEMENT OF CHANGES IN EQUITY
Convertible Non- Ordinary preference Treasury Other Revenue controlling TotalIn $ millions shares shares shares reserves reserves Total interests equity
2012 Balance at 1 January 2012 9,101 249 (154) 7,075 12,523 28,794 4,275 33,069 Conversion of DBSH Non-voting CPS and Non-voting redeemable CPS to ordinary shares 86 (86) – – Issue of shares upon exercise of share options 25 25 25 Cost of share-based payments 68 68 68 Reclassifi cation of reserves upon exercise of share options 2 (2) – – Draw-down of reserves upon vesting of performance shares 51 (51) – – Issue of shares pursuant to Scrip Dividend Scheme 268 268 268 Final dividends paid for previous year (677) (677) (677)Interim dividends paid for current year (689) (689) (689)Dividends paid to non- controlling interests – (213) (213)Total comprehensive income 139 3,809 3,948 199 4,147
Balance at 31 December 2012 9,482 163 (103) 7,229 14,966 31,737 4,261 35,998
2011 Balance at 1 January 2011 8,533 247 (84) 7,084 10,819 26,599 6,503 33,102 Issue of shares upon exercise of share options 19 19 19 Cost of share-based payments 54 54 54 Reclassifi cation of reserves upon exercise of share options 2 (2) – – Draw-down of reserves upon vesting of performance shares 45 (45) – – Issue of shares pursuant to Scrip Dividend Scheme 547 2 549 549 Purchase of Treasury shares (115) (115) (115)Final dividends paid for previous year (645) (645) (645)Interim dividends paid for current year (686) (686) (686)Dividends paid to non-controlling interests – (275) (275)Redemption of preference shares issued by a subsidiary – (2,112) (2,112)Change in non-controlling interests – (77) (77)Total comprehensive income (16) 3,035 3,019 236 3,255
Balance at 31 December 2011 9,101 249 (154) 7,075 12,523 28,794 4,275 33,069
(The notes on pages 99 to 159 as well as the Risk Management section on pages 74 to 83 form part of these fi nancial statements)

p98 DBS ANNUAL REPORT 2012 | FINANCIAL STATEMENTS
for the year ended 31 December 2012
DBS Group Holdings Ltd and its Subsidiaries
CONSOLIDATED CASH FLOW STATEMENT
In $ millions 2012 2011 Cash fl ows from operating activitiesNet profi t for the year 4,019 3,290
Adjustments for non-cash items: Allowances for credit and other losses 417 722 Depreciation of properties and other fi xed assets 179 185 Share of profi ts of associates (124) (127)Net gain on disposal (net of write-off) of properties and other fi xed assets (42) (6)Net income from fi nancial investments (419) (454)Net gain on disposal of subsidiary – (47)Net gain on disposal of associate (450) –Income tax expense 588 443
Profi t before changes in operating assets and liabilities 4,168 4,006
Increase/(Decrease) in: Due to banks (2,439) 8,790 Due to non-bank customers 22,173 31,297 Financial liabilities at fair value through profi t or loss (4,063) 1,684 Other liabilities including bills payable (6,389) 8,522 Debt securities and borrowings (355) 7,949
(Increase)/Decrease in: Restricted balances with central banks (366) (322)Singapore Government securities and treasury bills 411 (957)Due from banks (3,250) (5,297)Financial assets at fair value through profi t or loss 387 (1,748)Loans and advances to customers (15,529) (43,215)Financial investments (4,674) (3,509)Other assets 3,605 (8,366)
Tax paid (587) (511)
Net cash used in operating activities (1) (6,908) (1,677)
Cash fl ows from investing activities Dividends from associates 82 46 Purchase of properties and other fi xed assets (338) (177)Proceeds from disposal of properties and other fi xed assets 90 47 Acquisition of interest in associates (566) (55)Disposal of interest in associate 757 –
Net cash generated from/(used in) investing activities (2) 25 (139)
Cash fl ows from fi nancing activities Increase in share capital 295 570 Payment upon maturity of subordinated term debts (2,575) (1,046)Issue of subordinated term debts 2,943 –Purchase of treasury shares – (115)Dividends paid to shareholders of the Company (1,366) (1,331)Dividends paid to non-controlling interests (213) (275)Payment upon redemption of preference shares – (2,112)Change in non-controlling interests – (77)
Net cash used in fi nancing activities (3) (916) (4,386) Exchange translation adjustments (4) (99) (19) Net change in cash and cash equivalents (1)+(2)+(3)+(4) (7,898) (6,221)Cash and cash equivalents at 1 January 18,891 25,112
Cash and cash equivalents at 31 December (Note 17) 10,993 18,891
(The notes on pages 99 to 159 as well as the Risk Management section on pages 74 to 83 form part of these fi nancial statements)

p99FINANCIAL STATEMENTS | DBS ANNUAL REPORT 2012
for the year ended 31 December 2012
DBS Group Holdings Ltd and its Subsidiaries
NOTES TO THE FINANCIAL STATEMENTS
These Notes are integral to the fi nancial statements.
The consolidated fi nancial statements for the year ended 31 December 2012 were authorised for issue by the directors on 5 February 2013.
1 DOMICILE AND ACTIVITIES
The Company, DBS Group Holdings Ltd, is incorporated and domiciled in the Republic of Singapore and has its registered offi ce at 12 Marina Boulevard, Marina Bay Financial Centre Tower Three, Singapore 018982.
The Company is listed on the Singapore Exchange.
The principal activity of the Company is that of an investment holding company and the principal activity of its main wholly-owned subsidiary, DBS Bank Ltd (the Bank), is the provision of retail, small and medium-sized enterprise, corporate and investment banking services.
The fi nancial statements relate to the Company and its subsidiaries (the Group) and the Group’s interests in associates and joint ventures.
2 SUMMARY OF SIGNIFICANT ACCOUNTING POLICIES
2.1 BASIS OF PREPARATION
Compliance with Singapore Financial Reporting Standards (FRS)The consolidated fi nancial statements of the Group are prepared in accordance with Singapore Financial Reporting Standards (FRS) and related Interpretations promulgated by the Accounting Standards Council (ASC). In accordance with Section 201(19) of the Companies Act (the Act), the requirements of FRS 39 Financial Instruments: Recognition and Measurement in respect of loan loss provisioning are modifi ed by the requirements of Notice to Banks No. 612 “Credit Files, Grading and Provisioning” issued by the Monetary Authority of Singapore.
The fi nancial statements of the Company are prepared in accordance with FRS including related Interpretations to FRS (INT FRS) promulgated by the ASC. As permitted by Section 201(4B) of the Act, the Company’s income statement has not been included in these fi nancial statements.
The fi nancial statements are presented in Singapore dollars and rounded to the nearest million, unless otherwise stated. They are prepared on the historical cost convention, except as disclosed in the accounting policies below.
Differences between International Financial Reporting Standards (IFRS) and FRSBeyond the above modifi cation to FRS related to Notice No. 612, there are no signifi cant differences between IFRS and
FRS in terms of their application to the Group for periods covered by these fi nancial statements and consequently there would otherwise be no signifi cant differences had the fi nancial statements been prepared in accordance with IFRS. The consolidated fi nancial statements together with the notes thereon as set out on pages 99 to 159 include the aggregate of all disclosures necessary to satisfy IFRS and FRS.
2.2 SIGNIFICANT ESTIMATES AND JUDGMENT
The preparation of fi nancial statements in conformity with FRS requires management to exercise judgment, use estimates and make assumptions that affect the application of policies and reported amounts of assets, liabilities, income and expenses. Although these estimates are based on management’s best knowledge of current events and actions, actual results may differ from these estimates. Critical accounting estimates and assumptions used that are signifi cant to the fi nancial statements, and areas involving a higher degree of judgment and complexity, are disclosed in Note 3.
2.3 ADOPTION OF NEW AND REVISED ACCOUNTING STANDARDS
On 1 January 2012, the Group adopted the new or revised FRS and INT FRS that are applicable in the current fi nancial year. The fi nancial statements have been prepared in accordance with the relevant transitional provisions in the respective FRS and INT FRS. The adoption of these new or revised FRS and INT FRS did not result in substantial changes to the Group’s and Company’s accounting policies and had no material effect on the amounts reported for the current or prior fi nancial years.
Conceptual Framework for Financial Reporting 2010 (Chapters 1 and 3)The revised Framework is based on fundamental economic concepts rather than a collection of arbitrary conventions. The revisions include stipulating existing or potential investors, lenders and other creditors as primary users of fi nancial statements. It also distinguishes between two types of qualitative characteristics that are necessary to provide useful fi nancial information: (1) fundamental qualitative characteristics, comprising relevance and faithful representation and (2) enhancing qualitative characteristics, comprising comparability, timeliness, verifi ability and understandability.
There is no impact on the fi nancial statements, as the chapters only provide more clarity about the underlying principles of fi nancial reporting.
Amendments to FRS 107 Financial Instruments: DisclosuresThe amendments require additional disclosures for all transferred fi nancial assets that are not derecognised in their entirety, and those that are derecognised in their entirety but for which the transferor retains continuing involvement existing as at the reporting date, irrespective of when the
p100 DBS ANNUAL REPORT 2012 | FINANCIAL STATEMENTS
related transfer transaction occurred. The amendments also clarify the conditions under which an entity is deemed to have transferred a fi nancial asset.
Please refer to Note 22 for the corresponding disclosures.
Standards to be adopted in future reporting periods are outlined in Note 4. A summary of the most signifi cant group accounting policies are described further below starting with those relating to the entire fi nancial statements followed by those relating to the income statement, the balance sheet and other specifi c topics. This does not refl ect the relative importance of these policies to the Group. A summary of the accounting policies for areas that are not material for the Group’s fi nancial statements for the current year are not presented.
A) General Accounting Policies
2.4 GROUP ACCOUNTING
SubsidiariesSubsidiaries are entities over which the Group has the power to govern the fi nancial and operating policies so as to obtain benefi ts from their activities. It is generally accompanied by a shareholding of more than 50% of voting rights. Potential voting rights that are currently exercisable or convertible are considered when determining whether an entity is considered a subsidiary.
The acquisition method is used to account for business combinations. Subsidiaries are consolidated from the date control is transferred to the Group to the date control ceases. The consideration transferred for an acquisition is measured as the acquisition-date fair value of the assets transferred, the liabilities incurred and the equity interests issued. Acquisition-related costs are expensed as incurred. Identifi able assets acquired, and liabilities and contingent liabilities assumed in a business combination are measured initially at their fair values on the date of acquisition. Refer to Note 2.12 for the Group’s accounting policy on goodwill.
All intra-group transactions, balances, income and expenses are eliminated on consolidation.
Special purpose entitiesIn the normal course of business, the Group is involved with a number of entities with limited and predetermined activities (special purpose entities or SPEs) in different capacities such as through derivative transactions. While the Group may hold little or no equity in SPEs, it may consolidate such entities under certain circumstances. These include situations where:
• the activities of the SPE are being conducted on behalf of the Group according to its specifi c business needs so that the Group obtains benefi ts from the SPE’s operation;
• the Group has the decision-making powers to obtain the majority of the benefi ts of the activities of the SPE or, by setting up an ‘autopilot’ mechanism, the Group has delegated these decision-making powers;
• the Group has rights to obtain the majority of the benefi ts of the SPE and therefore may be exposed to risks incidental to the activities of the SPE; or
• the Group retains the majority of the residual or ownership risks related to the SPE or its assets in order to obtain benefi ts from its activities.
The main SPEs that the Group controls and consolidates are outlined in Note 23. These entities are used for issuance of structured products on behalf of the Group.
Joint venturesJoint ventures are entities that are jointly controlled by the Group together with one or more parties through contractual arrangements. The Group recognises its interests in joint ventures using the proportionate consolidation method.
Associates Associates are entities over which the Group has signifi cant infl uence, but no control, and generally holds a shareholding of between and including 20% and 50% of the voting rights. The Group recognises its investments in associates using the equity method of accounting.
Under the equity method of accounting, an investment is initially carried at cost. The carrying amount is increased or decreased to recognise the Group’s share of net assets of the associate, less any impairment in value after the date of acquisition. The results of the associates are taken from the latest audited accounts or unaudited management accounts of the associates and adjusted where required to align with the Group’s application of FRS. The accounts are prepared at dates not more than three months prior to the end of the fi nancial year of the Group. Adjustments are made for the effects of signifi cant transactions or events that occur between the two dates.
2.5 FOREIGN CURRENCY TREATMENT
Functional and presentation currencyItems in the fi nancial statements of the Company and each of the Group’s subsidiaries are measured using the entities’ functional currency, being the currency of the primary economic environment in which the entity operates. The Company’s fi nancial statements are presented in Singapore dollars, which is its functional currency. It is also the Group’s presentation currency because Singapore dollars form the major currency in which the Group transacts, incurs cost and funds its business.
Foreign currency transactions Transactions in foreign currencies are measured at the exchange rate ruling at the date of the transaction.

p101FINANCIAL STATEMENTS | DBS ANNUAL REPORT 2012
Monetary assets and liabilities denominated in foreign currencies are translated into the functional currency of the entity undertaking the transaction at the exchange rate ruling as at the balance sheet date. Foreign exchange differences arising from this translation are recognised in the income statement. Non-monetary assets and liabilities measured at cost in a foreign currency are translated using the exchange rate at the date of the transaction.
Unrealised foreign exchange differences arising from non-monetary fi nancial assets classifi ed as fair value through profi t or loss are recognised in the income statement in trading income. For non-monetary fi nancial assets such as equity investments classifi ed as available-for-sale, unrealised foreign exchange differences are recorded in other comprehensive income and accumulated in equity until the assets are disposed of or become impaired.
Foreign currency translation The results and fi nancial position of the Group’s operations whose functional currency is not Singapore dollars are translated into Singapore dollars in the following manner:
• Assets and liabilities are translated at the exchange rates ruling as at the balance sheet date;
• Income and expenses in the income statement are translated at exchange rates prevailing at each month-end, approximating the exchange rates at the dates of the transactions; and
• All resulting exchange differences are recognised in other comprehensive income.
For acquisitions prior to 1 January 2005, comprising mainly DBS Bank (Hong Kong) Limited and DBS Vickers Securities Holdings Pte Ltd, the foreign exchange rates at the respective dates of acquisition were used. Please refer to Note 26 for an overview of goodwill recorded. Goodwill and fair value adjustments arising on the acquisition of a foreign operation on or after 1 January 2005 will be treated as assets and liabilities of the foreign operation and translated at the closing rate.
On consolidation, foreign exchange differences arising from the translation of net investments in foreign entities, as well as any borrowings and instruments designated as foreign currency hedges of such investments, are recognised in other comprehensive income and accumulated under capital reserves in equity. When a foreign operation is disposed of, such currency translation differences are recognised in the income statement as part of the gain or loss on disposal.
2.6 SEGMENT REPORTING
Operating segments are reported in a manner consistent with the internal reporting provided to management responsible for allocating resources and assessing performance of the operating segments. Segment income, segment profi ts, segment assets and segment liabilities are also measured on a basis that is consistent with internal reporting.
The Group’s operating segments comprise Consumer Banking/Wealth Management, Institutional Banking, Treasury and Others (including activities from corporate decisions, capital and balance sheet management, funding and liquidity). In total, the Group has four reportable segments.
As part of a group that provides integrated fi nancial activities, segments frequently interact with one another including the integrated provision of fi nancial services across its business lines. External client incomes and expenses incurred by internal service providers to reportable segments are allocated on a basis that refl ects the relative value generated by each segment. Assets and liabilities of the reportable segments are funded through and invested with the funding management unit within the “Others” segment. Specifi c and general allowances are generally allocated to the same segment where the corresponding assets to which the provisions pertain to are reported.
The Group also prepares disclosures on its main geographical areas. The segments represent the aggregate fi nancial position of those legal entities that are located in the geographical area (i.e. booking location). The presentation of these segments does not necessarily represent the country to which the Group has exposure due to cross border activities. The credit exposure from customer loans by country of incorporation of borrower is provided in Note 20.
Please refer to Note 47 for further details on business and geographical segment reporting.
B) Income Statement
2.7 REVENUE RECOGNITION
Interest income and interest expenseInterest income and interest expense as presented in Note 5 represent the income on all assets and liabilities regardless of the classifi cation and measurement of the assets and liabilities on accrual or at fair value. No interest expense is accrued on the Group’s structured investment deposits which are carried at fair value through profi t or loss.
Interest income and interest expense are recognised on a time-proportionate basis using the effective interest method as prescribed by FRS. The calculation includes signifi cant fees and transaction costs that are integral to the effective interest rate, as well as premiums or discounts.
Fee and commission incomeThe Group earns fee and commission income from a diverse range of products and services provided to its customers. Fee and commission income is recognised on the completion of a transaction. For a service that is provided over a period of time, fee and commission income is recognised over the period during which the related service is provided or credit risk is undertaken. Specifi cally:

p102 DBS ANNUAL REPORT 2012 | FINANCIAL STATEMENTS
• Card-related fee and commission income is recognised net of interchange fees paid;
• Income from issued fi nancial guarantees are generally amortised over the duration of the instruments. For loan commitments, revenue is recognised over the period covered by the commitment. Please see Note 2.15 for the accounting policy on such commitments. Loan syndication fee received as payment for arranging a loan is recognised as revenue when the act has been completed, i.e. when the syndication has been fi nalised and the Group retained no part of the loan package for itself, or retained a part at the same effective interest rate as for the other participants;
• Management and advisory fees are recognised over the period for which the services are provided.
Fees that are recognised upon the completion of a single transaction include underwriting fees, brokerage fees and fees related to completion of corporate fi nance transactions in general.
Expenses that are required, directly related and incremental to the revenue generation are offset in the net fee and commission. These typically include brokerage fees paid, card-related expenses, sales commissions but do not include expenses for services delivered over a period (service contracts) and other expenses that are not directly related to any specifi c transaction. Judgment is required in making these determinations.
Dividend incomeDividend income is recognised when the right to receive payment is established. This is generally the ex-dividend date for listed equity securities, and usually the date when shareholders have approved the dividend for unlisted equity securities. Dividend income arising from held for trading fi nancial assets is recognised in “Net trading income”, while that arising from available-for-sale fi nancial assets is recognised in “Net income from fi nancial investments”.
Allowances for credit and other lossesPlease refer to Note 2.10 for the accounting policy on impairment on fi nancial assets including loan loss provisions.
C) Balance Sheet
2.8 FINANCIAL ASSETS
Initial recognition Purchases and sales of all fi nancial assets regardless of the subsequent classifi cation and measurement are recognised on the date that the Group enters into the contractual provisions of the arrangements with counterparties. When the Group acts in a capacity as trustee or other fi duciary capacity without the direct control or direct benefi t from the assets, these assets and the corresponding income belonging to a customer are excluded from the fi nancial statements.
Financial assets are initially recognised at fair value, which is usually the transaction price.
Classifi cation and subsequent measurementThe Group attempts to classify and measure fi nancial assets based on the business model in which they are applied and how management monitors performance. The classifi cation is consistently applied across segments and where allowed by FRS. FRS mandates the classifi cation and measurement for fi nancial assets based on their nature and purpose, which broadly means:
• Financial assets (other than derivatives) that are managed mainly for longer term holding and collection of payments are classifi ed as loans and receivables. These assets have fi xed or determinable payments, are not quoted in an active market and are mainly transactions within the segments “Consumer Banking/Wealth Management” and “Institutional Banking”. Loans and receivables are carried at amortised cost using the effective interest method. The majority of these assets are reported on the balance sheet under “Due from banks” and “Loans and advances to customers” but also in other captions. The income from these assets is reported in the income statement mainly as “Interest income”.
• Financial assets that are managed on a fair value basis, mainly in “Treasury” segment, are classifi ed as fi nancial assets at fair value through profi t or loss. Such assets include instruments held for the purpose of short term selling and market making, or designated under the fair value option if doing so eliminates or signifi cantly reduces measurement or recognition inconsistencies that would otherwise arise, or if the fi nancial asset contains an embedded derivative that would otherwise need to be separately recorded.
Financial assets at fair value through profi t or loss are reported on the balance sheet mainly under “Financial assets at fair value through profi t or loss” and “Singapore Government securities and treasury bills” where these are held either for the purpose of market making and trading purposes. Realised or unrealised gains or losses on such fi nancial assets, except interest income, are taken to “Net trading income” and “Net income from fi nancial instruments designated at fair value” in the income statement in the period they arise.
• Derivatives are classifi ed as assets when the fair value is positive (“Positive fair values for fi nancial derivatives”) and as liabilities when the fair value is negative (“Negative fair values for fi nancial derivatives”). Changes in the fair value of derivatives other than those designated as hedges in accordance with Note 2.18 are included in “Net trading income”. Where a derivative is linked to and settled by delivery of an unquoted equity instrument whose fair value cannot be reliably measured, cost may be the best

p103FINANCIAL STATEMENTS | DBS ANNUAL REPORT 2012
and only approximation of fair value for the derivative. In some cases, derivatives may be embedded in fi nancial contracts otherwise carried at amortised cost. Embedded derivatives may be separated from the host contract and accounted for as a standalone derivative instrument at fair value through profi t or loss when required by FRS 39. For such cases, the embedded derivatives are reported on the balance sheet under “Positive/Negative fair values for fi nancial derivatives” and are measured at fair value with changes in fair value recognised in “Net trading income”.
• The Group holds fi nancial assets for the purpose of investment or satisfying regulatory liquidity requirements. Such assets are held for an indefi nite period and may be sold in response to needs for liquidity or changes in interest rates, credit spreads, exchange rates or equity prices. Financial assets in this catergory are held in all business segments as well as the liquidity management unit in the “Others” segment. These assets are classifi ed as available-for-sale and initially and subsequently measured at fair value.
Unrealised gains or losses arising from changes in fair value are recognised in other comprehensive income and accumulated in available-for-sale revaluation reserves. When sold or impaired, the accumulated fair value adjustments in the available-for-sale revaluation reserves are reclassifi ed to the income statement. Unquoted equity investments classifi ed as available-for-sale for which fair values cannot be reliably determined are carried at cost, less impairment. These assets are presented on the balance sheet under “Singapore Government securities and treasury bills” and “Financial investments”.
Where FRS does not allow for a classifi cation and measurement that refl ect the management of the fi nancial assets (or fi nancial liabilities), the Group may apply hedge accounting where permissible and relevant to better refl ect the management of the fi nancial assets. Please see Note 2.18 for details on hedging and hedge accounting.
Please refer to Note 16 for further details on the types of fi nancial assets classifi ed and measured as above.
Reclassifi cation of fi nancial assetsWhen the purpose for holding a fi nancial asset changes, or when FRS otherwise requires it, non-derivative fi nancial assets are reclassifi ed accordingly. Financial assets may be classifi ed out of the fair value through profi t or loss or available-for-sale categories in particular circumstances as prescribed by FRS 39. The Group made a one-off reclassifi cation in 2008 and 2009 as outlined in Note 16.
Reclassifi cations are made at fair value as of the reclassifi cation date. The fair value becomes the new cost or amortised cost as applicable. Any gain or loss already recognised in the income statement before the reclassifi cation date is not reversed.
Determination of fair valueThe fair value of fi nancial assets is the amount for which they could be exchanged between knowledgeable, willing parties in arm’s length transaction. Determining fair value is considered a signifi cant accounting policy for the Group and further details are disclosed in Note 42.1 on fair value measurements.
OffsettingFinancial assets and liabilities are presented net when there is a legally enforceable right to set off the recognised amounts and there is an intention to settle them on a net basis, or realise the asset and settle the liability simultaneously.
DerecognitionFinancial assets are derecognised when the rights to receive cash fl ows from the fi nancial assets have expired or have been transferred and the Group has transferred substantially all risks and rewards of ownership.
The Group enters into certain transactions where it transfers fi nancial assets recognised on its balance sheet but retains either all or a portion of the risks and rewards of the transferred fi nancial assets. If all or substantially all risks and rewards are retained, the transferred fi nancial assets are not derecognised from the balance sheet. Transactions where transfers of fi nancial assets result in the Group retaining all or substantially all risks and rewards include repurchase transactions described in Note 2.11. They also include certain transactions where control over the fi nancial asset is retained, for example, by a simultaneous transaction with the same counterparty to which the asset is transferred such as options. They are mainly transacted in the “Treasury” segment. In such cases the Group continues to recognise the asset to the extent of its continuing involvement, determined by the extent to which it is exposed to changes in the value of the transferred asset.
Please refer to Note 22 for disclosures on transferred fi nancial assets.
2.9 CASH AND CASH EQUIVALENTS
For the purposes of the cash fl ow statement, cash and cash equivalents comprise cash on hand and non-restricted balances with central banks which are readily convertible into cash.
2.10 IMPAIRMENT OF FINANCIAL ASSETS
The Group assesses at each balance sheet date whether there is objective evidence that a fi nancial asset or a group of fi nancial assets is impaired.
(a) Financial assets classifi ed as loans and receivables The Group carries out regular and systematic reviews of all
credit facilities extended to customers.
The criteria that the Group uses to determine that there is objective evidence of an impairment loss include:

p104 DBS ANNUAL REPORT 2012 | FINANCIAL STATEMENTS
• Signifi cant fi nancial diffi culty of the issuer or obligor, including breach of covenants and/or fi nancial conditions;
• A breach of contract, such as a default or delinquency in interest or principal payments;
• Granting of a concession to the borrower, for economic or legal reasons relating to the borrower’s fi nancial diffi culty, that the Group would not otherwise consider; and
• High probability of bankruptcy or other fi nancial reorganisation of the borrower.
Specifi c allowances for credit lossesA specifi c allowance for credit losses is established if there is objective evidence that the Group will be unable to collect all amounts due under a claim according to the original contractual terms or the equivalent value. A “claim” means a loan, debt security or a commitment such as fi nancial guarantees and letters of credit.
A specifi c allowance for credit losses is recorded as a reduction in the carrying value of a claim on the balance sheet. For an off-balance sheet item such as a commitment, a specifi c allowance for credit loss is recorded as a component within other liabilities.
Specifi c allowances for credit losses are evaluated either individually or collectively for a portfolio.
Specifi c allowance for an individual credit exposure is made when existing facts, conditions or valuations indicate that the Group is not likely to collect the principal and interest due contractually on the claim. An allowance is reversed only when there has been an identifi able event that led to an improvement in the collectability of the claim. The amount of specifi c allowance also takes into account the collateral value, which may be discounted to refl ect the impact of a forced sale or untimely liquidation. Over-due unsecured consumer loans which are homogenous in nature such as credit card receivables are pooled according to their delinquency behaviour and evaluated for impairment collectively as a group, taking into account the historical loss experience of such loans.
When a loan is uncollectible, it is written off against the related allowance for loan impairment. Such loans are written off after all the necessary procedures have been completed and the amount of the loss has been determined. Recoveries in full or in part of amounts previously written off are credited to the income statement in “Allowances for credit and other losses”.
General allowances for credit lossesApart from specifi c allowances, the Group also carries general allowances for credit losses. The Group maintains a level of allowances that is deemed suffi cient to absorb the estimated credit losses inherent in its loan portfolio (including off-balance
sheet credit exposures). The Group maintains general allowances of at least 1% of credit exposures arising from both on and off-balance sheet items (against which specifi c allowances have not been made) adjusted for collaterals held. This is in accordance with the transitional arrangements under Notice to Banks No. 612 “Credit Files, Grading and Provisioning” issued by the Monetary Authority of Singapore.
Loans which are restructured as determined in Note 43.2 will no longer be presented as past due but remain classifi ed as non-performing. Accordingly such loans will continue to follow the accounting treatment for the relevant classifi cation as outlined above.
(b) Financial assets classifi ed as available-for-sale The Group assesses at each balance sheet date whether
there is objective evidence that an available-for-sale fi nancial asset is impaired. In the case of an equity investment, a signifi cant or prolonged decline in the fair value of the security below its cost is considered in determining whether the asset is impaired. When there is objective evidence of an impairment of an available-for-sale fi nancial asset, the cumulative loss – measured as the difference between the acquisition cost and the current fair value, less any impairment loss on that fi nancial asset previously recognised in the income statement – is reclassifi ed from the revaluation reserve within equity to the income statement. Impairment losses recognised in the income statement on equity investments are not reversed, until the equity investments are disposed of. A subsequent recovery in the value of an available-for-sale debt instrument whose value has been impaired is reversed through the income statement if there has been an identifi able event that led to the recovery.
2.11 REPURCHASE AGREEMENTS
Repurchase agreements (Repos) are treated as collateralised borrowing. The amount borrowed is refl ected as a liability either as “Due to non-bank customers”, “Due to banks” or “Financial liabilities at fair value through profi t or loss” when related to trading activities. The securities sold under repos are treated as pledged assets and remain on the balance sheet at amortised cost or fair value depending on their classifi cation.
Reverse repurchase agreements (Reverse repos) are treated as collateralised lending. The amount lent is refl ected as an asset either as “Loans and advances to customers”, “Due from banks” or “Financial assets at fair value through profi t or loss”.
Amounts paid and received in excess of the amounts borrowed and lent on the repos and reverse repos are amortised as interest expense and interest income respectively using the effective interest method.

p105FINANCIAL STATEMENTS | DBS ANNUAL REPORT 2012
2.12 GOODWILL ON CONSOLIDATION
Goodwill arising from business combinations on or after 1 January 2010 represents the excess of the consideration transferred, the amount of any non-controlling interest in the acquiree and the acquisition-date fair value of any previous equity interest in the acquiree over the fair value of the net identifi able assets acquired. Goodwill in business combinations prior to 1 January 2010 represents the excess of acquisition cost over the fair values of the identifi able assets acquired, liabilities and contingent liabilities assumed at the date of exchange. Goodwill is stated at cost less impairment losses and it is tested at least annually for impairment.
At the acquisition date, any goodwill acquired is allocated to each of the cash-generating units (CGU) or group of CGUs expected to benefi t from the combination’s synergies for the purpose of impairment testing. The determination of CGUs takes into account how the Group manages and reports its businesses and requires judgment.
An impairment loss is recognised when the carrying amount of a CGU, including the goodwill, exceeds the recoverable amount of the CGU or group of CGUs to which goodwill is allocated. Recoverable amount of a CGU or CGU group is the higher of the CGU’s or CGU group’s fair value less cost to sell and its value-in-use. An impairment loss on goodwill is recognised in the income statement and cannot be reversed in subsequent periods.
2.13 PROPERTIES AND OTHER FIXED ASSETS
Properties (including investment properties) and other fi xed assets are stated at cost less accumulated depreciation and allowances for impairment. The cost of an item of properties and other fi xed assets includes its purchase price and any cost that is directly attributable to bringing the asset to the location and condition necessary for it to be capable of operating in the manner intended by management.
Depreciation is calculated using the straight-line method to write down the cost of properties and other fi xed assets to their residual values over their estimated useful lives. Generally, the useful lives are as follows:
Buildings 50 years or over the remaining lease period, whichever is shorter
Leasehold land 100 years or remaining lease period, whichever is shorter. Leasehold land where the unexpired lease period is more than 100 years is not depreciated.
Intangible/Computer software 3 - 5 yearsOffi ce equipment, furniture and fi ttings 5 - 10 years
The estimated useful life and residual values of properties and other fi xed assets are reviewed on each balance sheet date.
Subsequent expenditure relating to properties and other fi xed assets that has already been recognised is added to the carrying amount of the asset only when it is probable that future economic benefi ts associated with the item will fl ow to the Group and the cost can be measured reliably. Other subsequent expenditure is recognised as hire and maintenance expense in the income statement during the fi nancial year in which it is incurred.
Properties and other fi xed assets are subject to an impairment review if there are events or changes in circumstances which indicate that the carrying amount may not be recoverable.
Upon disposal, the difference between the net disposal proceeds and the carrying amount is taken to the income statement.
Please refer to Note 27 for the details of properties and other fi xed assets and their movements during the year.
2.14 FINANCIAL LIABILITIES
Initial recognition, classifi cation and subsequent measurementFinancial liabilities are initially recognised at fair value.The Group classifi es and measures its fi nancial liabilities where allowed by FRS in accordance with the purpose for which the fi nancial liabilities are incurred and managed. Accordingly,
• Financial liabilities are classifi ed as fi nancial liabilities at fair value through profi t or loss if they are incurred for the purpose of repurchasing in the near term (held for trading) or designated by management on initial recognition (designated under the fair value option). This is mainly the case within the “Treasury” segment and pertains often to short positions in securities for the purpose of ongoing market making, hedging or trading. Such fi nancial liabilities are reported on the balance sheet under “Financial liabilities at fair value through profi t or loss”.
In addition, some fi nancial liabilities used to fund specifi c fi nancial assets measured at fair value through profi t or loss are designated under the fair value option when doing so eliminates or signifi cantly reduces measurement or recognition inconsistencies that would otherwise arise. Please refer to Note 31 for details on these fi nancial liabilities in the Group’s fi nancial statements.
Realised or unrealised gains or losses on fi nancial liabilities held for trading and fi nancial liabilities designated under the fair value option, except interest expense, are taken to “Net trading income” and “Net income from fi nancial instruments designated at fair value” respectively in the income statement in the period they arise.

p106 DBS ANNUAL REPORT 2012 | FINANCIAL STATEMENTS
• Derivative liabilities are treated consistently with derivative assets. Please refer to Note 2.8 for the accounting policy on derivatives.
• Other fi nancial liabilities are carried at amortised cost using the effective interest method. These comprise predominantly the Group’s deposit portfolio under “Due to non-bank customers” and “Due to banks”, and those under “Other liabilities”.
Please refer to Note 16 for further details on the types of fi nancial liabilities classifi ed and measured as above.
Determination of fair valueThe fair value of fi nancial liabilities is the amount the liability can be settled at. The fair value is estimated by discounting the future contractual cash fl ows at the current market interest rate that is available to the Group for similar fi nancial instruments. Where applicable, a valuation reserve or pricing adjustment is applied to arrive at the fair value.
Please refer also to Note 42.1 for further fair value measurement disclosures.
DerecognitionA fi nancial liability is derecognised from the balance sheet when the obligation specifi ed in the contract is discharged, cancelled or expired.
2.15 LOAN COMMITMENTS, LETTERS OF CREDIT AND FINANCIAL GUARANTEES
Loan CommitmentsLoan commitments are typically not fi nancial instruments and are not recognised on balance sheet but are disclosed off-balance sheet in accordance with FRS 37 Provisions, Contingent Liabilities and Contingent Assets. They form part of the disclosures in Note 38. Upon a loan draw-down by the counterparty, the amount of the loan is generally accounted for under “Loans and receivables” as described in Note 2.8.
Letters of CreditLetters of credit are recorded off-balance sheet as contingent liabilities upon issuance, and the corresponding payables/receivables to/from the benefi ciaries/applicants are recorded upon acceptance of the underlying documents.
Financial GuaranteesA fi nancial guarantee is initially recognised in the fi nancial statements at fair value on the date the guarantee was given. Subsequent to initial recognition, the Group’s liability under each guarantee is measured at the higher of the initial measurement less amortisation and the best estimate of the expenditure required to settle any fi nancial obligation arising at the balance sheet date.
The exposure to potential losses associated with a fi nancial guarantee is monitored periodically. When there is objective evidence indicating probable losses, a provision is recognised for the fi nancial guarantee.
2.16 PROVISIONS AND OTHER LIABILITIES
Provisions are recognised when:
• the Group has a present legal or constructive obligation as a result of past events;
• it is probable that an outfl ow of resources embodying economic benefi ts will be required to settle the obligation; and
• a reliable estimate of the amount of the obligation can be made.
The amount recognised as a provision is the best estimate of the expenditure required to settle the present obligation at the balance sheet date.
2.17 SHARE CAPITAL AND TREASURY SHARES
Ordinary shares and preference shares which do not result in the Group having a contractual obligation to deliver cash or another fi nancial asset, or to exchange fi nancial assets or fi nancial liabilities with the holder under conditions that are potentially unfavourable to the Group, are classifi ed as equity. Incremental external costs directly attributable to the issuance of new shares are deducted against share capital.
When any entity within the Group purchases the Company’s ordinary shares (“treasury shares”), the consideration paid including any directly attributable incremental cost is presented as a component within equity, until they are cancelled, sold or reissued.
When treasury shares are subsequently cancelled, the cost of the treasury shares is deducted against either the share capital account or retained earnings. When treasury shares are subsequently sold or reissued, any realised gain or loss on sale or reissue, net of any directly attributable incremental transaction costs and related income tax, is recognised in capital reserves.
Interim dividends are recorded during the fi nancial year in which they are declared payable. Final dividends are recorded during the fi nancial year in which the dividends are approved by the shareholders at the Annual General Meeting.
D) Other Specifi c Topics
2.18 HEDGING AND HEDGE ACCOUNTING
The Group uses derivative contracts as part of its hedging strategies for hedging interest rate risk arising from maturity

p107FINANCIAL STATEMENTS | DBS ANNUAL REPORT 2012
mismatches or for hedging currency risk from currency mismatch and cash fl ows in foreign currencies.
In some cases, these hedges are designated as such for accounting purposes in order to modify the timing of the recognition of the profi t or loss from the instruments in accordance with the items they are intended to hedge. Such designation requires the Group to meet strict requirement for documentation and hedge effectiveness as set out in FRS 39. For such hedge accounting relationships, each entity within the Group documents at the inception the relationship between the hedging instrument and hedged item, including the risk management objective for undertaking various hedge transactions and methods used to assess the effectiveness of the hedge. Each entity within the Group also documents its assessment, both at hedge inception and on an ongoing basis, of whether the derivative is highly effective in offsetting changes in the fair value or cash fl ows of the hedged item.
Specifi cally hedge accounting is applied in the following types of hedge relationships.
Fair value hedgeThe Group’s fair value hedges consist principally of interest rate swaps used for managing the interest rate gaps that naturally arise from its purchases or issues of debt securities, and where a mismatch in the measurement between the hedging derivative (measured at fair value through profi t or loss) and the hedged item (measured at amortised cost) exists. Such hedges are used in the “Treasury” and “Others” segments.
For a qualifying fair value hedge, the changes in the fair value of the hedging derivatives are recorded in the income statement, together with any changes in the fair value of the hedged item attributable to the hedged risk. Gain or loss arising from hedge ineffectiveness is recognised in the income statement.
If the hedge no longer meets the criteria for hedge accounting, the adjustment to the carrying amount of a hedged item is amortised to the income statement over its remaining maturity, using the effective interest method.
Cash fl ow hedgeCash fl ow hedge accounting is employed principally for hedges against variability in exchange rates from highly probable forecast transactions including interest cash fl ows expected to occur at various future dates. In addition, cash fl ow hedge accounting is applied to currency swaps used to hedge foreign currency cash fl ows of purchased bonds to avoid volatility from the recognition of changes in forward points in the currency swaps that is inconsistent with the management’s strategy. Such hedging is performed mainly by funding management unit in “Others” segment.
The effective portion of changes in the fair value of a derivative designated and qualifying as a hedge of future cash fl ows is
recognised in other comprehensive income and accumulated under the cash fl ow hedge reserve in equity, and reclassifi ed to the income statement in the periods when the hedged forecast cash fl ows affect the income statement. The ineffective portion of the gain or loss is recognised immediately in the income statement under “Net trading income”.
When a hedging instrument expires or is sold, or when a hedge no longer meets the criteria for hedge accounting, any cumulative gain or loss existing in the cash fl ow hedge reserve remains until the forecast transaction is ultimately recognised in the income statement. When a forecast transaction is no longer expected to occur, the cumulative gain or loss in the cash fl ow hedge reserve is reclassifi ed from equity to the income statement.
Net investment hedgeNet investment hedging is applied to hedge investments which comprise certain subsidiaries, branches, associates and joint ventures with a functional currency different from that of the Group. Under the Group’s hedging strategy, the carrying amount of these investments could be fully hedged, partially hedged or fully opened.
Hedges of net investments in the Group’s foreign operations are accounted for in a manner similar to cash fl ow hedges. The gain or loss from the derivative relating to the effective portion of the hedge is recognised in other comprehensive income and accumulated under the capital reserves in equity. The gain or loss relating to the ineffective portion of the hedge is recognised immediately in the income statement under “Net trading income”. On disposal of the foreign operations, the cumulative gain or loss in the capital reserves is reclassifi ed to the income statement under “Net trading income”.
Economic hedges which do not qualify for hedge accountingSome hedging instruments serve as fully or partially effective economic hedges but do not qualify for hedge accounting given the exact nature of the derivatives or due to the inability to prove expected effectiveness of the hedging relationship within the strict requirements outlined by FRS 39. This includes entering into swaps and other derivatives (e.g. futures, options) to manage interest rate, foreign exchange and other risks. Such hedges are treated in the same way as derivative instruments used for trading purposes, i.e. realised and unrealised gains and losses are recognised in “Net trading income”. Similarly, the hedged exposures are typically recorded at fair value through profi t or loss, thereby achieving some measure of offset in the income statement.
Derivatives that do not qualify for hedge accounting include some hedges entered into as part of documented interest rate management strategies. The size and direction of changes in fair value of non-qualifying hedges can be volatile from year to year, but do not alter the cash fl ows expected as part of the documented management strategies for both the non-

p108 DBS ANNUAL REPORT 2012 | FINANCIAL STATEMENTS
qualifying hedge instruments and the assets and liabilities to which the documented interest rate strategies relate. Non-qualifying hedges therefore operate as economic hedges of the related assets and liabilities.
Please refer to Note 39.2 for disclosures on hedging derivatives.
2.19 EMPLOYEE BENEFITS
Employee benefi ts, which include base pay, cash bonuses, share-based compensation, contribution to defi ned contribution plans such as the Central Provident Fund and other staff-related allowances, are recognised in the income statement when incurred. For defi ned contribution plans, contributions are made to publicly or privately administered funds on a mandatory, contractual or voluntary basis. Once the contributions have been paid, the Group has no further payment obligations.
Employee entitlement to annual leave is recognised when they accrue to employees. A provision is made for the estimated liability for annual untaken leave as a result of services rendered by employees up to the balance sheet date.
2.20 SHARE-BASED COMPENSATION
Employee benefi ts also include share-based compensation, namely the DBSH Share Ownership Scheme (the Scheme), the DBSH Share Option Plan, the DBSH Share Plan and the DBSH Employee Share Plan (the Plans). The details of the Scheme and Plans are described in Note 40.
Equity instruments granted and ultimately vested under the Plans are recognised in the income statement based on the fair value of the equity instrument at the date of grant. The expense is amortised over the vesting period of each award, with a corresponding adjustment to the share option/plan reserves. Monthly contributions to the Scheme are expensed off when incurred.
For the DBSH Share Plan and the DBSH Employee Share Plan, a trust has been set up for each share plan. The employee trust funds are consolidated and the DBSH shares held by the trust funds are accounted for as “Treasury shares”, which is presented as a deduction within equity.
2.21 CURRENT AND DEFERRED TAXES
Current income tax for current and prior periods is recognised at the amount expected to be paid or recovered from the tax authorities, using the tax rates and tax laws that have been enacted or substantively enacted by the balance sheet date. The Group considers uncertain tax positions generally at the level of the total tax liability to each tax authority for each period. The liability is determined based on the total amount of current tax expected to be paid, taking into account all tax
uncertainties, using either an expected value approach or a single best estimate of the most likely outcome.
Tax assets and liabilities of the same type (current or deferred) are offset when a legal right of offset exist and settlement in this fashion is intended. This applies generally when they arise from the same tax reporting group and relate to the same tax authority.
Deferred income tax is provided on temporary differences arising between the tax bases of assets and liabilities and their carrying amounts in the fi nancial statements. Temporary differences are not recognised for goodwill that is not deductible for tax purposes and for the initial recognition of assets or liabilities that neither affects accounting nor taxable profi t, other than a business combination. The amount of deferred tax provided is based on the expected manner of realisation or settlement of the carrying amount of assets and liabilities, using tax rates enacted or substantively enacted by the balance sheet date.
Deferred tax assets are recognised to the extent that it is probable that future taxable profi ts will be available against which the temporary differences can be utilised. Deferred tax is provided on temporary differences arising from investments in subsidiaries, branches, associates and joint ventures, except where the timing of the reversal of the temporary difference can be controlled and it is probable that the temporary difference will not be reversed in the foreseeable future.
Deferred tax related to fair value re-measurement of available-for-sale investments, which are recognised outside profi t or loss, is also recognised outside profi t or loss i.e. in other comprehensive income and accumulated in the available-for-sale revaluation reserves.
3 CRITICAL ACCOUNTING ESTIMATES
The Group’s accounting policies and use of estimates are integral to the reported results. Certain accounting estimates require exercise of management’s judgment in determining the appropriate methodology for valuation of assets and liabilities. In addition, procedures are in place to ensure that methodologies are reviewed and revised as appropriate. The Group believes its estimates for determining the valuation of its assets and liabilities are appropriate.
The following is a brief description of the Group’s critical accounting estimates involving management’s valuation judgment.
3.1 IMPAIRMENT ALLOWANCES
It is the Group’s policy to establish, through charges against profi t, specifi c and general allowances in respect of estimated and inherent credit losses in its portfolio as described in Note 2.10.

p109FINANCIAL STATEMENTS | DBS ANNUAL REPORT 2012
A signifi cant judgmental area is the calculation of general and other allowances assessed on a collective basis. Such allowances require judgment partly because it is not possible or practical to determine losses on individual loans due to the large number of individual loans and hence a portfolio assessment is required taking into account historical data and combined with professional judgment by management on the current economic and credit environment. In determining such allowances, management considers country and portfolio risks, as well as industry practices. Please refer to the Risk Management section for a further description of the risk management strategies applied.
3.2 FAIR VALUE OF FINANCIAL INSTRUMENTS
Fair value is defi ned as the price that would be received to sell an asset or paid to transfer a liability in an orderly transaction. The majority of the Group’s fi nancial instruments reported at fair value are based on quoted and observable market prices or on internally developed models that are based on independently sourced market parameters, such as interest rate yield curves, credit spreads, exchange prices, dividend yields, option volatilities and foreign exchange rates. Valuation reserves or pricing adjustments where applicable will be used to converge to fair value.
The determination of fair value is subject to the Valuation Framework approved by the Board Risk Management Committee (BRMC) and the oversight of senior management committees. The Valuation Framework is implemented by the Group through policies and procedures approved by the committees. These policies and procedures facilitate the exercise of judgment in determining the risk characteristics of various fi nancial instruments, discount rates, estimates of future cash fl ows and other factors used in the valuation process. Judgment may also be applied in adjusting prices for less readily observable external parameters such as through the use of valuation reserves. Other factors such as model assumptions and market dislocations leading to market anomalies can also materially affect these estimates. Please refer to Note 42 for details about the fair value hierarchy of the Group’s fi nancial instruments measured at fair value.
The fair value of fi nancial instruments without an observable market price in liquid market may be determined using valuations models. The choice of model requires signifi cant judgment for complex products especially those in the “Treasury” segment and is governed by the above Valuation Framework and subject to approval by an independent control function. Note 42 provides details of fi nancial instruments that are valued with observable and unobservable parameters (Levels 1 to 3). Instruments designated as Levels 2 and 3 are frequently revalued using a valuation technique employing a relevant model.
3.3 GOODWILL ON CONSOLIDATION
The Group performs an impairment review to ensure that the carrying amount of the CGU, to which the goodwill is allocated, does not exceed the recoverable amount of the CGU. Note 26 provides details of goodwill as of the reporting date.
The recoverable amount represents the present value of the estimated future cash fl ows expected to arise from continuing operations. Therefore, in arriving at the recoverable amount, management exercises judgment in estimating the future cash fl ows, growth rate and discount rate.
3.4 INCOME TAXES
The Group has exposure to income taxes in numerous jurisdictions. Signifi cant judgment is involved in determining the Group-wide provision for income taxes. The Group recognises liabilities for expected tax issues based on reasonable estimates of whether additional taxes will be due. Where uncertainty exists around the Group’s tax position including resolution of any related appeals or litigation processes, appropriate provisions are provided based on technical merits of the positions with the same tax authority. Note 28 provides details of the Group’s deferred tax assets/liabilities. In general, determination of the value of assets/liabilities relating to carry forward tax losses requires judgment.
Judgment is also required for other areas of the Group’s fi nancial statements including the application of hedge accounting and consolidation of entities.
4 EFFECTS ON FINANCIAL STATEMENTS ON ADOPTION OF NEW OR REVISED FRS
The Group has not applied the following FRS that have been issued but are not yet effective. These new/revised standards will be adopted by the Group for annual periods commencing on their effective dates as indicated below, and are not expected to have signifi cant impact to the Group’s fi nancial statements. The adoption of FRS 107, FRS 112 and FRS 113 as outlined below, will mandate additional disclosures for the Group’s fi nancial statements.
Amendments to FRS 1 Presentation of Items of Other Comprehensive Income (effective 1 July 2012)The amendments require entities to group items presented in Other Comprehensive Income on the basis of whether they are potentially recycled to the income statement (reclassifi cation adjustments). Where an entity presents its comprehensive income in two separate statements, the amendments specifi cally require these statements to be presented consecutively.
FRS 113 Fair Value Measurement (effective 1 January 2013)FRS 113 defi nes fair value, establishes a framework for measuring fair value and sets out the disclosure requirements for fair value measurements. It explains how to measure the fair

p110 DBS ANNUAL REPORT 2012 | FINANCIAL STATEMENTS
value when it is required by other FRS. It does not introduce new fair value measurements, neither does it eliminate the practicability exceptions to fair value measurements that currently exist in certain standards.
Amendments to FRS 107 Disclosures – Offsetting Financial Assets and Financial Liabilities (effective 1 January 2013)The amendments require more extensive disclosures than are currently required under FRS. The disclosures focus on quantitative information about recognised fi nancial instruments that are offset on the balance sheet, as well as those recognised fi nancial instruments that are subject to master netting or similar arrangements irrespective of whether they are offset on the balance sheet.
Annual Improvements 2011 (effective 1 January 2013)As part of IASB’s annual improvements project, there are amendments made to 7 standards this year. These revisions are of a technical or clarifying nature.
FRS 110 Consolidated Financial Statements (effective 1 January 2014)FRS 110 establishes control as the basis for determining which entities are consolidated. It provides a single model to be applied in the control analysis for all investees, including special purpose entities that are currently within the scope of INT FRS 12 Consolidation – Special Purpose Entities. Control exists under FRS 110 when the investor has power, exposure to variable returns and the ability to use that power to affect its returns from the investee.
FRS 111 Joint Arrangements (effective 1 January 2014)FRS 111 applies to all parties to a joint arrangement including those who participate in, but do not have joint control of, a joint arrangement. The standard prescribes the accounting for joint operations and joint ventures in both consolidated and separate fi nancial statements.
FRS 112 Disclosure of Interests in Other Entities (effective 1 January 2014)FRS 112 combines the existing disclosure requirements in a single disclosure standard. It requires the disclosure of summarised fi nancial information about each subsidiary that has material non-controlling interests as well as material associates and joint ventures. It also sets out new disclosure requirements such as fi nancial or other support provided to consolidated and unconsolidated structured entities, and fi nancial information about unconsolidated structured entities that the reporting entity had sponsored.
Amendments to FRS 32 Offsetting Financial Assets and Financial Liabilities (effective 1 January 2014)The amendments clarify that to qualify for offsetting in the balance sheet, the right of set-off must not be contingent on a future event. It also must be legally enforceable for all counterparties in the normal course of business, as well as in the event of default, insolvency or bankruptcy.
5 NET INTEREST INCOME
The GroupIn $ millions 2012 2011
Cash and balances with central banks and Due from banks 496 532Loans and advances to customers 5,644 4,571Debt securities 1,481 1,452
Total interest income 7,621 6,555
Due to banks 269 196Due to non-bank customers 1,684 1,267Others 383 267
Total interest expense 2,336 1,730
Net interest income 5,285 4,825
Comprising:Interest income for fi nancial assets at fair value through profi t or loss 353 317Interest income for fi nancial assets not at fair value through profi t or loss 7,268 6,238Interest expense for fi nancial liabilities at fair value through profi t or loss (92) (87)Interest expense for fi nancial liabilities not at fair value through profi t or loss (2,244) (1,643)
Total 5,285 4,825
6 NET FEE AND COMMISSION INCOME
The GroupIn $ millions 2012 2011
Stockbroking 179 214Investment banking 148 190Trade and remittances 320 284Loan-related 333 359Guarantees 79 71Deposit-related 74 82Cards(b) 299 267Wealth management 300 228Others(c) 43 71
Fee and commission income 1,775 1,766Less: fee and commission expense 196 224
Net fee and commission income(a) 1,579 1,542
(a) Includes net fee and commission income of $29 million (2011: $42 million), which is derived from the provision of trust and other fi duciary services during the year. Net fee and commission income earned from fi nancial assets or liabilities not at fair value through profi t or loss is $603 million (2011: $607 million) during the year
(b) Cards fees are net of interchange fees paid(c) 2011 includes fund management fees

p111FINANCIAL STATEMENTS | DBS ANNUAL REPORT 2012
7 NET TRADING INCOME
The GroupIn $ millions 2012 2011
Foreign exchange 705 726Interest rates, credit and equities(a) 32 (28)
Total 737 698
(a) Includes dividend income of $11 million (2011: $12 million)
8 NET LOSS FROM FINANCIAL INSTRUMENTS DESIGNATED AT FAIR VALUE
The GroupIn $ millions 2012 2011
Financial assets designated at fair value (3) (42)Financial liabilities designated at fair value (45) 24
Total (48) (18)
Gains or losses from changes in fair value of fi nancial liabilities designated at fair value not attributable to changes in market conditions are not material. Refer to Note 31.
9 NET INCOME FROM FINANCIAL INVESTMENTS
The GroupIn $ millions 2012 2011
Debt securities – Available-for-sale 294 301– Loans and receivables 7 6Equity securities(a)(b) 118 147
Total(c) 419 454
Comprising net gains transferred from: Available-for-sale revaluation reserves 345 425
(a) Includes gain on sale of unquoted equity securities which were stated at cost of $3 million (2011: $1 million), their carrying amounts were $40,000 (2011: $1) at the time of sale
(b) Includes dividend income of $38 million (2011: $24 million)(c) Includes fair value impact of hedges for the fi nancial investments
10 OTHER INCOME
The GroupIn $ millions 2012 2011
Rental income 23 19Net gain on disposal of properties and other fi xed assets 49 19Others(a) 470 92
Total 542 130
(a) 2012 includes a $450 million gain from the partial divestment of the Bank of the Philippine Islands investment. Refer to Note 25 for details. 2011 includes a $47 million gain from the disposal of DBS Asset Management
11 EMPLOYEE BENEFITS
The GroupIn $ millions 2012 2011
Salary and bonus 1,544 1,434Contributions to defi ned contribution plans 95 83Share-based expenses 68 54Others 181 141
Total 1,888 1,712
12 OTHER EXPENSES
The GroupIn $ millions 2012 2011
Computerisation expenses(a) 622 640Occupancy expenses(b) 330 291Revenue-related expenses 222 170Others(c) 552 490
Total 1,726 1,591
(a) Includes hire and maintenance of computer hardware and software (b) Includes rental expenses of offi ce and branch premises of $178 million
(2011: $148 million) and amounts incurred in the maintenance and service of buildings owned by the Group’s subsidiary companies
(c) Includes offi ce administration expenses (e.g. printing and stationery, telecommunications, etc), legal and professional fees
The GroupIn $ millions 2012 2011
Depreciation expenses 179 185Hire and maintenance of fi xed assets, including building-related expenses 319 277Expenses on investment properties 1 1Audit fees payable to external auditors(a):– Auditors of the Company 3 3– Associated fi rms of Auditors of the Company 3 3Non audit fees payable to external auditors(a): – Auditors of the Company # #– Associated fi rms of Auditors of the Company 1 1
# Amount under $500,000(a) PricewaterhouseCoopers network fi rms
13 ALLOWANCES FOR CREDIT AND OTHER LOSSES
The GroupIn $ millions 2012 2011
Loans and advances to customers (Note 20) 379 638Financial investments – Available-for-sale 16 4– Loans and receivables 1 17Properties and other fi xed assets 1 1Off-balance sheet credit exposures 5 26Others (bank loans and sundry debtors) 15 36
Total 417 722

p112 DBS ANNUAL REPORT 2012 | FINANCIAL STATEMENTS
The table below shows the movements in specifi c and general allowances during the year for the Group:
The Group Charge/ (Write-back) Net write- Exchange Balance at to income off during and other Balance atIn $ millions 1 January statement the year movements 31 December
2012Specifi c allowances Loans and advances to customers (Note 20) 1,188 198 (149) (20) 1,217Financial investments 66 17 (10) (2) 71Properties and other fi xed assets 62 1 (12) (1) 50Off-balance sheet credit exposures 40 (8) – (30) 2Others (bank loans and sundry debtors) 45 (2) (3) (1) 39
Total specifi c allowances 1,401 206 (174) (54) 1,379
Total general allowances for credit exposures 2,339 211 – (39) 2,511
Total allowances 3,740 417 (174) (93) 3,890
2011Specifi c allowances Loans and advances to customers (Note 20) 1,152 194 (177) 19 1,188Financial investments 72 28 (34) – 66Properties and other fi xed assets 68 1 (6) (1) 62Off-balance sheet credit exposures 24 17 – (1) 40Others (bank loans and sundry debtors) 119 4 (80) 2 45
Total specifi c allowances 1,435 244 (297) 19 1,401
Total general allowances for credit exposures 1,852 478 – 9 2,339
Total allowances 3,287 722 (297) 28 3,740

p113FINANCIAL STATEMENTS | DBS ANNUAL REPORT 2012
14 INCOME TAX EXPENSE
Income tax expense in respect of profi t for the fi nancial year is analysed as follows:
The GroupIn $ millions 2012 2011
Current tax expense– Current year 637 582– Prior years’ provision (63) (113)Deferred tax expense– Prior years’ provision (2) –– Effect of change in tax rate – 1– Origination of temporary differences 16 (27)
Total 588 443
The deferred charge/(credit) in the income statement comprises the following temporary differences:
The Group
In $ millions 2012 2011
Accelerated tax depreciation 7 (4)Allowances for loan losses 6 8Other temporary differences 1 (30)
Deferred tax charge/(credit) to income statement 14 (26)
The tax on the Group’s profi t (before share of profi ts of associates) differs from the theoretical amount that would arise using the Singapore basic tax rate as follows:
The GroupIn $ millions 2012 2011
Profi t 4,483 3,606
Prima facie tax calculated at a tax rate of 17% (2011: 17%) 762 613Effect of different tax rates in other countries 88 55Effect of change in tax rate – 1Net income not subject to tax (96) (62)Net income taxed at concessionary rate (69) (62)Others (97) (102)
Income tax expense charged to income statement 588 443
Refer to Note 28 for further information on deferred tax assets/liabilities.
15 EARNINGS PER ORDINARY SHARE
The Group
Number of shares (millions) 2012 2011
Weighted average number of ordinary shares in issue (a) 2,413 2,316Dilutive effect of share options 1 1Full conversion of non-voting redeemable CPS 30 100Full conversion of non-voting convertible preference shares – #
Weighted average number of ordinary shares in issue (diluted) (aa) 2,444 2,417
# Amount under 500,000
The Group
In $ millions 2012 2011
Net profi t attributable to shareholders (Net Profi t) (b) 3,809 3,035Net profi t (less preference dividends) (c) 3,800 3,005
Earnings per ordinary share ($)Basic (c)/(a) 1.57 1.30Diluted (b)/(aa) 1.56 1.26
For the purpose of calculating the diluted earnings per ordinary share, the weighted average number of ordinary shares in issue is adjusted to take into account the effect of a full conversion of non-voting convertible preference shares (CPS) and non-voting redeemable CPS. In addition, the calculation takes into account the exercise of all outstanding share options granted to employees where such shares would be issued at a price lower than the average share price during the fi nancial year.

p114 DBS ANNUAL REPORT 2012 | FINANCIAL STATEMENTS
16 MEASUREMENT BASIS OF FINANCIAL INSTRUMENTS
The Group 2012 Designated Loans and at fair value receivables/ Held for through amortised Available- HedgingIn $ millions trading profi t or loss cost for-sale derivatives Total
AssetsCash and balances with central banks – – 14,841 2,931 – 17,772Singapore Government securities and treasury bills 2,274 – – 9,818 – 12,092Due from banks – – 27,514 1,294 – 28,808Financial assets at fair value through profi t or loss 10,351 1,189 – – – 11,540Positive fair values for fi nancial derivatives 17,044 – – – 236 17,280Loans and advances to customers – – 209,395 – – 209,395Financial investments – – 9,553 26,014 – 35,567Securities pledged and transferred 1,662 – 53 2,682 – 4,397Other assets – – 8,611 – – 8,611
Total fi nancial assets 31,331 1,189 269,967 42,739 236 345,462
Non-fi nancial assets(a) 7,571
Total assets 353,033
Liabilities Due to banks – – 25,162 – – 25,162Due to non-bank customers – – 241,165 – – 241,165Financial liabilities at fair value through profi t or loss 5,754 2,095 – – – 7,849Negative fair values for fi nancial derivatives 17,243 – – – 289 17,532Bills payable – – 316 – – 316Other liabilities – – 8,190 – – 8,190Other debt securities in issue – – 10,236 – – 10,236Subordinated term debts – – 5,505 – – 5,505
Total fi nancial liabilities 22,997 2,095 290,574 – 289 315,955
Non-fi nancial liabilities(b) 1,080
Total liabilities 317,035
(a) Includes investments in associates, goodwill on consolidation, properties and other fi xed assets, investment properties and deferred tax assets(b) Includes current tax liabilities, deferred tax liabilities and provision for loss in respect of off-balance sheet credit exposures

p115FINANCIAL STATEMENTS | DBS ANNUAL REPORT 2012
The Group 2011 Designated Loans and at fair value receivables/ Held for through amortised Available- HedgingIn $ millions trading profi t or loss cost for-sale derivatives Total
Assets Cash and balances with central banks – – 23,401 1,903 – 25,304Singapore Government securities and treasury bills 2,039 – – 10,464 – 12,503Due from banks – – 24,193 1,378 – 25,571Financial assets at fair value through profi t or loss 11,394 533 – – – 11,927Positive fair values for fi nancial derivatives 20,989 – – – 175 21,164Loans and advances to customers – – 194,275 – – 194,275Financial investments – – 9,244 21,247 – 30,491Securities pledged and transferred 1,361 – – 1,273 – 2,634Other assets – – 9,730 – – 9,730
Total fi nancial assets 35,783 533 260,843 36,265 175 333,599
Non-fi nancial assets(a) 7,248
Total assets 340,847
Liabilities Due to banks – – 27,601 – – 27,601Due to non-bank customers – – 218,992 – – 218,992Financial liabilities at fair value through profi t or loss 6,764 5,148 – – – 11,912Negative fair values for fi nancial derivatives 21,806 – – – 401 22,207Bills payable – – 254 – – 254Other liabilities – – 10,037 – – 10,037Other debt securities in issue – – 10,354 – – 10,354Subordinated term debts – – 5,304 – – 5,304
Total fi nancial liabilities 28,570 5,148 272,542 – 401 306,661
Non-fi nancial liabilities(b) 1,117
Total liabilities 307,778
(a) Includes investments in associates, goodwill on consolidation, properties and other fi xed assets, investment properties and deferred tax assets(b) Includes current tax liabilities, deferred tax liabilities and provision for loss in respect of off-balance sheet credit exposures
In 2008 and 2009, the Group had reclassifi ed certain fi nancial assets between categories as a result of its change in holding intention. Had the Group not reclassifi ed assets out of the available-for-sale category into the loans and receivables category, fair value gains recognised for the year in respect of the reclassifi ed assets outstanding at year end would have amounted to $3 million (2011: losses of $16 million) in the revaluation reserves. The impact of other reclassifi cations would not have a material impact on the income statement for the current period.
The Group has the intention and ability to hold the reclassifi ed assets in the loans and receivables category for the foreseeable future or until maturity.

p116 DBS ANNUAL REPORT 2012 | FINANCIAL STATEMENTS
The fair values and carrying amounts of the reclassifi ed fi nancial assets are as follows:
The Group 2012 2011In $ millions Carrying CarryingReclassifi ed from Reclassifi ed to Fair values amounts Fair values amounts
Reclassifi ed in 2009Held for trading Loans and receivables 4 4 17 17
Reclassifi ed in 2008Held for trading Available-for-sale 106 106 635 635
Available-for-sale Loans and receivables 447 445 529 531
Total 557 555 1,181 1,183
17 CASH AND BALANCES WITH CENTRAL BANKS
The GroupIn $ millions 2012 2011
Cash on hand 1,656 1,629Non-restricted balances with central banks 9,337 17,262
Cash and cash equivalents 10,993 18,891
Restricted balances with central banks (a) 6,779 6,413
Total 17,772 25,304
(a) Mandatory balances with central banks
18 SINGAPORE GOVERNMENT SECURITIES AND TREASURY BILLS
The GroupIn $ millions 2012 2011
Held for trading 2,639 2,272Available-for-sale 10,294 10,987
Total 12,933 13,259
Less: securities pledged and transferred 841 756
12,092 12,503
19 FINANCIAL ASSETS AT FAIR VALUE THROUGH PROFIT OR LOSS
The GroupIn $ millions 2012 2011
Held for trading Other government securities and treasury bills 6,206 6,790Corporate debt securities 4,609 3,892Equity securities 235 229Other fi nancial assets (due from banks) 598 1,611
Sub-total 11,648 12,522
The GroupIn $ millions 2012 2011
Designated at fair value through profi t or loss Corporate debt securities 65 88Loans and advances to customers (Note 20) 1,124 445
Sub-total 1,189 533
Total 12,837 13,055
Less: securities pledged and transferred 1,297 1,128
11,540 11,927
Corporate debt, equity and government securities
The GroupIn $ millions 2012 2011
Analysed by industry Manufacturing 308 313Building and construction 175 227General commerce 176 148Transportation, storage and communications 335 340Financial institutions, investment and holding companies 3,137 2,448Government 6,206 6,790Others 778 733
Total 11,115 10,999
Analysed by geography(a) Singapore 1,300 1,173Hong Kong 1,206 1,610Rest of Greater China 2,383 2,029South and Southeast Asia 3,029 2,922Rest of the World 3,197 3,265
Total 11,115 10,999
(a) Based on the country of incorporation of the issuer
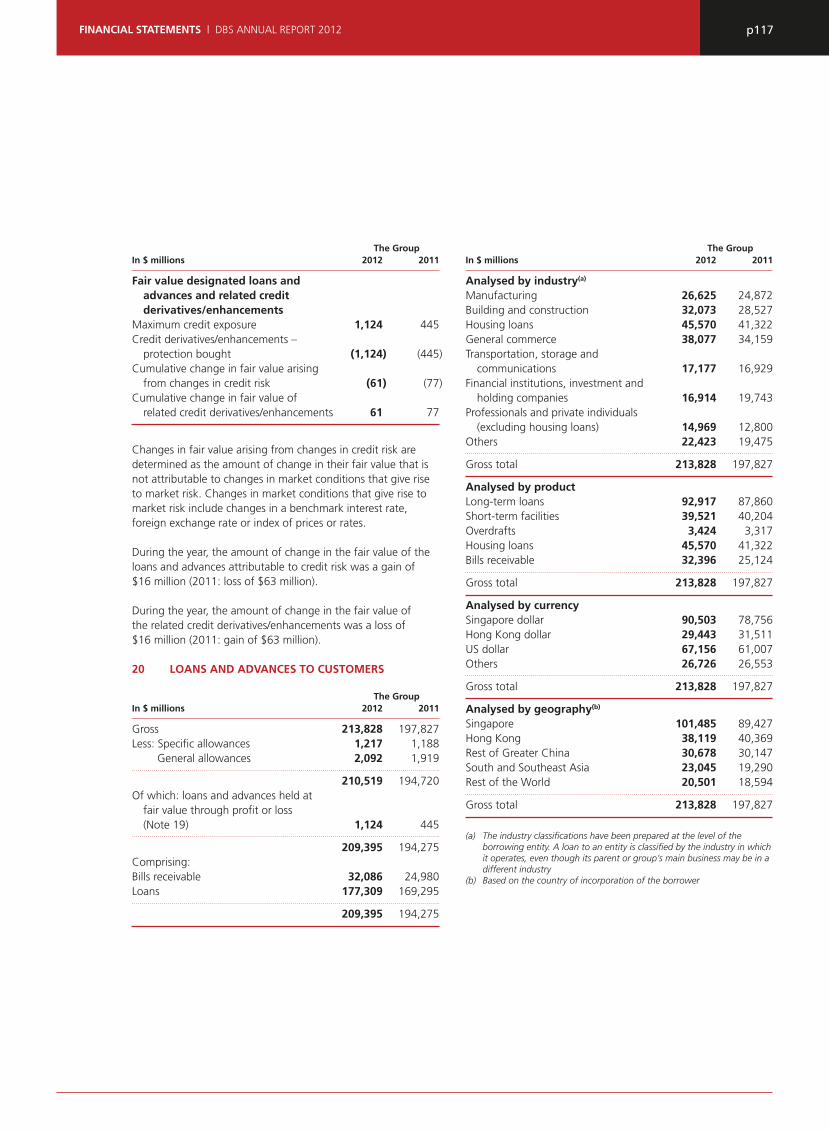
p117FINANCIAL STATEMENTS | DBS ANNUAL REPORT 2012
The GroupIn $ millions 2012 2011
Fair value designated loans and advances and related credit derivatives/enhancements Maximum credit exposure 1,124 445Credit derivatives/enhancements – protection bought (1,124) (445)Cumulative change in fair value arising from changes in credit risk (61) (77)Cumulative change in fair value of related credit derivatives/enhancements 61 77
Changes in fair value arising from changes in credit risk are determined as the amount of change in their fair value that is not attributable to changes in market conditions that give rise to market risk. Changes in market conditions that give rise to market risk include changes in a benchmark interest rate, foreign exchange rate or index of prices or rates.
During the year, the amount of change in the fair value of the loans and advances attributable to credit risk was a gain of $16 million (2011: loss of $63 million).
During the year, the amount of change in the fair value of the related credit derivatives/enhancements was a loss of $16 million (2011: gain of $63 million).
20 LOANS AND ADVANCES TO CUSTOMERS
The GroupIn $ millions 2012 2011
Gross 213,828 197,827Less: Specifi c allowances 1,217 1,188 General allowances 2,092 1,919
210,519 194,720Of which: loans and advances held at fair value through profi t or loss (Note 19) 1,124 445
209,395 194,275Comprising:Bills receivable 32,086 24,980Loans 177,309 169,295
209,395 194,275
The GroupIn $ millions 2012 2011
Analysed by industry(a) Manufacturing 26,625 24,872Building and construction 32,073 28,527Housing loans 45,570 41,322General commerce 38,077 34,159Transportation, storage and communications 17,177 16,929Financial institutions, investment and holding companies 16,914 19,743Professionals and private individuals (excluding housing loans) 14,969 12,800Others 22,423 19,475
Gross total 213,828 197,827
Analysed by product Long-term loans 92,917 87,860Short-term facilities 39,521 40,204Overdrafts 3,424 3,317Housing loans 45,570 41,322Bills receivable 32,396 25,124
Gross total 213,828 197,827
Analysed by currency Singapore dollar 90,503 78,756Hong Kong dollar 29,443 31,511US dollar 67,156 61,007Others 26,726 26,553
Gross total 213,828 197,827
Analysed by geography(b) Singapore 101,485 89,427Hong Kong 38,119 40,369Rest of Greater China 30,678 30,147South and Southeast Asia 23,045 19,290Rest of the World 20,501 18,594
Gross total 213,828 197,827
(a) The industry classifi cations have been prepared at the level of the borrowing entity. A loan to an entity is classifi ed by the industry in which it operates, even though its parent or group’s main business may be in a different industry
(b) Based on the country of incorporation of the borrower

p118 DBS ANNUAL REPORT 2012 | FINANCIAL STATEMENTS
The table below shows the movements in specifi c and general allowances for loans and advances to customers during the year for the Group:
Charge/ (Write-back) Net write- Exchange Balance at to income off during and other Balance atIn $ millions 1 January statement the year movements 31 December
2012Specifi c allowances Manufacturing 223 26 (19) (8) 222Building and construction 37 (3) 1 (1) 34Housing loans 11 (1) – – 10General commerce 125 46 (17) (5) 149Transportation, storage and communications 282 96 (9) 1 370Financial institutions, investment and holding companies 392 (21) (5) (3) 363Professionals and private individuals (excluding housing loans) 63 76 (90) (4) 45Others 55 (21) (10) – 24
Total specifi c allowances 1,188 198 (149) (20) 1,217
Total general allowances 1,919 181 – (8) 2,092
Total allowances 3,107 379 (149) (28) 3,309
2011Specifi c allowances Manufacturing 305 (29) (55) 2 223Building and construction 24 14 (2) 1 37Housing loans 15 (6) 2 – 11General commerce 101 55 (32) 1 125Transportation, storage and communications 180 99 (1) 4 282Financial institutions, investment and holding companies 380 29 (23) 6 392Professionals and private individuals (excluding housing loans) 69 54 (61) 1 63Others 78 (22) (5) 4 55
Total specifi c allowances 1,152 194 (177) 19 1,188
Total general allowances 1,476 444 – (1) 1,919
Total allowances 2,628 638 (177) 18 3,107

p119FINANCIAL STATEMENTS | DBS ANNUAL REPORT 2012
21 FINANCIAL INVESTMENTS
The GroupIn $ millions 2012 2011
Available-for-sale Quoted other government securities and treasury bills 17,262 10,343Quoted corporate debt securities 9,859 10,497Quoted equity securities 701 654Unquoted equity securities 398 503
Available-for-sale fi nancial investments 28,220 21,997
Loans and receivables Other government securities and treasury bills 25 107Corporate debt securities 9,702 9,258Less: Impairment allowances for corporate debt securities 121 121
Loans and receivables fi nancial investments(a) 9,606 9,244
Total 37,826 31,241
Less: securities pledged and transferred 2,259 750
35,567 30,491
Analysed by industry Manufacturing 835 586Building and construction 1,828 1,623General commerce 841 573Transportation, storage and communications 2,177 1,963Financial institutions, investment and holding companies 8,399 10,738Government 17,287 10,450Others 6,459 5,308
Total carrying value 37,826 31,241
Analysed by geography(b) Singapore 8,565 6,632Hong Kong 2,708 3,117Rest of Greater China 1,711 1,586South and Southeast Asia 3,548 2,824Rest of the World 21,294 17,082
Total carrying value 37,826 31,241
(a) The market value of loans and receivables fi nancial investments amounted to $9,887 million (2011: $9,351 million)(b) Based on the country of incorporation of the issuer
22 SECURITIES PLEDGED AND TRANSFERRED
The Group enters into transactions in the normal course of business by which it transfers fi nancial assets to third parties or to special purpose entities. These transfers may give rise to full or partial derecognition of those fi nancial assets.
The following table provides information on the fi nancial assets which are sold or transferred under repurchase agreements and securities lending arrangements, which are generally conducted under terms that are in accordance with normal market practice. The Group has determined that it retains substantially
all the risks and rewards of these securities and therefore has not derecognised them. In these transactions, the counterparty is typically allowed to sell or repledge those securities lent or transferred, but has an obligation to return the securities at maturity. If the securities decrease in value, the Group may, in certain circumstances, be required, to pay additional cash collateral, and typically the counterparty has recourse only to the securities.
For repurchase agreements, the securities transferred are either classifi ed as “fair value through profi t or loss” or “available-for-sale” (see Note 16). The Group recognises a fi nancial liability

p120 DBS ANNUAL REPORT 2012 | FINANCIAL STATEMENTS
for cash received. The fair values of the associated liabilities approximate the carrying value and amount to $3,335 million (2011: $2,627 million).
For securities lending transactions, the securities lent are classifi ed as “available-for-sale” or “loans and receivables” on the balance sheet (see Note 16), and the carrying amount is equal to the fair value. As the Group receives mainly other fi nancial assets in exchange, the associated liabilities recorded are not material.
The GroupIn $ millions 2012 2011
Securities pledged and transferred Singapore Government securities and treasury bills 841 756Other government securities and treasury bills 2,207 1,856Corporate debt securities 1,349 22
Total securities pledged and transferred(a) 4,397 2,634
(a) Securities transferred under securities lending transactions ($1,328 million) were presented under fi nancial investments in 2011
The Group also enters into structured funding transactions where the Group retains the contractual rights to receive cash fl ows of loans extended to third parties, but assumes a contractual obligation to pay these cash fl ows under the issued notes. The carrying amounts and fair values of these fi nancial assets and liabilities both amount to $1,124 million (2011: $445 million).
Collaterals pledged in connection with derivative transactions under Credit Support Annexes (CSA) agreement are mainly cash.
Transferred fi nancial assets which are subject to partial continuing involvement were not material in 2012 and 2011.
23 SUBSIDIARIES AND OTHER CONTROLLED ENTITIES
The CompanyIn $ millions 2012 2011
Unquoted equity shares, at cost 10,326 9,426Due from subsidiaries 833 1,531
Total 11,159 10,957
23.1 MAIN OPERATING SUBSIDIARIES
The main operating subsidiaries of the Group are listed below:
Effective shareholding %Name of subsidiary Country of incorporation 2012 2011
Commercial BankingDBS Bank Ltd Singapore 100 100DBS Bank (China) Limited* China 100 100PT Bank DBS Indonesia* Indonesia 99 99DBS Bank (Taiwan) Limited* Taiwan 100 100DBS Bank (Hong Kong) Limited* Hong Kong 100 100
Merchant Banking The Islamic Bank of Asia Limited Singapore 50 50
Stockbroking DBS Vickers Securities (Singapore) Pte Ltd Singapore 100 100
* Audited by PricewaterhouseCoopers network fi rms outside Singapore
23.2 SPECIAL PURPOSE ENTITIES
The main special purpose entities controlled and consolidated by the Group are listed below:
Name of entity Purpose of special purpose entity Country of incorporation
Zenesis SPC Issuance of structured notes Cayman IslandsConstellation Investment Ltd Issuance of structured notes Cayman Islands

p121FINANCIAL STATEMENTS | DBS ANNUAL REPORT 2012
24 JOINT VENTURES
The Group’s share of income and expenses, and assets and liabilities of joint venture at 31 December are as follows:
The GroupIn $ millions 2012 2011
Income statementShare of income 25 25Share of expenses (19) (19)Balance sheetShare of total assets 205 205Share of total liabilities 153 156
The main joint venture of the Group is listed below:
Effective shareholding %Name of joint venture Country of incorporation 2012 2011
Hutchinson DBS Card Limited* British Virgin Islands 50 50
* Audited by PricewaterhouseCoopers network fi rms outside Singapore
25 INVESTMENTS IN ASSOCIATES
The GroupIn $ millions 2012 2011
Unquoted Cost 718 160Share of post acquisition reserves 130 143
Sub-total 848 303
Quoted Cost 246 426Net exchange translation adjustments (14) (40)Share of post acquisition reserves 156 260
Sub-total(a) 388 646
Total 1,236 949
(a) The market value of quoted associates amounted to $1,063 million (2011: $1,247 million)
The Group’s share of income and expenses, assets and liabilities and off-balance sheet items of associates at 31 December are as follows: The GroupIn $ millions 2012 2011
Income statement Share of income 472 476Share of expenses (348) (349)Balance sheet Share of total assets 4,779 5,807 Share of total liabilities 3,543 4,858Off-balance sheet Share of contingent liabilities and commitments 57 53
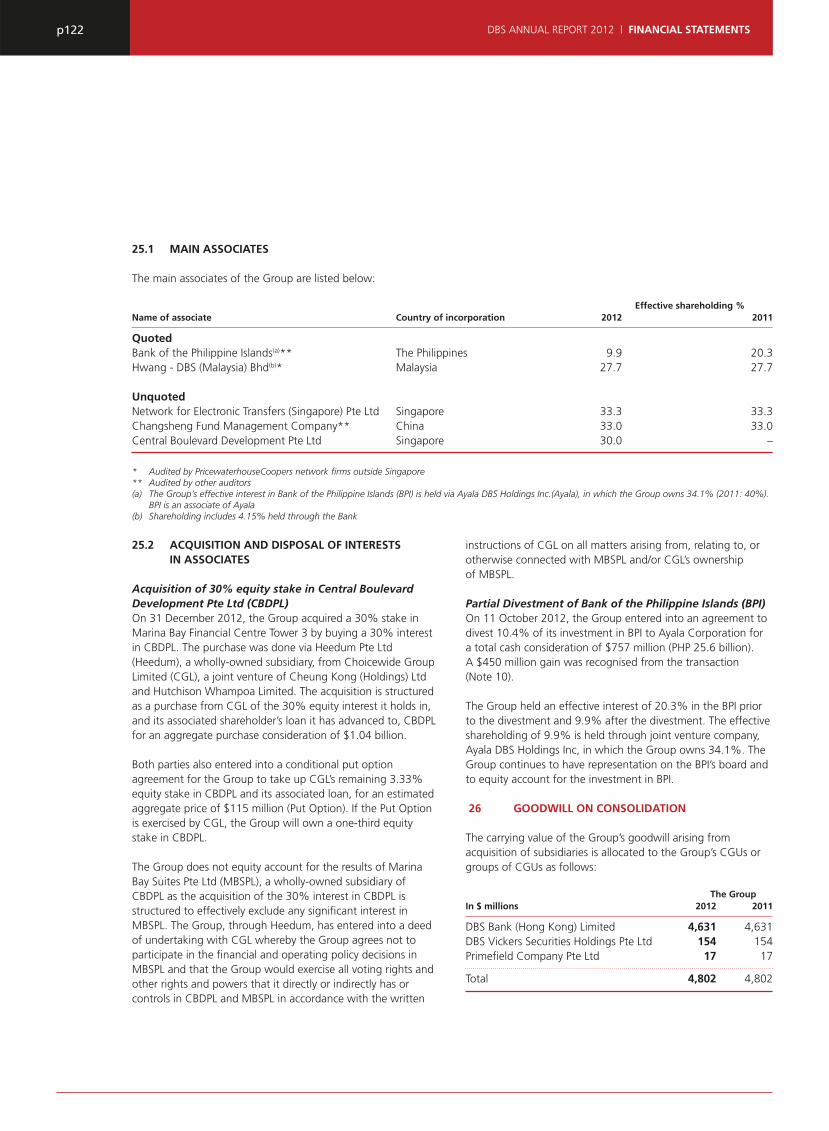
p122 DBS ANNUAL REPORT 2012 | FINANCIAL STATEMENTS
25.1 MAIN ASSOCIATES
The main associates of the Group are listed below:
Effective shareholding %Name of associate Country of incorporation 2012 2011
Quoted Bank of the Philippine Islands(a)** The Philippines 9.9 20.3Hwang - DBS (Malaysia) Bhd(b)* Malaysia 27.7 27.7
UnquotedNetwork for Electronic Transfers (Singapore) Pte Ltd Singapore 33.3 33.3Changsheng Fund Management Company** China 33.0 33.0Central Boulevard Development Pte Ltd Singapore 30.0 –
* Audited by PricewaterhouseCoopers network fi rms outside Singapore** Audited by other auditors(a) The Group’s effective interest in Bank of the Philippine Islands (BPI) is held via Ayala DBS Holdings Inc.(Ayala), in which the Group owns 34.1% (2011: 40%).
BPI is an associate of Ayala(b) Shareholding includes 4.15% held through the Bank
25.2 ACQUISITION AND DISPOSAL OF INTERESTS IN ASSOCIATES
Acquisition of 30% equity stake in Central Boulevard Development Pte Ltd (CBDPL)On 31 December 2012, the Group acquired a 30% stake in Marina Bay Financial Centre Tower 3 by buying a 30% interest in CBDPL. The purchase was done via Heedum Pte Ltd (Heedum), a wholly-owned subsidiary, from Choicewide Group Limited (CGL), a joint venture of Cheung Kong (Holdings) Ltd and Hutchison Whampoa Limited. The acquisition is structured as a purchase from CGL of the 30% equity interest it holds in, and its associated shareholder’s loan it has advanced to, CBDPL for an aggregate purchase consideration of $1.04 billion.
Both parties also entered into a conditional put option agreement for the Group to take up CGL’s remaining 3.33% equity stake in CBDPL and its associated loan, for an estimated aggregate price of $115 million (Put Option). If the Put Option is exercised by CGL, the Group will own a one-third equity stake in CBDPL.
The Group does not equity account for the results of Marina Bay Suites Pte Ltd (MBSPL), a wholly-owned subsidiary of CBDPL as the acquisition of the 30% interest in CBDPL is structured to effectively exclude any signifi cant interest in MBSPL. The Group, through Heedum, has entered into a deed of undertaking with CGL whereby the Group agrees not to participate in the fi nancial and operating policy decisions in MBSPL and that the Group would exercise all voting rights and other rights and powers that it directly or indirectly has or controls in CBDPL and MBSPL in accordance with the written
instructions of CGL on all matters arising from, relating to, or otherwise connected with MBSPL and/or CGL’s ownership of MBSPL.
Partial Divestment of Bank of the Philippine Islands (BPI)On 11 October 2012, the Group entered into an agreement to divest 10.4% of its investment in BPI to Ayala Corporation for a total cash consideration of $757 million (PHP 25.6 billion). A $450 million gain was recognised from the transaction (Note 10).
The Group held an effective interest of 20.3% in the BPI prior to the divestment and 9.9% after the divestment. The effective shareholding of 9.9% is held through joint venture company, Ayala DBS Holdings Inc, in which the Group owns 34.1%. The Group continues to have representation on the BPI’s board and to equity account for the investment in BPI. 26 GOODWILL ON CONSOLIDATION
The carrying value of the Group’s goodwill arising from acquisition of subsidiaries is allocated to the Group’s CGUs or groups of CGUs as follows:
The GroupIn $ millions 2012 2011
DBS Bank (Hong Kong) Limited 4,631 4,631DBS Vickers Securities Holdings Pte Ltd 154 154Primefi eld Company Pte Ltd 17 17
Total 4,802 4,802

p123FINANCIAL STATEMENTS | DBS ANNUAL REPORT 2012
Key assumptions used for value-in-use calculations:
DBS Vickers DBS Bank Securities (Hong Kong) Holdings Limited Pte Ltd
Growth rate(a) 4.5% 4.0%Discount rate(a) 9.5% 9.0%
(a) No change from 2011
The recoverable amounts are determined based on a value-in-use calculation. These calculations use cash fl ow projections based on fi nancial budgets and forecasts approved by senior management, taking into account projected regulatory capital requirements. The recoverable value is determined by discounting the cash fl ow projections to their present values. The terminal value refl ecting all periods beyond the fi fth year is calculated based on the forecast fi fth year profi t, the cost of equity and the long term growth rate stated above. The growth rates do not exceed the long term average growth rate for the market in which the businesses operate.
The process of evaluating goodwill impairment requires signifi cant management judgment, the results of which are highly sensitive to the assumptions used. The review of goodwill impairment represents management’s prudent estimate of the various factors, including the future cash fl ows and the discount and growth rates used.
If the estimated long term growth rates for DBS Bank (Hong Kong) Limited and DBS Vickers Securities Holdings Pte Ltd are reduced by 25 basis points or the estimated discount rates increased by 25 basis points, the impact on the recoverable amounts for these entities is not material. On this basis, the Group concluded that goodwill remains recoverable at 31 December 2012. However, if conditions in Hong Kong and the banking industry deteriorate and turn out to be signifi cantly worse than anticipated in the Group’s performance forecast, the goodwill may be further impaired in future periods.
27 PROPERTIES AND OTHER FIXED ASSETS
The Group leases out investment properties under operating leases. The leases typically run for an initial period of one to fi ve years, and may contain an option to renew the lease after that date at which time all terms will be renegotiated.
The minimum lease receivables as at the balance sheet date are as follows:
The GroupIn $ millions 2012 2011
Minimum lease receivable Not later than 1 year 22 7Later than 1 year but not later than 5 years 64 4Later than 5 years 3 –
Total 89 11
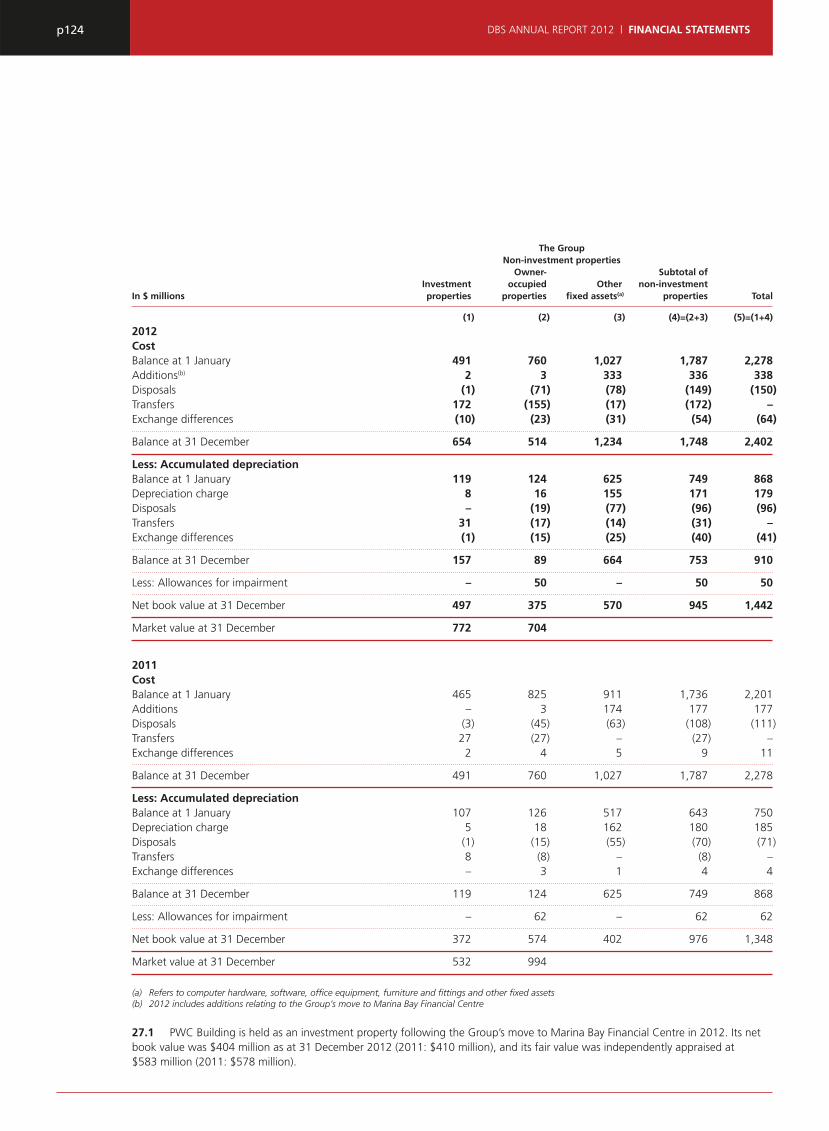
p124 DBS ANNUAL REPORT 2012 | FINANCIAL STATEMENTS
The Group Non-investment properties Owner- Subtotal of Investment occupied Other non-investmentIn $ millions properties properties fi xed assets(a) properties Total
(1) (2) (3) (4)=(2+3) (5)=(1+4)
2012 Cost Balance at 1 January 491 760 1,027 1,787 2,278Additions(b) 2 3 333 336 338Disposals (1) (71) (78) (149) (150)Transfers 172 (155) (17) (172) –Exchange differences (10) (23) (31) (54) (64)
Balance at 31 December 654 514 1,234 1,748 2,402
Less: Accumulated depreciation Balance at 1 January 119 124 625 749 868Depreciation charge 8 16 155 171 179Disposals – (19) (77) (96) (96)Transfers 31 (17) (14) (31) –Exchange differences (1) (15) (25) (40) (41)
Balance at 31 December 157 89 664 753 910
Less: Allowances for impairment – 50 – 50 50
Net book value at 31 December 497 375 570 945 1,442
Market value at 31 December 772 704
2011 Cost Balance at 1 January 465 825 911 1,736 2,201Additions – 3 174 177 177Disposals (3) (45) (63) (108) (111)Transfers 27 (27) – (27) –Exchange differences 2 4 5 9 11
Balance at 31 December 491 760 1,027 1,787 2,278
Less: Accumulated depreciation Balance at 1 January 107 126 517 643 750Depreciation charge 5 18 162 180 185Disposals (1) (15) (55) (70) (71)Transfers 8 (8) – (8) –Exchange differences – 3 1 4 4
Balance at 31 December 119 124 625 749 868
Less: Allowances for impairment – 62 – 62 62
Net book value at 31 December 372 574 402 976 1,348
Market value at 31 December 532 994
(a) Refers to computer hardware, software, offi ce equipment, furniture and fi ttings and other fi xed assets(b) 2012 includes additions relating to the Group’s move to Marina Bay Financial Centre
27.1 PWC Building is held as an investment property following the Group’s move to Marina Bay Financial Centre in 2012. Its net book value was $404 million as at 31 December 2012 (2011: $410 million), and its fair value was independently appraised at $583 million (2011: $578 million).

p125FINANCIAL STATEMENTS | DBS ANNUAL REPORT 2012
28 DEFERRED TAX ASSETS/LIABILITIES
Deferred tax assets and liabilities are offset when there is a legally enforceable right to set off current tax assets against current tax liabilities and when the deferred income taxes relate to the same tax authority. The deferred tax assets and liabilities are to be recovered and settled after one year and the following amounts, determined after appropriate offsetting, are shown in the balance sheet.
The GroupIn $ millions 2012 2011
Deferred tax assets 91 149Deferred tax liabilities (30) (30)
Total 61 119
The movement in deferred tax (prior to offsetting of balances within the same tax jurisdiction) is as follows:
The GroupIn $ millions 2012
Other Allowances temporaryDeferred income tax assets for losses differences Total
Balance at 1 January 142 84 226Charge to income statement (6) (11) (17)
Balance at 31 December 136 73 209
Available- for-sale Other Accelerated tax investments temporaryDeferred income tax liabilities depreciation and others differences Total
Balance at 1 January (82) (3) (22) (107)Credit/(Charge) to income statement (7) – 10 3Charge to equity – (44) – (44)
Balance at 31 December (89) (47) (12) (148)
The GroupIn $ millions 2011
Other Allowances temporaryDeferred income tax assets for losses differences Total
Balance at 1 January 150 39 189Credit/(Charge) to income statement (8) 45 37
Balance at 31 December 142 84 226
Available- for-sale Other Accelerated tax investments temporaryDeferred income tax liabilities depreciation and others differences Total
Balance at 1 January (86) (34) (7) (127)Credit/(Charge) to income statement 4 – (15) (11)Credit to equity – 31 – 31
Balance at 31 December (82) (3) (22) (107)

p126 DBS ANNUAL REPORT 2012 | FINANCIAL STATEMENTS
29 OTHER ASSETS
The GroupIn $ millions 2012 2011
Accrued interest receivable 844 847Deposits and prepayments 297 263Clients’ monies receivable from securities business 778 435Sundry debtors and others 6,692 8,185
Total 8,611 9,730
30 DUE TO NON-BANK CUSTOMERS
The GroupIn $ millions 2012 2011
Due to non-bank customers 241,165 218,992Due to non-bank customers which are at fair value through profi t or loss (Note 31) 1,742 6,354
Total Due to non-bank customers 242,907 225,346
Analysed by currency Singapore dollar 131,000 122,992US dollar 45,981 40,336Hong Kong dollar 25,730 21,733Others 40,196 40,285
Total 242,907 225,346
Analysed by product Savings accounts 103,512 97,314Current accounts 42,841 38,145Fixed deposits 91,959 82,922Other deposits 4,595 6,965
Total 242,907 225,346
31 FINANCIAL LIABILITIES AT FAIR VALUE THROUGH PROFIT OR LOSS
The GroupIn $ millions 2012 2011
TradingOther debt securities in issue (Note 33) 2,373 2,443Due to non-bank customers (Note 30)– structured investments 792 1,531– others – 235Payable in respect of short sale of securities 1,843 2,068Other fi nancial liabilities 746 487
Sub-total 5,754 6,764
The GroupIn $ millions 2012 2011
Fair value designated(a)
Due to non-bank customers (Note 30)– structured investments(b) 950 4,588Other debt securities in issue (Note 33) 1,145 560
Sub-total 2,095 5,148
Total 7,849 11,912
(a) Changes in fair value arising from changes in credit risks are determined as the amount of change in fair value that is not attributable to changes in market conditions that give rise to market risk. Changes in market conditions that give rise to market risk include changes in benchmark interest rate, foreign exchange rate or index of prices or rates. Change in fair value arising from change in credit risks is not signifi cant. Net unrealised loss for the fair value designated liabilities amount to $10 million at 31 December 2012 (2011: $73 million)
(b) Certain structured investments issued in 2012 are bifurcated and the host contract amounts are carried at amortised cost
32 OTHER LIABILITIES
The GroupIn $ millions 2012 2011
Cash collaterals received in respect of derivative portfolios 745 821Accrued interest payable 624 382Provision for loss in respect of off-balance sheet credit exposures 226 250Clients’ monies payable in respect of securities business 679 372Sundry creditors and others 6,142 8,462
Total 8,416 10,287
33 OTHER DEBT SECURITIES IN ISSUE
The GroupIn $ millions 2012 2011
Negotiable certifi cates of deposit(a) (Note 33.1) 1,149 2,767Medium term notes (Note 33.2) 3,168 1,381Commercial papers (Note 33.3) 5,820 6,228Other debt securities in issue(a) (Note 33.4) 3,617 2,981
Total 13,754 13,357Of which: Debt securities in issue at fair value through profi t or loss (Note 31) 3,518 3,003
10,236 10,354
Due within 1 year 8,498 9,270Due after 1 year 5,256 4,087
Total 13,754 13,357
(a) Includes debt securities in issue at fair value through profi t or loss

p127FINANCIAL STATEMENTS | DBS ANNUAL REPORT 2012
33.1 Details of negotiable certifi cates of deposit issued and outstanding at 31 December are as follows:
In $ millions The GroupCurrency Interest Rate and Repayment Terms 2012 2011
Issued by other subsidiariesCNH 1.95%, payable quarterly – 10CNH 1.6% to 2.99%, payable semi-annually 48 34CNH 2.8%, payable yearly 88 –HKD 0.4% to 4.22%, payable quarterly 462 931HKD 3M HIBOR* + 0.3% to 0.9%, payable quarterly 244 258HKD 1.5% to 4.2%, payable yearly 307 422HKD Zero coupon certifi cate of deposit, payable on maturity – 657USD Zero coupon certifi cate of deposit, payable on maturity – 165JPY Zero coupon certifi cate of deposit, payable on maturity – 168GBP Zero coupon certifi cate of deposit, payable on maturity – 122
Total 1,149 2,767
* HIBOR: Hong Kong Interbank Offer Rate
The negotiable certifi cates of deposit were issued by DBS Bank (Hong Kong) Limited under its HKD 28 billion Certifi cate of Deposit Programme. The outstanding negotiable certifi cates of deposit as at 31 December 2012 were issued between 21 August 2008 and 31 January 2012 (2011: 21 August 2008 and 20 December 2011) and mature between 16 January 2013 and 16 March 2021 (2011: 18 January 2012 and 25 November 2021).
33.2 Details of medium term notes issued and outstanding at 31 December are as follows:
In $ millions The GroupCurrency Interest Rate and Repayment Terms Issue Date Maturity Date 2012 2011
Issued by the BankUSD 2.35%, payable half yearly 21 Feb 2012 28 Feb 2017 1,219 –USD 2.35%, payable half yearly 19 Jun 2012 28 Feb 2017 2 –USD 2.375%, payable half yearly 08 Sep 2010 14 Sep 2015 1,281 1,318USD Floating rate note, payable quarterly 24 Aug 2012 04 Sep 2013 37 –GBP Floating rate note, payable quarterly 28 Mar 2012 04 Apr 2013 247 –GBP Floating rate note, payable quarterly 12 Sep 2012 19 Sep 2013 247 –HKD 2.24%, payable quarterly 21 Mar 2012 30 Mar 2017 79 –IDR 6.89%, payable yearly 09 Dec 2011 23 Dec 2013 28 31 IDR 7.25%, payable yearly 22 Feb 2011 04 Mar 2014 28 32
Total 3,168 1,381
The medium term notes were issued by the Bank under its USD 10 billion Euro Medium Term Note Programme which was fi rst established in June 2010 and updated to a USD 15 billion Global Medium Term Note Programme in October 2011.
33.3 The zero-coupon commercial papers which are payable on maturity were issued by the Bank under its USD 5 billion Euro Commercial Paper programme established in August 2011 and US Commercial Paper programme originally established in December 2011 with a programme size of USD 5 billion. The US Commercial Paper programme was upsized from USD 5 billion to USD 15 billion in June 2012. The outstanding notes as at 31 December 2012 were issued between 31 January 2012 and 31 December 2012 (2011: 19 August 2011 and 28 December 2011) and mature between 3 January 2013 and 18 September 2013 (2011: 6 January 2012 and 29 November 2012).
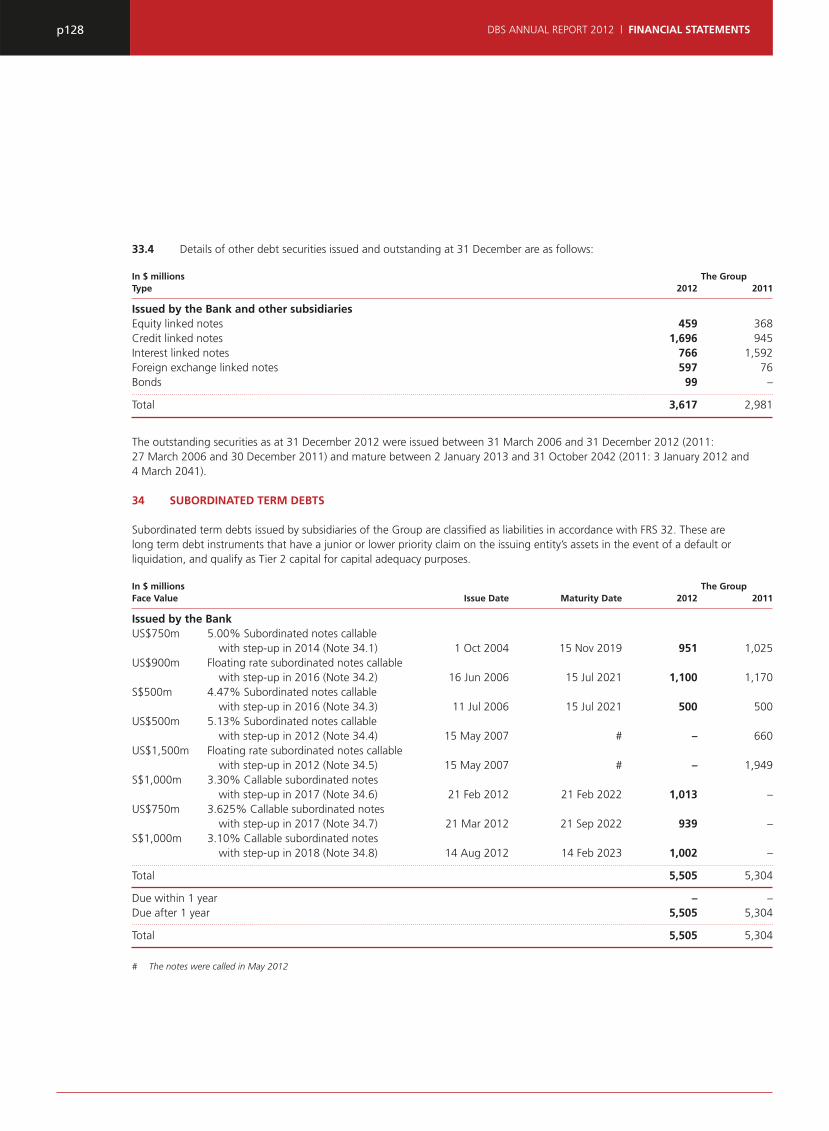
p128 DBS ANNUAL REPORT 2012 | FINANCIAL STATEMENTS
33.4 Details of other debt securities issued and outstanding at 31 December are as follows:
In $ millions The GroupType 2012 2011
Issued by the Bank and other subsidiariesEquity linked notes 459 368Credit linked notes 1,696 945Interest linked notes 766 1,592Foreign exchange linked notes 597 76Bonds 99 –
Total 3,617 2,981
The outstanding securities as at 31 December 2012 were issued between 31 March 2006 and 31 December 2012 (2011: 27 March 2006 and 30 December 2011) and mature between 2 January 2013 and 31 October 2042 (2011: 3 January 2012 and 4 March 2041).
34 SUBORDINATED TERM DEBTS
Subordinated term debts issued by subsidiaries of the Group are classifi ed as liabilities in accordance with FRS 32. These are long term debt instruments that have a junior or lower priority claim on the issuing entity’s assets in the event of a default or liquidation, and qualify as Tier 2 capital for capital adequacy purposes.
In $ millions The GroupFace Value Issue Date Maturity Date 2012 2011
Issued by the BankUS$750m 5.00% Subordinated notes callable with step-up in 2014 (Note 34.1) 1 Oct 2004 15 Nov 2019 951 1,025US$900m Floating rate subordinated notes callable with step-up in 2016 (Note 34.2) 16 Jun 2006 15 Jul 2021 1,100 1,170S$500m 4.47% Subordinated notes callable with step-up in 2016 (Note 34.3) 11 Jul 2006 15 Jul 2021 500 500US$500m 5.13% Subordinated notes callable with step-up in 2012 (Note 34.4) 15 May 2007 # – 660US$1,500m Floating rate subordinated notes callable with step-up in 2012 (Note 34.5) 15 May 2007 # – 1,949S$1,000m 3.30% Callable subordinated notes with step-up in 2017 (Note 34.6) 21 Feb 2012 21 Feb 2022 1,013 –US$750m 3.625% Callable subordinated notes with step-up in 2017 (Note 34.7) 21 Mar 2012 21 Sep 2022 939 –S$1,000m 3.10% Callable subordinated notes with step-up in 2018 (Note 34.8) 14 Aug 2012 14 Feb 2023 1,002 –
Total 5,505 5,304
Due within 1 year – –Due after 1 year 5,505 5,304
Total 5,505 5,304
# The notes were called in May 2012

p129FINANCIAL STATEMENTS | DBS ANNUAL REPORT 2012
34.1 Interest is payable semi-annually on 15 May and 15 November commencing 15 May 2005. Part of the fi xed rate funding has been converted to fl oating rate at three-month LIBOR + 0.61% via interest rate swaps. If the notes are not called at the tenth year, the interest rate steps up and will be reset at six-month LIBOR + 1.61% on the call date. In computing the Group’s capital adequacy ratio, these notes qualify as Tier 2 capital.
34.2 Interest is payable quarterly on 15 January, 15 April, 15 July and 15 October commencing 15 October 2006. Interest on the notes will be paid initially at three-month LIBOR + 0.61%. If the notes are not called at the tenth year, the interest rate steps up and will be set at three-month LIBOR + 1.61% on the call date. In computing the Group’s capital adequacy ratio, these notes qualify as Tier 2 capital.
34.3 Interest is payable semi-annually on 15 January and 15 July commencing 15 January 2007. If the notes are not called at the tenth year, the interest rate steps up and will be reset at a fl oating rate per annum equal to six-month Singapore Dollar Swap Offer Rate + 1.58% on the call date. In computing the Group’s capital adequacy ratio, these notes qualify as Tier 2 capital.
34.4 Interest was payable semi-annually on 16 May and 16 November commencing 16 November 2007. The fi xed rate funding was converted to fl oating rate at three-month LIBOR + 0.22% via interest rate swaps. The notes were called in May 2012. If the notes had not been called, the interest rate will have been reset with a step up to three-month LIBOR + 1.22% on the call date.
34.5 Interest was payable quarterly on 16 February, 16 May, 16 August and 16 November commencing 16 August 2007. Interest on the notes was paid initially at three-month LIBOR + 0.22%. The notes were called in May 2012. If the notes had not been called, the interest rate will have been reset with a step up to three-month LIBOR + 1.22% on the call date. 34.6 Interest is payable semi-annually on 21 August and 21 February commencing 21 August 2012. The fi xed rate funding has been converted to fl oating rate at six-month Singapore Dollar Swap Offer Rate + 2.22% via interest rate swaps. If the notes are not called on 21 February 2017, the interest rate from that date will be reset at a fi xed rate per annum of the then-prevailing fi ve-year Swap Offer Rate + 2.147%. In computing the Group’s capital adequacy ratio, these notes qualify as Tier 2 capital.
34.7 Interest is payable semi-annually on 21 September and 21 March commencing 21 September 2012. The fi xed rate funding has been converted to fl oating rate at three-month LIBOR + 2.21% via interest rate swaps. If the notes are not
called on 21 September 2017, the interest rate from that date will be reset at a fi xed rate per annum of the then-prevailing fi ve-year US Dollar Swap Rate + 2.229%. In computing the Group’s capital adequacy ratio, these notes qualify as Tier 2 capital.
34.8 Interest is payable semi-annually on 14 February and 14 August commencing 14 February 2013. The fi xed rate funding has been converted to fl oating rate at six-month Singapore Dollar Swap Offer Rate + 2.16% via interest rate swaps. If the notes are not called on 14 February 2018, the interest rate from that date will be reset at a fi xed rate per annum of the then-prevailing fi ve-year Swap Offer Rate + 2.085%. In computing the Group’s capital adequacy ratio, these notes qualify as Tier 2 capital.
35 SHARE CAPITAL AND TREASURY SHARES
During the fi nancial year, pursuant to the DBSH Share Option Plan, the Company issued 2,104,176 (2011: 1,667,402) ordinary shares, fully paid in cash upon the exercise of the options granted. The Company also issued 19,579,969 (2011: 39,859,969) ordinary shares to eligible shareholders who elected to participate in the scrip dividend scheme.
On 28 February 2012, the Company issued 70,026,649 ordinary shares upon the conversion of 180,915 non-voting CPS and 69,845,734 non-voting redeemable CPS. The newly issued shares rank pari passu in all respects with the previously issued shares.
The movements in number of ordinary shares and Convertible Preference Shares (CPS) are as follows:
The CompanyNumber of shares (millions) 2012 2011
Balance at 1 January 2,450 2,409Issue of shares pursuant to Scrip Dividend Scheme 20 39Issue of shares upon exercise of share options 2 2
Balance at 31 December 2,472 2,450
The balance includes the following: 2,442,028,426 (2011: 2,350,317,632) ordinary shares(a) 2,442 2,350Nil (2011: 180,915) non-voting CPS – #30,011,421 (2011: 99,857,155) non-voting redeemable CPS 30 100
Total 2,472 2,450
(a) The ordinary shares are fully paid-up and do not have par value# Amount under $500,000
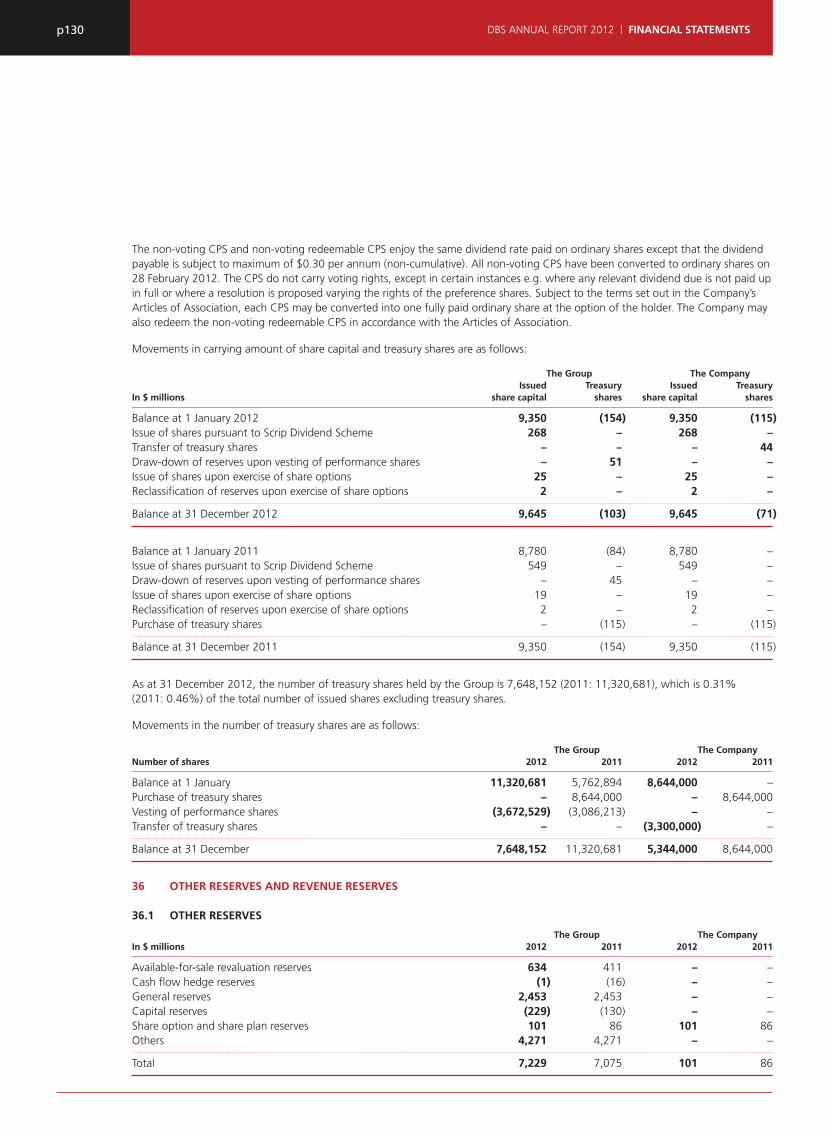
p130 DBS ANNUAL REPORT 2012 | FINANCIAL STATEMENTS
The non-voting CPS and non-voting redeemable CPS enjoy the same dividend rate paid on ordinary shares except that the dividend payable is subject to maximum of $0.30 per annum (non-cumulative). All non-voting CPS have been converted to ordinary shares on 28 February 2012. The CPS do not carry voting rights, except in certain instances e.g. where any relevant dividend due is not paid up in full or where a resolution is proposed varying the rights of the preference shares. Subject to the terms set out in the Company’s Articles of Association, each CPS may be converted into one fully paid ordinary share at the option of the holder. The Company may also redeem the non-voting redeemable CPS in accordance with the Articles of Association.
Movements in carrying amount of share capital and treasury shares are as follows:
The Group The Company Issued Treasury Issued TreasuryIn $ millions share capital shares share capital shares
Balance at 1 January 2012 9,350 (154) 9,350 (115)Issue of shares pursuant to Scrip Dividend Scheme 268 – 268 –Transfer of treasury shares – – – 44Draw-down of reserves upon vesting of performance shares – 51 – –Issue of shares upon exercise of share options 25 – 25 –Reclassifi cation of reserves upon exercise of share options 2 – 2 –
Balance at 31 December 2012 9,645 (103) 9,645 (71)
Balance at 1 January 2011 8,780 (84) 8,780 –Issue of shares pursuant to Scrip Dividend Scheme 549 – 549 –Draw-down of reserves upon vesting of performance shares – 45 – –Issue of shares upon exercise of share options 19 – 19 –Reclassifi cation of reserves upon exercise of share options 2 – 2 –Purchase of treasury shares – (115) – (115)
Balance at 31 December 2011 9,350 (154) 9,350 (115)
As at 31 December 2012, the number of treasury shares held by the Group is 7,648,152 (2011: 11,320,681), which is 0.31% (2011: 0.46%) of the total number of issued shares excluding treasury shares.
Movements in the number of treasury shares are as follows:
The Group The CompanyNumber of shares 2012 2011 2012 2011
Balance at 1 January 11,320,681 5,762,894 8,644,000 –Purchase of treasury shares – 8,644,000 – 8,644,000Vesting of performance shares (3,672,529) (3,086,213) – –Transfer of treasury shares – – (3,300,000) –
Balance at 31 December 7,648,152 11,320,681 5,344,000 8,644,000
36 OTHER RESERVES AND REVENUE RESERVES
36.1 OTHER RESERVES
The Group The CompanyIn $ millions 2012 2011 2012 2011
Available-for-sale revaluation reserves 634 411 – –Cash fl ow hedge reserves (1) (16) – –General reserves 2,453 2,453 – –Capital reserves (229) (130) – –Share option and share plan reserves 101 86 101 86Others 4,271 4,271 – –
Total 7,229 7,075 101 86

p131FINANCIAL STATEMENTS | DBS ANNUAL REPORT 2012
Movements in other reserves during the year are as follows:
The Group Available- Share for-sale Cash fl ow option and revaluation hedge General Capital share plan OtherIn $ millions reserves reserves reserves(a) reserves(b) reserves reserves(c) Total
Balance at 1 January 2012 411 (16) 2,453 (130) 86 4,271 7,075Net exchange translation adjustments – – – (99) – – (99)Share of associates’ reserves (3) – – – – – (3)Cost of share-based payments – – – – 68 – 68Reclassifi cation of reserves upon exercise of share options – – – – (2) – (2)Draw-down of reserves upon vesting of performance shares – – – – (51) – (51)Available-for-sale fi nancial assets and others:– net valuation taken to equity 613 9 – – – – 622– transferred to income statement (345) 8 – – – – (337)– tax on items taken directly to or transferred from equity (42) (2) – – – – (44)
Balance at 31 December 2012 634 (1) 2,453 (229) 101 4,271 7,229
Balance at 1 January 2011 387 – 2,453 (106) 79 4,271 7,084Net exchange translation adjustments – – – (19) – – (19)Share of associates’ reserves 4 – – (5) – – (1)Cost of share-based payments – – – – 54 – 54Reclassifi cation of reserves upon exercise of share options – – – – (2) – (2)Draw-down of reserves upon vesting of performance shares – – – – (45) – (45)Available-for-sale fi nancial assets and others: – net valuation taken to equity 416 (18) – – – – 398– transferred to income statement (425) – – – – – (425)– tax on items taken directly to or transferred from equity 29 2 – – – – 31
Balance at 31 December 2011 411 (16) 2,453 (130) 86 4,271 7,075
(a) General reserves are maintained in accordance with the provisions of applicable laws and regulations. These reserves are non distributable unless otherwise approved by the relevant authorities. Under the Banking (Reserve Fund) (Transitional Provision) regulations 2007, which came into effect on 11 June 2007, the Bank may distribute or utilise its statutory reserves provided that the amount distributed or utilised for each fi nancial year does not exceed 20% of the reserves as at 30 March 2007
(b) Capital reserves include net exchange translation adjustments arising from translation differences on net investments in foreign subsidiaries, joint ventures, associates and branches, and the related foreign currency fi nancial instruments designated as a hedge
(c) Other reserves relate to the share premium of the Bank prior to the restructuring of the Bank under a fi nancial services holding company, DBSH, pursuant to a scheme of arrangement under Section 210 of the Singapore Companies Act on 26 June 1999

p132 DBS ANNUAL REPORT 2012 | FINANCIAL STATEMENTS
Movements in share option and share plan reserves of the Company during the year are as follows:
The CompanyIn $ millions Share option and share plan reserves
Balance at 1 January 2012 86Cost of share-based payments 68Reclassifi cation of reserves upon exercise of share options (2)Draw-down of reserves upon vesting of performance shares (51)
Balance at 31 December 2012 101
Balance at 1 January 2011 79Cost of share-based payments 54Reclassifi cation of reserves upon exercise of share options (2)Draw-down of reserves upon vesting of performance shares (45)
Balance at 31 December 2011 86
36.2 REVENUE RESERVES
The GroupIn $ millions 2012 2011
Balance at 1 January 12,523 10,819Net profi t attributable to shareholders 3,809 3,035
Amount available for distribution 16,332 13,854Less: Final dividend on ordinary shares of $0.28 (one-tier tax-exempt) paid for the previous
fi nancial year (2011: $0.28 one-tier tax-exempt) 677 643 Final dividends on non-voting CPS and non-voting redeemable CPS of $0.02
(one-tier tax-exempt) paid for the previous fi nancial year (2011: $0.02 one-tier tax-exempt) # 2 Interim dividends on ordinary shares of $0.28 (one-tier tax-exempt) paid for the current
fi nancial year (2011: $0.28 one-tier tax-exempt) 681 658 Interim dividends on non-voting redeemable CPS of $0.28 (one-tier tax-exempt) paid for
the current fi nancial year (2011: $0.28 one-tier tax-exempt) 8 28
Balance at 31 December 14,966 12,523
# Amount under $500,000
36.3 PROPOSED DIVIDEND
Proposed fi nal one-tier tax-exempt dividends on ordinary shares of $0.28 per share and DBSH non-voting redeemable CPS of $0.02 per share will not be accounted for in the fi nancial statements for the year ended 31 December 2012 until they are approved at the Annual General Meeting on 29 April 2013.

p133FINANCIAL STATEMENTS | DBS ANNUAL REPORT 2012
37 NON-CONTROLLING INTERESTS
The GroupIn $ millions 2012 2011
Preference shares issued by the Bank (Note 37.1) 1,700 1,700Preference shares issued by the Bank (Note 37.2) 800 800Preference shares issued by DBS Capital Funding II Corporation (Note 37.3) 1,500 1,500Other subsidiaries 261 275
Total 4,261 4,275
37.1 $1,700 million 4.7% non-cumulative non-convertible perpetual preference shares and a liquidation preference of $250,000 each, was issued on 22 October 2010 by the Bank, a subsidiary of the Company, to third parties. They qualify as Tier 1 capital for the calculation of the Group’s capital adequacy ratios. Dividends, if declared by the Board of Directors of the Bank, are payable semi-annually on 22 April and 22 October at a fi xed rate of 4.7% of the liquidation preference per annum.
37.2 $800 million 4.7% non-cumulative non-convertible perpetual preference shares and a liquidation preference of $100 each, was issued on 22 November 2010 by the Bank, a subsidiary of the Company, to third parties. They qualify as Tier 1 capital for the calculation of the Group’s capital adequacy ratios. Dividends, if declared by the Board of Directors of the Bank, are payable semi-annually on 22 May and 22 November at a fi xed rate of 4.7% of the liquidation preference per annum.
37.3 $1,500 million 5.75% non-cumulative non-convertible non-voting guaranteed preference shares, with a liquidation preference of $250,000 was issued on 27 May 2008 by DBS Capital Funding II Corporation, a subsidiary of the Bank. Dividends, when declared by the Board of Directors of DBS Capital Funding II Corporation, are payable in arrears on 15 June and 15 December each year at a fi xed rate of 5.75% per annum up to 15 June 2018 and quarterly in arrears on 15 March, 15 June, 15 September and 15 December each year at a fl oating rate of three-month Singapore Dollar Swap Offer Rate + 3.415% per annum. In computing the Group’s capital adequacy ratios, these guaranteed preference shares qualify as Tier 1 capital.
38 CONTINGENT LIABILITIES AND COMMITMENTS
The Group issues guarantees, performance bonds and indemnities in the ordinary course of business. The majority of these facilities are offset by corresponding obligations of third parties.
Guarantees and performance bonds are generally written by the Group to support the performance of a customer to third
parties. As the Group will only be required to meet these obligations in the event of the customer’s default, the cash requirements of these instruments are expected to be considerably below their nominal amount.
Endorsements are residual liabilities of the Group in respect of bills of exchange, which have been paid and subsequently rediscounted.
The GroupIn $ millions 2012 2011
Guarantees on account of customers 12,578 11,246Endorsements and other obligations on account of customers – Letters of credit 6,487 7,324– Others 1,994 2,198Other contingent items (Note 38.2) – 21Undrawn loan commitments(a) 135,513 116,278Undisbursed commitments in securities 291 133
Sub-total 156,863 137,200Operating lease commitments (Note 38.3) 875 881Capital commitments 19 33
Total 157,757 138,114
Analysed by industry (excluding operating lease commitments and capital commitments) Manufacturing 25,680 24,428Building and construction 10,973 9,291Housing loans 9,783 8,779General commerce 29,185 22,083Transportation, storage and communications 10,767 6,232Government 319 340Financial institutions, investment and holding companies 16,317 19,902Professionals and private individuals (excluding housing loans) 39,069 29,534Others 14,770 16,611
Total 156,863 137,200
Analysed by geography (excluding operating lease commitments and capital commitments)(b) Singapore 71,403 57,301Hong Kong 32,231 27,542Rest of Greater China 11,354 14,855South and Southeast Asia 14,849 14,144Rest of the World 27,026 23,358
Total 156,863 137,200
(a) Undrawn loan commitments are recognised at activation stage and include commitments which are unconditionally cancellable by the Group (2012: $103,666 million, 2011: $90,458 million)
(b) Based on the country of incorporation of the counterparty or borrower

p134 DBS ANNUAL REPORT 2012 | FINANCIAL STATEMENTS
38.1 The Group has existing outsourcing agreements for the provision of information technology and related support to the Group’s operations. There are various termination clauses in the agreements that could require the Group to pay termination fees on early termination of the contract or part thereof. The termination fees are stipulated in the agreements and are determined based on the year when the agreements or part thereof are terminated.
38.2 Included in “Other contingent items” at 31 December 2011, was an amount representing the termination fee payable by the Bank should a distribution agreement be terminated prematurely prior to December 2011. Under the terms of the agreement, the termination fee payable reduces upon achieving the sales volume target. The liability was extinguished during the course of 2012.
38.3 The Group has existing signifi cant operating lease commitments including the leasing of offi ce premises in Changi Business Park and Marina Bay Financial Centre in Singapore; and One Island East in Hong Kong. These include lease commitments for which the payments will be determined in the future based on the prevailing market rates in accordance with the lease agreements, of which the related amounts have not been included. The leases have varying terms, escalation clauses and renewal rights.
39 FINANCIAL DERIVATIVES
Financial derivatives are fi nancial instruments whose characteristics are derived from the underlying assets, or from interest and exchange rates or indices. These include forwards, swaps, futures and options. The following sections outline the nature and terms of the most common types of derivatives used by the Group.
Interest rate derivativesForward rate agreements give the buyer the ability to determine the underlying rate of interest for a specifi ed period commencing on a specifi ed future date (the settlement date). There is no exchange of principal and settlement is effected on the settlement date. The settlement amount is the difference between the contracted rate and the market rate prevailing on the settlement date.
Interest rate swaps involve the exchange of interest obligations with a counterparty for a specifi ed period without exchanging the underlying (or notional) principal.
Interest rate futures are exchange-traded agreements to buy or sell a standard amount of a specifi ed fi xed income security or time deposit at an agreed interest rate on a standard future date.
Interest rate options give the buyer on payment of a premium the right, but not the obligation, to fi x the rate of
interest on a future deposit or loan, for a specifi ed period and commencing on a specifi ed future date.
Interest rate caps and fl oors give the buyer the ability to fi x the maximum or minimum rate of interest. There is no facility to deposit or draw down funds, instead the writer pays to the buyer the amount by which the market rate exceeds or is less than the cap rate or the fl oor rate respectively. This category includes combinations of interest rate caps and fl oors, which are known as interest rate collars.
Foreign exchange derivativesForward foreign exchange contracts are agreements to buy or sell fi xed amounts of currency at agreed rates of exchange on a specifi ed future date.
Cross currency swaps are agreements to exchange, and on termination of the swap, re-exchange principal amounts denominated in different currencies. Cross currency swaps may involve the exchange of interest payments in one specifi ed currency for interest payments in another specifi ed currency for a specifi ed period.
Currency options give the buyer, on payment of a premium, the right but not the obligation, to buy or sell specifi ed amounts of currency at agreed rates of exchange on or before a specifi ed future date.
Equity derivativesEquity options provide the buyer, on payment of a premium, the right but not the obligation, either to purchase or sell a specifi ed stock or stock index at a specifi ed price or level on or before a specifi ed date.
Equity swaps involve the exchange of a set of payments whereby one of these payments is based on an equity-linked return while the other is typically based on an interest reference rate.
Credit derivativesCredit default swaps involve the transfer of credit risk of a reference asset from the protection buyer to the protection seller. The protection buyer makes one or more payments to the seller in exchange for an undertaking by the seller to make a payment to the buyer upon the occurrence of a predefi ned credit event.
Commodity derivativesCommodity contracts are agreements between two parties to exchange cash fl ows which are dependent on the price of the underlying physical assets.
Commodity futures are exchange-traded agreements to buy or sell a standard amount of a commodity at an agreed price on a standard future date.

p135FINANCIAL STATEMENTS | DBS ANNUAL REPORT 2012
Commodity options give the buyer the right, but not the obligation, to buy or sell a specifi c amount of commodity at an agreed contract price on or before a specifi ed date.
39.1 TRADING DERIVATIVES
Most of the Group’s derivatives relate to sales and trading activities. Sales activities include the structuring and marketing of derivatives to customers to enable them to take, transfer, modify or reduce current or expected risks. Trading activities are entered into principally for dealer’s margin or for the purpose of generating a profi t from short-term fl uctuations in price. Trading includes mainly market making and warehousing to facilitate customer orders. Market making involves quoting bid and offer prices to other market participants with the intention of generating revenues based on spread and volume. Warehousing involves holding on to positions in order to liquidate in an orderly fashion with timing of unwinding determined by market conditions and traders’ views of markets as they evolve.
39.2 HEDGING DERIVATIVES
The accounting treatment of the hedge derivative transactions varies according to the nature of the hedge and whether the hedge meets the specifi ed criteria to qualify for hedge accounting. Derivatives transacted as economic hedges but do not qualify for hedge accounting are treated in the same way as derivative instruments used for trading purposes.
Fair value hedgesThe Group’s fair value hedges consist principally of interest rate swaps used for managing interest rate gaps. For the year ended 31 December 2012, the gain on hedging instruments was $144 million (2011: $44 million). The total loss on hedged items attributable to the hedged risk amounted to $143 million (2011: $43 million).
Cash fl ow hedgesThe Group’s cash fl ow hedges consist principally of currency forwards and currency swaps transacted to hedge highly probable forecast transactions expected to occur at various future dates against variability in exchange rates. The currency forwards and currency swaps have maturity dates that coincide within the expected occurrence of these transactions. The hedged cash fl ows are expected to occur over next 5 years following the balance sheet date, and are expected to affect profi t or loss in the same period these cash fl ows occur. The ineffectiveness arising from these hedges is insignifi cant.
Net investment hedgesThe Group hedges part of the currency translation risk of investments through fi nancial derivatives and borrowings. The ineffectiveness arising from hedging of investments is insignifi cant. The Group regularly reviews its hedging strategy and rebalance based on long term outlook of the currency fundamentals.
Financial Net instruments Remaining investments which hedge unhedged in foreign the net currencyIn $ millions operations (a) investments (b) exposures
2012
Hong Kong dollar 5,417 5,394 23US dollar 801 797 4Others 4,957 1,997 2,960
Total 11,175 8,188 2,987
2011 Hong Kong dollar 5,176 5,139 37US dollar 862 859 3Others 4,578 3,076 1,502
Total 10,616 9,074 1,542
(a) Refer to net tangible assets of subsidiaries, joint ventures and associates, and capital funds/retained earnings of overseas branches operations
(b) Includes forwards, non-deliverable forwards and borrowings used to hedge the investments
The following table summarises the contractual or underlying principal amounts of derivative fi nancial instruments held or issued for trading and hedging purposes. The notional or contractual amounts of these instruments refl ect the volume of transactions outstanding at balance sheet date, and do not represent amounts at risk.
In the fi nancial statements, trading derivative fi nancial instruments are revalued on a gross position basis and the unrealised gains or losses are refl ected as assets (Positive fair values for fi nancial derivatives) or liabilities (Negative fair values for fi nancial derivatives). Derivative assets and liabilities arising from different transactions are only offset if the transactions are done with the same counterparty, a legal right of offset exists, and the parties intend to settle the cash fl ows on a net basis. There was no offset of derivative assets and liabilities in 2012 and 2011.

p136 DBS ANNUAL REPORT 2012 | FINANCIAL STATEMENTS
2012 2011 Year-end Year-end Year-end Year-end Underlying positive fair negative fair Underlying positive fair negative fairIn $ millions notional values values notional values values
Derivatives held for trading Interest rate derivatives Forward rate agreements – – – 2,109 1 1Interest rate swaps 545,166 8,013 7,987 711,406 9,123 9,166Financial futures 4,801 1 1 22,725 2 4Interest rate options 7,788 87 110 7,655 73 83Interest rate futures options – – – 780 – #Interest rate caps/fl oors 23,249 356 534 21,809 334 575
Sub-total 581,004 8,457 8,632 766,484 9,533 9,829
Foreign exchange (FX) derivatives FX contracts 511,736 3,794 3,779 485,450 5,927 5,736Currency swaps 107,227 3,452 3,511 98,537 2,515 3,479Currency options 146,528 610 490 150,713 1,275 927
Sub-total 765,491 7,856 7,780 734,700 9,717 10,142
Equity derivatives Equity options 1,933 207 245 2,809 163 166Equity swaps 409 6 8 994 6 15
Sub-total 2,342 213 253 3,803 169 181
Credit derivatives Credit default swaps and others 60,665 457 520 94,902 1,544 1,635
Sub-total 60,665 457 520 94,902 1,544 1,635
Commodity derivatives Commodity contracts 1,255 31 36 737 11 8Commodity futures 2,006 28 17 45 1 #Commodity options 500 2 5 504 14 11
Sub-total 3,761 61 58 1,286 26 19
Total derivatives held for trading 1,413,263 17,044 17,243 1,601,175 20,989 21,806
Derivatives held for hedging Interest rate swaps held for fair value hedge 8,554 228 231 5,526 154 265FX contracts held for fair value hedge 20 – # 65 – 6FX contracts held for cash fl ow hedge 586 # 1 605 – 18FX contracts held for hedge of net investment 1,930 8 26 2,830 17 81Currency swaps held for fair value hedge 61 – 2 97 1 1Currency swaps held for cash fl ow hedge 160 – 2 – – –Currency swaps held for hedge of net investment 1,635 – 27 1,740 3 30
Total derivatives held for hedging 12,946 236 289 10,863 175 401
Total derivatives 1,426,209 17,280 17,532 1,612,038 21,164 22,207
Impact of netting arrangements recognised for computation of Capital Adequacy Ratio (CAR) (9,616) (9,616) (11,812) (11,812)
7,664 7,916 9,352 10,395
# Amounts less than $500,000
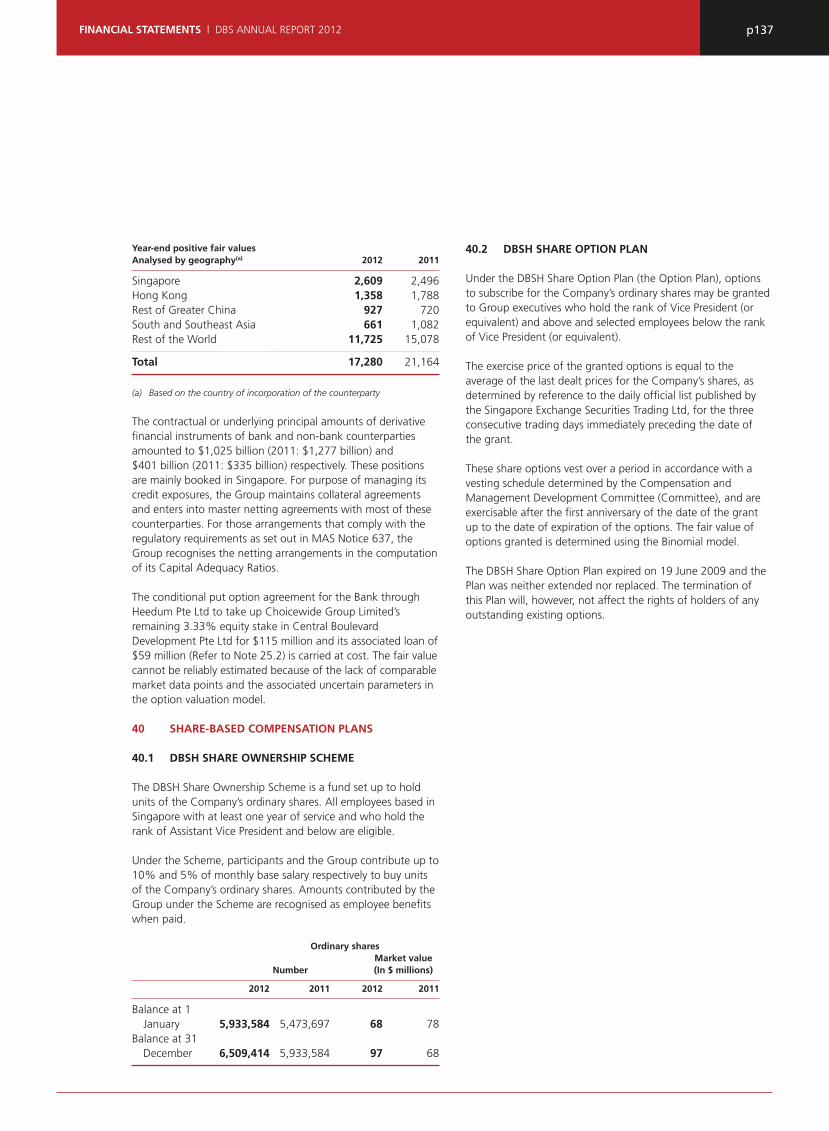
p137FINANCIAL STATEMENTS | DBS ANNUAL REPORT 2012
Year-end positive fair values Analysed by geography(a) 2012 2011
Singapore 2,609 2,496Hong Kong 1,358 1,788Rest of Greater China 927 720South and Southeast Asia 661 1,082Rest of the World 11,725 15,078
Total 17,280 21,164
(a) Based on the country of incorporation of the counterparty
The contractual or underlying principal amounts of derivative fi nancial instruments of bank and non-bank counterparties amounted to $1,025 billion (2011: $1,277 billion) and $401 billion (2011: $335 billion) respectively. These positions are mainly booked in Singapore. For purpose of managing its credit exposures, the Group maintains collateral agreements and enters into master netting agreements with most of these counterparties. For those arrangements that comply with the regulatory requirements as set out in MAS Notice 637, the Group recognises the netting arrangements in the computation of its Capital Adequacy Ratios.
The conditional put option agreement for the Bank through Heedum Pte Ltd to take up Choicewide Group Limited’s remaining 3.33% equity stake in Central Boulevard Development Pte Ltd for $115 million and its associated loan of $59 million (Refer to Note 25.2) is carried at cost. The fair value cannot be reliably estimated because of the lack of comparable market data points and the associated uncertain parameters in the option valuation model.
40 SHARE-BASED COMPENSATION PLANS
40.1 DBSH SHARE OWNERSHIP SCHEME
The DBSH Share Ownership Scheme is a fund set up to hold units of the Company’s ordinary shares. All employees based in Singapore with at least one year of service and who hold the rank of Assistant Vice President and below are eligible.
Under the Scheme, participants and the Group contribute up to 10% and 5% of monthly base salary respectively to buy units of the Company’s ordinary shares. Amounts contributed by the Group under the Scheme are recognised as employee benefi ts when paid.
Ordinary shares Market value Number (In $ millions)
2012 2011 2012 2011
Balance at 1 January 5,933,584 5,473,697 68 78Balance at 31 December 6,509,414 5,933,584 97 68
40.2 DBSH SHARE OPTION PLAN
Under the DBSH Share Option Plan (the Option Plan), options to subscribe for the Company’s ordinary shares may be granted to Group executives who hold the rank of Vice President (or equivalent) and above and selected employees below the rank of Vice President (or equivalent).
The exercise price of the granted options is equal to the average of the last dealt prices for the Company’s shares, as determined by reference to the daily offi cial list published by the Singapore Exchange Securities Trading Ltd, for the three consecutive trading days immediately preceding the date of the grant.
These share options vest over a period in accordance with a vesting schedule determined by the Compensation and Management Development Committee (Committee), and are exercisable after the fi rst anniversary of the date of the grant up to the date of expiration of the options. The fair value of options granted is determined using the Binomial model.
The DBSH Share Option Plan expired on 19 June 2009 and the Plan was neither extended nor replaced. The termination of this Plan will, however, not affect the rights of holders of any outstanding existing options.
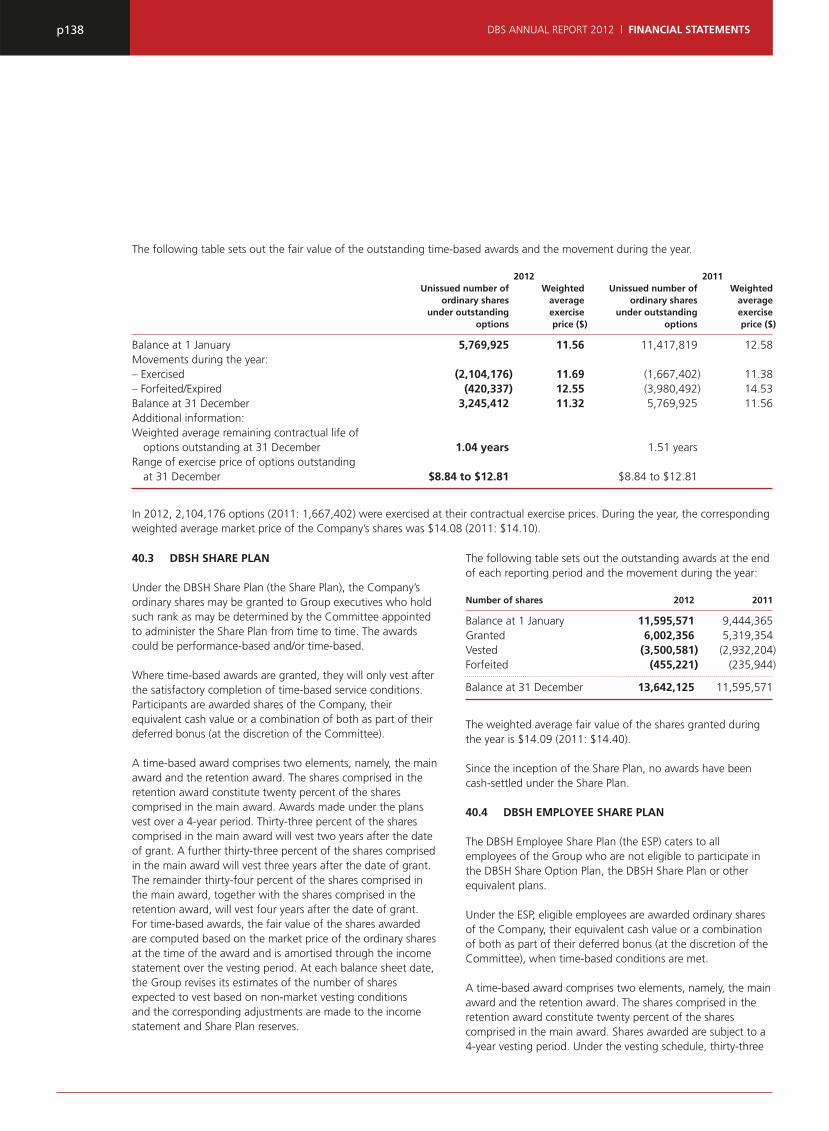
p138 DBS ANNUAL REPORT 2012 | FINANCIAL STATEMENTS
The following table sets out the fair value of the outstanding time-based awards and the movement during the year.
2012 2011 Unissued number of Weighted Unissued number of Weighted ordinary shares average ordinary shares average under outstanding exercise under outstanding exercise options price ($) options price ($)
Balance at 1 January 5,769,925 11.56 11,417,819 12.58Movements during the year: – Exercised (2,104,176) 11.69 (1,667,402) 11.38– Forfeited/Expired (420,337) 12.55 (3,980,492) 14.53Balance at 31 December 3,245,412 11.32 5,769,925 11.56Additional information: Weighted average remaining contractual life of options outstanding at 31 December 1.04 years 1.51 years Range of exercise price of options outstanding at 31 December $8.84 to $12.81 $8.84 to $12.81
In 2012, 2,104,176 options (2011: 1,667,402) were exercised at their contractual exercise prices. During the year, the corresponding weighted average market price of the Company’s shares was $14.08 (2011: $14.10).
40.3 DBSH SHARE PLAN
Under the DBSH Share Plan (the Share Plan), the Company’s ordinary shares may be granted to Group executives who hold such rank as may be determined by the Committee appointed to administer the Share Plan from time to time. The awards could be performance-based and/or time-based. Where time-based awards are granted, they will only vest after the satisfactory completion of time-based service conditions. Participants are awarded shares of the Company, their equivalent cash value or a combination of both as part of their deferred bonus (at the discretion of the Committee).
A time-based award comprises two elements, namely, the main award and the retention award. The shares comprised in the retention award constitute twenty percent of the shares comprised in the main award. Awards made under the plans vest over a 4-year period. Thirty-three percent of the shares comprised in the main award will vest two years after the date of grant. A further thirty-three percent of the shares comprised in the main award will vest three years after the date of grant. The remainder thirty-four percent of the shares comprised in the main award, together with the shares comprised in the retention award, will vest four years after the date of grant. For time-based awards, the fair value of the shares awarded are computed based on the market price of the ordinary shares at the time of the award and is amortised through the income statement over the vesting period. At each balance sheet date, the Group revises its estimates of the number of shares expected to vest based on non-market vesting conditions and the corresponding adjustments are made to the income statement and Share Plan reserves.
The following table sets out the outstanding awards at the end of each reporting period and the movement during the year:
Number of shares 2012 2011
Balance at 1 January 11,595,571 9,444,365Granted 6,002,356 5,319,354Vested (3,500,581) (2,932,204)Forfeited (455,221) (235,944)
Balance at 31 December 13,642,125 11,595,571
The weighted average fair value of the shares granted during the year is $14.09 (2011: $14.40).
Since the inception of the Share Plan, no awards have been cash-settled under the Share Plan.
40.4 DBSH EMPLOYEE SHARE PLAN
The DBSH Employee Share Plan (the ESP) caters to all employees of the Group who are not eligible to participate in the DBSH Share Option Plan, the DBSH Share Plan or other equivalent plans.
Under the ESP, eligible employees are awarded ordinary shares of the Company, their equivalent cash value or a combination of both as part of their deferred bonus (at the discretion of the Committee), when time-based conditions are met.
A time-based award comprises two elements, namely, the main award and the retention award. The shares comprised in the retention award constitute twenty percent of the shares comprised in the main award. Shares awarded are subject to a 4-year vesting period. Under the vesting schedule, thirty-three
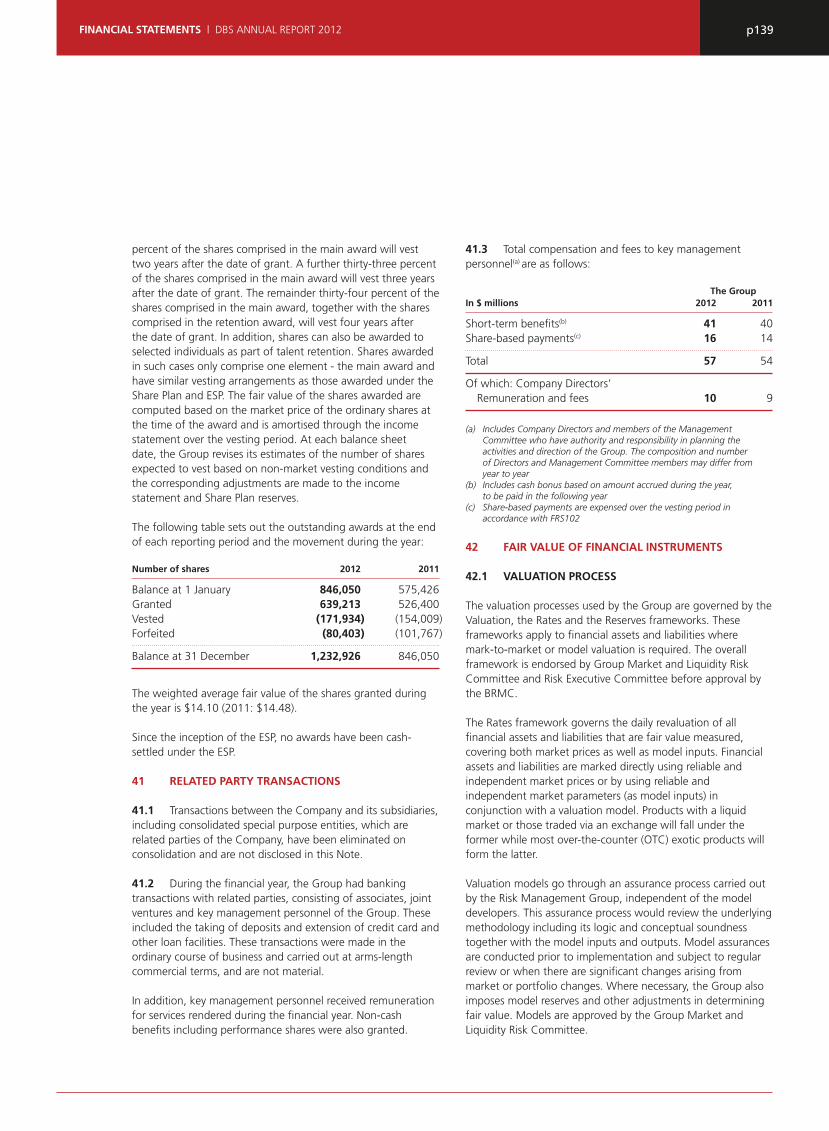
p139FINANCIAL STATEMENTS | DBS ANNUAL REPORT 2012
percent of the shares comprised in the main award will vest two years after the date of grant. A further thirty-three percent of the shares comprised in the main award will vest three years after the date of grant. The remainder thirty-four percent of the shares comprised in the main award, together with the shares comprised in the retention award, will vest four years after the date of grant. In addition, shares can also be awarded to selected individuals as part of talent retention. Shares awarded in such cases only comprise one element - the main award and have similar vesting arrangements as those awarded under the Share Plan and ESP. The fair value of the shares awarded are computed based on the market price of the ordinary shares at the time of the award and is amortised through the income statement over the vesting period. At each balance sheet date, the Group revises its estimates of the number of shares expected to vest based on non-market vesting conditions and the corresponding adjustments are made to the income statement and Share Plan reserves.
The following table sets out the outstanding awards at the end of each reporting period and the movement during the year:
Number of shares 2012 2011
Balance at 1 January 846,050 575,426Granted 639,213 526,400Vested (171,934) (154,009)Forfeited (80,403) (101,767)
Balance at 31 December 1,232,926 846,050
The weighted average fair value of the shares granted during the year is $14.10 (2011: $14.48).
Since the inception of the ESP, no awards have been cash-settled under the ESP.
41 RELATED PARTY TRANSACTIONS
41.1 Transactions between the Company and its subsidiaries, including consolidated special purpose entities, which are related parties of the Company, have been eliminated on consolidation and are not disclosed in this Note.
41.2 During the fi nancial year, the Group had banking transactions with related parties, consisting of associates, joint ventures and key management personnel of the Group. These included the taking of deposits and extension of credit card and other loan facilities. These transactions were made in the ordinary course of business and carried out at arms-length commercial terms, and are not material.
In addition, key management personnel received remuneration for services rendered during the fi nancial year. Non-cash benefi ts including performance shares were also granted.
41.3 Total compensation and fees to key management personnel(a) are as follows:
The GroupIn $ millions 2012 2011
Short-term benefi ts(b) 41 40 Share-based payments(c) 16 14
Total 57 54
Of which: Company Directors’ Remuneration and fees 10 9
(a) Includes Company Directors and members of the Management Committee who have authority and responsibility in planning the activities and direction of the Group. The composition and number of Directors and Management Committee members may differ from year to year
(b) Includes cash bonus based on amount accrued during the year, to be paid in the following year
(c) Share-based payments are expensed over the vesting period in accordance with FRS102
42 FAIR VALUE OF FINANCIAL INSTRUMENTS
42.1 VALUATION PROCESS
The valuation processes used by the Group are governed by the Valuation, the Rates and the Reserves frameworks. These frameworks apply to fi nancial assets and liabilities where mark-to-market or model valuation is required. The overall framework is endorsed by Group Market and Liquidity Risk Committee and Risk Executive Committee before approval by the BRMC.
The Rates framework governs the daily revaluation of all fi nancial assets and liabilities that are fair value measured, covering both market prices as well as model inputs. Financial assets and liabilities are marked directly using reliable and independent market prices or by using reliable and independent market parameters (as model inputs) in conjunction with a valuation model. Products with a liquid market or those traded via an exchange will fall under the former while most over-the-counter (OTC) exotic products will form the latter.
Valuation models go through an assurance process carried out by the Risk Management Group, independent of the model developers. This assurance process would review the underlying methodology including its logic and conceptual soundness together with the model inputs and outputs. Model assurances are conducted prior to implementation and subject to regular review or when there are signifi cant changes arising from market or portfolio changes. Where necessary, the Group also imposes model reserves and other adjustments in determining fair value. Models are approved by the Group Market and Liquidity Risk Committee.

p140 DBS ANNUAL REPORT 2012 | FINANCIAL STATEMENTS
The majority of OTC derivatives are traded in active markets. Valuations are determined using generally accepted models (discounted cash fl ows, Black-Scholes model, interpolation techniques) based on quoted market prices for similar instruments or underlyings.
A process of independent price verifi cation (IPV) is in place to establish the accuracy of the market parameters used when the marking is performed by the Front Offi ce. The IPV process entails independent checks to compare traders’ marks to independent sources such as broker/dealer sources or market consensus providers. The results of the IPV are reviewed by independent control functions on a monthly basis.
For illiquid complex fi nancial instruments where mark-to-market is not possible, the Group will value these products using an approved valuation model. Prices and parameters used as inputs to the model or to any intermediate technique involving a transformation process must be derived from approved market reliable sources. Where possible, the inputs must be checked against multiple sources for reliability and accuracy. Reliance will be placed on the model assurance framework established by Risk Management Group for assurance of valuation models as fi t for purpose.
The Group uses various market accepted benchmark interest rates such as LIBOR and Swap Offer Rates to determine the fair value of the fi nancial instruments. Where unobservable inputs are used in these models resulting in Level 3 classifi cation, valuation adjustments or reserves will be taken for the purpose of adjusting for uncertainty in valuations. Valuation adjustment or reserve methodologies are used to substantiate the unobservable inputs and attempt to quantify the level of uncertainty in valuations. Such methodologies are governed by the Reserve Framework and require approval by the Group Market and Liquidity Risk Committee.
The main valuation adjustments and reserves are described below:
Model and Parameter Uncertainty adjustmentsValuation uncertainties may occur during fair value measurement either due to uncertainties in the required input parameters or uncertainties in the modeling methods used in valuation process. In such situations, adjustments may be necessary to take these factors into account.
For example, where market data such as prices or rates for an instrument are no longer observable after an extended period of time, these inputs used to value the fi nancial instruments may no longer be relevant in the current market conditions. In such situations, adjustments may be necessary to address the pricing uncertainty arising from the use of stale market data inputs.
Credit risk adjustmentCredit risk adjustment is incorporated into derivative valuations to refl ect the impact on fair value of counterparty credit risk. Credit risk adjustment is based upon the creditworthiness of the counterparties, magnitude of the current or potential exposure on the underlying transactions, netting arrangements, collateral arrangements, and the maturity of the underlying transactions.
Day 1 profi t or loss (P&L) reserveIn situations where the market for an instrument is not active and its fair value is established using a valuation model based on signifi cant unobservable market parameters, Day 1 P&L reserve is utilised to defer the P&L arising from the difference between the transaction price and the model value. A market parameter is defi ned as being signifi cant when its impact on the Day 1 P&L is greater than an internally determined threshold. The Day 1 P&L reserve is released to profi t or loss as the parameters become observable or the transaction closed out or amortised over the duration of the transaction. At year end, the unamortised Day 1 P&L is not material.
Bid Offer adjustmentThe Group often holds, at varying points in time, both long or short positions in fi nancial instruments which are valued using mid market levels. Bid offer adjustments are then made to adjust net open position valuations to the respective bid or offer levels as appropriate.
42.2 FAIR VALUE HIERARCHY
The fair value hierarchy accords the highest level to observable inputs such as unadjusted quoted prices in active markets for identical assets or liabilities and the lowest level to unobservable inputs. The fair value measurement of each fi nancial instrument is categorised in accordance to the same level of the fair value hierarchy as the input with the lowest level that is signifi cant to the entire measurement. If unobservable inputs are deemed as signifi cant, the fi nancial instrument will be categorised as Level 3.
Financial instruments that are valued using quoted prices in active markets are classifi ed as Level 1 of the valuation hierarchy. These would include government and sovereign securities, listed equities and corporate debt securities which are actively traded. Derivatives contracts which are traded in an active exchange market are also classifi ed as Level 1 of the valuation hierarchy.
Where fair value is determined using quoted market prices in less active markets or quoted prices for similar assets and liabilities, such instruments are generally classifi ed as Level 2. In cases where quoted prices are generally not available, the Group will determine the fair value based on valuation techniques that use market parameters as inputs including but not limited to yield curves, volatilities and foreign exchange rates. The majority of valuation techniques employ only

p141FINANCIAL STATEMENTS | DBS ANNUAL REPORT 2012
observable market data and so reliability of the fair value measurement is high. These would include corporate debt securities, repurchase, reverse repurchase agreements and most of the Group’s OTC derivatives.
The Group classifi es fi nancial instruments as Level 3 when there is reliance on unobservable inputs to the valuation model attributing to a signifi cant contribution to the instrument value. These would include all input parameters which are derived from historical data such as correlation or volatilities as well as
unquoted equity securities. The fair value of unquoted equity securities is measured in comparison with recent transactions in the equity of the company in question or comparable companies in similar industries. Level 3 inputs also include all quoted security prices that have not been updated for more than 3 months, quoted proxies in active markets for non-similar asset classes (e.g. bonds marked over credit default swap spreads), as well as prices/valuations that are obtained from counterparties. Valuation reserves or pricing adjustments where applicable will be used to converge to fair value.
The following table presents assets and liabilities measured at fair value, classifi ed by level of the fair value hierarchies:
The GroupIn $ millions Level 1 Level 2 Level 3 Total
2012 Assets Singapore Government securities and treasury bills 12,092 – – 12,092Financial assets at fair value through profi t or loss(a) – Debt securities 8,803 683 97 9,583– Equity securities 235 – – 235– Other fi nancial assets – 1,722 – 1,722Available-for-sale fi nancial investments – Debt securities 22,260 2,619 36 24,915– Equity securities(b) 702 43 126 871– Other fi nancial assets – 4,225 – 4,225Securities pledged and transferred 3,920 424 – 4,344Positive fair values for fi nancial derivatives 29 17,229 22 17,280
Liabilities Financial liabilities at fair value through profi t or loss(c) – Other debt securities in issue – 3,493 25 3,518– Other fi nancial liabilities 1,861 2,469 1 4,331Negative fair values for fi nancial derivatives 19 17,502 11 17,532
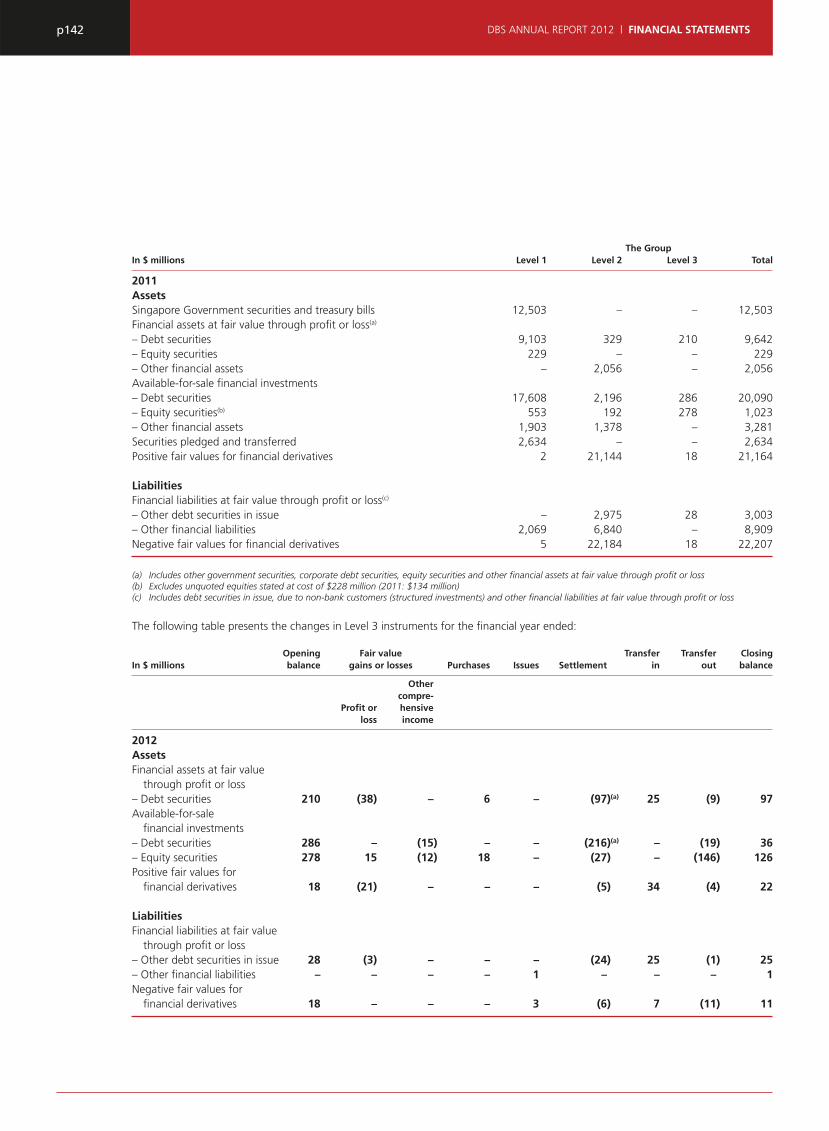
p142 DBS ANNUAL REPORT 2012 | FINANCIAL STATEMENTS
The GroupIn $ millions Level 1 Level 2 Level 3 Total
2011 Assets Singapore Government securities and treasury bills 12,503 – – 12,503Financial assets at fair value through profi t or loss(a) – Debt securities 9,103 329 210 9,642– Equity securities 229 – – 229– Other fi nancial assets – 2,056 – 2,056Available-for-sale fi nancial investments – Debt securities 17,608 2,196 286 20,090– Equity securities(b) 553 192 278 1,023– Other fi nancial assets 1,903 1,378 – 3,281Securities pledged and transferred 2,634 – – 2,634Positive fair values for fi nancial derivatives 2 21,144 18 21,164
Liabilities Financial liabilities at fair value through profi t or loss(c) – Other debt securities in issue – 2,975 28 3,003– Other fi nancial liabilities 2,069 6,840 – 8,909Negative fair values for fi nancial derivatives 5 22,184 18 22,207
(a) Includes other government securities, corporate debt securities, equity securities and other fi nancial assets at fair value through profi t or loss (b) Excludes unquoted equities stated at cost of $228 million (2011: $134 million)(c) Includes debt securities in issue, due to non-bank customers (structured investments) and other fi nancial liabilities at fair value through profi t or loss
The following table presents the changes in Level 3 instruments for the fi nancial year ended:
Opening Fair value Transfer Transfer ClosingIn $ millions balance gains or losses Purchases Issues Settlement in out balance
Other compre- Profi t or hensive loss income
2012AssetsFinancial assets at fair value through profi t or loss– Debt securities 210 (38) – 6 – (97)(a) 25 (9) 97Available-for-sale fi nancial investments– Debt securities 286 – (15) – – (216)(a) – (19) 36– Equity securities 278 15 (12) 18 – (27) – (146) 126Positive fair values for fi nancial derivatives 18 (21) – – – (5) 34 (4) 22
LiabilitiesFinancial liabilities at fair value through profi t or loss– Other debt securities in issue 28 (3) – – – (24) 25 (1) 25– Other fi nancial liabilities – – – – 1 – – – 1 Negative fair values for fi nancial derivatives 18 – – – 3 (6) 7 (11) 11
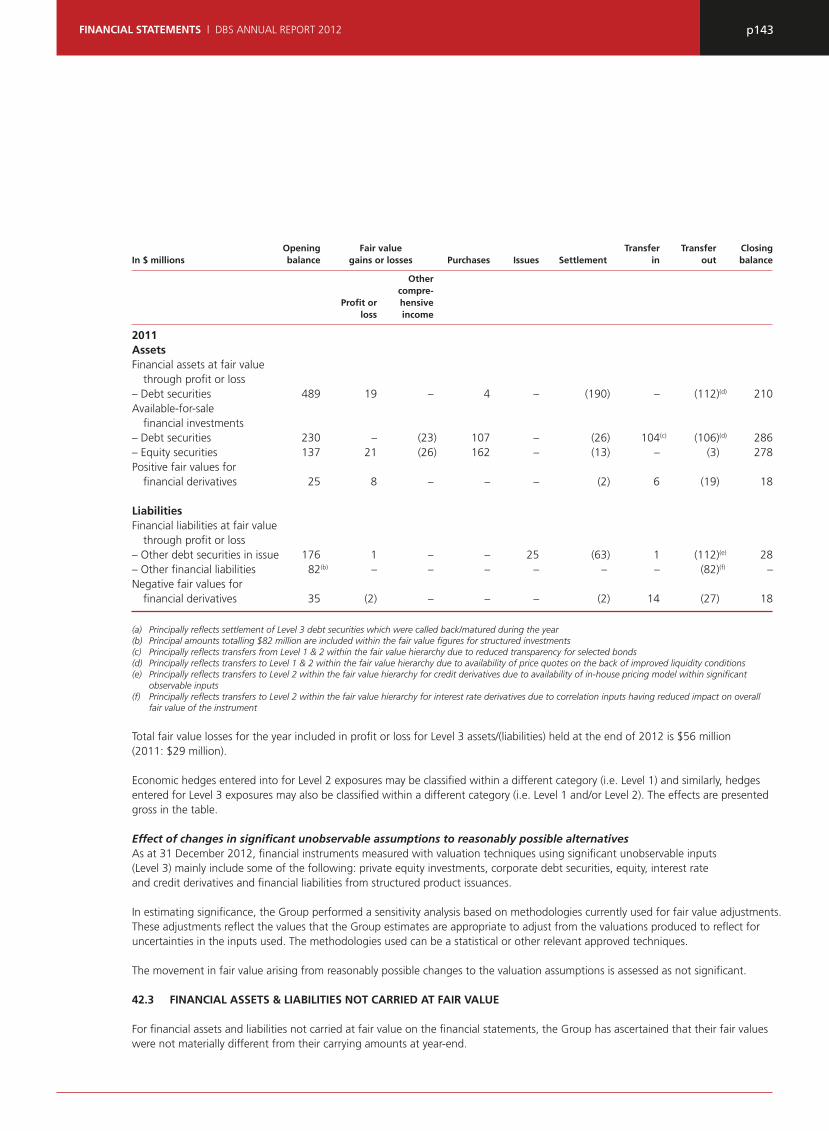
p143FINANCIAL STATEMENTS | DBS ANNUAL REPORT 2012
Opening Fair value Transfer Transfer ClosingIn $ millions balance gains or losses Purchases Issues Settlement in out balance
Other compre- Profi t or hensive loss income
2011 Assets Financial assets at fair value through profi t or loss – Debt securities 489 19 – 4 – (190) – (112)(d) 210Available-for-sale fi nancial investments – Debt securities 230 – (23) 107 – (26) 104(c) (106)(d) 286– Equity securities 137 21 (26) 162 – (13) – (3) 278Positive fair values for fi nancial derivatives 25 8 – – – (2) 6 (19) 18
LiabilitiesFinancial liabilities at fair value through profi t or loss – Other debt securities in issue 176 1 – – 25 (63) 1 (112)(e) 28– Other fi nancial liabilities 82(b) – – – – – – (82)(f) –Negative fair values for fi nancial derivatives 35 (2) – – – (2) 14 (27) 18
(a) Principally refl ects settlement of Level 3 debt securities which were called back/matured during the year(b) Principal amounts totalling $82 million are included within the fair value fi gures for structured investments(c) Principally refl ects transfers from Level 1 & 2 within the fair value hierarchy due to reduced transparency for selected bonds(d) Principally refl ects transfers to Level 1 & 2 within the fair value hierarchy due to availability of price quotes on the back of improved liquidity conditions(e) Principally refl ects transfers to Level 2 within the fair value hierarchy for credit derivatives due to availability of in-house pricing model within signifi cant
observable inputs(f) Principally refl ects transfers to Level 2 within the fair value hierarchy for interest rate derivatives due to correlation inputs having reduced impact on overall
fair value of the instrument
Total fair value losses for the year included in profi t or loss for Level 3 assets/(liabilities) held at the end of 2012 is $56 million (2011: $29 million).
Economic hedges entered into for Level 2 exposures may be classifi ed within a different category (i.e. Level 1) and similarly, hedges entered for Level 3 exposures may also be classifi ed within a different category (i.e. Level 1 and/or Level 2). The effects are presented gross in the table.
Effect of changes in signifi cant unobservable assumptions to reasonably possible alternativesAs at 31 December 2012, fi nancial instruments measured with valuation techniques using signifi cant unobservable inputs (Level 3) mainly include some of the following: private equity investments, corporate debt securities, equity, interest rate and credit derivatives and fi nancial liabilities from structured product issuances.
In estimating signifi cance, the Group performed a sensitivity analysis based on methodologies currently used for fair value adjustments. These adjustments refl ect the values that the Group estimates are appropriate to adjust from the valuations produced to refl ect for uncertainties in the inputs used. The methodologies used can be a statistical or other relevant approved techniques.
The movement in fair value arising from reasonably possible changes to the valuation assumptions is assessed as not signifi cant.
42.3 FINANCIAL ASSETS & LIABILITIES NOT CARRIED AT FAIR VALUE
For fi nancial assets and liabilities not carried at fair value on the fi nancial statements, the Group has ascertained that their fair values were not materially different from their carrying amounts at year-end.

p144 DBS ANNUAL REPORT 2012 | FINANCIAL STATEMENTS
For cash and balances with central banks, placements with banks, loans and advances to non-bank customers, as well as deposits of bank and non-bank customers, the basis of arriving at fair values is by discounting cash fl ows using the relevant market interest rates for the respective currency.
For investment debt securities and subordinated term debts issued, fair values are determined based on independent market quotes, where available. Where market prices are not available, fair values are estimated using discounted cash fl ow method.
For unquoted equities not carried at fair value, fair values have been estimated by reference to the net tangible asset backing of the investee. Unquoted equities of $228 million as at 31 December 2012 (2011: $134 million) were stated at cost less accumulated impairment losses because the fair value cannot be reliably estimated using valuation techniques supported by observable market data. The Group intends to dispose of such instruments through trade sale.
The fair value of variable interest-bearing as well as short term fi nancial instruments accounted for at amortised cost is assumed to be approximated by their carrying amounts.
43 CREDIT RISK
43.1 MAXIMUM EXPOSURE TO CREDIT RISK
The following table shows the exposure to credit risk of on-balance sheet and off-balance sheet fi nancial instruments, before taking into account any collateral held, other credit enhancements and netting arrangements. For on-balance sheet fi nancial assets, the maximum credit exposure is the carrying amounts. For contingent liabilities, the maximum exposure to credit risk is the amount the Group would have to pay if the instrument is called upon. For undrawn facilities, the maximum exposure to credit risk is the full amount of the undrawn credit facilities granted to customers.
The GroupIn $ millions Average 2012 Average 2011 2012 2011
Cash and balances with central banks (excluding cash on hand) 19,896 26,754 16,116 23,675Singapore Government securities and treasury bills 12,298 12,024 12,092 12,503Due from banks 27,190 22,939 28,808 25,571Financial assets at fair value through profi t or loss (excluding equity securities) Other government securities and treasury bills 5,498 4,254 5,334 5,662 Corporate debt securities 4,114 3,791 4,249 3,980 Loans and advances to customers 784 420 1,124 445 Other fi nancial assets 1,104 2,301 598 1,611Positive fair values for fi nancial derivatives 19,222 18,965 17,280 21,164Loans and advances to customers 201,835 172,986 209,395 194,275Financial investments (excluding equity securities) Other government securities and treasury bills 12,837 9,098 15,952 9,723 Corporate debt securities 19,063 18,273 18,516 19,611Securities pledged and transferred Singapore Government securities and treasury bills 798 585 841 756 Other government securities and treasury bills 2,032 1,706 2,207 1,856 Corporate debt securities 686 17 1,349 22Other assets 9,171 8,055 8,611 9,730
Credit exposure 336,528 302,168 342,472 330,584
Contingent liabilities and commitments (excluding operating lease and capital commitments) 147,032 124,094 156,863 137,200
Total credit exposure 483,560 426,262 499,335 467,784
The Group’s exposures to credit risk, measured using the expected gross credit exposures that will arise upon a default of the end obligor are as shown in the Group’s annual Basel II Pillar 3 Disclosures. These exposures, which include both on-balance sheet and off-balance sheet fi nancial instruments, are shown without taking into account any collateral held or netting arrangements.

p145FINANCIAL STATEMENTS | DBS ANNUAL REPORT 2012
Analysis of CollateralWhilst the Group’s maximum exposure to credit risk is the carrying value of the assets or, in the case of off-balance sheet instruments, the amount guaranteed, committed, accepted or endorsed, the likely exposure may be lower due to offsetting collateral, credit guarantees and other actions taken to mitigate the Group’s exposure.
The description of collateral for each class of fi nancial asset is set out below:
Balances with central banks, Singapore Government securities and treasury bills, due from banks, fi nancial assets at fair value through profi t or loss and fi nancial investmentsCollateral is generally not sought for these assets.
Positive fair values for fi nancial derivativesThe Group maintains collateral agreements and enters into master netting agreements with most of the counterparties for derivative transactions. Please refer to Note 39 for the impact of netting arrangements recognised for the computation of Capital Adequacy Ratio (CAR).
Advances to customers, contingent liabilities and commitmentsCertain loans and advances to customers, contingent liabilities and commitments are typically collateralised to a substantial extent. In particular, residential mortgage exposures are generally fully secured by residential properties. Income-producing real estate, which is a sub-set of the Specialised Lending exposure, are fully secured by the underlying assets fi nanced.
The extent to which credit exposures are covered by Basel II-eligible collateral, besides real estate, after the application of the requisite regulatory hair-cuts, is shown in the Group’s Basel II Pillar 3 Disclosures. The amounts are a sub-set of the actual collateral arrangements entered into by the Group as Basel II imposes strict legal and operational standards before collateral can be admitted as credit risk mitigants. As a result, certain collateral arrangements which do not meet its criteria will not be included. Certain collateral types which are not permitted as credit risk mitigants for credit exposures under the Standardised Approach are also excluded.

p146 DBS ANNUAL REPORT 2012 | FINANCIAL STATEMENTS
43.2 LOANS AND ADVANCES TO CUSTOMERS
Loans and advances to customers are summarised as follows:
The GroupIn $ millions 2012 2011
Loans and advances to customers Performing Loans – Neither past due nor impaired (i) 210,541 194,594 – Past due but not impaired (ii) 745 633 Non-Performing Loans – Impaired (iii) 2,542 2,600
Total gross loans (Note 20) 213,828 197,827
(i) Loans and advances neither past due nor impaired, analysed by loan grading and industry
The credit quality of the portfolio of loans and advances that are neither past due nor impaired can be assessed by reference to the loan gradings in MAS Notice to Banks No. 612, “Credit Files, Grading and Provisioning” are as follows:
The GroupIn $ millions Pass Special mention Total
2012 Manufacturing 25,373 804 26,177Building and construction 31,723 183 31,906Housing loans 45,119 150 45,269General commerce 36,558 1,105 37,663Transportation, storage and communications 16,041 447 16,488Financial institutions, investments and holding companies 15,995 50 16,045Professionals and private individuals (excluding housing loans) 14,684 23 14,707Others 21,845 441 22,286
Total 207,338 3,203 210,541
2011Manufacturing 23,614 835 24,449Building and construction 27,902 395 28,297Housing loans 40,779 297 41,076General commerce 32,664 1,141 33,805Transportation, storage and communications 15,671 631 16,302Financial institutions, investments and holding companies 18,586 225 18,811Professionals and private individuals (excluding housing loans) 12,485 52 12,537Others 19,033 284 19,317
Total 190,734 3,860 194,594
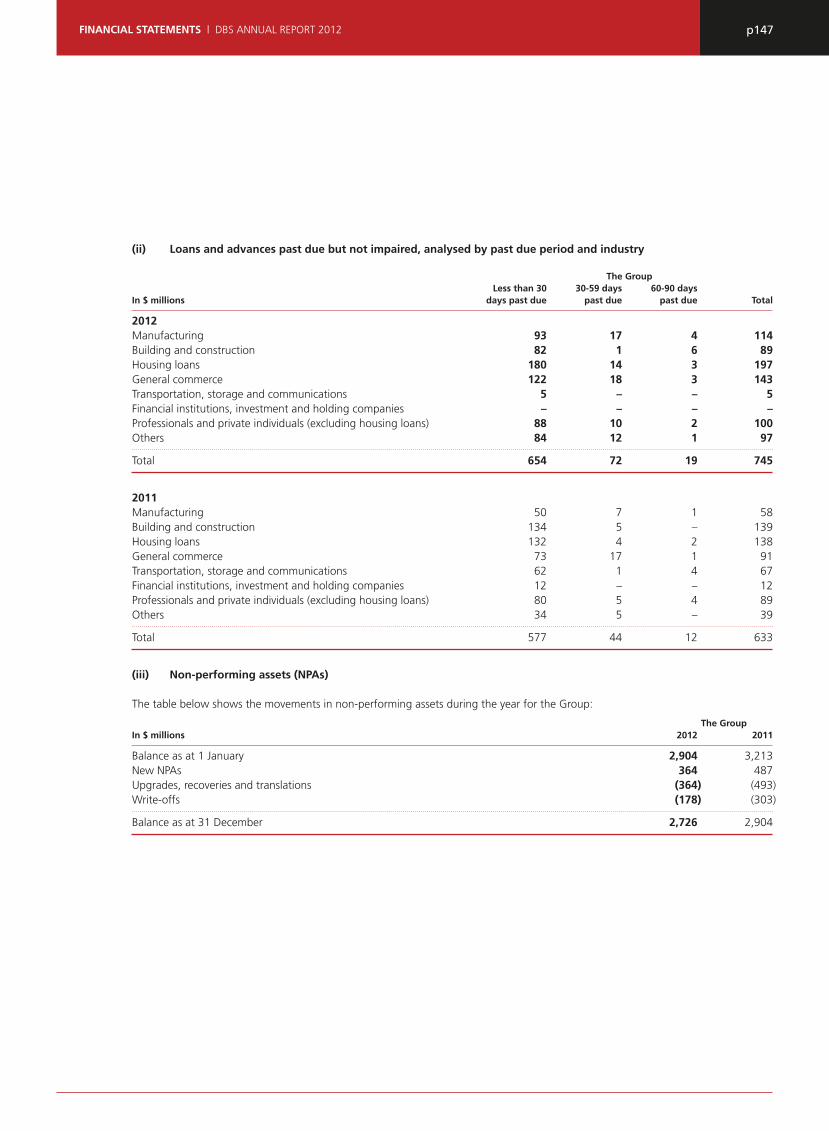
p147FINANCIAL STATEMENTS | DBS ANNUAL REPORT 2012
(ii) Loans and advances past due but not impaired, analysed by past due period and industry
The Group Less than 30 30-59 days 60-90 days In $ millions days past due past due past due Total
2012Manufacturing 93 17 4 114Building and construction 82 1 6 89Housing loans 180 14 3 197General commerce 122 18 3 143Transportation, storage and communications 5 – – 5Financial institutions, investment and holding companies – – – –Professionals and private individuals (excluding housing loans) 88 10 2 100Others 84 12 1 97
Total 654 72 19 745
2011 Manufacturing 50 7 1 58Building and construction 134 5 – 139Housing loans 132 4 2 138General commerce 73 17 1 91Transportation, storage and communications 62 1 4 67Financial institutions, investment and holding companies 12 – – 12Professionals and private individuals (excluding housing loans) 80 5 4 89Others 34 5 – 39
Total 577 44 12 633
(iii) Non-performing assets (NPAs)
The table below shows the movements in non-performing assets during the year for the Group:
The GroupIn $ millions 2012 2011
Balance as at 1 January 2,904 3,213New NPAs 364 487Upgrades, recoveries and translations (364) (493)Write-offs (178) (303)
Balance as at 31 December 2,726 2,904
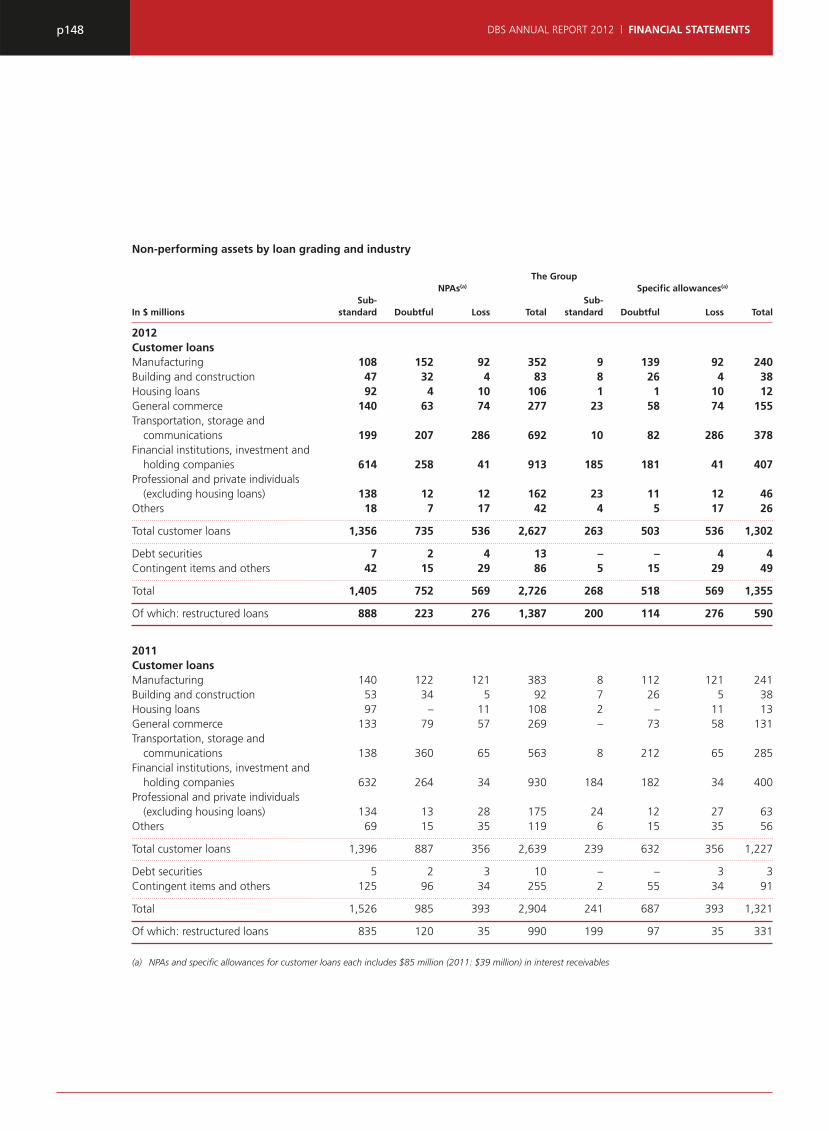
p148 DBS ANNUAL REPORT 2012 | FINANCIAL STATEMENTS
Non-performing assets by loan grading and industry
The Group NPAs(a) Specifi c allowances(a)
Sub- Sub-In $ millions standard Doubtful Loss Total standard Doubtful Loss Total
2012Customer loansManufacturing 108 152 92 352 9 139 92 240Building and construction 47 32 4 83 8 26 4 38Housing loans 92 4 10 106 1 1 10 12General commerce 140 63 74 277 23 58 74 155Transportation, storage and communications 199 207 286 692 10 82 286 378Financial institutions, investment and holding companies 614 258 41 913 185 181 41 407Professional and private individuals (excluding housing loans) 138 12 12 162 23 11 12 46Others 18 7 17 42 4 5 17 26
Total customer loans 1,356 735 536 2,627 263 503 536 1,302
Debt securities 7 2 4 13 – – 4 4Contingent items and others 42 15 29 86 5 15 29 49
Total 1,405 752 569 2,726 268 518 569 1,355
Of which: restructured loans 888 223 276 1,387 200 114 276 590
2011Customer loansManufacturing 140 122 121 383 8 112 121 241Building and construction 53 34 5 92 7 26 5 38Housing loans 97 – 11 108 2 – 11 13General commerce 133 79 57 269 – 73 58 131Transportation, storage and communications 138 360 65 563 8 212 65 285Financial institutions, investment and holding companies 632 264 34 930 184 182 34 400Professional and private individuals (excluding housing loans) 134 13 28 175 24 12 27 63Others 69 15 35 119 6 15 35 56
Total customer loans 1,396 887 356 2,639 239 632 356 1,227
Debt securities 5 2 3 10 – – 3 3Contingent items and others 125 96 34 255 2 55 34 91
Total 1,526 985 393 2,904 241 687 393 1,321
Of which: restructured loans 835 120 35 990 199 97 35 331
(a) NPAs and specifi c allowances for customer loans each includes $85 million (2011: $39 million) in interest receivables
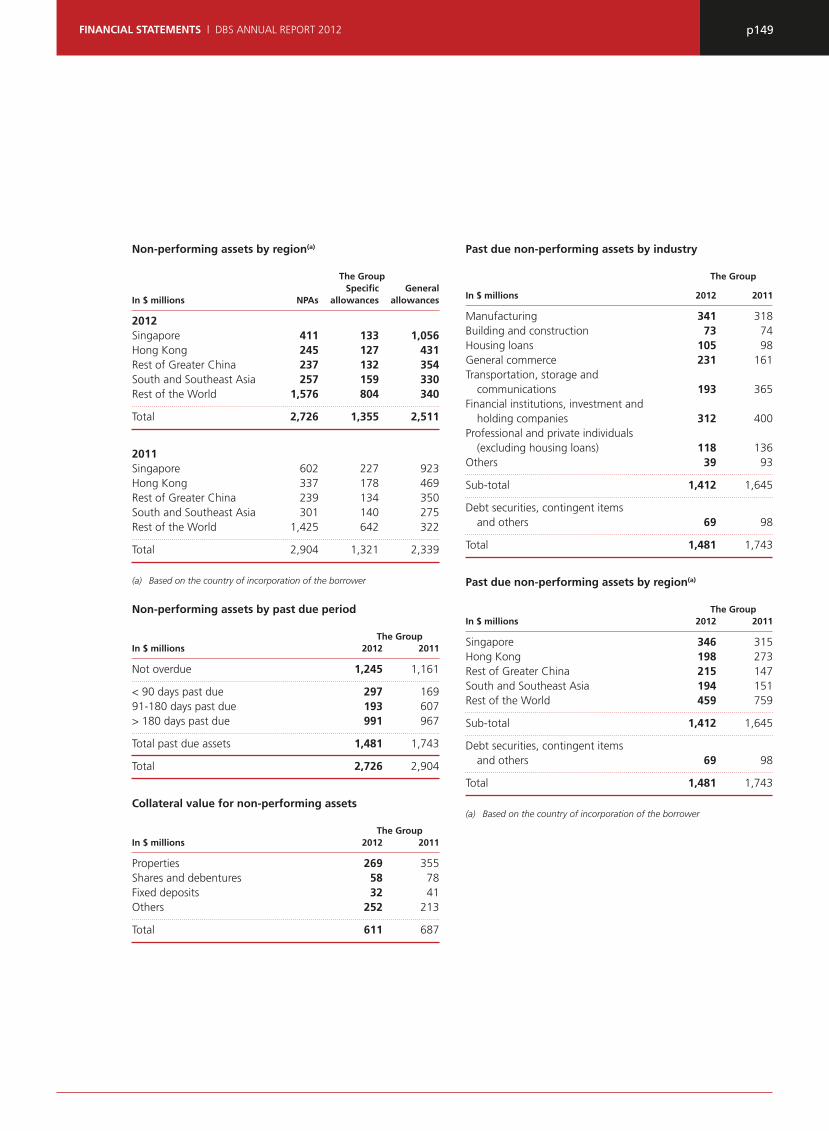
p149FINANCIAL STATEMENTS | DBS ANNUAL REPORT 2012
Non-performing assets by region(a)
The Group Specifi c GeneralIn $ millions NPAs allowances allowances
2012 Singapore 411 133 1,056Hong Kong 245 127 431Rest of Greater China 237 132 354South and Southeast Asia 257 159 330Rest of the World 1,576 804 340
Total 2,726 1,355 2,511
2011 Singapore 602 227 923Hong Kong 337 178 469Rest of Greater China 239 134 350South and Southeast Asia 301 140 275Rest of the World 1,425 642 322
Total 2,904 1,321 2,339
(a) Based on the country of incorporation of the borrower
Non-performing assets by past due period
The GroupIn $ millions 2012 2011
Not overdue 1,245 1,161
< 90 days past due 297 16991-180 days past due 193 607> 180 days past due 991 967
Total past due assets 1,481 1,743
Total 2,726 2,904
Collateral value for non-performing assets
The GroupIn $ millions 2012 2011
Properties 269 355Shares and debentures 58 78Fixed deposits 32 41Others 252 213
Total 611 687
Past due non-performing assets by industry
The Group
In $ millions 2012 2011
Manufacturing 341 318Building and construction 73 74Housing loans 105 98General commerce 231 161Transportation, storage and communications 193 365Financial institutions, investment and holding companies 312 400Professional and private individuals (excluding housing loans) 118 136Others 39 93
Sub-total 1,412 1,645
Debt securities, contingent items and others 69 98
Total 1,481 1,743
Past due non-performing assets by region(a)
The GroupIn $ millions 2012 2011
Singapore 346 315Hong Kong 198 273Rest of Greater China 215 147South and Southeast Asia 194 151Rest of the World 459 759
Sub-total 1,412 1,645
Debt securities, contingent items and others 69 98
Total 1,481 1,743
(a) Based on the country of incorporation of the borrower

p150 DBS ANNUAL REPORT 2012 | FINANCIAL STATEMENTS
43.3 CREDIT QUALITY OF SINGAPORE GOVERNMENT SECURITIES AND TREASURY BILLS, FINANCIAL ASSETS AT FAIR VALUE THROUGH PROFIT OR LOSS AND FINANCIAL INVESTMENTS (INCLUDING SECURITIES PLEDGED AND TRANSFERRED)(a)
The table below presents an analysis of Singapore Government securities and treasury bills, fi nancial assets at fair value through profi t or loss and fi nancial investments (including securities pledged and transferred) for the Group by rating agency designation as at 31 December:
Financial assets at fair value through profi t or loss(c) Financial investments(c)
Singapore Other Other Government government Loans Other government securities securities and fi nancial securities and and Corporate advances assets and CorporateIn $ millions treasury treasury debt to (due from treasury debtExternal rating bills(c) bills securities customer banks)(b) Total bills securities Total
(1) (2) (3) (4) (5) (6)=(2+ (7) (8) (9)= 3+4+5) (7+8)
2012AAA 12,933 5 750 – – 755 1,637 2,521 4,158AA- to AA+ – 3,894 133 – – 4,027 12,280 1,600 13,880A- to A+ – 358 667 – – 1,025 503 5,008 5,511Lower than A- – 1,949 1,169 – – 3,118 2,867 1,584 4,451Unrated – – 1,955 1,124 598 3,677 – 8,727 8,727
Total 12,933 6,206 4,674 1,124 598 12,602 17,287 19,440 36,727
2011 AAA 13,259 863 625 – – 1,488 1,250 2,885 4,135AA- to AA+ – 2,166 158 – – 2,324 6,344 2,272 8,616A- to A+ – 1,514 1,322 – – 2,836 1,386 5,573 6,959Lower than A- – 2,247 952 – – 3,199 1,470 1,918 3,388Unrated – – 923 445 1,611 2,979 – 6,986 6,986
Total 13,259 6,790 3,980 445 1,611 12,826 10,450 19,634 30,084
(a) The amount of securities that are past due but not impaired is not material(b) For amounts due from banks, majority of the bank counterparties are accorded "Pass" grade in accordance with the loan grading per MAS Notice to
Banks No. 612 "Credit Files, Grading and Provisioning"(c) Include securities pledged and transferred
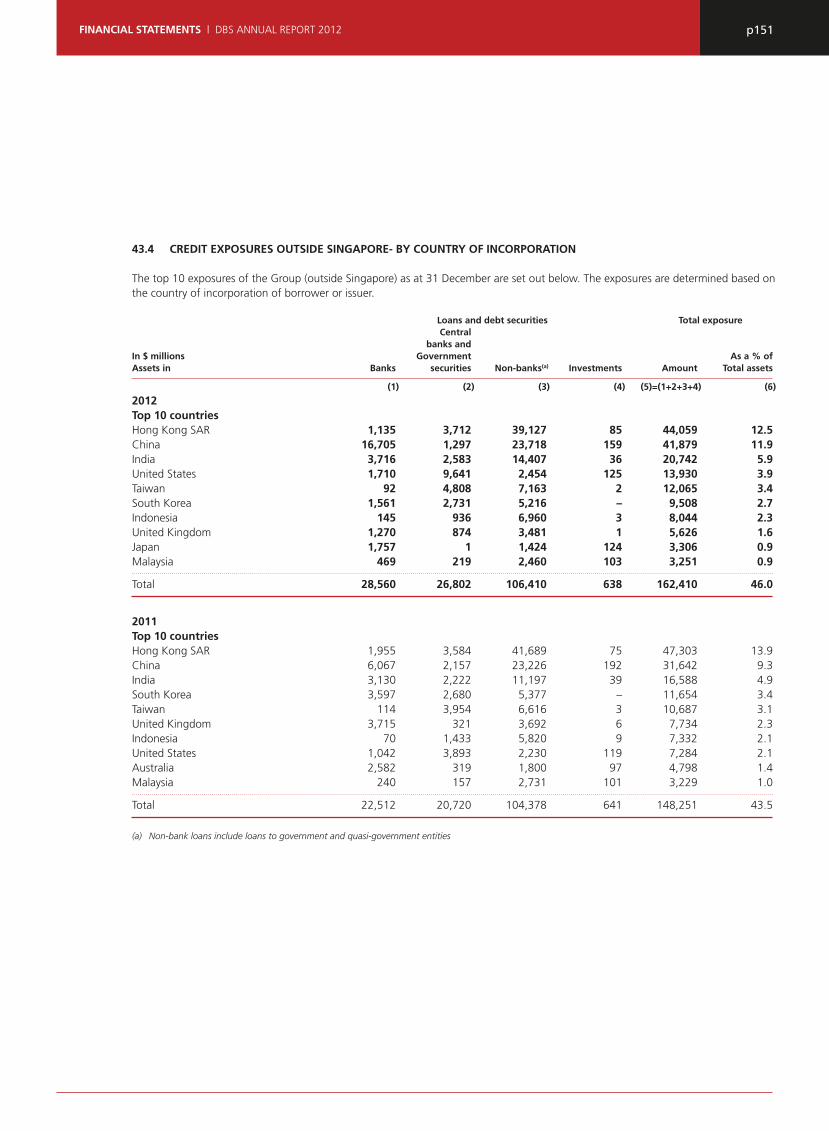
p151FINANCIAL STATEMENTS | DBS ANNUAL REPORT 2012
43.4 CREDIT EXPOSURES OUTSIDE SINGAPORE- BY COUNTRY OF INCORPORATION
The top 10 exposures of the Group (outside Singapore) as at 31 December are set out below. The exposures are determined based on the country of incorporation of borrower or issuer.
Loans and debt securities Total exposure Central banks and In $ millions Government As a % ofAssets in Banks securities Non-banks(a) Investments Amount Total assets
(1) (2) (3) (4) (5)=(1+2+3+4) (6)
2012Top 10 countriesHong Kong SAR 1,135 3,712 39,127 85 44,059 12.5China 16,705 1,297 23,718 159 41,879 11.9India 3,716 2,583 14,407 36 20,742 5.9United States 1,710 9,641 2,454 125 13,930 3.9Taiwan 92 4,808 7,163 2 12,065 3.4South Korea 1,561 2,731 5,216 – 9,508 2.7Indonesia 145 936 6,960 3 8,044 2.3United Kingdom 1,270 874 3,481 1 5,626 1.6Japan 1,757 1 1,424 124 3,306 0.9Malaysia 469 219 2,460 103 3,251 0.9
Total 28,560 26,802 106,410 638 162,410 46.0
2011Top 10 countriesHong Kong SAR 1,955 3,584 41,689 75 47,303 13.9China 6,067 2,157 23,226 192 31,642 9.3India 3,130 2,222 11,197 39 16,588 4.9South Korea 3,597 2,680 5,377 – 11,654 3.4Taiwan 114 3,954 6,616 3 10,687 3.1United Kingdom 3,715 321 3,692 6 7,734 2.3Indonesia 70 1,433 5,820 9 7,332 2.1United States 1,042 3,893 2,230 119 7,284 2.1Australia 2,582 319 1,800 97 4,798 1.4Malaysia 240 157 2,731 101 3,229 1.0
Total 22,512 20,720 104,378 641 148,251 43.5
(a) Non-bank loans include loans to government and quasi-government entities

p152 DBS ANNUAL REPORT 2012 | FINANCIAL STATEMENTS
Back-testing is a procedure used to verify the predictive power of the VaR model involving comparison of daily profi ts and losses adjusted with the estimates from the VaR model. In the back-testing for the period from 1 January 2012 to 31 December 2012, there were no backtesting exceptions (2011: 5 exceptions).
For the banking book market risk the main risk drivers are SGD and USD interest rate positions. The economic value impact of changes in interest rates is simulated under various assumptions for the banking book. The simulated economic value changes are negative $449 million and $848 million (2011: negative $243 million and $433 million) based on parallel shocks to all yield curves of 100 basis points and 200 basis points respectively. The reported fi gures are based on the worst case of an upward and downward parallel shift in the yield curves.
44 MARKET RISK
The Group has a comprehensive risk appetite framework for all types of market risk across both the trading and banking books, (including structural foreign exchange risk arising from the Group’s strategic investments). The Group level total TVaR associated with this framework is tabulated below, showing the period-end, average, high and low TVaR (at a 95% confi dence level over a one-day holding period).
The Group 1 Jan 2012 to 31 Dec 2012In $ millions As at 31 Dec 2012 Average High Low
Total 40 52 62 38
The Group 1 Jan 2011 to 31 Dec 2011In $ millions As at 31 Dec 2011 Average High Low
Total 44 41 48 35
The Group’s interest rate trading business is the major contributor of trading book risk and the signifi cant exposures are in SGD and USD.
The following table shows the period-end, average, high and low VaR (at a 99% confi dence level over a one-day holding period) for trading book market risk:
The Group 1 Jan 2012 to 31 Dec 2012In $ millions As at 31 Dec 2012 Average High Low
Total 17 25 40 15
The Group 1 Jan 2011 to 31 Dec 2011In $ millions As at 31 Dec 2011 Average High Low
Total 37 27 42 14
The chart below (unaudited) provides the range of VaR for the trading portfolio for the period from 1 January 2012 to 31 December 2012
0
10
20
30
40
50
60
70
69 21 24 4840 32 12 14 1
>15
-18
>18
-21
VaR (S$ million)
>21
-24
>27
-30
>24
-27
>30
-33
No
. of
Day
s
>33
-36
>36
-39
>39
DBSH GROUP VAR FOR TRADING BOOK
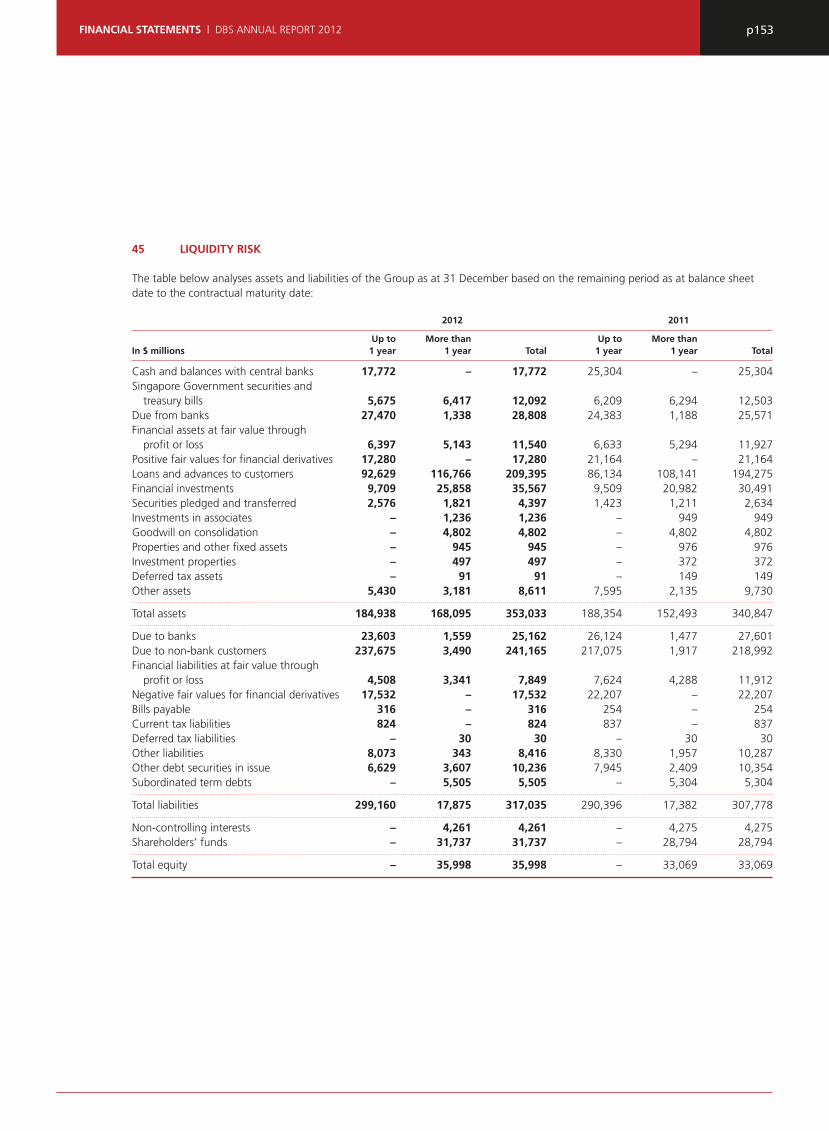
p153FINANCIAL STATEMENTS | DBS ANNUAL REPORT 2012
45 LIQUIDITY RISK
The table below analyses assets and liabilities of the Group as at 31 December based on the remaining period as at balance sheet date to the contractual maturity date:
2012 2011
Up to More than Up to More thanIn $ millions 1 year 1 year Total 1 year 1 year Total
Cash and balances with central banks 17,772 – 17,772 25,304 – 25,304Singapore Government securities and treasury bills 5,675 6,417 12,092 6,209 6,294 12,503Due from banks 27,470 1,338 28,808 24,383 1,188 25,571Financial assets at fair value through profi t or loss 6,397 5,143 11,540 6,633 5,294 11,927Positive fair values for fi nancial derivatives 17,280 – 17,280 21,164 – 21,164Loans and advances to customers 92,629 116,766 209,395 86,134 108,141 194,275Financial investments 9,709 25,858 35,567 9,509 20,982 30,491Securities pledged and transferred 2,576 1,821 4,397 1,423 1,211 2,634Investments in associates – 1,236 1,236 – 949 949Goodwill on consolidation – 4,802 4,802 – 4,802 4,802Properties and other fi xed assets – 945 945 – 976 976Investment properties – 497 497 – 372 372Deferred tax assets – 91 91 – 149 149Other assets 5,430 3,181 8,611 7,595 2,135 9,730
Total assets 184,938 168,095 353,033 188,354 152,493 340,847
Due to banks 23,603 1,559 25,162 26,124 1,477 27,601Due to non-bank customers 237,675 3,490 241,165 217,075 1,917 218,992Financial liabilities at fair value through profi t or loss 4,508 3,341 7,849 7,624 4,288 11,912Negative fair values for fi nancial derivatives 17,532 – 17,532 22,207 – 22,207Bills payable 316 – 316 254 – 254Current tax liabilities 824 – 824 837 – 837Deferred tax liabilities – 30 30 – 30 30Other liabilities 8,073 343 8,416 8,330 1,957 10,287Other debt securities in issue 6,629 3,607 10,236 7,945 2,409 10,354Subordinated term debts – 5,505 5,505 – 5,304 5,304
Total liabilities 299,160 17,875 317,035 290,396 17,382 307,778
Non-controlling interests – 4,261 4,261 – 4,275 4,275Shareholders’ funds – 31,737 31,737 – 28,794 28,794
Total equity – 35,998 35,998 – 33,069 33,069

p154 DBS ANNUAL REPORT 2012 | FINANCIAL STATEMENTS
The table below shows the assets and liabilities of the Group as at 31 December based on contractual undiscounted repayment obligations:
Less than 1 week to 1 to 3 3 to 12 More than No specifi cIn $ millions 7 days 1 month months months 1 year maturity Total
2012Cash and balances with central banks 10,261 1,975 4,161 1,381 – – 17,778Due from banks 7,233 4,120 5,662 10,521 1,352 – 28,888Financial assets at fair value through profi t or loss 419 1,371 1,676 3,143 5,243 235 12,087Other securities(a) 169 1,249 5,230 12,058 35,312 1,099 55,117Loans and advances to customers 14,772 23,637 20,711 35,661 125,456 – 220,237Other assets(b) 2,467 159 506 1,453 3,181 7,572 15,338
Total assets 35,321 32,511 37,946 64,217 170,544 8,906 349,445
Due to banks 10,489 6,289 5,166 1,679 1,561 – 25,184Due to non-bank customers 158,547 29,605 25,372 24,497 3,498 – 241,519Financial liabilities at fair value through profi t or loss 771 1,019 1,433 1,347 3,464 – 8,034Other liabilities(c) 6,596 3,408 1,627 3,689 4,098 30 19,448Subordinated term debts – 14 49 113 6,268 – 6,444
Total liabilities 176,403 40,335 33,647 31,325 18,889 30 300,629
Non-controlling interests – – – – – 4,261 4,261Shareholders’ funds – – – – – 31,737 31,737
Total equity – – – – – 35,998 35,998
Derivatives settled on a net basis(d) (469) (8) (10) 53 151 – (283)
Net liquidity gap (141,551) (7,832) 4,289 32,945 151,806 (27,122) 12,535
2011 Cash and balances with central banks 10,703 5,904 7,248 1,462 – – 25,317Due from banks 10,144 3,211 4,792 6,361 1,213 – 25,721 Financial assets at fair value through profi t or loss 422 1,210 1,557 3,532 5,863 229 12,813Other securities(a) 197 2,276 4,876 9,428 31,294 1,157 49,228Loans and advances to customers 11,193 24,729 18,282 33,698 118,986 – 206,888Other assets(b) 3,975 216 622 37 2,134 9,380 16,364
Total assets 36,634 37,546 37,377 54,518 159,490 10,766 336,331
Due to banks 12,843 7,770 4,314 1,211 1,478 – 27,616Due to non-bank customers 146,846 25,772 25,417 19,282 1,928 – 219,245Financial liabilities at fair value through profi t or loss 1,526 1,242 1,408 3,421 4,480 60 12,137Other liabilities(c) 4,285 4,166 4,642 1,441 4,529 2,748 21,811 Subordinated term debts – 14 3 96 5,868 – 5,981
Total liabilities 165,500 38,964 35,784 25,451 18,283 2,808 286,790
Non-controlling interests – – – – – 4,275 4,275Shareholders’ funds – – – – – 28,794 28,794
Total equity – – – – – 33,069 33,069
Derivatives settled on a net basis(d) (440) (22) 26 (73) (119) – (628)
Net liquidity gap (129,306) (1,440) 1,619 28,994 141,088 (25,111) 15,844
(a) Other securities include Singapore Government securities and treasury bills, fi nancial investments and securities pledged and transferred(b) Other assets include investments in associates, goodwill on consolidation, properties and other fi xed assets, investment properties, deferred tax assets and
other assets(c) Other liabilities include bills payable, other debt securities in issue, current and deferred tax liabilities and other liabilities(d) Positive indicates infl ow and negative indicates outfl ow of funds

p155FINANCIAL STATEMENTS | DBS ANNUAL REPORT 2012
The balances in the above table will not agree with the balances in the consolidated balance sheet as the table incorporates all cash fl ows, on an undiscounted basis, relating to both principal as well as future interest payments.
Customer assets and liabilities (including non-maturing savings/current deposits) are represented on a contractual basis or in a period when it can legally be withdrawn. On a behavioural basis for liquidity risk analysis, the assets and liabilities cash fl ows may differ from contractual basis.
45.1 DERIVATIVES SETTLED ON A GROSS BASIS
The table below shows the Group’s derivative fi nancial instruments in the period where they mature based on the remaining period to contractual maturity date as at the balance sheet date. The amounts disclosed in the table are the contractual undiscounted cash fl ows on a gross settlement basis.
Less than 1 week to 1 to 3 3 to 12 More than In $ millions 7 days 1 month months months 1 year Total
2012Foreign exchange derivatives – outfl ow 30,018 63,640 111,228 136,208 77,202 418,296– infl ow 30,017 63,741 111,257 136,421 76,786 418,222
2011 Foreign exchange derivatives – outfl ow 62,640 61,447 112,085 147,500 65,387 449,059– infl ow 62,494 61,360 112,600 147,560 64,508 448,522
45.2 CONTINGENT LIABILITIES AND COMMITMENTS
The table below shows the Group’s contingent liabilities and commitments in the period where they expire based on the remaining period to contractual maturity date as at the balance sheet date:
In $ millions Less than 1 year 1 to 3 years 3 to 5 years Over 5 years Total
2012Guarantees, endorsements and other contingent items 21,059 – – – 21,059Undrawn loan commitments(a) and other facilities 126,127 3,656 3,744 2,277 135,804Operating lease commitments 211 301 255 108 875Capital commitments 17 2 – – 19
Total 147,414 3,959 3,999 2,385 157,757
2011 Guarantees, endorsements and other contingent items 20,789 – – – 20,789Undrawn loan commitments(a) and other facilities 109,321 3,255 3,333 502 116,411Operating lease commitments 149 300 241 191 881Capital commitments 30 3 – – 33
Total 130,289 3,558 3,574 693 138,114
(a) Undrawn loan commitments are recognised at activation stage and include commitments which are unconditionally cancellable by the Group
The Group expects that not all of the contingent liabilities and undrawn loan commitments will be drawn before expiry.
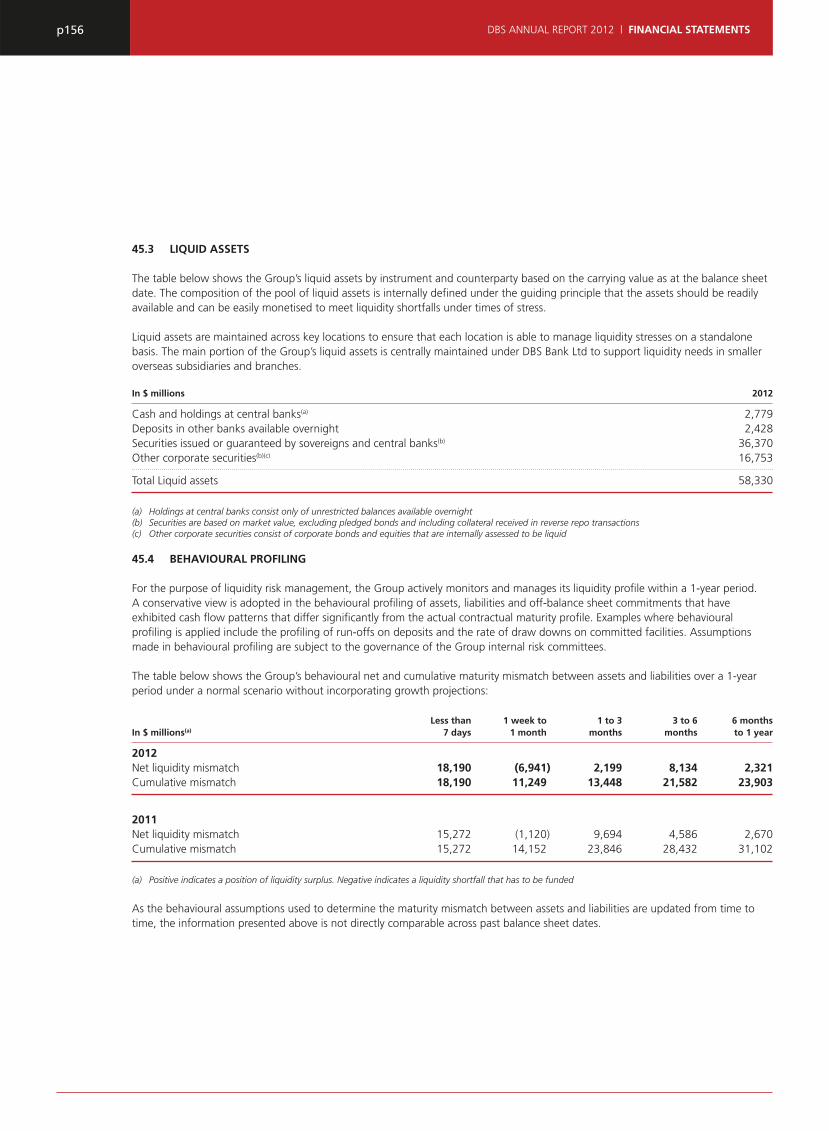
p156 DBS ANNUAL REPORT 2012 | FINANCIAL STATEMENTS
45.3 LIQUID ASSETS
The table below shows the Group’s liquid assets by instrument and counterparty based on the carrying value as at the balance sheet date. The composition of the pool of liquid assets is internally defi ned under the guiding principle that the assets should be readily available and can be easily monetised to meet liquidity shortfalls under times of stress.
Liquid assets are maintained across key locations to ensure that each location is able to manage liquidity stresses on a standalone basis. The main portion of the Group’s liquid assets is centrally maintained under DBS Bank Ltd to support liquidity needs in smaller overseas subsidiaries and branches.
In $ millions 2012
Cash and holdings at central banks(a) 2,779Deposits in other banks available overnight 2,428Securities issued or guaranteed by sovereigns and central banks(b) 36,370Other corporate securities(b)(c) 16,753
Total Liquid assets 58,330
(a) Holdings at central banks consist only of unrestricted balances available overnight(b) Securities are based on market value, excluding pledged bonds and including collateral received in reverse repo transactions(c) Other corporate securities consist of corporate bonds and equities that are internally assessed to be liquid
45.4 BEHAVIOURAL PROFILING
For the purpose of liquidity risk management, the Group actively monitors and manages its liquidity profi le within a 1-year period. A conservative view is adopted in the behavioural profi ling of assets, liabilities and off-balance sheet commitments that have exhibited cash fl ow patterns that differ signifi cantly from the actual contractual maturity profi le. Examples where behavioural profi ling is applied include the profi ling of run-offs on deposits and the rate of draw downs on committed facilities. Assumptions made in behavioural profi ling are subject to the governance of the Group internal risk committees.
The table below shows the Group’s behavioural net and cumulative maturity mismatch between assets and liabilities over a 1-year period under a normal scenario without incorporating growth projections:
Less than 1 week to 1 to 3 3 to 6 6 monthsIn $ millions(a) 7 days 1 month months months to 1 year
2012 Net liquidity mismatch 18,190 (6,941) 2,199 8,134 2,321Cumulative mismatch 18,190 11,249 13,448 21,582 23,903
2011 Net liquidity mismatch 15,272 (1,120) 9,694 4,586 2,670Cumulative mismatch 15,272 14,152 23,846 28,432 31,102
(a) Positive indicates a position of liquidity surplus. Negative indicates a liquidity shortfall that has to be funded
As the behavioural assumptions used to determine the maturity mismatch between assets and liabilities are updated from time to time, the information presented above is not directly comparable across past balance sheet dates.

p157FINANCIAL STATEMENTS | DBS ANNUAL REPORT 2012
46 CAPITAL MANAGEMENT
The Group's capital management objectives are to diversify its sources of capital, to allocate capital effi ciently, guided by the need to maintain a prudent relationship between available capital and the risks of its underlying businesses, and to meet the expectations of key constituencies, including investors, regulators and rating agencies. The Group has complied with all prescribed regulatory capital adequacy ratios.
The capital management process, which is under the oversight of the Capital Committee, includes periodic reviews of both the demand for and supply of capital across the Group. Overseas subsidiaries and non-banking subsidiaries of the Group may be required to comply with country-specifi c and industry-specifi c capital requirements depending on the jurisdiction and industry in which they operate, and are allocated capital accordingly to ensure regulatory compliance. Quarterly updates on the Group’s capital position are provided to the Board of Directors.
The Group is subject to the capital adequacy requirements set out in the Monetary Authority of Singapore’s Notice to Banks No. 637 (Notice on Risk Based Capital Adequacy Requirements for Banks incorporated in Singapore), which effects the Basel Committee on Banking Supervision’s capital adequacy framework in Singapore.
47 SEGMENT REPORTING
47.1 BUSINESS SEGMENT REPORTING
The business segment results are prepared based on the Group’s internal management reporting which refl ects the organisation management structure. As the activities of the Group are highly integrated, internal allocation has been made in preparing the segment information. Amounts for each business segment are shown after the allocation of certain centralised costs, funding income and the application of transfer pricing, where appropriate. Transactions between segments are recorded within the segment as if they are third party transactions and are eliminated on consolidation.
The various business segments are described below:
Consumer Banking/Wealth ManagementConsumer Banking/Wealth Management provides individual customers with a diverse range of banking and related fi nancial services. The products and services available to customers include current and savings accounts, fi xed deposits, loans and home fi nance, cards, payments, investment and insurance products.
Institutional BankingInstitutional Banking provides fi nancial services and products to institutional clients including bank and non-bank fi nancial institutions, government linked companies, large corporates and small and medium-sized businesses. The business focuses
on broadening and deepening customer relationships. Products and services comprise the full range of credit facilities from short term working capital fi nancing to specialised lending. It also provides global transactional services such as cash management, trade fi nance and securities and fi duciary services; treasury and markets products; corporate fi nance and advisory banking as well as capital markets solutions. In addition, Institutional Banking includes DBS Vickers Securities, which provides equities and derivatives brokerage services, and Islamic Bank of Asia.
Treasury Treasury provides treasury services to corporations, institutional and private investors, fi nancial institutions and other market participants. It is primarily involved in sales, structuring, market making and trading across a broad range of fi nancial products including foreign exchange, interest rate, debt, credit, equity and other structured derivatives. Income from these fi nancial products and services offered to the customer of other business segments, such as Consumer Banking/Wealth Management and Institutional Banking, is refl ected in the respective segments. Treasury is also responsible for managing surplus deposits relative to approved benchmarks.
OthersOthers encompasses a range of activities from corporate decisions and income and expenses not attributed to the business segments, including capital and balance sheet management, funding and liquidity.
During the year, no one group of related customers as defi ned under banking regulations accounted for more than 10% of the Group’s revenues.

p158 DBS ANNUAL REPORT 2012 | FINANCIAL STATEMENTS
The following table analyses the results, total assets and total liabilities of the Group by business segments:
Consumer Banking/ InstitutionalIn $ millions Wealth Management Banking Treasury Others Total
2012Net interest income 1,427 2,767 692 399 5,285Non-interest income 873 1,545 427 384 3,229Total income 2,300 4,312 1,119 783 8,514Expenses 1,602 1,416 462 134 3,614Allowances for credit and other losses 93 212 (3) 115 417Share of profi ts of associates – 6 – 118 124Profi t before tax 605 2,690 660 652 4,607Income tax expense 588Net profi t attributable to shareholders 3,809
Total assets before goodwill 63,232 177,073 75,434 32,492 348,231Goodwill on consolidation 4,802Total assets 353,033Total liabilities 136,639 103,450 75,697 1,249 317,035
Capital expenditure 57 29 13 239 338Depreciation(a) 32 18 7 122 179
2011Net interest income 1,446 2,317 951 111 4,825Non-interest income 758 1,693 201 154 2,806Total income 2,204 4,010 1,152 265 7,631Expenses 1,561 1,319 420 3 3,303Allowances for credit and other losses 71 453 2 196 722Share of profi ts of associates – 21 – 106 127Profi t before tax 572 2,259 730 172 3,733Income tax expense 443Net profi t attributable to shareholders 3,035
Total assets before goodwill 56,167 165,930 103,900 10,048 336,045Goodwill on consolidation 4,802Total assets 340,847Total liabilities 127,475 103,977 71,166 5,160 307,778
Capital expenditure 31 29 21 96 177Depreciation(a) 43 26 13 103 185
(a) Amounts for each business segment are shown before allocation of centralised cost
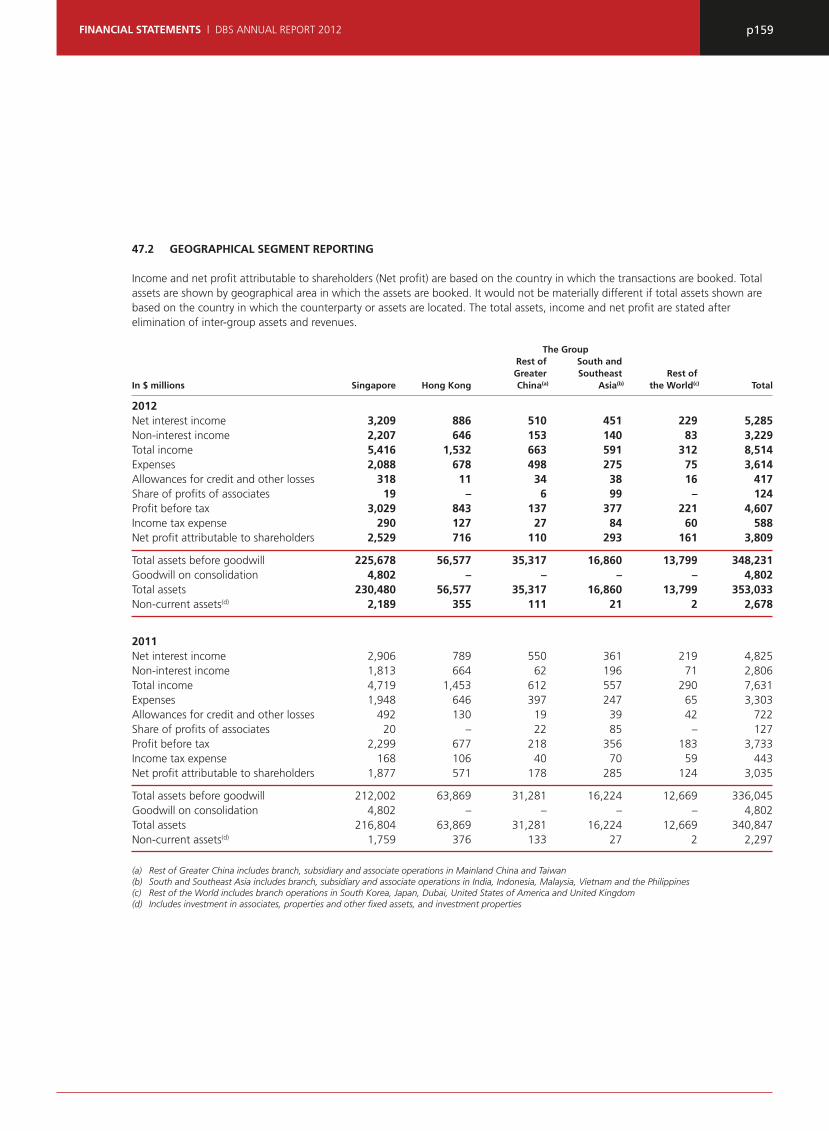
p159FINANCIAL STATEMENTS | DBS ANNUAL REPORT 2012
47.2 GEOGRAPHICAL SEGMENT REPORTING
Income and net profi t attributable to shareholders (Net profi t) are based on the country in which the transactions are booked. Total assets are shown by geographical area in which the assets are booked. It would not be materially different if total assets shown are based on the country in which the counterparty or assets are located. The total assets, income and net profi t are stated after elimination of inter-group assets and revenues.
The Group Rest of South and Greater Southeast Rest ofIn $ millions Singapore Hong Kong China(a) Asia(b) the World(c) Total
2012 Net interest income 3,209 886 510 451 229 5,285Non-interest income 2,207 646 153 140 83 3,229Total income 5,416 1,532 663 591 312 8,514Expenses 2,088 678 498 275 75 3,614Allowances for credit and other losses 318 11 34 38 16 417Share of profi ts of associates 19 – 6 99 – 124Profi t before tax 3,029 843 137 377 221 4,607Income tax expense 290 127 27 84 60 588Net profi t attributable to shareholders 2,529 716 110 293 161 3,809
Total assets before goodwill 225,678 56,577 35,317 16,860 13,799 348,231Goodwill on consolidation 4,802 – – – – 4,802Total assets 230,480 56,577 35,317 16,860 13,799 353,033Non-current assets(d) 2,189 355 111 21 2 2,678
2011 Net interest income 2,906 789 550 361 219 4,825Non-interest income 1,813 664 62 196 71 2,806Total income 4,719 1,453 612 557 290 7,631Expenses 1,948 646 397 247 65 3,303Allowances for credit and other losses 492 130 19 39 42 722Share of profi ts of associates 20 – 22 85 – 127Profi t before tax 2,299 677 218 356 183 3,733Income tax expense 168 106 40 70 59 443Net profi t attributable to shareholders 1,877 571 178 285 124 3,035
Total assets before goodwill 212,002 63,869 31,281 16,224 12,669 336,045Goodwill on consolidation 4,802 – – – – 4,802Total assets 216,804 63,869 31,281 16,224 12,669 340,847Non-current assets(d) 1,759 376 133 27 2 2,297
(a) Rest of Greater China includes branch, subsidiary and associate operations in Mainland China and Taiwan(b) South and Southeast Asia includes branch, subsidiary and associate operations in India, Indonesia, Malaysia, Vietnam and the Philippines(c) Rest of the World includes branch operations in South Korea, Japan, Dubai, United States of America and United Kingdom(d) Includes investment in associates, properties and other fi xed assets, and investment properties

p160 DBS ANNUAL REPORT 2012 | FINANCIAL STATEMENTS
for the year ended 31 December 2012
DBS Bank Ltd
INCOME STATEMENT
In $ millions Note 2012 2011
IncomeInterest income 5,396 4,763 Interest expense 1,571 1,260
Net interest income 3,825 3,503 Net fee and commission income 1,085 1,068 Net trading income 716 456 Net loss from fi nancial instruments designated at fair value (26) (9)Net income from fi nancial investments 2 455 593 Other income 291 144
Total income 6,346 5,755
ExpensesEmployee benefi ts 1,140 1,121 Other expenses 1,116 1,074 Allowances for credit and other losses 342 587
Total expenses 2,598 2,782
Profi t before tax 3,748 2,973 Income tax expense 450 325
Net profi t for the year 3,298 2,648
(see notes on pages 163 to 164, which form part of these fi nancial statements)

p161FINANCIAL STATEMENTS | DBS ANNUAL REPORT 2012
for the year ended 31 December 2012
DBS Bank Ltd
STATEMENT OF COMPREHENSIVE INCOME
In $ millions 2012 2011
Net profi t for the year 3,298 2,648
Other comprehensive income:Foreign currency translation differences for foreign operations 2 (12)Available-for-sale fi nancial assets and others: Net valuation taken to equity 599 411 Transferred to income statement (327) (420) Tax on items taken directly to or transferred from equity (43) 29
Other comprehensive income for the year, net of tax 231 8
Total comprehensive income 3,529 2,656
(see notes on pages 163 to 164, which form part of these fi nancial statements)

p162 DBS ANNUAL REPORT 2012 | FINANCIAL STATEMENTS
as at 31 December 2012
DBS Bank Ltd
BALANCE SHEET
In $ millions Note 2012 2011
AssetsCash and balances with central banks 11,652 21,728 Singapore Government securities and treasury bills 12,092 12,503 Due from banks 22,063 19,537 Financial assets at fair value through profi t or loss 10,178 9,867 Positive fair values for fi nancial derivatives 16,982 21,034 Loans and advances to customers 159,443 149,600 Financial investments 31,765 25,325 Securities pledged and transferred 1,901 1,236 Subsidiaries 3 15,688 14,435 Due from special purpose entities 2 15 Investments in joint ventures – 1 Investments in associates 649 1,109 Properties and other fi xed assets 509 467 Investment properties 43 43 Deferred tax assets 28 60 Other assets 5,055 4,933
Total assets 288,050 281,893
Liabilities Due to banks 23,844 25,846 Due to non-bank customers 182,228 176,684 Financial liabilities at fair value through profi t or loss 5,435 5,890 Negative fair values for fi nancial derivatives 17,283 22,009 Bills payable 240 204 Current tax liabilities 769 742 Other liabilities 4,170 4,987 Other debt securities in issue 8,989 7,609 Due to holding company 822 1,533 Due to subsidiaries 4 7,129 2,449 Due to special purpose entities – 112 Subordinated term debts 5,505 5,304
Total liabilities 256,414 253,369
Net assets 31,636 28,524
EquityShare capital 5 17,096 16,196 Other reserves 6 2,979 2,748 Revenue reserves 6 11,561 9,580
Shareholders' funds 31,636 28,524
Total equity 31,636 28,524
(see notes on pages 163 to 164, which form part of these fi nancial statements)

p163FINANCIAL STATEMENTS | DBS ANNUAL REPORT 2012
for the year ended 31 December 2012
NOTES TO THE SUPPLEMENTARY FINANCIAL STATEMENTS
DBS Bank Ltd
The supplementary fi nancial statements of DBS Bank Ltd (the Bank) are extracted from the Audited Statutory Financial Statements of DBS Bank Ltd and its subsidiaries (the Bank Group) for the fi nancial year ended 31 December 2012. The statutory fi nancial statements of the Bank and the Bank Group which contained an unqualifi ed audit report, will be delivered to the Accounting & Corporate Regulatory Authority in accordance with the Singapore Companies Act.
1 SUMMARY OF SIGNIFICANT ACCOUNTING POLICIES
The accounting policies applied by the Bank and the Bank Group are consistent with those applied by the Group as disclosed in Note 2 of the "Notes to the Financial Statements" (Notes) in the Group’s Consolidated Financial Statements.
2 NET INCOME FROM FINANCIAL INVESTMENTS
Net income from fi nancial investments includes the following:
In $ millions 2012 2011
Dividends from subsidiaries 7 123Dividends from joint ventures/associates 82 34
Total 89 157
3 SUBSIDIARIES
In $ millions 2012 2011
Unquoted equity shares(a) 12,434 11,185Less: impairment allowances 736 813
Sub-total 11,698 10,372Due from subsidiaries 3,990 4,063
Total 15,688 14,435
(a) The carrying amounts of certain investments which are designated as hedged items in a fair value hedge are adjusted for fair value changes attributable to the hedged risks
Movements in impairment allowances during the year are as follows:
In $ millions 2012 2011
Balance at 1 January 813 819Write-back to income statement (7) (6)Write-off against investment cost (70) –
Balance at 31 December 736 813
4 DUE TO SUBSIDIARIES
In $ millions 2012 2011
Subordinated term debts issued to DBS Capital Funding Corporation II (Note 4.1) 1,500 1,500Due to subsidiaries 5,629 949
Total 7,129 2,449
4.1 The $1,500 million 5.75% subordinated note was issued on 27 May 2008 by the Bank to DBS Capital Funding II Corporation, both wholly-owned subsidiaries of DBSH. Interest is payable in arrears on 15 June and 15 December each year at a fi xed rate of 5.75% per annum up to 15 June 2018. Thereafter, interest is payable quarterly in arrears on 15 March, 15 June, 15 September and 15 December each year at a fl oating rate of three-month Singapore Swap Offer Rate + 3.415% per annum. 5 SHARE CAPITAL
Issued and fully paid up 2012 2011
2,233,102,635 (2011: 2,172,821,322) ordinary shares 2,233 2,1736,800 (2011: 6,800) 4.7% non-cumulative non-convertible perpetual preference shares # #8,000,000 (2011: 8,000,000) 4.7% non-cumulative non-convertible perpetual preference shares 8 8
Total number of shares (millions) 2,241 2,181
Total Share Capital (in $ millions) 17,096 16,196
# Amount under 500,000
6 OTHER RESERVES
6.1 OTHER RESERVES
In $ millions 2012 2011
Available-for-sale revaluation reserves 630 416Cash fl ow hedge reserves (1) (16)General reserves 2,360 2,360Capital reserves (10) (12)
Total 2,979 2,748

p164 DBS ANNUAL REPORT 2012 | FINANCIAL STATEMENTS
Movements in other reserves for the Bank during the year are as follows:
Available- for-sale Cash fl ow revaluation hedge General CapitalIn $ millions reserves reserves reserves(a) reserves(b) Total
Balance at 1 January 2012 416 (16) 2,360 (12) 2,748Net exchange translation adjustments – – – 2 2Available-for-sale fi nancial assets and others:– net valuation taken to equity 590 9 – – 599– transferred to income statement (335) 8 – – (327)– tax on items taken directly to or transferred from equity (41) (2) – – (43)
Balance at 31 December 2012 630 (1) 2,360 (10) 2,979
Balance at 1 January 2011 380 – 2,360 – 2,740Net exchange translation adjustments – – – (12) (12)Available-for-sale fi nancial assets and others:– net valuation taken to equity 429 (18) – – 411– transferred to income statement (420) – – – (420)– tax on items taken directly to or transferred from equity 27 2 – – 29
Balance at 31 December 2011 416 (16) 2,360 (12) 2,748
(a) The General reserves are maintained in accordance with the provisions of applicable laws and regulations. These reserves are non distributable unless otherwise approved by the relevant authorities. Under the Banking (Reserve Fund) (Transitional Provision) regulations 2007, which came into effect on 11 June 2007, the Bank may distribute or utilise its statutory reserves provided that the amount distributed or utilised for each fi nancial year does not exceed 20% of the reserves as at 30 March 2007
(b) Capital reserves include net exchange translation adjustments arising from translation differences on net investments in foreign branches and the related foreign currency instruments designated as a hedge
6.2 REVENUE RESERVES
In $ millions 2012 2011
Balance at 1 January 9,580 8,432Net profi t attributable to shareholders 3,298 2,648
Amount available for distribution 12,878 11,080Less: Special dividend 1,200 1,350 4.7% tax exempt preference dividends (2011: 4.7% tax exempt) 117 117 6% tax exempt preference dividends (2011: 6% tax exempt) – 33
Balance at 31 December 11,561 9,580